semi-quantitative risk assessment, the risk position of ... · introduction semi-quantitative risk...
TRANSCRIPT
Operační program Vzdělávání pro konkurenceschopnost Název projektu: Inovace magisterského studijního programu Fakulty ekonomiky a managementu Registrační číslo projektu: CZ.1.07/2.2.00/28.0326
Risk Management
Semi-quantitative Risk Assessment,
the Risk Position of the Entity
Prepared by: prof. Ing. František BOŽEK, CSc.
University of Defence Brno Phone: tel.: 973 443 170,e-mail: [email protected]
Introduction Semi-quantitative risk assessment
- form transition between quantitative and qualitative analysis;
- outputs rather subjective the nature of the impending qualitative assessment;
- compared with the quantitative analysis is characterized by speed, simplicity of design, lower requirements on the input data and the smaller demands on the resources;
- precision accuracy and reliability of the outputs is lower in comparison with the quantitative analysis;
- outputs presented in a certain interval spot index values in the matrix and the risk map.
Introduction
Semi-quantitative risk assessment
- qualitative analysis is based on an expert estimate. probability of hazard activation and impact;
- probability and impact are referred to in a certain interval of point values (indexes);
- allows easy and quickly identify critical risks for assessment systems;
- it may be recommended especially for systems for which has not yet been implemented risk analysis.
General characteristic of semi-quantitative analysis
- provides a more consistent and rigorous approach to assessing and comparing risks, including strategies for risk management, compared with a qualitative assessment
- eliminates certain ambiguities and inconsistencies, which can produce qualitative risk analysis;
- requires at least the same quantum of input data as qualitative analysis;
- Uses on similar methods of data acquisition and analysis activities as a qualitative analysis, supplemented by other special procedures.
General characteristic of semi-quantitative analysis
- is often categorized into groups of qualitative assessment, which isn‘t correct because there are significant differences between the two procedures in orderliness, structure and relative levels of objectivity, transparency and reproducibility;
- based on a predetermined scoring system, that allows the inclusion of a risk perception into categories, among which there is a logical and explicit hierarchy.
General characteristic of semi-quantitative analysis
- quantitative analysis can be used to assess a number of different types of risk, it doesn´t require a complete mathematical model;
- risk assessment covers a wider range of probability and impact;
- assessment of a wide range in risk systems; specific regional risks;
- allows the comparison of different systems from the aspect of risk positions and risk positions of each subfields.
Use of semi-quantitative analysis
- chemical, engineering, automotive, agriculture, risk assessment of projects, military begins to apply in other specialization;
- ranking methods of relative assessment:
• Dow's index flammability and explosiveness; • Mondo's index; • Index hazards of the substance; • Index exposure of chemicals; • Index of danger and vulnerability etc.
Process of semi-quantitative analysis
- is based on the description of each category level of probability, impact and seriousness (a combination of probability and impact)
- mostly numerical expression in a predetermined interval, the values of natural numbers N *, less Re +;
- verbal labeling categories and letters;
- intervals category label can‘t overlap, must be clearly defined and all categorical conditions must be exhausted.
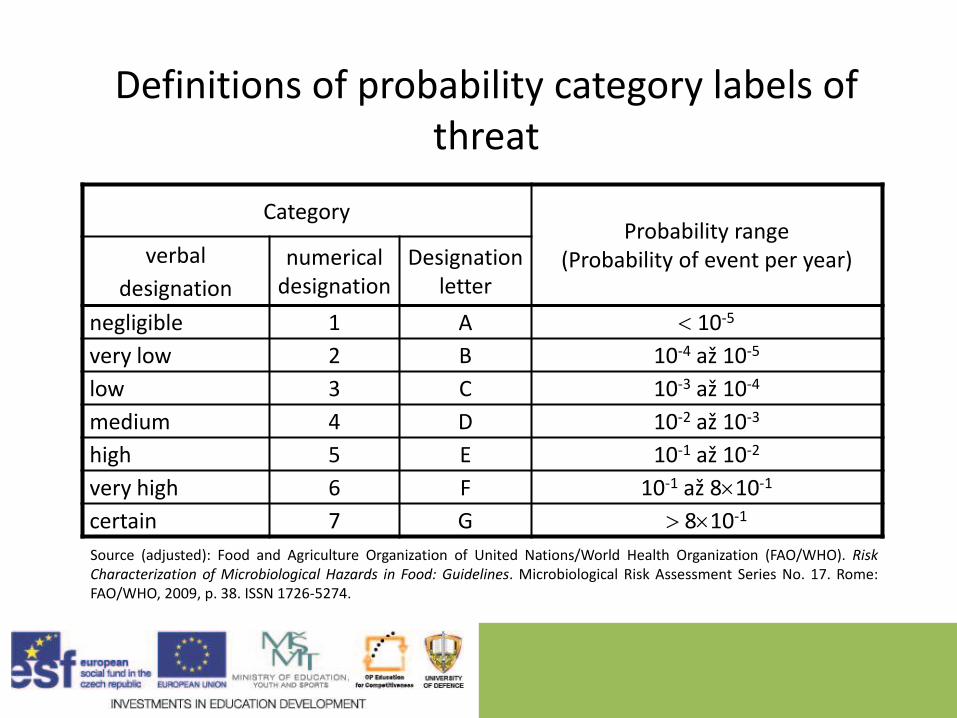
Definitions of probability category labels of threat
Category Probability range
(Probability of event per year) verbal
designation
numerical designation
Designation letter
negligible 1 A 10-5
very low 2 B 10-4 až 10-5
low 3 C 10-3 až 10-4
medium 4 D 10-2 až 10-3
high 5 E 10-1 až 10-2
very high 6 F 10-1 až 810-1
certain 7 G 810-1
Source (adjusted): Food and Agriculture Organization of United Nations/World Health Organization (FAO/WHO). Risk Characterization of Microbiological Hazards in Food: Guidelines. Microbiological Risk Assessment Series No. 17. Rome: FAO/WHO, 2009, p. 38. ISSN 1726-5274.
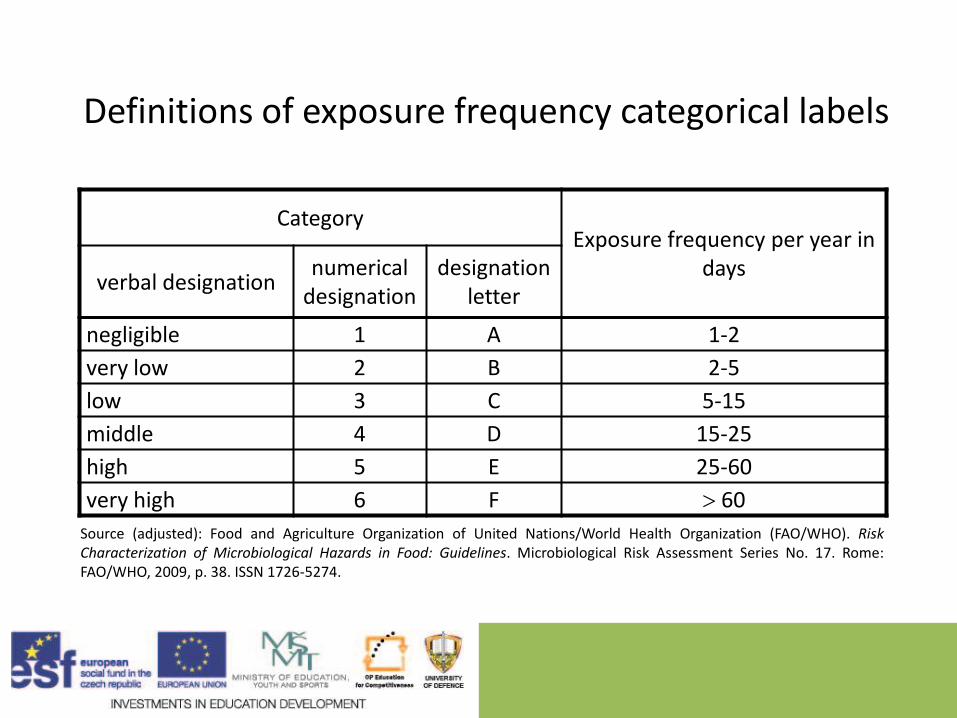
Definitions of exposure frequency categorical labels
Category Exposure frequency per year in
days verbal designation
numerical designation
designation letter
negligible 1 A 1-2
very low 2 B 2-5
low 3 C 5-15
middle 4 D 15-25
high 5 E 25-60
very high 6 F 60
Source (adjusted): Food and Agriculture Organization of United Nations/World Health Organization (FAO/WHO). Risk Characterization of Microbiological Hazards in Food: Guidelines. Microbiological Risk Assessment Series No. 17. Rome: FAO/WHO, 2009, p. 38. ISSN 1726-5274.
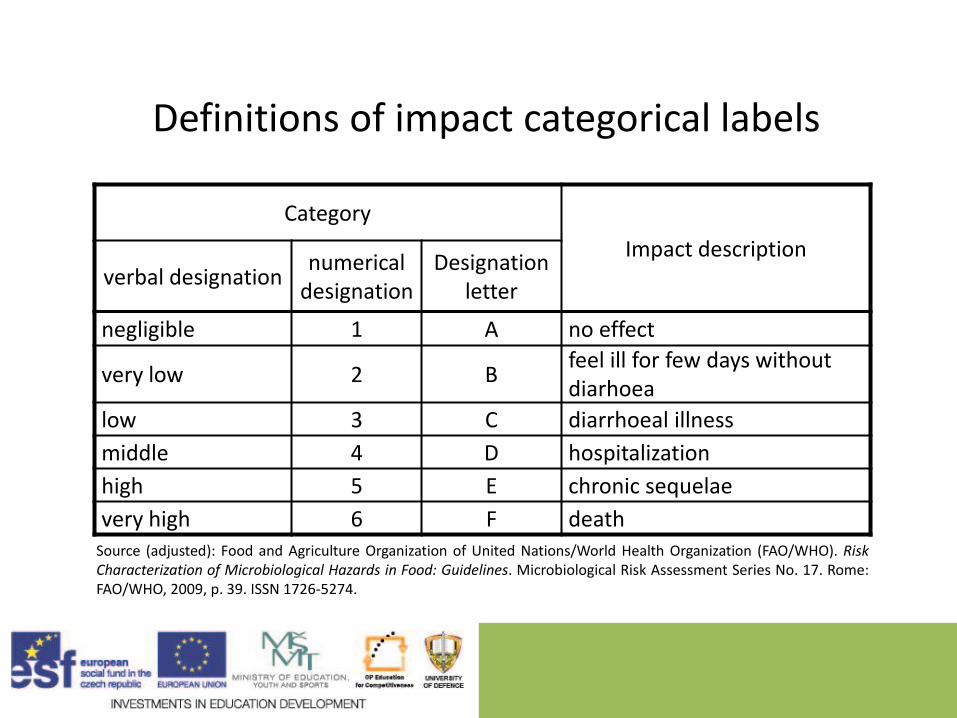
Definitions of impact categorical labels
Category
Impact description verbal designation
numerical designation
Designation letter
negligible 1 A no effect
very low 2 B feel ill for few days without diarhoea
low 3 C diarrhoeal illness
middle 4 D hospitalization
high 5 E chronic sequelae
very high 6 F death Source (adjusted): Food and Agriculture Organization of United Nations/World Health Organization (FAO/WHO). Risk Characterization of Microbiological Hazards in Food: Guidelines. Microbiological Risk Assessment Series No. 17. Rome: FAO/WHO, 2009, p. 39. ISSN 1726-5274.
Role of semi-quantitative analysis
• Provide management objective estimate of the level of assessed risk in the form of a matrix and risk maps.
- This risk assessment concluded that the risk level is "low",
must be seen by assessor and risk managers at a specified interval, to avoid the process of assessing and managing risk to misunderstandings, that is a potential weakness of qualitative risk analysis. Semi-quantitative risk assessment avoids this problem by appending the term "Low" quantitative importance in certain.
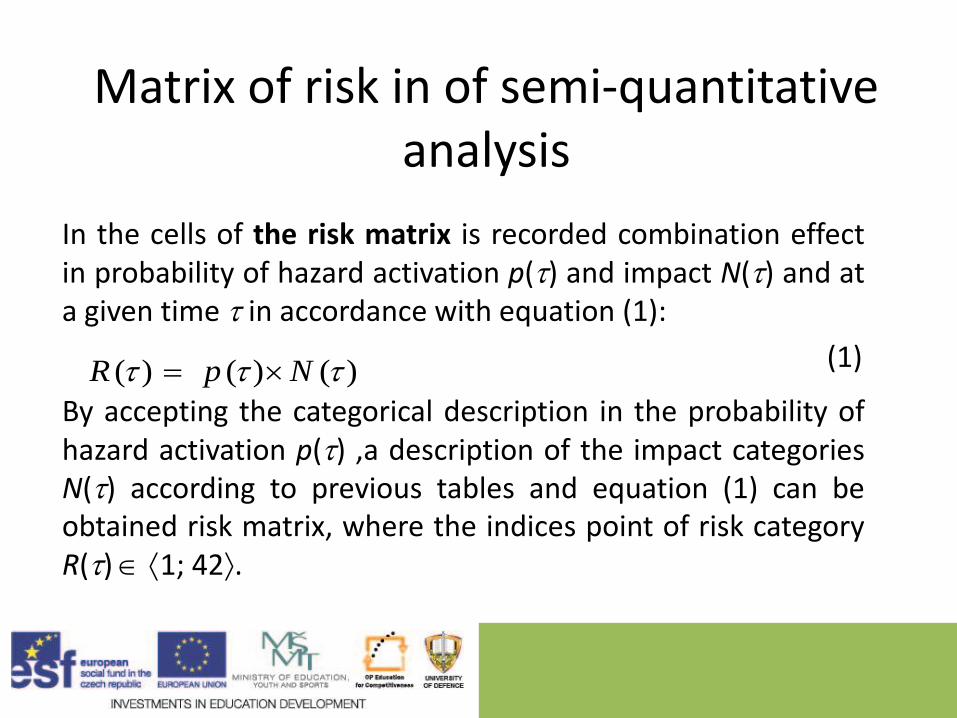
Matrix of risk in of semi-quantitative analysis
In the cells of the risk matrix is recorded combination effect in probability of hazard activation p() and impact N() and at a given time in accordance with equation (1):
(1)
By accepting the categorical description in the probability of hazard activation p() ,a description of the impact categories N() according to previous tables and equation (1) can be obtained risk matrix, where the indices point of risk category R() 1; 42.
)()()( NpR
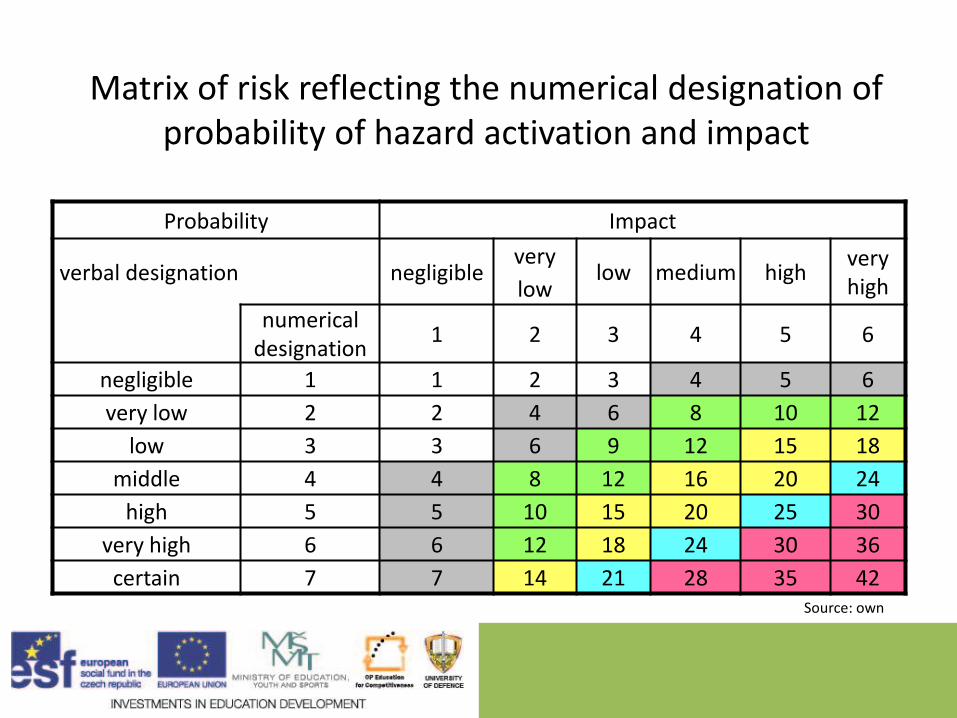
Matrix of risk reflecting the numerical designation of probability of hazard activation and impact
Probability Impact
verbal designation negligible very
low low medium high
very high
numerical
designation 1 2 3 4 5 6
negligible 1 1 2 3 4 5 6
very low 2 2 4 6 8 10 12
low 3 3 6 9 12 15 18
middle 4 4 8 12 16 20 24
high 5 5 10 15 20 25 30
very high 6 6 12 18 24 30 36
certain 7 7 14 21 28 35 42 Source: own
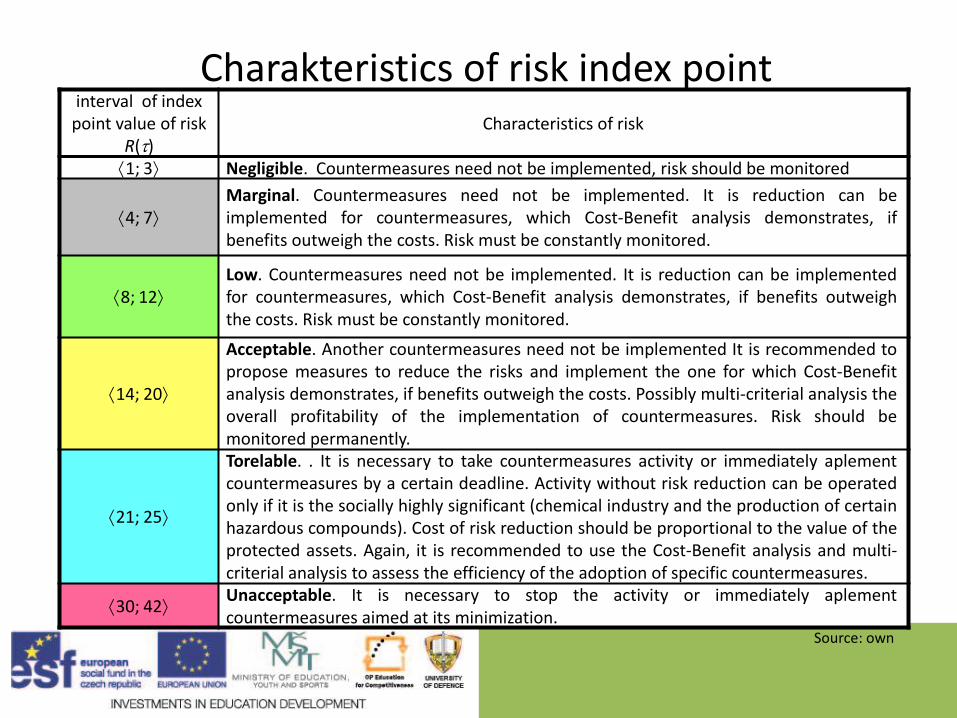
Charakteristics of risk index point interval of index
point value of risk R()
Characteristics of risk
1; 3 Negligible. Countermeasures need not be implemented, risk should be monitored
4; 7 Marginal. Countermeasures need not be implemented. It is reduction can be implemented for countermeasures, which Cost-Benefit analysis demonstrates, if benefits outweigh the costs. Risk must be constantly monitored.
8; 12 Low. Countermeasures need not be implemented. It is reduction can be implemented for countermeasures, which Cost-Benefit analysis demonstrates, if benefits outweigh the costs. Risk must be constantly monitored.
14; 20
Acceptable. Another countermeasures need not be implemented It is recommended to propose measures to reduce the risks and implement the one for which Cost-Benefit analysis demonstrates, if benefits outweigh the costs. Possibly multi-criterial analysis the overall profitability of the implementation of countermeasures. Risk should be monitored permanently.
21; 25
Torelable. . It is necessary to take countermeasures activity or immediately aplement countermeasures by a certain deadline. Activity without risk reduction can be operated only if it is the socially highly significant (chemical industry and the production of certain hazardous compounds). Cost of risk reduction should be proportional to the value of the protected assets. Again, it is recommended to use the Cost-Benefit analysis and multi-criterial analysis to assess the efficiency of the adoption of specific countermeasures.
30; 42 Unacceptable. It is necessary to stop the activity or immediately aplement countermeasures aimed at its minimization.
Source: own
Defining risk position of the system
Risk matrix can be applied also to identify critical risks.
Imagine that in company X is found 12 sources of risk Rk(), where k 1; 12 k N* (N* is the symbol of natural numbers), associated with the handling of hazardous compounds that may be in relation to the assessment of the probability pk() and the impact Nk() to view in the risk matrix.
From such a risk matrix and in accordance with the characteristics of the risks presented immediately before, result category of significance k-th risk. It‘s also from the matrix immediately identify unacceptable risks.
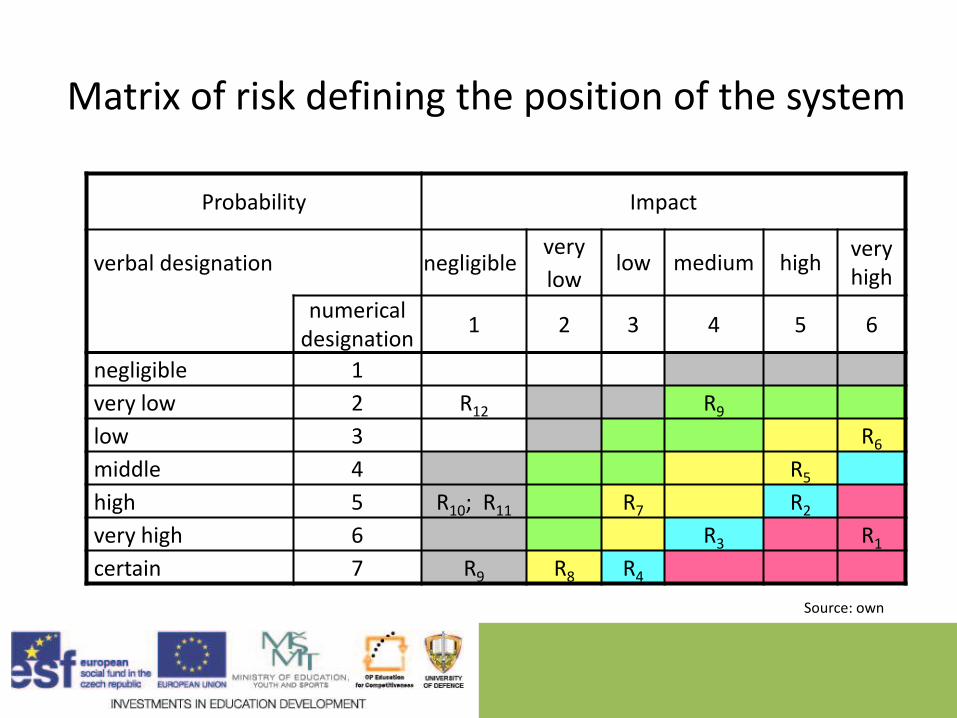
Matrix of risk defining the position of the system
Probability Impact
verbal designation negligible very
low low medium high
very high
numerical
designation 1 2 3 4 5 6
negligible 1
very low 2 R12 R9
low 3 R6
middle 4 R5
high 5 R10; R11 R7 R2
very high 6 R3 R1
certain 7 R9 R8 R4
Source: own
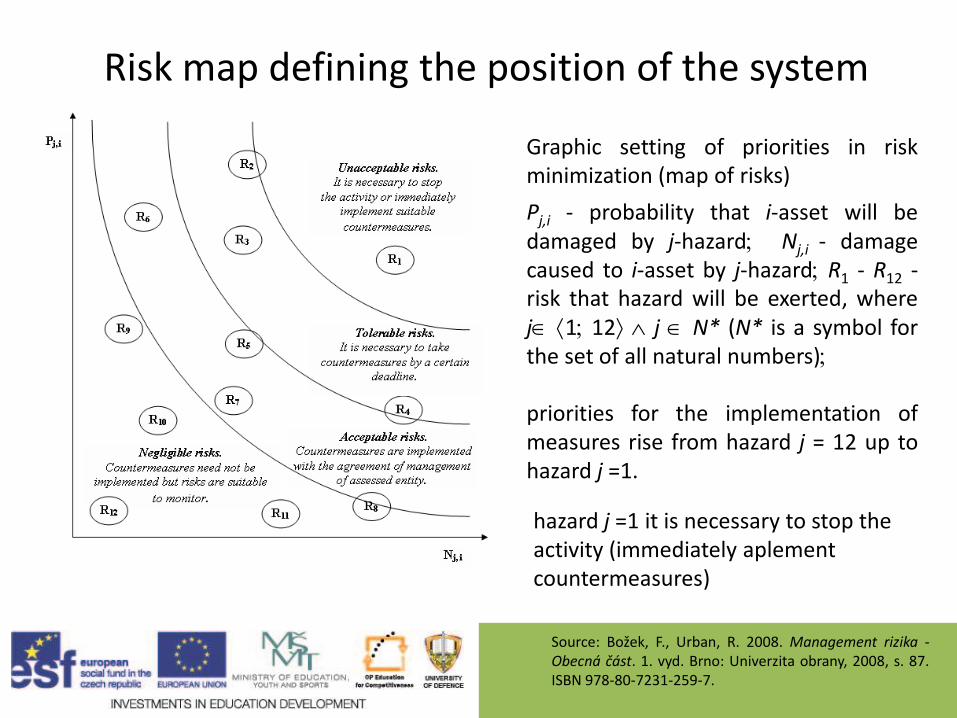
Risk map defining the position of the system
Source: Božek, F., Urban, R. 2008. Management rizika - Obecná část. 1. vyd. Brno: Univerzita obrany, 2008, s. 87. ISBN 978-80-7231-259-7.
Graphic setting of priorities in risk minimization (map of risks)
Pj,i - probability that i-asset will be damaged by j-hazard Nj,i - damage caused to i-asset by j-hazard R1 - R12 - risk that hazard will be exerted, where j 1 12 j N* (N* is a symbol for the set of all natural numbers) priorities for the implementation of measures rise from hazard j = 12 up to hazard j =1.
hazard j =1 it is necessary to stop the activity (immediately aplement countermeasures)
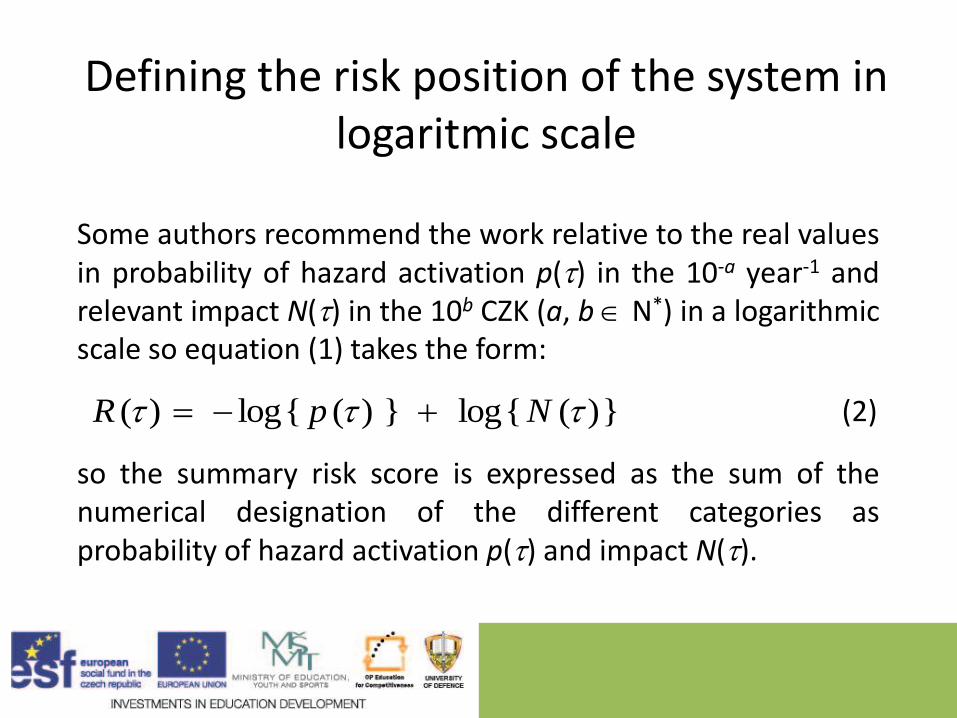
Defining the risk position of the system in logaritmic scale
Some authors recommend the work relative to the real values in probability of hazard activation p() in the 10-a year-1 and relevant impact N() in the 10b CZK (a, b N*) in a logarithmic scale so equation (1) takes the form:
(2)
so the summary risk score is expressed as the sum of the numerical designation of the different categories as probability of hazard activation p() and impact N().
})({log})({log)( NpR
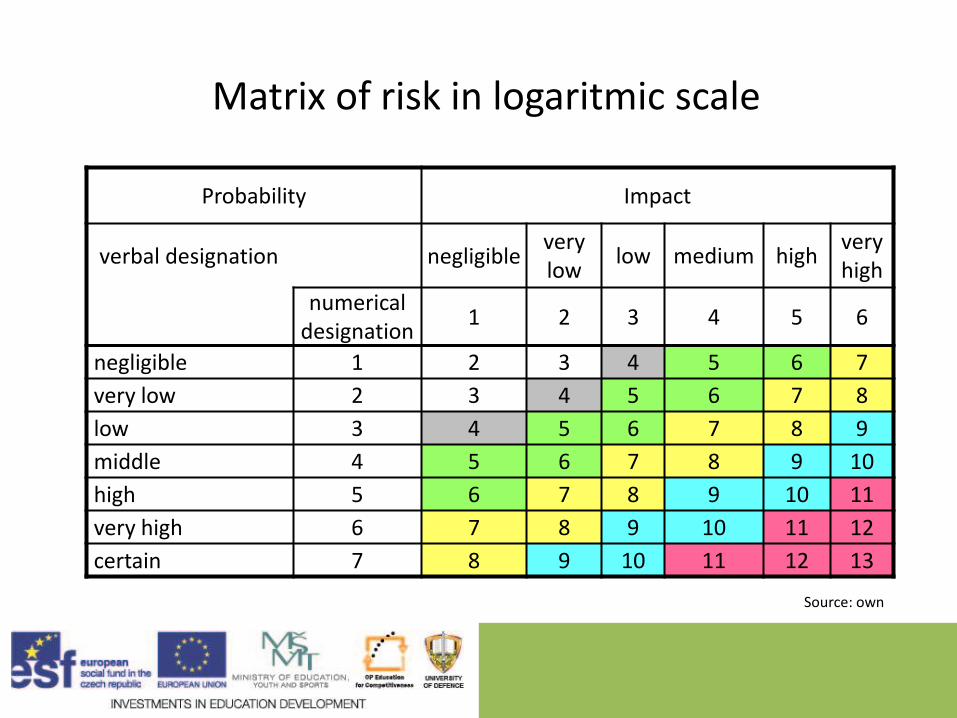
Matrix of risk in logaritmic scale
Probability Impact
verbal designation negligible very low
low medium high very high
numerical
designation 1 2 3 4 5 6
negligible 1 2 3 4 5 6 7
very low 2 3 4 5 6 7 8
low 3 4 5 6 7 8 9
middle 4 5 6 7 8 9 10
high 5 6 7 8 9 10 11
very high 6 7 8 9 10 11 12
certain 7 8 9 10 11 12 13
Source: own
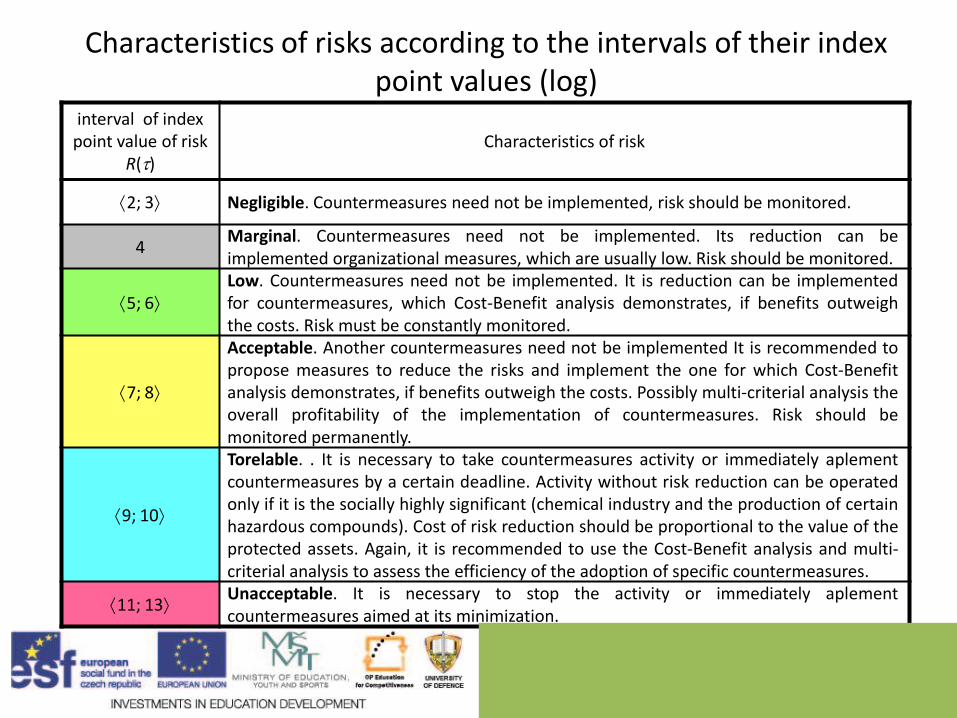
Characteristics of risks according to the intervals of their index point values (log)
interval of index point value of risk
R() Characteristics of risk
2; 3 Negligible. Countermeasures need not be implemented, risk should be monitored.
4 Marginal. Countermeasures need not be implemented. Its reduction can be implemented organizational measures, which are usually low. Risk should be monitored.
5; 6 Low. Countermeasures need not be implemented. It is reduction can be implemented for countermeasures, which Cost-Benefit analysis demonstrates, if benefits outweigh the costs. Risk must be constantly monitored.
7; 8
Acceptable. Another countermeasures need not be implemented It is recommended to propose measures to reduce the risks and implement the one for which Cost-Benefit analysis demonstrates, if benefits outweigh the costs. Possibly multi-criterial analysis the overall profitability of the implementation of countermeasures. Risk should be monitored permanently.
9; 10
Torelable. . It is necessary to take countermeasures activity or immediately aplement countermeasures by a certain deadline. Activity without risk reduction can be operated only if it is the socially highly significant (chemical industry and the production of certain hazardous compounds). Cost of risk reduction should be proportional to the value of the protected assets. Again, it is recommended to use the Cost-Benefit analysis and multi-criterial analysis to assess the efficiency of the adoption of specific countermeasures.
11; 13 Unacceptable. It is necessary to stop the activity or immediately aplement countermeasures aimed at its minimization.
Source: own
Protection of NATURA 2000 sites in military training areas. Application of semi-
quantitative risk assessment
Rough implementation of training and maintenance of Natura 2000 sites can damage or destroy the individual elements of sites, and cause ecological harm or damage.
The aim of the application of risk management is to ensure the protection of selected species of plants, animals and habitat types, which are from a European perspective valuable, rare or limited occurrence of a particular area (endemic) and the most vulnerable.
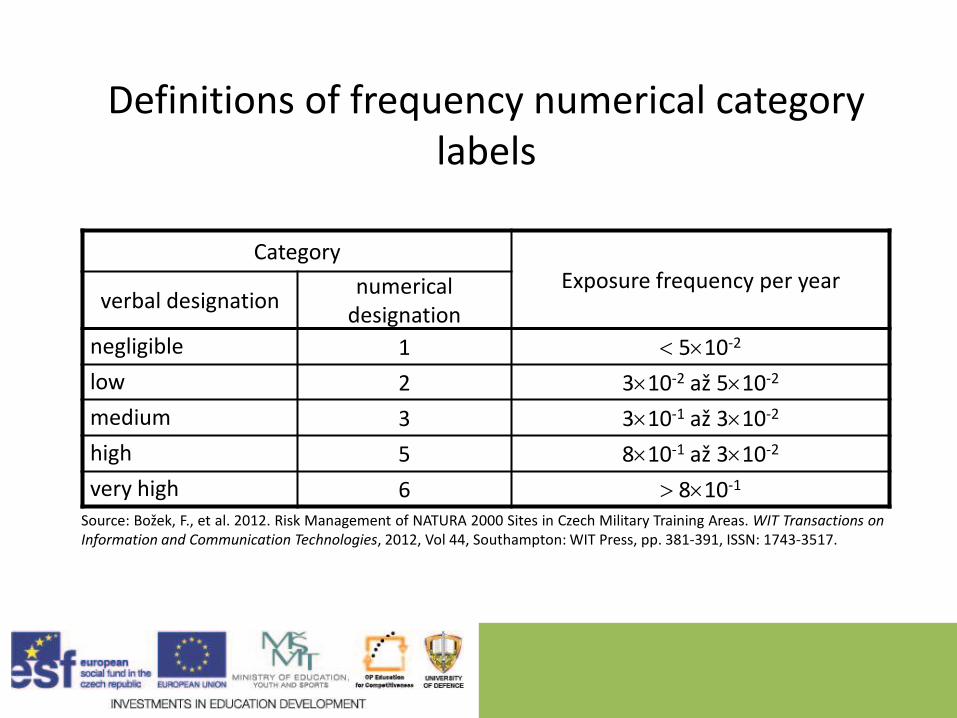
Definitions of frequency numerical category labels
Category Exposure frequency per year
verbal designation numerical
designation
negligible 1 510-2
low 2 310-2 až 510-2
medium 3 310-1 až 310-2
high 5 810-1 až 310-2
very high 6 810-1 Source: Božek, F., et al. 2012. Risk Management of NATURA 2000 Sites in Czech Military Training Areas. WIT Transactions on Information and Communication Technologies, 2012, Vol 44, Southampton: WIT Press, pp. 381-391, ISSN: 1743-3517.
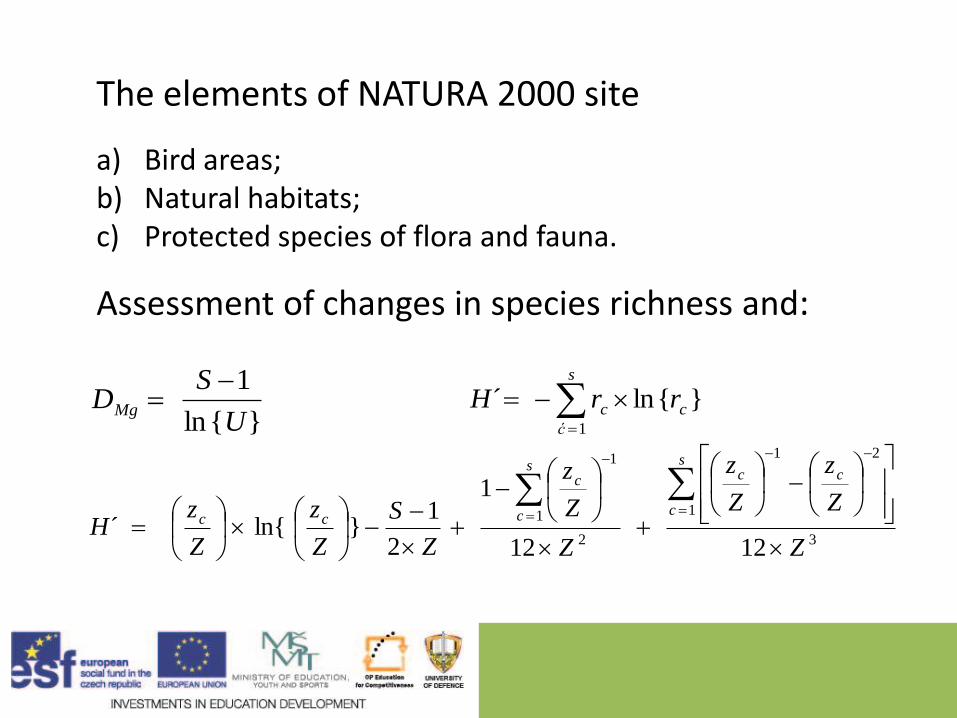
The elements of NATURA 2000 site
a) Bird areas; b) Natural habitats; c) Protected species of flora and fauna.
Assessment of changes in species richness and:
}{ln
1
U
SDMg
s
ć
cc rrH1
}{ln´
3
1
21
2
1
1
1212
1
2
1}ln{´
Z
Z
z
Z
z
Z
Z
z
Z
S
Z
z
Z
zH
s
c
ccs
c
c
cc
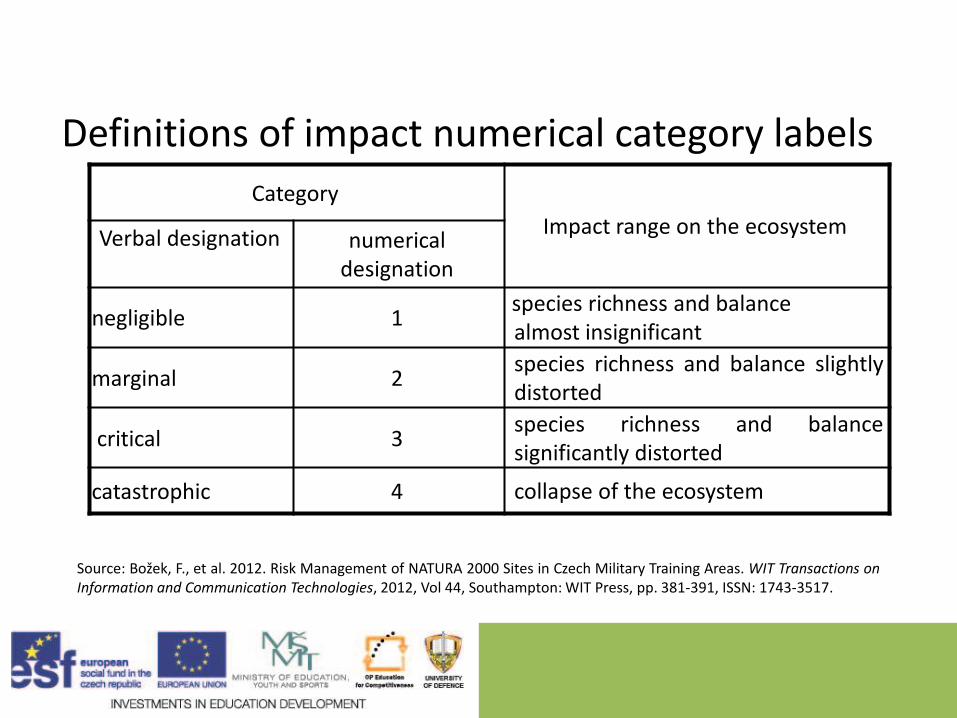
Definitions of impact numerical category labels
Category
Impact range on the ecosystem Verbal designation
numerical designation
negligible 1 species richness and balance almost insignificant
marginal 2 species richness and balance slightly distorted
critical 3 species richness and balance significantly distorted
catastrophic 4 collapse of the ecosystem
Source: Božek, F., et al. 2012. Risk Management of NATURA 2000 Sites in Czech Military Training Areas. WIT Transactions on Information and Communication Technologies, 2012, Vol 44, Southampton: WIT Press, pp. 381-391, ISSN: 1743-3517.
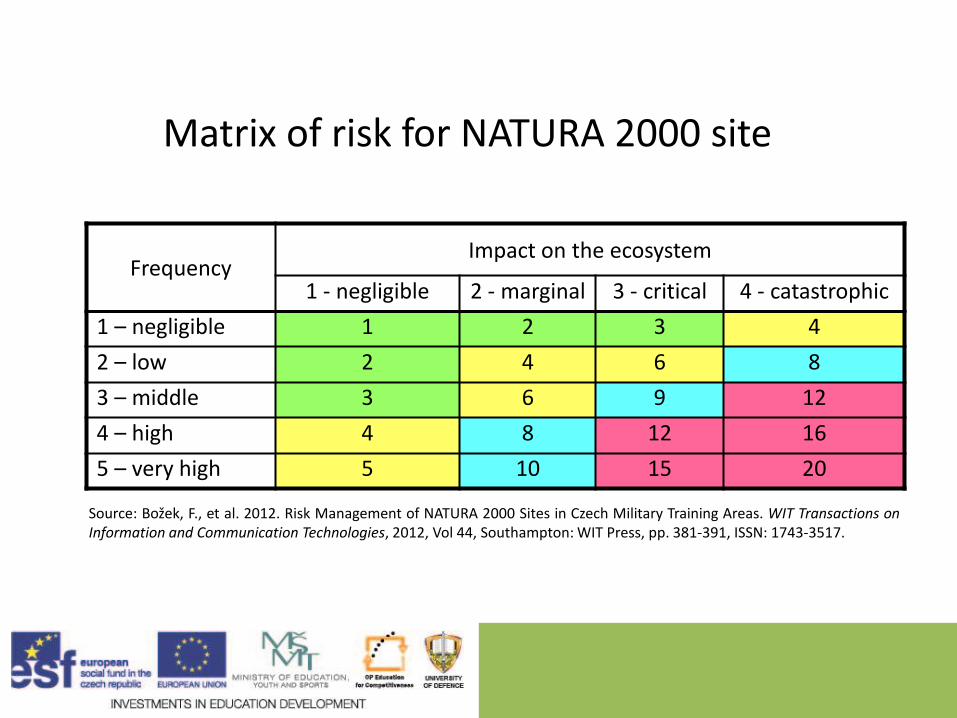
Matrix of risk for NATURA 2000 site
Frequency Impact on the ecosystem
1 - negligible 2 - marginal 3 - critical 4 - catastrophic
1 – negligible 1 2 3 4
2 – low 2 4 6 8
3 – middle 3 6 9 12
4 – high 4 8 12 16
5 – very high 5 10 15 20
Source: Božek, F., et al. 2012. Risk Management of NATURA 2000 Sites in Czech Military Training Areas. WIT Transactions on Information and Communication Technologies, 2012, Vol 44, Southampton: WIT Press, pp. 381-391, ISSN: 1743-3517.
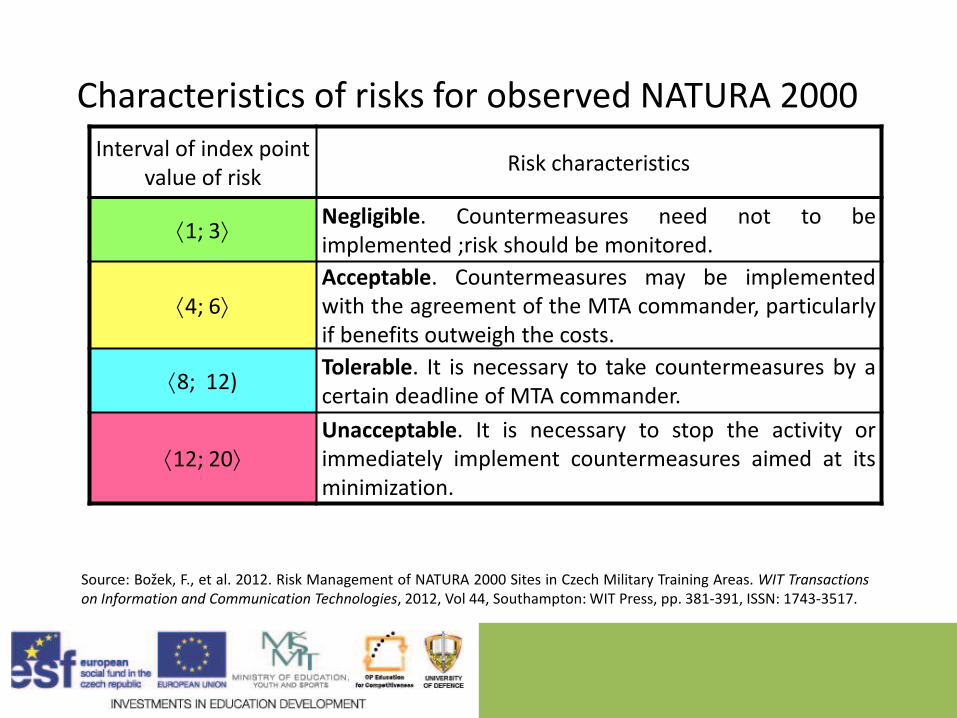
Characteristics of risks for observed NATURA 2000 site Interval of index point
value of risk Risk characteristics
1; 3 Negligible. Countermeasures need not to be implemented ;risk should be monitored.
4; 6 Acceptable. Countermeasures may be implemented with the agreement of the MTA commander, particularly if benefits outweigh the costs.
8; 12) Tolerable. It is necessary to take countermeasures by a certain deadline of MTA commander.
12; 20 Unacceptable. It is necessary to stop the activity or immediately implement countermeasures aimed at its minimization.
Source: Božek, F., et al. 2012. Risk Management of NATURA 2000 Sites in Czech Military Training Areas. WIT Transactions on Information and Communication Technologies, 2012, Vol 44, Southampton: WIT Press, pp. 381-391, ISSN: 1743-3517.
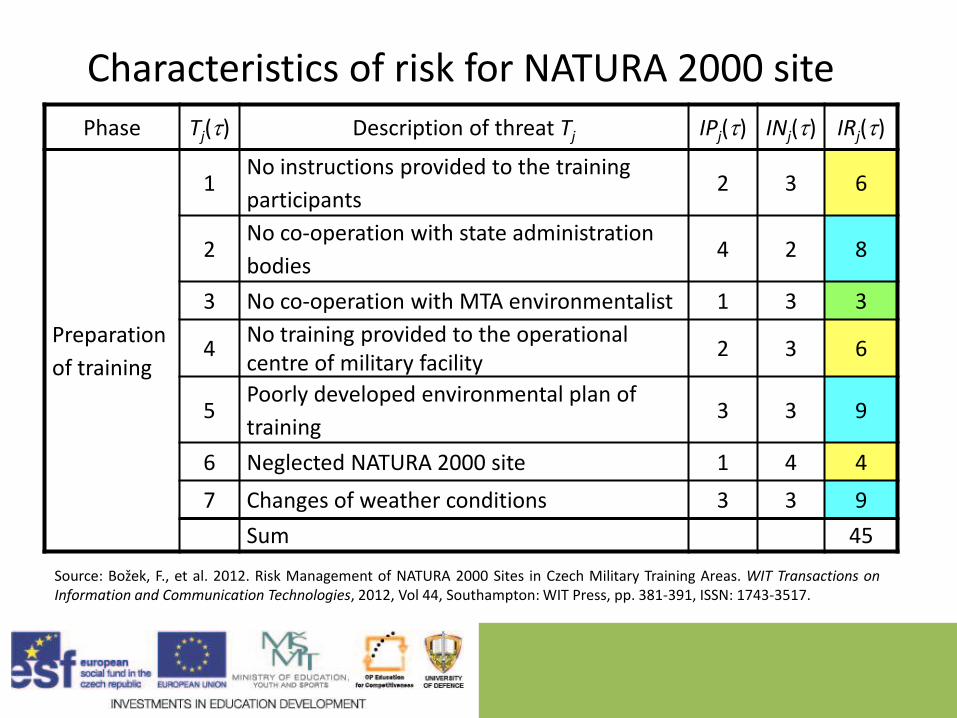
Characteristics of risk for NATURA 2000 site
Phase Tj() Description of threat Tj IPj() INj() IRj()
Preparation
of training
1 No instructions provided to the training
participants 2 3 6
2 No co-operation with state administration
bodies 4 2 8
3 No co-operation with MTA environmentalist 1 3 3
4 No training provided to the operational centre of military facility
2 3 6
5 Poorly developed environmental plan of
training 3 3 9
6 Neglected NATURA 2000 site 1 4 4
7 Changes of weather conditions 3 3 9
Sum 45
Source: Božek, F., et al. 2012. Risk Management of NATURA 2000 Sites in Czech Military Training Areas. WIT Transactions on Information and Communication Technologies, 2012, Vol 44, Southampton: WIT Press, pp. 381-391, ISSN: 1743-3517.
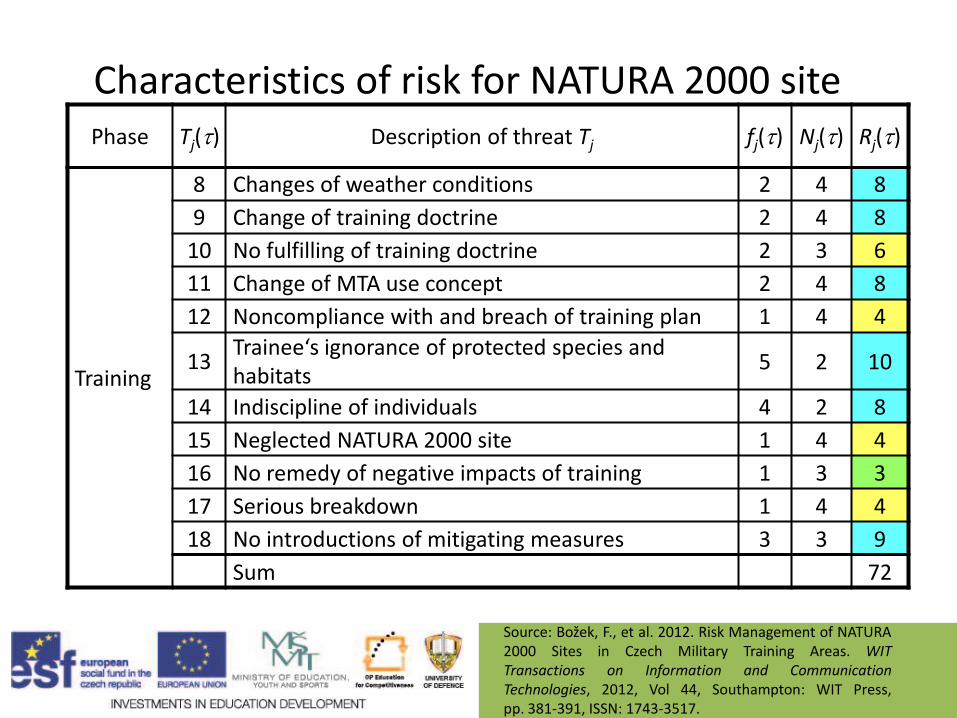
Characteristics of risk for NATURA 2000 site Phase Tj() Description of threat Tj fj() Nj() Rj()
Training
8 Changes of weather conditions 2 4 8
9 Change of training doctrine 2 4 8
10 No fulfilling of training doctrine 2 3 6
11 Change of MTA use concept 2 4 8
12 Noncompliance with and breach of training plan 1 4 4
13 Trainee‘s ignorance of protected species and habitats
5 2 10
14 Indiscipline of individuals 4 2 8
15 Neglected NATURA 2000 site 1 4 4
16 No remedy of negative impacts of training 1 3 3
17 Serious breakdown 1 4 4
18 No introductions of mitigating measures 3 3 9
Sum 72
Source: Božek, F., et al. 2012. Risk Management of NATURA 2000 Sites in Czech Military Training Areas. WIT Transactions on Information and Communication Technologies, 2012, Vol 44, Southampton: WIT Press, pp. 381-391, ISSN: 1743-3517.
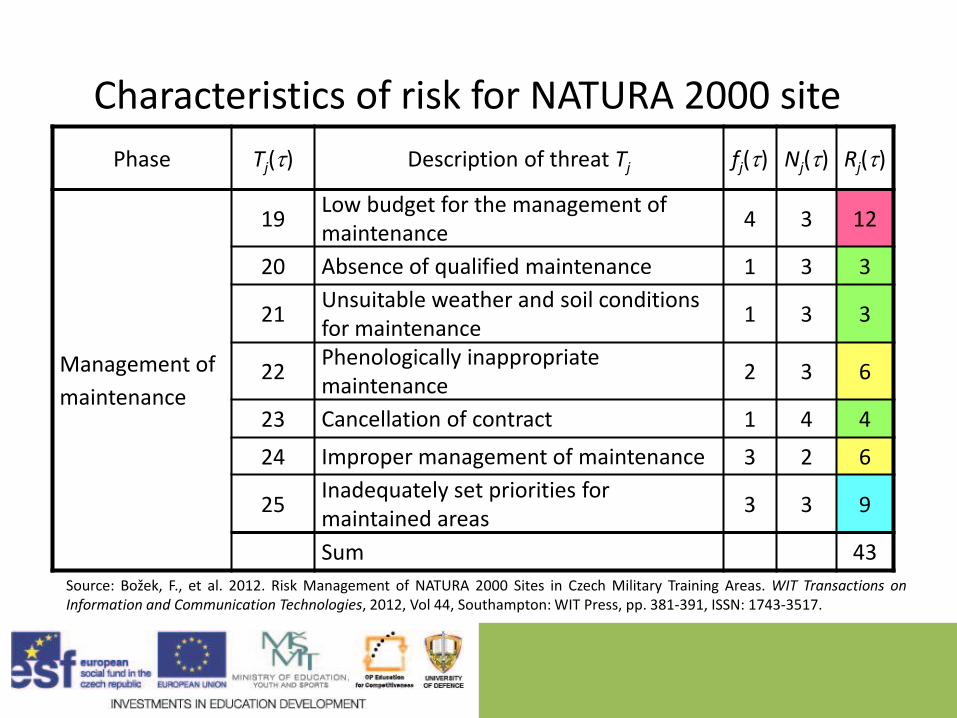
Characteristics of risk for NATURA 2000 site
Phase Tj() Description of threat Tj fj() Nj() Rj()
Management of
maintenance
19 Low budget for the management of maintenance
4 3 12
20 Absence of qualified maintenance 1 3 3
21 Unsuitable weather and soil conditions for maintenance
1 3 3
22 Phenologically inappropriate maintenance
2 3 6
23 Cancellation of contract 1 4 4
24 Improper management of maintenance 3 2 6
25 Inadequately set priorities for maintained areas
3 3 9
Sum 43
Source: Božek, F., et al. 2012. Risk Management of NATURA 2000 Sites in Czech Military Training Areas. WIT Transactions on Information and Communication Technologies, 2012, Vol 44, Southampton: WIT Press, pp. 381-391, ISSN: 1743-3517.
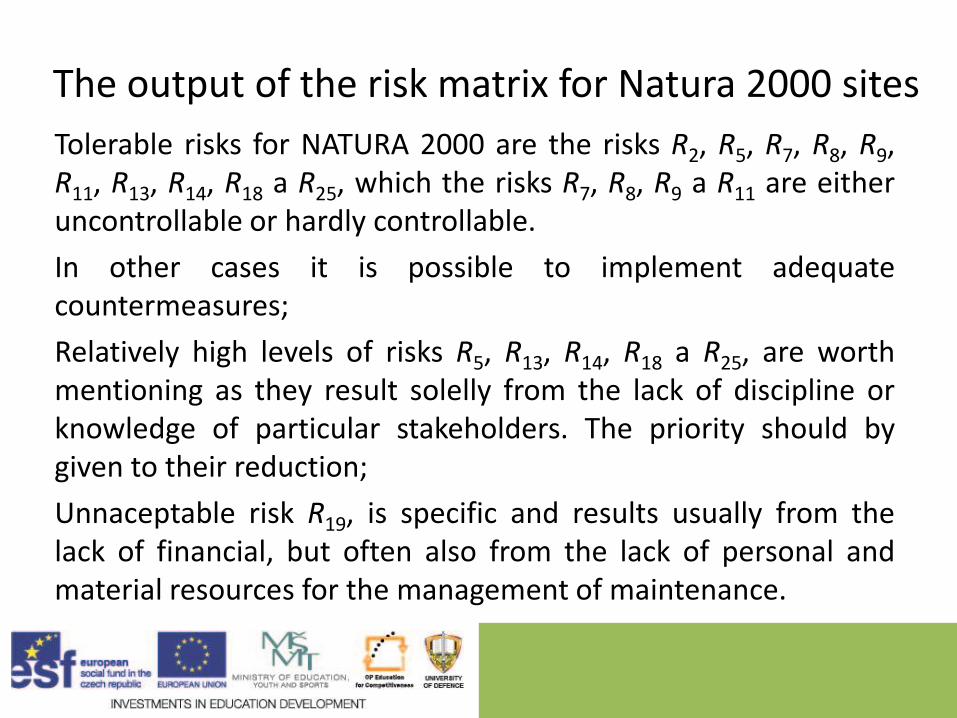
The output of the risk matrix for Natura 2000 sites
Tolerable risks for NATURA 2000 are the risks R2, R5, R7, R8, R9, R11, R13, R14, R18 a R25, which the risks R7, R8, R9 a R11 are either uncontrollable or hardly controllable.
In other cases it is possible to implement adequate countermeasures;
Relatively high levels of risks R5, R13, R14, R18 a R25, are worth mentioning as they result solelly from the lack of discipline or knowledge of particular stakeholders. The priority should by given to their reduction;
Unnaceptable risk R19, is specific and results usually from the lack of financial, but often also from the lack of personal and material resources for the management of maintenance.
Conclusion
Semi-quantitative risk assessment
- provides a level between text qualitative risk assessment and numerical quantitative risk assessment in index scale of certain range;
- provides a more consistent and rigorous approach to assessing and comparing risks, including strategies for risk management in comparison with qualitative assessment and eliminates certain ambiguities and inconsistencies, which can produce qualitative risk analysis;
Conclusion
Semi-quantitative risk assessment
- requires strict labeling categories probability of hazard activation and impact to individual categories don´t overlap and were also exhausting;
- provides the same, but more accurate outputs in the form of a matrix and risk maps compared with qualitative analysis;
- has a similar utility in practice as a qualitative assessment.

Seminar to the T15 Students will learn the advantages and shortcomings of semi-quantitative risk assessment in comparison with qualitative and quantitative way and learn the procedure for obtaining outputs of semi-quantitative analysis, particularly in the form of risk maps and views in the risk matrix.
Formed groups of 3-5 students implement a simple semi-quantitative risk analysis system (part of the department of military training area, households, establishments, public institutions, region) and make the matrix, or the risk maps of the investigated system. They use the results obtained in previous exercises.