semi-annual financial statement– as at june 30, 2011€¦ · · 2011-09-2356,900 nestle sa, ......
TRANSCRIPT
Semi-Annual Financial Statement – as at June 30, 2011
managed by CI Investments Inc. issued by Unity Life of Canada
CI SegregatedFunds

A look inside
Overview ............................................................................................................................... 1
Equity Funds
CI Global Segregated Fund ...................................................................................................... 2
CI Global Value Segregated Fund ............................................................................................ 7
CI Harbour Segregated Fund .................................................................................................... 11
CI Harbour Growth & Income Segregated Fund ...................................................................... 15
CI Synergy American Segregated Fund ................................................................................... 20
Income Funds
CI Money Market Segregated Fund ........................................................................................ 24
Notes to the Financial Statements ................................................................................... 28
Legal Notice ........................................................................................................................ 30
– 1 –
Enclosed are the Financial Statements for your CI Investments
segregated funds for the period ending June 30, 2011. Inside is important
information about each fund, including its financial statements for the
period and a list of the top portfolio holdings of the underlying fund as of
the end of the year.
Additional information about your funds can be found on our website,
www.ci.com.
If you have any questions about your investments, please contact your
financial advisor. CI is proud to partner with advisors across Canada.
We believe investors are most successful when they follow an investment
plan developed with the assistance of a qualified advisor.
You may also contact CI Client Services at 1-800-792-9355.
Thank you for investing with us.
ABOUT CI INVESTMENTS
CI has been investing on behalf of Canadians since 1965 and has grown
to become one of Canada’s largest investment fund companies. We
manage over $74 billion on behalf of 1.7 million Canadians. CI is a
subsidiary of CI Financial Corp., a TSX-listed financial services firm
with $97 billion in fee-earning assets at June 30, 2011.
CI provides one of the industry’s widest selections of investment products
and services and a strong lineup of leading portfolio management teams.
Our portfolio management expertise is offered through several platforms,
including mutual funds, tax-efficient funds, segregated funds, and
managed solutions.
2 Queen Street East, Twentieth FloorToronto, Ontario M5C 3G7www.ci.com
Telephone: 416-364-1145Toll Free: 1-800-268-9374Facsimile: 416-364-6299

– 2 –
CI Global Segregated FundUnderlying Fund Information (unaudited)
CIG - 025
Top 25 Holdings of CI Global Fund
No. of Shares/ Average FairPar Value Investment Cost ($) Value ($)
Cash & Equivalents 30,639,240 172,400 Eli Lilly and Co. 6,289,030 6,240,160 577,969 Bank of America Corp. 7,000,233 6,109,350 204,605 Wells Fargo & Co. 5,809,774 5,537,118 131,197 JPMorgan Chase & Co. 5,341,142 5,180,261 534,416 HSBC Holdings PLC 5,522,854 5,115,359 76,400 Novartis AG, Registered Shares 4,569,636 4,512,984 36,687 Apache Corp. 3,686,427 4,365,883
1,065,700 Barclays PLC 4,410,022 4,230,238 109,195 Credit Suisse Group AG 4,852,911 4,095,564
25,300 WW Grainger Inc. 3,585,067 3,749,151 64,200 Accenture PLC 3,544,469 3,741,068
242,750 Deutsche Telekom AG 3,507,064 3,671,909 50,700 Norfolk Southern Corp. 3,543,498 3,663,900 27,600 Siemens AG, Registered Shares 3,495,364 3,655,655 95,684 BHP Billiton PLC 2,909,667 3,631,507 62,042 Baxter International Inc. 2,952,596 3,571,636
102,900 Royal Dutch Shell PLC, Class A 3,484,632 3,532,678 1,373,100 Vodafone Group PLC 3,496,065 3,513,194
44,722 Exxon Mobil Corp. 2,901,264 3,510,094 84,711 Southwestern Energy Co. 3,523,595 3,503,277 34,755 Fresenius SE & Co. KGaA 2,590,138 3,498,930
163,700 Xstrata PLC 3,323,730 3,475,135 34,603 Occidental Petroleum Corp. 2,802,953 3,472,114 56,900 Nestle SA, Registered Shares 3,455,591 3,410,058
Semi-Annual Financial Statements as at June 30, 2011
– 3 –
IncomeIncome distribution from investmentsInterestManagement fee rebate
Expenses (Management expense ratios – see Financial Highlights)
Management feesAdministrative feesInsurance feesCustody feesLegal feesAudit feesGoods and services tax/Harmonized sales tax
Net investment income (loss) for the period
Realized and unrealized gain (loss) on investments Realized gain (loss) on investmentsCapital gain distribution
from investmentsChange in unrealized appreciation
(depreciation) of investmentsNet gain (loss) on investmentsIncrease (decrease) in net assets
from operations(Increase (decrease) in net assets from operations per unit – see Supplementary Schedule)
CI Global Segregated FundFinancial Statements (unaudited)
AssetsInvestments at fair value*CashReceivable for unit subscriptionsReceivable for securities soldManagement fee rebate receivableReceivable for dividends and
accrued interest
LiabilitiesBank overdraftManagement fees payableAdministration fees payableInsurance fees payablePayable for securities purchased Payable for unit redemptions
Net assets and unitholders’ equity
*Investments at cost
Net Assets per unit – (see Financial Highlights)
Number of units outstanding (Unit transactions – see Supplementary Schedule)
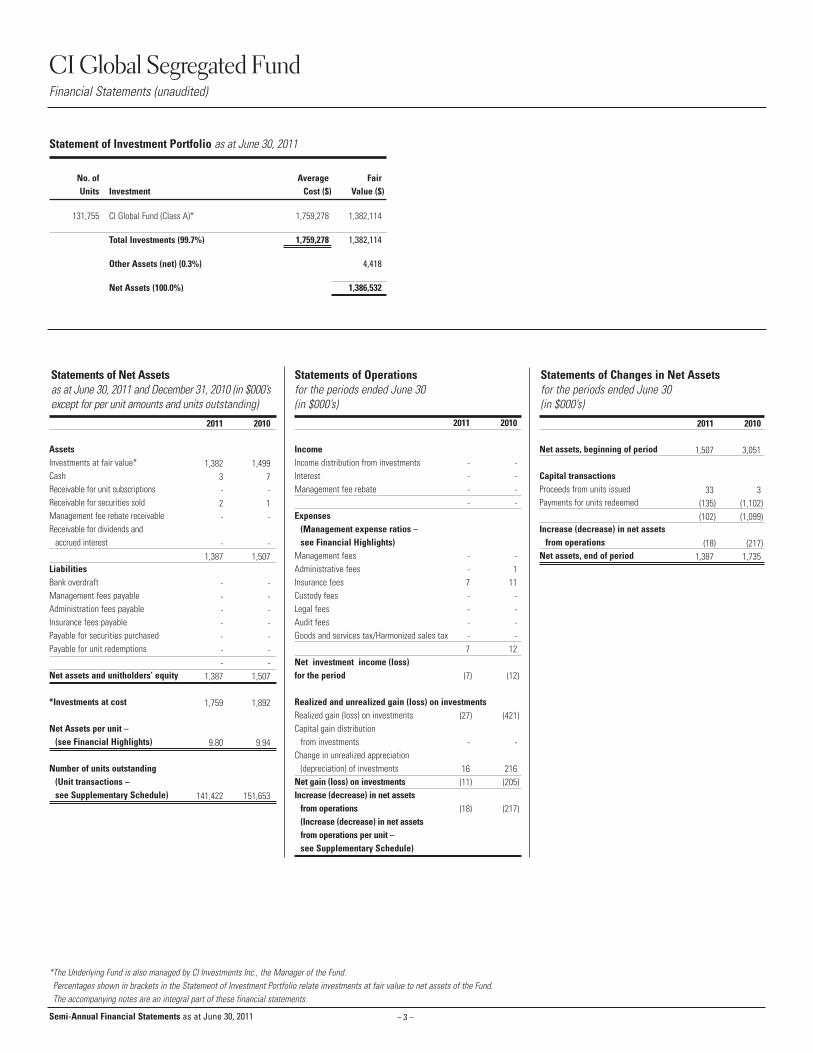
Statements of Operations for the periods ended June 30(in $000’s)
2011 2010
1,382 1,4993 7- -2 1- -
- -1,387 1,507
- -- -- -- -- -- -- -
1,387 1,507
1,759 1,892
9.80 9.94
141,422 151,653
Statements of Net Assets as at June 30, 2011 and December 31, 2010 (in $000’sexcept for per unit amounts and units outstanding)
Statements of Changes in Net Assets for the periods ended June 30(in $000’s)
2011 2010
- -- -- -- -
- -- 17 11- -- -- -- -7 12
(7) (12)
(27) (421)
- -
16 216(11) (205)
(18) (217)
Statement of Investment Portfolio as at June 30, 2011
No. of Average FairUnits Investment Cost ($) Value ($)
131,755 CI Global Fund (Class A)* 1,759,278 1,382,114
Total Investments (99.7%) 1,759,278 1,382,114
Other Assets (net) (0.3%) 4,418
Net Assets (100.0%) 1,386,532
*The Underlying Fund is also managed by CI Investments Inc., the Manager of the Fund.Percentages shown in brackets in the Statement of Investment Portfolio relate investments at fair value to net assets of the Fund.The accompanying notes are an integral part of these financial statements.
Net assets, beginning of period
Capital transactionsProceeds from units issued Payments for units redeemed
Increase (decrease) in net assetsfrom operations
Net assets, end of period
2011 2010
1,507 3,051
33 3(135) (1,102)(102) (1,099)
(18) (217)1,387 1,735
Semi-Annual Financial Statements as at June 30, 2011
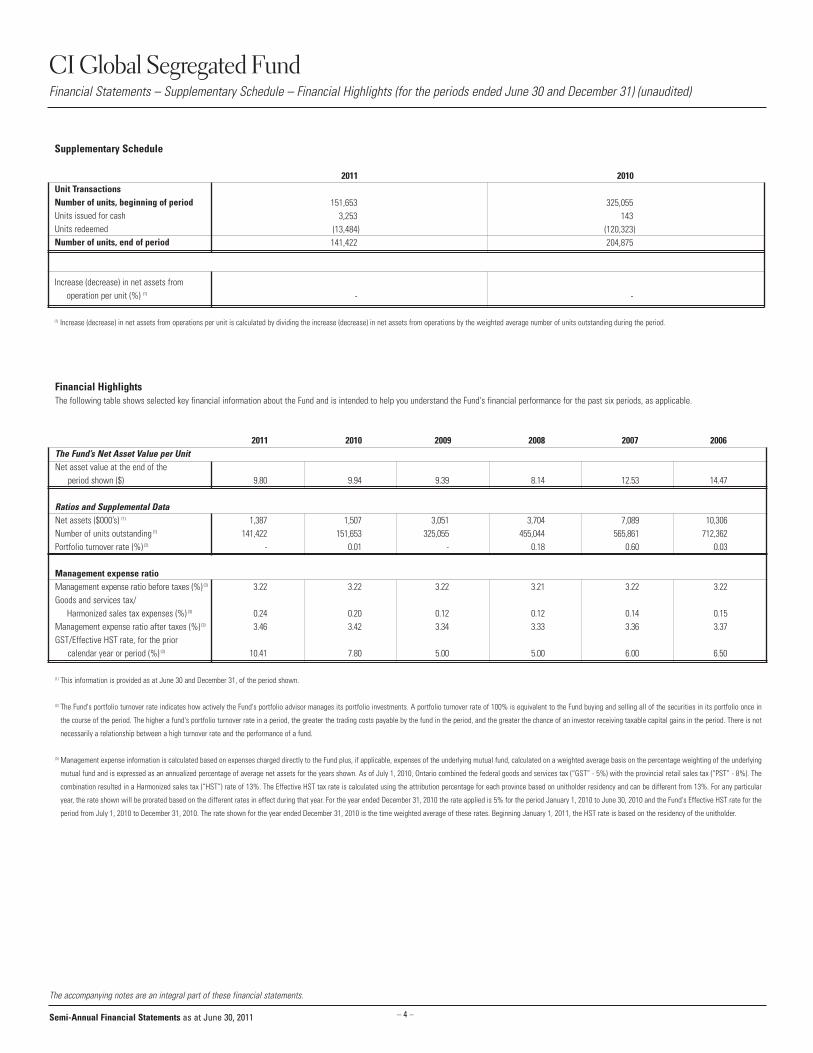
Financial HighlightsThe following table shows selected key financial information about the Fund and is intended to help you understand the Fund's financial performance for the past six periods, as applicable.
2011 2010 2009 2008 2007 2006The Fund’s Net Asset Value per UnitNet asset value at the end of the
period shown ($)
Ratios and Supplemental DataNet assets ($000’s) (1)
Number of units outstanding (1)
Portfolio turnover rate (%) (2)
Management expense ratio Management expense ratio before taxes (%) (3)
Goods and services tax/Harmonized sales tax expenses (%) (3)
Management expense ratio after taxes (%) (3)
GST/Effective HST rate, for the prior calendar year or period (%) (3)
(1) This information is provided as at June 30 and December 31, of the period shown.
(2) The Fund's portfolio turnover rate indicates how actively the Fund's portfolio advisor manages its portfolio investments. A portfolio turnover rate of 100% is equivalent to the Fund buying and selling all of the securities in its portfolio once in
the course of the period. The higher a fund's portfolio turnover rate in a period, the greater the trading costs payable by the fund in the period, and the greater the chance of an investor receiving taxable capital gains in the period. There is not
necessarily a relationship between a high turnover rate and the performance of a fund.
(3) Management expense information is calculated based on expenses charged directly to the Fund plus, if applicable, expenses of the underlying mutual fund, calculated on a weighted average basis on the percentage weighting of the underlying
mutual fund and is expressed as an annualized percentage of average net assets for the years shown. As of July 1, 2010, Ontario combined the federal goods and services tax (“GST” - 5%) with the provincial retail sales tax (“PST” - 8%). The
combination resulted in a Harmonized sales tax (“HST”) rate of 13%. The Effective HST tax rate is calculated using the attribution percentage for each province based on unitholder residency and can be different from 13%. For any particular
year, the rate shown will be prorated based on the different rates in effect during that year. For the year ended December 31, 2010 the rate applied is 5% for the period January 1, 2010 to June 30, 2010 and the Fund's Effective HST rate for the
period from July 1, 2010 to December 31, 2010. The rate shown for the year ended December 31, 2010 is the time weighted average of these rates. Beginning January 1, 2011, the HST rate is based on the residency of the unitholder.
– 4 –
CI Global Segregated FundFinancial Statements – Supplementary Schedule – Financial Highlights (for the periods ended June 30 and December 31) (unaudited)
Semi-Annual Financial Statements as at June 30, 2011
The accompanying notes are an integral part of these financial statements.
Supplementary Schedule
2011 2010Unit TransactionsNumber of units, beginning of periodUnits issued for cash Units redeemedNumber of units, end of period
Increase (decrease) in net assets from operation per unit (%) (1)
(1) Increase (decrease) in net assets from operations per unit is calculated by dividing the increase (decrease) in net assets from operations by the weighted average number of units outstanding during the period.
151,653 325,0553,253 143
(13,484) (120,323)141,422 204,875
- -
9.80 9.94 9.39 8.14 12.53 14.47
1,387 1,507 3,051 3,704 7,089 10,306141,422 151,653 325,055 455,044 565,861 712,362
- 0.01 - 0.18 0.60 0.03
3.22 3.22 3.22 3.21 3.22 3.22
0.24 0.20 0.12 0.12 0.14 0.153.46 3.42 3.34 3.33 3.36 3.37
10.41 7.80 5.00 5.00 6.00 6.50
– 5 –
CI Global Segregated FundFund Specific Financial Instruments Risks (Note 2) (unaudited)
The accompanying notes are an integral part of these financial statements.
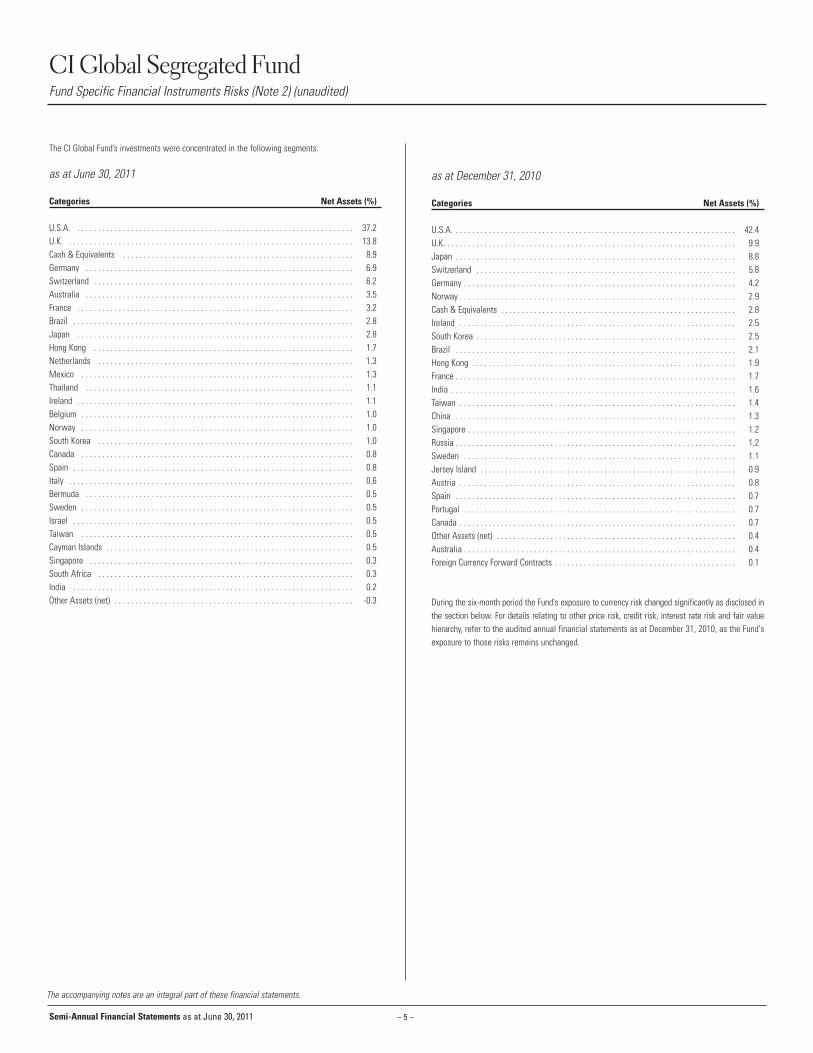
as at December 31, 2010
Categories Net Assets (%)
U.S.A. . . . . . . . . . . . . . . . . . . . . . . . . . . . . . . . . . . . . . . . . . . . . . . . . . . . . . . . . . . . . . . . . . . . . 42.4U.K. . . . . . . . . . . . . . . . . . . . . . . . . . . . . . . . . . . . . . . . . . . . . . . . . . . . . . . . . . . . . . . . . . . . . . . 9.9Japan . . . . . . . . . . . . . . . . . . . . . . . . . . . . . . . . . . . . . . . . . . . . . . . . . . . . . . . . . . . . . . . . . . . . 8.8Switzerland . . . . . . . . . . . . . . . . . . . . . . . . . . . . . . . . . . . . . . . . . . . . . . . . . . . . . . . . . . . . . . . 5.8Germany . . . . . . . . . . . . . . . . . . . . . . . . . . . . . . . . . . . . . . . . . . . . . . . . . . . . . . . . . . . . . . . . . . 4.2Norway . . . . . . . . . . . . . . . . . . . . . . . . . . . . . . . . . . . . . . . . . . . . . . . . . . . . . . . . . . . . . . . . . . . 2.9Cash & Equivalents . . . . . . . . . . . . . . . . . . . . . . . . . . . . . . . . . . . . . . . . . . . . . . . . . . . . . . . . . 2.8Ireland . . . . . . . . . . . . . . . . . . . . . . . . . . . . . . . . . . . . . . . . . . . . . . . . . . . . . . . . . . . . . . . . . . . 2.5South Korea . . . . . . . . . . . . . . . . . . . . . . . . . . . . . . . . . . . . . . . . . . . . . . . . . . . . . . . . . . . . . . . 2.5Brazil . . . . . . . . . . . . . . . . . . . . . . . . . . . . . . . . . . . . . . . . . . . . . . . . . . . . . . . . . . . . . . . . . . . . 2.1Hong Kong . . . . . . . . . . . . . . . . . . . . . . . . . . . . . . . . . . . . . . . . . . . . . . . . . . . . . . . . . . . . . . . . 1.9France . . . . . . . . . . . . . . . . . . . . . . . . . . . . . . . . . . . . . . . . . . . . . . . . . . . . . . . . . . . . . . . . . . . . 1.7India . . . . . . . . . . . . . . . . . . . . . . . . . . . . . . . . . . . . . . . . . . . . . . . . . . . . . . . . . . . . . . . . . . . . . 1.6Taiwan . . . . . . . . . . . . . . . . . . . . . . . . . . . . . . . . . . . . . . . . . . . . . . . . . . . . . . . . . . . . . . . . . . . 1.4China . . . . . . . . . . . . . . . . . . . . . . . . . . . . . . . . . . . . . . . . . . . . . . . . . . . . . . . . . . . . . . . . . . . . 1.3Singapore . . . . . . . . . . . . . . . . . . . . . . . . . . . . . . . . . . . . . . . . . . . . . . . . . . . . . . . . . . . . . . . . . 1.2Russia . . . . . . . . . . . . . . . . . . . . . . . . . . . . . . . . . . . . . . . . . . . . . . . . . . . . . . . . . . . . . . . . . . . . 1.2Sweden . . . . . . . . . . . . . . . . . . . . . . . . . . . . . . . . . . . . . . . . . . . . . . . . . . . . . . . . . . . . . . . . . . 1.1Jersey Island . . . . . . . . . . . . . . . . . . . . . . . . . . . . . . . . . . . . . . . . . . . . . . . . . . . . . . . . . . . . . . 0.9Austria . . . . . . . . . . . . . . . . . . . . . . . . . . . . . . . . . . . . . . . . . . . . . . . . . . . . . . . . . . . . . . . . . . . 0.8Spain . . . . . . . . . . . . . . . . . . . . . . . . . . . . . . . . . . . . . . . . . . . . . . . . . . . . . . . . . . . . . . . . . . . . 0.7Portugal . . . . . . . . . . . . . . . . . . . . . . . . . . . . . . . . . . . . . . . . . . . . . . . . . . . . . . . . . . . . . . . . . . 0.7Canada . . . . . . . . . . . . . . . . . . . . . . . . . . . . . . . . . . . . . . . . . . . . . . . . . . . . . . . . . . . . . . . . . . . 0.7Other Assets (net) . . . . . . . . . . . . . . . . . . . . . . . . . . . . . . . . . . . . . . . . . . . . . . . . . . . . . . . . . . 0.4Australia . . . . . . . . . . . . . . . . . . . . . . . . . . . . . . . . . . . . . . . . . . . . . . . . . . . . . . . . . . . . . . . . . . 0.4Foreign Currency Forward Contracts . . . . . . . . . . . . . . . . . . . . . . . . . . . . . . . . . . . . . . . . . . . . 0.1
During the six-month period the Fund's exposure to currency risk changed significantly as disclosed inthe section below. For details relating to other price risk, credit risk, interest rate risk and fair valuehierarchy, refer to the audited annual financial statements as at December 31, 2010, as the Fund'sexposure to those risks remains unchanged.
The CI Global Fund’s investments were concentrated in the following segments:
as at June 30, 2011
Categories Net Assets (%)
U.S.A. . . . . . . . . . . . . . . . . . . . . . . . . . . . . . . . . . . . . . . . . . . . . . . . . . . . . . . . . . . . . . . . . . . . 37.2U.K. . . . . . . . . . . . . . . . . . . . . . . . . . . . . . . . . . . . . . . . . . . . . . . . . . . . . . . . . . . . . . . . . . . . . . 13.8Cash & Equivalents . . . . . . . . . . . . . . . . . . . . . . . . . . . . . . . . . . . . . . . . . . . . . . . . . . . . . . . . 8.9Germany . . . . . . . . . . . . . . . . . . . . . . . . . . . . . . . . . . . . . . . . . . . . . . . . . . . . . . . . . . . . . . . . . 6.9Switzerland . . . . . . . . . . . . . . . . . . . . . . . . . . . . . . . . . . . . . . . . . . . . . . . . . . . . . . . . . . . . . . . 6.2Australia . . . . . . . . . . . . . . . . . . . . . . . . . . . . . . . . . . . . . . . . . . . . . . . . . . . . . . . . . . . . . . . . . 3.5France . . . . . . . . . . . . . . . . . . . . . . . . . . . . . . . . . . . . . . . . . . . . . . . . . . . . . . . . . . . . . . . . . . . 3.2Brazil . . . . . . . . . . . . . . . . . . . . . . . . . . . . . . . . . . . . . . . . . . . . . . . . . . . . . . . . . . . . . . . . . . . . 2.8Japan . . . . . . . . . . . . . . . . . . . . . . . . . . . . . . . . . . . . . . . . . . . . . . . . . . . . . . . . . . . . . . . . . . . 2.8Hong Kong . . . . . . . . . . . . . . . . . . . . . . . . . . . . . . . . . . . . . . . . . . . . . . . . . . . . . . . . . . . . . . . 1.7Netherlands . . . . . . . . . . . . . . . . . . . . . . . . . . . . . . . . . . . . . . . . . . . . . . . . . . . . . . . . . . . . . . 1.3Mexico . . . . . . . . . . . . . . . . . . . . . . . . . . . . . . . . . . . . . . . . . . . . . . . . . . . . . . . . . . . . . . . . . . 1.3Thailand . . . . . . . . . . . . . . . . . . . . . . . . . . . . . . . . . . . . . . . . . . . . . . . . . . . . . . . . . . . . . . . . . 1.1Ireland . . . . . . . . . . . . . . . . . . . . . . . . . . . . . . . . . . . . . . . . . . . . . . . . . . . . . . . . . . . . . . . . . . . 1.1Belgium . . . . . . . . . . . . . . . . . . . . . . . . . . . . . . . . . . . . . . . . . . . . . . . . . . . . . . . . . . . . . . . . . . 1.0Norway . . . . . . . . . . . . . . . . . . . . . . . . . . . . . . . . . . . . . . . . . . . . . . . . . . . . . . . . . . . . . . . . . . 1.0South Korea . . . . . . . . . . . . . . . . . . . . . . . . . . . . . . . . . . . . . . . . . . . . . . . . . . . . . . . . . . . . . . 1.0Canada . . . . . . . . . . . . . . . . . . . . . . . . . . . . . . . . . . . . . . . . . . . . . . . . . . . . . . . . . . . . . . . . . . 0.8Spain . . . . . . . . . . . . . . . . . . . . . . . . . . . . . . . . . . . . . . . . . . . . . . . . . . . . . . . . . . . . . . . . . . . . 0.8Italy . . . . . . . . . . . . . . . . . . . . . . . . . . . . . . . . . . . . . . . . . . . . . . . . . . . . . . . . . . . . . . . . . . . . . 0.6Bermuda . . . . . . . . . . . . . . . . . . . . . . . . . . . . . . . . . . . . . . . . . . . . . . . . . . . . . . . . . . . . . . . . . 0.5Sweden . . . . . . . . . . . . . . . . . . . . . . . . . . . . . . . . . . . . . . . . . . . . . . . . . . . . . . . . . . . . . . . . . . 0.5Israel . . . . . . . . . . . . . . . . . . . . . . . . . . . . . . . . . . . . . . . . . . . . . . . . . . . . . . . . . . . . . . . . . . . . 0.5Taiwan . . . . . . . . . . . . . . . . . . . . . . . . . . . . . . . . . . . . . . . . . . . . . . . . . . . . . . . . . . . . . . . . . . 0.5Cayman Islands . . . . . . . . . . . . . . . . . . . . . . . . . . . . . . . . . . . . . . . . . . . . . . . . . . . . . . . . . . . . 0.5Singapore . . . . . . . . . . . . . . . . . . . . . . . . . . . . . . . . . . . . . . . . . . . . . . . . . . . . . . . . . . . . . . . . 0.3South Africa . . . . . . . . . . . . . . . . . . . . . . . . . . . . . . . . . . . . . . . . . . . . . . . . . . . . . . . . . . . . . . 0.3India . . . . . . . . . . . . . . . . . . . . . . . . . . . . . . . . . . . . . . . . . . . . . . . . . . . . . . . . . . . . . . . . . . . . 0.2Other Assets (net) . . . . . . . . . . . . . . . . . . . . . . . . . . . . . . . . . . . . . . . . . . . . . . . . . . . . . . . . . . -0.3
Semi-Annual Financial Statements as at June 30, 2011

– 6 –
CI Global Segregated FundFund Specific Financial Instruments Risks (Note 2) (unaudited) (cont’d)
The accompanying notes are an integral part of these financial statements.
Currency Risk The Fund indirectly bears the currency risk exposure of the Underlying Fund. As at June 30, 2011 andDecember 31, 2010, the Underlying Fund was exposed to currency risk as it invested predominantlyin stocks that were denominated in currencies other than Canadian dollars, the functional currencyof the Fund and the Underlying Fund. As a result, the Fund would be affected by fluctuations in thevalue of such currencies relative to the Canadian dollar.
The tables below summarize the Underlying Fund’s exposure to currency risk.
as at June 30, 2011Assets
Currency (%)US Dollar 49.7 British Pound 15.4 Euro 12.8 Swiss Franc 5.0 Australian Dollar 3.3 Japanese Yen 2.8 Hong Kong Dollar 2.7 Brazilian Real 1.8 Thai Baht 1.1 Korean Won 1.0 Norwegian Krone 1.0 Mexican Peso 0.7 Israeli Shekel 0.5 Singapore Dollar 0.3 South Africa Rand 0.3 Taiwan Dollar 0.1 Total 98.5
as at December 31, 2010Assets
Currency (%)US Dollar 40.7 British Pound 10.1 Japanese Yen 8.9 Swiss Franc 4.8 Norwegian Krone 2.9 Hong Kong Dollar 2.8 Singapore Dollar 1.2 Swedish Krona 1.1 Korean Won 0.6 Australian Dollar 0.4 Taiwan Dollar 0.2 Brazilian Real 0.1 Euro (1.5) Total 72.3
As at June 30, 2011, had the Canadian dollar strengthened or weakened by 10% (December 31, 2010 -10%) in relation to all other foreign currencies held in the Underlying Fund, with all other variablesheld constant, net assets of the Fund would have indirectly decreased or increased, respectively, byapproximately $136,000 (December 31, 2010 - $108,000). In practice, the actual results may differfrom this analysis and the difference may be material.
Semi-Annual Financial Statements as at June 30, 2011
– 7 –
CI Global Value Segregated FundUnderlying Fund Information (unaudited)
CIG - 024
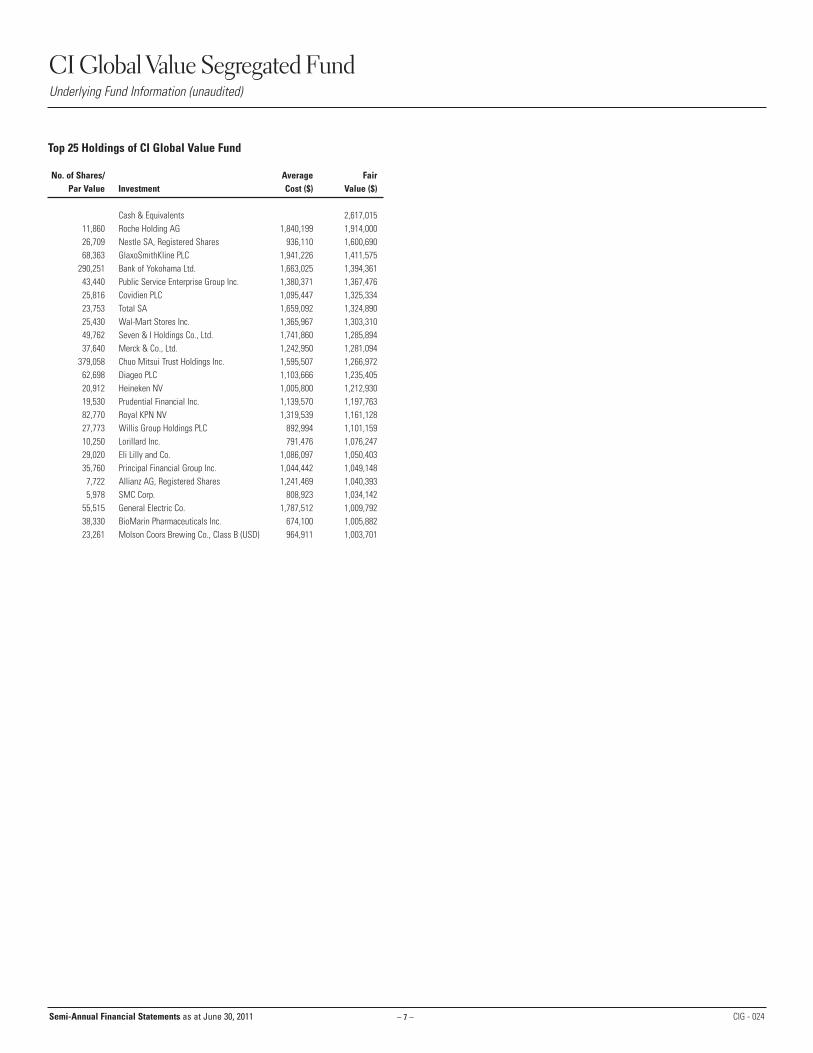
Top 25 Holdings of CI Global Value Fund
No. of Shares/ Average FairPar Value Investment Cost ($) Value ($)
Cash & Equivalents 2,617,015 11,860 Roche Holding AG 1,840,199 1,914,000 26,709 Nestle SA, Registered Shares 936,110 1,600,690 68,363 GlaxoSmithKline PLC 1,941,226 1,411,575
290,251 Bank of Yokohama Ltd. 1,663,025 1,394,361 43,440 Public Service Enterprise Group Inc. 1,380,371 1,367,476 25,816 Covidien PLC 1,095,447 1,325,334 23,753 Total SA 1,659,092 1,324,890 25,430 Wal-Mart Stores Inc. 1,365,967 1,303,310 49,762 Seven & I Holdings Co., Ltd. 1,741,860 1,285,894 37,640 Merck & Co., Ltd. 1,242,950 1,281,094
379,058 Chuo Mitsui Trust Holdings Inc. 1,595,507 1,266,972 62,698 Diageo PLC 1,103,666 1,235,405 20,912 Heineken NV 1,005,800 1,212,930 19,530 Prudential Financial Inc. 1,139,570 1,197,763 82,770 Royal KPN NV 1,319,539 1,161,128 27,773 Willis Group Holdings PLC 892,994 1,101,159 10,250 Lorillard Inc. 791,476 1,076,247 29,020 Eli Lilly and Co. 1,086,097 1,050,403 35,760 Principal Financial Group Inc. 1,044,442 1,049,148
7,722 Allianz AG, Registered Shares 1,241,469 1,040,393 5,978 SMC Corp. 808,923 1,034,142
55,515 General Electric Co. 1,787,512 1,009,792 38,330 BioMarin Pharmaceuticals Inc. 674,100 1,005,882 23,261 Molson Coors Brewing Co., Class B (USD) 964,911 1,003,701
Semi-Annual Financial Statements as at June 30, 2011
– 8 –
IncomeIncome distribution from investmentsInterestManagement fee rebate
Expenses (Management expense ratios – see Financial Highlights)
Management feesAdministrative feesInsurance feesCustody feesLegal feesAudit feesGoods and services tax/Harmonized sales tax
Net investment income (loss) for the period
Realized and unrealized gain (loss) on investments Realized gain (loss) on investmentsCapital gain distribution
from investmentsChange in unrealized appreciation
(depreciation) of investmentsNet gain (loss) on investmentsIncrease (decrease) in net assets
from operations(Increase (decrease) in net assets from operations per unit – see Supplementary Schedule)
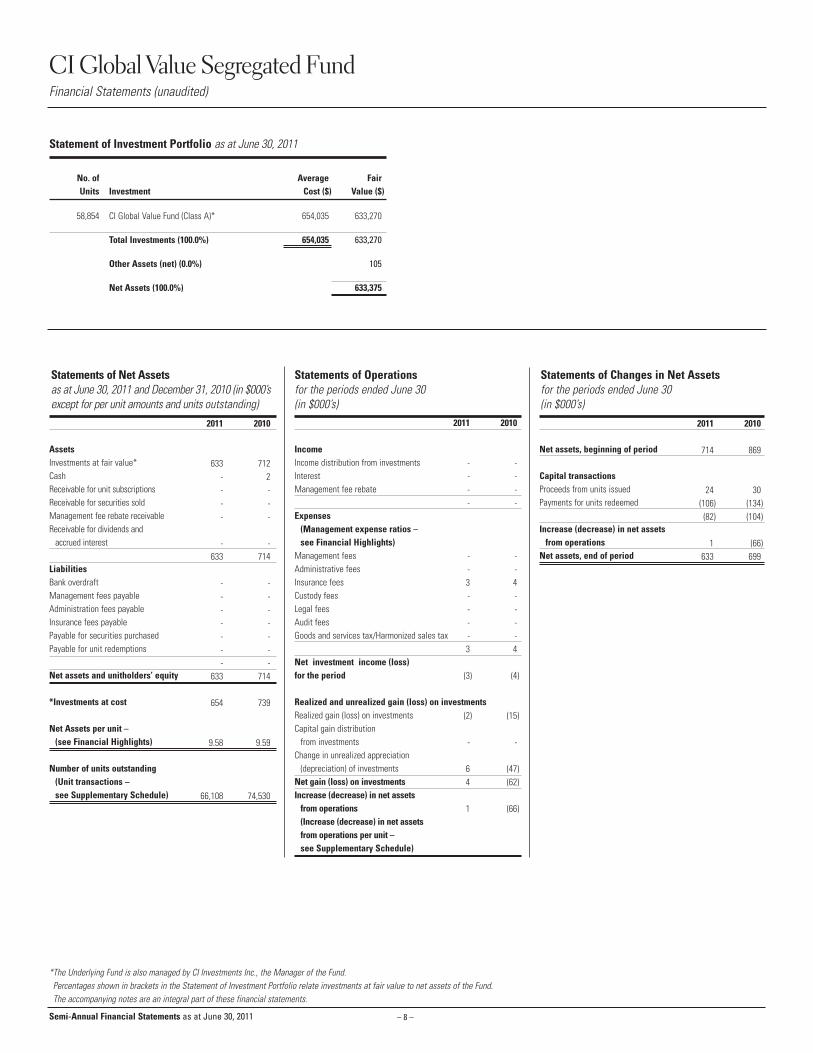
CI Global Value Segregated FundFinancial Statements (unaudited)
AssetsInvestments at fair value*CashReceivable for unit subscriptionsReceivable for securities soldManagement fee rebate receivableReceivable for dividends and
accrued interest
LiabilitiesBank overdraftManagement fees payableAdministration fees payableInsurance fees payablePayable for securities purchased Payable for unit redemptions
Net assets and unitholders’ equity
*Investments at cost
Net Assets per unit – (see Financial Highlights)
Number of units outstanding (Unit transactions – see Supplementary Schedule)
Statements of Operations for the periods ended June 30(in $000’s)
2011 2010
633 712- 2- -- -- -
- -633 714
- -- -- -- -- -- -- -
633 714
654 739
9.58 9.59
66,108 74,530
Statements of Net Assets as at June 30, 2011 and December 31, 2010 (in $000’sexcept for per unit amounts and units outstanding)
Statements of Changes in Net Assets for the periods ended June 30(in $000’s)
2011 2010
- -- -- -- -
- -- -3 4- -- -- -- -3 4
(3) (4)
(2) (15)
- -
6 (47)4 (62)
1 (66)
Statement of Investment Portfolio as at June 30, 2011
No. of Average FairUnits Investment Cost ($) Value ($)
58,854 CI Global Value Fund (Class A)* 654,035 633,270
Total Investments (100.0%) 654,035 633,270
Other Assets (net) (0.0%) 105
Net Assets (100.0%) 633,375
*The Underlying Fund is also managed by CI Investments Inc., the Manager of the Fund.Percentages shown in brackets in the Statement of Investment Portfolio relate investments at fair value to net assets of the Fund.The accompanying notes are an integral part of these financial statements.
Net assets, beginning of period
Capital transactionsProceeds from units issued Payments for units redeemed
Increase (decrease) in net assetsfrom operations
Net assets, end of period
2011 2010
714 869
24 30(106) (134)(82) (104)
1 (66)633 699
Semi-Annual Financial Statements as at June 30, 2011

Financial HighlightsThe following table shows selected key financial information about the Fund and is intended to help you understand the Fund's financial performance for the past six periods, as applicable.
2011 2010 2009 2008 2007 2006The Fund’s Net Asset Value per UnitNet asset value at the end of the
period shown ($)
Ratios and Supplemental DataNet assets ($000’s) (1)
Number of units outstanding (1)
Portfolio turnover rate (%) (2)
Management expense ratio Management expense ratio before taxes (%) (3)
Goods and services tax/Harmonized sales tax expenses (%) (3)
Management expense ratio after taxes (%) (3)
GST/Effective HST rate, for the prior calendar year or period (%) (3)
(1) This information is provided as at June 30 and December 31, of the period shown.
(2) The Fund's portfolio turnover rate indicates how actively the Fund's portfolio advisor manages its portfolio investments. A portfolio turnover rate of 100% is equivalent to the Fund buying and selling all of the securities in its portfolio once in
the course of the period. The higher a fund's portfolio turnover rate in a period, the greater the trading costs payable by the fund in the period, and the greater the chance of an investor receiving taxable capital gains in the period. There is not
necessarily a relationship between a high turnover rate and the performance of a fund.
(3) Management expense information is calculated based on expenses charged directly to the Fund plus, if applicable, expenses of the underlying mutual fund, calculated on a weighted average basis on the percentage weighting of the underlying
mutual fund and is expressed as an annualized percentage of average net assets for the years shown. As of July 1, 2010, Ontario combined the federal goods and services tax (“GST” - 5%) with the provincial retail sales tax (“PST” - 8%). The
combination resulted in a Harmonized sales tax (“HST”) rate of 13%. The Effective HST tax rate is calculated using the attribution percentage for each province based on unitholder residency and can be different from 13%. For any particular
year, the rate shown will be prorated based on the different rates in effect during that year. For the year ended December 31, 2010 the rate applied is 5% for the period January 1, 2010 to June 30, 2010 and the Fund's Effective HST rate for the
period from July 1, 2010 to December 31, 2010. The rate shown for the year ended December 31, 2010 is the time weighted average of these rates. Beginning January 1, 2011, the HST rate is based on the residency of the unitholder.
– 9 –
CI Global Value Segregated FundFinancial Statements – Supplementary Schedule – Financial Highlights (for the periods ended June 30 and December 31) (unaudited)
Semi-Annual Financial Statements as at June 30, 2011
The accompanying notes are an integral part of these financial statements.
Supplementary Schedule
2011 2010Unit TransactionsNumber of units, beginning of periodUnits issued for cash Units redeemedNumber of units, end of period
Increase (decrease) in net assets from operation per unit (%) (1)
(1) Increase (decrease) in net assets from operations per unit is calculated by dividing the increase (decrease) in net assets from operations by the weighted average number of units outstanding during the period.
74,530 94,6052,513 3,342
(10,935) (14,998)66,108 82,949
- (0.74)
9.58 9.59 9.19 8.51 10.58 12.68
633 714 869 1,011 1,735 2,74766,108 74,530 94,605 118,816 163,935 216,646
- 4.30 0.36 2.95 2.22 0.97
3.22 3.22 3.22 3.21 3.22 3.22
0.24 0.20 0.12 0.12 0.14 0.153.46 3.42 3.34 3.33 3.36 3.37
11.13 7.89 5.00 5.00 6.00 6.50
– 10 –
CI Global Value Segregated FundFund Specific Financial Instruments Risks (Note 2) (unaudited)
The accompanying notes are an integral part of these financial statements.
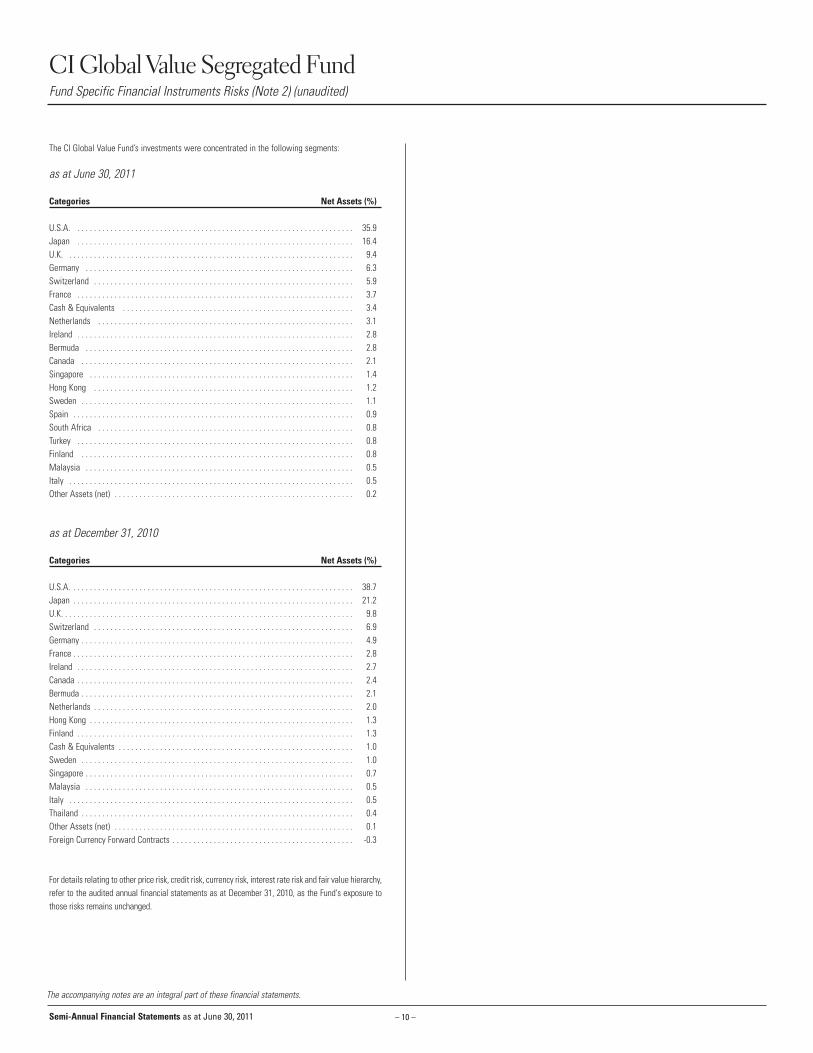
The CI Global Value Fund’s investments were concentrated in the following segments:
as at June 30, 2011
Categories Net Assets (%)
U.S.A. . . . . . . . . . . . . . . . . . . . . . . . . . . . . . . . . . . . . . . . . . . . . . . . . . . . . . . . . . . . . . . . . . . . 35.9Japan . . . . . . . . . . . . . . . . . . . . . . . . . . . . . . . . . . . . . . . . . . . . . . . . . . . . . . . . . . . . . . . . . . . 16.4U.K. . . . . . . . . . . . . . . . . . . . . . . . . . . . . . . . . . . . . . . . . . . . . . . . . . . . . . . . . . . . . . . . . . . . . . 9.4Germany . . . . . . . . . . . . . . . . . . . . . . . . . . . . . . . . . . . . . . . . . . . . . . . . . . . . . . . . . . . . . . . . . 6.3Switzerland . . . . . . . . . . . . . . . . . . . . . . . . . . . . . . . . . . . . . . . . . . . . . . . . . . . . . . . . . . . . . . . 5.9France . . . . . . . . . . . . . . . . . . . . . . . . . . . . . . . . . . . . . . . . . . . . . . . . . . . . . . . . . . . . . . . . . . . 3.7Cash & Equivalents . . . . . . . . . . . . . . . . . . . . . . . . . . . . . . . . . . . . . . . . . . . . . . . . . . . . . . . . 3.4Netherlands . . . . . . . . . . . . . . . . . . . . . . . . . . . . . . . . . . . . . . . . . . . . . . . . . . . . . . . . . . . . . . 3.1Ireland . . . . . . . . . . . . . . . . . . . . . . . . . . . . . . . . . . . . . . . . . . . . . . . . . . . . . . . . . . . . . . . . . . . 2.8Bermuda . . . . . . . . . . . . . . . . . . . . . . . . . . . . . . . . . . . . . . . . . . . . . . . . . . . . . . . . . . . . . . . . . 2.8Canada . . . . . . . . . . . . . . . . . . . . . . . . . . . . . . . . . . . . . . . . . . . . . . . . . . . . . . . . . . . . . . . . . . 2.1Singapore . . . . . . . . . . . . . . . . . . . . . . . . . . . . . . . . . . . . . . . . . . . . . . . . . . . . . . . . . . . . . . . . 1.4Hong Kong . . . . . . . . . . . . . . . . . . . . . . . . . . . . . . . . . . . . . . . . . . . . . . . . . . . . . . . . . . . . . . . 1.2Sweden . . . . . . . . . . . . . . . . . . . . . . . . . . . . . . . . . . . . . . . . . . . . . . . . . . . . . . . . . . . . . . . . . . 1.1Spain . . . . . . . . . . . . . . . . . . . . . . . . . . . . . . . . . . . . . . . . . . . . . . . . . . . . . . . . . . . . . . . . . . . . 0.9South Africa . . . . . . . . . . . . . . . . . . . . . . . . . . . . . . . . . . . . . . . . . . . . . . . . . . . . . . . . . . . . . . 0.8Turkey . . . . . . . . . . . . . . . . . . . . . . . . . . . . . . . . . . . . . . . . . . . . . . . . . . . . . . . . . . . . . . . . . . . 0.8Finland . . . . . . . . . . . . . . . . . . . . . . . . . . . . . . . . . . . . . . . . . . . . . . . . . . . . . . . . . . . . . . . . . . 0.8Malaysia . . . . . . . . . . . . . . . . . . . . . . . . . . . . . . . . . . . . . . . . . . . . . . . . . . . . . . . . . . . . . . . . . 0.5Italy . . . . . . . . . . . . . . . . . . . . . . . . . . . . . . . . . . . . . . . . . . . . . . . . . . . . . . . . . . . . . . . . . . . . . 0.5Other Assets (net) . . . . . . . . . . . . . . . . . . . . . . . . . . . . . . . . . . . . . . . . . . . . . . . . . . . . . . . . . . 0.2
as at December 31, 2010
Categories Net Assets (%)
U.S.A. . . . . . . . . . . . . . . . . . . . . . . . . . . . . . . . . . . . . . . . . . . . . . . . . . . . . . . . . . . . . . . . . . . . . 38.7Japan . . . . . . . . . . . . . . . . . . . . . . . . . . . . . . . . . . . . . . . . . . . . . . . . . . . . . . . . . . . . . . . . . . . . 21.2U.K. . . . . . . . . . . . . . . . . . . . . . . . . . . . . . . . . . . . . . . . . . . . . . . . . . . . . . . . . . . . . . . . . . . . . . . 9.8Switzerland . . . . . . . . . . . . . . . . . . . . . . . . . . . . . . . . . . . . . . . . . . . . . . . . . . . . . . . . . . . . . . . 6.9Germany . . . . . . . . . . . . . . . . . . . . . . . . . . . . . . . . . . . . . . . . . . . . . . . . . . . . . . . . . . . . . . . . . . 4.9France . . . . . . . . . . . . . . . . . . . . . . . . . . . . . . . . . . . . . . . . . . . . . . . . . . . . . . . . . . . . . . . . . . . . 2.8Ireland . . . . . . . . . . . . . . . . . . . . . . . . . . . . . . . . . . . . . . . . . . . . . . . . . . . . . . . . . . . . . . . . . . . 2.7Canada . . . . . . . . . . . . . . . . . . . . . . . . . . . . . . . . . . . . . . . . . . . . . . . . . . . . . . . . . . . . . . . . . . . 2.4Bermuda . . . . . . . . . . . . . . . . . . . . . . . . . . . . . . . . . . . . . . . . . . . . . . . . . . . . . . . . . . . . . . . . . . 2.1Netherlands . . . . . . . . . . . . . . . . . . . . . . . . . . . . . . . . . . . . . . . . . . . . . . . . . . . . . . . . . . . . . . . 2.0Hong Kong . . . . . . . . . . . . . . . . . . . . . . . . . . . . . . . . . . . . . . . . . . . . . . . . . . . . . . . . . . . . . . . . 1.3Finland . . . . . . . . . . . . . . . . . . . . . . . . . . . . . . . . . . . . . . . . . . . . . . . . . . . . . . . . . . . . . . . . . . . 1.3Cash & Equivalents . . . . . . . . . . . . . . . . . . . . . . . . . . . . . . . . . . . . . . . . . . . . . . . . . . . . . . . . . 1.0Sweden . . . . . . . . . . . . . . . . . . . . . . . . . . . . . . . . . . . . . . . . . . . . . . . . . . . . . . . . . . . . . . . . . . 1.0Singapore . . . . . . . . . . . . . . . . . . . . . . . . . . . . . . . . . . . . . . . . . . . . . . . . . . . . . . . . . . . . . . . . . 0.7Malaysia . . . . . . . . . . . . . . . . . . . . . . . . . . . . . . . . . . . . . . . . . . . . . . . . . . . . . . . . . . . . . . . . . 0.5Italy . . . . . . . . . . . . . . . . . . . . . . . . . . . . . . . . . . . . . . . . . . . . . . . . . . . . . . . . . . . . . . . . . . . . . 0.5Thailand . . . . . . . . . . . . . . . . . . . . . . . . . . . . . . . . . . . . . . . . . . . . . . . . . . . . . . . . . . . . . . . . . . 0.4Other Assets (net) . . . . . . . . . . . . . . . . . . . . . . . . . . . . . . . . . . . . . . . . . . . . . . . . . . . . . . . . . . 0.1Foreign Currency Forward Contracts . . . . . . . . . . . . . . . . . . . . . . . . . . . . . . . . . . . . . . . . . . . . -0.3
For details relating to other price risk, credit risk, currency risk, interest rate risk and fair value hierarchy,refer to the audited annual financial statements as at December 31, 2010, as the Fund's exposure tothose risks remains unchanged.
Semi-Annual Financial Statements as at June 30, 2011
– 11 –
CI Harbour Segregated FundUnderlying Fund Information (unaudited)
CIG - 021
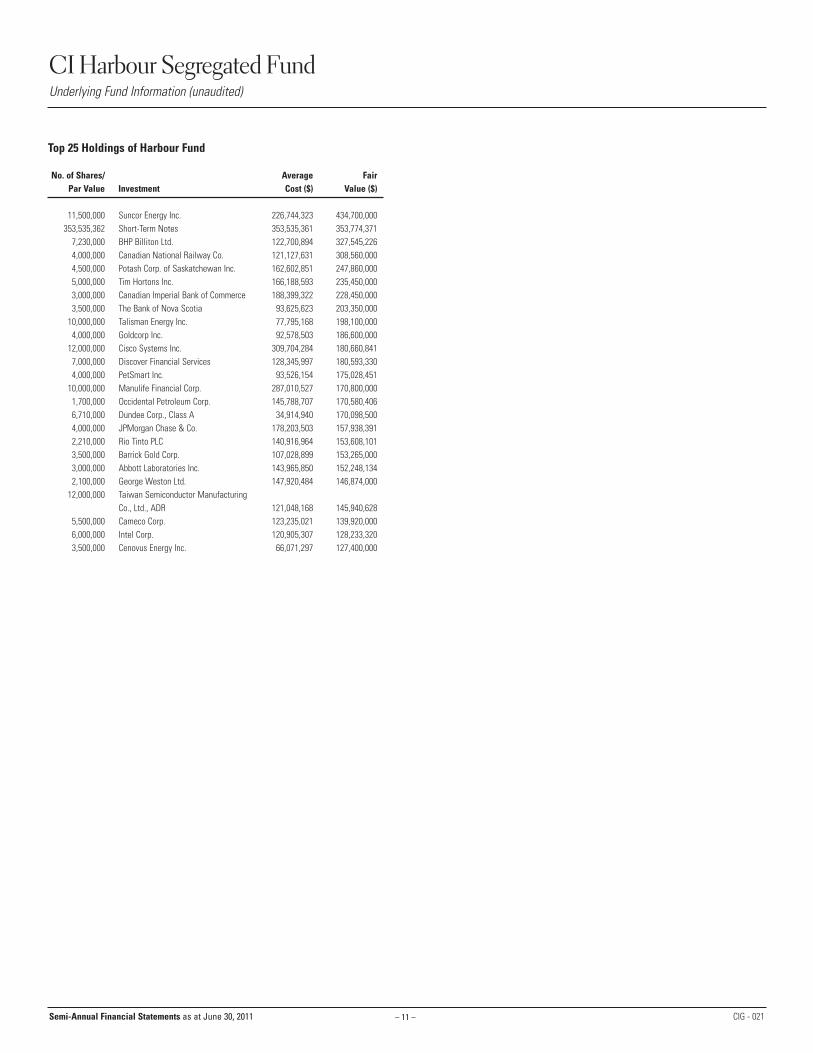
Top 25 Holdings of Harbour Fund
No. of Shares/ Average FairPar Value Investment Cost ($) Value ($)
11,500,000 Suncor Energy Inc. 226,744,323 434,700,000 353,535,362 Short-Term Notes 353,535,361 353,774,371
7,230,000 BHP Billiton Ltd. 122,700,894 327,545,226 4,000,000 Canadian National Railway Co. 121,127,631 308,560,000 4,500,000 Potash Corp. of Saskatchewan Inc. 162,602,851 247,860,000 5,000,000 Tim Hortons Inc. 166,188,593 235,450,000 3,000,000 Canadian Imperial Bank of Commerce 188,399,322 228,450,000 3,500,000 The Bank of Nova Scotia 93,625,623 203,350,000
10,000,000 Talisman Energy Inc. 77,795,168 198,100,000 4,000,000 Goldcorp Inc. 92,578,503 186,600,000
12,000,000 Cisco Systems Inc. 309,704,284 180,660,841 7,000,000 Discover Financial Services 128,345,997 180,593,330 4,000,000 PetSmart Inc. 93,526,154 175,028,451
10,000,000 Manulife Financial Corp. 287,010,527 170,800,000 1,700,000 Occidental Petroleum Corp. 145,788,707 170,580,406 6,710,000 Dundee Corp., Class A 34,914,940 170,098,500 4,000,000 JPMorgan Chase & Co. 178,203,503 157,938,391 2,210,000 Rio Tinto PLC 140,916,964 153,608,101 3,500,000 Barrick Gold Corp. 107,028,899 153,265,000 3,000,000 Abbott Laboratories Inc. 143,965,850 152,248,134 2,100,000 George Weston Ltd. 147,920,484 146,874,000
12,000,000 Taiwan Semiconductor Manufacturing Co., Ltd., ADR 121,048,168 145,940,628
5,500,000 Cameco Corp. 123,235,021 139,920,000 6,000,000 Intel Corp. 120,905,307 128,233,320 3,500,000 Cenovus Energy Inc. 66,071,297 127,400,000
Semi-Annual Financial Statements as at June 30, 2011
– 12 –
IncomeIncome distribution from investmentsInterestManagement fee rebate
Expenses (Management expense ratios – see Financial Highlights)
Management feesAdministrative feesInsurance feesCustody feesLegal feesAudit feesGoods and services tax/Harmonized sales tax
Net investment income (loss) for the period
Realized and unrealized gain (loss) on investments Realized gain (loss) on investmentsCapital gain distribution
from investmentsChange in unrealized appreciation
(depreciation) of investmentsNet gain (loss) on investmentsIncrease (decrease) in net assets
from operations(Increase (decrease) in net assets from operations per unit – see Supplementary Schedule)
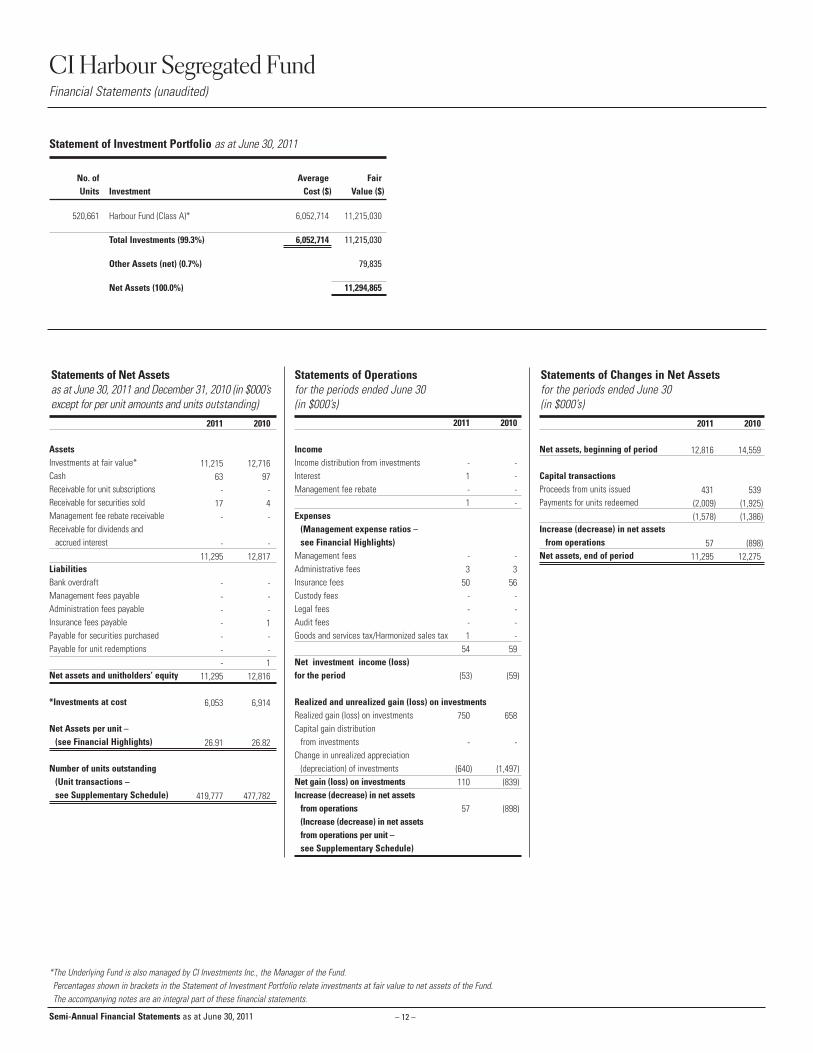
CI Harbour Segregated FundFinancial Statements (unaudited)
AssetsInvestments at fair value*CashReceivable for unit subscriptionsReceivable for securities soldManagement fee rebate receivableReceivable for dividends and
accrued interest
LiabilitiesBank overdraftManagement fees payableAdministration fees payableInsurance fees payablePayable for securities purchased Payable for unit redemptions
Net assets and unitholders’ equity
*Investments at cost
Net Assets per unit – (see Financial Highlights)
Number of units outstanding (Unit transactions – see Supplementary Schedule)
Statements of Operations for the periods ended June 30(in $000’s)
2011 2010
11,215 12,71663 97
- -17 4
- -
- -11,295 12,817
- -- -- -- 1- -- -- 1
11,295 12,816
6,053 6,914
26.91 26.82
419,777 477,782
Statements of Net Assets as at June 30, 2011 and December 31, 2010 (in $000’sexcept for per unit amounts and units outstanding)
Statements of Changes in Net Assets for the periods ended June 30(in $000’s)
2011 2010
- -1 -- -1 -
- -3 3
50 56- -- -- -1 -
54 59
(53) (59)
750 658
- -
(640) (1,497)110 (839)
57 (898)
Statement of Investment Portfolio as at June 30, 2011
No. of Average FairUnits Investment Cost ($) Value ($)
520,661 Harbour Fund (Class A)* 6,052,714 11,215,030
Total Investments (99.3%) 6,052,714 11,215,030
Other Assets (net) (0.7%) 79,835
Net Assets (100.0%) 11,294,865
*The Underlying Fund is also managed by CI Investments Inc., the Manager of the Fund.Percentages shown in brackets in the Statement of Investment Portfolio relate investments at fair value to net assets of the Fund.The accompanying notes are an integral part of these financial statements.
Net assets, beginning of period
Capital transactionsProceeds from units issued Payments for units redeemed
Increase (decrease) in net assetsfrom operations
Net assets, end of period
2011 2010
12,816 14,559
431 539(2,009) (1,925)(1,578) (1,386)
57 (898)11,295 12,275
Semi-Annual Financial Statements as at June 30, 2011
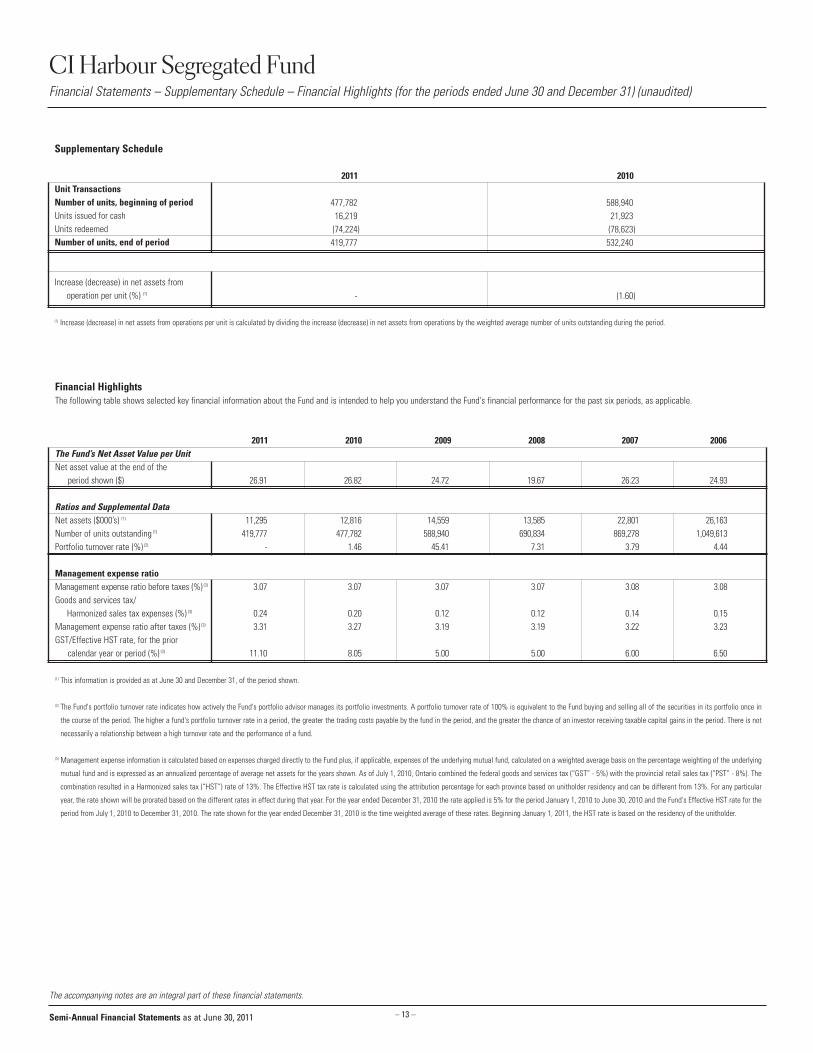
Financial HighlightsThe following table shows selected key financial information about the Fund and is intended to help you understand the Fund's financial performance for the past six periods, as applicable.
2011 2010 2009 2008 2007 2006The Fund’s Net Asset Value per UnitNet asset value at the end of the
period shown ($)
Ratios and Supplemental DataNet assets ($000’s) (1)
Number of units outstanding (1)
Portfolio turnover rate (%) (2)
Management expense ratio Management expense ratio before taxes (%) (3)
Goods and services tax/Harmonized sales tax expenses (%) (3)
Management expense ratio after taxes (%) (3)
GST/Effective HST rate, for the prior calendar year or period (%) (3)
(1) This information is provided as at June 30 and December 31, of the period shown.
(2) The Fund's portfolio turnover rate indicates how actively the Fund's portfolio advisor manages its portfolio investments. A portfolio turnover rate of 100% is equivalent to the Fund buying and selling all of the securities in its portfolio once in
the course of the period. The higher a fund's portfolio turnover rate in a period, the greater the trading costs payable by the fund in the period, and the greater the chance of an investor receiving taxable capital gains in the period. There is not
necessarily a relationship between a high turnover rate and the performance of a fund.
(3) Management expense information is calculated based on expenses charged directly to the Fund plus, if applicable, expenses of the underlying mutual fund, calculated on a weighted average basis on the percentage weighting of the underlying
mutual fund and is expressed as an annualized percentage of average net assets for the years shown. As of July 1, 2010, Ontario combined the federal goods and services tax (“GST” - 5%) with the provincial retail sales tax (“PST” - 8%). The
combination resulted in a Harmonized sales tax (“HST”) rate of 13%. The Effective HST tax rate is calculated using the attribution percentage for each province based on unitholder residency and can be different from 13%. For any particular
year, the rate shown will be prorated based on the different rates in effect during that year. For the year ended December 31, 2010 the rate applied is 5% for the period January 1, 2010 to June 30, 2010 and the Fund's Effective HST rate for the
period from July 1, 2010 to December 31, 2010. The rate shown for the year ended December 31, 2010 is the time weighted average of these rates. Beginning January 1, 2011, the HST rate is based on the residency of the unitholder.
– 13 –
CI Harbour Segregated FundFinancial Statements – Supplementary Schedule – Financial Highlights (for the periods ended June 30 and December 31) (unaudited)
Semi-Annual Financial Statements as at June 30, 2011
The accompanying notes are an integral part of these financial statements.
Supplementary Schedule
2011 2010Unit TransactionsNumber of units, beginning of periodUnits issued for cash Units redeemedNumber of units, end of period
Increase (decrease) in net assets from operation per unit (%) (1)
(1) Increase (decrease) in net assets from operations per unit is calculated by dividing the increase (decrease) in net assets from operations by the weighted average number of units outstanding during the period.
477,782 588,94016,219 21,923(74,224) (78,623)419,777 532,240
- (1.60)
26.91 26.82 24.72 19.67 26.23 24.93
11,295 12,816 14,559 13,585 22,801 26,163419,777 477,782 588,940 690,834 869,278 1,049,613
- 1.46 45.41 7.31 3.79 4.44
3.07 3.07 3.07 3.07 3.08 3.08
0.24 0.20 0.12 0.12 0.14 0.153.31 3.27 3.19 3.19 3.22 3.23
11.10 8.05 5.00 5.00 6.00 6.50
– 14 –
CI Harbour Segregated FundFund Specific Financial Instruments Risks (Note 2) (unaudited)
The accompanying notes are an integral part of these financial statements.
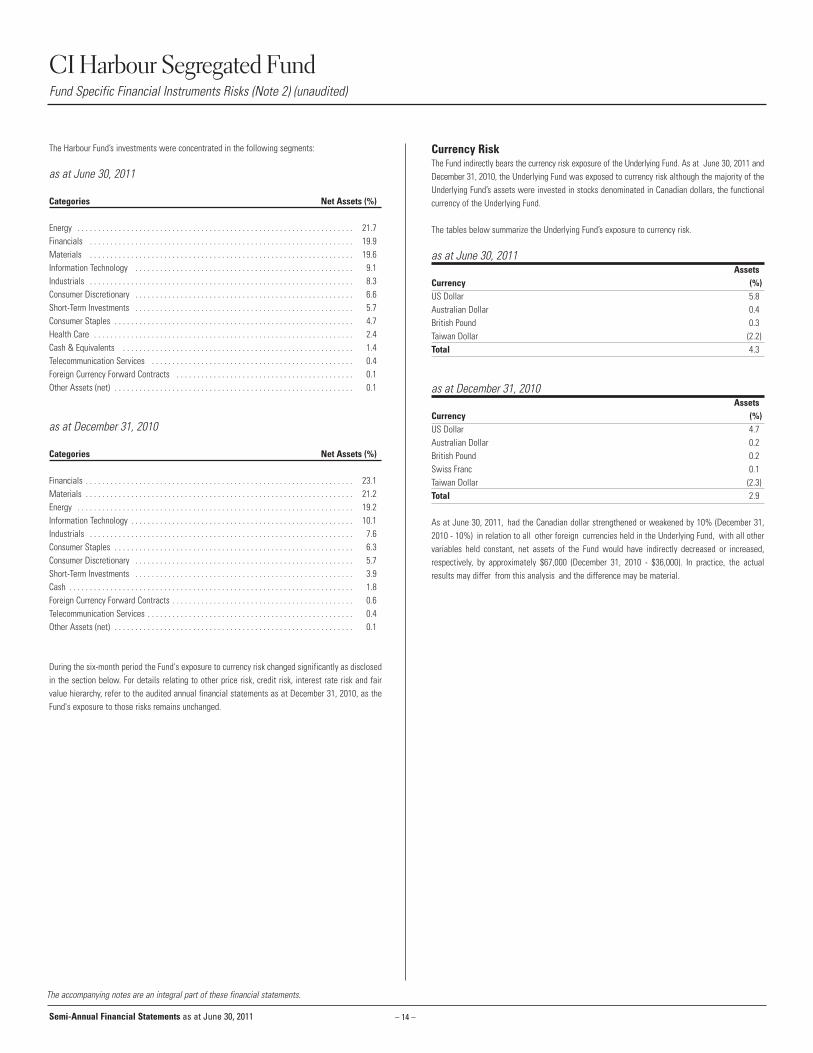
Currency Risk The Fund indirectly bears the currency risk exposure of the Underlying Fund. As at June 30, 2011 andDecember 31, 2010, the Underlying Fund was exposed to currency risk although the majority of theUnderlying Fund’s assets were invested in stocks denominated in Canadian dollars, the functionalcurrency of the Underlying Fund.
The tables below summarize the Underlying Fund’s exposure to currency risk.
as at June 30, 2011Assets
Currency (%)US Dollar 5.8 Australian Dollar 0.4 British Pound 0.3 Taiwan Dollar (2.2)Total 4.3
as at December 31, 2010Assets
Currency (%)US Dollar 4.7 Australian Dollar 0.2 British Pound 0.2 Swiss Franc 0.1 Taiwan Dollar (2.3)Total 2.9
As at June 30, 2011, had the Canadian dollar strengthened or weakened by 10% (December 31,2010 - 10%) in relation to all other foreign currencies held in the Underlying Fund, with all othervariables held constant, net assets of the Fund would have indirectly decreased or increased,respectively, by approximately $67,000 (December 31, 2010 - $36,000). In practice, the actualresults may differ from this analysis and the difference may be material.
The Harbour Fund’s investments were concentrated in the following segments:
as at June 30, 2011
Categories Net Assets (%)
Energy . . . . . . . . . . . . . . . . . . . . . . . . . . . . . . . . . . . . . . . . . . . . . . . . . . . . . . . . . . . . . . . . . . . 21.7Financials . . . . . . . . . . . . . . . . . . . . . . . . . . . . . . . . . . . . . . . . . . . . . . . . . . . . . . . . . . . . . . . . 19.9Materials . . . . . . . . . . . . . . . . . . . . . . . . . . . . . . . . . . . . . . . . . . . . . . . . . . . . . . . . . . . . . . . . 19.6Information Technology . . . . . . . . . . . . . . . . . . . . . . . . . . . . . . . . . . . . . . . . . . . . . . . . . . . . . 9.1Industrials . . . . . . . . . . . . . . . . . . . . . . . . . . . . . . . . . . . . . . . . . . . . . . . . . . . . . . . . . . . . . . . . 8.3Consumer Discretionary . . . . . . . . . . . . . . . . . . . . . . . . . . . . . . . . . . . . . . . . . . . . . . . . . . . . . 6.6Short-Term Investments . . . . . . . . . . . . . . . . . . . . . . . . . . . . . . . . . . . . . . . . . . . . . . . . . . . . . 5.7Consumer Staples . . . . . . . . . . . . . . . . . . . . . . . . . . . . . . . . . . . . . . . . . . . . . . . . . . . . . . . . . . 4.7Health Care . . . . . . . . . . . . . . . . . . . . . . . . . . . . . . . . . . . . . . . . . . . . . . . . . . . . . . . . . . . . . . . 2.4Cash & Equivalents . . . . . . . . . . . . . . . . . . . . . . . . . . . . . . . . . . . . . . . . . . . . . . . . . . . . . . . . 1.4Telecommunication Services . . . . . . . . . . . . . . . . . . . . . . . . . . . . . . . . . . . . . . . . . . . . . . . . . 0.4Foreign Currency Forward Contracts . . . . . . . . . . . . . . . . . . . . . . . . . . . . . . . . . . . . . . . . . . . 0.1Other Assets (net) . . . . . . . . . . . . . . . . . . . . . . . . . . . . . . . . . . . . . . . . . . . . . . . . . . . . . . . . . . 0.1
as at December 31, 2010
Categories Net Assets (%)
Financials . . . . . . . . . . . . . . . . . . . . . . . . . . . . . . . . . . . . . . . . . . . . . . . . . . . . . . . . . . . . . . . . . 23.1Materials . . . . . . . . . . . . . . . . . . . . . . . . . . . . . . . . . . . . . . . . . . . . . . . . . . . . . . . . . . . . . . . . . 21.2Energy . . . . . . . . . . . . . . . . . . . . . . . . . . . . . . . . . . . . . . . . . . . . . . . . . . . . . . . . . . . . . . . . . . . 19.2Information Technology . . . . . . . . . . . . . . . . . . . . . . . . . . . . . . . . . . . . . . . . . . . . . . . . . . . . . . 10.1Industrials . . . . . . . . . . . . . . . . . . . . . . . . . . . . . . . . . . . . . . . . . . . . . . . . . . . . . . . . . . . . . . . . 7.6Consumer Staples . . . . . . . . . . . . . . . . . . . . . . . . . . . . . . . . . . . . . . . . . . . . . . . . . . . . . . . . . . 6.3Consumer Discretionary . . . . . . . . . . . . . . . . . . . . . . . . . . . . . . . . . . . . . . . . . . . . . . . . . . . . . 5.7Short-Term Investments . . . . . . . . . . . . . . . . . . . . . . . . . . . . . . . . . . . . . . . . . . . . . . . . . . . . . 3.9Cash . . . . . . . . . . . . . . . . . . . . . . . . . . . . . . . . . . . . . . . . . . . . . . . . . . . . . . . . . . . . . . . . . . . . . 1.8Foreign Currency Forward Contracts . . . . . . . . . . . . . . . . . . . . . . . . . . . . . . . . . . . . . . . . . . . . 0.6Telecommunication Services . . . . . . . . . . . . . . . . . . . . . . . . . . . . . . . . . . . . . . . . . . . . . . . . . . 0.4Other Assets (net) . . . . . . . . . . . . . . . . . . . . . . . . . . . . . . . . . . . . . . . . . . . . . . . . . . . . . . . . . . 0.1
During the six-month period the Fund's exposure to currency risk changed significantly as disclosedin the section below. For details relating to other price risk, credit risk, interest rate risk and fairvalue hierarchy, refer to the audited annual financial statements as at December 31, 2010, as theFund's exposure to those risks remains unchanged.
Semi-Annual Financial Statements as at June 30, 2011
– 15 –
CI Harbour Growth & Income Segregated FundUnderlying Fund Information (unaudited)
CIG - 022
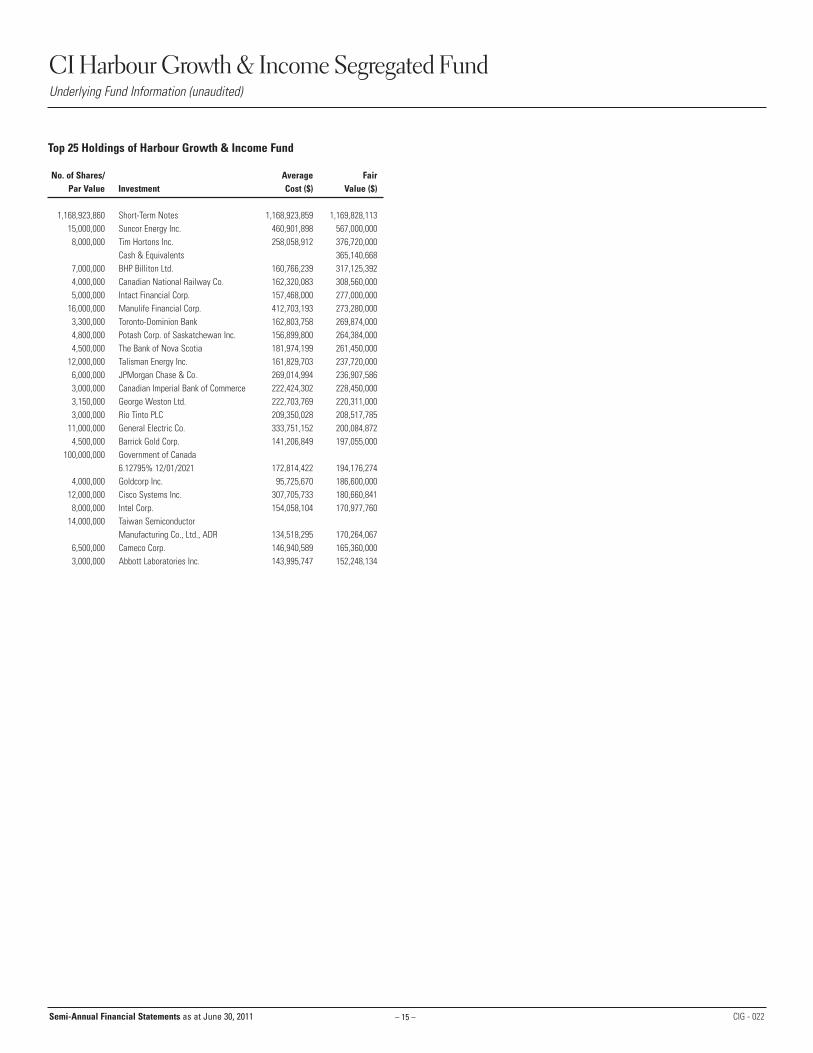
Top 25 Holdings of Harbour Growth & Income Fund
No. of Shares/ Average FairPar Value Investment Cost ($) Value ($)
1,168,923,860 Short-Term Notes 1,168,923,859 1,169,828,113 15,000,000 Suncor Energy Inc. 460,901,898 567,000,000
8,000,000 Tim Hortons Inc. 258,058,912 376,720,000 Cash & Equivalents 365,140,668
7,000,000 BHP Billiton Ltd. 160,766,239 317,125,392 4,000,000 Canadian National Railway Co. 162,320,083 308,560,000 5,000,000 Intact Financial Corp. 157,468,000 277,000,000
16,000,000 Manulife Financial Corp. 412,703,193 273,280,000 3,300,000 Toronto-Dominion Bank 162,803,758 269,874,000 4,800,000 Potash Corp. of Saskatchewan Inc. 156,899,800 264,384,000 4,500,000 The Bank of Nova Scotia 181,974,199 261,450,000
12,000,000 Talisman Energy Inc. 161,829,703 237,720,000 6,000,000 JPMorgan Chase & Co. 269,014,994 236,907,586 3,000,000 Canadian Imperial Bank of Commerce 222,424,302 228,450,000 3,150,000 George Weston Ltd. 222,703,769 220,311,000 3,000,000 Rio Tinto PLC 209,350,028 208,517,785
11,000,000 General Electric Co. 333,751,152 200,084,872 4,500,000 Barrick Gold Corp. 141,206,849 197,055,000
100,000,000 Government of Canada 6.12795% 12/01/2021 172,814,422 194,176,274
4,000,000 Goldcorp Inc. 95,725,670 186,600,000 12,000,000 Cisco Systems Inc. 307,705,733 180,660,841 8,000,000 Intel Corp. 154,058,104 170,977,760
14,000,000 Taiwan Semiconductor Manufacturing Co., Ltd., ADR 134,518,295 170,264,067
6,500,000 Cameco Corp. 146,940,589 165,360,000 3,000,000 Abbott Laboratories Inc. 143,995,747 152,248,134
Semi-Annual Financial Statements as at June 30, 2011
– 16 –
IncomeIncome distribution from investmentsInterestManagement fee rebate
Expenses (Management expense ratios – see Financial Highlights)
Management feesAdministrative feesInsurance feesCustody feesLegal feesAudit feesGoods and services tax/Harmonized sales tax
Net investment income (loss) for the period
Realized and unrealized gain (loss) on investments Realized gain (loss) on investmentsCapital gain distribution
from investmentsChange in unrealized appreciation
(depreciation) of investmentsNet gain (loss) on investmentsIncrease (decrease) in net assets
from operations(Increase (decrease) in net assets from operations per unit – see Supplementary Schedule)
CI Harbour Growth & Income Segregated FundFinancial Statements (unaudited)
AssetsInvestments at fair value*CashReceivable for unit subscriptionsReceivable for securities soldManagement fee rebate receivableReceivable for dividends and
accrued interest
LiabilitiesBank overdraftManagement fees payableAdministration fees payableInsurance fees payablePayable for securities purchased Payable for unit redemptions
Net assets and unitholders’ equity
*Investments at cost
Net Assets per unit – (see Financial Highlights)
Number of units outstanding (Unit transactions – see Supplementary Schedule)
Statements of Operations for the periods ended June 30(in $000’s)
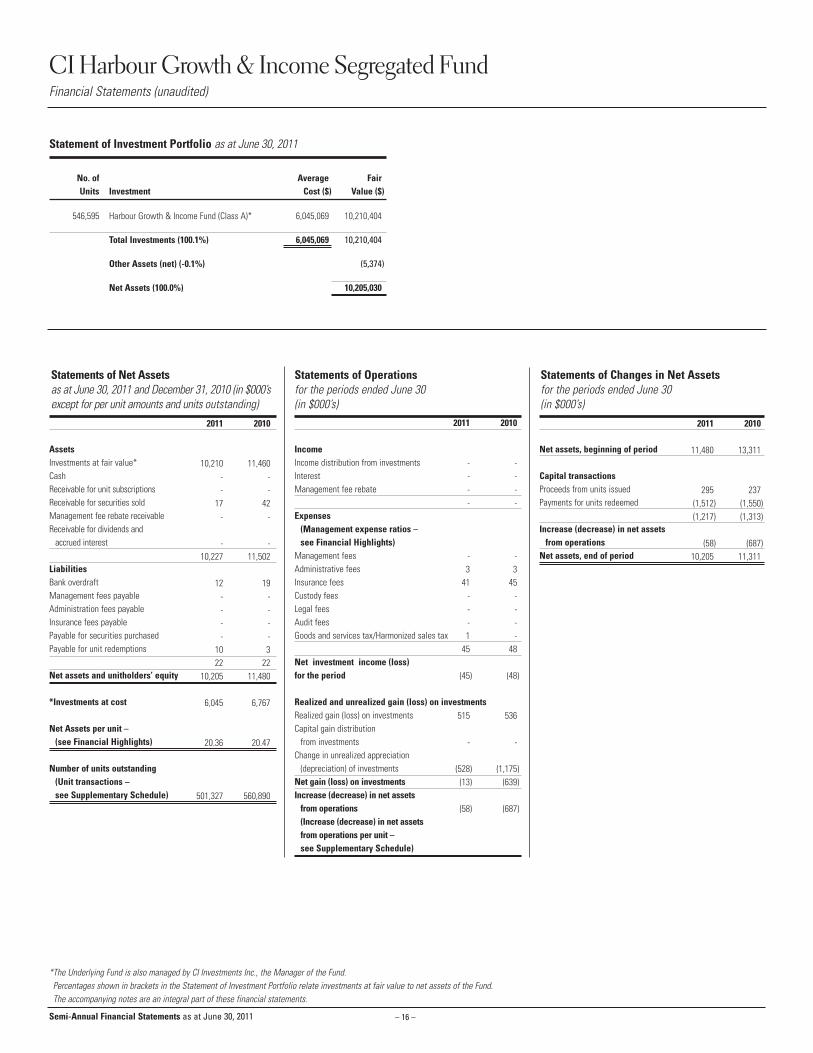
2011 2010
10,210 11,460- -- -
17 42- -
- -10,227 11,502
12 19- -- -- -- -
10 322 22
10,205 11,480
6,045 6,767
20.36 20.47
501,327 560,890
Statements of Net Assets as at June 30, 2011 and December 31, 2010 (in $000’sexcept for per unit amounts and units outstanding)
Statements of Changes in Net Assets for the periods ended June 30(in $000’s)
2011 2010
- -- -- -- -
- -3 3
41 45- -- -- -1 -
45 48
(45) (48)
515 536
- -
(528) (1,175)(13) (639)
(58) (687)
Statement of Investment Portfolio as at June 30, 2011
No. of Average FairUnits Investment Cost ($) Value ($)
546,595 Harbour Growth & Income Fund (Class A)* 6,045,069 10,210,404
Total Investments (100.1%) 6,045,069 10,210,404
Other Assets (net) (-0.1%) (5,374)
Net Assets (100.0%) 10,205,030
*The Underlying Fund is also managed by CI Investments Inc., the Manager of the Fund.Percentages shown in brackets in the Statement of Investment Portfolio relate investments at fair value to net assets of the Fund.The accompanying notes are an integral part of these financial statements.
Net assets, beginning of period
Capital transactionsProceeds from units issued Payments for units redeemed
Increase (decrease) in net assetsfrom operations
Net assets, end of period
2011 2010
11,480 13,311
295 237(1,512) (1,550)(1,217) (1,313)
(58) (687)10,205 11,311
Semi-Annual Financial Statements as at June 30, 2011
Financial HighlightsThe following table shows selected key financial information about the Fund and is intended to help you understand the Fund's financial performance for the past six periods, as applicable.
2011 2010 2009 2008 2007 2006The Fund’s Net Asset Value per UnitNet asset value at the end of the
period shown ($)
Ratios and Supplemental DataNet assets ($000’s) (1)
Number of units outstanding (1)
Portfolio turnover rate (%) (2)
Management expense ratio Management expense ratio before taxes (%) (3)
Goods and services tax/Harmonized sales tax expenses (%) (3)
Management expense ratio after taxes (%) (3)
GST/Effective HST rate, for the prior calendar year or period (%) (3)
(1) This information is provided as at June 30 and December 31, of the period shown.
(2) The Fund's portfolio turnover rate indicates how actively the Fund's portfolio advisor manages its portfolio investments. A portfolio turnover rate of 100% is equivalent to the Fund buying and selling all of the securities in its portfolio once in
the course of the period. The higher a fund's portfolio turnover rate in a period, the greater the trading costs payable by the fund in the period, and the greater the chance of an investor receiving taxable capital gains in the period. There is not
necessarily a relationship between a high turnover rate and the performance of a fund.
(3) Management expense information is calculated based on expenses charged directly to the Fund plus, if applicable, expenses of the underlying mutual fund, calculated on a weighted average basis on the percentage weighting of the underlying
mutual fund and is expressed as an annualized percentage of average net assets for the years shown. As of July 1, 2010, Ontario combined the federal goods and services tax (“GST” - 5%) with the provincial retail sales tax (“PST” - 8%). The
combination resulted in a Harmonized sales tax (“HST”) rate of 13%. The Effective HST tax rate is calculated using the attribution percentage for each province based on unitholder residency and can be different from 13%. For any particular
year, the rate shown will be prorated based on the different rates in effect during that year. For the year ended December 31, 2010 the rate applied is 5% for the period January 1, 2010 to June 30, 2010 and the Fund's Effective HST rate for the
period from July 1, 2010 to December 31, 2010. The rate shown for the year ended December 31, 2010 is the time weighted average of these rates. Beginning January 1, 2011, the HST rate is based on the residency of the unitholder.
– 17 –
CI Harbour Growth & Income Segregated FundFinancial Statements – Supplementary Schedule – Financial Highlights (for the periods ended June 30 and December 31) (unaudited)
Semi-Annual Financial Statements as at June 30, 2011
The accompanying notes are an integral part of these financial statements.
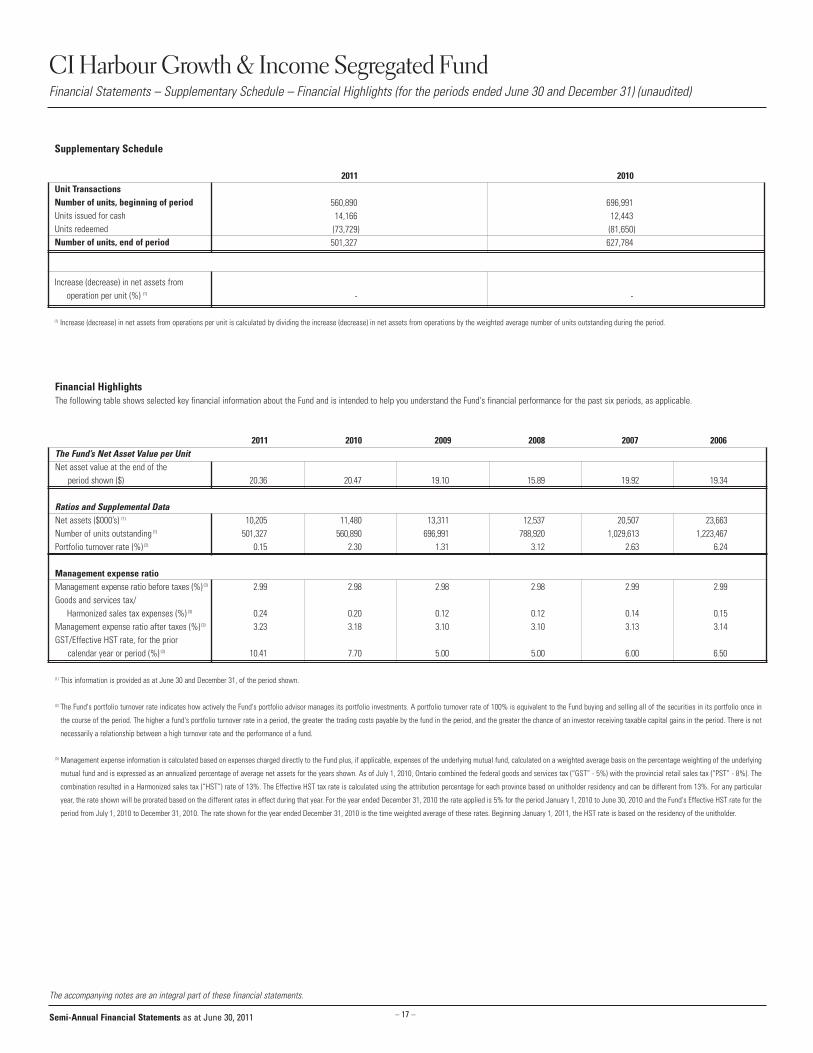
Supplementary Schedule
2011 2010Unit TransactionsNumber of units, beginning of periodUnits issued for cash Units redeemedNumber of units, end of period
Increase (decrease) in net assets from operation per unit (%) (1)
(1) Increase (decrease) in net assets from operations per unit is calculated by dividing the increase (decrease) in net assets from operations by the weighted average number of units outstanding during the period.
560,890 696,99114,166 12,443(73,729) (81,650)501,327 627,784
- -
20.36 20.47 19.10 15.89 19.92 19.34
10,205 11,480 13,311 12,537 20,507 23,663501,327 560,890 696,991 788,920 1,029,613 1,223,467
0.15 2.30 1.31 3.12 2.63 6.24
2.99 2.98 2.98 2.98 2.99 2.99
0.24 0.20 0.12 0.12 0.14 0.153.23 3.18 3.10 3.10 3.13 3.14
10.41 7.70 5.00 5.00 6.00 6.50
– 18 –
CI Harbour Growth & Income Segregated FundFund Specific Financial Instruments Risks (Note 2) (unaudited)
The accompanying notes are an integral part of these financial statements.
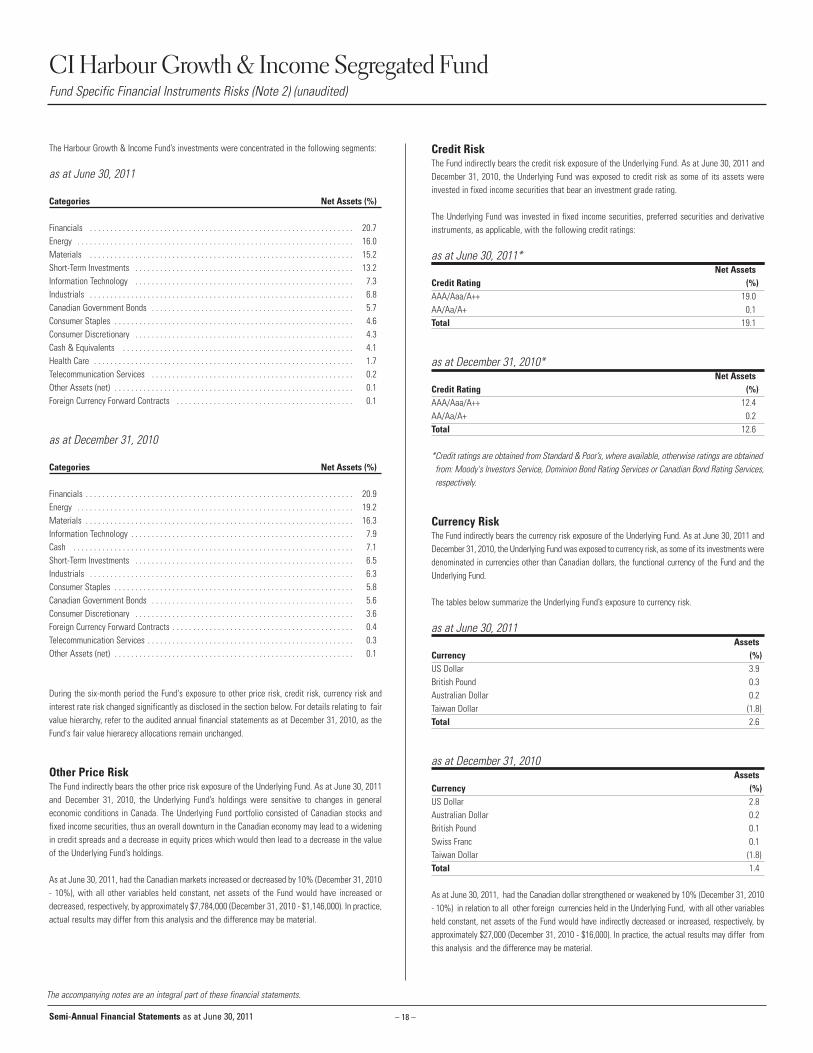
Credit Risk The Fund indirectly bears the credit risk exposure of the Underlying Fund. As at June 30, 2011 andDecember 31, 2010, the Underlying Fund was exposed to credit risk as some of its assets wereinvested in fixed income securities that bear an investment grade rating.
The Underlying Fund was invested in fixed income securities, preferred securities and derivativeinstruments, as applicable, with the following credit ratings:
as at June 30, 2011*Net Assets
Credit Rating (%)AAA/Aaa/A++ 19.0 AA/Aa/A+ 0.1 Total 19.1
as at December 31, 2010*Net Assets
Credit Rating (%)AAA/Aaa/A++ 12.4 AA/Aa/A+ 0.2 Total 12.6
*Credit ratings are obtained from Standard & Poor’s, where available, otherwise ratings are obtainedfrom: Moody's Investors Service, Dominion Bond Rating Services or Canadian Bond Rating Services,respectively.
Currency Risk The Fund indirectly bears the currency risk exposure of the Underlying Fund. As at June 30, 2011 andDecember 31, 2010, the Underlying Fund was exposed to currency risk, as some of its investments weredenominated in currencies other than Canadian dollars, the functional currency of the Fund and theUnderlying Fund.
The tables below summarize the Underlying Fund’s exposure to currency risk.
as at June 30, 2011Assets
Currency (%)US Dollar 3.9 British Pound 0.3 Australian Dollar 0.2 Taiwan Dollar (1.8)Total 2.6
as at December 31, 2010Assets
Currency (%)US Dollar 2.8 Australian Dollar 0.2 British Pound 0.1 Swiss Franc 0.1 Taiwan Dollar (1.8)Total 1.4
As at June 30, 2011, had the Canadian dollar strengthened or weakened by 10% (December 31, 2010- 10%) in relation to all other foreign currencies held in the Underlying Fund, with all other variablesheld constant, net assets of the Fund would have indirectly decreased or increased, respectively, byapproximately $27,000 (December 31, 2010 - $16,000). In practice, the actual results may differ fromthis analysis and the difference may be material.
The Harbour Growth & Income Fund’s investments were concentrated in the following segments:
as at June 30, 2011
Categories Net Assets (%)
Financials . . . . . . . . . . . . . . . . . . . . . . . . . . . . . . . . . . . . . . . . . . . . . . . . . . . . . . . . . . . . . . . . 20.7Energy . . . . . . . . . . . . . . . . . . . . . . . . . . . . . . . . . . . . . . . . . . . . . . . . . . . . . . . . . . . . . . . . . . . 16.0Materials . . . . . . . . . . . . . . . . . . . . . . . . . . . . . . . . . . . . . . . . . . . . . . . . . . . . . . . . . . . . . . . . 15.2Short-Term Investments . . . . . . . . . . . . . . . . . . . . . . . . . . . . . . . . . . . . . . . . . . . . . . . . . . . . . 13.2Information Technology . . . . . . . . . . . . . . . . . . . . . . . . . . . . . . . . . . . . . . . . . . . . . . . . . . . . . 7.3Industrials . . . . . . . . . . . . . . . . . . . . . . . . . . . . . . . . . . . . . . . . . . . . . . . . . . . . . . . . . . . . . . . . 6.8Canadian Government Bonds . . . . . . . . . . . . . . . . . . . . . . . . . . . . . . . . . . . . . . . . . . . . . . . . . 5.7Consumer Staples . . . . . . . . . . . . . . . . . . . . . . . . . . . . . . . . . . . . . . . . . . . . . . . . . . . . . . . . . . 4.6Consumer Discretionary . . . . . . . . . . . . . . . . . . . . . . . . . . . . . . . . . . . . . . . . . . . . . . . . . . . . . 4.3Cash & Equivalents . . . . . . . . . . . . . . . . . . . . . . . . . . . . . . . . . . . . . . . . . . . . . . . . . . . . . . . . 4.1Health Care . . . . . . . . . . . . . . . . . . . . . . . . . . . . . . . . . . . . . . . . . . . . . . . . . . . . . . . . . . . . . . . 1.7Telecommunication Services . . . . . . . . . . . . . . . . . . . . . . . . . . . . . . . . . . . . . . . . . . . . . . . . . 0.2Other Assets (net) . . . . . . . . . . . . . . . . . . . . . . . . . . . . . . . . . . . . . . . . . . . . . . . . . . . . . . . . . . 0.1Foreign Currency Forward Contracts . . . . . . . . . . . . . . . . . . . . . . . . . . . . . . . . . . . . . . . . . . . 0.1
as at December 31, 2010
Categories Net Assets (%)
Financials . . . . . . . . . . . . . . . . . . . . . . . . . . . . . . . . . . . . . . . . . . . . . . . . . . . . . . . . . . . . . . . . . 20.9Energy . . . . . . . . . . . . . . . . . . . . . . . . . . . . . . . . . . . . . . . . . . . . . . . . . . . . . . . . . . . . . . . . . . . 19.2Materials . . . . . . . . . . . . . . . . . . . . . . . . . . . . . . . . . . . . . . . . . . . . . . . . . . . . . . . . . . . . . . . . . 16.3Information Technology . . . . . . . . . . . . . . . . . . . . . . . . . . . . . . . . . . . . . . . . . . . . . . . . . . . . . . 7.9Cash . . . . . . . . . . . . . . . . . . . . . . . . . . . . . . . . . . . . . . . . . . . . . . . . . . . . . . . . . . . . . . . . . . . . 7.1Short-Term Investments . . . . . . . . . . . . . . . . . . . . . . . . . . . . . . . . . . . . . . . . . . . . . . . . . . . . . 6.5Industrials . . . . . . . . . . . . . . . . . . . . . . . . . . . . . . . . . . . . . . . . . . . . . . . . . . . . . . . . . . . . . . . . 6.3Consumer Staples . . . . . . . . . . . . . . . . . . . . . . . . . . . . . . . . . . . . . . . . . . . . . . . . . . . . . . . . . . 5.8Canadian Government Bonds . . . . . . . . . . . . . . . . . . . . . . . . . . . . . . . . . . . . . . . . . . . . . . . . . 5.6Consumer Discretionary . . . . . . . . . . . . . . . . . . . . . . . . . . . . . . . . . . . . . . . . . . . . . . . . . . . . . 3.6Foreign Currency Forward Contracts . . . . . . . . . . . . . . . . . . . . . . . . . . . . . . . . . . . . . . . . . . . . 0.4Telecommunication Services . . . . . . . . . . . . . . . . . . . . . . . . . . . . . . . . . . . . . . . . . . . . . . . . . . 0.3Other Assets (net) . . . . . . . . . . . . . . . . . . . . . . . . . . . . . . . . . . . . . . . . . . . . . . . . . . . . . . . . . . 0.1
During the six-month period the Fund's exposure to other price risk, credit risk, currency risk andinterest rate risk changed significantly as disclosed in the section below. For details relating to fairvalue hierarchy, refer to the audited annual financial statements as at December 31, 2010, as theFund's fair value hierarecy allocations remain unchanged.
Other Price RiskThe Fund indirectly bears the other price risk exposure of the Underlying Fund. As at June 30, 2011and December 31, 2010, the Underlying Fund’s holdings were sensitive to changes in generaleconomic conditions in Canada. The Underlying Fund portfolio consisted of Canadian stocks andfixed income securities, thus an overall downturn in the Canadian economy may lead to a wideningin credit spreads and a decrease in equity prices which would then lead to a decrease in the valueof the Underlying Fund’s holdings.
As at June 30, 2011, had the Canadian markets increased or decreased by 10% (December 31, 2010- 10%), with all other variables held constant, net assets of the Fund would have increased ordecreased, respectively, by approximately $7,784,000 (December 31, 2010 - $1,146,000). In practice,actual results may differ from this analysis and the difference may be material.
Semi-Annual Financial Statements as at June 30, 2011
– 19 –
CI Harbour Growth & Income Segregated FundFund Specific Financial Instruments Risks (Note 2) (unaudited) (cont’d)
The accompanying notes are an integral part of these financial statements.
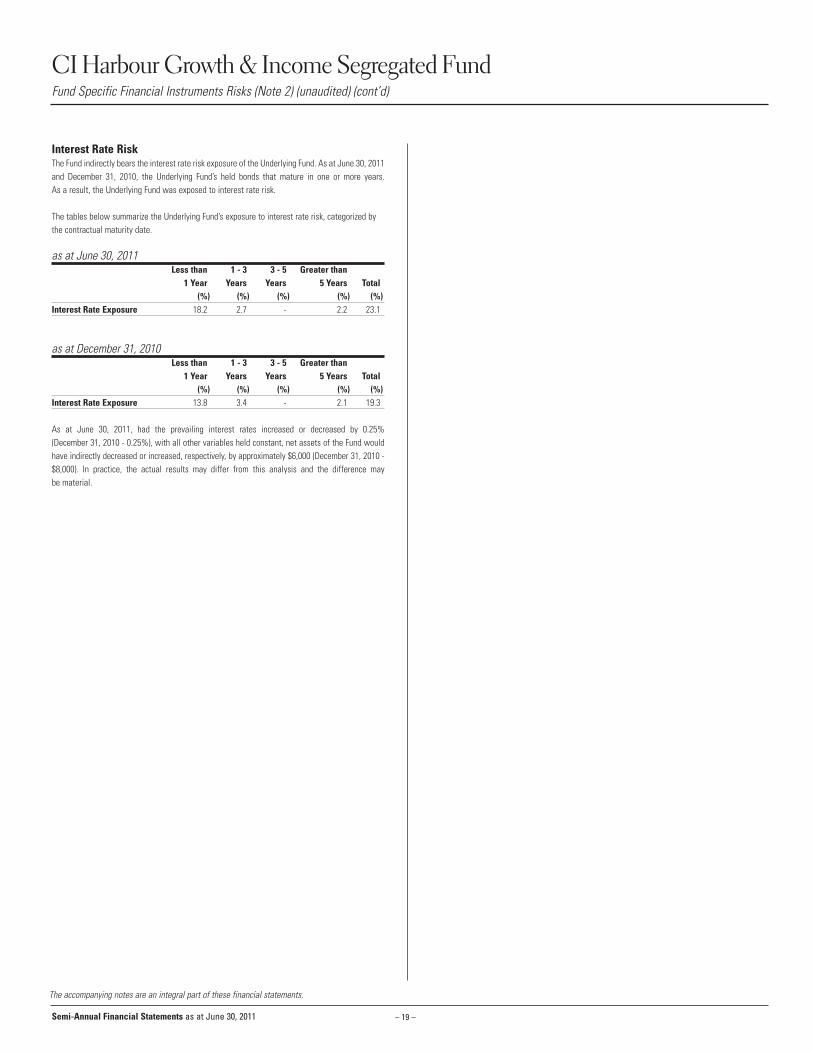
Interest Rate Risk The Fund indirectly bears the interest rate risk exposure of the Underlying Fund. As at June 30, 2011and December 31, 2010, the Underlying Fund’s held bonds that mature in one or more years. As a result, the Underlying Fund was exposed to interest rate risk.
The tables below summarize the Underlying Fund’s exposure to interest rate risk, categorized bythe contractual maturity date.
as at June 30, 2011Less than 1 - 3 3 - 5 Greater than
1 Year Years Years 5 Years Total(%) (%) (%) (%) (%)
Interest Rate Exposure 18.2 2.7 - 2.2 23.1
as at December 31, 2010Less than 1 - 3 3 - 5 Greater than
1 Year Years Years 5 Years Total(%) (%) (%) (%) (%)
Interest Rate Exposure 13.8 3.4 - 2.1 19.3
As at June 30, 2011, had the prevailing interest rates increased or decreased by 0.25% (December 31, 2010 - 0.25%), with all other variables held constant, net assets of the Fund wouldhave indirectly decreased or increased, respectively, by approximately $6,000 (December 31, 2010 -$8,000). In practice, the actual results may differ from this analysis and the difference may be material.
Semi-Annual Financial Statements as at June 30, 2011
– 20 –
CI Synergy American Segregated FundUnderlying Fund Information (unaudited)
CIG - 023
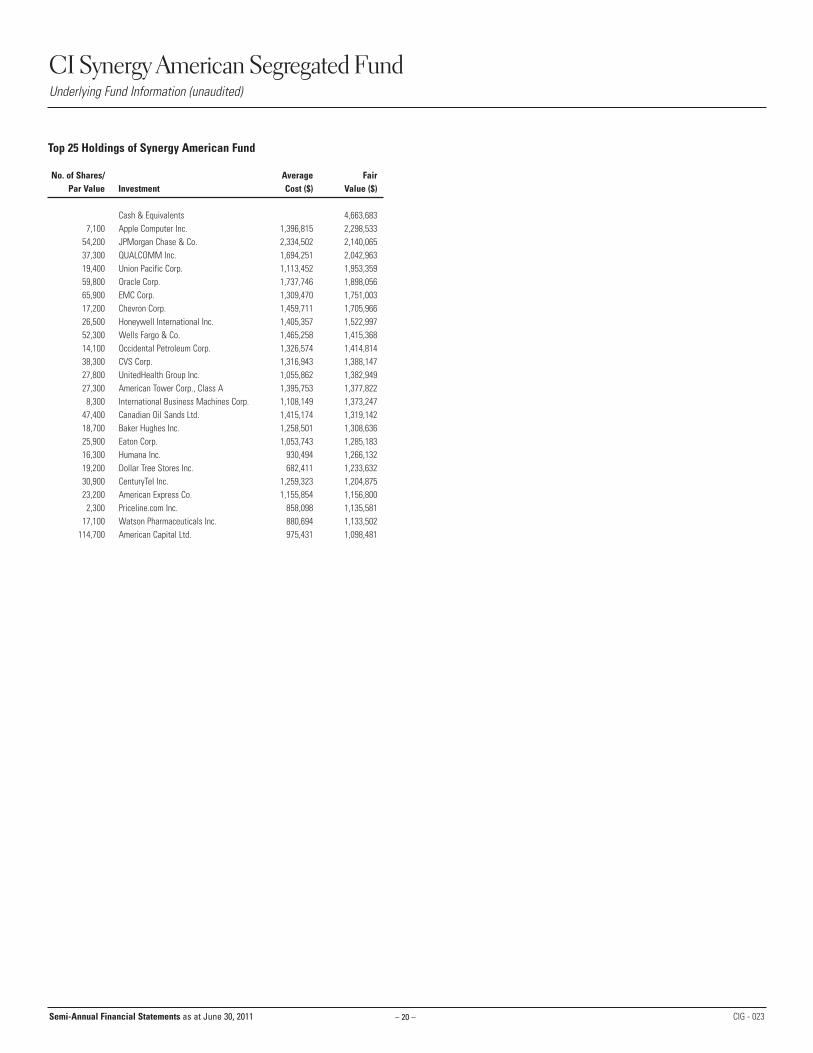
Top 25 Holdings of Synergy American Fund
No. of Shares/ Average FairPar Value Investment Cost ($) Value ($)
Cash & Equivalents 4,663,683 7,100 Apple Computer Inc. 1,396,815 2,298,533
54,200 JPMorgan Chase & Co. 2,334,502 2,140,065 37,300 QUALCOMM Inc. 1,694,251 2,042,963 19,400 Union Pacific Corp. 1,113,452 1,953,359 59,800 Oracle Corp. 1,737,746 1,898,056 65,900 EMC Corp. 1,309,470 1,751,003 17,200 Chevron Corp. 1,459,711 1,705,966 26,500 Honeywell International Inc. 1,405,357 1,522,997 52,300 Wells Fargo & Co. 1,465,258 1,415,368 14,100 Occidental Petroleum Corp. 1,326,574 1,414,814 38,300 CVS Corp. 1,316,943 1,388,147 27,800 UnitedHealth Group Inc. 1,055,862 1,382,949 27,300 American Tower Corp., Class A 1,395,753 1,377,822
8,300 International Business Machines Corp. 1,108,149 1,373,247 47,400 Canadian Oil Sands Ltd. 1,415,174 1,319,142 18,700 Baker Hughes Inc. 1,258,501 1,308,636 25,900 Eaton Corp. 1,053,743 1,285,183 16,300 Humana Inc. 930,494 1,266,132 19,200 Dollar Tree Stores Inc. 682,411 1,233,632 30,900 CenturyTel Inc. 1,259,323 1,204,875 23,200 American Express Co. 1,155,854 1,156,800
2,300 Priceline.com Inc. 858,098 1,135,581 17,100 Watson Pharmaceuticals Inc. 880,694 1,133,502
114,700 American Capital Ltd. 975,431 1,098,481
Semi-Annual Financial Statements as at June 30, 2011
– 21 –
IncomeIncome distribution from investmentsInterestManagement fee rebate
Expenses (Management expense ratios – see Financial Highlights)
Management feesAdministrative feesInsurance feesCustody feesLegal feesAudit feesGoods and services tax/Harmonized sales tax
Net investment income (loss) for the period
Realized and unrealized gain (loss) on investments Realized gain (loss) on investmentsCapital gain distribution
from investmentsChange in unrealized appreciation
(depreciation) of investmentsNet gain (loss) on investmentsIncrease (decrease) in net assets
from operations(Increase (decrease) in net assets from operations per unit – see Supplementary Schedule)
CI Synergy American Segregated FundFinancial Statements (unaudited)
AssetsInvestments at fair value*CashReceivable for unit subscriptionsReceivable for securities soldManagement fee rebate receivableReceivable for dividends and
accrued interest
LiabilitiesBank overdraftManagement fees payableAdministration fees payableInsurance fees payablePayable for securities purchased Payable for unit redemptions
Net assets and unitholders’ equity
*Investments at cost
Net Assets per unit – (see Financial Highlights)
Number of units outstanding (Unit transactions – see Supplementary Schedule)
Statements of Operations for the periods ended June 30(in $000’s)
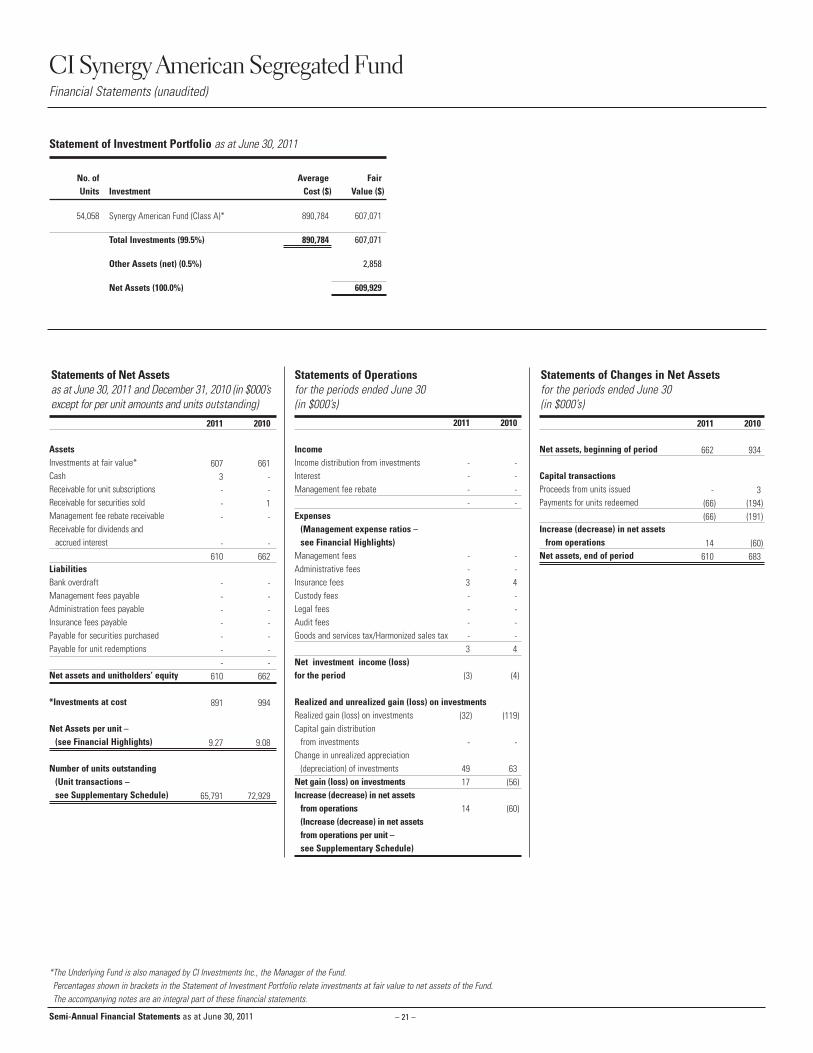
2011 2010
607 6613 -- -- 1- -
- -610 662
- -- -- -- -- -- -- -
610 662
891 994
9.27 9.08
65,791 72,929
Statements of Net Assets as at June 30, 2011 and December 31, 2010 (in $000’sexcept for per unit amounts and units outstanding)
Statements of Changes in Net Assets for the periods ended June 30(in $000’s)
2011 2010
- -- -- -- -
- -- -3 4- -- -- -- -3 4
(3) (4)
(32) (119)
- -
49 6317 (56)
14 (60)
Statement of Investment Portfolio as at June 30, 2011
No. of Average FairUnits Investment Cost ($) Value ($)
54,058 Synergy American Fund (Class A)* 890,784 607,071
Total Investments (99.5%) 890,784 607,071
Other Assets (net) (0.5%) 2,858
Net Assets (100.0%) 609,929
*The Underlying Fund is also managed by CI Investments Inc., the Manager of the Fund.Percentages shown in brackets in the Statement of Investment Portfolio relate investments at fair value to net assets of the Fund.The accompanying notes are an integral part of these financial statements.
Net assets, beginning of period
Capital transactionsProceeds from units issued Payments for units redeemed
Increase (decrease) in net assetsfrom operations
Net assets, end of period
2011 2010
662 934
- 3(66) (194)(66) (191)
14 (60)610 683
Semi-Annual Financial Statements as at June 30, 2011
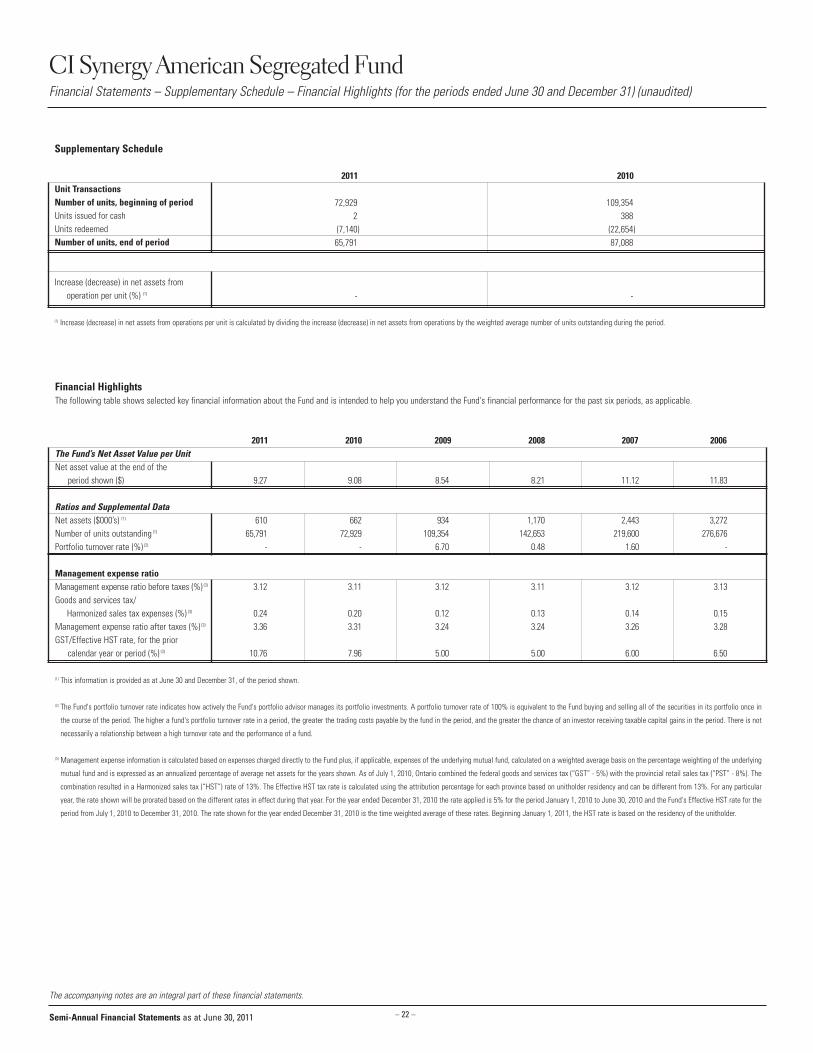
Financial HighlightsThe following table shows selected key financial information about the Fund and is intended to help you understand the Fund's financial performance for the past six periods, as applicable.
2011 2010 2009 2008 2007 2006The Fund’s Net Asset Value per UnitNet asset value at the end of the
period shown ($)
Ratios and Supplemental DataNet assets ($000’s) (1)
Number of units outstanding (1)
Portfolio turnover rate (%) (2)
Management expense ratio Management expense ratio before taxes (%) (3)
Goods and services tax/Harmonized sales tax expenses (%) (3)
Management expense ratio after taxes (%) (3)
GST/Effective HST rate, for the prior calendar year or period (%) (3)
(1) This information is provided as at June 30 and December 31, of the period shown.
(2) The Fund's portfolio turnover rate indicates how actively the Fund's portfolio advisor manages its portfolio investments. A portfolio turnover rate of 100% is equivalent to the Fund buying and selling all of the securities in its portfolio once in
the course of the period. The higher a fund's portfolio turnover rate in a period, the greater the trading costs payable by the fund in the period, and the greater the chance of an investor receiving taxable capital gains in the period. There is not
necessarily a relationship between a high turnover rate and the performance of a fund.
(3) Management expense information is calculated based on expenses charged directly to the Fund plus, if applicable, expenses of the underlying mutual fund, calculated on a weighted average basis on the percentage weighting of the underlying
mutual fund and is expressed as an annualized percentage of average net assets for the years shown. As of July 1, 2010, Ontario combined the federal goods and services tax (“GST” - 5%) with the provincial retail sales tax (“PST” - 8%). The
combination resulted in a Harmonized sales tax (“HST”) rate of 13%. The Effective HST tax rate is calculated using the attribution percentage for each province based on unitholder residency and can be different from 13%. For any particular
year, the rate shown will be prorated based on the different rates in effect during that year. For the year ended December 31, 2010 the rate applied is 5% for the period January 1, 2010 to June 30, 2010 and the Fund's Effective HST rate for the
period from July 1, 2010 to December 31, 2010. The rate shown for the year ended December 31, 2010 is the time weighted average of these rates. Beginning January 1, 2011, the HST rate is based on the residency of the unitholder.
– 22 –
CI Synergy American Segregated FundFinancial Statements – Supplementary Schedule – Financial Highlights (for the periods ended June 30 and December 31) (unaudited)
Semi-Annual Financial Statements as at June 30, 2011
The accompanying notes are an integral part of these financial statements.
Supplementary Schedule
2011 2010Unit TransactionsNumber of units, beginning of periodUnits issued for cash Units redeemedNumber of units, end of period
Increase (decrease) in net assets from operation per unit (%) (1)
(1) Increase (decrease) in net assets from operations per unit is calculated by dividing the increase (decrease) in net assets from operations by the weighted average number of units outstanding during the period.
72,929 109,3542 388
(7,140) (22,654)65,791 87,088
- -
9.27 9.08 8.54 8.21 11.12 11.83
610 662 934 1,170 2,443 3,27265,791 72,929 109,354 142,653 219,600 276,676
- - 6.70 0.48 1.60 -
3.12 3.11 3.12 3.11 3.12 3.13
0.24 0.20 0.12 0.13 0.14 0.153.36 3.31 3.24 3.24 3.26 3.28
10.76 7.96 5.00 5.00 6.00 6.50
– 23 –
CI Synergy American Segregated FundFund Specific Financial Instruments Risks (Note 2) (unaudited)
The accompanying notes are an integral part of these financial statements.
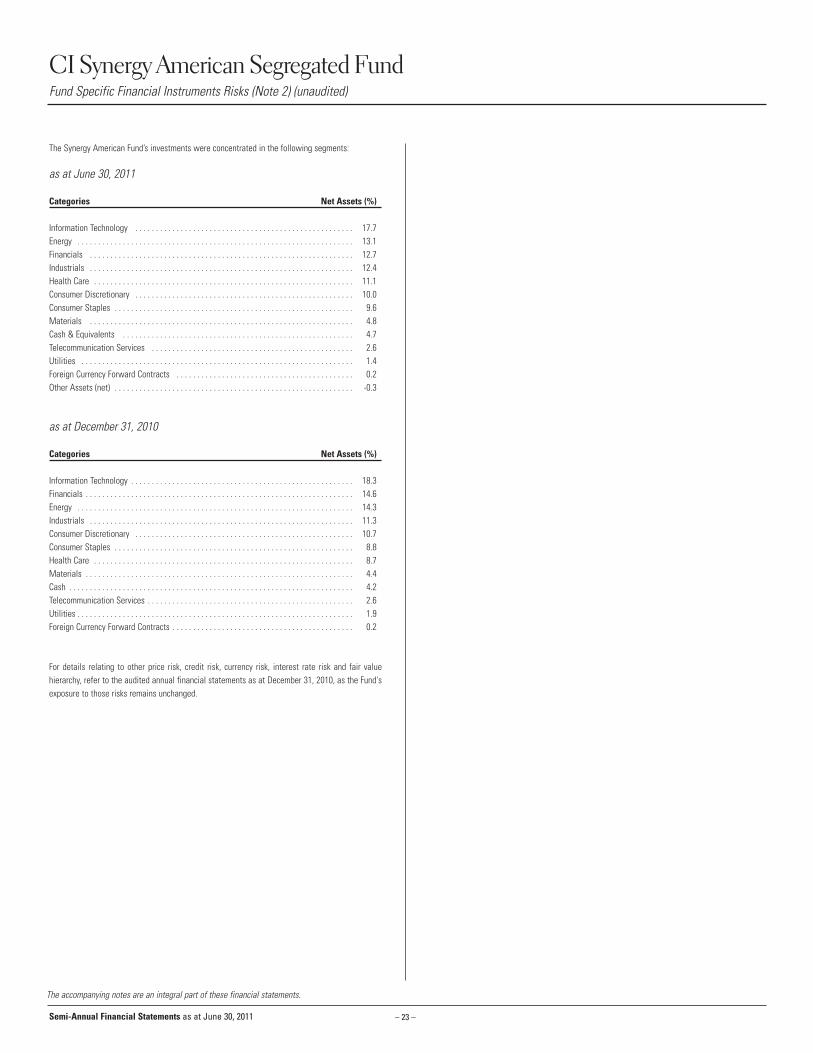
The Synergy American Fund’s investments were concentrated in the following segments:
as at June 30, 2011
Categories Net Assets (%)
Information Technology . . . . . . . . . . . . . . . . . . . . . . . . . . . . . . . . . . . . . . . . . . . . . . . . . . . . . 17.7Energy . . . . . . . . . . . . . . . . . . . . . . . . . . . . . . . . . . . . . . . . . . . . . . . . . . . . . . . . . . . . . . . . . . . 13.1Financials . . . . . . . . . . . . . . . . . . . . . . . . . . . . . . . . . . . . . . . . . . . . . . . . . . . . . . . . . . . . . . . . 12.7Industrials . . . . . . . . . . . . . . . . . . . . . . . . . . . . . . . . . . . . . . . . . . . . . . . . . . . . . . . . . . . . . . . . 12.4Health Care . . . . . . . . . . . . . . . . . . . . . . . . . . . . . . . . . . . . . . . . . . . . . . . . . . . . . . . . . . . . . . . 11.1Consumer Discretionary . . . . . . . . . . . . . . . . . . . . . . . . . . . . . . . . . . . . . . . . . . . . . . . . . . . . . 10.0Consumer Staples . . . . . . . . . . . . . . . . . . . . . . . . . . . . . . . . . . . . . . . . . . . . . . . . . . . . . . . . . . 9.6Materials . . . . . . . . . . . . . . . . . . . . . . . . . . . . . . . . . . . . . . . . . . . . . . . . . . . . . . . . . . . . . . . . 4.8Cash & Equivalents . . . . . . . . . . . . . . . . . . . . . . . . . . . . . . . . . . . . . . . . . . . . . . . . . . . . . . . . 4.7Telecommunication Services . . . . . . . . . . . . . . . . . . . . . . . . . . . . . . . . . . . . . . . . . . . . . . . . . 2.6Utilities . . . . . . . . . . . . . . . . . . . . . . . . . . . . . . . . . . . . . . . . . . . . . . . . . . . . . . . . . . . . . . . . . . 1.4Foreign Currency Forward Contracts . . . . . . . . . . . . . . . . . . . . . . . . . . . . . . . . . . . . . . . . . . . 0.2Other Assets (net) . . . . . . . . . . . . . . . . . . . . . . . . . . . . . . . . . . . . . . . . . . . . . . . . . . . . . . . . . . -0.3
as at December 31, 2010
Categories Net Assets (%)
Information Technology . . . . . . . . . . . . . . . . . . . . . . . . . . . . . . . . . . . . . . . . . . . . . . . . . . . . . . 18.3Financials . . . . . . . . . . . . . . . . . . . . . . . . . . . . . . . . . . . . . . . . . . . . . . . . . . . . . . . . . . . . . . . . . 14.6Energy . . . . . . . . . . . . . . . . . . . . . . . . . . . . . . . . . . . . . . . . . . . . . . . . . . . . . . . . . . . . . . . . . . . 14.3Industrials . . . . . . . . . . . . . . . . . . . . . . . . . . . . . . . . . . . . . . . . . . . . . . . . . . . . . . . . . . . . . . . . 11.3Consumer Discretionary . . . . . . . . . . . . . . . . . . . . . . . . . . . . . . . . . . . . . . . . . . . . . . . . . . . . . 10.7Consumer Staples . . . . . . . . . . . . . . . . . . . . . . . . . . . . . . . . . . . . . . . . . . . . . . . . . . . . . . . . . . 8.8Health Care . . . . . . . . . . . . . . . . . . . . . . . . . . . . . . . . . . . . . . . . . . . . . . . . . . . . . . . . . . . . . . . 8.7Materials . . . . . . . . . . . . . . . . . . . . . . . . . . . . . . . . . . . . . . . . . . . . . . . . . . . . . . . . . . . . . . . . . 4.4Cash . . . . . . . . . . . . . . . . . . . . . . . . . . . . . . . . . . . . . . . . . . . . . . . . . . . . . . . . . . . . . . . . . . . . . 4.2Telecommunication Services . . . . . . . . . . . . . . . . . . . . . . . . . . . . . . . . . . . . . . . . . . . . . . . . . . 2.6Utilities . . . . . . . . . . . . . . . . . . . . . . . . . . . . . . . . . . . . . . . . . . . . . . . . . . . . . . . . . . . . . . . . . . . 1.9Foreign Currency Forward Contracts . . . . . . . . . . . . . . . . . . . . . . . . . . . . . . . . . . . . . . . . . . . . 0.2
For details relating to other price risk, credit risk, currency risk, interest rate risk and fair valuehierarchy, refer to the audited annual financial statements as at December 31, 2010, as the Fund'sexposure to those risks remains unchanged.
Semi-Annual Financial Statements as at June 30, 2011
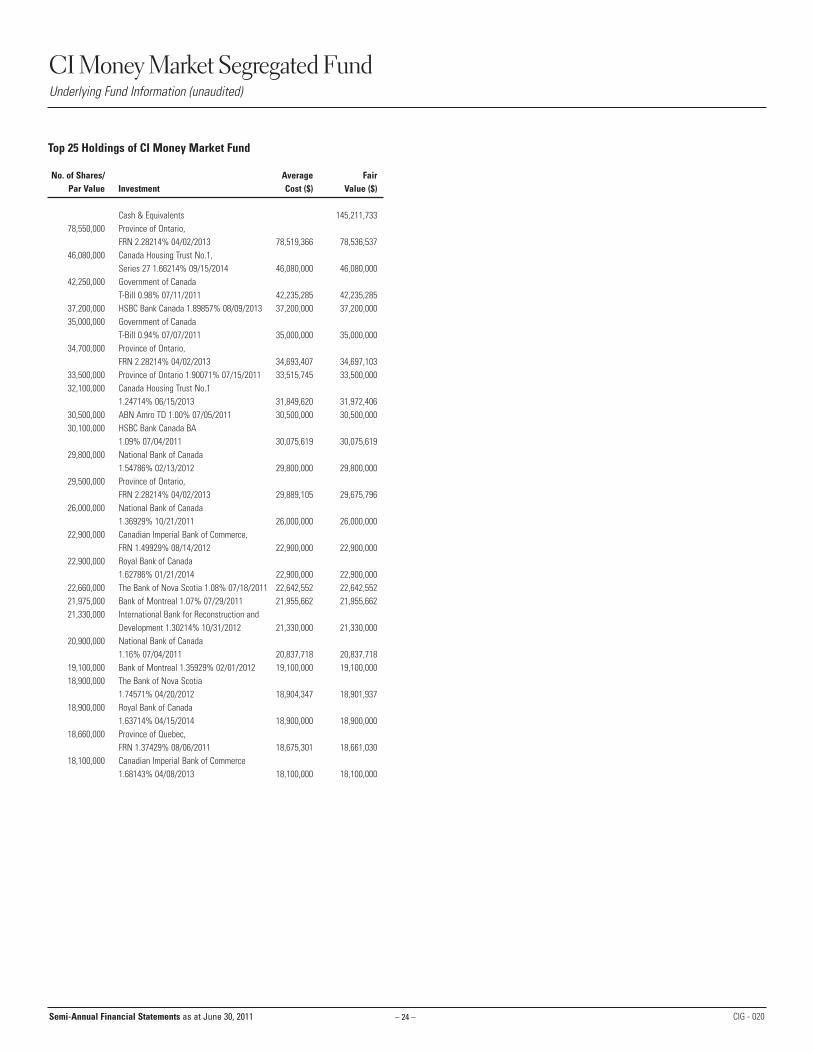
– 24 –
CI Money Market Segregated FundUnderlying Fund Information (unaudited)
CIG - 020
Top 25 Holdings of CI Money Market Fund
No. of Shares/ Average FairPar Value Investment Cost ($) Value ($)
Cash & Equivalents 145,211,733 78,550,000 Province of Ontario,
FRN 2.28214% 04/02/2013 78,519,366 78,536,537 46,080,000 Canada Housing Trust No.1,
Series 27 1.66214% 09/15/2014 46,080,000 46,080,000 42,250,000 Government of Canada
T-Bill 0.98% 07/11/2011 42,235,285 42,235,285 37,200,000 HSBC Bank Canada 1.89857% 08/09/2013 37,200,000 37,200,000 35,000,000 Government of Canada
T-Bill 0.94% 07/07/2011 35,000,000 35,000,000 34,700,000 Province of Ontario,
FRN 2.28214% 04/02/2013 34,693,407 34,697,103 33,500,000 Province of Ontario 1.90071% 07/15/2011 33,515,745 33,500,000 32,100,000 Canada Housing Trust No.1
1.24714% 06/15/2013 31,849,620 31,972,406 30,500,000 ABN Amro TD 1.00% 07/05/2011 30,500,000 30,500,000 30,100,000 HSBC Bank Canada BA
1.09% 07/04/2011 30,075,619 30,075,619 29,800,000 National Bank of Canada
1.54786% 02/13/2012 29,800,000 29,800,000 29,500,000 Province of Ontario,
FRN 2.28214% 04/02/2013 29,889,105 29,675,796 26,000,000 National Bank of Canada
1.36929% 10/21/2011 26,000,000 26,000,000 22,900,000 Canadian Imperial Bank of Commerce,
FRN 1.49929% 08/14/2012 22,900,000 22,900,000 22,900,000 Royal Bank of Canada
1.62786% 01/21/2014 22,900,000 22,900,000 22,660,000 The Bank of Nova Scotia 1.08% 07/18/2011 22,642,552 22,642,552 21,975,000 Bank of Montreal 1.07% 07/29/2011 21,955,662 21,955,662 21,330,000 International Bank for Reconstruction and
Development 1.30214% 10/31/2012 21,330,000 21,330,000 20,900,000 National Bank of Canada
1.16% 07/04/2011 20,837,718 20,837,718 19,100,000 Bank of Montreal 1.35929% 02/01/2012 19,100,000 19,100,000 18,900,000 The Bank of Nova Scotia
1.74571% 04/20/2012 18,904,347 18,901,937 18,900,000 Royal Bank of Canada
1.63714% 04/15/2014 18,900,000 18,900,000 18,660,000 Province of Quebec,
FRN 1.37429% 08/06/2011 18,675,301 18,661,030 18,100,000 Canadian Imperial Bank of Commerce
1.68143% 04/08/2013 18,100,000 18,100,000
Semi-Annual Financial Statements as at June 30, 2011

– 25 –
IncomeIncome distribution from investmentsInterestManagement fee rebate
Expenses (Management expense ratios – see Financial Highlights)
Management feesAdministrative feesInsurance feesCustody feesLegal feesAudit feesGoods and services tax/Harmonized sales tax
Net investment income (loss) for the period
Realized and unrealized gain (loss) on investments Realized gain (loss) on investmentsCapital gain distribution
from investmentsChange in unrealized appreciation
(depreciation) of investmentsNet gain (loss) on investmentsIncrease (decrease) in net assets
from operations(Increase (decrease) in net assets from operations per unit – see Supplementary Schedule)
CI Money Market Segregated FundFinancial Statements (unaudited)
AssetsInvestments at fair value*CashReceivable for unit subscriptionsReceivable for securities soldManagement fee rebate receivableReceivable for dividends and
accrued interest
LiabilitiesBank overdraftManagement fees payableAdministration fees payableInsurance fees payablePayable for securities purchased Payable for unit redemptions
Net assets and unitholders’ equity
*Investments at cost
Net Assets per unit – (see Financial Highlights)
Number of units outstanding (Unit transactions – see Supplementary Schedule)
Statements of Operations for the periods ended June 30(in $000’s)
2011 2010
788 1,03525 39
- -- 33- -
- 1813 1,108
- -- -- -- -
20 32- 34
20 66793 1,042
788 1,035
12.89 12.88
61,494 80,942
Statements of Net Assets as at June 30, 2011 and December 31, 2010 (in $000’sexcept for per unit amounts and units outstanding)
Statements of Changes in Net Assets for the periods ended June 30(in $000’s)
2011 2010
4 1- -- -4 1
1 2- -2 2- -- -- -- -3 4
1 (3)
- (1)
- -
- -- (1)
1 (4)
Statement of Investment Portfolio as at June 30, 2011
No. of Average FairUnits Investment Cost ($) Value ($)
78,786 CI Money Market Fund (Class A)* 787,861 787,861
Total Investments (99.4%) 787,861 787,861
Other Assets (net) (0.6%) 4,670
Net Assets (100.0%) 792,531
*The Underlying Fund is also managed by CI Investments Inc., the Manager of the Fund.Percentages shown in brackets in the Statement of Investment Portfolio relate investments at fair value to net assets of the Fund.The accompanying notes are an integral part of these financial statements.
Net assets, beginning of period
Capital transactionsProceeds from units issued Payments for units redeemed
Increase (decrease) in net assetsfrom operations
Net assets, end of period
2011 2010
1,042 1,780
250 1,951(500) (2,519)(250) (568)
1 (4)793 1,208
Semi-Annual Financial Statements as at June 30, 2011

Financial HighlightsThe following table shows selected key financial information about the Fund and is intended to help you understand the Fund's financial performance for the past six periods, as applicable.
2011 2010 2009 2008 2007 2006The Fund’s Net Asset Value per UnitNet asset value at the end of the
period shown ($)
Ratios and Supplemental DataNet assets ($000’s) (1)
Number of units outstanding (1)
Portfolio turnover rate (%) (2)
Management expense ratio Management expense ratio before taxes (%) (3)
Goods and services tax/Harmonized sales tax expenses (%) (3)
Management expense ratio after taxes (%) (3)
GST/Effective HST rate, for the prior calendar year or period (%) (3)
(1) This information is provided as at June 30 and December 31, of the period shown.
(2) The Fund's portfolio turnover rate indicates how actively the Fund's portfolio advisor manages its portfolio investments. A portfolio turnover rate of 100% is equivalent to the Fund buying and selling all of the securities in its portfolio once in
the course of the period. The higher a fund's portfolio turnover rate in a period, the greater the trading costs payable by the fund in the period, and the greater the chance of an investor receiving taxable capital gains in the period. There is not
necessarily a relationship between a high turnover rate and the performance of a fund.
(3) Management expense information is calculated based on expenses charged directly to the Fund plus, if applicable, expenses of the underlying mutual fund, calculated on a weighted average basis on the percentage weighting of the underlying
mutual fund and is expressed as an annualized percentage of average net assets for the years shown. As of July 1, 2010, Ontario combined the federal goods and services tax (“GST” - 5%) with the provincial retail sales tax (“PST” - 8%). The
combination resulted in a Harmonized sales tax (“HST”) rate of 13%. The Effective HST tax rate is calculated using the attribution percentage for each province based on unitholder residency and can be different from 13%. For any particular
year, the rate shown will be prorated based on the different rates in effect during that year. For the year ended December 31, 2010 the rate applied is 5% for the period January 1, 2010 to June 30, 2010 and the Fund's Effective HST rate for the
period from July 1, 2010 to December 31, 2010. The rate shown for the year ended December 31, 2010 is the time weighted average of these rates. Beginning January 1, 2011, the HST rate is based on the residency of the unitholder.
– 26 –
CI Money Market Segregated FundFinancial Statements – Supplementary Schedule – Financial Highlights (for the periods ended June 30 and December 31) (unaudited)
Semi-Annual Financial Statements as at June 30, 2011
The accompanying notes are an integral part of these financial statements.
Supplementary Schedule
2011 2010Unit TransactionsNumber of units, beginning of periodUnits issued for cash Units redeemedNumber of units, end of period
Increase (decrease) in net assets from operation per unit (%) (1)
(1) Increase (decrease) in net assets from operations per unit is calculated by dividing the increase (decrease) in net assets from operations by the weighted average number of units outstanding during the period.
80,942 137,78719,343 151,199(38,791) (195,236)61,494 93,750
- -
12.89 12.88 12.92 12.97 12.75 12.35
793 1,042 1,780 1,525 1,270 1,33061,494 80,942 137,787 117,539 99,607 107,696
9.48 1.12 81.86 72.79 81.23 89.05
1.40 1.40 1.40 1.40 1.40 1.41
0.12 0.10 0.06 0.07 0.07 0.071.52 1.50 1.46 1.47 1.47 1.48
11.88 8.56 5.00 5.00 6.00 6.50
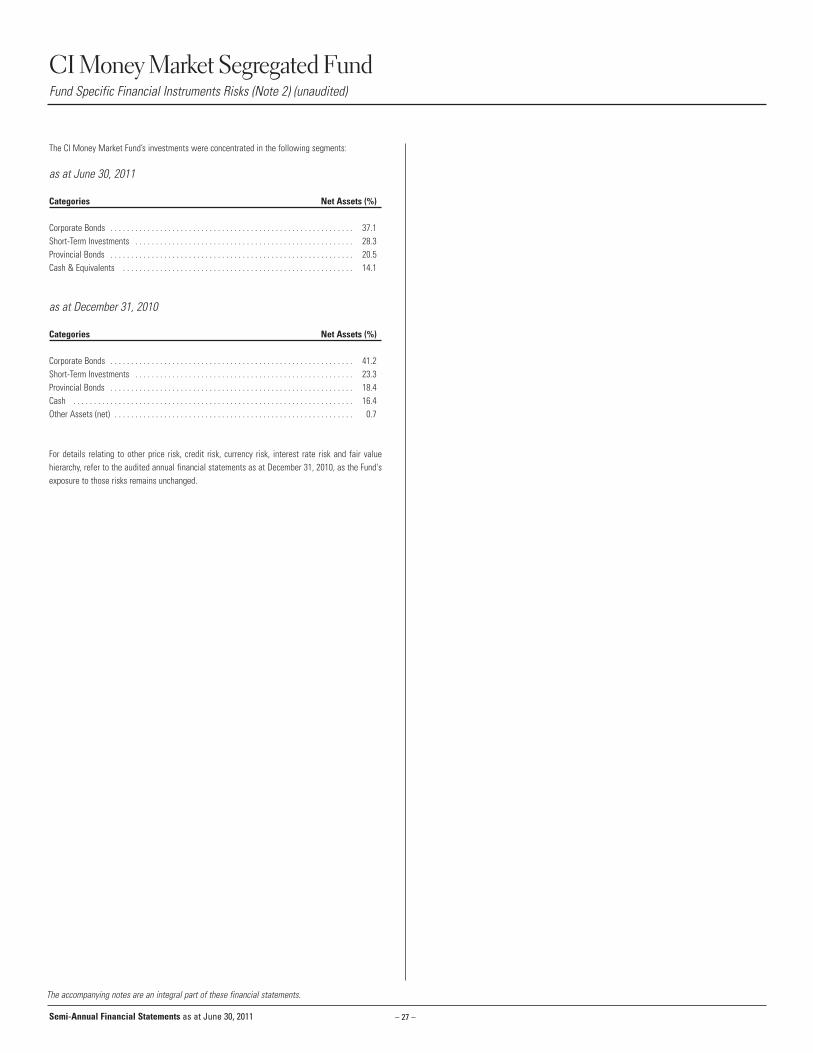
– 27 –
CI Money Market Segregated FundFund Specific Financial Instruments Risks (Note 2) (unaudited)
The accompanying notes are an integral part of these financial statements.
The CI Money Market Fund’s investments were concentrated in the following segments:
as at June 30, 2011
Categories Net Assets (%)
Corporate Bonds . . . . . . . . . . . . . . . . . . . . . . . . . . . . . . . . . . . . . . . . . . . . . . . . . . . . . . . . . . . 37.1Short-Term Investments . . . . . . . . . . . . . . . . . . . . . . . . . . . . . . . . . . . . . . . . . . . . . . . . . . . . . 28.3Provincial Bonds . . . . . . . . . . . . . . . . . . . . . . . . . . . . . . . . . . . . . . . . . . . . . . . . . . . . . . . . . . . 20.5Cash & Equivalents . . . . . . . . . . . . . . . . . . . . . . . . . . . . . . . . . . . . . . . . . . . . . . . . . . . . . . . . 14.1
as at December 31, 2010
Categories Net Assets (%)
Corporate Bonds . . . . . . . . . . . . . . . . . . . . . . . . . . . . . . . . . . . . . . . . . . . . . . . . . . . . . . . . . . . 41.2Short-Term Investments . . . . . . . . . . . . . . . . . . . . . . . . . . . . . . . . . . . . . . . . . . . . . . . . . . . . . 23.3Provincial Bonds . . . . . . . . . . . . . . . . . . . . . . . . . . . . . . . . . . . . . . . . . . . . . . . . . . . . . . . . . . . 18.4Cash . . . . . . . . . . . . . . . . . . . . . . . . . . . . . . . . . . . . . . . . . . . . . . . . . . . . . . . . . . . . . . . . . . . . 16.4Other Assets (net) . . . . . . . . . . . . . . . . . . . . . . . . . . . . . . . . . . . . . . . . . . . . . . . . . . . . . . . . . . 0.7
For details relating to other price risk, credit risk, currency risk, interest rate risk and fair valuehierarchy, refer to the audited annual financial statements as at December 31, 2010, as the Fund'sexposure to those risks remains unchanged.
Semi-Annual Financial Statements as at June 30, 2011

1. SUMMARY OF SIGNIFICANT ACCOUNTING POLICIES
These financial statements have been prepared in accordance with Canadian Generally Accepted
Accounting Principles (“Canadian GAAP”). Significant accounting policies used in preparing the semi-
annual financial statements are consistent with those used in preparing the annual financial
statements. The semi-annual financial statements should be read in conjunction with the Funds’
December 31, 2010 annual financial statements.
The Statement of Investment Portfolio for each of the Funds is as at June 30, 2011 and the Statements
of Net Assets are as at June 30, 2011 and December 31, 2010. The Statements of Operations and the
Statements of Changes in Net Assets for each of the Funds are for the periods ended June 30, 2011
and 2011. The Supplementary Schedules/Financial Highlights for each Fund are for periods ended June
30, 2011 and 2010 for Supplementary Schedules and for the most recent six-month period ended June
30, 2011 and for the most recent five periods ended December 31 for Financial Highlights. The Fund’s
Specific Financial Instruments Risks for each of the Funds are as at June 30, 2011 and December 31,
2010, where applicable.
(a) Valuation of Investments
Canadian GAAP requires the fair value of financial instruments traded in an active market to be
measured based on an investment’s bid/ask price depending on the investment position (long/short).
For the purpose of processing unitholder transactions, net asset value is calculated based on the closing
market price of investments (referred to as “Net Asset Value”), while for financial statement purposes
net assets are calculated based on bid/ask price of investments (referred to as “Net Assets”). The Funds
invest only in units of Underlying Funds. The Underlying Funds are valued at their net asset value as
reported by the Underlying Funds’ manager on the valuation date. No Net Assets comparison schedule
is presented for these Funds as there is no difference between Net Assets and Net Asset Value.
2. FINANCIAL INSTRUMENTS RISK
Risk Management
The Funds invest in units of Underlying Funds and are exposed to a variety of financial instruments
risks: credit risk, liquidity risk and price risk (including interest rate risk, currency risk and other price
risk). The level of risk to which each Fund is exposed depends on the investment objective and the type
of investments held by the Underlying Fund. The value of investments within an Underlying Fund
portfolio can fluctuate daily as a result of changes in prevailing interest rates, economic and market
conditions and company specific news related to investments held by the Underlying Fund and this will
affect the value of the Funds. The Manager of the Underlying Fund may minimize potential adverse
effects of these risks by, but not limited to, regular monitoring of the Underlying Fund’s positions and
market events, diversification of the investment portfolio by asset type, country, sector, term to
maturity within the constraints of the stated objectives, and through the usage of derivatives to hedge
certain risk exposures.
Other Price Risk
Other price risk is the risk that the value of financial instruments will fluctuate as a result of changes
in market prices (other than those arising from interest rate risk or currency risk). The value of each
investment is influenced by the outlook of the issuer and by general economic and political conditions,
as well as industry and market trends. All securities present a risk of loss of capital.
Other assets and liabilities are monetary items that are short-term in nature and therefore are not
subject to other price risk.
Credit Risk
Credit risk is the risk that a security issuer or counterparty to a financial instrument will fail to meet
its financial obligations. The fair value of a debt instrument includes consideration of the credit
worthiness of the debt issuer. The carrying amount of debt instruments represents the credit risk
exposure of each Underlying Fund. Credit risk exposure for derivative instruments is based on each
Underlying Funds’ unrealized gain on the contractual obligations with the counterparty as at the
reporting date. The credit risk exposure of Funds’ other assets are represented by their carrying amount
as disclosed in the Statements of Net Assets.
Currency Risk
Currency risk arises from financial instruments that are denominated in a currency other than,
Canadian dollars, the functional currency of the Funds and the Underlying Funds. As a result, the
Underlying Funds may be exposed to the risk that the value of securities denominated in other
currencies will fluctuate due to changes in exchange rates. Equities traded in foreign markets are also
exposed to currency risk as the prices denominated in foreign currencies are converted to Underlying
Funds’ functional currency to determine their fair value.
Interest Rate Risk
Interest rate risk is the risk that the fair value of interest-bearing investments will fluctuate due to
changes in prevailing levels of market interest rates. As a result, the value of the underlying funds that
invest in debt securities and/or income trusts will be affected by changes in applicable interest rates.
If interest rates fall, the fair value of existing debt securities may increase due to the increase in yield.
Alternatively, if interest rates rise, the yield of existing debt securities decrease which may then lead
to a decrease in their fair value. The magnitude of the decline will generally be greater for long-term
debt securities than for short-term debt securities.
Interest rate risk also applies to convertible securities. The fair value of these securities varies
inversely with interest rates, similar to other debt securities. However, since they may be converted
into common shares, convertible securities are generally less affected by interest rate fluctuations
than other debt securities.
Liquidity Risk
Liquidity risk is the risk that a Fund may not be able to settle or meet its obligations, on time or at a
reasonable price. The Funds are exposed to daily cash redemption of redeemable units. The Funds
invest all of their assets in underlying funds which can be readily disposed of.
Fair Value Hierarchy
The Funds are required to classify financial instruments measured at fair value using a fair value
hierarchy. Investments whose values are based on quoted market prices in active markets are classified
as Level 1. This level includes publicly traded equities, exchange traded and retail mutual funds,
exchange traded warrants, futures contracts, traded options, American depositary receipts (“ADRs”) and
Global depositary receipts (“GDRs”).
Financial instruments that trade in markets that are not considered to be active but are valued based
on quoted market prices, dealer quotations or alternative pricing sources supported by observable
inputs are classified as Level 2. These include, fixed income securities, mortgage backed securities
(“MBS”), short-term instruments, non-traded warrants, over-the-counter options, structured notes of
indexed securities, if applicable, foreign currency forward contracts and swap instruments.
CI Segregated FundsNotes to the Financial Statements (unaudited)
– 28 –Semi-Annual Financial Statements as at June 30, 2011

CI Segregated Funds Notes to the Financial Statements (unaudited) (cont’d)
– 29 –Semi-Annual Financial Statements as at June 30, 2011
Investments classified as Level 3 have significant unobservable inputs. Level 3 instruments include
private equities, private term loans, private equity funds and certain derivatives. As observable prices
are not available for these securities, the Funds may use a variety of valuation techniques to derive
the fair value.
The Funds invest only in other investment funds and these investments are classified as Level 1.
During the six-month period some Funds’ exposure to financial instruments risks including fair value
hierarchy classification changed significantly as per details disclosed in the "Fund Specific Financial
Instruments Risks" section of the financial statements. For details relating to financial instruments
risks and fair value hierarchy classification exposure for remaining Funds refer to the audited annual
financial statements as at December 31, 2010, as these Funds’ exposure to financial instruments risks
remained unchanged through the period.
NOTICE: Should you require additional copies of these Semi-Annual Financial Statements or have
received more than one copy, please contact CI Investments Inc. or your adviser.
Unity Life of Canada is the sole issuer of the individual variable annuity contract providing for
investment in CI Segregated Funds. A description of the key features of the applicable individual
variable annuity contract is contained in the CI Segregated Funds Information Folder. ANY AMOUNT
THAT IS ALLOCATED TO A SEGREGATED FUND IS INVESTED AT THE RISK OF THE OWNER
AND MAY INCREASE OR DECREASE IN VALUE.
®CI Investments and the CI Investments design, Synergy Mutual Funds, Harbour Advisors and Harbour
Funds are trademarks of CI Investments Inc.
INFORMATION FOLDER: CI Investments Inc. would be pleased to provide, without charge, the most
recent Information Folder upon request to its Toronto office.
CI Segregated Funds Legal Notice
Semi-Annual Financial Statements as at June 30, 2011 – 30 –

CISEG_SA_08/11E
Unity Life of Canada
50 Charles St. E. PO Box 1098, Station FToronto, ON, M4Y 2T7
2 Queen Street East, Twentieth Floor, Toronto, Ontario M5C 3G7 I www.ci.comHead Office / Toronto416-364-1145 1-800-268-9374
Calgary 403-205-43961-800-776-9027
Montreal 514-875-00901-800-268-1602
Vancouver 604-681-33461-800-665-6994
Client Services English: 1-800-563-5181French: 1-800-668-3528