self-esteem and locus of control of …acikarsiv.ankara.edu.tr/browse/24717/metinpiskin.pdf ·...
TRANSCRIPT
SELF-ESTEEM AND LOCUS OF CONTROL
OF SECONDARY SCHOOL CHILDREN
BOTH IN ENGLAND AND TURKEY
Thesis submitted for the degree of
Doctor of Philosophy
at the University of Leicester
by
Metin Piskin MA (Ankara)
Faculty of Education & Continuing Studies
University of Leicester
University of Leicester
Faculty of Education & Continuing Studies
Leicester, LE1 7RH January 1996
ii
ABSTRACT
This study investigates self-esteem and locus of control in a cross-cultural context,
comparing British and Turkish students. Sex differences are also considered. The
relationship between academic achievement and the personality variables of self-esteem
and locus of control is also examined.
The sample consisted of year-11 secondary school students. 190 were British and 315
were Turkish. In order to collect data, the Coopersmith Self-Esteem Inventory (SEI), the
Nowicki-Strickland Internal-External Control Scale and the Crandall et al. Intellectual
Achievement Responsibility Scale (IAR) were used.
The findings of this study indicated that English subjects had higher self-esteem scores
than the Turkish subjects. The results also showed that cultural differences were bigger
among males than among females. The results reveal no sex differences when both the
English and the Turkish samples were combined. However, among English subjects, the
males had significantly higher self-esteem scores than their female counterparts, while
no sex differences existed between Turkish males and females.
Cross-cultural comparisons of global locus of control between English and Turkish
cultures showed that there was no significant difference between English and Turkish
subjects. Furthermore, the results also indicated that English males were significantly
more internal than English females, whereas Turkish males and females did not differ.
The data also indicated that English and Turkish students did not differ in academic
locus of control. When the English and the Turkish males and females were compared,
the results showed that there were no significant differences between English and
Turkish females but English males were more internal than the Turkish males.
Furthermore, the results also indicated that Turkish females were more internal than
Turkish males, whereas, English males and females did not significantly differ.
When the relationships between self-esteem and academic achievement were
investigated, the data indicated that most of the self-esteem scales related significantly
with academic achievement for the English and the Turkish samples. However the
majority of the correlation coefficients were classified as moderate or low for the
English sample as well as for the Turkish.
The study also revealed that both the global and the academic locus of control scales
were significantly correlated with the academic achievement (GPA) for both of the
English and Turkish samples. Achievement also had a stronger relationship with global
locus of control than the academic locus of control for both the English and the Turkish
samples.
In order to find out the best predictor of achievement, multiple regression analyses were
carried out using the Stepwise procedure. Regression analyses, using academic
iii
achievement (GPA) scores as the criterion variable, found the Academic Self-Esteem
variable as the best independent variable to predict achievement for both English and
Turkish groups. However, together with the other independent variables, they accounted
for only 19 % of the variance in achievement for the English group and 13 % of the
variance for the Turkish group.
Dedicated to my parents and family
with the greatest of love and affection

iv
Acknowledgements
When I first started my research I had mixed feelings, on the one hand it seemed that I
had a long period ahead of me, a period that would be adequate to complete my studies.
I knew, on the other hand, that research was something that did not have an end. During
this long period I received considerable help from different people. Thus, many debts of
gratitude have accumulated.
First of all, my thanks go to my supervisor, Ms Sylvia McNamara, without whose
support, advice and guidance this work could not have been completed.
I should also like to sincerely thank Dr. Linda Hargreaves who assisted me in many
ways to complete the course of my study. I acknowledge the help and encouragement
she offered throughout my research. I would like to thank Dr. Sue Sawyer for assisting
me in using the SPSS computer programme. I am grateful to David Tomley for his
academic support and for helping me to sort out my official reports and documents. I
always received great kindness from our departmental secretary, Julie Thomson; my
thanks, hence, go to her as well.
I have also received considerable assistance from Turkey. I take this opportunity to
extend my thanks to my colleagues of the Educational Science Faculty, University of
Ankara. I would particularly like to express my gratitude to Professor Dr. Yıldız
Kuzgun for her advice and encouragement. She always supported me when I was in
need. With her help in overcoming bureaucratic difficulties regarding my extent of
study here, my morale was kept high. I am grateful to Professor Dr. Üstun Dökmen for
his kind help in conducting my pilot study at Mamak Lisesi (High School), in Ankara,
whilst I was in Leicester. I also express my thanks to Mr. Oguz Gürbüztürk for his help
in Turkey.
I am grateful to the administrators, staff and students of Mamak Lisesi and Cumhuriyet
Lisesi for allowing, collaborating and assisting me in carrying out my field work in their
institutions. I also wish to remember, the teachers, students and particularly Mrs Anne
Fullagar of John Cleaveland College, Hinckley, for their kind assistance when I
conducted my study in their school.
v
I wish to remember my best friend Vicky Ioannidou, for without her support,
encouragement and affection, my stay here would not have been as enjoyable. Thus, I
wish to express my deepest thanks to her.
I am grateful to Dr. Sinan Saydam for his help with a number of technical matters
concerning computers. I extend my thanks to Mr Mehmet Asutay for his friendship and
assistance in different parts of my research. Mr Don Jones and Mr Mohammad Rahmat
Bin Adam read the drafts and provided helpful comments, so I am grateful to them for
their editorial help.
I express my thanks to my friend Mr Cengiz Turkmen for his kind generosity and great
friendship. Mr Mustafa Polat, my cousin, was always helpful in handling necessary
bureaucratical work concerning the scholarship on my behalf in Ankara.
I owe many thanks to many people who contributed in one way or another to my study.
It is not possible for me to acknowledge all those by name but to all of them I wish to
express my gratitude.
Last but not least, I am indebted to my parents and family. Without their moral and
financial support, their deepest affection and their encouragement throughout my life,
none of my achievements would have been realised. Therefore, I dedicate this thesis to
my parents, with affection.
vi
Statement
The work described in this thesis has been carried out by the author in the Faculty of
Education & Continuing Studies at the University of Leicester, between October 1991
and September 1995. The work has not been submitted for any other degree at this or
any other university.
Signed Date:
vii
Contents
CHAPTER 1: INTRODUCTION ................................................................................. 1
CHAPTER 2: SELF-ESTEEM ..................................................................................... 9
2.1 INTRODUCTION ........................................................................................ 10
2.2 THE HISTORICAL DEVELOPMENT of SELF and SELF-
ESTEEM in PSYCHOLOGICAL THEORY ............................................... 11
2.2.1 The Self in William James’s Pioneer Work...................................... 13
2.2.2 The Self in Symbolic Interactionism ................................................ 15
2.2.2.1 Cooley ................................................................................ 15
2.2.2.2 Mead ................................................................................... 16
2.2.3 The Self in Freudian and Neo-Freudian Theories ............................. 17
2.2.3.1 The Self in Freud’s Psychoanalytic Theory ....................... 17
2.2.3.2 The Self in Jung’s Analytical Psychology .......................... 18
2.2.3.3 The Self in Adler’s Individual Psychology ........................ 19
2.2.3.4 The Self in Horney’s Social and Cultural
Psychoanalysis .................................................................... 20
2.2.3.5 The Self in Fromm’s Humanistic Psychoanalysis .............. 22
2.2.3.6 The Self in Sullivan’s Work ............................................... 23
2.2.3.7 The Self in Erikson’s Psychoanalytic Ego
Psychology ......................................................................... 24
2.2.4 The Self in Humanistic Perspectives ................................................ 27
2.2.4.1 The Self in Maslow’s Self-Actualisation Theory ............... 27
2.2.4.2 The Self in Rogers' Person Centred Theory ....................... 29
2.2.5 The Self-Enhancement and Self-Consistency Theories .................... 30
2.2.5.1 Self-Enhancement Theory .................................................. 30
viii
2.2.5.2 Self-Consistency Theory .................................................... 31
2.2.6 Specific Self-Esteem Theories .......................................................... 32
2.2.6.1 Morris Rosenberg ............................................................... 32
2.2.6.2 Stanley Coopersmith .......................................................... 34
2.2.7 Summary of the Theories .................................................................. 35
2.3 CONCEPTUAL PROBLEMS of SELF-ESTEEM & SELF-
CONCEPT .................................................................................................... 36
2.4 DEFINITIONS OF SELF-ESTEEM ............................................................ 39
2.5 THE INDICATIONS OF HIGH & LOW SELF-ESTEEM .......................... 44
2.6 SELF-ESTEEM MEASUREMENT & PROBLEMS .................................. 48
2.6.1 Introduction ....................................................................................... 48
2.6.2 Methods For Measuring Self-Esteem ............................................... 48
2.6.2.1 Self-Report Methods .......................................................... 49
2.6.2.2 Observational Methods ...................................................... 50
2.6.3 Problems in Measuring Self-Esteem ................................................. 51
2.6.4 Summary ........................................................................................... 52
2.7 SELF-ESTEEM & ACADEMIC ACHIEVEMENT .................................... 53
2.7.1 Correlational Studies ......................................................................... 55
2.7.1.1 Studies which obtained a positive relationship .................. 55
2.7.1.2 Studies which failed to obtain a relationship ..................... 62
2.7.1.3 Studies which obtained a negative relationship ................. 63
2.7.1.4 Sex Differences in the context of self-esteem-
achievement relationships .................................................. 64
2.7.2 Summary of the Correlational Studies .............................................. 65
2.7.3 Causality Studies ............................................................................... 66
2.7.4 Summary of Causality Studies .......................................................... 71
ix
2.7.5 Implications....................................................................................... 72
2.8 SEX AND GENDER DIFFERENCES IN SELF-ESTEEM ........................ 80
2.8.1 The Present Review .......................................................................... 82
2.8.2 Summary & Implications .................................................................. 85
2.9 CULTURAL DIFFERENCES & SELF-ESTEEM ...................................... 89
2.9.1 Introduction ....................................................................................... 89
2.9.2 Summary & Implications .................................................................. 95
2.10 GENERAL SUMMARY OF THE CHAPTER ............................................ 97
CHAPTER 3: LOCUS OF CONTROL ....................................................................... 103
3.1 INTRODUCTION ........................................................................................ 104
3.2 THEORETICAL PERSPECTIVE OF LOCUS OF CONTROL .................. 104
3.3 THE RELATIONSHIP of LOCUS OF CONTROL WITH
ACHIEVEMENT ......................................................................................... 109
3.3.1 Introduction ....................................................................................... 109
3.3.2 Empirical Findings ............................................................................ 109
3.3.2.1 Previous Reviews ............................................................... 110
3.3.2.2 Present Review ................................................................... 112
3.3.3 Summary ........................................................................................... 124
3.3.3.1 The summary of the studies in general ............................... 125
3.3.3.2 The summary of the studies on sex differences ................. 127
3.3.4 Educational Implications .................................................................. 131
3.4 SEX DIFFERENCES IN LOCUS of CONTROL ........................................ 133
3.4.1 Introduction ....................................................................................... 133
3.4.2 Empirical Findings ............................................................................ 133
3.4.3 Summary ........................................................................................... 139
x
3.5 LOCUS of CONTROL & CULTURAL DIFFERENCES ........................... 143
3.5.1 Introduction ....................................................................................... 143
3.5.2 Empirical Findings ............................................................................ 144
3.5.3 Summary ........................................................................................... 152
3.6 LOCUS of CONTROL AND SELF-ESTEEM ............................................ 154
3.6.1 Introduction ....................................................................................... 154
3.6.2 Empirical Findings ............................................................................ 155
3.6.3 Summary ........................................................................................... 160
3.7 IMPLICATIONS .......................................................................................... 161
3.8 GENERAL SUMMARY of the CHAPTER ................................................ 163
CHAPTER 4: DESIGN OF THE STUDY ................................................................... 167
4.1 INTRODUCTION ........................................................................................ 168
4.2 The QUESTIONS ASKED BY THE STUDY ............................................. 168
4.3 The RESEARCH HYPOTHESIS ................................................................. 169
4.4 The VARIABLES OF THE STUDY............................................................ 173
4.5 SELECTION & DESCRIPTION of the INSTRUMENTS .......................... 174
4.5.1 Self-Esteem Measurement ................................................................ 174
4.5.2 Reasons for Selecting the Coopersmith SEI ..................................... 174
4.5.3 Description of the Coopersmith SEI ................................................. 176
4.5.3.1 General Self ........................................................................ 176
4.5.3.2 Social -Peers Self ............................................................... 177
4.5.3.3 Home-Parents Self ............................................................. 177
4.5.3.4 School-Academic Self ........................................................ 178
4.5.4 Technical Support of the Coopersmith SEI ...................................... 178
4.5.5 Global Locus of Control Measurement ............................................. 179
xi
4.5.6 Reasons for Selecting the Nowicki-Strickland IE Control
Scale .................................................................................................. 180
4.5.7 Description of the Nowicki-Strickland I-E Control Scale ................ 180
4.5.8 Technical Support of the Nowicki-Strickland I-E Control
Scale .................................................................................................. 181
4.5.9 Academic Locus of Control Measurement ....................................... 181
4.5.10 Reasons for Selecting the Crandall IAR Scale .................................. 181
4.5.11 Description of the Crandall IAR Scale ............................................. 182
4.5.12 Technical Support of the Crandall IAR Scale ................................... 183
4.5.13 Academic Achievement Measurement ............................................. 183
4.6 THE TRANSLATION OF THE INSTRUMENTS INTO TURKISH ......... 184
4.7 ADAPTATION OF THE INSTRUMENTS FOR THE TURKISH
SAMPLE ...................................................................................................... 185
4.8 THE ADAPTATION OF THE CRANDALL IAR SCALE TO
TURKISH CULTURE.................................................................................. 185
4.9 PILOT STUDY ............................................................................................. 187
4.9.1 The Pilot Study in England ............................................................... 187
4.9.1.1 The English Pilot Sample ................................................... 187
4.9.1.2 The Specific Aims of the Pilot Study in England .............. 187
4.9.1.3 How the Pilot Study Influenced my Decision .................... 188
4.9.2 The Pilot Study in Turkey ................................................................. 190
4.9.2.1 The Pilot Sample ................................................................ 190
4.9.2.2 The specific aims of the Pilot Study in Turkey .................. 191
4.10 RELIABILITY STUDIES OF THE INSTRUMENTS for the
TURKISH PILOT SAMPLE ........................................................................ 192
4.10.1 Introduction ....................................................................................... 192
4.10.2 Results ............................................................................................... 193
4.11 THE MAIN SAMPLES ................................................................................ 196
xii
4.11.1 The Main Sample in England ........................................................... 196
4.11.2 The Main Sample in Turkey ............................................................. 198
4.12 STATISTICAL ANALYSIS ........................................................................ 199
CHAPTER 5: RELIABILITY STUDIES .................................................................... 200
5.1 INTRODUCTION ........................................................................................ 201
5.2 The RELIABILITY STUDIES of the INSTRUMENTS for the
TURKISH SAMPLE .................................................................................... 202
5.2.1 Introduction ....................................................................................... 202
5.2.2 The Results of KR-20 and Split-Half Reliabilities ........................... 202
5.2.3 The Results of Intercorrelations of the Scales .................................. 206
5.2.3.1 The Results of SEI.............................................................. 207
5.2.3.2 The Results of Locus of Control ........................................ 209
5.3 THE RELIABILITY STUDIES of the INSTRUMENTS FOR the
ENGLISH SAMPLE .................................................................................... 210
5.3.1 Introduction ....................................................................................... 210
5.3.2 The Results of KR-20 and Split-Half Reliabilities ........................... 211
5.3.3 The Results of Intercorrelations of Scales ........................................ 214
5.3.3.1 The Results of SEI.............................................................. 214
5.3.3.2 The Results of Locus of Control ........................................ 216
5.4 SUMMARY & DISCUSSION of the RESULTS ........................................ 218
5.4.1 The Turkish Sample .......................................................................... 218
5.4.2 The English Sample .......................................................................... 221
CHAPTER 6: STATISTICAL ANALYSIS & RESULT DISCUSSION .................. 224
6.1 CROSS-CULTURAL COMPARISONS of SELF-ESTEEM ...................... 225
6.1.1 Introduction ....................................................................................... 225
xiii
6.1.2 Total Self-Esteem ............................................................................. 225
6.1.3 Short Form of SEI ............................................................................. 227
6.1.4 General Self-Esteem ......................................................................... 229
6.1.5 Social Self-Esteem ............................................................................ 230
6.1.6 Home Self-Esteem ............................................................................ 232
6.1.7 Academic Self-Esteem ...................................................................... 233
6.1.8 Lie Scale ............................................................................................ 235
6.1.9 Summary & Discussion .................................................................... 236
6.1.10 Conclusion ........................................................................................ 244
6.2 CROSS-CULTURAL COMPARISONS OF LOCUS OF
CONTROL ................................................................................................... 245
6.2.1 Introduction ....................................................................................... 245
6.2.2 Global Locus of Control ................................................................... 246
6.2.3 Academic Locus of Control Scale (IAR-Total) ................................ 247
6.2.4 Academic Locus of Control Scale IAR-Success ............................... 250
6.2.5 Academic Locus of Control Scale IAR-Failure ................................ 251
6.2.6 Discussion ......................................................................................... 253
6.2.7 Conclusions ....................................................................................... 261
6.3 CORRELATIONS BETWEEN SELF-ESTEEM AND LOCUS of
CONTROL ................................................................................................... 263
6.3.1 Introduction ....................................................................................... 263
6.3.2 Results of the English Sample .......................................................... 263
6.3.3 Results of the Turkish Sample .......................................................... 266
6.3.4 Discussion ......................................................................................... 268
6.3.5 Conclusion ........................................................................................ 271
6.4 SEX COMPARISONS in ACADEMIC ACHIEVEMENT ......................... 273
xiv
6.4.1 Introduction ....................................................................................... 273
6.4.2 Results of the English Sample .......................................................... 273
6.4.2.1 Comparisons in June GCSE Exam Grades ........................ 273
6.4.2.2 Comparisons in November Teacher Assessment
Grades ................................................................................ 275
6.4.2.3 Correlation between June & November
Achievement Scores ........................................................... 276
6.4.3 Results of the Turkish Sample .......................................................... 277
6.4.4 Summary ........................................................................................... 278
6.5 RELATIONSHIP between SELF-ESTEEM & ACHIEVEMENT .............. 280
6.5.1 Introduction ....................................................................................... 280
6.5.2 Results of the English Sample .......................................................... 281
6.5.3 Results of the Turkish Sample .......................................................... 287
6.5.4. Discussion ......................................................................................... 293
6.6 RELATIONSHIP between LOCUS of CONTROL &
ACHIEVEMENT ......................................................................................... 302
6.6.1 Introduction ....................................................................................... 302
6.6.2 Results of the English Sample .......................................................... 303
6.6.3 Results of the Turkish Sample .......................................................... 307
6.6.4 Discussion ......................................................................................... 311
6.6.5 Conclusion ........................................................................................ 315
6.7 MULTIPLE REGRESSION ANALYSIS .................................................... 318
6.7.1 Introduction ....................................................................................... 318
6.7.2 Results of the English Group ............................................................ 319
6.7.3 Results of the Turkish Group ............................................................ 322
6.7.4. Summary of the Regression Analyses ............................................... 326
6.7.5 Conclusion ........................................................................................ 328
xv
CHAPTER 7: SUMMARY, IMPLICATION & LIMITATIONS ............................ 330
7.1 INTRODUCTION ........................................................................................ 331
7.2 GENERAL SUMMARY & CONCLUSIONS ............................................. 331
7.3 IMPLICATION FOR FURTHER STUDIES ............................................... 349
7.4 LIMITATION OF THE STUDY .................................................................. 358
REFERENCES ............................................................................................................... 361
APPENDICES ................................................................................................................ 390
xvi
List of Tables
Table 2.1 : The findings of sex comparisons in self-esteem ........................................ 84
Table 3.1 : The Direction of Findings in Studies of Sex Differences in Locus
of Control ................................................................................................... 140
Table 3.2 : The distribution of comparisons of sex differences in locus of
control during a period of 1970- 1980 and 1980-1994. ............................. 142
Table 4.1 : The KR-20 And Split-Half Reliability Coefficients of the
Instruments Applied in the Pilot Study in Turkey (N=85). ........................ 194
Table 4.2 : The KR-20 and Split-Half Reliabilities of the Instruments
Calculated from the Scores of Males (N= 31) and Females (N= 54)
in The Pilot Study in Turkey. ..................................................................... 195
Table 5.1 : The KR-20 and the Split-Half Reliability Coefficients of the
Instruments Applied All Turkish Sample. ................................................. 204
Table 5.2 : The KR-20 and Split-Half Reliability Coefficients of the
Instruments Calculated from the Scores of Females and Males
from the Main Study in Turkey. ................................................................. 205
Table 5.3 : Subscale intercorrelations of SEI for Turkish sample (n=315) ................. 207
Table 5.4 : Subscale intercorrelations of SEI for Turkish males (n=151) and
females (n=164) ......................................................................................... 208
Table 5.5 : Intercorrelations of Locus of Control Scales for Turkish Sample
(n= 315 for IAR ......................................................................................... 209
Table 5.6 : Intercorrelations of Locus of Control Scales for Turkish Males (n
= 151 for IAR Scales .................................................................................. 210
Table 5.7 : The KR-20 and Split-Half Reliability Coefficients of the
Instruments Applied to the English Sample. .............................................. 212
Table 5.8 : The KR-20 and the Split-Half Reliability Coefficients of the
Instruments Calculated from the Scores of Females and Males
from the English Sample. ........................................................................... 213
Table 5.9 : Subscale Intercorrelations of SEI for the English Sample (n=190) ........... 215
xvii
Table 5.10 : Subscale Intercorrelations of SEI for English Males (n=100) and
Females (n=90) .......................................................................................... 216
Table 5.11 : Intercorrelations of the Locus of Control Variables for the English
Sample (n= 190) ......................................................................................... 217
Table 5.12 : Intercorrelations of the Locus of Control Variables for English
males (n = 100) and females (n = 90). ....................................................... 217
Table 6.1 : English and Turkish Samples’ Means, Standard Deviation,
Minimum and Maximum Scores in Total Self-Esteem ............................. 226
Table 6.2 : ANOVA (Total Self-Esteem by Country and Sex) .................................... 226
Table 6.8 : English and Turkish Samples’ Means, Standard Deviation,
Minimum, and Maximum Scores in Short Form ....................................... 228
Table 6.9 : ANOVA (Short-Form by Country and Sex) .............................................. 228
Table 6.10 : English and Turkish Samples’ Means, Standard Deviation,
Minimum, and Maximum Scores in General Self-Esteem ........................ 229
Table 6.11 : ANOVA (General Self-Esteem by Country and Sex) ................................ 230
Table 6.12 : English and Turkish Samples’ Means, Standard Deviation,
Minimum, and Maximum Scores in Social-Peers Self-Esteem ................. 231
Table 6.13 : ANOVA (Social-Peers Self-Esteem by Country by Sex) .......................... 231
Table 6.14 : English and Turkish Samples’ Means, Standard Deviation,
Minimum, and Maximum Scores in Home-Parent Self-Esteem ............... 232
Table 6.15 : ANOVA (Home-Parent Self-Esteem by Country and Sex) ....................... 233
Table 6.16 : English and Turkish Samples’ Means, Standard Deviation,
Minimum, and Maximum Scores in School-Academic Self-
Esteem ........................................................................................................ 234
Table 6.17 : ANOVA (School-Academic Self-Esteem by Country and Sex) ................ 234
Table 6.18 : English and Turkish Samples’ Means, Standard Deviation,
Minimum, and Maximum Scores in Lie Scale .......................................... 235
Table 6.19 : ANOVA (Lie Scale by Country and Sex) .................................................. 236
Table 6.20 : English and Turkish Samples’ Means, Standard Deviation,
Minimum, and Maximum Scores in Global Locus of Control
(Nowicki-Strickland Internal-External Control Scale) .............................. 246
Table 6.21 : ANOVA (Global Locus of Control by Country and Sex) .......................... 247
xviii
Table 6.27 : English and Turkish Samples’ Means, Standard Deviation,
Minimum, and Maximum Scores in Total Academic Locus of
Control (Crandall et al.’s Intellectual-Achievement Responsibility
Scale) ......................................................................................................... 248
Table 6.28 : ANOVA (IAR-Total by Country and Sex) ................................................ 249
Table 6.29 : English and Turkish Samples’ Means, Standard Deviation,
Minimum, and Maximum Scores in Academic Locus of Control -
Success Situation (IAR-Success) ............................................................... 250
Table 6.30 : ANOVA (Academic Locus of Control -Success Situations- by
Country and Sex) ....................................................................................... 251
Table 6.31 : English and Turkish Samples’ Means, Standard Deviation,
Minimum, and Maximum Scores in Academic Locus of Control -
Failure Situation (IAR-Failure) .................................................................. 252
Table 6.32 : ANOVA (Academic Locus of Control -Failure Situations-by
Country and Sex) ....................................................................................... 253
Table 6.33 : Correlation coefficients between Coopersmith SEI and the
Nowicki-Strickland Internal-External Control Scale, and Crandall
et al. IAR Scale for the Entire British sample (Male + Female) ................ 264
Table 6.34 : Correlation coefficients between Coopersmith SEI and the
Nowicki-Strickland Internal-External Control Scale, and Crandall
et al. IAR Scale for British Males and Females ......................................... 265
Table 6.35 : Correlation coefficients between Coopersmith SEI and the
Nowicki-Strickland Internal-External Control Scale, and Crandall
et al. IAR Scale for Entire Turkish sample (Male + Female) .................... 266
Table 6.36 : Correlation coefficients between Coopersmith SEI and the
Nowicki-Strickland Internal-External Control Scale, and Crandall
et al. IAR Scale for Turkish Males and Females ....................................... 267
Table 6.37 : English Students’ Mean, Standard Deviation, Minimum, and
Maximum Scores in the June GCSE Exam ............................................... 274
Table 6.38 : T-Test between English Males and Females on the June GCSE
Exam. Grades ............................................................................................. 274
Table 6.39 : English Students’ Mean, Standard Deviation, Minimum, and
Maximum Scores in the November Teacher Assessment .......................... 275
Table 6.40 : T-Test between English Males and Females on the November
Teacher Assessment ................................................................................... 276
xix
Table 6.41 : Pearson Product-Moment correlations between June Exam.
Grades, and November Teacher Assessment Grades for English
sample ........................................................................................................ 277
Table 6.42 Turkish Students’ Mean, Standard Deviation, Minimum, and
Maximum Scores in the January Exam Grades ......................................... 278
Table 6.43 : T-Test between Turkish Males and Females on the January Exam.
Grades ........................................................................................................ 278
Table 6.44 Pearson Product-Moment correlations between Coopersmith Self-
Esteem Inventory Scales and Academic Achievement (November
Assessment Grade) for the English sample ............................................... 282
Table 6.45 Pearson Product-Moment correlations between Coopersmith Self-
Esteem Inventory Scales and Academic Achievement (November
Assessment Grade) for English males and females. .................................. 284
Table 6.46 : Pearson Product-Moment correlations between Scores in the
Coopersmith Self-Esteem Inventory Scales and Academic
Achievement Variables for Turkish sample. ............................................. 287
Table 6.47 : Pearson Product-Moment correlations between Coopersmith Self-
Esteem Inventory Scales and Academic Achievement Variables
for Turkish males and females. .................................................................. 289
Table 6.48 : Pearson Product-Moment correlations between Global, and
Academic Locus of Control scales (IAR-Total, IAR-Success, and
IAR-Failure) and Academic Achievement for the English sample ........... 304
Table 6.49 : Pearson Product-Moment correlations between Global, and
Academic Locus of Control scales (IAR) and Academic
Achievement (November Assessment Grades) for English males
and females. ............................................................................................... 306
Table 6.50 : Pearson Product-Moment correlations between Global, and
Academic Locus of Control scales (IAR) and Academic
Achievement Variables for the Turkish sample. ........................................ 308
Table 6.51 : Pearson Product-Moment correlations between Global, and
Academic Locus of Control scales (IAR) and Academic
Achievement Variables for Turkish males and females. ........................... 309
Table 6.52 : Multiple Regression Analysis of the English Students’ Academic
Achievement by Self-Esteem and Locus of Control measures .................. 319
Table 6.53 : Multiple Regression Analysis of the English Males’ Academic
Achievement by Self-Esteem and Locus of Control measures .................. 321
xx
Table 6.54 : Multiple Regression Analysis of the English Females’ Academic
Achievement by Self-Esteem and Locus of Control measures .................. 322
Table 6.55 : Multiple Regression Analysis of the Turkish Students’ Academic
Achievement by Self-Esteem and Locus of Control measures .................. 323
Table 6.56 : Multiple Regression Analysis of the Turkish Males’ Academic
Achievement by Self-Esteem and Locus of Control measures .................. 324
Table 6.57 : Multiple Regression Analysis of the Turkish Females’ Academic
Achievement by Self-Esteem and Locus of Control measures .................. 326

C h a p t e r O n e
- 1 -
CHAPTER 1
INTRODUCTION
C h a p t e r O n e
- 2 -
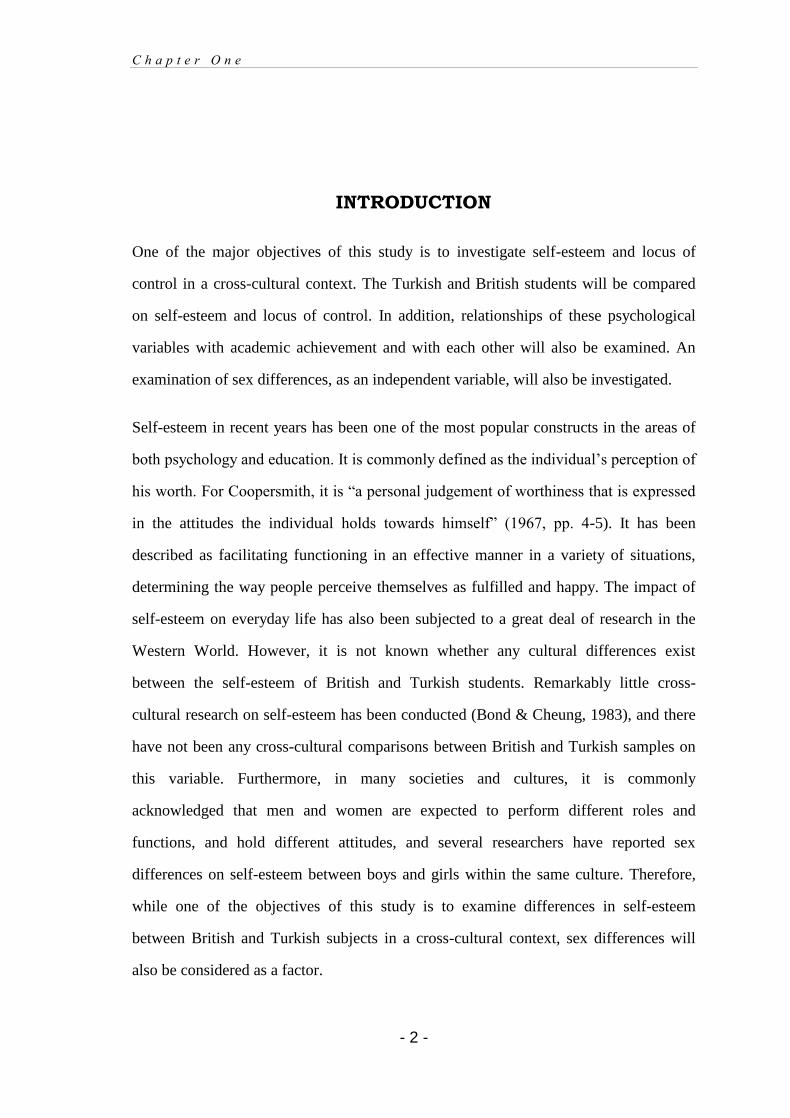
INTRODUCTION
One of the major objectives of this study is to investigate self-esteem and locus of
control in a cross-cultural context. The Turkish and British students will be compared
on self-esteem and locus of control. In addition, relationships of these psychological
variables with academic achievement and with each other will also be examined. An
examination of sex differences, as an independent variable, will also be investigated.
Self-esteem in recent years has been one of the most popular constructs in the areas of
both psychology and education. It is commonly defined as the individual’s perception of
his worth. For Coopersmith, it is “a personal judgement of worthiness that is expressed
in the attitudes the individual holds towards himself” (1967, pp. 4-5). It has been
described as facilitating functioning in an effective manner in a variety of situations,
determining the way people perceive themselves as fulfilled and happy. The impact of
self-esteem on everyday life has also been subjected to a great deal of research in the
Western World. However, it is not known whether any cultural differences exist
between the self-esteem of British and Turkish students. Remarkably little cross-
cultural research on self-esteem has been conducted (Bond & Cheung, 1983), and there
have not been any cross-cultural comparisons between British and Turkish samples on
this variable. Furthermore, in many societies and cultures, it is commonly
acknowledged that men and women are expected to perform different roles and
functions, and hold different attitudes, and several researchers have reported sex
differences on self-esteem between boys and girls within the same culture. Therefore,
while one of the objectives of this study is to examine differences in self-esteem
between British and Turkish subjects in a cross-cultural context, sex differences will
also be considered as a factor.
C h a p t e r O n e
- 3 -
Locus of control is another important and popular concept. Its construct has been the
subject of psychological research since the late 1950s (Phares, 1957; James & Rotter,
1958; Rotter, Seeman, & Liverant, 1962; Lefcourt, 1966). Interest in the study started
with Rotter’s (1966) monograph, which presented the concept of locus of control from a
social-learning theory point of view. It spread rapidly, resulting in a burst of
psychological and educational interest in this construct. Locus of control as a
personality factor has been correlated with hundreds of different variables in the last 30
years. Locus of control is concerned with “the question of whether or not an individual
believes that his own behaviour, skills or internal disposition determines what
reinforcements he receives” (Rotter et al., 1972), and refers to a person’s beliefs about
control over life events. Those with an internal locus of control believe that the
consequences of their behaviour are under their personal control and that they are
effective in controlling their destiny and determining the occurrence of reinforcement,
and feel personally responsible for the things that happen to them; whereas those with
an external locus of control believe that the outcomes of their performances in life are
determined by forces beyond their control (e.g., fate, chance, luck, powerful others and
supernatural forces) which determine the occurrence of specified events. It might be
described as a self appraisal of the degree to which an individual views him/herself as
having a causal role in determining specific events.
In contrast to self-esteem, locus of control research has been reported quite extensively
in cross-cultural literature. Despite its popularity, no British and Turkish samples have
been subjected together in a study of cultural comparisons. Therefore, the present study
was also aimed at comparing students’ beliefs in locus of control between British and
Turkish cultures.
The relationship of academic achievement with self-esteem and locus of control will
also be examined both among British and Turkish students, in this study.
C h a p t e r O n e
- 4 -
Educational systems have been traditionally commended if they have appeared
effectively to meet the current needs of the societies they are serving. Throughout the
history of different states, there have been different views about the role of education.
During the 19th century, as a result of the Industrial Revolution, modern developed
countries needed technicians. Consequently the school’s role was to train students to
meet these needs, and improving students’ academic performance has been a principal
aim of education in many countries. However, today, at the end of the 20th century, the
role of the school is generally accepted by many educational experts and school
psychologists as not only imparting knowledge and technical skills to students but also
producing psychologically healthy pupils who can understand and properly evaluate
themselves and their environment. One of the major goals of the school is to enhance
children’s affective development and increase their academic performance and
achievement. This raises the question as to how students’ academic achievement can be
increased. Starting in the 1960s, particularly in America and other developed countries,
a considerable amount of research has been focused on examining several psychological
variables in order to improve the academic performance of students.
The study of Coleman et al. (1966) was an important key point. After having completed
a large-scale study of school children in the United States, Coleman et al., (1966)
emphasised the crucial role of self-esteem and locus of control beliefs in understanding
the academic achievement of students. The authors concluded that “a pupil attitude
factor, which appears to have a stronger relationship to achievement than do all the
school factors together, is the extent to which an individual feels that he has some
control over his own destiny” (p.23). He found that measures of self-esteem and locus
of control were among the best predictors of academic achievement. Since Coleman et
al.’s report (1966) was published, a great deal of research has focused on investigating
the relationships of these variables with academic achievement.
C h a p t e r O n e
- 5 -
It has been hypothesised that self-esteem may affect a student's motivation and
expectations, that will in turn be reflected in academic achievement (Chapman et al.,
1981; Johnson, 1981). The findings of a great number of studies have indicated that
there is a relationship between self-esteem and academic achievement (Purkey, 1970;
Wylie, 1974, 1979; Burns, 1981 and 1982; Hansford & Hattie, 1982; Gurney, 1987;
Rosenberg et al., 1989; Okun & Fournet, 1993). Self-esteem has also been shown to be
correlated specifically with grades (Sears, 1970; Gordon, 1977; Borges et al., 1980;
Arseven, 1986; Strassburger, et al., 1990; Maqsud & Rouhani, 1991; Ersek, 1992).
There is also evidence of a positive relationship between an internal locus of control and
academic success (Phares, 1976; Bar-Tal and Bar-Tal, 1977; Lefcourt, 1976a; Uguroglu
et al., 1979; Findley et al., 1983). It has been argued that students who take internal
responsibility for their academic performances have higher levels of achievement than
those who do not (Nowicki et al., 1971). A positive relation between locus of control
beliefs and achievement is logical and intuitively appealing. Logically, if success is
positively valued, people who feel more able to control outcomes are likely to exert
more effort. Also, internals and externals should (and do) react differently to success
and failure. Internals take pride in good outcomes and feel shame in bad outcomes,
whereas externals experience less intense emotions (Phares, 1976). This difference
should enhance the relative “attractiveness” of the success experience for the internal.
Kukla (1972) showed that high achievers more frequently attributed their success or
failure to the degree of effort expended than did either intermediate or low achievers,
while intermediate achievers ascribed outcomes to luck more often than either of the
extreme achievement groups.
Though many studies show that the relationship of academic achievement with internal
locus of control and self-esteem tends to be positive, one still cannot easily make
reliable generalisations about these findings regarding different groups, cultures and
C h a p t e r O n e
- 6 -
communities. The number of research projects undertaken in Turkey on self-esteem and
locus of control, particularly their relationships with academic achievement, is very
limited and almost all of them have been undertaken for the first time during the second
half of the 1980s. Therefore, there is a great need to do research in these areas,
particularly in Turkey. It is also particularly important to make sure that the instruments
are actually measuring what they are intended to measure. Therefore, one of the main
aims of this study is to find out the reliability of the three instruments which are used in
this research, both in Turkey and in England. The reliability study of Crandall’s Locus
of Control scale will be the first one to be undertaken in a Turkish context. It is
considered worthwhile to do more research in this area.
There have also been a considerable number of studies both on self-esteem (e.g. Wylie,
1974 and 1979, Coopersmith, 1967; Rosenberg, 1965 and 1979; Burns, 1981 and 1982;
Lawrence, 1981 and 1988) and locus of control (e.g. Rotter, 1966; Lefcourt, 1976;
Phares, 1976) considered separately. However some studies have focused on the
relationship between these two academically important variables. Theoretically,
someone’s attitudes about himself or herself should bear some relation to locus of
control. A person who feels insecure, lacking in self worth and low in feelings of
personal adequacy is expected to be oriented towards external control rather than
internal control. The high-self-esteem individual, with his positive sense of adequacy,
should feel more in control of what he does and what happens to him rather than feeling
under control from outside forces. Externals may not only perceive a lack of control
over themselves but actively seek external control because of their feelings of personal
inadequacy. The results of many studies examining beliefs in personal control and self-
esteem suggest that the internal control person has higher self-esteem, probably because
he or she is more able to accept personal responsibility for his or her success (Lefcourt,
1976). Bellak (1975) found that externals produced lower self-evaluation. Externals
were also found to have difficulty with interpersonal relations (McDonald, 1971), with
C h a p t e r O n e
- 7 -
low self evaluation (Hersh & Schiebe, 1969), and with poor personal adjustment
(Warehime & Foulds, 1971). They were also found to have large discrepancies between
self and ideal and to perceive internal control as their ideal (Lombardo, Saverio &
Solheim, 1975). However, the number of research studies investigating the relationship
between self-esteem and locus of control are limited in Turkey as well as in Britain,
therefore one of the aims of this study is to examine the relationship between the two
constructs among both British and Turkish subjects.
In summary, the thesis will be organised and presented in the following way: first, the
literature on self-esteem will be reviewed in Chapter Two. This chapter will also
include a discussion of conceptual problems between self-esteem and self-concept, and
some definitions of self-esteem. The relationship between self-esteem and academic
achievement will also be discussed, and these relationships will be examined in the light
of both correlational studies and causality studies. The influence of sex and cultural
differences on the self-esteem construct will also be subjects of this chapter.
Chapter Three will be concerned with the literature review of the locus of control
construct. In this section, the relationship of locus of control with academic
achievement, self-esteem, sex and culture will be examined, and empirical findings of
past studies will be outlined.
Chapter Four will be concerned with methodological issues such as the research
questions, the samples and data collection, the statistical methods to be used, and the
adaptation of the scales.
The results of the study will be presented in Chapters Five and Six. While the reliability
of the instruments for both the English and Turkish samples will be assessed in Chapter
Five, Chapter Six will describe and discuss the results of comparisons between British
and Turkish subjects on the self-esteem and locus of control. This chapter also deals
C h a p t e r O n e
- 8 -
with the relationship of academic achievement with self-esteem and locus of control.
These results will be discussed and compared with the findings of other related and
relevant studies in these chapters. In order to find out the best predictor of academic
achievement, the results of the multiple regression analysis will also be assessed in this
chapter.
Chapter Seven provides a summary of the main results of this study, followed by
limitations of the study, and some implications for future research.
A p p e n d i c e s
- 427 -
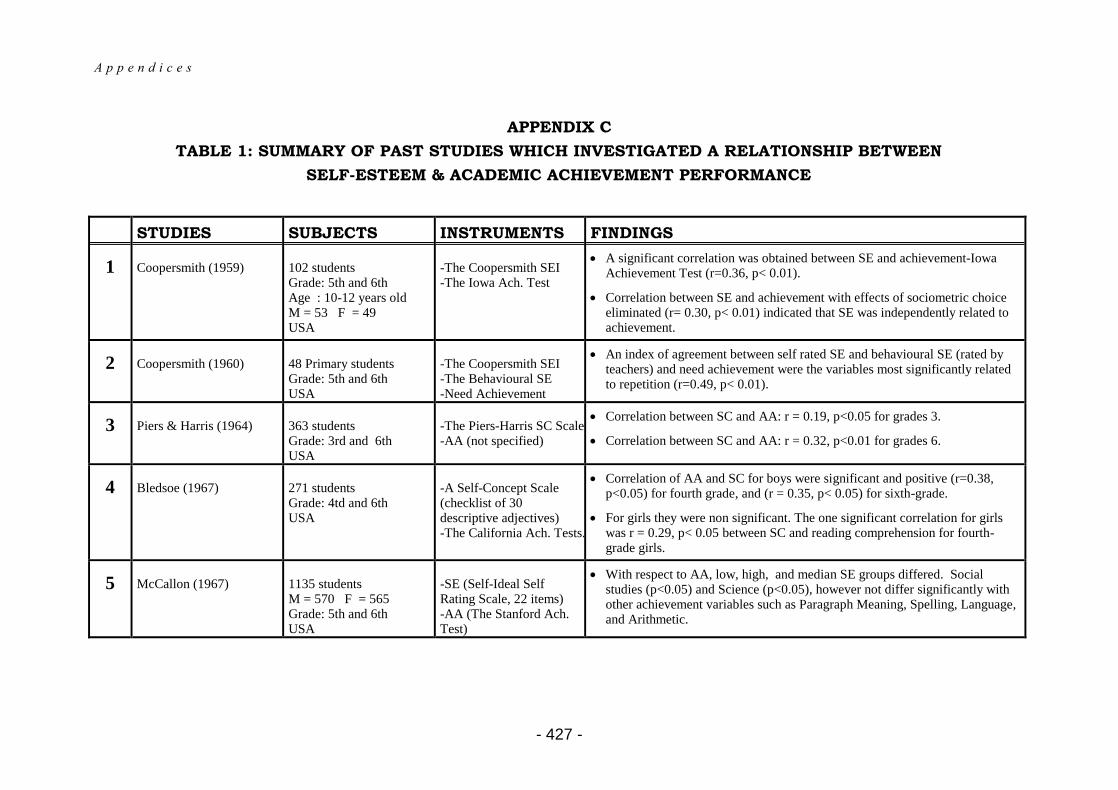
APPENDIX C
TABLE 1: SUMMARY OF PAST STUDIES WHICH INVESTIGATED A RELATIONSHIP BETWEEN
SELF-ESTEEM & ACADEMIC ACHIEVEMENT PERFORMANCE
STUDIES SUBJECTS INSTRUMENTS FINDINGS
1 Coopersmith (1959)
102 students Grade: 5th and 6th Age : 10-12 years old M = 53 F = 49 USA
-The Coopersmith SEI -The Iowa Ach. Test
A significant correlation was obtained between SE and achievement-Iowa Achievement Test (r=0.36, p< 0.01).
Correlation between SE and achievement with effects of sociometric choice eliminated (r= 0.30, p< 0.01) indicated that SE was independently related to achievement.
2 Coopersmith (1960)
48 Primary students Grade: 5th and 6th USA
-The Coopersmith SEI -The Behavioural SE -Need Achievement
An index of agreement between self rated SE and behavioural SE (rated by teachers) and need achievement were the variables most significantly related to repetition (r=0.49, p< 0.01).
3 Piers & Harris (1964)
363 students Grade: 3rd and 6th USA
-The Piers-Harris SC Scale -AA (not specified)
Correlation between SC and AA: r = 0.19, p<0.05 for grades 3.
Correlation between SC and AA: r = 0.32, p<0.01 for grades 6.
4 Bledsoe (1967)
271 students Grade: 4td and 6th USA
-A Self-Concept Scale (checklist of 30 descriptive adjectives) -The California Ach. Tests.
Correlation of AA and SC for boys were significant and positive (r=0.38, p<0.05) for fourth grade, and (r = 0.35, p< 0.05) for sixth-grade.
For girls they were non significant. The one significant correlation for girls was r = 0.29, p< 0.05 between SC and reading comprehension for fourth-grade girls.
5 McCallon (1967)
1135 students M = 570 F = 565 Grade: 5th and 6th USA
-SE (Self-Ideal Self Rating Scale, 22 items) -AA (The Stanford Ach. Test)
With respect to AA, low, high, and median SE groups differed. Social studies (p<0.05) and Science (p<0.05), however not differ significantly with other achievement variables such as Paragraph Meaning, Spelling, Language, and Arithmetic.
A p p e n d i c e s
- 428 -
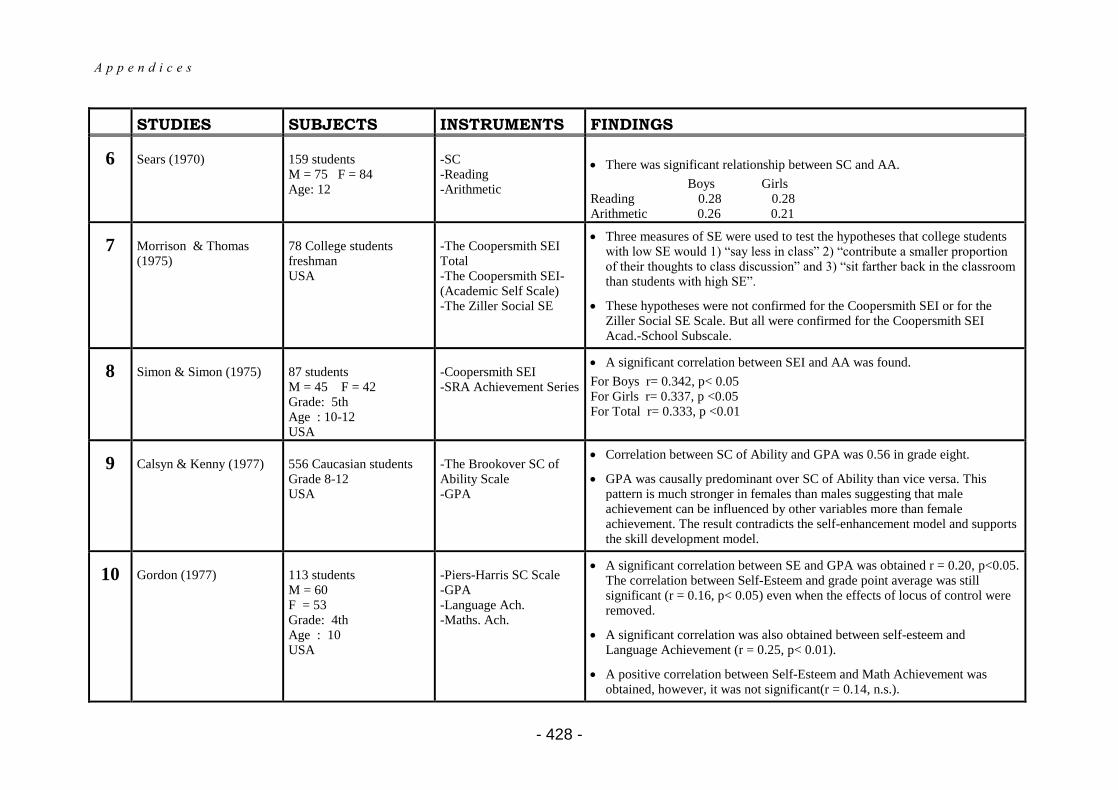
STUDIES SUBJECTS INSTRUMENTS FINDINGS
6 Sears (1970)
159 students M = 75 F = 84 Age: 12
-SC -Reading -Arithmetic
There was significant relationship between SC and AA.
Boys Girls Reading 0.28 0.28 Arithmetic 0.26 0.21
7 Morrison & Thomas (1975)
78 College students freshman USA
-The Coopersmith SEI Total -The Coopersmith SEI-(Academic Self Scale) -The Ziller Social SE
Three measures of SE were used to test the hypotheses that college students with low SE would 1) “say less in class” 2) “contribute a smaller proportion of their thoughts to class discussion” and 3) “sit farther back in the classroom than students with high SE”.
These hypotheses were not confirmed for the Coopersmith SEI or for the Ziller Social SE Scale. But all were confirmed for the Coopersmith SEI Acad.-School Subscale.
8 Simon & Simon (1975)
87 students M = 45 F = 42 Grade: 5th Age : 10-12 USA
-Coopersmith SEI -SRA Achievement Series
A significant correlation between SEI and AA was found.
For Boys r= 0.342, p< 0.05 For Girls r= 0.337, p <0.05 For Total r= 0.333, p <0.01
9 Calsyn & Kenny (1977)
556 Caucasian students Grade 8-12 USA
-The Brookover SC of Ability Scale -GPA
Correlation between SC of Ability and GPA was 0.56 in grade eight.
GPA was causally predominant over SC of Ability than vice versa. This pattern is much stronger in females than males suggesting that male achievement can be influenced by other variables more than female achievement. The result contradicts the self-enhancement model and supports the skill development model.
10 Gordon (1977)
113 students M = 60 F = 53 Grade: 4th Age : 10 USA
-Piers-Harris SC Scale -GPA -Language Ach. -Maths. Ach.
A significant correlation between SE and GPA was obtained r = 0.20, p<0.05. The correlation between Self-Esteem and grade point average was still significant (r = 0.16, p< 0.05) even when the effects of locus of control were removed.
A significant correlation was also obtained between self-esteem and Language Achievement (r = 0.25, p< 0.01).
A positive correlation between Self-Esteem and Math Achievement was obtained, however, it was not significant(r = 0.14, n.s.).
A p p e n d i c e s
- 429 -
STUDIES SUBJECTS INSTRUMENTS FINDINGS
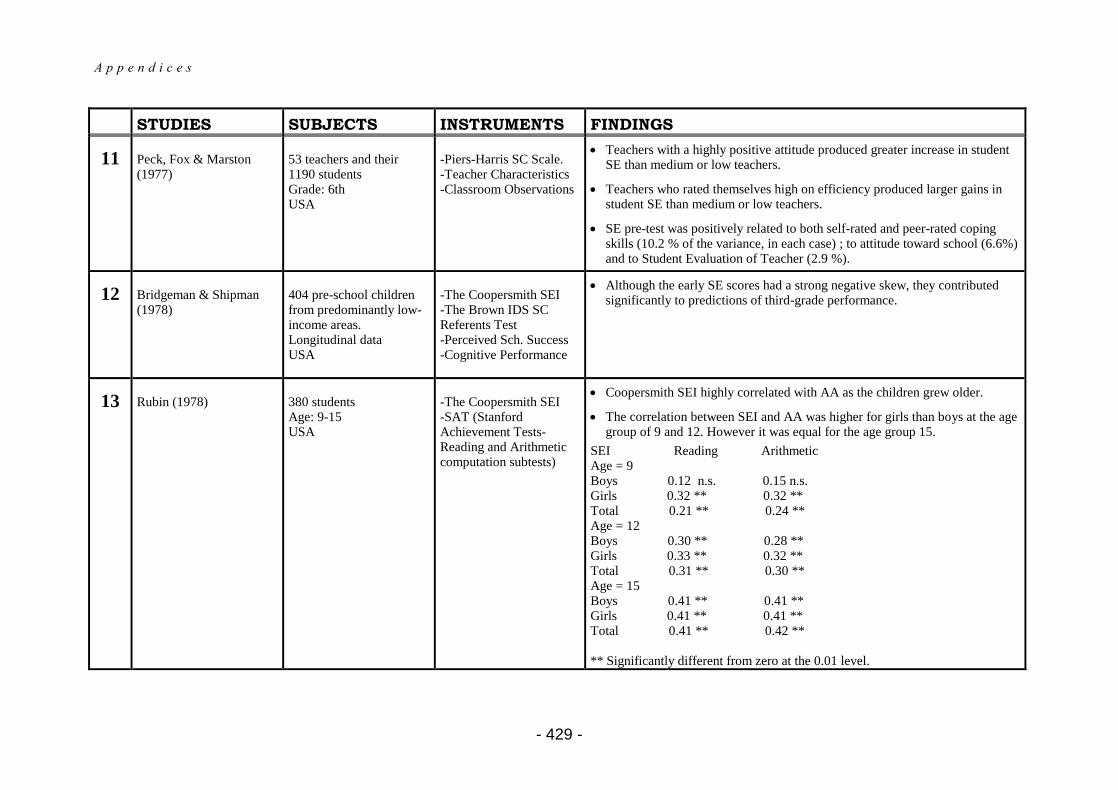
11 Peck, Fox & Marston (1977)
53 teachers and their 1190 students Grade: 6th USA
-Piers-Harris SC Scale. -Teacher Characteristics -Classroom Observations
Teachers with a highly positive attitude produced greater increase in student SE than medium or low teachers.
Teachers who rated themselves high on efficiency produced larger gains in student SE than medium or low teachers.
SE pre-test was positively related to both self-rated and peer-rated coping skills (10.2 % of the variance, in each case) ; to attitude toward school (6.6%) and to Student Evaluation of Teacher (2.9 %).
12 Bridgeman & Shipman (1978)
404 pre-school children from predominantly low-income areas. Longitudinal data USA
-The Coopersmith SEI -The Brown IDS SC Referents Test -Perceived Sch. Success -Cognitive Performance
Although the early SE scores had a strong negative skew, they contributed significantly to predictions of third-grade performance.
13 Rubin (1978)
380 students Age: 9-15 USA
-The Coopersmith SEI -SAT (Stanford Achievement Tests-Reading and Arithmetic computation subtests)
Coopersmith SEI highly correlated with AA as the children grew older.
The correlation between SEI and AA was higher for girls than boys at the age group of 9 and 12. However it was equal for the age group 15.
SEI Reading Arithmetic Age = 9 Boys 0.12 n.s. 0.15 n.s. Girls 0.32 ** 0.32 ** Total 0.21 ** 0.24 ** Age = 12 Boys 0.30 ** 0.28 ** Girls 0.33 ** 0.32 ** Total 0.31 ** 0.30 ** Age = 15 Boys 0.41 ** 0.41 ** Girls 0.41 ** 0.41 ** Total 0.41 ** 0.42 ** ** Significantly different from zero at the 0.01 level.
A p p e n d i c e s
- 430 -
STUDIES SUBJECTS INSTRUMENTS FINDINGS
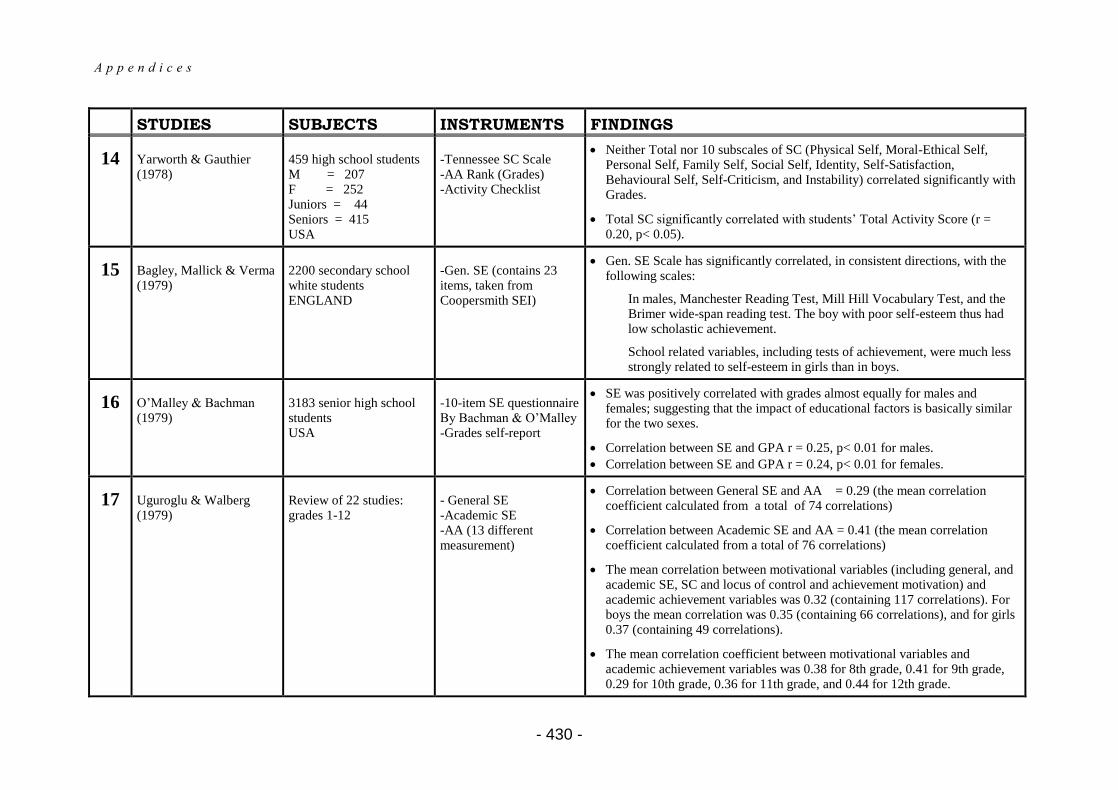
14 Yarworth & Gauthier (1978)
459 high school students M = 207 F = 252 Juniors = 44 Seniors = 415 USA
-Tennessee SC Scale -AA Rank (Grades) -Activity Checklist
Neither Total nor 10 subscales of SC (Physical Self, Moral-Ethical Self, Personal Self, Family Self, Social Self, Identity, Self-Satisfaction, Behavioural Self, Self-Criticism, and Instability) correlated significantly with Grades.
Total SC significantly correlated with students’ Total Activity Score (r = 0.20, p< 0.05).
15 Bagley, Mallick & Verma (1979)
2200 secondary school white students ENGLAND
-Gen. SE (contains 23 items, taken from Coopersmith SEI)
Gen. SE Scale has significantly correlated, in consistent directions, with the following scales:
In males, Manchester Reading Test, Mill Hill Vocabulary Test, and the Brimer wide-span reading test. The boy with poor self-esteem thus had low scholastic achievement.
School related variables, including tests of achievement, were much less strongly related to self-esteem in girls than in boys.
16 O’Malley & Bachman (1979)
3183 senior high school students USA
-10-item SE questionnaire By Bachman & O’Malley -Grades self-report
SE was positively correlated with grades almost equally for males and females; suggesting that the impact of educational factors is basically similar for the two sexes.
Correlation between SE and GPA r = 0.25, p< 0.01 for males.
Correlation between SE and GPA r = 0.24, p< 0.01 for females.
17 Uguroglu & Walberg (1979)
Review of 22 studies: grades 1-12
- General SE -Academic SE -AA (13 different measurement)
Correlation between General SE and AA = 0.29 (the mean correlation coefficient calculated from a total of 74 correlations)
Correlation between Academic SE and AA = 0.41 (the mean correlation coefficient calculated from a total of 76 correlations)
The mean correlation between motivational variables (including general, and academic SE, SC and locus of control and achievement motivation) and academic achievement variables was 0.32 (containing 117 correlations). For boys the mean correlation was 0.35 (containing 66 correlations), and for girls 0.37 (containing 49 correlations).
The mean correlation coefficient between motivational variables and academic achievement variables was 0.38 for 8th grade, 0.41 for 9th grade, 0.29 for 10th grade, 0.36 for 11th grade, and 0.44 for 12th grade.
A p p e n d i c e s
- 431 -
STUDIES SUBJECTS INSTRUMENTS FINDINGS
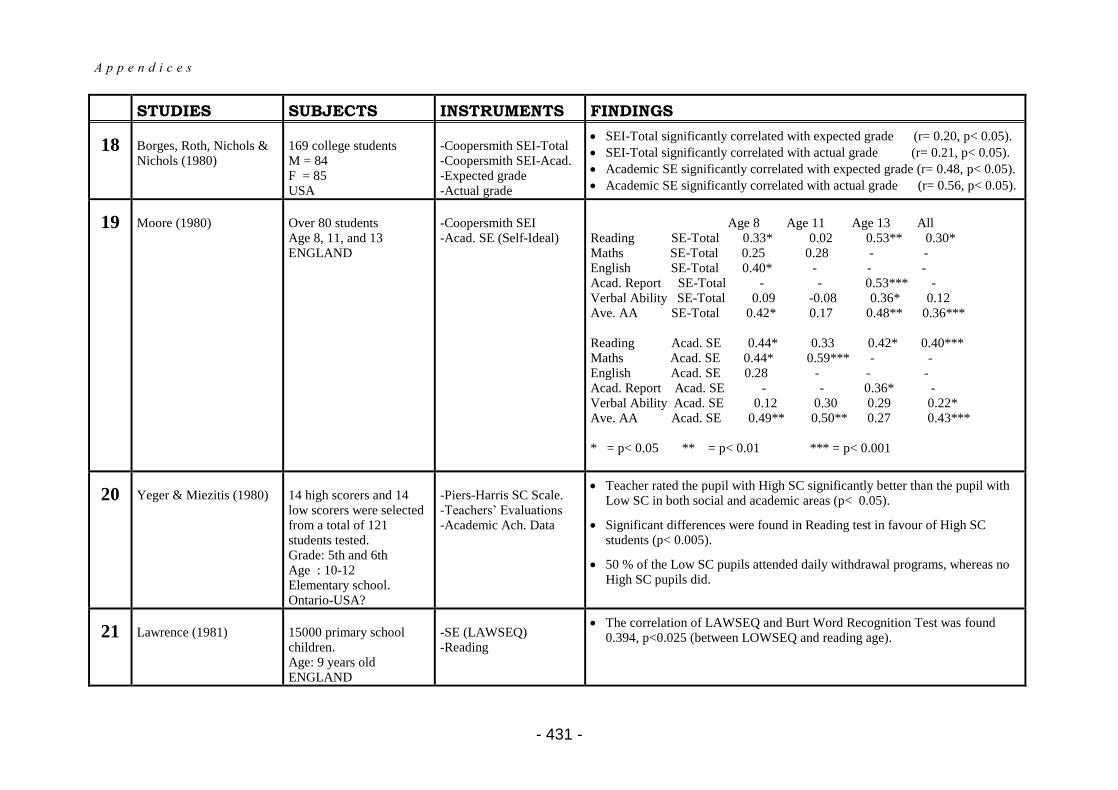
18 Borges, Roth, Nichols & Nichols (1980)
169 college students M = 84 F = 85 USA
-Coopersmith SEI-Total -Coopersmith SEI-Acad. -Expected grade -Actual grade
SEI-Total significantly correlated with expected grade (r= 0.20, p< 0.05).
SEI-Total significantly correlated with actual grade (r= 0.21, p< 0.05).
Academic SE significantly correlated with expected grade (r= 0.48, p< 0.05).
Academic SE significantly correlated with actual grade (r= 0.56, p< 0.05).
19 Moore (1980)
Over 80 students Age 8, 11, and 13 ENGLAND
-Coopersmith SEI -Acad. SE (Self-Ideal)
Age 8 Age 11 Age 13 All Reading SE-Total 0.33* 0.02 0.53** 0.30* Maths SE-Total 0.25 0.28 - - English SE-Total 0.40* - - - Acad. Report SE-Total - - 0.53*** - Verbal Ability SE-Total 0.09 -0.08 0.36* 0.12 Ave. AA SE-Total 0.42* 0.17 0.48** 0.36*** Reading Acad. SE 0.44* 0.33 0.42* 0.40*** Maths Acad. SE 0.44* 0.59*** - - English Acad. SE 0.28 - - - Acad. Report Acad. SE - - 0.36* - Verbal Ability Acad. SE 0.12 0.30 0.29 0.22* Ave. AA Acad. SE 0.49** 0.50** 0.27 0.43*** * = p< 0.05 ** = p< 0.01 *** = p< 0.001
20 Yeger & Miezitis (1980)
14 high scorers and 14 low scorers were selected from a total of 121 students tested. Grade: 5th and 6th Age : 10-12 Elementary school. Ontario-USA?
-Piers-Harris SC Scale. -Teachers’ Evaluations -Academic Ach. Data
Teacher rated the pupil with High SC significantly better than the pupil with Low SC in both social and academic areas (p< 0.05).
Significant differences were found in Reading test in favour of High SC students (p< 0.005).
50 % of the Low SC pupils attended daily withdrawal programs, whereas no High SC pupils did.
21 Lawrence (1981)
15000 primary school children. Age: 9 years old ENGLAND
-SE (LAWSEQ) -Reading
The correlation of LAWSEQ and Burt Word Recognition Test was found 0.394, p<0.025 (between LOWSEQ and reading age).
A p p e n d i c e s
- 432 -
STUDIES SUBJECTS INSTRUMENTS FINDINGS
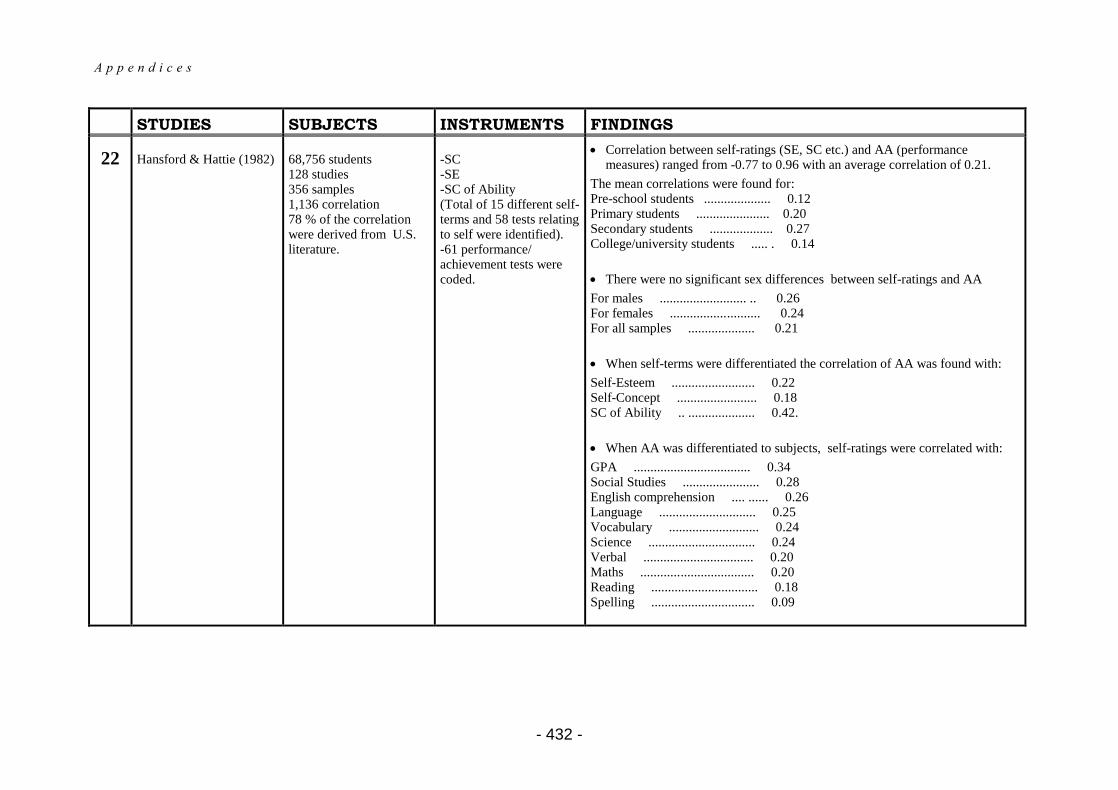
22 Hansford & Hattie (1982)
68,756 students 128 studies 356 samples 1,136 correlation 78 % of the correlation were derived from U.S. literature.
-SC -SE -SC of Ability (Total of 15 different self-terms and 58 tests relating to self were identified). -61 performance/ achievement tests were coded.
Correlation between self-ratings (SE, SC etc.) and AA (performance measures) ranged from -0.77 to 0.96 with an average correlation of 0.21.
The mean correlations were found for: Pre-school students .................... 0.12 Primary students ...................... 0.20 Secondary students ................... 0.27 College/university students ..... . 0.14
There were no significant sex differences between self-ratings and AA
For males .......................... .. 0.26 For females ........................... 0.24 For all samples .................... 0.21
When self-terms were differentiated the correlation of AA was found with:
Self-Esteem ......................... 0.22 Self-Concept ........................ 0.18 SC of Ability .. .................... 0.42.
When AA was differentiated to subjects, self-ratings were correlated with:
GPA ................................... 0.34 Social Studies ....................... 0.28 English comprehension .... ...... 0.26 Language ............................. 0.25 Vocabulary ........................... 0.24 Science ................................ 0.24 Verbal ................................. 0.20 Maths .................................. 0.20 Reading ................................ 0.18 Spelling ............................... 0.09
A p p e n d i c e s
- 433 -
STUDIES SUBJECTS INSTRUMENTS FINDINGS
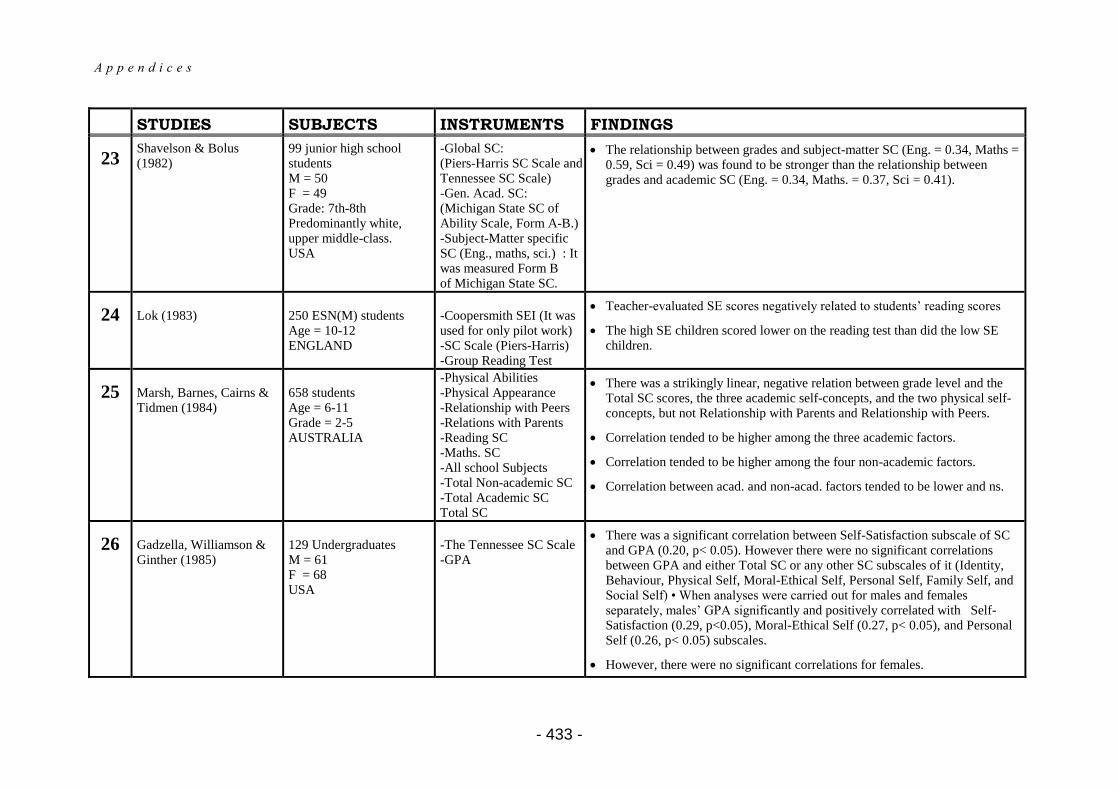
23 Shavelson & Bolus (1982)
99 junior high school students M = 50 F = 49 Grade: 7th-8th Predominantly white, upper middle-class. USA
-Global SC: (Piers-Harris SC Scale and Tennessee SC Scale) -Gen. Acad. SC: (Michigan State SC of Ability Scale, Form A-B.) -Subject-Matter specific SC (Eng., maths, sci.) : It was measured Form B of Michigan State SC.
The relationship between grades and subject-matter SC (Eng. = 0.34, Maths = 0.59, Sci = 0.49) was found to be stronger than the relationship between grades and academic SC (Eng. = 0.34, Maths. = 0.37, Sci = 0.41).
24 Lok (1983)
250 ESN(M) students Age = 10-12 ENGLAND
-Coopersmith SEI (It was used for only pilot work) -SC Scale (Piers-Harris) -Group Reading Test
Teacher-evaluated SE scores negatively related to students’ reading scores
The high SE children scored lower on the reading test than did the low SE children.
25 Marsh, Barnes, Cairns & Tidmen (1984)
658 students Age = 6-11 Grade = 2-5 AUSTRALIA
-Physical Abilities -Physical Appearance -Relationship with Peers -Relations with Parents -Reading SC -Maths. SC -All school Subjects -Total Non-academic SC -Total Academic SC Total SC
There was a strikingly linear, negative relation between grade level and the Total SC scores, the three academic self-concepts, and the two physical self-concepts, but not Relationship with Parents and Relationship with Peers.
Correlation tended to be higher among the three academic factors.
Correlation tended to be higher among the four non-academic factors.
Correlation between acad. and non-acad. factors tended to be lower and ns.
26 Gadzella, Williamson & Ginther (1985)
129 Undergraduates M = 61 F = 68 USA
-The Tennessee SC Scale -GPA
There was a significant correlation between Self-Satisfaction subscale of SC and GPA (0.20, p< 0.05). However there were no significant correlations between GPA and either Total SC or any other SC subscales of it (Identity, Behaviour, Physical Self, Moral-Ethical Self, Personal Self, Family Self, and Social Self) • When analyses were carried out for males and females separately, males’ GPA significantly and positively correlated with Self-Satisfaction (0.29, p<0.05), Moral-Ethical Self (0.27, p< 0.05), and Personal Self (0.26, p< 0.05) subscales.
However, there were no significant correlations for females.
A p p e n d i c e s
- 434 -
STUDIES SUBJECTS INSTRUMENTS FINDINGS
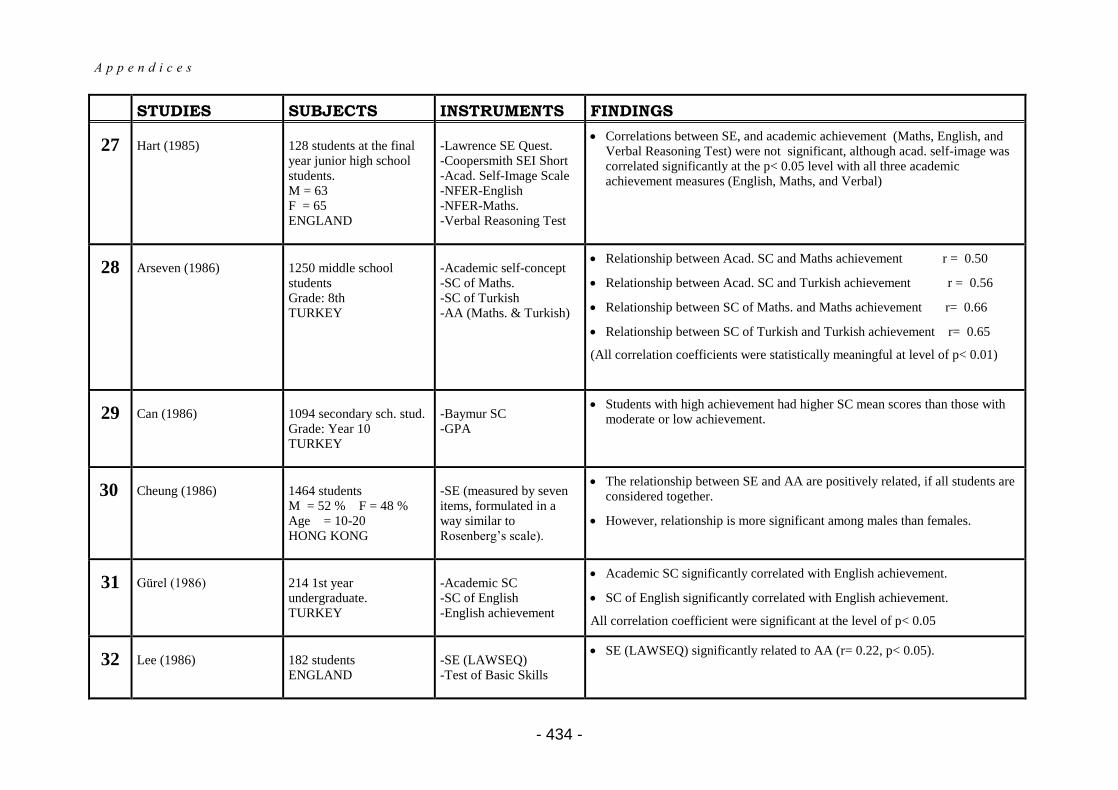
27 Hart (1985)
128 students at the final year junior high school students. M = 63 F = 65 ENGLAND
-Lawrence SE Quest. -Coopersmith SEI Short -Acad. Self-Image Scale -NFER-English -NFER-Maths. -Verbal Reasoning Test
Correlations between SE, and academic achievement (Maths, English, and Verbal Reasoning Test) were not significant, although acad. self-image was correlated significantly at the p< 0.05 level with all three academic achievement measures (English, Maths, and Verbal)
28 Arseven (1986)
1250 middle school students Grade: 8th TURKEY
-Academic self-concept -SC of Maths. -SC of Turkish -AA (Maths. & Turkish)
Relationship between Acad. SC and Maths achievement r = 0.50
Relationship between Acad. SC and Turkish achievement r = 0.56
Relationship between SC of Maths. and Maths achievement r= 0.66
Relationship between SC of Turkish and Turkish achievement r= 0.65
(All correlation coefficients were statistically meaningful at level of p< 0.01)
29 Can (1986)
1094 secondary sch. stud. Grade: Year 10 TURKEY
-Baymur SC -GPA
Students with high achievement had higher SC mean scores than those with moderate or low achievement.
30 Cheung (1986)
1464 students M = 52 % F = 48 % Age = 10-20 HONG KONG
-SE (measured by seven items, formulated in a way similar to Rosenberg’s scale).
The relationship between SE and AA are positively related, if all students are considered together.
However, relationship is more significant among males than females.
31 Gürel (1986)
214 1st year undergraduate. TURKEY
-Academic SC -SC of English -English achievement
Academic SC significantly correlated with English achievement.
SC of English significantly correlated with English achievement.
All correlation coefficient were significant at the level of p< 0.05
32 Lee (1986)
182 students ENGLAND
-SE (LAWSEQ) -Test of Basic Skills
SE (LAWSEQ) significantly related to AA (r= 0.22, p< 0.05).
A p p e n d i c e s
- 435 -
STUDIES SUBJECTS INSTRUMENTS FINDINGS
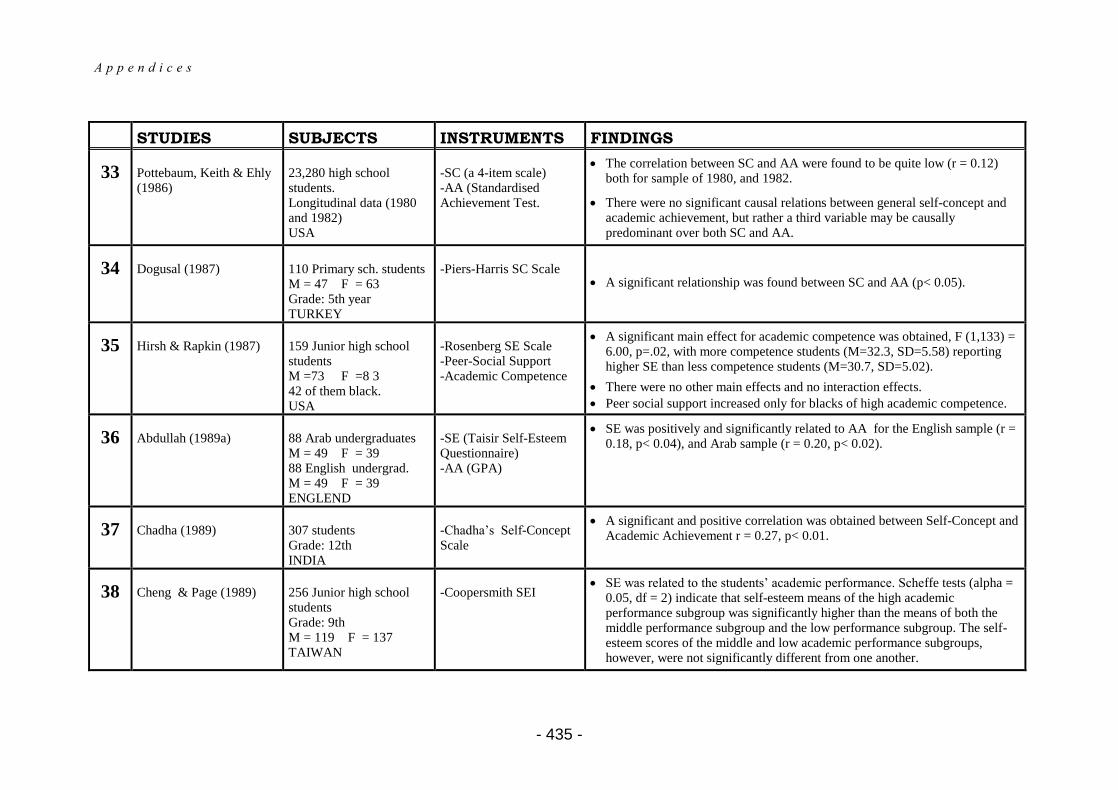
33 Pottebaum, Keith & Ehly (1986)
23,280 high school students. Longitudinal data (1980 and 1982) USA
-SC (a 4-item scale) -AA (Standardised Achievement Test.
The correlation between SC and AA were found to be quite low (r = 0.12) both for sample of 1980, and 1982.
There were no significant causal relations between general self-concept and academic achievement, but rather a third variable may be causally predominant over both SC and AA.
34 Dogusal (1987)
110 Primary sch. students M = 47 F = 63 Grade: 5th year TURKEY
-Piers-Harris SC Scale
A significant relationship was found between SC and AA (p< 0.05).
35 Hirsh & Rapkin (1987)
159 Junior high school students M =73 F =8 3 42 of them black. USA
-Rosenberg SE Scale -Peer-Social Support -Academic Competence
A significant main effect for academic competence was obtained, F (1,133) = 6.00, p=.02, with more competence students (M=32.3, SD=5.58) reporting higher SE than less competence students (M=30.7, SD=5.02).
There were no other main effects and no interaction effects.
Peer social support increased only for blacks of high academic competence.
36 Abdullah (1989a)
88 Arab undergraduates M = 49 F = 39 88 English undergrad. M = 49 F = 39 ENGLEND
-SE (Taisir Self-Esteem Questionnaire) -AA (GPA)
SE was positively and significantly related to AA for the English sample (r = 0.18, p< 0.04), and Arab sample (r = 0.20, p< 0.02).
37 Chadha (1989)
307 students Grade: 12th INDIA
-Chadha’s Self-Concept Scale
A significant and positive correlation was obtained between Self-Concept and Academic Achievement r = 0.27, p< 0.01.
38 Cheng & Page (1989)
256 Junior high school students Grade: 9th M = 119 F = 137 TAIWAN
-Coopersmith SEI
SE was related to the students’ academic performance. Scheffe tests (alpha = 0.05, df = 2) indicate that self-esteem means of the high academic performance subgroup was significantly higher than the means of both the middle performance subgroup and the low performance subgroup. The self-esteem scores of the middle and low academic performance subgroups, however, were not significantly different from one another.
A p p e n d i c e s
- 436 -
STUDIES SUBJECTS INSTRUMENTS FINDINGS
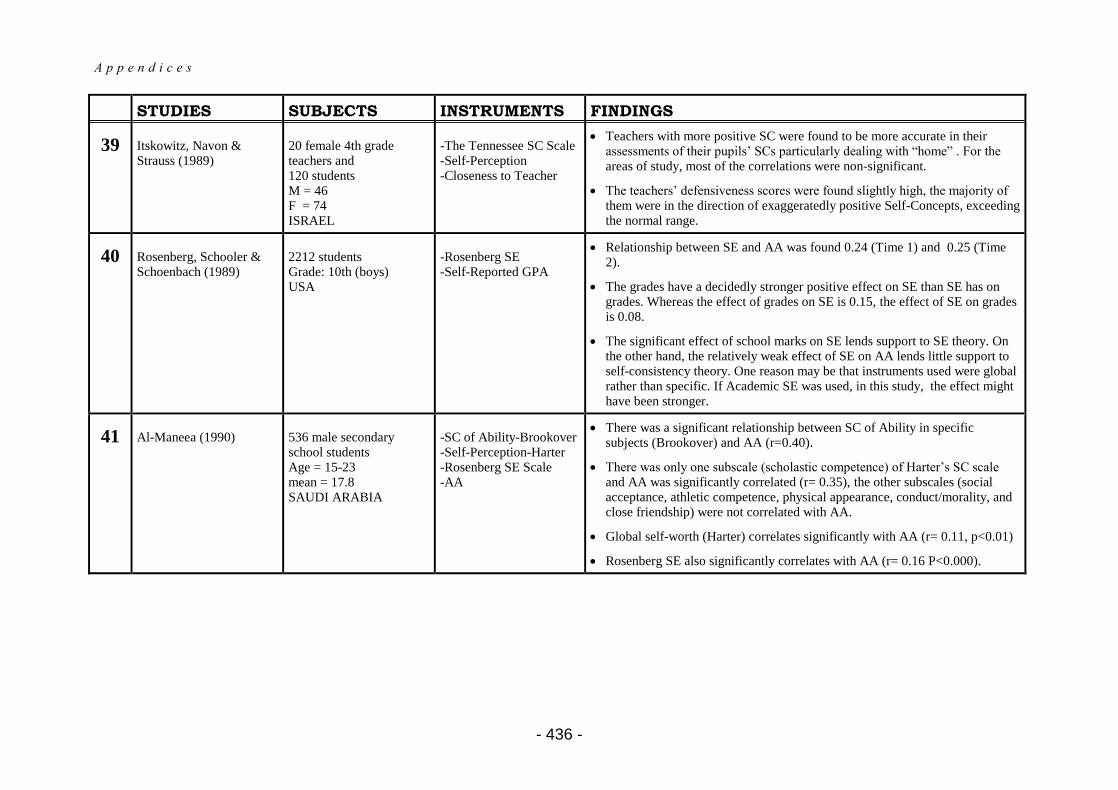
39 Itskowitz, Navon & Strauss (1989)
20 female 4th grade teachers and 120 students M = 46 F = 74 ISRAEL
-The Tennessee SC Scale -Self-Perception -Closeness to Teacher
Teachers with more positive SC were found to be more accurate in their assessments of their pupils’ SCs particularly dealing with “home” . For the areas of study, most of the correlations were non-significant.
The teachers’ defensiveness scores were found slightly high, the majority of them were in the direction of exaggeratedly positive Self-Concepts, exceeding the normal range.
40 Rosenberg, Schooler & Schoenbach (1989)
2212 students Grade: 10th (boys) USA
-Rosenberg SE -Self-Reported GPA
Relationship between SE and AA was found 0.24 (Time 1) and 0.25 (Time 2).
The grades have a decidedly stronger positive effect on SE than SE has on grades. Whereas the effect of grades on SE is 0.15, the effect of SE on grades is 0.08.
The significant effect of school marks on SE lends support to SE theory. On the other hand, the relatively weak effect of SE on AA lends little support to self-consistency theory. One reason may be that instruments used were global rather than specific. If Academic SE was used, in this study, the effect might have been stronger.
41 Al-Maneea (1990)
536 male secondary school students Age = 15-23 mean = 17.8 SAUDI ARABIA
-SC of Ability-Brookover -Self-Perception-Harter -Rosenberg SE Scale -AA
There was a significant relationship between SC of Ability in specific subjects (Brookover) and AA (r=0.40).
There was only one subscale (scholastic competence) of Harter’s SC scale and AA was significantly correlated (r= 0.35), the other subscales (social acceptance, athletic competence, physical appearance, conduct/morality, and close friendship) were not correlated with AA.
Global self-worth (Harter) correlates significantly with AA (r= 0.11, p<0.01)
Rosenberg SE also significantly correlates with AA (r= 0.16 P<0.000).
A p p e n d i c e s
- 437 -
STUDIES SUBJECTS INSTRUMENTS FINDINGS
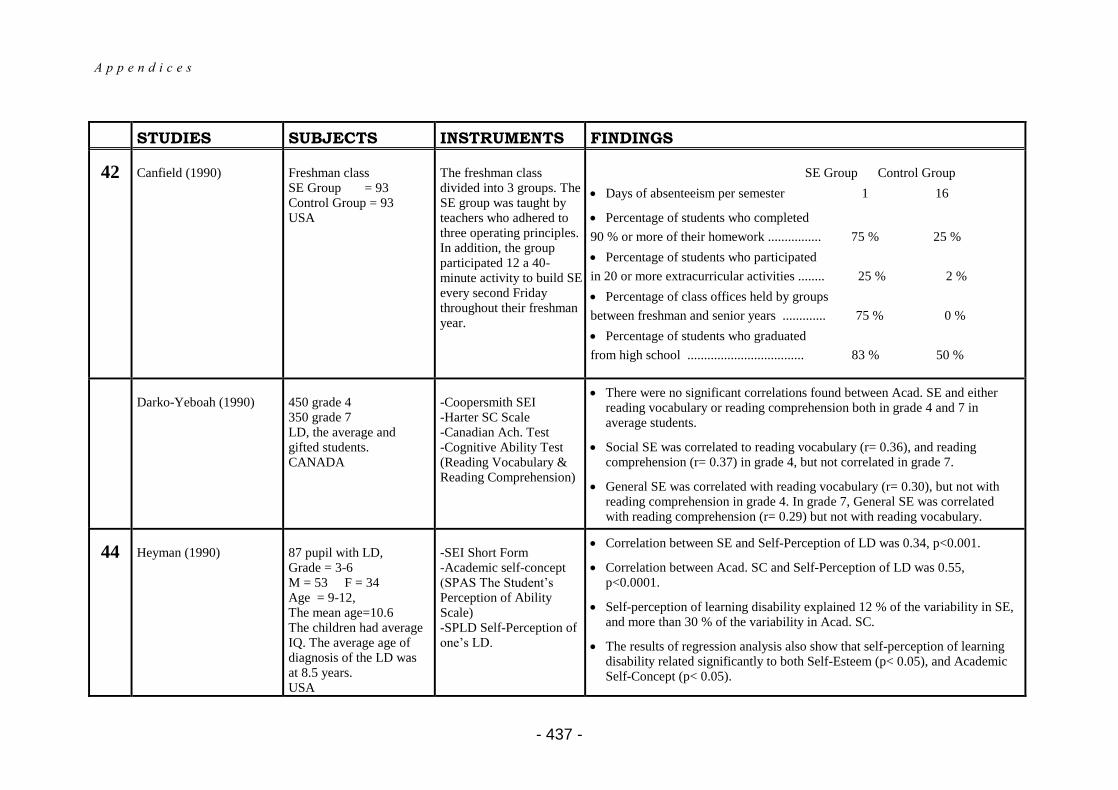
42 Canfield (1990)
Freshman class SE Group = 93 Control Group = 93 USA
The freshman class divided into 3 groups. The SE group was taught by teachers who adhered to three operating principles. In addition, the group participated 12 a 40-minute activity to build SE every second Friday throughout their freshman year.
SE Group Control Group
Days of absenteeism per semester 1 16
Percentage of students who completed
90 % or more of their homework ................ 75 % 25 %
Percentage of students who participated
in 20 or more extracurricular activities ........ 25 % 2 %
Percentage of class offices held by groups
between freshman and senior years ............. 75 % 0 %
Percentage of students who graduated
from high school ................................... 83 % 50 %
Darko-Yeboah (1990)
450 grade 4 350 grade 7 LD, the average and gifted students. CANADA
-Coopersmith SEI -Harter SC Scale -Canadian Ach. Test -Cognitive Ability Test (Reading Vocabulary & Reading Comprehension)
There were no significant correlations found between Acad. SE and either reading vocabulary or reading comprehension both in grade 4 and 7 in average students.
Social SE was correlated to reading vocabulary (r= 0.36), and reading comprehension (r= 0.37) in grade 4, but not correlated in grade 7.
General SE was correlated with reading vocabulary (r= 0.30), but not with reading comprehension in grade 4. In grade 7, General SE was correlated with reading comprehension (r= 0.29) but not with reading vocabulary.
44 Heyman (1990)
87 pupil with LD, Grade = 3-6 M = 53 F = 34 Age = 9-12, The mean age=10.6 The children had average IQ. The average age of diagnosis of the LD was at 8.5 years. USA
-SEI Short Form -Academic self-concept (SPAS The Student’s Perception of Ability Scale) -SPLD Self-Perception of one’s LD.
Correlation between SE and Self-Perception of LD was 0.34, p<0.001.
Correlation between Acad. SC and Self-Perception of LD was 0.55, p<0.0001.
Self-perception of learning disability explained 12 % of the variability in SE, and more than 30 % of the variability in Acad. SC.
The results of regression analysis also show that self-perception of learning disability related significantly to both Self-Esteem (p< 0.05), and Academic Self-Concept (p< 0.05).
A p p e n d i c e s
- 438 -
STUDIES SUBJECTS INSTRUMENTS FINDINGS
45 Hoge, Smit & Hanson (1990)
322 students M = 45 % F = 55 % Grade: 6-7 95 % of them white 2-year longitudinal study USA
-Rosenberg SE Scale -SC of Schoolwork Ability-General Scale -Specific SC (Maths., Language, Science, Social studies, PE) -Grades -Rating by teachers etc.
In all tests, school climate and evaluations by teachers had significant effect on SE.
The commitment to “Schoolwork” subscale of the Quality of School Life Scale appears to be one of the most important school factors predicting changes in SE.
It has a positive influence on changes in SE in 3 of the 4 equations.
Teacher evaluations of work habits have a positive impact on both global and academic SE in 7th grade.
The predictive power of grades on changes in the student’s SE in any discipline is very strong, and strongest of all in science. It is weakest in physical education. These findings contrast with the much weaker effect of the general measure of grades on global SE or academic SE. In the case of science we can say that grades are clearly the main determinant of SE in that discipline.
Another important school variable is the student’s rating of teachers in each discipline. For all disciplines (with the exception of language), a higher rating of the teacher in a subject area is associated with greater gains in SE in that subject area.
These results support other research in suggesting that teachers play a central role in generating high SE in their classroom.
46 La Graca & Stone (1990)
57 learning disabilities (LD) (M =3 8 F = 19) and 490 Non LD M = 233 F = 257) Grade: 4th-6th USA
-Harter Self-Perception Profile for Children -Peer Ratings and Peer Nominations -Revised Behaviour Problem Checklist
Group comparisons revealed that, relative to “low achievers” and “average to high achievers”, children with LD perceived themselves as lower in social acceptance (p< 0.03), and global self-worth (p< 0.001).
The Low Achievers and Average to High Achievers groups did not differ in their self-perceptions.
Relative to children in the “low achievers” and the “average to high achievers” groups, children with LD received significantly lower ratings of peer acceptance (p< 0.02) and fewer positive nominations (p< 0.001). The “low achievers” and the “average to high achievers” groups did not significantly differ.
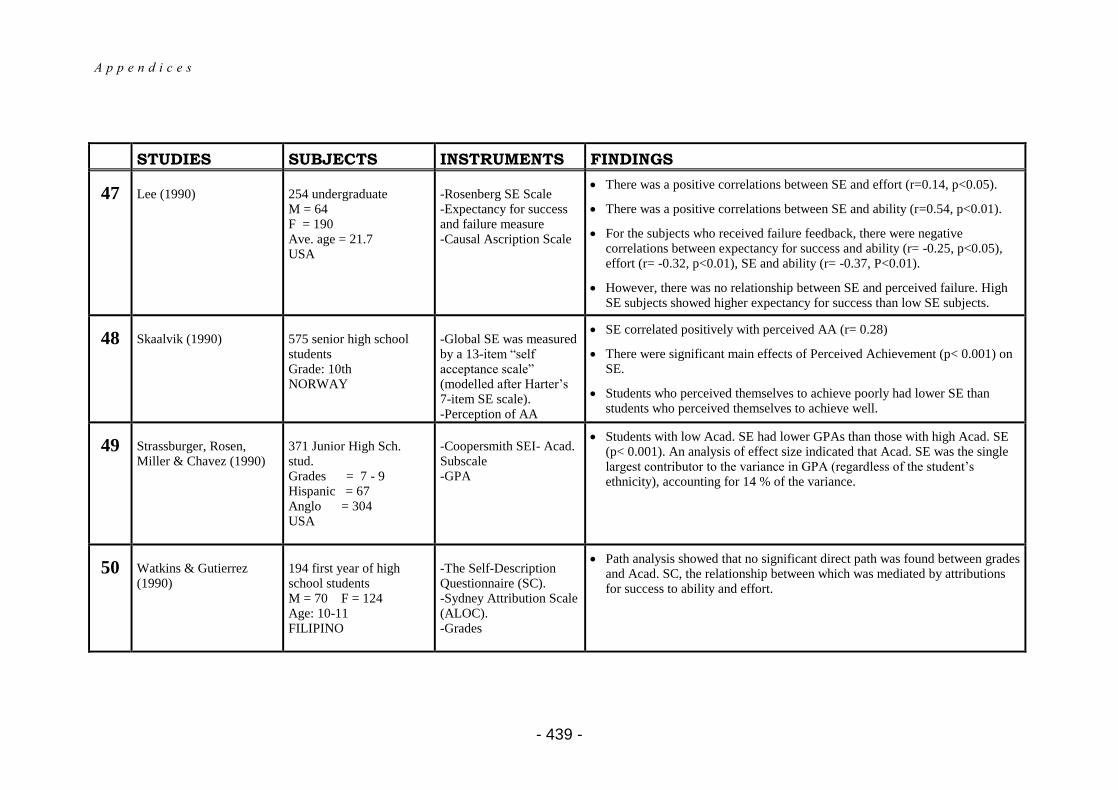
A p p e n d i c e s
- 439 -
STUDIES SUBJECTS INSTRUMENTS FINDINGS
47 Lee (1990)
254 undergraduate M = 64 F = 190 Ave. age = 21.7 USA
-Rosenberg SE Scale -Expectancy for success and failure measure -Causal Ascription Scale
There was a positive correlations between SE and effort (r=0.14, p<0.05).
There was a positive correlations between SE and ability (r=0.54, p<0.01).
For the subjects who received failure feedback, there were negative correlations between expectancy for success and ability (r= -0.25, p<0.05), effort (r= -0.32, p<0.01), SE and ability (r= -0.37, P<0.01).
However, there was no relationship between SE and perceived failure. High SE subjects showed higher expectancy for success than low SE subjects.
48 Skaalvik (1990)
575 senior high school students Grade: 10th NORWAY
-Global SE was measured by a 13-item “self acceptance scale” (modelled after Harter’s 7-item SE scale). -Perception of AA
SE correlated positively with perceived AA (r= 0.28)
There were significant main effects of Perceived Achievement (p< 0.001) on SE.
Students who perceived themselves to achieve poorly had lower SE than students who perceived themselves to achieve well.
49 Strassburger, Rosen, Miller & Chavez (1990)
371 Junior High Sch. stud. Grades = 7 - 9 Hispanic = 67 Anglo = 304 USA
-Coopersmith SEI- Acad. Subscale -GPA
Students with low Acad. SE had lower GPAs than those with high Acad. SE (p< 0.001). An analysis of effect size indicated that Acad. SE was the single largest contributor to the variance in GPA (regardless of the student’s ethnicity), accounting for 14 % of the variance.
50 Watkins & Gutierrez (1990)
194 first year of high school students M = 70 F = 124 Age: 10-11 FILIPINO
-The Self-Description Questionnaire (SC). -Sydney Attribution Scale (ALOC). -Grades
Path analysis showed that no significant direct path was found between grades and Acad. SC, the relationship between which was mediated by attributions for success to ability and effort.
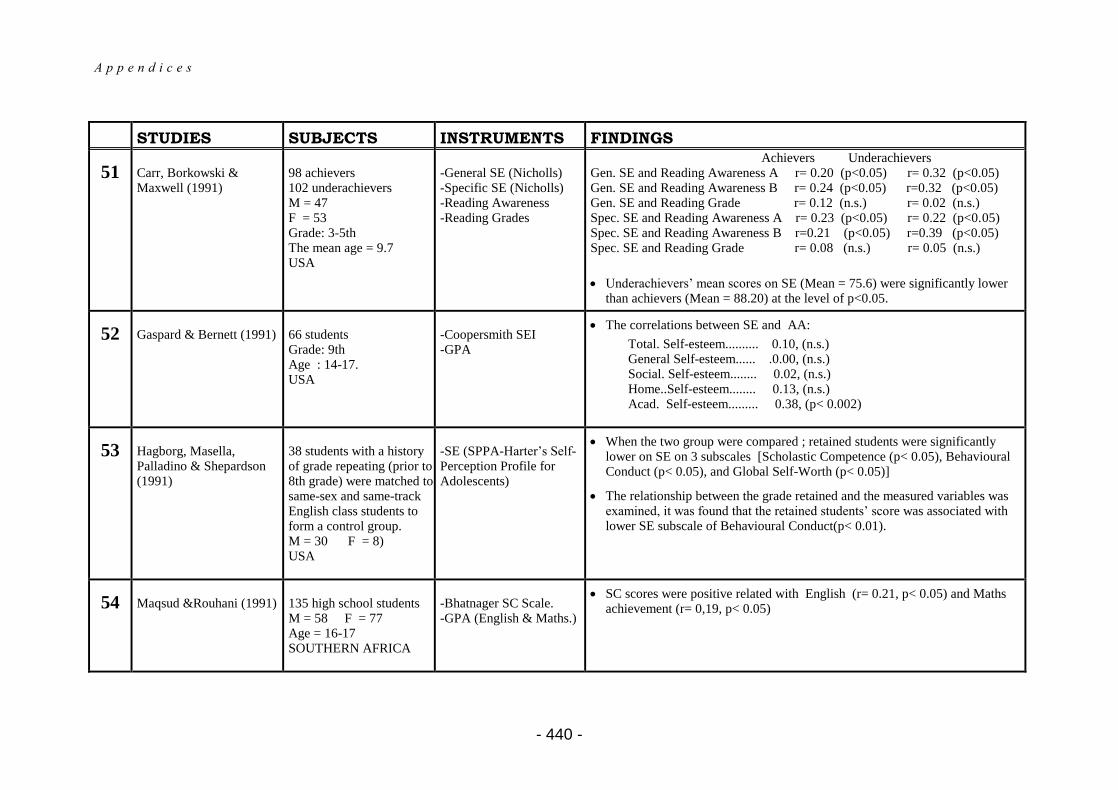
A p p e n d i c e s
- 440 -
STUDIES SUBJECTS INSTRUMENTS FINDINGS
51 Carr, Borkowski & Maxwell (1991)
98 achievers 102 underachievers M = 47 F = 53 Grade: 3-5th The mean age = 9.7 USA
-General SE (Nicholls) -Specific SE (Nicholls) -Reading Awareness -Reading Grades
Achievers Underachievers Gen. SE and Reading Awareness A r= 0.20 (p<0.05) r= 0.32 (p<0.05) Gen. SE and Reading Awareness B r= 0.24 (p<0.05) r=0.32 (p<0.05) Gen. SE and Reading Grade r= 0.12 (n.s.) r= 0.02 (n.s.) Spec. SE and Reading Awareness A r= 0.23 (p<0.05) r= 0.22 (p<0.05) Spec. SE and Reading Awareness B r=0.21 (p<0.05) r=0.39 (p<0.05) Spec. SE and Reading Grade r= 0.08 (n.s.) r= 0.05 (n.s.)
Underachievers’ mean scores on SE (Mean = 75.6) were significantly lower than achievers (Mean = 88.20) at the level of p<0.05.
52 Gaspard & Bernett (1991)
66 students Grade: 9th Age : 14-17. USA
-Coopersmith SEI -GPA
The correlations between SE and AA:
Total. Self-esteem.......... 0.10, (n.s.) General Self-esteem...... .0.00, (n.s.) Social. Self-esteem........ 0.02, (n.s.) Home..Self-esteem........ 0.13, (n.s.) Acad. Self-esteem......... 0.38, (p< 0.002)
53 Hagborg, Masella, Palladino & Shepardson (1991)
38 students with a history of grade repeating (prior to 8th grade) were matched to same-sex and same-track English class students to form a control group. M = 30 F = 8) USA
-SE (SPPA-Harter’s Self-Perception Profile for Adolescents)
When the two group were compared ; retained students were significantly lower on SE on 3 subscales [Scholastic Competence (p< 0.05), Behavioural Conduct (p< 0.05), and Global Self-Worth (p< 0.05)]
The relationship between the grade retained and the measured variables was examined, it was found that the retained students’ score was associated with lower SE subscale of Behavioural Conduct(p< 0.01).
54 Maqsud &Rouhani (1991)
135 high school students M = 58 F = 77 Age = 16-17 SOUTHERN AFRICA
-Bhatnager SC Scale. -GPA (English & Maths.)
SC scores were positive related with English (r= 0.21, p< 0.05) and Maths achievement (r= 0,19, p< 0.05)
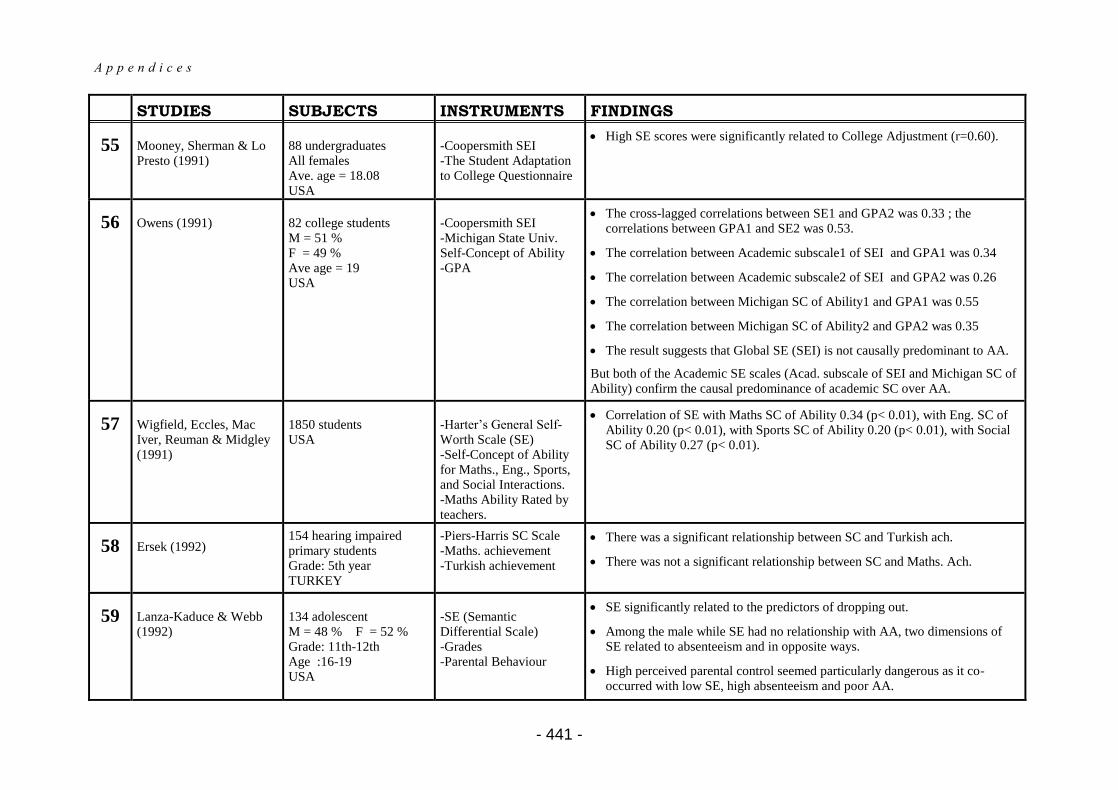
A p p e n d i c e s
- 441 -
STUDIES SUBJECTS INSTRUMENTS FINDINGS
55 Mooney, Sherman & Lo Presto (1991)
88 undergraduates All females Ave. age = 18.08 USA
-Coopersmith SEI -The Student Adaptation to College Questionnaire
High SE scores were significantly related to College Adjustment (r=0.60).
56 Owens (1991)
82 college students M = 51 % F = 49 % Ave age = 19 USA
-Coopersmith SEI -Michigan State Univ. Self-Concept of Ability -GPA
The cross-lagged correlations between SE1 and GPA2 was 0.33 ; the correlations between GPA1 and SE2 was 0.53.
The correlation between Academic subscale1 of SEI and GPA1 was 0.34
The correlation between Academic subscale2 of SEI and GPA2 was 0.26
The correlation between Michigan SC of Ability1 and GPA1 was 0.55
The correlation between Michigan SC of Ability2 and GPA2 was 0.35
The result suggests that Global SE (SEI) is not causally predominant to AA.
But both of the Academic SE scales (Acad. subscale of SEI and Michigan SC of Ability) confirm the causal predominance of academic SC over AA.
57 Wigfield, Eccles, Mac Iver, Reuman & Midgley (1991)
1850 students USA
-Harter’s General Self-Worth Scale (SE) -Self-Concept of Ability for Maths., Eng., Sports, and Social Interactions. -Maths Ability Rated by teachers.
Correlation of SE with Maths SC of Ability 0.34 (p< 0.01), with Eng. SC of Ability 0.20 (p< 0.01), with Sports SC of Ability 0.20 (p< 0.01), with Social SC of Ability 0.27 (p< 0.01).
58 Ersek (1992)
154 hearing impaired primary students Grade: 5th year TURKEY
-Piers-Harris SC Scale -Maths. achievement -Turkish achievement
There was a significant relationship between SC and Turkish ach.
There was not a significant relationship between SC and Maths. Ach.
59 Lanza-Kaduce & Webb (1992)
134 adolescent M = 48 % F = 52 % Grade: 11th-12th Age :16-19 USA
-SE (Semantic Differential Scale) -Grades -Parental Behaviour
SE significantly related to the predictors of dropping out.
Among the male while SE had no relationship with AA, two dimensions of SE related to absenteeism and in opposite ways.
High perceived parental control seemed particularly dangerous as it co-occurred with low SE, high absenteeism and poor AA.
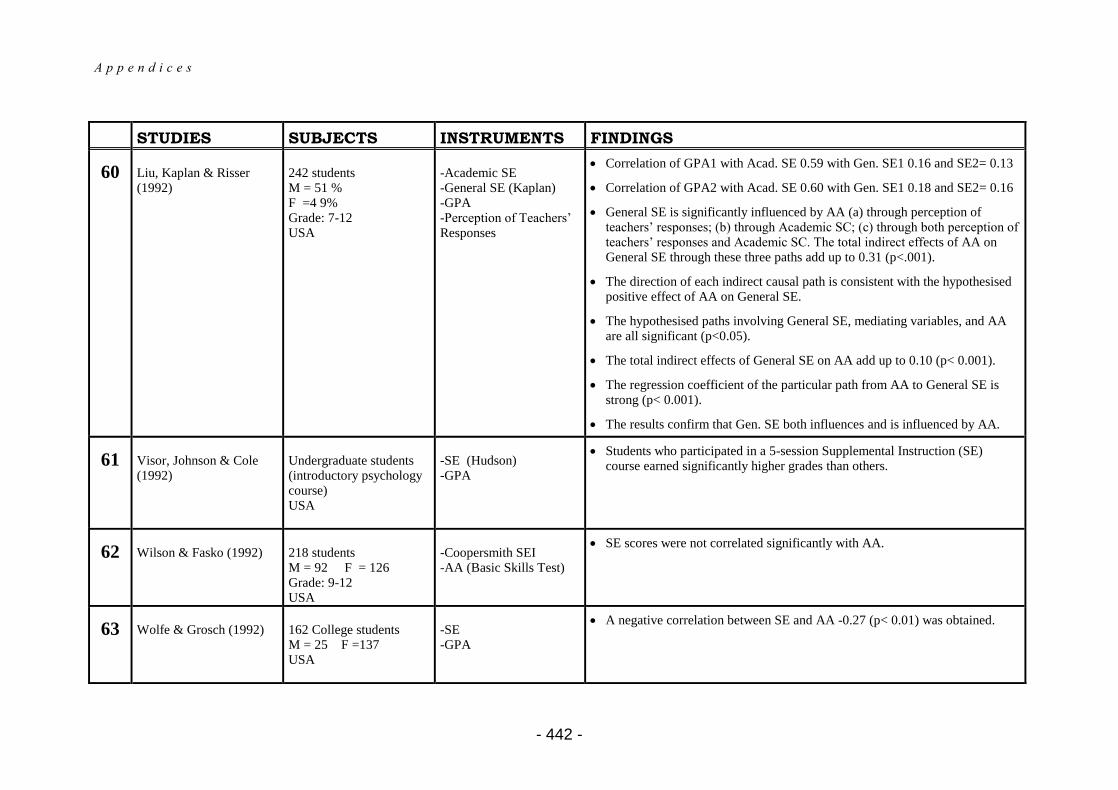
A p p e n d i c e s
- 442 -
STUDIES SUBJECTS INSTRUMENTS FINDINGS
60 Liu, Kaplan & Risser (1992)
242 students M = 51 % F =4 9% Grade: 7-12 USA
-Academic SE -General SE (Kaplan) -GPA -Perception of Teachers’ Responses
Correlation of GPA1 with Acad. SE 0.59 with Gen. SE1 0.16 and SE2= 0.13
Correlation of GPA2 with Acad. SE 0.60 with Gen. SE1 0.18 and SE2= 0.16
General SE is significantly influenced by AA (a) through perception of teachers’ responses; (b) through Academic SC; (c) through both perception of teachers’ responses and Academic SC. The total indirect effects of AA on General SE through these three paths add up to 0.31 (p<.001).
The direction of each indirect causal path is consistent with the hypothesised positive effect of AA on General SE.
The hypothesised paths involving General SE, mediating variables, and AA are all significant (p<0.05).
The total indirect effects of General SE on AA add up to 0.10 (p< 0.001).
The regression coefficient of the particular path from AA to General SE is strong (p< 0.001).
The results confirm that Gen. SE both influences and is influenced by AA.
61 Visor, Johnson & Cole (1992)
Undergraduate students (introductory psychology course) USA
-SE (Hudson) -GPA
Students who participated in a 5-session Supplemental Instruction (SE) course earned significantly higher grades than others.
62 Wilson & Fasko (1992)
218 students M = 92 F = 126 Grade: 9-12 USA
-Coopersmith SEI -AA (Basic Skills Test)
SE scores were not correlated significantly with AA.
63 Wolfe & Grosch (1992)
162 College students M = 25 F =137 USA
-SE -GPA
A negative correlation between SE and AA -0.27 (p< 0.01) was obtained.
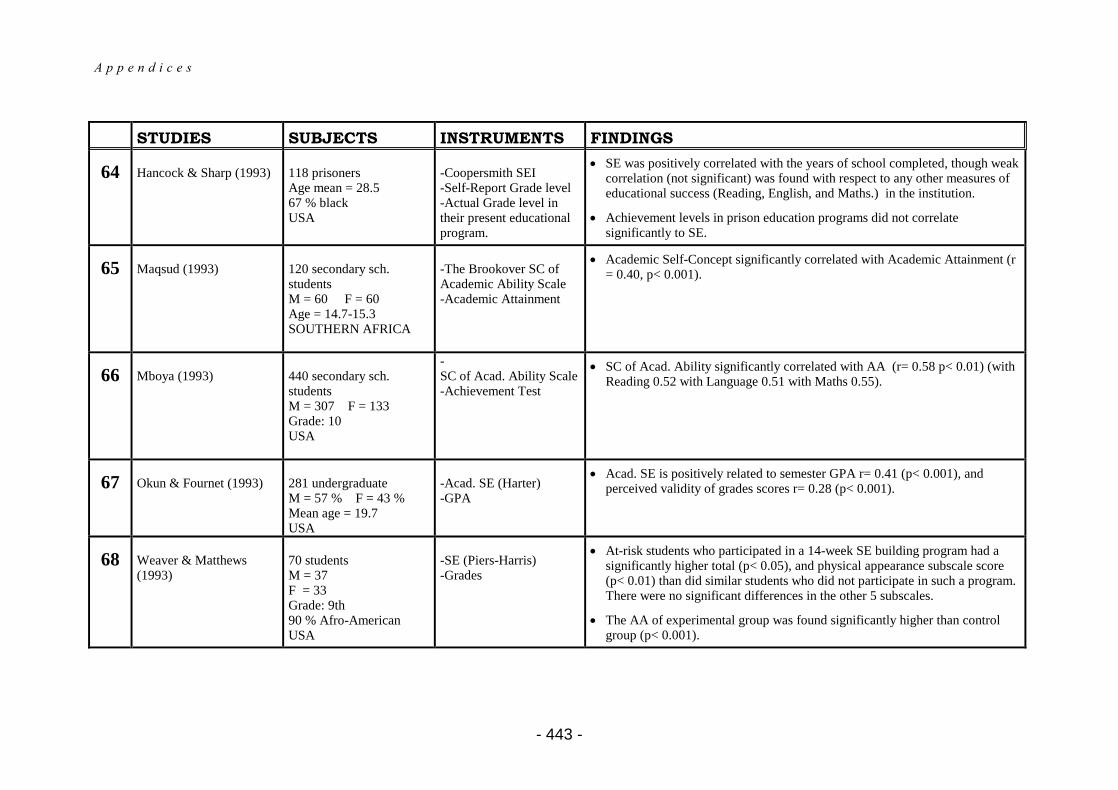
A p p e n d i c e s
- 443 -
STUDIES SUBJECTS INSTRUMENTS FINDINGS
64 Hancock & Sharp (1993)
118 prisoners Age mean = 28.5 67 % black USA
-Coopersmith SEI -Self-Report Grade level -Actual Grade level in their present educational program.
SE was positively correlated with the years of school completed, though weak correlation (not significant) was found with respect to any other measures of educational success (Reading, English, and Maths.) in the institution.
Achievement levels in prison education programs did not correlate significantly to SE.
65 Maqsud (1993)
120 secondary sch. students M = 60 F = 60 Age = 14.7-15.3 SOUTHERN AFRICA
-The Brookover SC of Academic Ability Scale -Academic Attainment
Academic Self-Concept significantly correlated with Academic Attainment (r = 0.40, p< 0.001).
66 Mboya (1993)
440 secondary sch. students M = 307 F = 133 Grade: 10 USA
- SC of Acad. Ability Scale -Achievement Test
SC of Acad. Ability significantly correlated with AA (r= 0.58 p< 0.01) (with Reading 0.52 with Language 0.51 with Maths 0.55).
67 Okun & Fournet (1993)
281 undergraduate M = 57 % F = 43 % Mean age = 19.7 USA
-Acad. SE (Harter) -GPA
Acad. SE is positively related to semester GPA r= 0.41 (p< 0.001), and perceived validity of grades scores r= 0.28 (p< 0.001).
68 Weaver & Matthews (1993)
70 students M = 37 F = 33 Grade: 9th 90 % Afro-American USA
-SE (Piers-Harris) -Grades
At-risk students who participated in a 14-week SE building program had a significantly higher total (p< 0.05), and physical appearance subscale score (p< 0.01) than did similar students who did not participate in such a program. There were no significant differences in the other 5 subscales.
The AA of experimental group was found significantly higher than control group (p< 0.001).
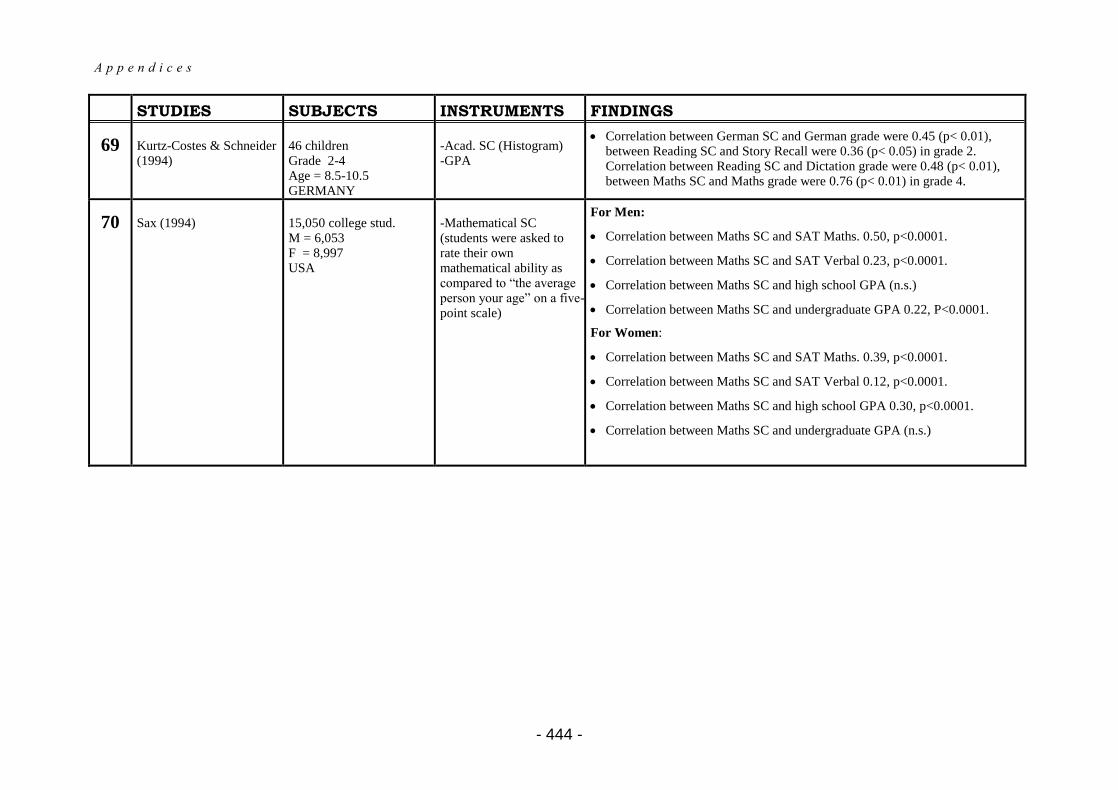
A p p e n d i c e s
- 444 -
STUDIES SUBJECTS INSTRUMENTS FINDINGS
69 Kurtz-Costes & Schneider (1994)
46 children Grade 2-4 Age = 8.5-10.5 GERMANY
-Acad. SC (Histogram) -GPA
Correlation between German SC and German grade were 0.45 (p< 0.01), between Reading SC and Story Recall were 0.36 (p< 0.05) in grade 2. Correlation between Reading SC and Dictation grade were 0.48 (p< 0.01), between Maths SC and Maths grade were 0.76 (p< 0.01) in grade 4.
70 Sax (1994)
15,050 college stud. M = 6,053 F = 8,997 USA
-Mathematical SC (students were asked to rate their own mathematical ability as compared to “the average person your age” on a five-point scale)
For Men:
Correlation between Maths SC and SAT Maths. 0.50, p<0.0001.
Correlation between Maths SC and SAT Verbal 0.23, p<0.0001.
Correlation between Maths SC and high school GPA (n.s.)
Correlation between Maths SC and undergraduate GPA 0.22, P<0.0001.
For Women:
Correlation between Maths SC and SAT Maths. 0.39, p<0.0001.
Correlation between Maths SC and SAT Verbal 0.12, p<0.0001.
Correlation between Maths SC and high school GPA 0.30, p<0.0001.
Correlation between Maths SC and undergraduate GPA (n.s.)
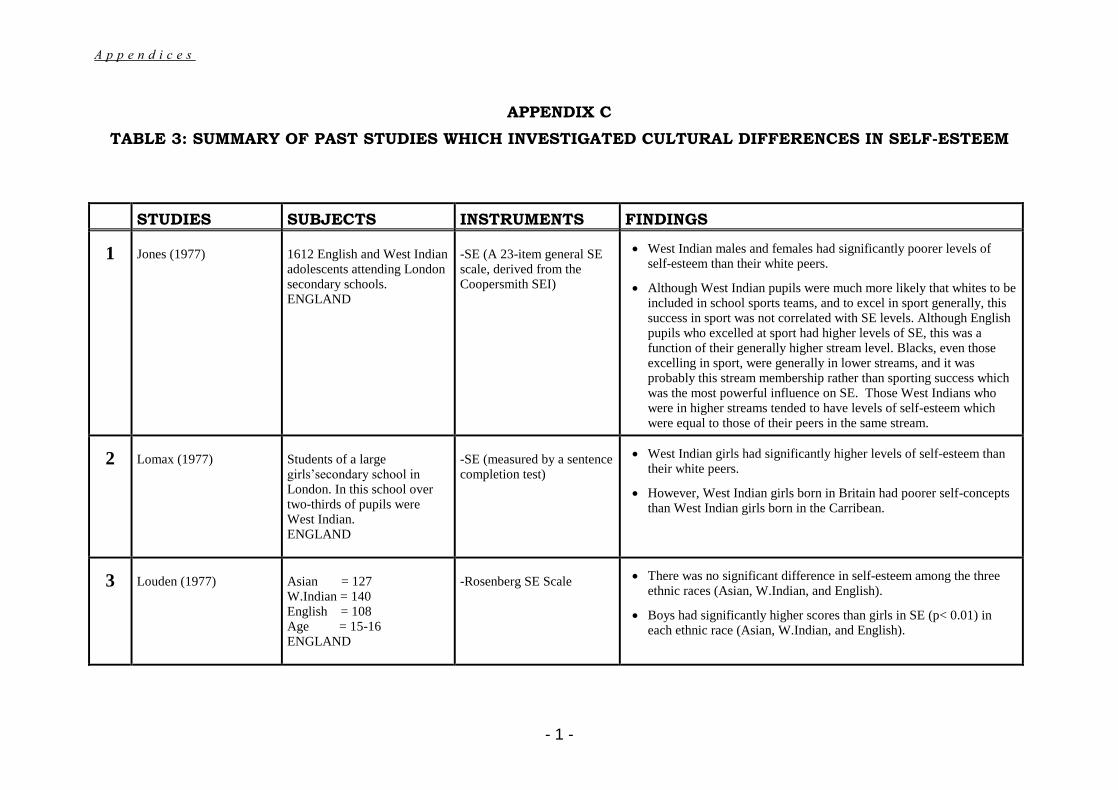
A p p e n d i c e s
- 1 -
APPENDIX C
TABLE 3: SUMMARY OF PAST STUDIES WHICH INVESTIGATED CULTURAL DIFFERENCES IN SELF-ESTEEM
STUDIES SUBJECTS INSTRUMENTS FINDINGS
1 Jones (1977)
1612 English and West Indian adolescents attending London secondary schools. ENGLAND
-SE (A 23-item general SE scale, derived from the Coopersmith SEI)
West Indian males and females had significantly poorer levels of self-esteem than their white peers.
Although West Indian pupils were much more likely that whites to be included in school sports teams, and to excel in sport generally, this success in sport was not correlated with SE levels. Although English pupils who excelled at sport had higher levels of SE, this was a function of their generally higher stream level. Blacks, even those excelling in sport, were generally in lower streams, and it was probably this stream membership rather than sporting success which was the most powerful influence on SE. Those West Indians who were in higher streams tended to have levels of self-esteem which were equal to those of their peers in the same stream.
2 Lomax (1977)
Students of a large girls’secondary school in London. In this school over two-thirds of pupils were West Indian. ENGLAND
-SE (measured by a sentence completion test)
West Indian girls had significantly higher levels of self-esteem than their white peers.
However, West Indian girls born in Britain had poorer self-concepts than West Indian girls born in the Carribean.
3 Louden (1977)
Asian = 127 W.Indian = 140 English = 108 Age = 15-16 ENGLAND
-Rosenberg SE Scale
There was no significant difference in self-esteem among the three ethnic races (Asian, W.Indian, and English).
Boys had significantly higher scores than girls in SE (p< 0.01) in each ethnic race (Asian, W.Indian, and English).
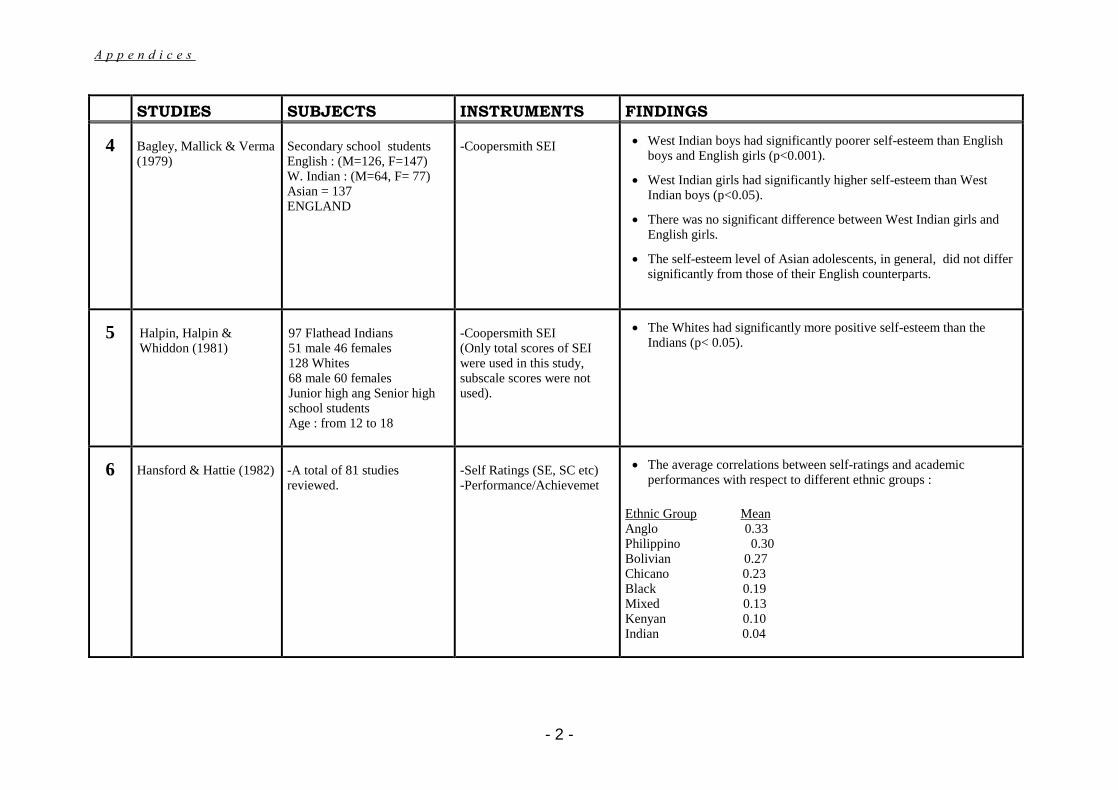
A p p e n d i c e s
- 2 -
STUDIES SUBJECTS INSTRUMENTS FINDINGS
4 Bagley, Mallick & Verma (1979)
Secondary school students English : (M=126, F=147) W. Indian : (M=64, F= 77) Asian = 137 ENGLAND
-Coopersmith SEI West Indian boys had significantly poorer self-esteem than English
boys and English girls (p<0.001).
West Indian girls had significantly higher self-esteem than West Indian boys (p<0.05).
There was no significant difference between West Indian girls and English girls.
The self-esteem level of Asian adolescents, in general, did not differ significantly from those of their English counterparts.
5 Halpin, Halpin & Whiddon (1981)
97 Flathead Indians 51 male 46 females 128 Whites 68 male 60 females Junior high ang Senior high school students Age : from 12 to 18
-Coopersmith SEI (Only total scores of SEI were used in this study, subscale scores were not used).
The Whites had significantly more positive self-esteem than the Indians (p< 0.05).
6 Hansford & Hattie (1982)
-A total of 81 studies reviewed.
-Self Ratings (SE, SC etc) -Performance/Achievemet
The average correlations between self-ratings and academic performances with respect to different ethnic groups :
Ethnic Group Mean Anglo 0.33 Philippino 0.30 Bolivian 0.27 Chicano 0.23 Black 0.19 Mixed 0.13 Kenyan 0.10 Indian 0.04

A p p e n d i c e s
- 3 -
STUDIES SUBJECTS INSTRUMENTS FINDINGS
7 Bond & Cheung (1983)
633 undergraduates Hong Kong = M=63, F=74 American = M=81, F=88 Japanese = M=185, F=142
-SC (students were asked to to write 20 answers for the question of “Who am I?” in the blanks. -The answers were categorised as follow : 1. Self 2. Social 3. Choice 4. Aspiration 5. Gen. Psych. Attribute 6. Personal Facts 7. Role
Of the seven category variables tested, six (Self, Social, Choice, Aspiration, Gen. Psych. Attribute, and Personal Facts) showed cultural effects at beyond the p<0.01 level.
There were no significant cultural effects for the Role category.
The Japanese use of categories was different from the American and Chinese who showed similar levels of category frequency. This characterization of the data was found for five of the six differences.
Except Social category there were no significant differences between American and Chinese (Hong Kong) subjects. For this category, American and Japanese subjects differ significantly from the Chinese students.
Japanese students differ significantly from Chinese students for all six categories. They also differ significantly from American students for five categories. No difference was obtained for Social category between them.
There were no significant differences between the sexes on any of the seven variables nor were there any interactions between sex and culture.
8 Hirsh & Rapkin (1987)
159 junior high school students M= 73 F=83 White = 117 Black = 42 USA
-Rosenberg SE Scale Although there were no significant race differences on overall self-
esteem between blacks and whites, multivariate analyses of symptom data revealed that blacks reported greater distrust of the environment than they reported negative internal states, whereas whites reported the opposite pattern.
9 Verkuyten (1989)
Dutch = 48 Turkish Minorities = 94 Age = 9-13 NETHERLAND
-The Piers-Harris SC Scale
Results indicated no significant difference between the Dutch and the Turkish children for global self-esteem.
There were also no differences for “behaviour”, “physical appearance and attributes”, “popularity”, or “happiness and satisfaction” components of self-esteem
The Turkish children, however, were significantly more anxious (p<0.05), but had a significantly higher score for “intellectual and school status” (p<0.05).
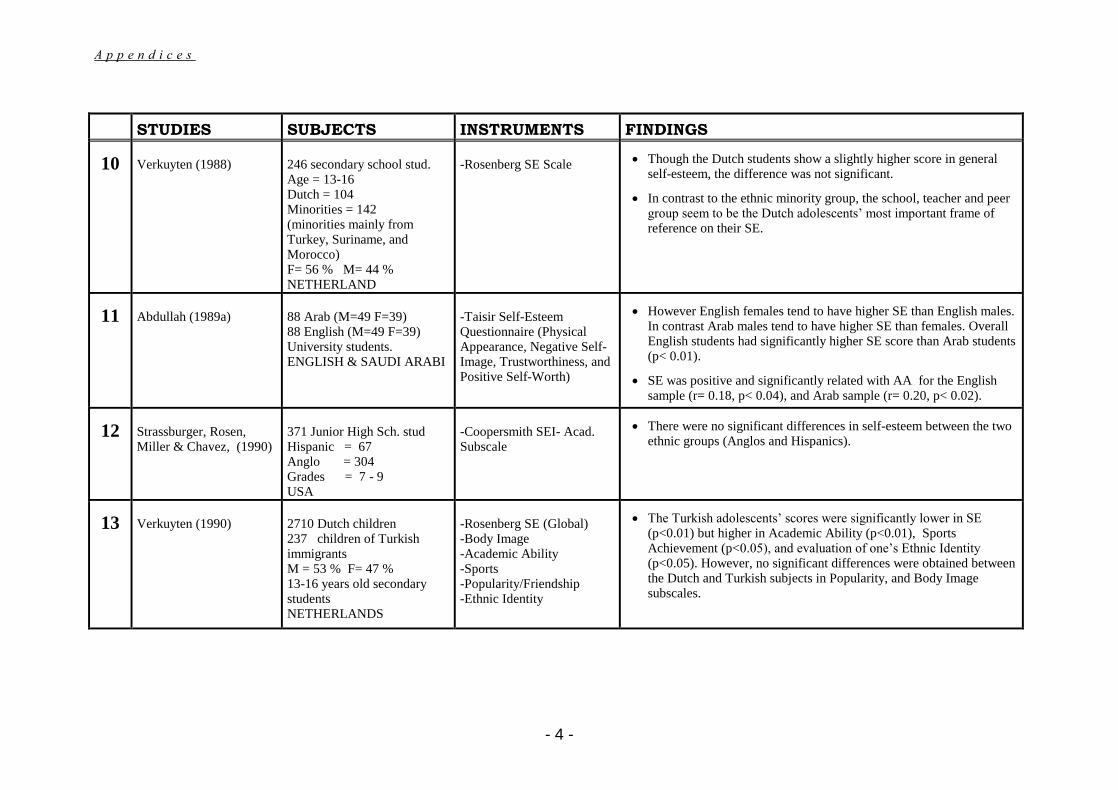
A p p e n d i c e s
- 4 -
STUDIES SUBJECTS INSTRUMENTS FINDINGS
10 Verkuyten (1988)
246 secondary school stud. Age = 13-16 Dutch = 104 Minorities = 142 (minorities mainly from Turkey, Suriname, and Morocco) F= 56 % M= 44 % NETHERLAND
-Rosenberg SE Scale Though the Dutch students show a slightly higher score in general
self-esteem, the difference was not significant.
In contrast to the ethnic minority group, the school, teacher and peer group seem to be the Dutch adolescents’ most important frame of reference on their SE.
11 Abdullah (1989a)
88 Arab (M=49 F=39) 88 English (M=49 F=39) University students. ENGLISH & SAUDI ARABI
-Taisir Self-Esteem Questionnaire (Physical Appearance, Negative Self-Image, Trustworthiness, and Positive Self-Worth)
However English females tend to have higher SE than English males. In contrast Arab males tend to have higher SE than females. Overall English students had significantly higher SE score than Arab students (p< 0.01).
SE was positive and significantly related with AA for the English sample (r= 0.18, p< 0.04), and Arab sample (r= 0.20, p< 0.02).
12 Strassburger, Rosen, Miller & Chavez, (1990)
371 Junior High Sch. stud Hispanic = 67 Anglo = 304 Grades = 7 - 9 USA
-Coopersmith SEI- Acad. Subscale
There were no significant differences in self-esteem between the two ethnic groups (Anglos and Hispanics).
13 Verkuyten (1990)
2710 Dutch children 237 children of Turkish immigrants M = 53 % F= 47 % 13-16 years old secondary students NETHERLANDS
-Rosenberg SE (Global) -Body Image -Academic Ability -Sports -Popularity/Friendship -Ethnic Identity
The Turkish adolescents’ scores were significantly lower in SE (p<0.01) but higher in Academic Ability (p<0.01), Sports Achievement (p<0.05), and evaluation of one’s Ethnic Identity (p<0.05). However, no significant differences were obtained between the Dutch and Turkish subjects in Popularity, and Body Image subscales.
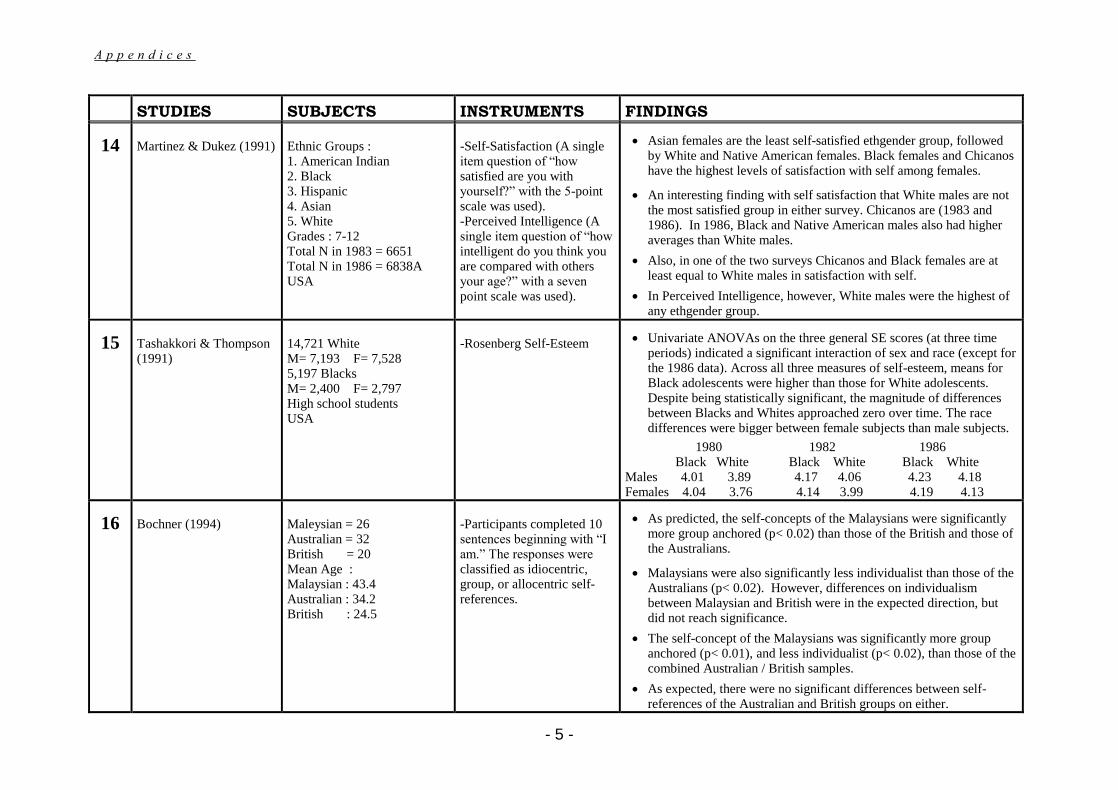
A p p e n d i c e s
- 5 -
STUDIES SUBJECTS INSTRUMENTS FINDINGS
14 Martinez & Dukez (1991)
Ethnic Groups : 1. American Indian 2. Black 3. Hispanic 4. Asian 5. White Grades : 7-12 Total N in 1983 = 6651 Total N in 1986 = 6838A USA
-Self-Satisfaction (A single item question of “how satisfied are you with yourself?” with the 5-point scale was used). -Perceived Intelligence (A single item question of “how intelligent do you think you are compared with others your age?” with a seven point scale was used).
Asian females are the least self-satisfied ethgender group, followed by White and Native American females. Black females and Chicanos have the highest levels of satisfaction with self among females.
An interesting finding with self satisfaction that White males are not the most satisfied group in either survey. Chicanos are (1983 and 1986). In 1986, Black and Native American males also had higher averages than White males.
Also, in one of the two surveys Chicanos and Black females are at least equal to White males in satisfaction with self.
In Perceived Intelligence, however, White males were the highest of any ethgender group.
15 Tashakkori & Thompson (1991)
14,721 White M= 7,193 F= 7,528 5,197 Blacks M= 2,400 F= 2,797 High school students USA
-Rosenberg Self-Esteem Univariate ANOVAs on the three general SE scores (at three time
periods) indicated a significant interaction of sex and race (except for the 1986 data). Across all three measures of self-esteem, means for Black adolescents were higher than those for White adolescents. Despite being statistically significant, the magnitude of differences between Blacks and Whites approached zero over time. The race differences were bigger between female subjects than male subjects.
1980 1982 1986 Black White Black White Black White Males 4.01 3.89 4.17 4.06 4.23 4.18 Females 4.04 3.76 4.14 3.99 4.19 4.13
16 Bochner (1994)
Maleysian = 26 Australian = 32 British = 20 Mean Age : Malaysian : 43.4 Australian : 34.2 British : 24.5
-Participants completed 10 sentences beginning with “I am.” The responses were classified as idiocentric, group, or allocentric self-references.
As predicted, the self-concepts of the Malaysians were significantly more group anchored (p< 0.02) than those of the British and those of the Australians.
Malaysians were also significantly less individualist than those of the Australians (p< 0.02). However, differences on individualism between Malaysian and British were in the expected direction, but did not reach significance.
The self-concept of the Malaysians was significantly more group anchored (p< 0.01), and less individualist (p< 0.02), than those of the combined Australian / British samples.
As expected, there were no significant differences between self-references of the Australian and British groups on either.
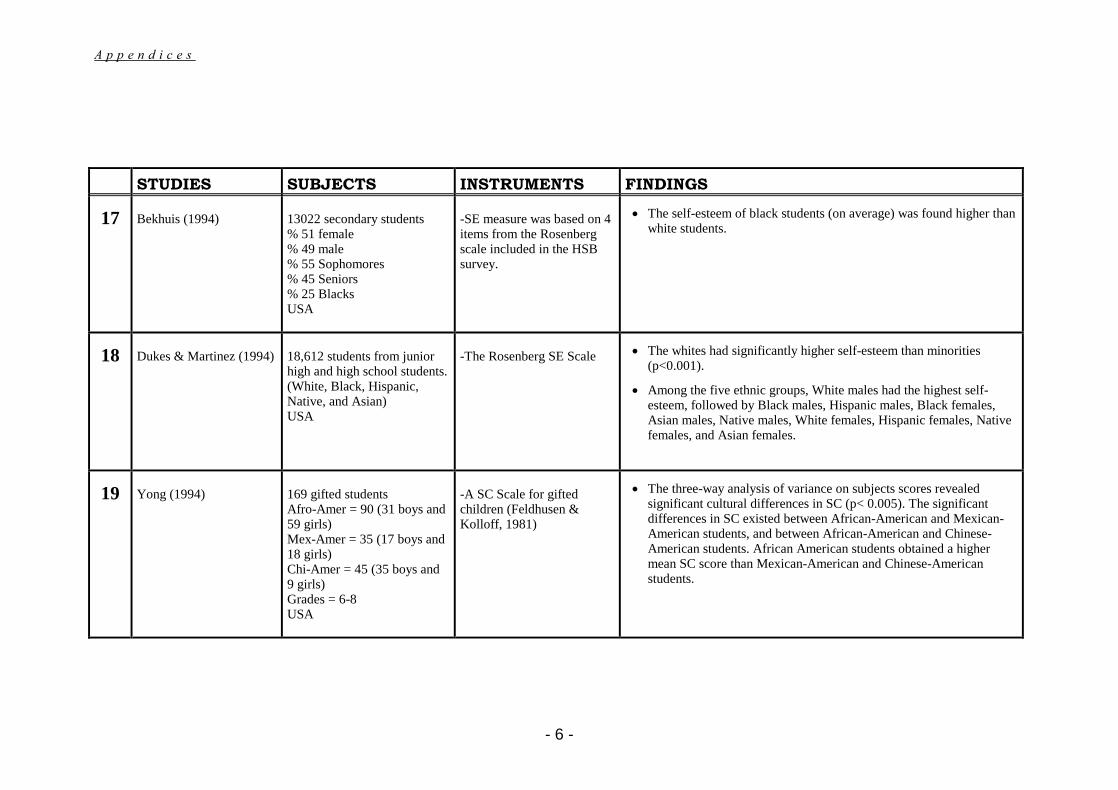
A p p e n d i c e s
- 6 -
STUDIES SUBJECTS INSTRUMENTS FINDINGS
17 Bekhuis (1994)
13022 secondary students % 51 female % 49 male % 55 Sophomores % 45 Seniors % 25 Blacks USA
-SE measure was based on 4 items from the Rosenberg scale included in the HSB survey.
The self-esteem of black students (on average) was found higher than white students.
18 Dukes & Martinez (1994)
18,612 students from junior high and high school students. (White, Black, Hispanic, Native, and Asian) USA
-The Rosenberg SE Scale The whites had significantly higher self-esteem than minorities
(p<0.001).
Among the five ethnic groups, White males had the highest self-esteem, followed by Black males, Hispanic males, Black females, Asian males, Native males, White females, Hispanic females, Native females, and Asian females.
19 Yong (1994)
169 gifted students Afro-Amer = 90 (31 boys and 59 girls) Mex-Amer = 35 (17 boys and 18 girls) Chi-Amer = 45 (35 boys and 9 girls) Grades = 6-8 USA
-A SC Scale for gifted children (Feldhusen & Kolloff, 1981)
The three-way analysis of variance on subjects scores revealed significant cultural differences in SC (p< 0.005). The significant differences in SC existed between African-American and Mexican-American students, and between African-American and Chinese-American students. African American students obtained a higher mean SC score than Mexican-American and Chinese-American students.
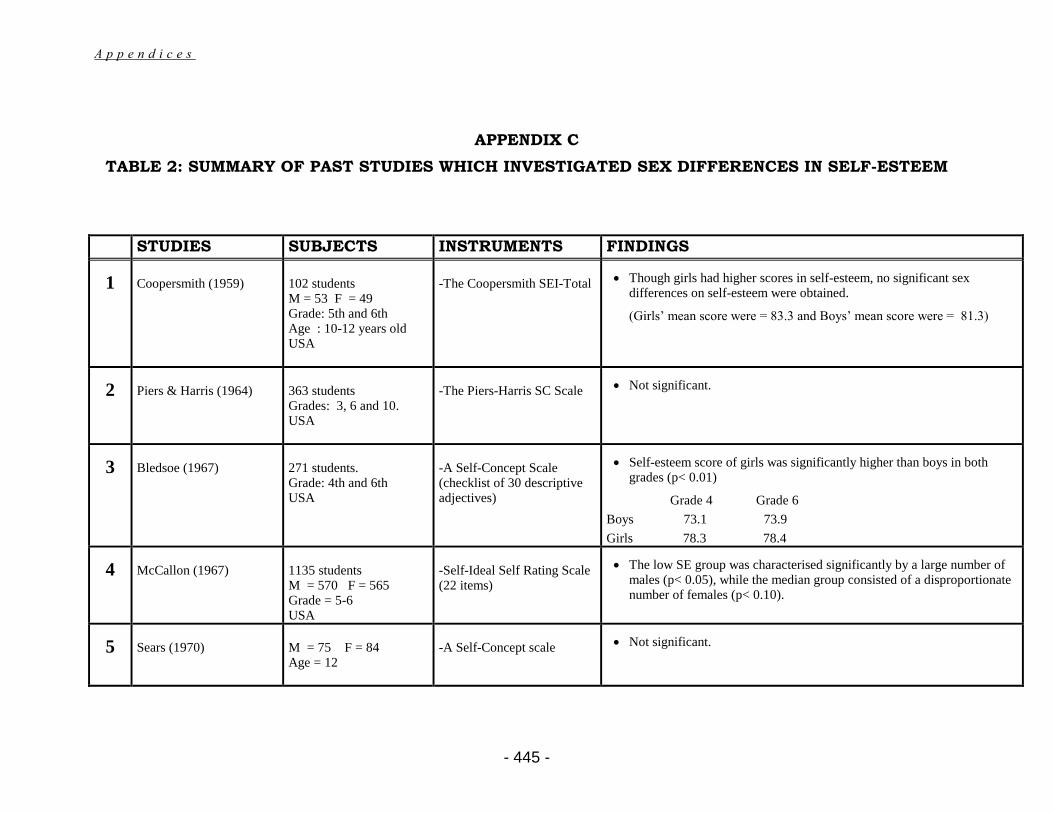
A p p e n d i c e s
- 445 -
APPENDIX C
TABLE 2: SUMMARY OF PAST STUDIES WHICH INVESTIGATED SEX DIFFERENCES IN SELF-ESTEEM
STUDIES SUBJECTS INSTRUMENTS FINDINGS
1 Coopersmith (1959)
102 students M = 53 F = 49 Grade: 5th and 6th Age : 10-12 years old USA
-The Coopersmith SEI-Total
Though girls had higher scores in self-esteem, no significant sex differences on self-esteem were obtained.
(Girls’ mean score were = 83.3 and Boys’ mean score were = 81.3)
2 Piers & Harris (1964)
363 students Grades: 3, 6 and 10. USA
-The Piers-Harris SC Scale Not significant.
3 Bledsoe (1967)
271 students. Grade: 4th and 6th USA
-A Self-Concept Scale (checklist of 30 descriptive adjectives)
Self-esteem score of girls was significantly higher than boys in both grades (p< 0.01)
Grade 4 Grade 6
Boys 73.1 73.9
Girls 78.3 78.4
4 McCallon (1967)
1135 students M = 570 F = 565 Grade = 5-6 USA
-Self-Ideal Self Rating Scale (22 items)
The low SE group was characterised significantly by a large number of males (p< 0.05), while the median group consisted of a disproportionate number of females (p< 0.10).
5 Sears (1970)
M = 75 F = 84 Age = 12
-A Self-Concept scale
Not significant.
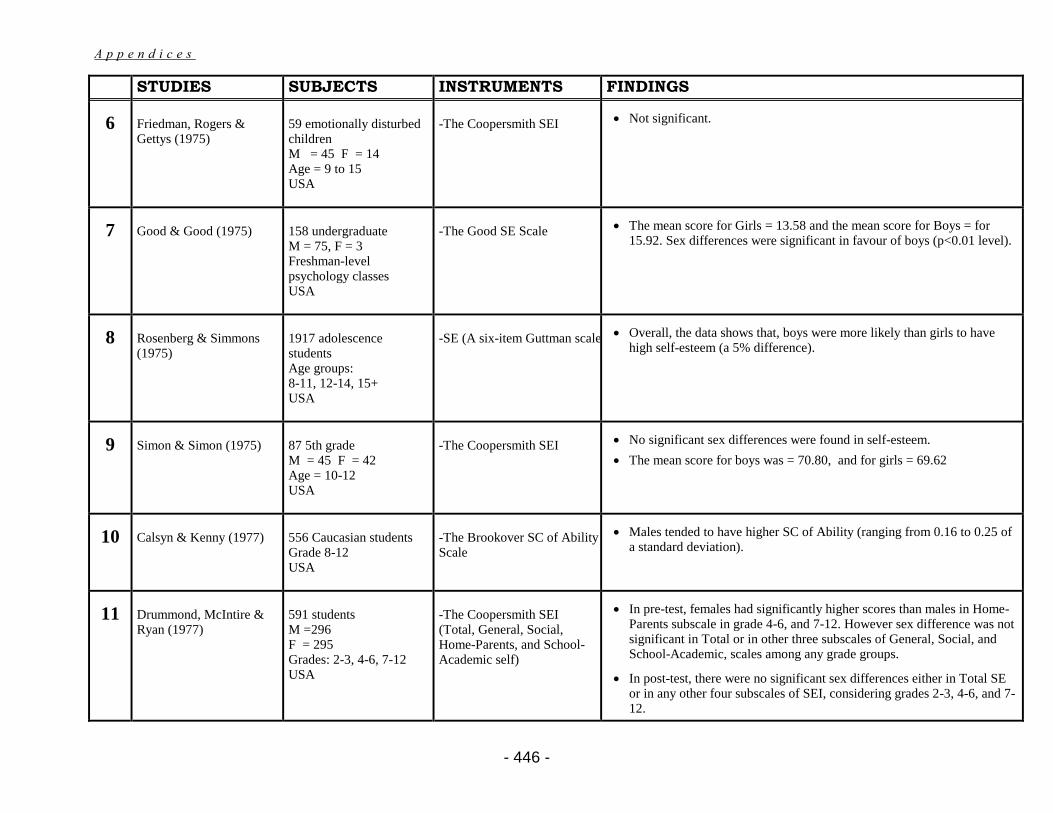
A p p e n d i c e s
- 446 -
STUDIES SUBJECTS INSTRUMENTS FINDINGS
6 Friedman, Rogers & Gettys (1975)
59 emotionally disturbed children M = 45 F = 14 Age = 9 to 15 USA
-The Coopersmith SEI
Not significant.
7 Good & Good (1975)
158 undergraduate M = 75, F = 3 Freshman-level psychology classes USA
-The Good SE Scale
The mean score for Girls = 13.58 and the mean score for Boys = for 15.92. Sex differences were significant in favour of boys (p<0.01 level).
8 Rosenberg & Simmons (1975)
1917 adolescence students Age groups: 8-11, 12-14, 15+ USA
-SE (A six-item Guttman scale)
Overall, the data shows that, boys were more likely than girls to have high self-esteem (a 5% difference).
9 Simon & Simon (1975)
87 5th grade M = 45 F = 42 Age = 10-12 USA
-The Coopersmith SEI No significant sex differences were found in self-esteem.
The mean score for boys was = 70.80, and for girls = 69.62
10 Calsyn & Kenny (1977)
556 Caucasian students Grade 8-12 USA
-The Brookover SC of Ability Scale
Males tended to have higher SC of Ability (ranging from 0.16 to 0.25 of a standard deviation).
11 Drummond, McIntire & Ryan (1977)
591 students M =296 F = 295 Grades: 2-3, 4-6, 7-12 USA
-The Coopersmith SEI (Total, General, Social, Home-Parents, and School-Academic self)
In pre-test, females had significantly higher scores than males in Home-Parents subscale in grade 4-6, and 7-12. However sex difference was not significant in Total or in other three subscales of General, Social, and School-Academic, scales among any grade groups.
In post-test, there were no significant sex differences either in Total SE or in any other four subscales of SEI, considering grades 2-3, 4-6, and 7-12.
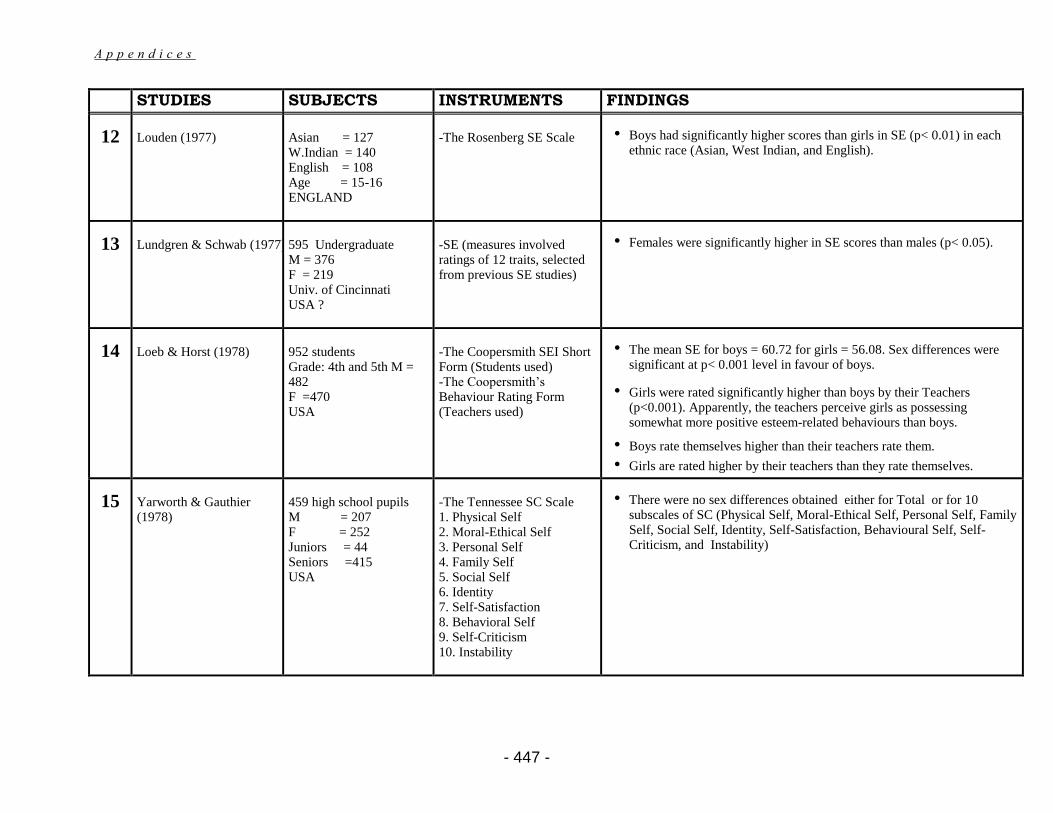
A p p e n d i c e s
- 447 -
STUDIES SUBJECTS INSTRUMENTS FINDINGS
12 Louden (1977)
Asian = 127 W.Indian = 140 English = 108 Age = 15-16 ENGLAND
-The Rosenberg SE Scale
• Boys had significantly higher scores than girls in SE (p< 0.01) in each ethnic race (Asian, West Indian, and English).
13 Lundgren & Schwab (1977)
595 Undergraduate M = 376 F = 219 Univ. of Cincinnati USA ?
-SE (measures involved ratings of 12 traits, selected from previous SE studies)
• Females were significantly higher in SE scores than males (p< 0.05).
14 Loeb & Horst (1978)
952 students Grade: 4th and 5th M = 482 F =470 USA
-The Coopersmith SEI Short Form (Students used) -The Coopersmith’s Behaviour Rating Form (Teachers used)
• The mean SE for boys = 60.72 for girls = 56.08. Sex differences were significant at p< 0.001 level in favour of boys.
• Girls were rated significantly higher than boys by their Teachers (p<0.001). Apparently, the teachers perceive girls as possessing somewhat more positive esteem-related behaviours than boys.
• Boys rate themselves higher than their teachers rate them.
• Girls are rated higher by their teachers than they rate themselves.
15 Yarworth & Gauthier (1978)
459 high school pupils M = 207 F = 252 Juniors = 44 Seniors =415 USA
-The Tennessee SC Scale 1. Physical Self 2. Moral-Ethical Self 3. Personal Self 4. Family Self 5. Social Self 6. Identity 7. Self-Satisfaction 8. Behavioral Self 9. Self-Criticism 10. Instability
• There were no sex differences obtained either for Total or for 10 subscales of SC (Physical Self, Moral-Ethical Self, Personal Self, Family Self, Social Self, Identity, Self-Satisfaction, Behavioural Self, Self-Criticism, and Instability)
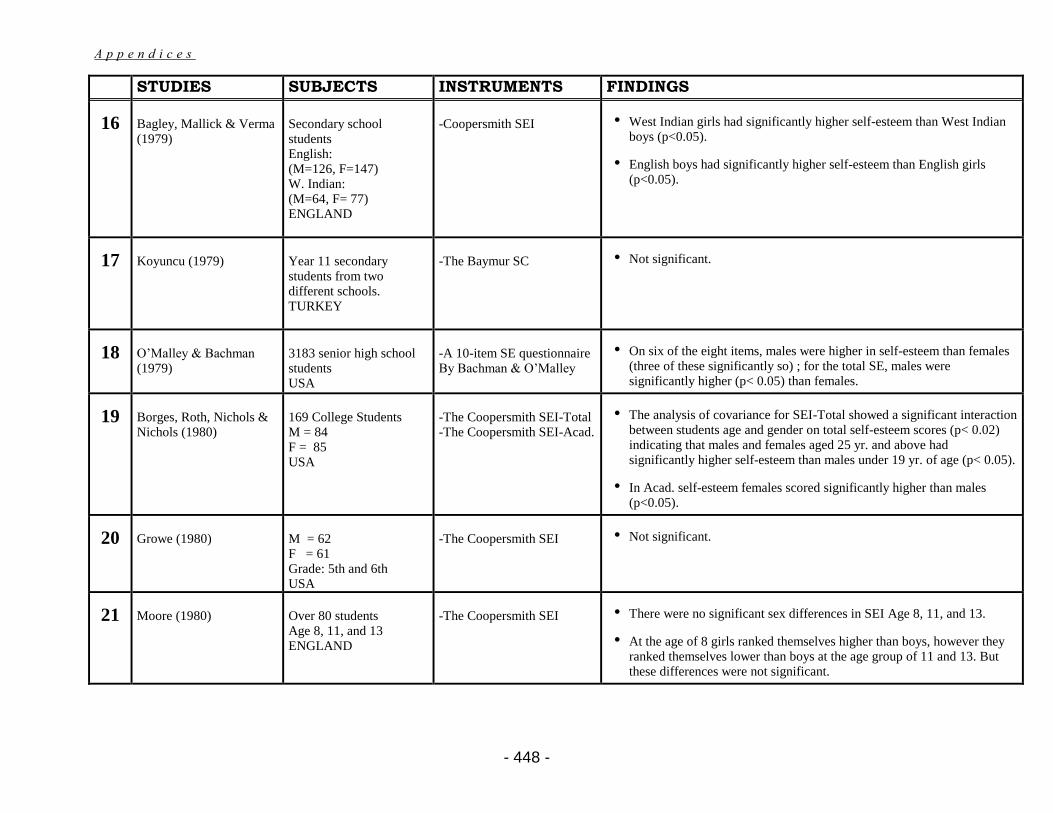
A p p e n d i c e s
- 448 -
STUDIES SUBJECTS INSTRUMENTS FINDINGS
16 Bagley, Mallick & Verma (1979)
Secondary school students English: (M=126, F=147) W. Indian: (M=64, F= 77) ENGLAND
-Coopersmith SEI • West Indian girls had significantly higher self-esteem than West Indian
boys (p<0.05).
• English boys had significantly higher self-esteem than English girls (p<0.05).
17 Koyuncu (1979)
Year 11 secondary students from two different schools. TURKEY
-The Baymur SC • Not significant.
18 O’Malley & Bachman (1979)
3183 senior high school students USA
-A 10-item SE questionnaire By Bachman & O’Malley
• On six of the eight items, males were higher in self-esteem than females (three of these significantly so) ; for the total SE, males were significantly higher (p< 0.05) than females.
19 Borges, Roth, Nichols & Nichols (1980)
169 College Students M = 84 F = 85 USA
-The Coopersmith SEI-Total -The Coopersmith SEI-Acad.
• The analysis of covariance for SEI-Total showed a significant interaction between students age and gender on total self-esteem scores (p< 0.02) indicating that males and females aged 25 yr. and above had significantly higher self-esteem than males under 19 yr. of age (p< 0.05).
• In Acad. self-esteem females scored significantly higher than males (p<0.05).
20 Growe (1980)
M = 62 F = 61 Grade: 5th and 6th USA
-The Coopersmith SEI • Not significant.
21 Moore (1980)
Over 80 students Age 8, 11, and 13 ENGLAND
-The Coopersmith SEI
• There were no significant sex differences in SEI Age 8, 11, and 13.
• At the age of 8 girls ranked themselves higher than boys, however they ranked themselves lower than boys at the age group of 11 and 13. But these differences were not significant.
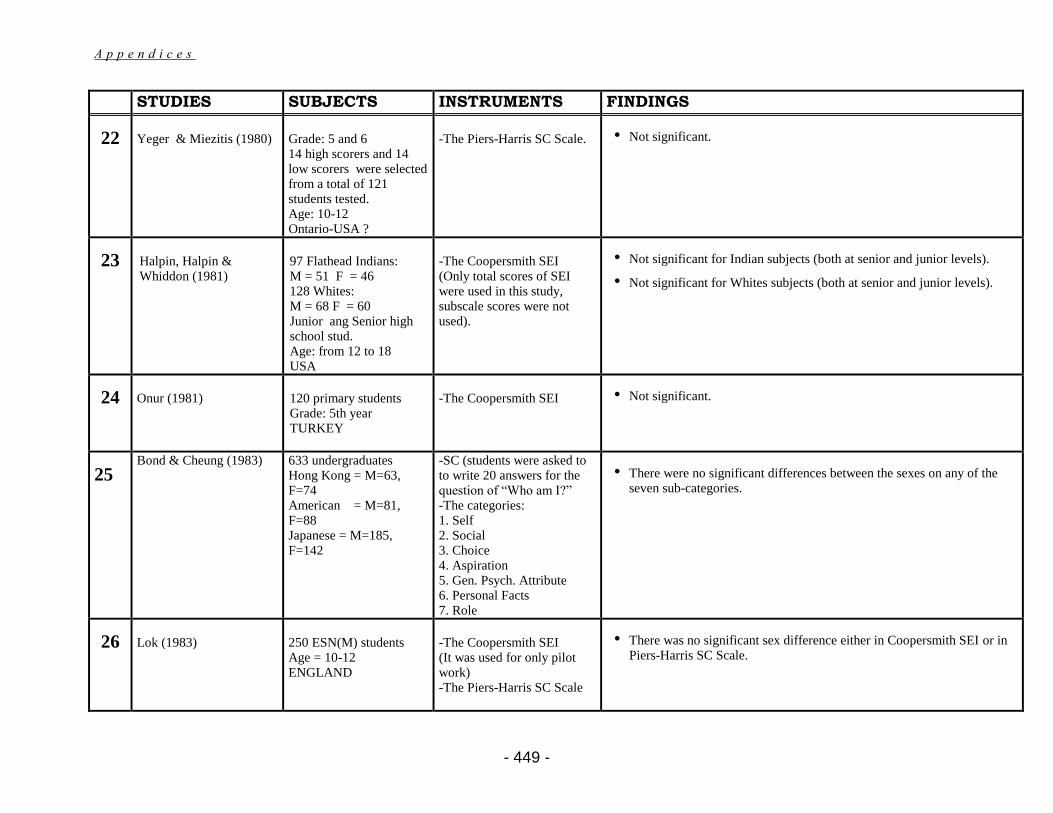
A p p e n d i c e s
- 449 -
STUDIES SUBJECTS INSTRUMENTS FINDINGS
22 Yeger & Miezitis (1980)
Grade: 5 and 6 14 high scorers and 14 low scorers were selected from a total of 121 students tested. Age: 10-12 Ontario-USA ?
-The Piers-Harris SC Scale. • Not significant.
23 Halpin, Halpin & Whiddon (1981)
97 Flathead Indians: M = 51 F = 46 128 Whites: M = 68 F = 60 Junior ang Senior high school stud. Age: from 12 to 18 USA
-The Coopersmith SEI (Only total scores of SEI were used in this study, subscale scores were not used).
• Not significant for Indian subjects (both at senior and junior levels).
• Not significant for Whites subjects (both at senior and junior levels).
24 Onur (1981)
120 primary students Grade: 5th year TURKEY
-The Coopersmith SEI • Not significant.
25
Bond & Cheung (1983) 633 undergraduates Hong Kong = M=63, F=74 American = M=81, F=88 Japanese = M=185, F=142
-SC (students were asked to to write 20 answers for the question of “Who am I?” -The categories: 1. Self 2. Social 3. Choice 4. Aspiration 5. Gen. Psych. Attribute 6. Personal Facts 7. Role
• There were no significant differences between the sexes on any of the seven sub-categories.
26 Lok (1983)
250 ESN(M) students Age = 10-12 ENGLAND
-The Coopersmith SEI (It was used for only pilot work) -The Piers-Harris SC Scale
• There was no significant sex difference either in Coopersmith SEI or in Piers-Harris SC Scale.
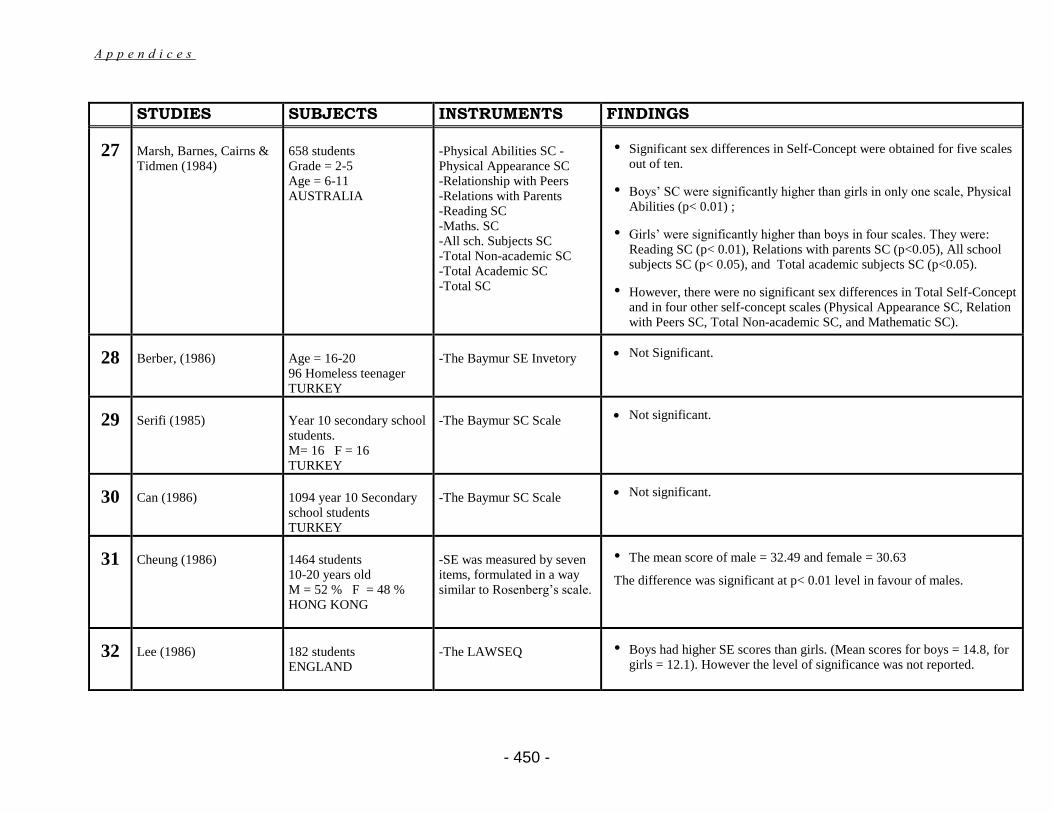
A p p e n d i c e s
- 450 -
STUDIES SUBJECTS INSTRUMENTS FINDINGS
27 Marsh, Barnes, Cairns & Tidmen (1984)
658 students Grade = 2-5 Age = 6-11 AUSTRALIA
-Physical Abilities SC -Physical Appearance SC -Relationship with Peers -Relations with Parents -Reading SC -Maths. SC -All sch. Subjects SC -Total Non-academic SC -Total Academic SC -Total SC
• Significant sex differences in Self-Concept were obtained for five scales out of ten.
• Boys’ SC were significantly higher than girls in only one scale, Physical Abilities (p< 0.01) ;
• Girls’ were significantly higher than boys in four scales. They were: Reading SC (p< 0.01), Relations with parents SC (p<0.05), All school subjects SC (p< 0.05), and Total academic subjects SC (p<0.05).
• However, there were no significant sex differences in Total Self-Concept and in four other self-concept scales (Physical Appearance SC, Relation with Peers SC, Total Non-academic SC, and Mathematic SC).
28 Berber, (1986)
Age = 16-20 96 Homeless teenager TURKEY
-The Baymur SE Invetory Not Significant.
29 Serifi (1985)
Year 10 secondary school students. M= 16 F = 16 TURKEY
-The Baymur SC Scale
Not significant.
30 Can (1986)
1094 year 10 Secondary school students TURKEY
-The Baymur SC Scale Not significant.
31 Cheung (1986)
1464 students 10-20 years old M = 52 % F = 48 % HONG KONG
-SE was measured by seven items, formulated in a way similar to Rosenberg’s scale.
• The mean score of male = 32.49 and female = 30.63
The difference was significant at p< 0.01 level in favour of males.
32 Lee (1986)
182 students ENGLAND
-The LAWSEQ • Boys had higher SE scores than girls. (Mean scores for boys = 14.8, for
girls = 12.1). However the level of significance was not reported.
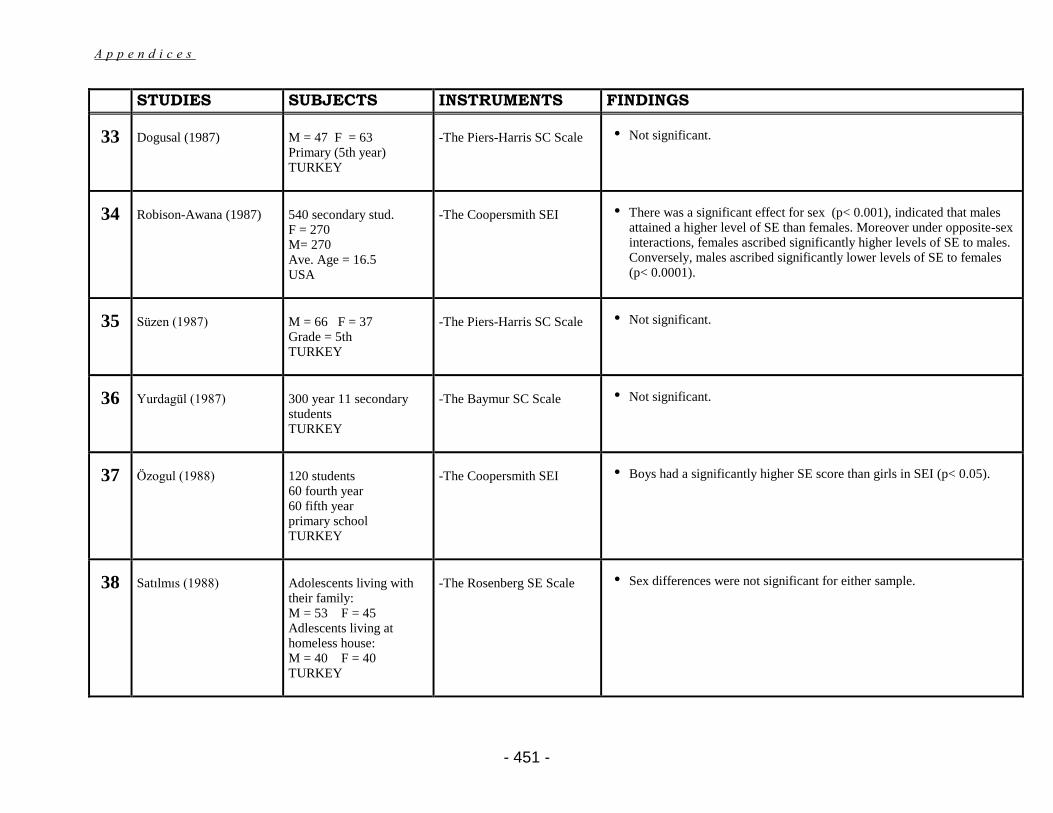
A p p e n d i c e s
- 451 -
STUDIES SUBJECTS INSTRUMENTS FINDINGS
33 Dogusal (1987)
M = 47 F = 63 Primary (5th year) TURKEY
-The Piers-Harris SC Scale • Not significant.
34 Robison-Awana (1987)
540 secondary stud. F = 270 M= 270 Ave. Age = 16.5 USA
-The Coopersmith SEI • There was a significant effect for sex (p< 0.001), indicated that males
attained a higher level of SE than females. Moreover under opposite-sex interactions, females ascribed significantly higher levels of SE to males. Conversely, males ascribed significantly lower levels of SE to females (p< 0.0001).
35 Süzen (1987)
M = 66 F = 37 Grade = 5th TURKEY
-The Piers-Harris SC Scale • Not significant.
36 Yurdagül (1987)
300 year 11 secondary students TURKEY
-The Baymur SC Scale • Not significant.
37 Özogul (1988)
120 students 60 fourth year 60 fifth year primary school TURKEY
-The Coopersmith SEI • Boys had a significantly higher SE score than girls in SEI (p< 0.05).
38 Satılmıs (1988)
Adolescents living with their family: M = 53 F = 45 Adlescents living at homeless house: M = 40 F = 40 TURKEY
-The Rosenberg SE Scale • Sex differences were not significant for either sample.
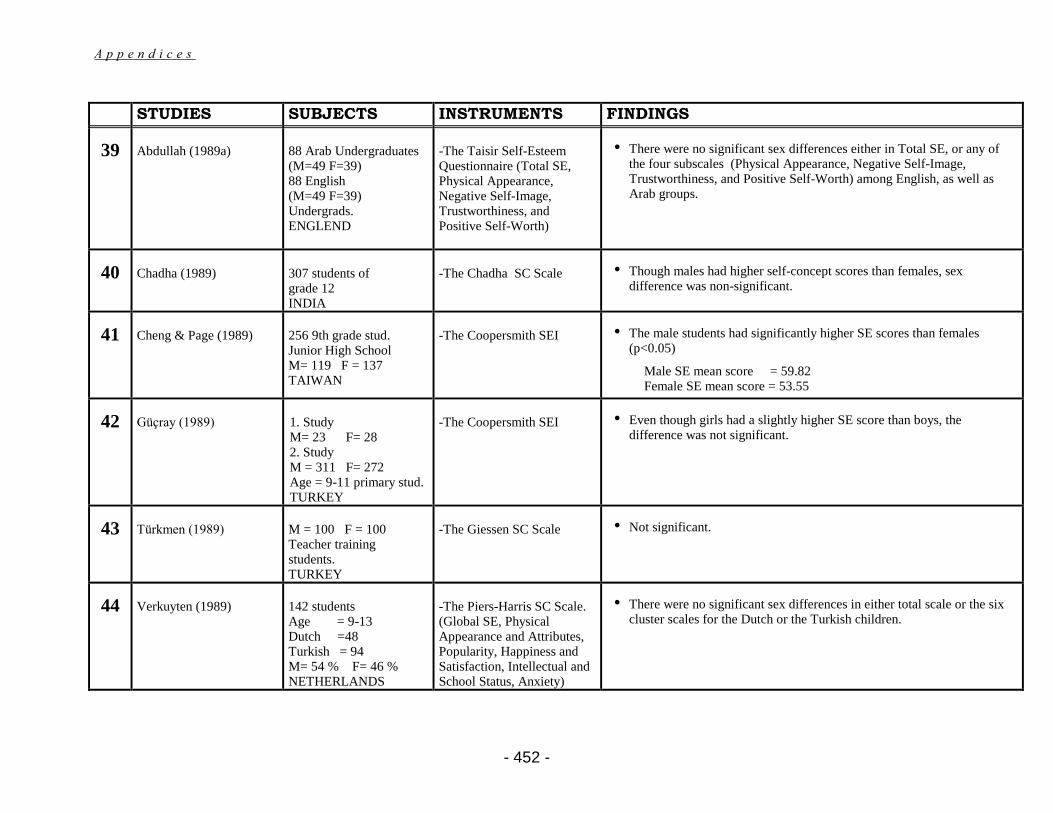
A p p e n d i c e s
- 452 -
STUDIES SUBJECTS INSTRUMENTS FINDINGS
39 Abdullah (1989a)
88 Arab Undergraduates (M=49 F=39) 88 English (M=49 F=39) Undergrads. ENGLEND
-The Taisir Self-Esteem Questionnaire (Total SE, Physical Appearance, Negative Self-Image, Trustworthiness, and Positive Self-Worth)
• There were no significant sex differences either in Total SE, or any of the four subscales (Physical Appearance, Negative Self-Image, Trustworthiness, and Positive Self-Worth) among English, as well as Arab groups.
40 Chadha (1989)
307 students of grade 12 INDIA
-The Chadha SC Scale
• Though males had higher self-concept scores than females, sex difference was non-significant.
41 Cheng & Page (1989)
256 9th grade stud. Junior High School M= 119 F = 137 TAIWAN
-The Coopersmith SEI • The male students had significantly higher SE scores than females
(p<0.05)
Male SE mean score = 59.82 Female SE mean score = 53.55
42 Güçray (1989)
1. Study M= 23 F= 28 2. Study M = 311 F= 272 Age = 9-11 primary stud. TURKEY
-The Coopersmith SEI • Even though girls had a slightly higher SE score than boys, the
difference was not significant.
43 Türkmen (1989)
M = 100 F = 100 Teacher training students. TURKEY
-The Giessen SC Scale • Not significant.
44 Verkuyten (1989)
142 students Age = 9-13 Dutch =48 Turkish = 94 M= 54 % F= 46 % NETHERLANDS
-The Piers-Harris SC Scale. (Global SE, Physical Appearance and Attributes, Popularity, Happiness and Satisfaction, Intellectual and School Status, Anxiety)
• There were no significant sex differences in either total scale or the six cluster scales for the Dutch or the Turkish children.
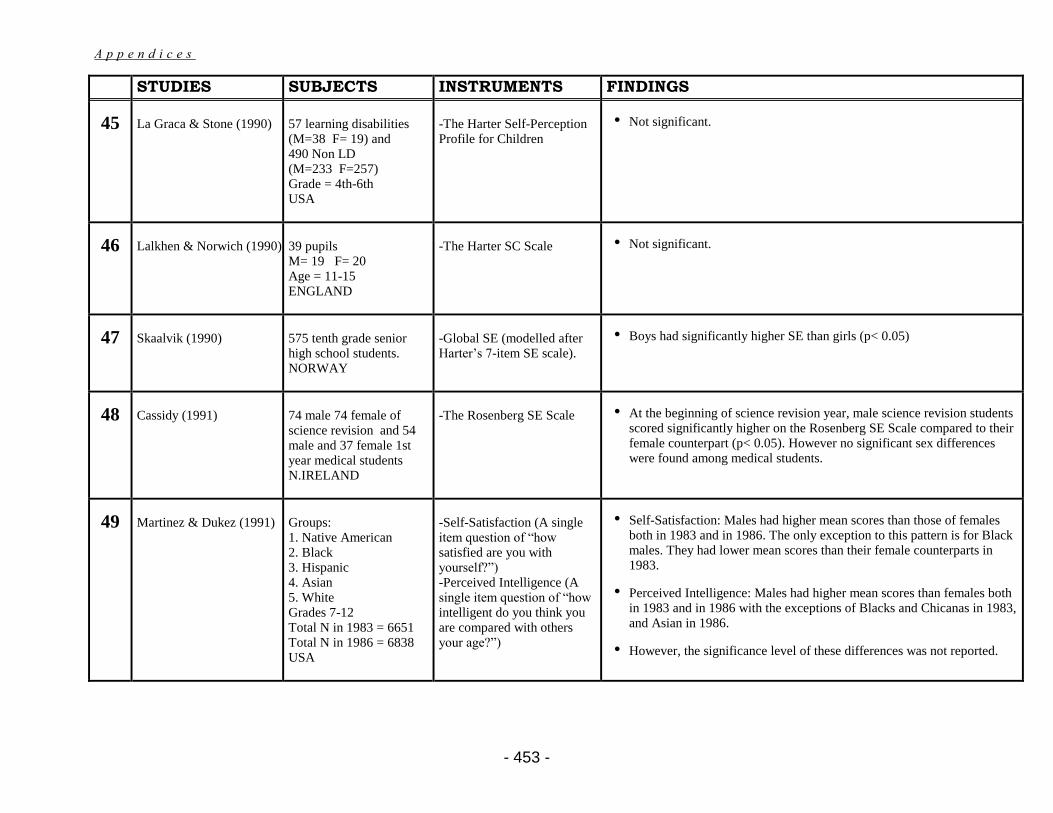
A p p e n d i c e s
- 453 -
STUDIES SUBJECTS INSTRUMENTS FINDINGS
45 La Graca & Stone (1990)
57 learning disabilities (M=38 F= 19) and 490 Non LD (M=233 F=257) Grade = 4th-6th USA
-The Harter Self-Perception Profile for Children
• Not significant.
46 Lalkhen & Norwich (1990)
39 pupils M= 19 F= 20 Age = 11-15 ENGLAND
-The Harter SC Scale
• Not significant.
47 Skaalvik (1990)
575 tenth grade senior high school students. NORWAY
-Global SE (modelled after Harter’s 7-item SE scale).
• Boys had significantly higher SE than girls (p< 0.05)
48 Cassidy (1991)
74 male 74 female of science revision and 54 male and 37 female 1st year medical students N.IRELAND
-The Rosenberg SE Scale
• At the beginning of science revision year, male science revision students scored significantly higher on the Rosenberg SE Scale compared to their female counterpart (p< 0.05). However no significant sex differences were found among medical students.
49 Martinez & Dukez (1991)
Groups: 1. Native American 2. Black 3. Hispanic 4. Asian 5. White Grades 7-12 Total N in 1983 = 6651 Total N in 1986 = 6838 USA
-Self-Satisfaction (A single item question of “how satisfied are you with yourself?”) -Perceived Intelligence (A single item question of “how intelligent do you think you are compared with others your age?”)
• Self-Satisfaction: Males had higher mean scores than those of females both in 1983 and in 1986. The only exception to this pattern is for Black males. They had lower mean scores than their female counterparts in 1983.
• Perceived Intelligence: Males had higher mean scores than females both in 1983 and in 1986 with the exceptions of Blacks and Chicanas in 1983, and Asian in 1986.
• However, the significance level of these differences was not reported.
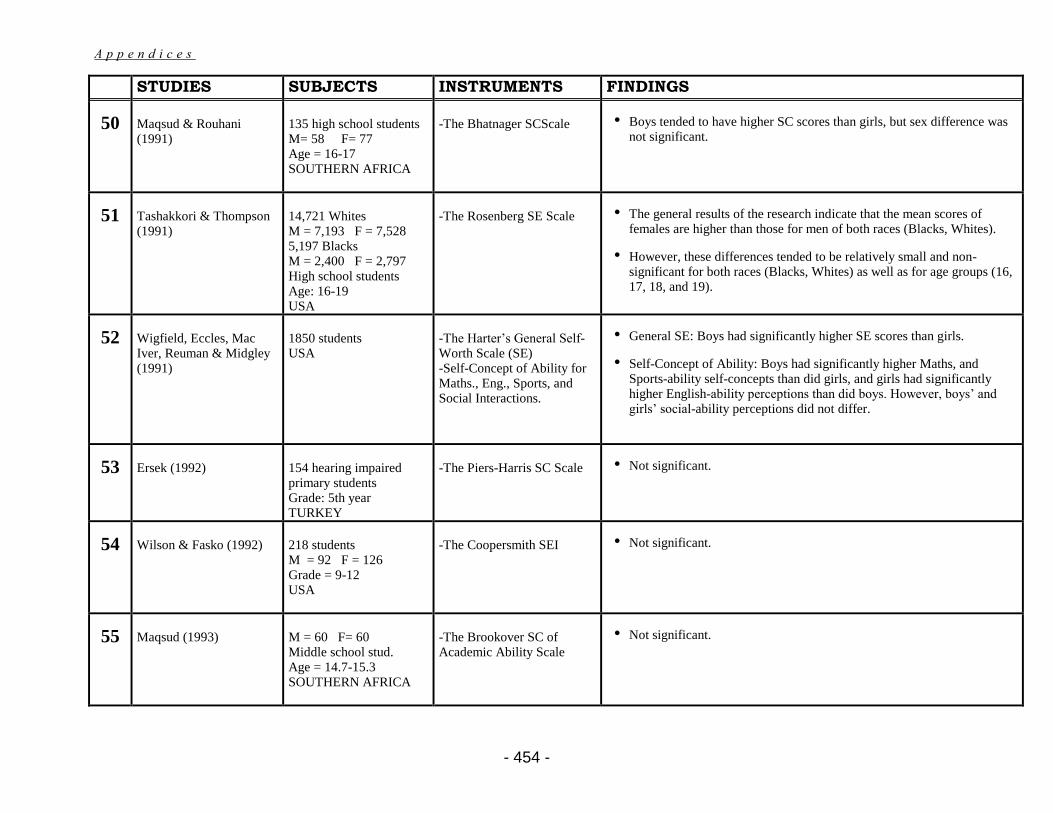
A p p e n d i c e s
- 454 -
STUDIES SUBJECTS INSTRUMENTS FINDINGS
50 Maqsud & Rouhani (1991)
135 high school students M= 58 F= 77 Age = 16-17 SOUTHERN AFRICA
-The Bhatnager SCScale • Boys tended to have higher SC scores than girls, but sex difference was
not significant.
51 Tashakkori & Thompson (1991)
14,721 Whites M = 7,193 F = 7,528 5,197 Blacks M = 2,400 F = 2,797 High school students Age: 16-19 USA
-The Rosenberg SE Scale • The general results of the research indicate that the mean scores of
females are higher than those for men of both races (Blacks, Whites).
• However, these differences tended to be relatively small and non-significant for both races (Blacks, Whites) as well as for age groups (16, 17, 18, and 19).
52 Wigfield, Eccles, Mac Iver, Reuman & Midgley (1991)
1850 students USA
-The Harter’s General Self-Worth Scale (SE) -Self-Concept of Ability for Maths., Eng., Sports, and Social Interactions.
• General SE: Boys had significantly higher SE scores than girls.
• Self-Concept of Ability: Boys had significantly higher Maths, and Sports-ability self-concepts than did girls, and girls had significantly higher English-ability perceptions than did boys. However, boys’ and girls’ social-ability perceptions did not differ.
53 Ersek (1992)
154 hearing impaired primary students Grade: 5th year TURKEY
-The Piers-Harris SC Scale • Not significant.
54 Wilson & Fasko (1992)
218 students M = 92 F = 126 Grade = 9-12 USA
-The Coopersmith SEI • Not significant.
55 Maqsud (1993)
M = 60 F= 60 Middle school stud. Age = 14.7-15.3 SOUTHERN AFRICA
-The Brookover SC of Academic Ability Scale
• Not significant.
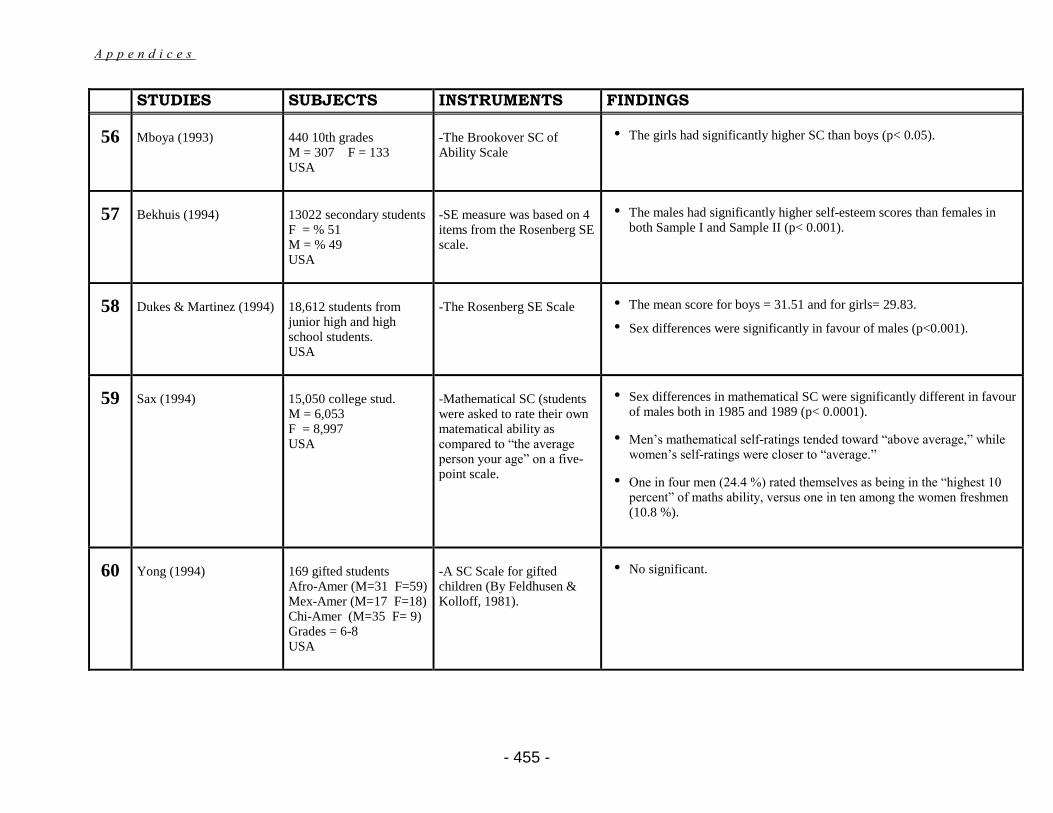
A p p e n d i c e s
- 455 -
STUDIES SUBJECTS INSTRUMENTS FINDINGS
56 Mboya (1993)
440 10th grades M = 307 F = 133 USA
-The Brookover SC of Ability Scale
• The girls had significantly higher SC than boys (p< 0.05).
57 Bekhuis (1994)
13022 secondary students F = % 51 M = % 49 USA
-SE measure was based on 4 items from the Rosenberg SE scale.
• The males had significantly higher self-esteem scores than females in both Sample I and Sample II (p< 0.001).
58 Dukes & Martinez (1994)
18,612 students from junior high and high school students. USA
-The Rosenberg SE Scale • The mean score for boys = 31.51 and for girls= 29.83.
• Sex differences were significantly in favour of males (p<0.001).
59 Sax (1994)
15,050 college stud. M = 6,053 F = 8,997 USA
-Mathematical SC (students were asked to rate their own matematical ability as compared to “the average person your age” on a five-point scale.
• Sex differences in mathematical SC were significantly different in favour of males both in 1985 and 1989 (p< 0.0001).
• Men’s mathematical self-ratings tended toward “above average,” while women’s self-ratings were closer to “average.”
• One in four men (24.4 %) rated themselves as being in the “highest 10 percent” of maths ability, versus one in ten among the women freshmen (10.8 %).
60 Yong (1994)
169 gifted students Afro-Amer (M=31 F=59) Mex-Amer (M=17 F=18) Chi-Amer (M=35 F= 9) Grades = 6-8 USA
-A SC Scale for gifted children (By Feldhusen & Kolloff, 1981).
• No significant.
CHAPTER 2
LITERATURE REVIEW AND RESEARCH
OF SELF-ESTEEM
C h a p t e r T w o
- 10 -
“With no attempt there can be no failure; with no failure no
humiliation; So our feelings in this world depend entirely on
what we back ourselves to be and to do”.
William James, 1890
2.1 INTRODUCTION
This chapter is concerned with a) the historical development of self and self-esteem in
psychological theory, b) conceptual problems of self-esteem and self-concept, c)
definitions of self-esteem, d) the indications of high and low self-esteem, e) self-esteem
measurement and problems in measuring self-esteem, f) the relation of self-esteem with
academic achievement, g) sex differences on self-esteem and h) cross-cultural
differences and self-esteem.
Firstly, the self and self-esteem theories will be outlined under five sections: a) the self
in James’s pioneer work; the looking-glass self or self in symbolic interactionism
(Cooley, and Mead), b) the self in Freudian and Neo-Freudian theories (Freud, Jung,
Adler, Horney, Fromm, Sullivan and Erikson), c) the self in the humanistic perspectives
(Maslow, and Rogers), d) the self-enhancement, and the self-consistency theories, and
finally e) attitudes toward the self or self worth (Rosenberg, and Coopersmith).
Secondly, the conceptual problems of self-esteem and self-concept will be briefly
examined. Although self-esteem has become interesting both in psychology and
education and its construct has been discussed in many theories since W. James and his
work (1890), there is still a lack of consensus in terms of a proper definition. Therefore
some conceptual problems of self-esteem and self-concept will be briefly discussed and
C h a p t e r T w o
- 11 -
different views on the definition of self-esteem will be summarised. The self-esteem
measurement methods and some related problems will also be discussed in this chapter.
Following the general explanations, there will be three main sections in this chapter.
They will be a) the relation of self-esteem with academic achievement, b) sex
differences in self-esteem, and c) self-esteem and cultural differences. These sections
will be given close attention because of their relation to the main objectives of this
study. Each of these three sections will include some brief theoretical explanations.
Related empirical findings of past research will also be examined. A brief summary will
be provided at the end of each section.
2.2 THE HISTORICAL DEVELOPMENT of SELF and SELF-ESTEEM
in PSYCHOLOGICAL THEORY
Psychology as a formal field of study is still quite youthful. To trace some of the earliest
formal writings on the concept of self, contributions from other areas of study must be
therefore examined. Personality theories applied to specific aspects of self have
produced many opinions. However, theorists disagree about whether the environment or
the heredity is more influential in their formulation. At present, statements about the
self still remain somewhat speculative, but an examination of different theories, it is
believed, does offer some important information about how people perceive themselves.
The term “self-esteem” is only of 20th century origin. Until this century, writings on the
individuality of behaving organisms had been considered imprecise and ambiguous.
Self, in the early religious and philosophical writings, was equated with such
metaphysical concepts as “soul”, “will”, and “spirit”. The early religious writings
revealed the belief that man had some inner regulatory agent which influenced his
destiny. These writings spoke of a soul or an inner being which had spiritual qualities
and thus was a separate entity from the material body (Donceel, 1955).
C h a p t e r T w o
- 12 -
The ancient Greek philosophers such as Plato and Aristotle discussed the concept of self
in their writings. For Plato, the soul was conscious, life-giving and non-material.
Aristotle, in the third century B.C. made a distinction between the physical and non-
physical aspects of the human body. However, this sort of account restricted the self to
unscientific speculation in theological and philosophic terms. Such ideas were prevalent
until the 17th century. Later, René Descartes, a French philosopher, elaborated on the
earlier concept of self. Descartes emphasised the centrality of the self in consciousness
by saying that: “I think, therefore I am.” For him, thinking was evidence of the
existence of the thinker whom he referred to as the “I”. His concept of “I” was the one
direct predecessor of the modern psychological concept of self (Gergen, 1971, p.6).
After Descartes, other philosophers such as Spinoza, Leibnitz, Hobbes, Locke and
Hume all discussed the centrality of the inner “self” in the system of cognition and
consciousness - the nature of self. In Islamic philosophy, folk conceptions of man and
society, the mind and the soul, were prevalent, but they were not taken into account in
academic and scientific teaching because they were confined mainly to the mystic and
the religious realms. The dominant orthodox Islamic theology relegated the human soul
or psyche to a divine act, thus obstructing further speculation or questioning that might
have led to improve our understanding of the self. However, the theories of these
philosophers will not be discussed in detail, in this study.
Summarising the writing on the self in the 17th and 18th centuries, Purkey (1970)
states, “Terms such as mind, soul, psyche, and self were often used interchangeably,
with scant regard for an invariant vocabulary or scientific experimentation. For the most
part, a general state of confusion in regard to the concept of self existed into this present
century” (p.3).
C h a p t e r T w o
- 13 -
2.2.1 The Self in William James’s Pioneer Work
It was William James (1890) who was the first psychologist to explore this concept in
his Principles of Psychology (1890). A remarkable aspect of his work was his rigid
objectivity in the treatment of the problem and he strongly rejected the earlier
philosophical notions. He assumed that everything, self or not self, was objective.
James categorised two aspects of Global Self. He formulated the terms “Me” and “I” for
“the empirical person and the judging thought”. He saw the Global Self as
simultaneously “Me” and “I”. They were discriminated aspects of the same entity, a
discrimination between pure experience (I) and the contrasts of that experience (Me);
between a self as subject (I) and a self as object (Me).
The Self or Me, is in the broadest sense, everything that a man can call his. To James
this empirical self comprised four components which were classed, in order of their
implications for self-esteem, as spiritual self, material self, social self and bodily self.
By ‘spiritual self’ James meant thinking and feeling, i.e. what we most truly seem to be.
"We take a purer self-satisfaction when we think of our ability to argue and
discriminate, or our moral sensibility and conscience, or our indomitable will, than
when we survey any of our other possessions. Only when these are altered is a man said
to be alienates a se." (James, 1890, p. 296).
James does not explain whether he considers either the material selves or the social
selves to be the more important, but according to Burns (1981) both are intermediate
between the bodily self and the spiritual self. Obviously we have many different social
selves, and we care about the opinions of individuals or groups around us. To Burns
(1981), our social and material selves are concerned with enhancing self esteem and
serving social ends, involved as they are with obtaining admiration, notice of others,
influence, power, etc.
C h a p t e r T w o
- 14 -
The ‘material self’ consists of the clothing and material possessions we see as part of
us. For some of us, the material aspects of our lives are so prominent that the material
self is a significant portion of our entire self-concept. We may see people around us
wearing smart clothes, which are clearly important for them. Sometimes an expensive
car or a nice house, a uniform we wear, or a book or article we have written, can be a
central part of our material self and of our self-concept. Even a beautiful girlfriend or a
young handsome boyfriend could be considered as part of our material self, although
they are mainly thought of as being part of our social selves. Children in particular
extend their self-concept by identifying with material possessions. After playing with
guns, a boy may feel as though he is a cowboy or a hero, and similarly when playing
with soft toys a girl may feel like a mother, a nurse or a queen.
The ‘bodily self’ is placed last in importance in James’s theory, but it is commonly
accepted that the bodily self is very important for children and particularly for
adolescents. Even adults spend a considerable amount of time and expense in order to
create a favourable image.
These four selves in James’s theory combine with each other and create an image of a
person’s self. In fact it is not possible to split them up easily and clearly, because most
of the time there are links between them. For example, wearing smart clothes is
considered a part of material self, which enhances bodily self and also gives us
satisfaction in the social community by attracting the attention of others.
According to James, individuals who live in a complex society constantly have to
choose between various goals. Individuals set their own goals, each of which is related
to a different component of the self, and they evaluate their success of having achieved
these goals. It depends on what we see ourselves as being. James went on to argue that
it is the position a person holds in the world, being contingent on his success or failure
that determines self-esteem. Though we want to maximise all of our various selves,
C h a p t e r T w o
- 15 -
limitations of our talent and time prevent this, so each of us has to choose particular
selves. He argued that having chosen our goals, our levels of self-regard can be reduced
by deficiencies, (or raised by achievements), which are relevant to our “pretensions”; a
proposition which can be expressed as follows:
Self-esteem = Success / Pretensions
Therefore, an individual’s feelings of worth are determined by the ratio of their actual
accomplishments to their supposed potentialities. The dimension of achievement, then,
is implicit in James’s concept of self-esteem.
James’s writings are significant because they are among the first detailed descriptions
by a psychologist of what was later called self-concept. Initially, however, the
development of self-concept was affected by criticism. The theory was criticised as
lacking experimental and empirical verification because it did not conform to the
behaviour models of scientific psychology. Nevertheless, as Al-Maneea (1990) argued,
sociologists, not being constrained by this apparent lack of scientific rigour, later
became involved with the idea of self. According to Burns (1982), the major difficulty
with James’s formulation was that it assumed that being the best at some activity would
automatically result in high self-esteem. However, there are some skills and jobs which
society does not rate very highly, so to consider oneself as the most competent dustman
or café waitress would be unlikely to lead to high self-esteem.
2.2.2 The Self in Symbolic Interactionism
2.2.2.1 Cooley
James was not alone in recognising that the self is a product of social interaction.
Cooley (1902) used the term “looking glass” self to convey the idea that self-concepts
reflect the evaluations of other people in the environment. He was one of the earliest
C h a p t e r T w o
- 16 -
social psychologists to explore the idea of self and he developed a theory of the self that
was concerned primarily with how the self grows as a consequence of interpersonal
interactions (Lok, 1983). Cooley’s original view was that individuals are prior to
society, but later he put more emphasis on society to the extent that “self and society are
twin born ... and the notion of a separate and independent ego is an illusion”(p.5). Burns
(1981) reports that Cooley was the one who first pointed out the importance of
subjectively interpreting feedback from others as a main source of data about the self.
For him, a self-idea had three principal elements: “the imagination of our appearance to
the other person; the imagination of his judgement of that appearance; and some self-
feeling” (p. 152). It seems clear that his view about the person’s self-concept is
significantly influenced by his perception and interpretation of the reactions of other
persons to him.
2.2.2.2 Mead
Cooley’s idea was elaborated by Mead (1934) who produced a more extensive and more
sophisticated theory of self-development. Like James, Mead saw the essence of the self
in the I-Me distinction; like Cooley, Mead saw the self as a social phenomenon. In the
“I-Me” polarity, Mead’s “I” is the impulsive tendency, the unorganised, undisciplined,
undifferentiated activity of the individual. He asserted that every behaviour commences
as an “I”, but develops and ends as a “Me” because it comes under the influence of
societal constraints. “I” provides the propulsion; “Me” provides direction (Lok, 1983).
According to Mead, self is not in existence at birth, “but arises in the process of social
experience... through the individual’s relations with the entire process and the
individuals within the social construct” (p.139). He considered the self-concept as an
object which occurs in social interaction as a consequence of the individual’s concern
about how others react to him or her. For this reason the individual can anticipate other
people’s reactions in order to behave appropriately, the individual then learns to
C h a p t e r T w o
- 17 -
interpret the environment as the others do. The consideration of others eventually comes
to guide and maintain behaviour even if external forces are no longer present. Self, then,
is a social structure which arises out of social experience. The important point about
Mead’s theory is that self is a process not a structure.
2.2.3 The Self in Freudian and Neo-Freudian Theories
Apart from James’s work and early symbolic interactionist theory, another early trend to
influence the theory of self was the work of the psychoanalytic theorists. In this section
self system in Freud, Jung, Adler, Sullivan and Horney’s theories, will be briefly
outlined.
2.2.3.1 The Self in Freud’s Psychoanalytic Theory
A concept of self can be seen in Freud’s studies, but the self construct being laid on the
id functioning at the expense of the ego, has never been clear. He initially engaged with
the ego rather than self. Unlike James, Freud was not formally concerned with self-
image and self-identity. Rather, Freud gave much more attention to the self through the
development and functioning of the ego (Freud, 1923, 1969). He proposed three
systems of the mind - id, ego, and superego. Any human behaviour, he argued, is nearly
always the product of an interaction among these three systems. Freud considered the id
to be the original aspect of personality, rooted in the biology of the individual (Jones,
1963), and to consist primarily of unconscious sexual and aggressive instincts. These
instincts might operate jointly in different situations to affect our behaviour (Ryckman,
1993). The id is amoral and unconcerned with the society. It operates according to the
pleasure principle. The aim of these impulses is always immediate and offers complete
discharge and satisfaction. The ego, however, is the executive of the personality because
it controls action. For Freud, this control becomes possible when the ego is
differentiated from the id. The ego, in his view, is the organised aspect of the id which
C h a p t e r T w o
- 18 -
is formed to provide direction for the person’s impulses. It comes into existence
because the needs of the person require appropriate transactions with society and the
environment if they are to be satisfied. To sum up, the ego maintains a psychic balance
between the demands of the person’s moral inclinations (the superego) and the natural
impulses (the id). The ego determines the content of consciousness and distinguishes
between reality and imagination. Such an element, according to Burns (1981), is the
same as global self. However Freud’s ego has roots in unconscious dynamics, while the
self is based on conscious awareness and subjective experiences.
2.2.3.2 The Self in Jung’s Analytical Psychology
Unlike Freud, Jung believed that the ego was the conscious part of personality. Jung
described the ego as a “complex of representations which constitutes the centrum of
field of consciousness and appears to possess a very high degree of continuity and
identity” (Jung, 1923, p. 540). The term complex refers to a collection of thoughts that
are united, often by a common feeling. The ego is a complex that is not completely
synonymous with the psyche, but is only one aspect of it (Jung, 1969, p. 324). Nor is the
ego identical with consciousness. Instead, the ego, which is at the centre of
consciousness, is a unifying force in the psyche. It is responsible for our feelings of
identity and continuity as human beings. From there, Jung’s ego contains the conscious
thoughts of our own behaviour and feelings as well as memories of our experiences.
However, self becomes all-inclusive, being the total of unconscious and conscious
aspects. Jung claimed that the self does not emerge until the various components of
personality are fully developed. The movement toward self-realisation is a difficult
process and it takes time and considerable effort to resolve the many conflicts between
opposites within the psyche, so that the few people who come closest to the attainment
of selfhood will be at least in middle age. According to him consciousness does not
replace unconsciousness within the psyche, but rather do they balance each other. The
C h a p t e r T w o
- 19 -
place of self, in his theory, lies between the conscious (the ego) and the unconscious
levels.
Jung’s personal development is a dynamic and evolving process that occurs throughout
life. A person is continually developing, learning new skills, and moving toward self-
realisation. The movement toward self-realisation is often a difficult and painful
process and progress towards it is not automatic. Jung also believed that many people
experience their most severe crises during the middle years. Burns (1981) found
similarities between Jung’s view of striving towards the single goal of self development
and phenomenological views on self actualisation and the process of becoming.
2.2.3.3 The Self in Adler’s Individual Psychology
The main concept of Adler which related to the self is the style of life which determines
behaviour. Dinkmeyer (1965) used it synonymously with the term self-concept. The
style of life, or as some authors used the terms, the life style (Burns, 1981; Lok, 1983),
also originally called the “life plan” or “guiding image”, refers to the unique ways in
which people pursue their goals. According to Adler, the style of life is the distinctive
personality pattern of the individual that is basically shaped by the end of early
childhood. In contrast to Freud, he put consciousness at the centre of personality and
saw man as a conscious being, usually aware of his reasons for behaviour, capable of
organising and guiding his actions with complete awareness of their implication for his
own self realisation (Adler, 1927). According to Adler, the person who develops a
healthy style of life is one who experiences a family life where the parents’ treatment is
based on consideration and respect. He believed that under these conditions a person is
likely to learn the importance of equality and co-operation between people and how to
develop goals in accordance with social interest. Adler also claimed that a healthy
person is able to change his or her fictional goals if circumstances demand it. He also
C h a p t e r T w o
- 20 -
pointed out that living by principles and being realistic were criteria for being a healthy
person.
Adler stated that every person has the same goal, that of self assertion. He believed that
each human was born into the world feeling incomplete and inferior, therefore the
origin of the drive to attain superiority or self assertion was the motivation of the fear of
inferiority. For him, there were endless possible “styles of life” for achieving that goal.
For example, one person might try to be superior in the academic arena by intensive
reading, studying, thinking and discussing, while another person might aim to be
superior in sporting activities.
Another important point of Adler’s theory is the dynamic principle of the creative self.
The concept of the creative self implies that people create their own personalities,
actively constructing them out of their experiences and heredities. People are, finally,
responsible for their destinies. Healthy people are generally aware of the alternatives
available to them in solving problems and make their choices in rational and responsible
ways. Neurotics, in contrast, may have goals that are largely unconscious and they are
often unaware of the alternatives available to them (Ryckman, 1993). Unlike Freud,
Adler argued that behaviour is based on self-determination and that the individual is
capable of creating his own personality out of his heredity and experience.
Briefly, self system, in Adler’s theory, originates and develops out of the behaviour
employed to manipulate feelings of superiority out of feelings of inferiority (Burns,
1981).
2.2.3.4 The Self in Horney’s Social and Cultural Psychoanalysis
Karen Horney was another psychiatrist who, like Adler and Sullivan, reacted against
orthodox psychoanalysis. She believed strongly that Freud had placed too much stress
on the role played by the sexual instincts in the development of neurosis and not enough
C h a p t e r T w o
- 21 -
on cultural and social conditions. For Freud, neurosis was essentially an outgrowth of
the person’s inability to cope with sexual impulses and strivings, but for Horney,
neurosis was mainly the result of disturbed human relationships.
She believed that the social and cultural experiences of children were crucial in the
determination of their adult personalities, and that the treatment of children by parents
laid the foundation for neurosis. She also believed that warm, fair, considerate,
supportive and respectful treatment by the parents would enable a healthy personality to
develop. For her, the self plays a large part in mental health. Neurosis is a disturbance
on the relationship between self and others. In attempting to solve the contradictions of
self, values and other cultural factors, the individual establishes a movement pattern.
According to this theory the person moves towards people -compliance, moves away
from people -detachment, or moves against people -aggression. The healthy person uses
all of these three movement patterns, while the neurotics use only one (Horney, 1945,
p.48-95).
Horney (1951) envisaged an individual as having three separate and distinct selves.
They are: a) the idealised-self, b) the actual self, and c) the real self.
She maintained that unsuitable environmental conditions damage the realistic inner
confidence of people and force them to develop defences to cope with others. As their
energies are directed toward the development of defences in order to feel safe, attempts
to develop their real selves are overridden. For Horney, the solution for neurotics is to
create an idealised image of themselves. Such an image supports them with unlimited
abilities and powers, so it is possible to become heroes, geniuses, saints and even gods
in their imagination. These images provide a way to solve their basic conflicts.
According to Horney, neurotics eventually try to actualise the idealised self by
achieving success and victory in the outside world. The result of internalisation of the
idealised image is that the person is driven to be perfect, believing that they should be
C h a p t e r T w o
- 22 -
able to do everything and know everything. Neurotics keep these impossible standards
because their evaluation promises to satisfy all their internal conflicts and to eliminate
all pain and anxiety. But in real life, self-idealisation unfortunately does not work most
of the time. When neurotics compare the actual self (the self as it is at the moment,
including all the person’s actual strengths and weaknesses) against the idealised self, the
actual self always falls short. As a result of the experienced discrepancies between their
actual and idealised selves, neurotics are filled with hatred. Even though they are aware
of the results -feeling inferior, guilty -they are completely unaware that they themselves
have brought these painful feelings and self-evaluations upon themselves (Horney,
1951, p.116). To get rid of the pain which comes from the discrepancies between their
actual and idealised selves, neurotics use a defence mechanism, which according to
Horney, takes the form of blind spots in which painful experiences are denied or
ignored because they are at variance with the idealised self (Ryckman, 1993, p.156).
Therefore, self-hate is essentially an unconscious process rather than a critical self
examination. In her humanistic view of development, Horney maintained that every
person was special and had a unique set of potentials that would gradually appear under
wise parental guidance. These potentialities she called the real self. She believed that
with proper support everyone could develop toward self-realisation. In this way they
could develop their own feelings, thoughts, wishes, interests and abilities (Horney,
1951, p.17). Unfortunately, however, many people do not receive proper guidance to
develop their real self.
2.2.3.5 The Self in Fromm’s Humanistic Psychoanalysis
As a psychoanalytic theorist, Fromm (1939) put greater emphasis on sociological
factors than did Adler and Horney. In their writings, distorted relationships with people
were considered to be significant in the development of the self. Fromm (1939)
however, stressed the close relation between a person’s regard for himself and the way
C h a p t e r T w o
- 23 -
he is able to deal with other persons. A basic theme of his theory was that self-love is a
prerequisite for the ability to love others. His definition of love is “primarily giving, not
receiving” (Fromm, 1956, p.18). Fromm himself pointed out that this definition was not
clear and his clarification was that “giving is more joyous than receiving, not because it
is a deprivation but because in the act of giving lies the expression of my aliveness”
(Fromm, 1956, p.9). According to his theory, people who dislike themselves tend to
criticise other negative inferiority feelings. For Fromm, the most powerful motivating
force in human behaviour is the attempt to find a reason for our existence. Even though
we are all animals with certain biological needs which must be satisfied, we are more
than animals. We can be aware of ourselves, we can use reason to solve problems and
we can imagine and create new things. Our self-awareness not only helps us to solve
problems but also makes us conscious of our limitations (Fromm, 1947, p.49). In his
view, these capacities provide us with a fundamental choice: we can choose to lead
healthy and productive lives by developing our potentialities, or we can choose to
escape from our freedom. For him, people have also a need for identity which means
to be able to say to others “I am I,” not “I am as you desire me.” Each of us has a degree
of self-awareness and knowledge of our capabilities.
2.2.3.6 The Self in Sullivan’s Work
Sullivan, (1940, 1947, 1953) like Fromm, also put great emphasis on sociological
factors. He (1953) specified the self process more explicitly and represented an unusual
aspect of psychoanalytic perspective by being particularly social psychological. In some
respect, his ideas are close to Cooley and Mead’s social interaction ideas. According to
Sullivan the self-system is purely a result of interpersonal experience arising out of
anxiety encountered in the pursuit of need satisfaction. But he stresses the role of the
mother rather than society at large. His description of the self was wholly interpersonal,
and he emphasised the function of symbolisation in its development. According to
C h a p t e r T w o
- 24 -
Sullivan, the self is built out of experience by means of reflected appraisals and is
entirely a learned phenomenon. He posited no inherent self-drives or potential selves.
The “self-system” is characterised as a dynamism - “a relatively enduring pattern of
energy transformations which recurrently characterise the organism in its duration as a
living organism” (Sullivan, 1953, p.103). Like most psychoanalytic theorists, he traced
the development of this system to childhood. He differentiated the child’s experiences
in “good me”, “bad me”, and “not me”. This division arose as a result of need-
satisfaction or anxiety production by the parent when the child performed an act which
pleased or displeased. From this process, the self-system developed as “an organisation
of educative experience called into being by the necessity to avoid or to minimise
incidents of anxiety” (Sullivan, 1953, p.165).
2.2.3.7 The Self in Erikson’s Psychoanalytic Ego Psychology
Erikson used the concept of identity in his theory rather than the self, and provided an
extension and liberalisation of Freudian theory which emphasised ego development in
the cultural context. He, for the first time, integrated psychoanalysis with history and
anthropology. As mentioned earlier, Freud saw the ego as a relatively weak agency that
operated the powerful id. In his opinion, ego functioning was primarily concerned with
satisfying the person’s biological needs by seeking realistic ways that did not offend the
moral value (superego), or forbid the id’s urges when suitable objects were not
available. In contrast with Freud’s view, Erikson proposed that the ego often operated
independently of id functions. In his perspective, portions of the ego are neither
defensive in nature nor concerned with the control of biological urges. Instead, the ego
often functions to help individuals adapt constructively to the challenges presented by
their surroundings. This new view examines ego function in relation to society. He
emphasises the integration of biological and psycho-social factors on personality.
Therefore in his theory of ego psychology, he gives special attention to the unique
C h a p t e r T w o
- 25 -
interpersonal, cultural, and historical context within which people face a common series
of developmental crises.
For Erikson, as stated earlier, self identity emerges from experience. He also indicates
that identity is obtained from “achievement that has meaning in the culture” (Burns,
1981, p.24; Cassidy, p.44). Erikson described eight stages of the development of
identity which comes from a gradual integration of all identifications; therefore it is
important for children to come into contact with adults with whom they can identify.
Identity is a particular problem in adolescence and Erikson pays considerable attention
to the crises and diffusion of identity at that stage. In Roazen’s opinion (1976, p.89),
probably his most famous concept is the identity crisis, which was designed to point to
the central conflict of adolescence. He defined identity as “a subjective sense of an
invigorating sameness and continuity” (1968, p.19). However, he was reluctant to
provide a tight definition of identity, which was not just the total of roles assumed by
the person, but also included emerging configurations of identifications and capacities,
and perceptions of others’ reactions to the self. Erikson’s process of identity formation
is similar to the Cooley-Mead formulation concerning the role of the generalised other.
But Erikson sees these processes as for the most part unconscious. He criticised terms
such as self-conceptualisation, self-image, and self-esteem which provide a static view
of self. Identity formation, like the ideas of Rogers on self-actualisation, is a continuing
process of progressive differentiations and crystallisations which expand self-awareness
and self-exploration (Burns, 1982, p.19).
In the 1950s, from his clinical observations, Erikson assembled a syndrome of problems
occurring in patients from about 16 to 24 years of age. At first, he labelled these
difficulties “identity diffusion” but later replaced that term with “identity confusion”.
The symptoms include “a split of self-images, ... a loss of centrality, a sense of
dispersion and confusion, and a fear of dissolution” (Erikson, 1959, p.122-123). For
C h a p t e r T w o
- 26 -
Erikson, such identity dilemmas not only involved a breakdown in the ability to
concentrate, but they were also accompanied by a withdrawal from perceived
competitiveness. In the face of threatened identity loss, rage could accumulate because
of “unfulfilled potentials” (Evans, 1967).
Erikson (1963, 1968) states in his stage theories that there are specific developmental
tasks to be mastered during the period of late secondary education if the personality is to
develop to maturity. These tasks for the late secondary school students mainly involve
the re-evaluation of beliefs, attitudes and behaviours in the light of past experiences -
what one has been in the past, and what one hopes to become in the future. The schools
-particularly at the late secondary level- provide a crucial opportunity, and challenge the
student to re-evaluate himself/herself. In this situation, the schools and colleges can
influence the nature and extend the change in personality.
Briefly, Erikson’s theory is indeed comprehensive. His works include a wide variety of
phenomena, such as both normal and abnormal, seeking to account for the biological,
social, cultural, and historical factors that jointly determine personality development
and functioning. Even though his work has had tremendous practical impact in the areas
of child psychology and psychiatry, vocational counselling, education, and social work,
his theory has been criticised by many researchers. Criticism of his work has mainly
focused on the difficulties of operational definitions of the concepts, the difficulties of
psychological measurement, the testability of his theory and the nature of the causes of
psycho-social development (Matteson, 1977; Coleman, 1980; Burns, 1981, 1982;
Cassidy, 1991; Ryckman, 1993).
C h a p t e r T w o
- 27 -
2.2.4 The Self in Humanistic Perspectives
2.2.4.1 The Self in Maslow’s Self-Actualisation Theory
Maslow’s main contribution to the humanistic perspective was his theory of self-
actualisation. In his theory, he argued that psychology had to focus on healthy persons
rather than sick ones, concentrating on man’s strengths and virtues, rather than his/her
frailties and sins (Maslow, 1970). His assumption for self actualisation was that each of
us has an intrinsic nature which is good or, at the very least, neutral (Maslow, 1962,
p.3). He believed that because this inner nature is good or neutral, it is best to encourage
its development in society. If the environment is restrictive and minimises personal
choice, the individual is likely to develop in neurotic ways because this inner nature is
weak and subject to control by environmental forces. Maslow believed that this inner
tendency, though weak, remains and continuously grows toward actualisation (Maslow,
1962, pp.3-4, 177-200).
According to Maslow, each person has five basic needs, which are arranged in
hierarchical order from the most basic to the highest as follows:
1. Physiological needs, i.e. hunger, thirst, and sex.
2. Safety and security needs, i.e. security, protection, structure, law, order.
3. Love and belongingness needs.
4. Esteem needs.
5. Self-actualisation needs, i.e. the desire for self fulfilment, for becoming
what one has the potential to become.
Maslow emphasises that when basic needs have been sufficiently satisfied, the needs for
self-actualisation become salient. People seek to satisfy their curiosity about
themselves, to know and understand phenomena that go beyond the satisfaction of basic

C h a p t e r T w o
- 28 -
needs, and to move toward realisation of their own unique potentialities. But movement
in this positive direction, in Maslow’s theory, is not automatic. He believed that we
often fear “our best side, ... our finest impulses, ... our creativeness” (Maslow, 1962,
p.58). Discovery of our own abilities brings happiness. However, it also brings fear of
new responsibilities and duties, fear of the unknown. Maslow called this fear the Jonah
complex.
To discover the characteristics of self-actualisers, Maslow made intensive clinical
studies of people whom he judged to be self-actualising in terms of achieving and
reaching their highest potential. Some of the historical people in his list were Albert
Einstein, Eleanor Roosevelt, F. D. Roosevelt, Spinoza, William James, Albert
Schweitzer, Thomas Jefferson, Beethoven and Abraham Lincoln in his later years. After
extensive analysis of these individuals’ lives, Maslow listed self-actualising people’s
characteristics. Such identifying characteristics included efficient perception of reality;
positive self acceptance, positive acceptance of others, and nature; being problem
centred; spontaneity of thinking and emotions; having a democratic character structure,
in that they were less likely to focus attention on race, creed, sex, religious affiliation,
educational level or social class; independence of thought and a sense of identity with
the whole of mankind (Maslow, 1970, p.149-168).
Maslow’s theory is based on the issue of positive growth and presented an optimistic
and positive view of people and their potential creativeness. But the theory is not very
precise and it is difficult to test properly. As Ryckman (1993) indicates, without
adequate measures of the major constructs of his theory, tests of its empirical validity
are impossible. Even though some researchers have constructed an adequate measure of
actualisation, the results of testing the theory have not been consistently supportive. For
example, Mathes (1978) found no evidence for Maslow’s hypothesis that self-
actualisers are more creative than nonactualisers. Similarly, Ryckman et al (1985), using
C h a p t e r T w o
- 29 -
two independent samples of college undergraduates, could find no support for Maslow’s
hypothesis that actualisers tend to be physically strong, fit people. In spite of these
negative findings, it is noted that researchers’ interest in Maslow’s theory continues to
grow.
2.2.4.2 The Self in Rogers' Person Centred Theory
The contributions of Carl Rogers (1951, 1959) brought self to the centre of all
psychological dimensions and thinking. The self, according to Rogers, was a
phenomenological concept which was the major determining factor in all human
behaviour. For him, self-concept was the organised set of characteristics that the
individual perceives as being peculiar to himself / herself. It is primarily a social
product and is acquired through social contact. He believed that when we interact with
significant people in our environment, we begin to develop a concept of self that is
largely based on the evaluation of others. That means, we evaluate ourselves in terms of
what others think and not in terms of what we feel. According to Al-Maneea, (1990),
self concept and self structure were seen as synonymous in Rogers’ theory. Rogers also
uses “self” as “person” when he claims that “there are many elements of experience
which the self cannot face” (1951, p.40). Rogers put the concept of the ideal self in his
theory as “the self-concept which the individual would most like to possess, upon which
he places the highest value for himself’ (1959, p. 200). So the notion of the self as used
by Rogers seems broader than the self concept, because it includes the self-concept and
the ideal self.
Another important concept of Rogers is having a need for positive regard which is the
reason we depend so heavily on the evaluation of others. According to Ryckman (1993),
Rogers was not certain whether this need was innate or learned. Rogers claims that
when we satisfy another’s needs, we experience satisfaction of our own need for
positive regard (1959, p.223). The ideal condition for development of healthy self-
C h a p t e r T w o
- 30 -
concept, in his view, is unconditional positive regard; -a deep and genuine caring by
others, uncontaminated by judgements or evaluations of our thoughts, feelings, or
behaviours (Rogers & Sanford, 1984, p.1379). With unconditional positive regard, the
self-concept carries no conditions of worth and in this position there is congruence
between self and experience, and the person is psychologically healthy. So he saw the
congruence as being equal to psychological adjustment or psychological health (Frick,
1971, p. 91).
2.2.5 The Self-Enhancement and Self-Consistency Theories
In addition to the theories which were outlined above, there are other theories which
also explore the nature of self-esteem. Among these theories, self-enhancement theory
and self-consistency theory are the most influential and many theoretical frameworks of
recent studies on self-esteem are based on them.
2.2.5.1 Self-Enhancement Theory
According to self-enhancement theory, every individual has a basic need for positive
self-esteem (Rogers, 1951; Sullivan, 1953; Wylie, 1979) which is satisfied by the
approval they receive from others and is frustrated by their disapproval, and that to the
extent that his self-esteem need is satisfied by others’ evaluations, the individual will
respond favourably to them (Jones, 1973). The theory in general assumes that the
individual has a need to enhance his or her self-evaluation and to increase, maintain or
confirm their feelings or personal satisfaction, self-worth and effectiveness. For this
theory, the individuals are motivated to evaluate themselves favourably at all times and
predicts that they will respond positively to those who evaluate them favourably.
Although the need to enhance self-esteem is assumed to be general, at any given time, it
may show itself with respect to a particular aspect of the individual’s self-evaluation,
rather than to increased feelings about the self. The self-esteem need varies with the
C h a p t e r T w o
- 31 -
degree of personal satisfaction or frustration the individual experiences in a particular
situation or period of time. According to the theory, this need also varies across
individuals.
2.2.5.2 Self-Consistency Theory
Self-consistency theory claims that an individual’s actions, attitudes, and his receptivity
to information from other people are strongly affected by his tendency to maintain a
consistency state on self-evaluation (Jones, 1973). The idea for this theory came from
Lecky (1945). The theory claims that the individual strives constantly to maintain
consistency with his own self-esteem and several writers have agreed that this is
pervasive of our behaviour (Rogers, 1951; Festinger, 1957; Argyle, 1967). According to
the theory, the individuals with high self-esteem will react more favourably to approval
than disapproval, however, individuals with low self-esteem will react more favourably
to disapproval than approval. Briefly, self-consistency theory argues that the individual
adjusts his cognitions and orients his relations with others, so as to maintain similarity
between his or her evaluations of himself and those he receives from others. The theory
predicts that we will accept the evaluations of others only when they are in accord with
our existing self-evaluations, regardless of whether these evaluations are favourable or
unfavourable.
Comparing the self-consistency theory with the self-enhancement theory, Shrauger &
Lund (1975) supported the consistency theory by evaluating findings of studies. On the
other hand, Wylie (1979) found that the results generally support self-enhancement
rather than self-consistency theory. However, a number of studies have found support
for both of the two opposing theories (Fitch, 1970; Jones, 1973). It still seems that there
is little resolution of the self-enhancement versus self-consistency controversy, some
results favour one theory while other results support its rival. Both theories, however,
do provide an explanation for evaluations of individuals.
C h a p t e r T w o
- 32 -
2.2.6 Specific Self-Esteem Theories
The theories briefly outlined above all contributed to the concept of self or self-esteem
at different levels. However, the work of Rosenberg (1965) and Coopersmith (1967)
probably contributed the most to theoretical and empirical research on self-esteem.
Therefore in this section the theories of Rosenberg and Coopersmith will be outlined.
2.2.6.1 Morris Rosenberg
One of the major empirical studies of the antecedents of self-esteem is the work of
Morris Rosenberg, a sociologist. His investigation represents an important movement in
explicating many of the social conditions associated with enhanced and diminished self-
esteem. Information on these conditions and the subjective experience of esteem was
obtained from an attitude survey administered to over five thousand high school
students. Rosenberg (1965) assumes that all individuals have attitudes towards all sorts
of objects, and self is just one of these objects. Though he claims there is no qualitative
difference in the characteristics of attitudes toward the self and attitudes toward the
other things, he underlines that there are quantitative differences between attitudes
about self-attitudes and about other things (p.5-6). Rosenberg (1979) has described
global self-esteem as the overall negative or positive attitude toward the self. His
definition of self-esteem, like “self-acceptance, self-respect, feelings of self-worth” (p.
31) has been used in the majority of American studies. Rosenberg saw self-image as a
global property of personality. According to Rosenberg, all self-attitudes have an
evaluative dimension which produces “self-estimation”. He used the term of self-
estimation “to indicate how the individual actually rates himself with regard to a
particular characteristic” (1965, p. 246). Every individual has many self-estimates
which are not equally important for him/her. The criteria here are the self-value of the
attitude. The term, self-value, means “to indicate how much he cares about the quality”
(1965, p. 246). Each self-estimate is weighted by its corresponding self-value and the
C h a p t e r T w o
- 33 -
overall self-esteem of the individual represents some kind of psychological summation
of these specific weighted self-evaluations. For Rosenberg, self-esteem is the total of
the individual’s thoughts and feelings with reference to himself as an object (1979).
Rosenberg (1985) equated self-esteem with the feeling of being satisfied with oneself,
believing that one is a person of worth. According to him, the individual with high self-
esteem does not necessarily feel superior to others, does not necessarily have feelings of
perfection, and does not necessarily reflect feelings of high competence or efficacy. The
individual with high self-esteem simply respects himself and considers himself a worthy
personality in his community. Low self-esteem, on the other hand, implies self-
rejection, self dissatisfaction and self-contempt. The individual lacks respect for the self
he observes. According to Rosenberg, self-esteem is a fairly unidimensional
phenomenon -an attitude about a specific object- but for Coopersmith, it is more
complex, involving self-evaluation, defensive reactions, and various manifestations of
these processes. Rosenberg (1965), like Coopersmith, stressed the importance of
positive identification with parental figures in the formation of high self-esteem.
However, Rosenberg, unlike Coopersmith, saw early self-definition as not necessarily
advantageous, but as possibly leading to self-consciousness and the inability of the
individual to accept himself as he is. Rosenberg maintained that, although the low self-
esteem person is consistently seen as docile, yielding and submissive, he rejects being
submissive as much as he rejects power and leadership. For Rosenberg, the main
motivating forces behind low self-esteem are “fear of failure” and “fear of interpersonal
criticism”, and these fears very often lead to failure and criticism. Rosenberg
maintained that the child does not have any control over his environment and, since his
self-image is largely unstructured, influence from parents and teachers will be strongly
pervasive.
C h a p t e r T w o
- 34 -
2.2.6.2 Stanley Coopersmith
Coopersmith (1967) was concerned with the antecedents of self-esteem in children. His
self-esteem inventory (SEI) has been used in many studies all over the world. According
to the review of Hansford & Hattie (1982) which was based on a total of 77 studies, the
Coopersmith SEI was the one most commonly used (over 30%) and among 58 tests,
relating to self was identified during their analysis. Coopersmith defined self-esteem as
follows: “The evaluation which the individual makes and customarily maintains with
regard to himself. It expresses an attitude of approval or disapproval and indicates the
extent to which the individual believes himself to be capable, significant, successful and
worthy. In short, self-esteem is a personal judgement of worthiness that is expressed in
the attitudes the individual holds toward himself” (pp. 4-5). Coopersmith’s definition of
self-esteem looks too general rather than specific. As Cassidy (1991) points out, “it is
difficult to imagine how one might arrive at a precise operational definition of self-
esteem” (p. 66). One of the dimensions of self which form the basis of self-esteem is
evaluation and self-esteem involves evaluative attitudes about the self. He refers to self-
evaluation as “a judgmental process in which the individual examines his performance,
capacities, and attributes according to his personal standards and values, and arrives at a
decision of his own worthiness” (pp. 6-7). He separated the observation of self-esteem
into two parts, subjective expression and behavioural expression (1959, p.87).
Subjective expression includes the individual’s self-perception and self-description;
behavioural expression is based on the individual’s prior positive and negative
experiences which are also observed and reported by others. According to Coopersmith,
description of a person’s self-esteem involves a composite index, reflecting both aspects
of self-evaluative behaviour (Coopersmith, 1959, p. 93). Coopersmith (1967) identifies
four variables which determine the individual’s self-esteem: successes, values,
aspirations, and defences. Coopersmith (1967) says “the process of self-judgement
C h a p t e r T w o
- 35 -
derives from a subjective judgement of success, with that appraisal weighted according
to the value placed upon different areas of capacity and performance, measured against
a person’s personal goals and standards and filtered through his capacity to defend
himself against presumed or actual occurrences of failure” (p. 242). For the choice of
values, Coopersmith (1967) argues that we cannot alter our values at will in order to
match our various achievements. Our values are principally those of the community to
which we belong and we are unlikely to use independently derived standards as a major
criteria for judging our own worth. Although individuals are theoretically free to select
their values, the social interactions generally lead to acceptance of group standards and
values. According to him, the general social norms of an individual’s group become
internalised as self-values, so that self-judgements are made in regard to them rather
than in regard to more private and more independently derived standards (pp. 244-245).
The third variable, aspirations, determines the individual’s self-esteem and Coopersmith
(1967) points out that “personal aspirations reflect personal expectations rather than
more general standards or vague secret hopes” (p. 246). Defences is the fourth variable
in Coopersmith’s (1967) formulation and determines the individual’s self-esteem.
According to him, individuals differ in their aspirations and values and they also differ
in their ability to deal with failure and uncertainty. He suggests that individuals with
high self-esteem are theoretically better able to defend themselves against inner and
external sources of distress.
2.2.7 Summary of the Theories
In this review, the self and self-esteem theories were outlined under five sections: the
self in W. James’s pioneer work; the looking-glass self or self in symbolic
interactionism (Cooley, & Mead); the self in Freudian and Neo-Freudian theories
(Freud, Jung, Adler, Horney, Fromm, Sullivan, and Erikson); the self in the humanistic
C h a p t e r T w o
- 36 -
perspectives (Maslow, & Rogers); the self-enhancement and self-consistency theories;
and finally attitudes toward the self or self worth (Rosenberg, & Coopersmith).
Although there are a variety of theoretical explanations on the nature of the self and
self-esteem, it is obvious that most theorists agree that the self is an important concept
in understanding human behaviour. Using the framework of these theories, most of the
recent researchers are still enthusiastically exploring the nature of self-esteem.
2.3 CONCEPTUAL PROBLEMS of SELF-ESTEEM & SELF-CONCEPT
During the past three decades there has been a growing number of studies in the field of
self-perception. The reviews of the literature reveal a list of terms to define self-esteem
such as self-concept, self-image, self-evaluation, self-value, self-perception, self-
assessment etc. Hansford & Hattie (1982), after reviewing 143 studies, identified 15
different self-terms during their meta-analysis. These self-terms were: self-concept, self-
esteem, self-concept of ability, self-acceptance, self-perception, ideal-self, self-
assurance, self-sentiment, self-attitude, self-confidence, self-regard, self-actualisation,
identity development, self-expectation, and self. However, many authors have pointed
out that of all the dimensions of the self, self-esteem and self-concept have been the
most studied (Wylie, 1974, 1979; McGuire & Padawer-Singer, 1976; Damon & Hart,
1982; Rosenberg, 1989; Cassidy, 1991). The review of Hansford & Hattie (1982) also
shows that over 85% of the 144 reviewed studies used only three self-terms: self-
concept, self-esteem, and self-concept of ability. Furthermore, within this literature,
many of these terms, particularly self-esteem and self-concept, overlap with each other
and some of these terms are used interchangeably. Most of the time, researchers have
tended to use terms like self-concept, self-esteem and self-image to mean the same
thing. Harter (1982), reports that “constructs such as self-concept and self-esteem are
vaguely defined at the conceptual level and therefore do not point to any clear
operational definition” (p. 87). Pope et al., (1988) also points out the same problem.
C h a p t e r T w o
- 37 -
Though the terms self-esteem and self-concept appear frequently in the educational,
psychological and personality literature, until recently, reviews have highlighted the
lack of specific definition and differences between these two commonly used constructs
(Wylie, 1979; Beane & Lipka, 1980; Lawrence, 1981; Hansford & Hattie, 1982; Harter,
1982; Pope, 1988; Abdallah, 1989a). Shavelson et al., (1976) point out that:
“... the distinction between self-description and self-evaluation
has not been clarified either conceptually or empirically.
Accordingly, the terms self-concept and self-esteem have been
used interchangeably in the literature.” (pp. 415-416).
The work of Shavelson, Hubner & Stanton (1976), and Shavelson & Bolus (1982),
focused on the development of a model that emphasised the multidimensional,
hierarchical structure of self-concept. However, their model did not clarify self-esteem
from self-concept either conceptually or empirically. Indeed, what they did do was little
more than address the issue of the relationship between self-description and self-
evaluation. Consequently, according to Shavelson, Hubner & Stanton (1976), Shavelson
& Bolus (1982) and Marsh & Shavelson (1985), the descriptive and evaluative
dimensions are not empirically separable. However, it has to be pointed out that most of
the literature distinguishes between the two constructs. They generally explain self-
concept with self-description and self-esteem with self-evaluation (Beane & Lipka,
1980; Gross, 1993; Burnet, 1994). This distinction separates the descriptive and
nonjudgemental (self-concept) aspects from the evaluative self (self-esteem). Beane &
Lipka (1980), suggest that research in the field of self-perception needs to employ at
least two-dimensional instrumentations, the descriptive element (self-concept) and the
evaluative (self-esteem). Beane & Lipka (1986) see self-esteem and self-concept as
distinct dimensions of the broader area of self-perceptions, while Shavelson, Hubner &
Stanton (1976), reported that descriptive and evaluative statements are indistinguishable
and empirically related to each other. Watkins & Dhawan (1989), on the other hand,
C h a p t e r T w o
- 38 -
argued that theoretically, self-concept and self-esteem can be distinguished. They noted
that Marsh’s Self-Descriptive Questionnaire includes self-descriptive (I enjoy sports and
games) items as well as self-evaluative (I am good at sports) items and therefore this
questionnaire measures both self-concept and self-esteem. Recently, Burnet (1994),
investigated the relationships and differences between descriptive and evaluative
aspects of self. He developed an instrument whose items measured both descriptive (I
like ..., I enjoy ...) and evaluative (I am good at ..., I get good marks in ...) beliefs about
seven specific characteristics of the self, which were derived from the areas assessed by
the SDQ1 (Marsh, 1990). These are Physical Appearance, Physical Ability, Peer
Relations, Parent Relations, Reading, Mathematics and School. After his investigation,
Burnet (1994) found that the relationship between self-descriptive and self-evaluative
ranged from 0.36 to 0.83, with a mean correlation of 0.62, indicating in general a
moderately high degree of correlation between the two perspectives and all the
correlations were significant at p<0.05 level. However, in terms of differences between
self-descriptive and self-evaluative, the results of this research indicated that the
differences in most cases were small despite attaining statistical significance, with the
exception of Physical Ability, Peer Relations, and Maths self-concepts. Though the
results of this research suggest that the descriptive and evaluative items are
homogeneous and can be combined to form a single scale, the findings of large
differences between self-descriptive and self-evaluative in Physical Appearance and
Maths subscales require further justification. The author suggests that because
descriptive and evaluative statements are, for the most part, closely related, they should
not be treated as separate constructs.
Though a great number of studies have been done on self-esteem there has nevertheless
been controversy over the utility of such a concept. One of the questions which has been
raised is whether there is such an entity as global self-esteem or whether the individual
evaluates himself separately. In other words, as Cassidy (1991) asks, do individuals
C h a p t e r T w o
- 39 -
value themselves differently, depending on what is asked of them within a specific
context? Simmons (1987) points out that a consensus seems to be emerging which does
embrace both these concepts of self-evaluation. Further, if we assume that self-esteem
does exist as a distinct entity, are specific self-esteem areas able to predict global
measures of self-esteem? Finally, can self-esteem work as a self-regulator in order to
maintain a positive self-concept? It seems that studies about the concepts of self-esteem
and self-concept will be more meaningful both in psychology and in education, when
researchers’ thoughts become clearer about the issue. However, the distinction between
self-esteem and self-concept constructs has yet to be investigated.
2.4 DEFINITIONS OF SELF-ESTEEM
Because of its importance in psychology and education, the interest in self-esteem has
increased and its construct has been discussed in many theories since W. James and his
work (1890), but there is still a lack of consensus in terms of a proper definition. The
concept has been defined in different ways by various theorists or psychologists, each
attempting to fit a definition to their own arguments. When we look at the historical
development of the concept of self-esteem, it is found that there have been over a
hundred definitions. Though some of these definitions are similar to each other, some
others are relatively different and contrasting. Most of them however, are too general,
therefore it is difficult to arrive at a precise operational definition. In order to provide a
better idea about self-esteem, some past and present definitions of the concept are
presented here.
W. James (1890) was one of the first to highlight the general importance of a person’s
accomplishments in his definition of self esteem. He considered self-esteem to be the
ratio of one’s “successes” to one’s “pretensions” indicating as a critical determinant
how we evaluate our self. He defined self-esteem as two kinds of attitudes: “how a
C h a p t e r T w o
- 40 -
person actually perceives himself with respect to some quality or ability and how he
might be or ought to be” (James, 1890, p.310).
Cooley (1902) was the first to point out the importance of subjectively interpreted
feedback from others as a main source of data about the self. For him a self-idea had
three principal elements: “the imagination of our appearance to the other person; the
imagination of his judgement of that appearance; and some self-feeling” (p. 152). It
seems clear that his view about the person’s self-esteem is significantly influenced by
his perception and interpretation of the reaction of other persons to him.
According to Mead (1934) self is not in existence at birth, “but arises in the process of
social experience... through the individual’s relations with the entire process and the
individuals within the social construct” (p.139). She considered self-esteem as an object
which occurs in social interaction as a consequence of the individual’s concern about
how others react to him or her. By this she means that the individual can anticipate
other people’s reactions in order to behave appropriately. The individual then learns to
interpret the environment as the others do. The consideration of others eventually comes
to guide and maintain behaviour even if external forces are no longer present. Self, then,
is a social structure which arises out of social experience. The important point about
Mead’s theory is that self is a process, not a structure.
For Rogers (1951), self-esteem is the way an individual views himself as a “person of
worth, worthy of respect rather than condemnation” (p. 376). In his more
comprehensive definition of self-concept, he states: “the self-concept, or self-structure,
may be thought of as an organised configuration of perception of the self which is
admissible to awareness. It is composed of such elements as the perceptions of one’s
characteristics and abilities; the percepts and concepts of the self in relation to others
and to the environment; the value qualities which are perceived as associated with
experiences and objects; and goals and ideas which are perceived as having positive and
C h a p t e r T w o
- 41 -
negative valence” (pp. 136-137). For Rogers, self-esteem is primarily a social product
and is acquired through social contact. He believed that when we interact with
significant people in our environment we begin to develop a concept of self that is
largely based on the evaluation of others. That means, we evaluate ourselves in terms of
what others think and not in terms of what we feel. Coopersmith (1967) has defined
self-esteem as follows:
“by self-esteem we refer to the evaluation which the individual
makes and customarily maintains with regard to himself. It
expresses an attitude of approval or disapproval and indicates
the extent to which the individual believes himself to be capable,
significant, successful and worthy. In short, self-esteem is a
personal judgement of worthiness that is expressed in the
attitudes the individual holds toward himself” (pp. 4-5).
The definition of Coopersmith is too general and does not provide a precise definition
of self-esteem.
Rosenberg defines self-esteem in a similar way to Coopersmith and he also sees self-
esteem as a self-evaluation component. According to Rosenberg (1965) self-esteem is
“a positive or negative attitude towards a particular object, namely, the self” (p. 30).
High self-esteem, he suggests, is when “the individual respects himself, considers
himself worthy ... recognises his limitations and expects to grow and improve. Low
self-esteem, on the other hand, implies self-rejection, self-dissatisfaction, self-contempt.
The individual lacks respect for the self he observes. The self-picture is disagreeable,
and he wishes it were otherwise” (p. 31).
The definition of Semuels (1977) is similar to Rosenberg: “Self-esteem is the evaluative
sector of the self-concept. An individual who has high self-esteem, respects herself and
considers herself worthy, feels competent, and has a sense of belonging. If her self-
C h a p t e r T w o
- 42 -
esteem is low, she lacks respect for the self and believes she is incapable, insignificant,
unsuccessful and unworthy”.
A broad definition of self-esteem has been put forward by Deaux & Wrightsman (1988)
as “the evaluation of oneself in either a positive or negative way”. Their definition
seems a reflection of Rosenberg’s (1965) theory which employs self-esteem to
designate a kind of overall well-being.
For Faust (1980) self-esteem is a thinking experience. It is related to ideas or thoughts
but not to emotion. He points out that self-esteem reflects an individual’s degree of self-
respect, how an individual values himself as a person. For him self-esteem is
“influenced by feedback from those who people your world. When you add your own
feedback or judgements about what kind of individual you are, this all adds up to ideas
you hold about yourself which is called self-esteem”.
The definition of Young & Bagley (1982) is very close to Coopersmith’s. According to
them self-esteem is “what the individual sees about himself or herself as salient and
important, and how such characteristics are evaluated”.
Self-esteem is also defined as the discrepancy between ideal self and self-image
(Lawrence, 1988). It was also defined as congruency between self and ideal self ratings
in the work carried out by Carlson (1965) and Soares & Soares (1969). Their definitions
of self-esteem are not much different to the definition of Wylie (1961). He defined self-
esteem as follows: “self-regard is self-esteem, the congruence between self and ideal
self, and discrepancies between self and ideal self” (p. 40).
O’Malley & Bachman (1983) viewed self-esteem as a stable component of personality
that is reflected in attitudes about one’s self-worth. The definition of Youngs (1993)
also emphasises self-worth. He defines self-esteem as follows: “Self-esteem is self-
regard. It’s the value each of us assigns to our personhood. Self-esteem is a composite

C h a p t e r T w o
- 43 -
picture of self-value. It’s a self-picture, the reputation you hold with yourself. It’s a total
score, your value - your price tag, so to speak. The building blocks for a healthy self-
esteem depend on positive experiences that shape and affirm a sense of self-efficacy and
self-respect” (p. 60).
Self-esteem could be accepted as a sub-aspect of self-concept (Burns, 1982; Shavelson
and Bolus, 1982; Gross, 1993). According to Burns (1981), “The self-esteem or self-
evaluation is the process in which the individual examines his performance, capabilities
and attributes according to his personal standards and values, which have been
internalised from society and significant others. These evaluations promote behaviour
consistent with the self-knowledge. This conceptualisation of the self-concept places it
firmly within the ambit of attitude study” (pp. 68-69). According to Shavelson, Hubner,
& Stanton (1976), Shavelson & Bolus (1982), and Marsh & Shavelson (1985) self-
esteem and self-concept are not empirically separable. Shavelson, Hubner, & Stanton
(1976) emphasise that self-esteem and self-concept are indistinguishable and
empirically related to each other. However, according to Pope et al. (1988) self-esteem
can be differentiated from self-concept, which is the constellation of things a person
uses to describe himself. For him self-esteem is an evaluation of the information
contained in the self-concept, and is derived from a person’s feelings about all the
things he is. The definition of Beane & Lipka (1986) also differentiates self-esteem
from self-concept. They state: “self-concept is defined here as the description an
individual attaches to himself or herself. The self-concept is based on the roles one
plays and the attributes one believes he or she possesses” (pp. 5-6). For them self-
concept is descriptive, and self-esteem is the evaluative dimension of self perceptions.
The definition of Gross (1993) is as follows: “self-concept can be thought of as the
individual’s beliefs about his / her personality -how the individual perceives his / her
personality” (p. 607). For him “self-image is essentially descriptive, self-esteem is
essentially evaluative: it refers to the extent to which we like and accept or approve of
C h a p t e r T w o
- 44 -
ourselves, how worthwhile a person we think we are” (p. 609). It is clear that Gross
(1993) sees self-image as many authors see self-concept. However, self-esteem, for him,
is one of the three major components of self-concept alongside self-image and ideal-
self.
Both the past and the present reviews and definitions indicate that not only self-esteem
and self-concept, but also, the other self are terms which are used interchangeably.
Many researchers used self-esteem scales to measure self-concept, and also used self-
concept scales in order to measure self-esteem. Sometimes authors used both of the
concepts to refer to the same construct. Despite the great deal of studies to distinguish
self-esteem and self-concept constructs, there is still controversy over the definitions of
the concepts. Therefore, in the present study, the terms self-esteem and self-concept will
be used interchangeably in accord with previous psychologists such as Wylie (1968),
Shavelson, et al. (1976), Rosenberg (1979), Burns (1981), Abdallah, (1989), Cassidy
(1991), and Burnet (1994).
2.5 THE INDICATIONS OF HIGH & LOW SELF-ESTEEM
Self-esteem has great significance personally, socially, educationally and
psychologically. Previous research has found that high self-esteem is positively
associated with better adjustment (William & Cole, 1969), more independence and less
defensive behaviour (Rosenberg, 1965). Most practitioners view positive self-esteem as
a central factor in good social-emotional adjustment (Pope et al. 1988). Personality
theorists such as Horney (1950), Rogers (1951), and Allport (1961) have all regarded
the attainment of positive self-esteem as extremely important. Wylie’s (1979) review of
self-esteem literature suggested that a favourable attitude toward oneself was central to
healthy functioning. Wylie’s review further noted that individuals who sought
psychological help often suffered low self-concepts. Coopersmith’s (1967) study of
C h a p t e r T w o
- 45 -
self-esteem in children reported that self-esteem was significantly associated with
personal satisfaction and effective functioning.
People who frequently seek psychological help may suffer from feelings of inadequacy
and unworthiness. Rogers states that these people see themselves as helpless and
inferior; incapable of improving their situations (Coopersmith, 1967). Clinical studies
show that failure and other conditions which threaten to expose personal inadequacies
are probably the major cause of anxiety. Many studies report that stress and anxiety are
closely related to low self-esteem (Coopersmith, 1967; Many & Many, 1975; Lundgreen
& Schwab, 1977; Lundgreen, 1978). A person with low self-esteem is less capable of
resisting pressure to conform and is less able to perceive threatening stimuli. The person
who has high self-esteem is more likely to assume an active role in social groups and be
able to express his/her feelings and views frequently and effectively. These people
move more directly and realistically toward their personal goals.
If self-esteem is seen as an attitude toward the self, then self-esteem involves the
evaluative dimension. Burns (1981) refers to high self-esteem individuals as those who
like or value themselves highly and who feel competent in dealing with the world in
which they interact. Those with low self-esteem are seen as disliking and devaluing
themselves, as not being competent and not being able to cope effectively with their
environment.
Rosenberg (1965) found that the individual with low self-esteem lacked confidence and
tended to avoid society (pp.185 & 172). An individual with low self-esteem had very
little respect for himself and imagined others to hold the same view (p.151). It was also
found that such an individual could not easily initiate conversation and always had a
feeling of isolation due partly to his unpopularity; a process which tended to be
interactive and which resulted in a failure in his interpersonal relationships (pp.183 &
171). It is not surprising, therefore, that the individual with low self-esteem avoided
C h a p t e r T w o
- 46 -
joining school clubs or societies. Even when committed to membership the individual
was happy to take a passive role in his society (pp.195 & 199). The individual with low
self-esteem was reluctant to call any sort of attention to himself which he regarded as a
form of self trial (p.229). Rosenberg found that the individual who generates high self-
esteem is not only an active member of a number of school societies but usually aspires
to and gains leadership in them (pp.168 & 196). The student with high self-esteem takes
a prominent role in his social environment, whether the society to which he belongs is a
formal or informal group (p.196). In terms of leadership, Rosenberg (1965) found that
60% of the respondents in his survey who had held some elected post in a school
organisation had high self-esteem compared with only 33% who had the least self-
esteem (p.207).
A positive self-esteem is considered to indicate a healthy view of the self. The children
who have positive self-esteem evaluate themselves in positive ways and feel good about
their strong points. Such children are likely to be confident in social situations and also
in tackling scholastic works. They will probably have a curiosity for learning and will
be eager to be successful.
The children with low self-esteem, in contrast, will lack confidence in their ability to
succeed. As a result, they may avoid situations which they see as potentially personally
humiliating. As Pope et al., (1988) report, someone with a low self-esteem frequently
exhibits an artificially positive self-attitude to the world, in a desperate attempt to prove
to others -and himself/herself- that he/she is an adequate person. Indeed, a person with
low self-esteem is essentially a person who finds little to be proud of in himself/herself
after evaluating himself/herself.
Self-esteem is made up of many components. We have to consider not only global self-
esteem, but also other sub-components. For example, a child’s evaluation of himself/
herself in the areas of football, friendship and academic success. His/her global self-

C h a p t e r T w o
- 47 -
esteem will depend on the importance he/she gives to each of the components.
Essentially, if he/she values the areas he/she feels good about, his/her global self-esteem
will be positive, while a devaluation of those areas will result in negative feeling about
himself/herself as a whole. Some children do not appreciate any of their own good
qualities or abilities, and consequently these children will obviously have more
difficulty with their global self-esteem than those who appreciate their strengths.
Briefly, many psychologists agree with the idea that positive self-esteem is related to
happier and more effective functioning.
Self-esteem is also associated with school adjustment (Mooney, et al. 1991). It has been
found that individuals with low self-esteem experience higher interpersonal
awkwardness and increased interpersonal isolation than their high self-esteem
counterparts (Coppersmith, 1967; Rosenberg, 1965). Geist & Borecki (1982) found that
those students responding high in social avoidance and distress also had significantly
lower self-esteem than those students reporting either moderate or low social avoidance
and distress. Furthermore, low self-esteem students tend to underestimate their grades
on examinations (Keefer, 1971; Morrison et al., 1973) and also tend to make lower
grade predictions than students reporting higher levels of self-esteem (Morrison &
Morrison, 1978). Moreover, Morrison & Thomas (1975) found that students with low
academic self-esteem “say less in class,” “contribute a smaller proportion of their
thoughts to class discussion,” and “sit farther back in the classroom than students with
high academic self-esteem”.
Finally, as a component of mental health, self-esteem appears to be associated with
academic achievement (see detail in Appendix C, Table 1). Research has shown a
significant relationship between high self-esteem and academic achievement
(Brookover et al 1964; Patrick et al 1979; Burns, 1981; West et al 1980; Lawrence,
1981 and 1988; Cant et al., 1985; Pope et al., 1988; Rosenberg et al., 1989). However,
C h a p t e r T w o
- 48 -
the issue about whether high self-esteem causes good grades or vice versa is still being
debated point, but causality probably operates in both directions (Coopersmith, 1967;
Pope et al., 1988). A student’s view of his or her academic performance will certainly
affect his/her self-evaluation. Conversely, an individual’s beliefs about himself will
have a strong impact on how well he performs, sometimes in spite of his actual abilities.
However, the relationship of self-esteem with academic achievement will be examined
in more detail in the following section.
2.6 SELF-ESTEEM MEASUREMENT & PROBLEMS
2.6.1 Introduction
Several methods for measuring self-esteem have been propounded. Such diversity is
due to the fact that there are many theoretical approaches to the understanding of self-
esteem, as well as the different aims of the researchers. The choice of the method,
therefore, is determined by the theoretical background of the researcher, his/her
previous experience and his / her personal preference. The researcher must justify the
choices made, with reference to the aims of the study being undertaken. Although the
aim of this study is not to develop a new self-esteem scale, it is thought that it is both
useful and necessary to review different self-esteem measurement methods and
problems.
2.6.2 Methods for Measuring Self-Esteem
There are several methods of classifying self-esteem instruments. Wylie (1968) has
identified three categories: a) measures of self-regard or evaluation along specified
dimensions, b) measures of configurational properties of self-concept, and c) measures
of the conscious self-concept, usually some evaluative aspects of it.
C h a p t e r T w o
- 49 -
Self-esteem has been measured in almost as many ways as there are of defining it.
However, for simplicity, self-esteem measurement methods can be divided into the
following two categories: a) self-report methods and b) observational methods.
2.6.2.1 Self-Report Methods
Self-report methods based on the subject’s own responses can be given in a variety of
forms. These methods are economical and practical in that they can be scored and
interpreted easily, and the researcher can obtain a self-description from a subject in a
short period of time because the measures are structured or semi-structured. Some
possible problems with these methods would be fakebility, social desirability, response
styles, and acquiescence. However, some of these problems can be controlled to some
extent by, for example, using equal numbers of negative and positive statements,
establishing rapport with the subjects, providing a non-threatening climate, and by
assuring anonymity when administering the self-report instruments.
Self-report methods can be further subdivided into the following four main categories:
a) Rating Scales, which are the most common, although these may be prone to errors in
central tendency, response set, and acquiescence. Other problems are in the differential
meanings and ambiguity of trait names or scale units to the respondent. b) Adjective
Check Lists, which are commonly used with children because they relate more
effectively to complete thoughts rather than isolated words (like names or adjectives)
for describing themselves. c) Semantic Differentials, which employ categories on a
continuum which separate a pair of dichotomous traits, though such a form necessitates
the respondent making finer distinctions about himself which he may unable to do.
Fewer points are more likely to add only chance variance to the individual’s judgement
about himself. Another problem is the ground which he can use if he does not care to
respond on a particular item. The advantage of this form is that it provides both
direction and intensity of response on a continuum between two terms which are
C h a p t e r T w o
- 50 -
opposite in meaning. d) Q-Sort, where the respondent sorts out statements which he/she
perceives as ranging from least characteristic to most characteristic of himself / herself
in a quasi-normal distribution of piles. Although the Q technique provides a certain
uniqueness in measurement, individuals may be grouped according to similarity in
profiles but may be entirely different in personality structure. Cluster analysis using
some type of distance function could be a possible answer to this problem. One obvious
limitation of the Q sort is that the procedure is time consuming when a large number of
subjects take part in a research study, because the sorting of statements is usually
administered individually to each subject.
Two other forms - open-ended questionnaires and pictorial or projective techniques -
are also used occasionally. However, they both present particular problems of scoring
and interpretation, and will not be described here.
2.6.2.2 Observational Methods
Here, self-esteem is inferred from the individual’s behaviour. The variety of this type
ranges from the structured interview to the categorising of behaviours by a clinically
trained observer or the measuring of the perceptions of a third person, notably one or
more of the “significant other.” Direct observations are useful for very young children,
where self-report methods may be inappropriate for their age. However, the presence of
the observer may produce behaviour on the part of the subject which could differ if the
observer were not present.
Finally, self-esteem may be inferred from the interaction of two or more types often by
assessing the congruence between self-ratings and ratings of others.
C h a p t e r T w o
- 51 -
2.6.3 Problems in Measuring Self-Esteem
As with any personality measure, there are problems in self-esteem assessment. These
may be seen as essentially those of establishing construct validity. Construct validity is
necessary because a subject’s cognitions and attitudes about himself are private and
beyond direct observation by the investigator. In order to measure self-esteem the
researcher must use some form of self-report where the response is made by the subjects
as a basis for his inferences. Self-report behaviour has usually taken the form of verbal
response or a choice response, when the subject is instructed to indicate specified
conscious processes. Despite their limitations these methods seem to be the only kinds
which are appropriate to this type of construct, in this researcher’s opinion. One of the
problems in measuring self-esteem is that of social desirability. Subjects may attribute
to themselves traits which social consensus would indicate are socially desirable and
acceptable while rejecting those that are socially undesirable and unacceptable. It is easy
to falsify responses so that a positive or a good picture is presented on a self-report
scale. For example, a subject with low self-esteem may wish to hide this fact from
others. Stair (1967) suggests that an individual with low self-esteem will try to hide his
feelings of inadequacy when he/she interacts with other people whom he/she feels to be
important. Another problem involves “faking good” subjects who may hide their true
appraisal of themselves because they are afraid of the negative evaluation they will
receive if they are honest. Wylie (1961) states “no way has been worked out to
determine in what cases and under what circumstances the social desirability variable
distorts individual self-reports away from validity in reflecting a subject’s phenomenal
field” (p. 28). Cowen & Tongas (1959) consider social desirability a very serious
validity threat. In fact several researchers have found a relationship between self-esteem
measures and social desirability (Cowen & Tongas, 1959; Meisels & Ford, 1969).
C h a p t e r T w o
- 52 -
Despite considerable interest in self-esteem and self-concept there have been persistent
methodological problems in measuring this construct (Wylie, 1961, 1974; Wells &
Marwell, 1976; Shavelson et al., 1976; Burns, 1981). According to Gecas (1982) self-
esteem measurement is still a “serious problem” in self-concept research. Wells &
Marewell (1976) described the self-esteem literature in general as having an
“indeterminant character”. Wylie (1961, 1974) was also quite critical of research in this
area arguing that there are far too many instruments used to measure self-esteem and
that most are never re-evaluated for their adequacy or perceived utility. Several
researchers (Wylie, 1961, 1974; Crandall, 1973; Burns, 1981) reviewed a number of
self-esteem measures and they found that most of them lack validity and reliability. The
reviews of Wylie (1961, 1979) examine hundreds of research reports on self-esteem /
self-concept. The conclusion of the author is that most studies purporting to explore
self-esteem are, in fact, not measures of self-esteem at all. According to Wells &
Marwell (1976) the most frequent form of validation used in self-esteem research is
simple face validity or substitution of faith for evidence. In the case of reliability, either
internal consistency, split-half, or test-retest measures is frequently missing. In the
majority of the instruments reviewed, internal consistency and split-half and test-retest
reliabilities have not been reported. According to Wylie (1974) test-retest reliability
estimates (whether using the same or alternate forms) are even rarer in the published
literature. However, more recently, researchers have developed self-esteem instruments
specifically to measure particular aspects of self-esteem that are based on a theoretical
model, and to use factor analysis to test the existence of these aspects.
2.6.4 Summary
There have been a great number of self-esteem / self-concept measures available which
vary greatly in their reliability and validity. One of the main criticisms which is always
stated in the review of self-esteem theory, methodology and research, is that the
C h a p t e r T w o
- 53 -
constructs used in the research are vague and not well defined (Wylie, 1961, 1974;
Shavelson et al., 1976; Wells & Marwell, 1976; Burns, 1981; Beane & Lipka, 1980;
Lawrence, 1981; Harter, 1982; Hansford & Hattie, 1982; Pope et al., 1988; Abdallah,
1989a). The second important criticism is that a large number of studies lacked
information about validity and reliability of the scales. For instance, Wylie (1968)
reported that 90% of the 22 sets of Q-sort scales she reviewed had no information about
the construct validity. Similarly, two-thirds of the Adjective Check Lists, Rating Scales
and Questionnaires lacked information about reliability. Finally, one of the weaknesses
of the self-esteem measures is the non-equivalence of the measures. Therefore one
cannot compare different test results. It is difficult to validate a self-esteem measure by
comparing it with the results of another self-esteem measure. As Abdallah (1989a)
points out, “one has to be very cautions when making a comparison between the results
of one’s research and those of the previous researchers”.
2.7 SELF-ESTEEM & ACADEMIC ACHIEVEMENT
Probably one of the most commonly accepted facts in school is the importance of
academic achievement. The daily efforts and results of students in the classroom are
evaluated by teachers. It is obvious that some students’ potential and academic
performance will be higher than others. Pupils academic achievements may be above or
below the required standards. The students who are high achievers are rewarded by the
classroom value system for their academic achievement and low achievers remain
unrewarded.
Traditionally, schools have favoured the use of competition between children for
encouraging high marks and the fear of failure as a means of motivation. Having a high
score in the examinations is the main concern of the students in these schools, and other
skills and abilities are not as important as their academic achievement. In this
educational system, children who have lower academic achievements than the majority
C h a p t e r T w o
- 54 -
of their classmates, feel that they are incapable and are failures. These students may
develop low self-esteem and a negative self-concept. Because of pressures employed by
most parents and teachers to achieve academically, it is not surprising that most children
use academic attainment as an important criteria of self-worth.
The construct of self-esteem and academic achievement has been of interest to many
researchers since Coleman’s (1966) report, and the findings of a great number of studies
have essentially indicated that there is a relationship between self-esteem (self-concept)
and academic achievement (Purkey, 1970; Wylie, 1974, 1979; Burns, 1981, 1982;
Hansford & Hattie, 1982; Gurney, 1987). However, Wylie (1979) argues that the
relationship between self-esteem and one’s abilities and / or achievement is not a direct
one, but depends on one’s perception of it.
Purkey (1970) claims that “overall, the research evidence clearly shows a persistent and
significant relationship between self-concept and academic achievement”. Uguroglu &
Walberg (1979) made a quantitative synthesis of studies investigating the relationship
between self-esteem and academic achievement; they found that there was an average
correlation of 0.41 for academic self-esteem and 0.29 for general self esteem. These
mean correlation coefficients were calculated from a total of over 70 correlations.
Hansford & Hattie (1982) in their review of 128 studies, investigated the relationship
between self-report measures and academic achievement. They found that correlations
between self-ratings (self-esteem, self-concept etc.) and academic achievement
(performance measures) were ranged between -0.77 to 0.96 with an average correlation
of 0.21. The mean correlation between self-esteem and academic achievement was
stronger among secondary school students (r=0.27) than among Primary students
(r=0.20) and among college / university students (r=0.14). In this study, when self-
ratings scales were differentiated, academic achievement was correlated with self-
esteem r=0.22, self-concept r=0.18, and self-concept of ability r=0.42. Moreover, when
C h a p t e r T w o
- 55 -
academic achievement differentiated to subjects, self-ratings were correlated with GPA
r=0.34, social studies r=0.28, English comprehension r=0.26, language r=0.25,
vocabulary r=0.24, science r=0.24, verbal achievement r=0.20, maths r=0.20, reading
r=0.18, and spelling r=0.09. However, the purpose of this section is to examine some
representative and best known past and recent studies of the relationship of self-esteem
to academic achievement. These studies will be in two groups: The first group of
research based on correlational studies, and the second based on causality studies. The
summary of these studies is shown in Appendix C (Table 1).
2.7.1 Correlational Studies
2.7.1.1 Studies which obtained positive relationship
Coopersmith (1959) reports an r= 0.36, between his SEI score and achievement in the
Iowa Achievement Test in children aged 10 to 12 and a correlation of 0.30 between SEI
scores and Iowa Achievement Tests with socio-economic choice partialled out,
indicating self-esteem was independently related to achievement. Both correlations are
significant at the 0.01 level. A study by Piers & Harris (1964) obtained significant
correlations of 0.19 (p<0.05) and 0.32 (p<0.01) between a 95-item version of the Piers-
Harris and an unspecified achievement test for children in the third and sixth grades
respectively. Bledsoe (1967) reports significant correlations of 0.38 and 0.35 between
self-esteem and The California Achievement Tests for fourth and sixth grade boy
students respectively. Both correlations were significant at the 0.05 level. However,
they were non-significant for girls. The one significant correlation obtained for girls was
between self-esteem and reading comprehension (r=0.29, p<0.05) for fourth grade. The
study of McCallon (1967) reveals that low, high, and median self-esteem groups of over
1000 fifth and sixth grade students significantly differed (p<0.05) in achievement of
“social studies” and “science”. However, different level self-esteem groups did not
significantly differ in “paragraph meaning”, “spelling”, “language”, and “arithmetic”.
C h a p t e r T w o
- 56 -
The manual for the Piers-Harris test (Piers, 1969) includes correlations between an 80-
item version of the test and an unspecified achievement test for boys and girls in the
fourth and sixth grades. All of the correlations were significant, ranging from 0.32 to
0.43, except the correlation for sixth grade girls, which was only 0.06. Bachman (1970)
found a significant correlation of 0.23 between an idiosyncratic self-esteem score in a
representative national sample of 2213 tenth-grade boys attending American Public
High Schools in 1966 based on Rosenberg’s Self-Esteem Scale. An analysis by
Bachman & O'Malley (1977) based on a sample of about 1600 boys from a high-school
class of 1969, showed that self-esteem was positively correlated with educational
success. The study also showed that educational accomplishments seem to have greater
importance for self-esteem during the high-school years than during the 5 years beyond
high school. Sears (1970) obtained a significant correlation of 0.28 between a self-
esteem and a reading test both for boys and for girls. The author also obtained
significant correlations of 0.26 and 0.21 between self-esteem and arithmetical
achievement for 12 year old boys and girls respectively. Trowbridge (1972) correlated
SEI scores and reading test scores of children in experimental and control classrooms.
The target area classrooms were composed of disadvantaged children. She found a
significant correlation within the target area classrooms of 0.33 and a significant
correlation within the nontarget area classrooms of 0.38. Morrison, Thomas & Weaver
(1973) report an r= 0.34 (p< 0.01) between SEI score and grades on an objective test on
material about learning theory. Morrison & Thomas (1975) report an r= 0.26 (p<0.05)
between total SEI score and proportion of thoughts contributing to a class discussion.
Simon & Simon (1975) obtained a significant correlation of 0.34 (p<0.05) between SEI
scores and Scientific Research Associates’ Achievement Series for 10 year-old boys and
girls. However, the significance reached p<0.01 level when the data of both sexes were
combined. Calsyn & Kenny (1977) report a significant correlation of 0.56 (p<0.01)
between self-concept of ability and GPA of 556 Caucasian students in grade eight.
C h a p t e r T w o
- 57 -
Gordon (1977) found a significant correlation of 0.20 (p<0.05) between self-esteem and
GPA, and the correlation was still significant r=0.16 (p<0.05) even when the effects of
locus of control were removed. The author also obtained a significant correlation of
0.25 (p<0.01) between self-esteem and language achievement. A positive correlation
between self-esteem and maths achievement obtained in this research, however, no
significance (r=0.14, n.s.). Baymur et al., (1977), in their investigation to find out
factors affecting academic achievement of university students who were having
scholarships from TUBITAK (Turkish Scientific Research Institution), obtained a
significant relationship between academic achievement and academic self-esteem.
Rubin (1978) investigated the relationship of self-esteem with reading and arithmetic
achievement for students aged nine, twelve, and fifteen. All of the correlations were
significant at 0.01 level for boys. For girls, as well as both sexes combined, there was a
range from 0.21 to 0.42, except the correlations for nine year old boys, which were 0.12
(n.s.) with reading, and 0.15 (n.s.) with Arithmetic. Using the Coopersmith Self-Esteem
Inventory with approximately 800 children in grades 5 and 8, Schnee (1978) found that
the Coopersmith SEI significantly correlated with reading comprehension and word
meaning measures. However, the obtained correlation was non-significant between self-
esteem and mathematical skills. Bagley, Mallick & Verma (1979) report that a 23-item
general self-esteem scale (derived from Coopersmith SEI) significantly correlated with
the Manchester Reading Test, Mill Hill Vocabulary Test, and the Brimer Wide-Span
Reading Test for boys among 2200 white secondary school students in England.
However, school related variables, including tests of achievement, were much less
strongly related to self-esteem in girls than in boys in this research. O’Malley &
Bachman (1979) obtained that self-esteem was positively and significantly correlated
with grades almost equally for boys (r=0.25, p<0.01) and for girls (r=0.24, p<0.01),
among 3183 senior high school students; suggesting that the impact of educational
factors is basically similar for the two sexes. Borges, Ruth, Nichols & Nichols (1980)
C h a p t e r T w o
- 58 -
report that SEI-Total, and Academic-Self, positively and significantly correlated with
actual GPA of college students (r=0.21, p<005; r=0.56, p<0.05 respectively). Moreover,
both the students' total and academic self-esteem scores correlated significantly with
their expected GPA (r=0.20, p<0.05; r=0.48, p<0.05 respectively), indicating that
academic self-esteem scores of students were more strongly related to students GPAs
than to their global self-esteem scores. Lawrence (1981) reports a significant correlation
of 0.39 (p<0.025) between LAWSEQ and Burt World Recognition Test among 15000
nine year old primary school students. Walsh & Winne (1980) tested males with low
achievement and reading difficulties and reported that these males displayed lower self-
esteem, lower expectations, and less persistence than the standard population. These
results were consistent with earlier investigations, which also indicated a rise in self-
esteem in line with a rise in academic achievement (Bledsoe, 1964; Bodwin & Bruck,
1962). Yeger & Miezitis (1980) found that teacher rated pupils with high self-concept
significantly better than the pupil with low self-concept in both social and academic
areas (p<0.05). In this study, students with high self-concepts differed significantly
(p<0.005) with students who had low self-esteem in the Reading test. Moreover, while
50% of the students with low self-concept were found to be attending daily withdrawal
programs, no students with high self-concept did. Shavelson & Bolus (1982) found the
relationship between GPA and subject-matter self-concept (English r=0.34, Maths.
r=0.59, Science r=0.49) to be stronger than the relationship between GPA and academic
self-concept (English r=0.34, Maths. r=0.37, and Science r=0.41) among junior high
school students. A study of Arseven (1986) reveals that academic self-concept scores of
1250 middle school students in Turkey, were positively and significantly correlated with
their Maths (r=0.50, p<0.01) and achievement in Turkish language (r=0.56, p<0.01).
Significant correlations between self-concept of maths and maths grades (r=0.66,
p<0.01), and self-concept of Turkish (language) and achievement in the Turkish
language (r=0.65, p<0.01) were also obtained. Can (1986) found that students with high
C h a p t e r T w o
- 59 -
achievement had higher self-esteem scores than those with moderate or low
achievement among over 1000 10th grade secondary school students in Turkey. In a
study by Gürel (1986) achievement in English (as a foreign language) significantly
correlated with both academic self-concept, and self-concept of English among 214 first
year undergraduate students, in Turkey. All correlations were significant at p<005 level.
Cheung (1986) reports a positive and significant relationship between self-esteem and
academic achievement among 1464 Chinese students, in Hong Kong. The study also
reveals that the relationship is stronger among males than females. Lee (1986) obtained
a significant correlation of r=0.22 (p<0.05) between LAWSEQ and academic
achievement, among 182 students, in England. Dogusal-Tezel (1987) in her
investigation among 5th year Turkish primary school students, obtained a significant
relationship between academic achievement and self-concept (p<0.05). In another
Turkish study, Güngör (1989) investigated the relationship of self-esteem with
perception of academic achievement among secondary school students. The study
revealed that students who had a higher perception on their achievement had
significantly higher self-esteem scores than students who had a lower perception on
their academic achievement. Abdallah (1989a) found that self-esteem significantly
correlated with academic achievement both among English undergraduates (r=0.18,
p<0.04), and among Arab undergraduate students (r=0.20, p<0.02). Chadha (1989)
reports a significant correlation of r=0.27 (p<0.01) between self-esteem and academic
achievement among over 300 twelfth grade students, in India. Rosenberg, Schooler &
Schoenbach (1989) obtained significant correlations of r=0.24 and r=0.25 between self-
esteem and self-reported GPA among over 2000 tenth grade boys. Al-Maneea (1990)
reports that academic achievement of 536 male secondary school students, in Saudi
Arabia, significantly correlated with their score in Brookover’s self-concept of Ability
scale (r=0.40) with Rosenberg’s self-esteem scale (r=0.16, p<0.000), and with Harter’s
Scholastic Competence (r=0.35), and Global Self-Worth scales (r=0.11, p<0.01). In this
C h a p t e r T w o
- 60 -
study, the Social-Acceptance, Athletic Competence, Physical Appearance,
Conduct/Morality, and Close Friendship subscales of Harter’s scale, did not correlate
significantly with academic achievement. Oven (1991) obtained significant and positive
correlations between the GPA of college students and their SEI and self-concept of
ability scores. Correlations in this study ranged from 0.26 to 0.55. Skaalvik (1990)
found a significant correlation of 0.28 between global self-esteem scores of 575 tenth
grade senior high school students and their perceived academic achievement. The
results of this study indicate that students who perceived themselves to achieve poorly
had lower self-esteem than students who perceived themselves to achieve well. The
study of Strassburger, Rosen, Miller & Chavez (1990) revealed that students with low
academic self-esteem had lower GPAs than those with high academic self-esteem
(p<0.001), among 371 Hispanic and Anglo junior high school students. An analysis of
the effect size indicated that academic self-esteem was the single largest contributor to
the variance in GPA (regardless of the students’ ethnicity) and accounted for 14% of the
variance. Carr, Barkowski & Maxwell (1991) investigated self-esteem differences of
underachiever and achiever students. The results indicated that underachiever students’
self-esteem mean scores were significantly (p<0.05) lower than those of achiever
students. The study also revealed significant correlations between general and specific
self-esteem scores and reading awareness, both for achiever and for underachiever
groups. The correlations ranged from 0.20 to 0.39. All were significant at p<0.05 level.
However, the authors obtained non-significant correlations of Reading grade with both
general and specific self-esteem scores. Maqsud & Rouhani (1991) found that self-
concept scores of secondary school students in Southern Africa, positively related to
both English (r=0.21, p<0.05), and Maths achievement (r=0.19, p<0.05). Similarly,
Ersek (1992) reports a significant relationship between self-concept scores of fifth grade
students and their Turkish Language achievement among 154 fifth grade hearing
impaired students, in Turkey. The study reveals non-significant correlation between
C h a p t e r T w o
- 61 -
self-concept and maths achievement. Liu, Kaplan & Risser (1992) found significant
correlations between GPAs of 242 students ranging in grades from 7 to 12, and their
scores in general and academic self-esteem. In this study, correlations ranged from 0.13
to 0.60, and all were significant at p<0.05 level. Maqsud (1993) obtained a significant
correlation of 0.40 (p<0.001) between academic achievement and self-concept of
academic ability among secondary school students in Southern Africa. Similarly,
Mboya (1993) reports significant correlations between self-concept of ability and
academic achievement (r=0.58, p<0.01) among 440 tenth grade secondary school
students. In this study, self-concept of ability significantly correlated with Reading
r=0.52 (p<0.01), Language r=0.51 (p<0.01), and Maths r=0.55 (p<0.01). Okun & Furnet
(1993) report a correlation of 0.41 (p<0.001) between academic self-esteem and GPA of
281 undergraduates. In a recent study Kurtz-Costes & Schneider (1994) obtained
significant correlations between self-concept and achievement among second and fourth
grade students, in Germany. The study indicated that German self-concept significantly
correlated with German grades (r=0.45, p<0.01), and Reading self-concept significantly
correlated with Story Recall (r=0.36, p<0.05) in grade two. In grade four, Reading self-
concept significantly correlated with Dictation grades (r=0.48, p<0.01), and Maths self-
concept significantly correlated with Maths grades (r=0.76, p<0.01). In another recent
study, Sax (1994) investigated the relationship of Maths self-concept with achievement
among over 15000 college students, in the USA. The results of the study revealed that
Maths self-concept significantly correlated with SAT-Maths (r=0.50), with SAT-Verbal
(r=0.23), and with undergraduate GPA (r=0.22), for males. For female groups, Maths
self-concept significantly correlated with SAT-Maths (r=0.39), with SAT-Verbal
(r=0.12), and with high school GPA (r=0.30). All correlations were significant at
p<0.0001 level. However, Maths self-concept scores of students, in this study, did not
significantly correlate with high school GPA for males, or with undergraduate GPA for
females.
C h a p t e r T w o
- 62 -
2.7.1.2 Studies which failed to obtain a relationship
Some studies failed to find any substantial relationship between self-esteem and
academic achievement. In a study of Yarworth & Gauthier (1978), academic
achievement (grades) did not correlate significantly with either total self-concept score
or any of the subscales of Tennessee self-concept scales (Physical self, Moral-Ethical
Self, Personal Self, Family Self, Social Self, Identity, Self-Satisfaction, Behavioural
Self, Self-Criticism, and Instability) among 459 secondary school students. Gadzella,
Williamson & Ginther (1985) obtained a significant correlation between the Self-
Satisfaction subscale of the Tennessee self-concept scale and GPA (r=0.20, p<0.05).
They obtained non-significant correlations between GPA and the Total self-concept, or
any of the seven subscales (Physical Self, Personal Self, Social Self, Family Self,
Identity, Behaviour, and Moral-Ethical Self) for 129 undergraduate students. When
analyses were carried out for males and for females separately, males GPA positively
and significantly correlated with Self-Satisfaction (r=0.29, p<0.05), Moral-Ethical Self
(r=0.27, p<0.05), and Personal Self (r=0.26, p<0.05). However, there was not a single
significant correlation for females. In a study undertaken by Hart (1985), academic self-
image significantly correlated with the NFER-English, NFER-Maths, and the Verbal
Reasoning Test (p<0.05). The study reveals non-significant correlations between self-
esteem (SEI Short-Form) and the NFER-English, NFER-Maths, and the Verbal
Reasoning Test among 128 English secondary school students. Darko-Yeboah (1990)
obtained academic self-esteem scores of both fourth and seventh grade students which
were not significantly correlated with either their reading vocabulary or reading
comprehension scores. Social self-esteem scores were significantly correlated both with
Reading Vocabulary (r=0.36), and Reading Comprehension (r=0.37) for fourth grade
students, but not for seventh grade students. General self-esteem was correlated with
Reading Vocabulary (r=0.30) in the fourth grade, and with Reading Comprehension
(r=0.29) in the seventh grade. However, general self-esteem scores did not correlate
C h a p t e r T w o
- 63 -
significantly with Reading Comprehension in grade four, or with Reading Vocabulary
in grade seven. Though Gaspard & Bernett (1991) report a significant correlation of
0.38 (p<0.002) between academic self-esteem and GPA of ninth grade students, they
obtained non-significant correlations between GPA and SEI-Total, SEI-General Self,
SEI-Social Self and SEI-Home self. Wilson & Fasko (1992) report that self-esteem
scores of 218 students, ranging from grades 9 to 12, were not significantly correlated
with academic achievement (Basic Skills Test). Hancock & Sharp (1993) found that
SEI did not significantly correlate with Reading, English, and Maths scores of 118
prisoners (67 & Black, Age mean = 28.5). Self-esteem did not correlate significantly
with achievement levels of prisoners in prison education programs in the USA.
2.7.1.3 Studies which obtained negative relationship
Some studies report a negative relationship between self-esteem and academic
achievement (Lok, 1983; Wolfe & Grosch, 1992). A study by Lok (1983) reveals that
teacher-evaluated self-esteem scores of 250 ESN(M) students negatively related to their
reading scores. The students with high self-esteem scored lower on the reading test than
did the students with low self-esteem. Wolfe & Grosch (1992) report a negative
correlation of -0.27 between self-esteem and academic achievement (GPA) among 162
college students, indicating that students with high self-esteem had significantly lower
academic achievement than students with low self-esteem.
C h a p t e r T w o
- 64 -
2.7.1.4 Sex Differences in the context of self-esteem-achievement
relationship
Sex differences, in the context of the relationship between self-esteem and academic
achievement, was investigated in previous research and even though some studies
obtained no significant sex differences, some, however, reported that the relationship of
self-esteem with academic achievement was stronger among boys than among girls.
Uguroglu & Walberg (1979) in their investigation of the relationship between
motivational (self-esteem, self-concept, locus of control, achievement motivation) and
academic achievement variables, found that there was no significant sex differences.
The mean correlation for males was 0.35 (calculated from 66 correlations), and for
females 0.37 (calculated from 49 correlations). Hansford & Hattie (1982) in their
review of 128 studies, investigated the relationship between self-report measures and
academic achievement. Their study revealed no significant sex differences in the
relationship of self-esteem with academic achievement. A correlation of 0.26 for boys
and a correlation of 0.24 for girls was obtained. As well as these two reviews, other
studies (Sears, 1970; Simon & Simon, 1975; O’Malley & Bachman, 1979) also found
no sex differences with respect to the relationship of self-esteem and academic
achievement. The study of Sears (1970) reveals that self-esteem scores of 12 year old
students significantly correlated with their reading test and arithmetic achievement both
for boys and girls. Simon & Simon (1975) also obtained similar significant results for
ten year old boys and girls between SEI scores and Scientific Research Associates’
Achievement Series. In another study, O’Malley & Bachman (1979) found that self-
esteem was positively and significantly correlated with grades almost equally for boys
(r=0.25, p<0.01) and for girls (r=0.24, p<0.01) among 3183 senior high school students,
suggesting that the impact of educational factors is basically similar for the two sexes.
However, some studies report that the relationship of self-esteem and academic
C h a p t e r T w o
- 65 -
achievement is stronger among boys than among girls (Bledsoe, 1967; Piers, 1969;
Bagley, Mallick & Verma, 1979; Gadzella, Williamson & Ginther, 1985; and Cheung,
1986). Bledsoe (1967) reports significant correlations between self-esteem and The
California Achievement Tests, for fourth and sixth grade boys. However, they were
non-significant for girls. The manual for the Piers-Harris test (Piers 1969) includes
correlations between an 80-item version of the test and an unspecified achievement test
for boys and girls in the fourth and sixth grades. Although all of the correlations were
significant for boys, the correlation for sixth grade girls, was not significant. Bagley,
Mallick & Verma (1979) report that school related variables, including achievement
tests, were much less strongly related to self-esteem in girls than in boys, among 2200
white secondary school students in England. Cheung (1986) found that positive and
significant relationships between self-esteem and academic achievement among
Chinese males were stronger than among Chinese females, in Hong Kong. Gadzella,
Williamson & Ginther (1985) report that although, males GPA positively and
significantly correlated with Self-Satisfaction (r=0.29, p<0.05), Moral-Ethical Self
(r=0.27, p<0.05), and Personal Self (r=0.26, p<0.05) subscales of The Tennessee self-
concept scale, there was not a single significant correlation for females.
2.7.2 Summary of the Correlational Studies
As can be seen in the above section, several studies have examined the relationship
between self-esteem and academic achievement. The data also indicates that the
academic achievement / self-esteem relationship is slightly stronger among boys than
among girls. The literature reviews show that although some of the research studies
found quite high relationships. Most of them, however, obtained a moderate
relationship between self-esteem and achievement. Some studies found a negative
relationship between self-esteem and achievement. Although a large proportion of
studies have reported a significant self-esteem / academic achievement relationship, the
C h a p t e r T w o
- 66 -
correlations have been uniformly low between the two variables. The issue was
summarised by Wylie (1974) who stated: “The correlations of achievement indices and
overall self-regard indices tend to be small in absolute terms, offering no support to the
commonly accepted lore that achievement and self-concept are strongly associated”
(p.406). Although the review studies of Uguroglu & Walberg (1979) and Hansford &
Hattie (1982), and most of the studies outlined in this section, reveal, in the aggregate,
that self-esteem is significantly associated with academic achievement, most of these
studies do not provide evidence which is strong enough to determine the causal
direction between self-esteem and academic achievement.
2.7.3 Causality Studies
One of the main objectives of the school is to enhance children’s affective development
and increase their academic performance and achievement. However, the question here
is how students’ academic achievement can be increased. Since the late 1960s in
America, much research has been done on self-esteem (self-concept) and academic
achievement. As a result it is believed that to increase students’ academic achievement
and performance, enhancing students’ self-concept is the best approach and
consequently, schools have a responsibility in this area. Since then a great deal of
research has been done, mainly in the USA, and some in Britain and Turkey, on the
effects of either self-concept or self-esteem upon academic achievement and, as can be
seen in the review section, a considerable number of these studies have found a positive
relationship between the two variables. During the twentieth century, in industrialised
countries, improvement of students’ academic performance has been a principal aim of
education. However, ideas on how best to achieve this are constantly changing; whether
to put the emphasis on better teaching skills or to put it on enhancing students’ self-
esteem, in order to improve academic performance.
C h a p t e r T w o
- 67 -
The controversy about whether to concentrate on basic skills or on the enhancement of
self-esteem is still being debated today. In the search for better achievement, researchers
and educational psychologists have mainly joined one of these two groups. One group
claims that the school curriculum should be designed to enhance students’ self-esteem
in order to improve academic achievement (Self-Enhancement Model), while the other
group suggests that intervention programs should employ procedures that will help
children to develop basic academic skills (Basic-Skills Model).
According to the self-enhancement theorists, self-concept is an important variable
influencing both students’ performance and academic achievement. They also argue that
the self-esteem variables are the primary causes of academic achievement. Therefore,
they argue that in order to promote better achievement, self-esteem must be changed
first. Accordingly these theorists and researchers emphasise that considerable time and
effort should be spent in trying to enhance the self-esteem of students by means of the
school curriculum. Specially designed self-enhancement intervention programs to help
children develop a general feeling of self-regard have been designed to promote the
feeling that they are good and worthy people. In contrast to the self-enhancement model,
the basic-skills model defends the structured teaching of specific skills to improve
academic achievement. Basic-skill theorists make no explicit effort to increase the self-
esteem of their students. For them, however, self-esteem is the consequence of
achievement rather than the cause.
In the 1960s and 1970s several educators reported that self-esteem caused academic
achievement. Reviewing the studies on the relationship between self-esteem and
academic achievement, Purkey (1970) claims that self-esteem is causally prior to
academic achievement. He reports that: “it gives us reason to assume that enhancing the
self-concept is a vital influence in improving academic performance” (p. 27). Irwin
(1967) also makes a similar conclusion. According to his findings he suggested that “a
C h a p t e r T w o
- 68 -
positive conception of one’s self as a person is not only more important than striving to
get ahead, and enthusiasm for studying and going to school, but that it is a central factor
when considering optimal scholastic performance” (p. 271). Hansford & Hattie (1982)
in their meta-analysis of 128 studies, which examined the relationship between various
self-measures of achievement and performance, indicated that 95% of the studies they
reviewed used zero-order product moment correlation coefficients. It has to be pointed
out that the statements of Purkey (1970) and Irvin (1967) on the causality of the
relationship between self-esteem and academic achievement have also been primarily
based on correlational data. Pottebaum et al. (1986) point out “any studies of self-
esteem and achievement have used designs that showed a single significant correlation
and imply causation is a well-known error in such methodology” (p. 141). They
maintained that neither correlation nor simple ANOVA provide any information about
the direction of possible causation: whether it is from self-esteem to achievement or
from achievement to self-esteem. In her comprehensive review of the self-esteem
literature, Byrne (1984) suggested that studies which address the direction of the
causality question follow these prerequisites: 1) a statistical relation must be
established, 2) longitudinal designs should be used with a clearly established time
precedence, and 3) a causal model must be tested.
To find out the causality direction, several studies have been specifically designed.
Some studies indicate that academic achievement is causally related to self-esteem
(Calsyn & Kenny, 1977; Newman, 1984; Byrne, 1986; Rosenberg et al., 1989). The
findings of these studies support the skill development theory in which self-esteem is
thought to be a consequence, rather than a cause, of achievement. In his investigation to
find out the causal relationship between self-concept of ability and academic
achievement, Calsyn & Kenny (1977) examined the data of 556 adolescents and used
cross-lagged panel correlation methods. His findings were more supportive of a skill
development model than a self-enhancement model. GPA was causally predominant
C h a p t e r T w o
- 69 -
over both self-concept of ability and perceived evaluations of others, and these patterns
of causal predominance were much stronger in females than males. The study of
Newman (1984) also supported the findings of Calsyn & Kenny (1977). Newman’s
study revealed that maths achievement predicted maths self-concept across grades 2, 5,
and 10. His findings indicated that maths achievement was causally related to maths
self-concept, although self-concept was not in the position of predicting academic
achievement. Rosenberg et al., (1989) also report similar findings. A panel of 1886
adolescent boys was used to explore the reciprocal relationship between self-esteem and
school performance. The results indicated that grades had a decidedly stronger positive
effect on self-esteem than self-esteem had on grades. The significant effect of school
marks on self-esteem, in this research, lends support to the skill development model. As
a result, these studies provided evidence that academic achievement is causally related
to self-esteem and supported the skill development model.
In comparison, the findings of other research support the self-enhancement theory in
which self-esteem is assumed to determine academic achievement (Bridgeman &
Shipman, 1978; Shavelson & Bolus, 1982; Song & Hattie, 1984; Marsh, 1990; Owens,
1991). One of the first empirical results showing causality of self-concept variables over
academic achievement is a study of Shavelson & Bolus (1982). In order to examine the
self-enhancement theory, the authors tested ninety nine seventh and eight grade junior
high school students in February, 1980. In June of the same school year they used cross-
lagged panel analysis to examine the causal predominance of self-concept and
achievement. The results of this study indicated the causal predominance of self-
concept over academic achievement. Marsh (1990) in his investigation examined more
than 1400 students’ academic self-concept and GPA scores at four specific times. He
found that GPA of students in grades 11 and 12 were significantly affected by academic
self-concept measured the previous year, while grades had no effect on subsequent
measures of academic self-concept. The results obtained by Marsh (1990) are in
C h a p t e r T w o
- 70 -
opposition to the findings of Newman (1984). In a recent study, Owens (1991)
investigated the direction of the causal relationship between global self-esteem and
academic achievement, and between academic self-concept and academic achievement.
The study attempted to determine the direction of this relationship through use of the
cross-lagged panel correlation technique, applied to a longitudinal study of community
college students during the fall and spring semesters of their freshmen year. The results
suggest that even though global self-esteem is not causally predominant in academic
achievement, academic self-concept is causally predominant in academic achievement.
Another consideration is that self-esteem and academic achievement effect each other in
a reciprocal manner. Some studies consider this approach (Chapman et al. 1981; Marsh,
1984; Skaalvik & Hagtvet, 1990); Liu, Kaplan, & Risser, 1992; Kurtz-Costes &
Schneider, 1994). The study of Chapman et al., (1981) reveals evidence for a reciprocal
relationship between self-esteem and achievement across a 12-month interval. They
used cross-lagged panel analyses, and obtained correlations ranging from 0.41 to 0.52
between self-esteem and achievement and vice versa for two groups in grades three and
four, and five and six. Skaalvik & Hagtvet (1990), in their investigation among grades
three and six, obtained two different results. They found that achievement measured in
grade three affected self-concept measured one and half years later in grade four. They
reported a reciprocal causal relationship operating from grade four to grade six between
achievement and self-concept for the older group. The authors concluded that the initial
causal predominance of achievement over self-concept diminished over time, leading to
reciprocal relationship between the two concepts. The research of Liu, Kaplan, & Risser
(1992) was another study which showed a reciprocal relationship between self-esteem
and academic achievement. The authors examined general self-esteem, academic self-
concept, and GPA score of 242 students, ranging from grade 7 to 12. The results of this
study confirmed that general self-esteem both influences and was influenced by
academic achievement. In another recent study Kurtz-Costes & Schneider (1994)
C h a p t e r T w o
- 71 -
investigated the same problem. In this study forty-six children’s academic self-concept
and achievement scores were measured at the ages of 8 and 10 but they obtained mixed
results. Their results overall neither supported the skills development theory nor the
self-enhancement theory. The results of this investigation indicated that self-concept at
Time 1 predicted achievement at Time 2, and that achievement at Time 1 predicted self-
concept at Time 2. These results supported a bidirectional relationship between self-
concept and achievement.
Apart from these studies and approaches, some studies have suggested that general self-
esteem and achievement may not be causally related (Maruyama, Rubin, & Kingsbury,
1981). Pottebaum, et al., (1986) in their investigation to determine the presence and
direction of the causal relation between self-esteem and academic achievement, used a
cross-lagged panel correlational technique applied to a longitudinal study of U.S. high
school students. The results of their study suggest that there is no significant causal
relation between self-esteem and academic achievement, but rather that the observed
relation is the result of one or more uncontrolled and unknown third variables. Using
path-analytic models, Watkins & Gutierrez (1990) examined self-concept, attributions,
and grades of 194 Filipino high school students. The authors obtained no direct path
between grades and academic self-concept, the relationship between which, was
mediated by attributions for success through ability and effort.
2.7.4 Summary of Causality Studies
Although much research has been conducted in the last three to four decades concerning
self-esteem (or self-concept) and academic achievement, it has to be pointed out that the
causal relation between these two constructs has yet to be clearly defined. Though many
researchers have used predominantly correlational data, they have commonly stated that
self-esteem causes academic achievement. In recent years researchers have used more
advanced statistical techniques and models (such as longitudinal data, cross-lagged
C h a p t e r T w o
- 72 -
panel analyses etc.) rather than simple correlations or variance analyses to determine the
causal relationship between self-esteem and academic achievement. However, the
research data still does not provide consistent evidence to determine which comes first,
positive self-esteem or academic success. Despite limitations of clear evidence, it seems
logical that educators do not necessarily have to make a decision whether to follow
either the basic-skills or the self-esteem enhancement model. The findings of Owens
(1991) support this idea, and suggest that “we should integrate self-enhancement and
skill-development strategies rather than polarise them” (176). Moreover, enhancing
self-esteem is not important just because it helps to increase academic achievement, it is
also important in the promotion of good social and emotional adjustment and mental
health. Therefore, educators and policymakers should be encouraged to structure school
curricula or programmes to facilitate the achievement of both goals, by following both
simultaneously.
2.7.5 Implications
The findings of this review seem to support the position that students who have clearer
and more positive views about themselves and their capacities, actually do better in
their studies than those with more uncertain or negative views. While we should be
careful about making any firm conclusions, we can say that the relationship between
self-esteem and academic achievement is a valid one. The findings of this review
suggest that an adequate degree of self-esteem is essential for students, because its
effectiveness in achievement. Educational or academic achievement is not, and cannot
be, a product of a single factor, it is instead more likely an outcome of a series of
numerous and different interacting factors, such as the individual’s intelligence,
abilities, motivation, attitude and self-value. All these are not sufficient as separate and
independent factors in achievement, the positive self-perceptions of learners appears to
be generally necessary (Brookover, 1967; Purkey, 1970) and there have been numerous
C h a p t e r T w o
- 73 -
studies supporting the importance of self-esteem in achievement. The implication is that
students who value themselves highly are more likely to perform successfully.
There is a close relationship between an individual’s self-esteem and his / her academic
and social performance. The study of Coopersmith (1967) and Burns (1982) reveal that
a healthy self-esteem is vitally important to the long-term development of an individual
throughout their life. Apart from the evidences showing close relationship between high
self-esteem and high academic achievement, there has also been evidence to show
significant correlation between low self-esteem and academic failing (Burns, 1982;
Lawrence, 1987). A study of Cattell et al., (1966) revealed that of the total variance in
academic achievement 21-25% were accounted for by intelligence tests, 27-36% by
personality and 23-27% by motivational factors. The findings of their study suggest that
the level of prediction of academic achievement could be even more by adding
measures of personality factors to measures of ability and motivational measures. Since
self-esteem is both a personal and motivational variable, its overall contribution to the
variance of academic achievement should be quite high. As outlined earlier in this
chapter, and summarised in Appendix C, Table 1, there have been many studies in the
literature showing evidence relating to academic performance and self-esteem.
Furthermore, physical, social and emotional development are equally important factors
for the educators and therefore the development of self-esteem is placed somewhere in
the centre of the non-cognitive development. The recent trend in educational
psychology suggests that academic development can not easily be isolated from other
aspects of human development.
The study of Coopersmith (1967) showed that apart from the global self-esteem, there
are different aspects of self-esteem (general, social-peers, home-parents, and academic)
that can be measured. Although all of these can be affected by a child’s educational
setting (McNamara & Gill, 1993), the academic self-esteem is a priority. Past research
C h a p t e r T w o
- 74 -
shows that the global self-esteem indices do not usually reveal so strong a relationship.
Several research studies employed both global and academic self-esteem scales and
showed that the relationship of achievement with academic self-esteem is stronger than
its relationship with global self-esteem (Uguroglu & Walberg, 1979; Moore, 1980;
Hansford & Hattie, 1982; Hart, 1985; Al-Maneea, 1990; Strassburger et al., 1990;
Gaspard & Bernett, 1991; Liu et al., 1992). The findings of these and other studies can
be seen in detail in Appendix C, Table 1. Briefly, past research indicates that there is a
relationship between academic achievement and global and academic self-esteem. Past
research also shows that it is possible to enhance self-esteem and also increase
academic achievement of students through either counselling, drama or other activities
(Lawrence, 1988; Pope et al., 1988). The finding of these studies indicates that school
has a crucial role in enhancing both the academic and non-academic self-esteem.
Probably one of the most influential ideas in social psychology has been the notion that
our knowledge, our thinking and our feelings about ourselves is derived from what
others say to us and how they treat us. This idea has been emphasised by many writers
(Cooley, 1902; Sullivan, 1953; Dinkmeyer, 1965). In his well known formulation,
Cooley (1902) put forward that: “self and society are twin born” (p. 5). Mead (1934)
also argued that self actually arises from social conditions, and suggested that the self
was essentially a social process. These ideas indicate that the way in which a person
views himself / herself can be influenced by the way in which others respond to him /
her. There are expectations to perform well in school and it is accepted that the school is
a place where a great number of interactions take place. It provides opportunities for
teachers to judge students and for students to judge each other and the teachers. The
affect of the school on the students’ self-esteem can be examined by the teacher-student,
and student-peer relationship. Although many writers have emphasised the importance
of teachers in the development of self-esteem (Lawrence, 1988; Burns, 1981 & 1982;
C h a p t e r T w o
- 75 -
Pope et al., 1988), several stressed the importance of peer relationship as well
(Coopersmith, 1967; McNamara & Gill, 1993 & 1995).
The work of Coopersmith (1967) and Wylie (1979) showed that there are three major
sources of feedback for school children and each of them affects the individual's self-
esteem. These are the parents, the teachers and the peers. In a paper presented at a
meeting of the American Educational Research Association in Chicago, Hamachek
(1972) revealed the fact that approximately one-third of those students who start school
each year drop out by the eleventh grade. Hamachek felt that the reason why these
youngsters dropped out was not because of some proximate causes, but because of more
or less continuous exposure to failure experiences which reinforced feelings of
worthlessness and inadequacy. According to Brookover et al (1965) simply telling
students that they are successful, encouraging them to persist, or flattering or rewarding
them are techniques unlikely to increase feelings of self-esteem. Coopersmith (1967)
found that giving too little feedback is in itself damaging as the pupil assumes that this
lack of feedback is because they are not worthy of attention. According to McNamara &
Gill (1995) even negative feedback is better for the student's feelings of self-worth than
no feedback, because it makes the student feel important. Kash & Borich (1978) state
that the significant other is “an individual selected and unconditionally valued by the
developing self as a source of self reflection and an interpreter of the behavioural
dialogue” (p. 12). In other words, “the significant other interprets experiences and
events for the child through the feedback, in addition to reflecting an image of the
child” (Burns, 1982, p. 165). It is logical to ask who are the significant others in
schools? Some research shows that a child’s view of the significant others is changing.
McGuire & McGuire (1982) report that as children grow in terms of authority figures,
the child’s self-definition progressively shifts from a relationship with parents to a
relationship with teachers (p. 82). Similarly, Jersild (1952) also states that “the teacher
... is an important factor in the interpersonal field of forces which influence the
C h a p t e r T w o
- 76 -
student’s self development” (p. 94). Students are not passive in the classroom and they
can interpret how their teachers feel about them. In a study, Davidson & Lang (1960)
found that even in the primary level, pupils were well able to evaluate their teachers’
feelings towards them. Those pupils who perceived the teacher as one who presented a
favourable response to them were found to have more positive self-concepts and higher
academic achievement. The study of Ensor (1976) also showed that teachers’ feedback,
in the form of verbal and nonverbal communication, had a positive effect on children’s
self-esteem. Using an observational method, the author recorded teacher-pupil dyadic
interactions in four separate classrooms. Two groups of pupils in each classroom were
identified; those with a high self-concept of their abilities (SCA) and those with a low
self-concept (SCA). Analysis of observation data showed that the high SCA children
received more favourable communications from their teachers, initiated more
acceptable behaviour patterns with the teachers and were more favourably evaluated by
their teachers. Conversely, the low-SCA children received more behavioural criticism
from their teachers, initiated less acceptable behavioural pattern with their teachers and
were less favourably evaluated by their teachers than their high SCA counterparts.
The development of student’s self-esteem is also influenced by the teacher’s status. The
work of Argyle (1967) indicates how attitudes are influenced when the person who sets
out to change attitudes has status and is capable of making a warm relationship with the
subject. Teachers generally have status in the eyes of their students and those who
promote a warm relationship may also influence the individual's self-esteem. The work
of Rogers (1961) produced three important personal characteristics (acceptance,
genuineness and empathy) that are generally accepted to be important in establishing a
warm relationship. These characteristics might help teachers to form a better
relationship with their students in terms of helping their self-esteem. Research also
shows that a teacher’s own self-esteem is an important factor. As Youngs (1993)
stresses “when educators feel unprepared, their own self-esteem suffers, and they lessen
C h a p t e r T w o
- 77 -
their commitment to teaching excellence”. The study of Itskowitz et al., (1989) shows
that the more positive the teacher's self-esteem, the more accurate their evaluation of the
student's self-esteem would be. There are also a number of studies showing the
relationship between positive self-concept and effective teachers (Combs, 1965;
Rosenberg, 1955; Murray, 1972). The study of Peck et al., (1977) shows that teachers
with a highly positive attitude produced a greater increase in student self-esteem than
those with medium or negative attitudes. As well as the teacher’s personal
characteristics affecting the student’s self-esteem, there are other factors within the
control of the teacher which can also affect the self-esteem of students. Many writers
agree that the effect of the teacher’s non-verbal behaviour is a particularly powerful
influence (Lawrence, 1988). Body posture, body orientation, eye contact, pauses in
speech, tone and speed of speech, gestures, can all communicate different messages.
Verbal messages can also either enhance or reduce self-esteem. It is obvious that the
words “you have done well” are more likely to enhance self-esteem than the words “you
can do better than this”. Staines (1958) identified the words and phrases teachers use in
the classroom and found that they could be classified into two groups: those which are
encouraging, praising, valuing, and generally relaxing; and those which are cajoling,
blaming, pushing and generally anxiety-producing. The author also concludes that there
is a positive and a negative way of saying the same thing and that which is used is
crucial in determining its effects on self-esteem. It is worth mentioning that this does
not mean enhancing self-esteem is ignoring poor work or disruptive behaviour. As
Sharp & Muller (1978) point out, teachers have to give students a realistic view of
themselves, not a false one, and when the relationship is a caring, trusting one, they will
accept blame and criticism without damaging their self-esteem.
Although many studies have emphasised the importance of teacher’s attitude,
characteristics, verbal and non-verbal messages in the development of a child’s self-
esteem, not many studies have been undertaken to evaluate the importance of the
C h a p t e r T w o
- 78 -
teacher’s role in improving peer relationship in order to improve students’ self-esteem.
The study of Coopersmith (1967) showed that the peer group was an important factor in
the development of self-esteem. In their two recent studies McNamara & Gill (1993 &
1995) emphasised the crucial role of friendship in self-esteem. They also developed
several techniques showing how a pupil can increase their skill in friendship as well as
showing techniques on how teachers can help their pupil in terms of increasing their
self-esteem throughout peer relationships.
When studies on the relationship between self-esteem and academic achievement were
analysed, it could be seen that most of these were conducted in the USA (see Table 1 in
Appendix C), and only a few studies have been undertaken in Turkey and Britain. Most
of the Turkish studies involved primary school students. The literature review revealed
that there has been only one study (Can, 1986) where subjects were Turkish secondary
school students. The results of the literature review concerning the magnitude of the
relationship between self-esteem and academic achievement between boys and girls,
indicated that the relationship between these two variables was slightly stronger for
boys than for girls. However, there have not been any Turkish studies to investigate this
issue. The lack of self-esteem studies in Turkey indicates that perhaps Turkish
educational authorities, school directors, and teachers are not aware of the role of self-
esteem in achievement. Therefore, the research in the area of self-esteem is necessary
and worthwhile, and this study is expected to offer some contribution to the Turkish
educational system.
The importance of self-esteem perhaps comes from its dynamic character. There have
been numerous studies showing the effectiveness of programmes in terms of enhancing
students’ self-esteem (Friedman et al., 1975; Zeeman, 1982; Omizo & Omizo, 1988;
Canfield, 1990; Necessary, 1993; Weaver & Matthews, 1993). The findings of these
studies suggest that considerable gains in pupil’s self-esteem can be achieved through a
C h a p t e r T w o
- 79 -
programme of systematic but fairly basic counselling provided by a class teacher.
However, before starting any activity in terms of helping students’ self-esteem, it is
clear that we need a tool to measure the self-esteem of students. The literature reveals
that there have been several methods and instruments to measure self-esteem, however,
this issue will be discussed in detail in Chapter Five. Past studies show that one of the
most popular and most commonly used instruments is the Coopersmith Self-Esteem
Inventory, and a great number of studies support its validity and reliability (for detail
see Chapter 4). Therefore, another main objective of this study is to assess the reliability
of the Coopersmith Self-Esteem Inventory for both English and Turkish year-11
secondary school students. The Turkish literature reveals that the instrument has never
been used in any research predicting the relationship between self-esteem and
achievement for Turkish secondary school students. Moreover, in searching the
published literature, the present researcher could find no Turkish studies assessing the
reliability of this instrument for the Turkish secondary school students. Furthermore,
some of the Turkish researchers (Özogul, 1988) in their description of SEI, interestingly
claim that the possible maximum score of the SEI was 58. In fact, although SEI consists
of 58 questions, as Coopersmith (1991) emphasis, eight of them are “lie” questions and
measure “defensive attitude”, not self-esteem. Therefore researchers should not add
them to the total self-esteem scores. The possible maximum self-esteem score in SEI is
either 50 or 100 when the scores are multiplied by two, as Coopersmith suggests in the
manual of his instrument (Coopersmith, 1991). This indicates that some of the Turkish
researchers are not aware of these calculations and eight items of lie questions have
been added to total self-esteem scores. It is clear that the validity of the instrument
would be damaged when scores of 16% of the all questions, which are not actually
measuring self-esteem, are added to self-esteem scores. Therefore, it seems crucial and
worthwhile to estimate the reliability of the SEI for Turkish secondary school students.
C h a p t e r T w o
- 80 -
2.8 SEX AND GENDER DIFFERENCES IN SELF-ESTEEM
During the second half of the twentieth century, there has been a great deal of
discussion and controversy about the status and role of women particularly in Western
societies. In many societies and cultures, it is commonly acknowledged that men and
women are expected to perform different roles, and have different attitudes and
functions. Although Carlson (1965), suggests that self-esteem is a relatively stable
dimension of self and is independent of the sex role, some social theorists argue that it
is the socialisation process that guides men and women in different directions
(Rosenberg & Simmons, 1975). They assume that females would have a lower self-
esteem than males because of the expectation of society. This includes the promotion of
male images as superior, beliefs in the inferiority of females and so on, which
undermine the female identity (Skaalvik, 1986). According to Freeman (1970) the
inferior social status of women is generally reflected in low self-esteem, which in turn
contributes to relatively lower achievement among women. Freeman states:
“What these new interpretations say is that women are the way
they are because they’ve been trained to be that way ... their
motivations as well as their alternatives have been channelled by
society ... Their motivation is controlled by the socialisation
process. Women are raised to fill the social roles in which
society needs them” (p. 36).
Wylie (1979) in her review of the research conducted before the seventies, concluded
that there is no doubt that certain traits are differentially ascribed to the typical male and
the typical female, at least in respect of college students. Females are typically described
as warm and sensitive, socially skilled, and inclined toward interpersonal and artistic
interests. Males are described as competent and logical, possessing self-confidence,
direct in manner, and dominant. Although it is agreed that both sexes possess
favourable qualities, males are regarded more favourably than females by both sexes.
C h a p t e r T w o
- 81 -
There is also evidence that there is considerable overlap between individuals’ self-
concepts and the generally-held sex-role stereotypes. However, Wylie (1979) reports
that most studies of the relationship between sex and overall self-esteem have found no
significant differences between boys and girls. She notes that: “the evidence from these
studies is inconsistent: null results appear as frequently as results favouring males. In
two studies females exceeded males on over-all self-regard. ... The majority report null
results, while no trend in favour of either sex is discernible among the rest” (Wylie,
1979, pp. 277-278). Wylie put forward a number of possible reasons for null findings
including the practice of summing across items in order to obtain a global self-regard
score. She speculates that: “perhaps males and females obtained equivalent total scores
by endorsing different sets of items” and suggests that item and factor analyses be
performed separately for each gender. This would allow for the possibility that factor
structures of overall self-regard would be similar for both sexes, but females may obtain
higher scores on some factors, and males on others. The ideas of Wylie were supported
by the study of Harter (1982). The author reports that on an analysis of the “Perceived
Competence Scale”, it consistently revealed that boys reported perceptions of greater
physical competence at sports and outdoors games than girls do. In contrast to Harter’s
(1982) findings, Ladd & Price (1986) found that cognitive and social competence are
the main areas for sex differences, their studies, however, failed to find sex differences
in the areas of general and physical competence. Their study revealed that girls tended
to underestimate their cognitive and social competence, while boys overestimated their
cognitive and social competence. Physical competence has also received attention in
some studies; Omark et al., (1975) reports that boys show great concern with being
“tough”, and toughness was regarded as an important adjective for the boys. Eaton &
Enns (1986), in their investigation among the results of 90 citations, found that males
were more active than females. Maccoby & Jacklin (1974) reviewed over 30
comparative studies and concluded that there were not any consistent gender differences
C h a p t e r T w o
- 82 -
in self-esteem. Skaalvik (1986) examined ten studies, including subjects predominantly
in the adolescence age range of 12 to 18 years. Among the eight studies they analysed,
boys scored significantly higher than girls in general self-esteem. Burns (1981) reported
from Australian studies that boys have a more positive self-concept than girls. Recently,
Renshaw (1990) has arrived at the same conclusion as Burns (1981). In contrast, Marsh
et al., (1984) obtained no significant sex differences in total self-concept of Australian
students. Furthermore, these authors found that, while boys had a more positive self-
concept than girls on only one subscale, girls had significantly more positive self-
concept on four subscales. They also obtained non-significant sex differences on
another five subscales.
In the next section, the findings of sixty studies from 1959 to 1994 which reported data
on sex differences will be examined.
2.8.1 The Present Review
In this review, in order to examine sex differences in self-esteem, a total of 60 past and
recent studies were analysed. These studies were based on a total of 85 samples, and
provided a total of 169 comparisons. The summary of these studies is shown in
Appendix C (Table 2).
Two studies (Lee, 1986; Martinez & Dukez, 1991) out of sixty provided self-esteem
scores for boys and for girls separately, but they did not report whether these differences
were statistically significant or not, therefore these studies were eliminated. However,
the mean self-esteem scores of boys were higher than of the girls in both studies of Lee
(1986) and Martinez & Dukez (1991). After the elimination of the two studies, the
number of studies was reduced to fifty-eight.
Firstly, when the overall self-esteem scores of the 58 studies were analysed, a large
proportion of them, thirty-six studies (62.1%), showed no significant sex differences.
C h a p t e r T w o
- 83 -
The findings of the fifteen studies (25.9%) found significant sex differences in favour of
boys, and only five studies (8.6%) obtained significant sex differences in favour of girls.
Two studies (Bagley, Mallick & Verma, 1979; Cassidy, 1991) however, obtained mixed
results. The studies of Bagley et al., (1979) revealed significant sex differences in
favour of boys among secondary level English students. They also obtained significant
sex differences among West Indian students. In contrast to the English sample,
significant sex differences among West Indian students were in favour of girls. Cassidy
(1991) also obtained mixed results. He obtained sex differences in favour of males
among science revision students, but obtained no sex differences among medical
students.
The following thirty-six studies obtained no sex differences in global self-esteem:
Coopersmith, 1959; Piers & Harris, 1964; Sears, 1970; Friedman, Rogers & Gettys,
1975; Simon & Simon, 1975; Drummond, McIntire & Ryan, 1977; Yarworth &
Gauthier, 1978; Koyuncu, 1979; Growe, 1980; Moore, 1980; Yeger & Miezitis, 1980;
Halpin, Halpin & Whiddon, 1981; Onur, 1981; Bond & Cheung, 1883; Lok, 1983;
Marsh, Barnes, Cairns & Tidmen, 1984; Serifi, 1985; Can, 1986; Berber, 1986;
Dogusal-Tezel, 1987; Süzen, 1987; Yurdagül, 1987; Satılmıs, 1988; Verkuyten, 1989;
Abdallah, 1989a; Chadha, 1989; Güçray, 1989; Türkmen, 1989; La Greca & Stone,
1990; Lalkhen & Norwich, 1990; Maqsud & Rouhani, 1991; Tashakkori & Thompson,
1991; Ersek, 1992; Wilson & Fasko, 1992; Maqsud, 1993; and Yong, 1994.
The following fifteen studies obtained significant sex differences in favour of boys in
global self-esteem: Good & Good, 1975; Rosenberg & Simmons, 1975; Calsyn &
Kenny, 1977; Louden, 1977; Loeb & Horst, 1978; O’Malley & Bachman, 1979;
Cheung, 1986; Robison-Awana, 1987; Özogul, 1988; Cheng & Page, 1989; Skaalvik,
1990; Wigfield et al., 1991; Bekhuis, 1994; Dukes & Martinez, 1994; Sax, 1994.
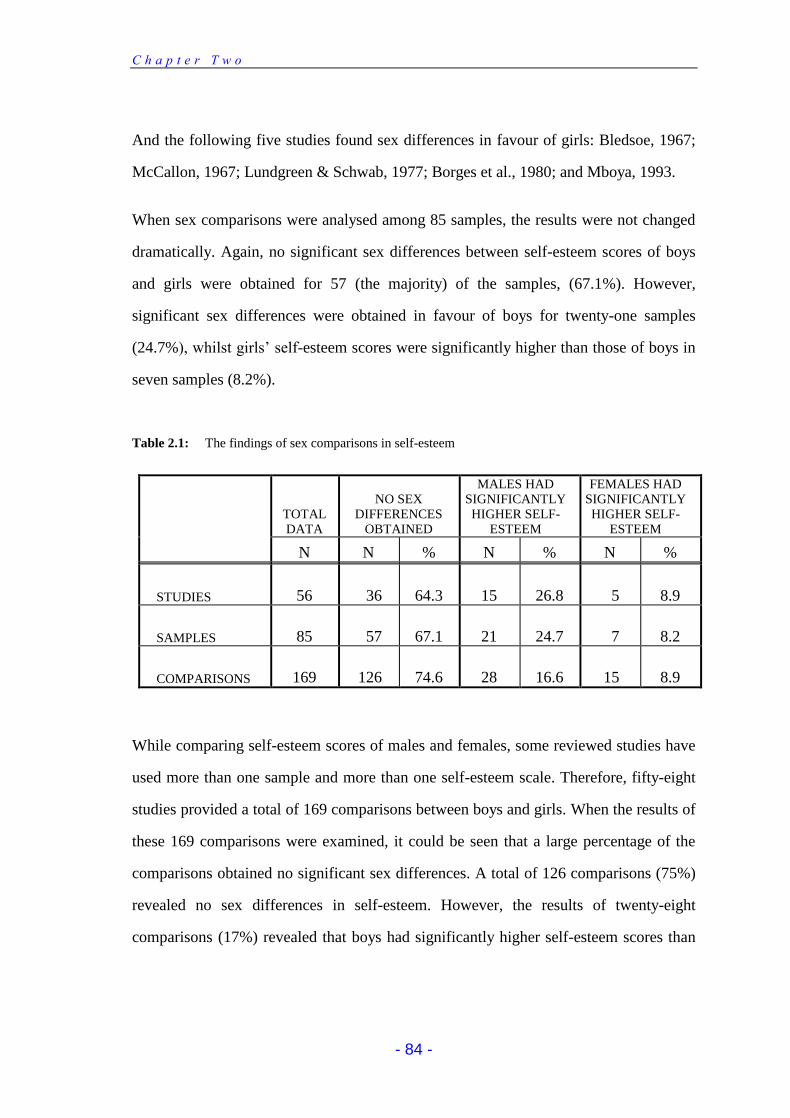
C h a p t e r T w o
- 84 -
And the following five studies found sex differences in favour of girls: Bledsoe, 1967;
McCallon, 1967; Lundgreen & Schwab, 1977; Borges et al., 1980; and Mboya, 1993.
When sex comparisons were analysed among 85 samples, the results were not changed
dramatically. Again, no significant sex differences between self-esteem scores of boys
and girls were obtained for 57 (the majority) of the samples, (67.1%). However,
significant sex differences were obtained in favour of boys for twenty-one samples
(24.7%), whilst girls’ self-esteem scores were significantly higher than those of boys in
seven samples (8.2%).
Table 2.1: The findings of sex comparisons in self-esteem
TOTAL DATA
NO SEX
DIFFERENCES OBTAINED
MALES HAD SIGNIFICANTLY HIGHER SELF-
ESTEEM
FEMALES HAD SIGNIFICANTLY HIGHER SELF-
ESTEEM
N N % N % N %
STUDIES 56 36 64.3 15 26.8 5 8.9
SAMPLES 85 57 67.1 21 24.7 7 8.2
COMPARISONS 169 126 74.6 28 16.6 15 8.9
While comparing self-esteem scores of males and females, some reviewed studies have
used more than one sample and more than one self-esteem scale. Therefore, fifty-eight
studies provided a total of 169 comparisons between boys and girls. When the results of
these 169 comparisons were examined, it could be seen that a large percentage of the
comparisons obtained no significant sex differences. A total of 126 comparisons (75%)
revealed no sex differences in self-esteem. However, the results of twenty-eight
comparisons (17%) revealed that boys had significantly higher self-esteem scores than
C h a p t e r T w o
- 85 -
their girl counterparts, while only fifteen comparisons (9%) revealed that sex
differences were in favour of girls.
When the studies were analysed, it could be seen from Table 2 in Appendix C that most
of these studies were American. However, a total of eight British, and thirteen Turkish
studies were included in this review and when findings of British and Turkish studies
were examined separately, among eight British studies, two studies (Louden, 1977;
Bagley et al., 1979) obtained significant sex differences, in favour of boys. Cassidy
(1991) obtained mixture results. He found sex differences in favour of boys among
science revision students, but did not find them among medical students, in Northern
Ireland. Although Lee (1986) obtained sex differences in favour of boys, he did not
report whether these differences were significant or not. None of the remaining four
studies, however, obtained any sex differences (Moore, 1980; Lok, 1983; Abdallah,
1989a; Lalkhen & Norwich, 1990). In contrast to what was expected, sex differences
among Turkish students in favour of boys were only found in one study (Özogul, 1988)
while the rest of the twelve studies reported no sex differences between the self-esteem
scores of Turkish boys and girls (Koyuncu, 1979; Onur, 1981; Serifi, 1985; Berber,
1986; Can, 1986; Dogusal-Tezel, 1987; Süzen, 1987; Yurdagül, 1987; Satılmıs, 1988;
Güçray, 1989; Türkmen, 1989; and Ersek, 1992).
2.8.2 Summary & Implications
Since the mid-1960s, many studies have focused on sex differences in self-esteem. Even
though most of the past studies reported no major sex differences in self-esteem, the
studies that reported sex differences in favour of boys seem to be more numerous than
those that found sex differences in favour of girls. The present review was undertaken
in order to arrive at a cumulative result of past and present studies. Therefore, the
findings of fifty-eight studies, (between 1959-1994) including thirteen Turkish, and
eight British, were examined. It has to be pointed out that recent studies on sex
C h a p t e r T w o
- 86 -
differences in self-esteem have used a wide variety of instruments and have produced an
equally varied set of results.
In summary, the most frequent finding is an absence of statistically significant sex
differences in self-esteem. This is consistent with Wylie’s (1979) assessment of the
evidence concerning overall self-esteem. Since the majority of the studies obtained null
findings which are inherently ambiguous, one could only speculate about the meaning
of these results. As over 20 different instruments were used in order to measure self-
esteem and self-concept in this review, it seems likely that instrument deficiencies are
responsible for a certain level for null results, many of which have not received a good
deal of psychometric exploration. Some of the instruments have been used for the first
time, such as the Taisir Self-Esteem Questionnaire (Abdallah, 1989a). Furthermore,
some of the instruments have consisted of only a few items. The self-esteem
instruments which are used in the study of Martinez & Dukez (1991) and Sax (1994)
consisted of only one item, the instrument which is used in the study of Bekhuis (1994)
consisted of only four items. Although the Coopersmith SEI (17 studies) and the Piers-
Harris Self-Concept Scale (7 studies) were the two most commonly used instruments in
this review, the reliability and validity of some other instruments are however,
questionable, since they were used for the first time. Apart from this reason, another
possibility for obtaining null results might be the inequality of the sex groups. When
reviewed studies were examined it could be seen that investigators often failed to
establish their whether sex groups were comparable on other variables (such as
academic achievement or SES) which may be related to self-esteem. The sex of the
experimenter might also be a factor. Wylie (1979) regards this as being an important
factor which may influence the student's answer. The sex of the experimenters were not
controlled for most of the studies reviewed.

C h a p t e r T w o
- 87 -
Although it is possible that the recurrent failure to find significant sex differences for
the majority of the studies indicates genuine similarity between the sexes in overall self-
esteem, this would be inconsistent with the many theories that predict lower self-regard
in females than males. In fact, the findings of the present review do not reveal exact
equality between self-esteem of males and females. Although about 75% of all the
comparisons failed to obtain a significant sex difference in self-esteem, the number of
comparisons which show that males had significantly higher self-esteem scores than
females are more than double the comparisons which found that females had higher
self-esteem scores than males. While the present review overall does show girls to have
somewhat lower self-esteem than boys, the differences are quite modest. In fact many
recent discussions have emphasised the importance of the changing self-concepts of
women. The influence of the recent feminist movement might be an important factor in
relation to these results. However, evidence across different research studies is largely
consistent, revealing a common core of stereotyped characteristics. Males are described
as competent and logical, possessing self-confidence, direct in manner and dominant.
Females are described as warm and sensitive, socially skilled and inclined toward
interpersonal and artistic interests. Despite the fact that women now constitute a greater
percentage of the nation’s workforce than in the past, female roles still continue to be
stereotyped primarily in terms of domestic responsibilities in many societies. Such
stereotypes are slow to change within in culture. However, the modern women’s
movement does take the position that basic changes in attitudes are essential to achieve
true equality of opportunity.
Since one of the aims of the present study is to find out sex differences in self-esteem,
previous Turkish studies have been examined. Past Turkish studies reveal that a total of
twelve Turkish studies were identified which produced self-esteem data for Turkish
male and female students separately (Koyuncu, 1979; Onur, 1981; Serifi, 1985; Can,
1986; Dogusal, 1987; Süzen, 1987; Yurdagül, 1987; Özogul, 1988; Satılmıs, 1988;
C h a p t e r T w o
- 88 -
Güçray, 1989, Türkmen, 1989, and Ersek, 1992). When these studies were examined it
could be seen that eleven of them revealed no significant differences between self-
esteem of Turkish male and female students. The only exception was the study of
Özogul (1988). This study reports that boys had significantly higher self-esteem scores
than girls among primary school students. Six of the twelve studies were primary school
students, and four studies were secondary school students. The other two studies were
undergraduate students, and homeless adolescents. After examining the instruments
used for these studies, a total of five instruments were identified. The Baymur Self-
Concept Scale was used for four studies, the Piers-Harris Self-Concept Scale for
Children, and the Coopersmith SEI were each used for three studies. The remaining two
instruments were the Rosenberg Self-Esteem Inventory and the Giessen Self-Concept
Scale. These studies of sex differences in self-esteem showed that the Coopersmith SEI
had not been used in any study of secondary school students in Turkey. All three studies
used the Coopersmith SEI for primary school students. When these Turkish studies
were examined it could be seen that nearly all of them were conducted either in Ankara
or Istanbul and therefore they do not represent the whole country. From the writer's
observations, the sex role of women is very different in rural areas and in the eastern
part of Turkey. Therefore one needs to be careful before making any firm conclusions.
In summary, the majority of the reviewed studies fail to support a relationship between
sex and self-esteem both in Western countries and Turkey. Although various
speculative interpretations may be offered to explain the repeated finding of null results,
no firm conclusions can yet be drawn. The question of sex differences in the literature
remains unresolved.
C h a p t e r T w o
- 89 -
2.9 CULTURAL DIFFERENCES & SELF-ESTEEM
2.9.1 Introduction
Self-esteem has been shown to be a significant personality variable in determining
human behaviour, and culture is one of the more significant social issues in modern life.
However, cross-cultural comparisons of self-esteem and self-concept studies are few.
As Bond & Cheung (1983) report, there have been a remarkably small number of
studies on self-esteem conducted in cultures outside North America and Northern
Europe. However, it is noted that a large proportion of the cross-cultural studies in the
USA, Britain, Australia, and other European countries, have mainly compared the self-
esteem of the majority groups with immigrant or minority ethnic groups. In most of the
American studies researchers compared the self-esteem of Whites with Blacks or other
culturally disadvantaged minority ethnic groups such as Indian, Chicano, Hispanic,
Asian etc. In Britain, several cross-cultural studies have been undertaken in order to
make comparisons of self-esteem among British, West Indian, and Asian immigrants.
Several studies were also conducted for similar purposes in Australia and in the
Netherlands. However, there are very few cross-cultural comparisons between or among
two or more nations in the literature. In this section the findings of 19 cross-cultural
studies are summarised. The findings of these studies can also be seen in Table 3,
Appendix C.
In a study by Hirsh & Rapkin (1987) the authors compared the self-esteem scores of
White, and Black American junior high school students. In this study, although there
were no significant race differences on overall self-esteem between Blacks and Whites,
multivariate analyses of symptom data revealed that Blacks reported greater distrust of
the environment than they reported negative internal states, whereas Whites reported the
opposite pattern. In another study, Tashakkori & Thompson (1991) also compared
C h a p t e r T w o
- 90 -
a large group of White (n=14,721) and Black (n=5,197) high school students’ self-
esteem scores, in 1980, 1982, and in 1986, in the USA. Univariate ANOVAs on the
three general self-esteem scores (at three time periods) indicated a significant
interaction of race and sex (except for the 1986 data). Across all three measures of self-
esteem, means for Black adolescents were higher than those for White adolescents.
Despite being statistically significant, the magnitude of differences between Blacks and
Whites approached zero over time. The race differences were bigger between female
subjects than male subjects. In a recent large study Bekhuis (1994) measured self-
esteem scores of over 13,000 secondary school students, in the USA. In this study, self-
esteem measures were based on four items from the Rosenberg Self-Esteem Scale, and
25% of the sample consisted of Black students. In this study, the self-esteem of Black
students on average was found to be higher than White students. Using Coopersmith
SEI with 97 Flathead Indians and 128 White junior and senior high school students, in
the USA, Halpin & Halpin (1981) found that White students had significantly more
positive self-esteem than Indians (p<0.05). Strassburger et al. (1990) compared the
academic self-esteem scores of Anglo and Hispanic junior high school students, in the
USA. Using the Coopersmith SEI Academic scale, they obtained no significant cultural
differences between the two ethnic groups. Martinez & Dukez (1991) compared the
self-concept scores of American ethnic groups of American Indian, Black, Hispanic,
Asian, and White, ranging from grade 7-12 (N=6651 in 1983, N=6838 in 1986). Self-
concept was measured twice in this study, in 1983 and in 1986, by a single question of
“how satisfied are you with yourself?” and a single question of “how intelligent do you
think you are compared with others your age?”. For “self-satisfaction” a five point scale
was used and for “perceived intelligence” a seven point scale was used. The study
revealed that Asian females were the least self-satisfied group, followed by White and
Native American females. Black females and Chicanos had the highest levels of
satisfaction with self among females. An interesting finding with self satisfaction was
C h a p t e r T w o
- 91 -
that White males were not the most satisfied group in either survey - Chicanos were (in
1983 and 1986), especially in terms of a consistent pattern. In 1986, Black and Native
American males also had higher averages than White males, but their patterns were not
very consistent. Also, in one of the two time periods Chicanos and Black females were
at least equal to White males in satisfaction with self. In Perceived Intelligence,
however, White males were the highest of any ethgender group. In another recent
American study, Dukes & Martinez (1994) compared the self-esteem scores of five
ethnic groups (Whites, Blacks, Hispanics, Natives, and Asian). The study consisted of
over 18,000 secondary students, and the Rosenberg Self-Esteem Scale was used to
measure the self-esteem scores of subjects. The study revealed that the whites had
significantly higher self-esteem scores than the minorities (p<0.005). Among the five
ethnic groups, White males had the highest self-esteem, followed by the Black males,
Hispanic males, Black females, Asian males, Native males, White females, Hispanic
females, Native females, and Asian females. In another recent American study Yong
(1994), compared the self-concept of gifted students (grades 6-8) of African-American,
Mexican-American, and Chinese-American origin. In this study the author used A Self-
Concept Scale for gifted children, and the three-way analysis of variance on subject
scores revealed significant cultural differences in self-concept (p<0.005). Significant
differences in self-concept existed between African-American and Mexican-American
students, and between African-American and Chinese American students. African
American students obtained a higher mean self-concept score than Mexican-American
and Chinese-American students.
The Meta-analysis of Hansford & Hattie (1982) (a total of 81 studies reviewed) revealed
the average correlations between self-ratings and academic performances with respect to
different ethnic groups:
C h a p t e r T w o
- 92 -
Ethnic Groups Mean
Anglo 0.33
Filipino 0.30
Bolivian 0.27
Chicano 0.23
Black 0.19
Mixed 0.13
Kenyan 0.10
Indian 0.04
Apart from these cross-cultural studies among American ethnic groups, there have been
some studies in Britain. Jones (1977), using a 23-item general self-esteem scale (derived
from the Coopersmith SEI) with over 1600 English and West Indian adolescents
attending London secondary schools, found that West Indian males and females had
significantly poorer levels of self-esteem than their White peers. Although West Indian
pupils were much more likely than whites to be included in school sports teams, and to
excel in sport generally, this success in sport was not correlated with SE levels.
Although English pupils who excelled at sport had higher levels of self-esteem, this was
a function of their generally higher stream level. Blacks, even those excelling in sport,
were generally in lower streams, and it was probably this stream membership rather
than sporting success which was the most powerful influence on self-esteem. Those
West Indians who were in higher streams tended to have levels of self-esteem which
were equal to those of their peers in the same stream. In another British study, Lomax
(1977) compared self-esteem of West Indian and White girls. The subjects for this study
were taken from a large girls’ secondary school in London, and in this school, over two
thirds of all students were West Indian. Self-esteem scores of students were measured
by a sentence completion test. The author found that West Indian girls had significantly
higher levels of self-esteem than their White peers. However, West Indian girls born in
Britain had poorer self-concepts than West Indian girls born in the Caribbean. Using the
Rosenberg Self-Esteem Scale, Louden (1977) compared 15-16 year old West Indian,
C h a p t e r T w o
- 93 -
Asian, and English adolescents. The study revealed no significant difference in self-
esteem among the three ethnic races. However, boys had significantly higher scores
than girls in self-esteem (p<0.01) in each ethnic race. Bagley, Mallick & Verma (1979)
used Coopersmith SEI, and conducted a similar study to Louden’s (1977). They found
that the self-esteem level of Asian adolescents, in general, did not differ significantly
from those of their English counterparts. However, West Indian boys had significantly
poorer self-esteem than English boys and English girls (p<0.001). There was no
significant difference between West Indian girls and English girls.
As a minority group, Turkish students were also the subject of several self-esteem
research studies, in recent years, in the Netherlands. All of these studies were conducted
by Verkuyten (1988, 1989, and 1990). In this section the findings of these studies will
be summarised. Using the Rosenberg Self-Esteem Scale, in the Netherlands, Verkuyten
(1988) compared the self-esteem of Dutch and ethnic minority (mainly from Turkey,
Surinam, and Morocco) secondary school students. The study revealed that though the
Dutch students showed a slightly higher score in general self-esteem, the difference was
not significant. However, in contrast to the ethnic minority group, the school, teacher
and peer group seemed to be the Dutch adolescents’ most important frame of reference
on their self-esteem. In another study, Verkuyten (1989) compared the self-esteem
scores of Dutch and Turkish minority students, in the Netherlands. In order to measure
the self-esteem of the subjects (age = 9-13) in this study the author used the Piers-Harris
Self-Concept Scale. The results indicated no significant difference between Dutch and
Turkish children for global self-esteem. There were also no differences for “behaviour”,
“physical appearance and attributes”, “popularity”, or “happiness and satisfaction”
components of self-esteem. The Turkish students, however, were significantly more
anxious (p<0.05), but had a significantly higher score for “intellectual and school
status” (p<0.05). In his third study, in the Netherlands, Verkuyten (1990) again
compared the self-esteem scores of Dutch and Turkish minority adolescents (secondary
C h a p t e r T w o
- 94 -
school students, age = 13-16). The study revealed that the Turkish adolescents’ global
self-esteem scores were significantly lower (p<0.01) than their Dutch counterparts, but
were higher in “academic ability” (p<0.01), “sports achievement” (p<0.05), and
“evaluation of one’s ethnic identity (p<0.05). However, no significant differences were
obtained between the Dutch and Turkish subjects in the “popularity” and “body image”
subscales.
All these studies outlined above have been undertaken in order to examine cultural
differences on self-esteem, and these comparisons were made between or among
majority and minority groups. Cross-cultural comparisons between or among two or
more nations however are very few in the literature. Among those studies that have been
conducted, Bond & Cheung (1983) compared the self-concept of American, Japanese
and Hong Kong university students. The study revealed that of the seven category
variables tested, six (Self, Social, Choice, Aspiration, General Psychological Attribute,
and Personal Facts) showed cultural effects at beyond the (p<0.01) level, but there were
no cultural effects for the role category. The Japanese use of categories was different
from the American and Chinese, who showed similar levels of category frequency. This
characterisation of the data was found for five of the six differences, with the exception
of the Social category, there were no significant differences between American and
Chinese (Hong Kong) subjects. For this category, American and Japanese subjects
differed significantly from the Chinese students. Japanese students differed significantly
from Chinese students for all six categories. They also differed significantly from
American students for five categories. No differences between them were obtained for
the Social category. There were no significant differences between the sexes on any of
the seven variables nor were there any interactions between sex and culture. In another
cross-cultural study, Abdallah (1989a) compared the self-esteem scores of English and
Arab (Saudi Arabian) undergraduates. The results revealed that overall, the English
subjects had significantly higher self-esteem scores than the Arab subjects (p<0.01). In
C h a p t e r T w o
- 95 -
Total self-esteem, as well as in Physical Appearance, in Trustworthiness, and in
Positive Self-Worth, English students had higher scores than Arabs. Arab students,
however, had higher scores than their English counterparts in Negative Self-Image. In a
recent research, Bochner (1994) compared the self-concept of Malaysian (n =26),
Australian (n = 32), and British subjects (n = 20). The Malaysian subjects were teachers
and educational administrators attending an in-service training course. The Australians
were all of Anglo-Celt background and drawn from a variety of white-collar
occupations. The British subjects were members of the Oxford University Department
of Experimental Psychology panel. All the participants completed 10 statements
beginning with “I am.” The responses were classified as idiocentric, group, or
allocentric self-references. As predicted, the study revealed that the self-concepts of the
Malaysians were significantly more group anchored (p< 0.02) than those of the British
and those of the Australians. Malaysians were also significantly less individualist than
those of the Australians (p< 0.02). However, although the differences in individualism
between the Malaysians and the British were in the expected direction, they did not
reach significance. The self-concept of the Malaysians was significantly more group
anchored (p< 0.01), and less individualist (p< 0.02), than those of the combined
Australian / British samples. As expected, there were no significant differences between
self-references of the Australian and British groups on either.
2.9.2 Summary & Implications
When the literature showing the relationship between culture and self-esteem is
analysed, it can be clearly observed that most of the studies have concentrated on
examining self-esteem differences between different ethnic groups within the same
country. The main objective of the present study is not to compare the self-esteem of a
minority group with another group(s), because of the lack of international research
comparing the self-esteem of two or more nations. Most of the studies summarised in
C h a p t e r T w o
- 96 -
this section were American subjects. The impact of ethnic minority status on global
self-esteem has been the object of many studies in the USA. There has been a classical
view, particularly in the USA, that the self-esteem of disadvantaged minority groups is
lower than the self-esteem of the whites. However, most of the studies after the 1970s
and 1980s found hardly any differences between white subjects and minority ethnic
groups (Wylie, 1979; Burns, 1981; Verkuyten, 1989; Tashakkori & Thompson, 1991;
Bekhuis, 1994). Coopersmith (1975) criticises his fellow psychologists for their writing
about black self-esteem before the 1960s.
“While the preceding description corresponds with what we
know of the black experience in America it is based more on
logical grounds than on a direct assessment of black attitudes,
beliefs and self-esteem. In a very real sense much of what has
been written about black self-esteem is based on inferences
made by white psychologists concerned with suffering and
human dignity and willing to accept those inferences without
direct investigation. Viewed in historical perspective the direct
examination of black self-esteem is a very recent event and
almost all of the studies before 1960 were descriptive and
impressionistic in nature” (p. 154).
The common assumption that ethnic minorities, given their low status, powerlessness,
prejudice and discrimination, have lower global self-esteem tends not to be confirmed
by recent studies. Though the studies do not always show a consistent pattern, the
differences seem to be not very great. These findings have also been replicated in
several studies in Great Britain (Verma & Bagley, 1975; Louden, 1977; Lomax, 1977;
Bagley, Mallick & Verma, 1979). The findings of Verkuyten, in the Netherlands, also
show the same pattern as many studies in America and Great Britain.
However, there is no cross-cultural study comparing self-esteem of British and Turkish
subjects in the literature. The two countries where religious, language, social, family,
C h a p t e r T w o
- 97 -
and educational systems are different might provide an important contribution to our
understanding of this relationship.
2.10 GENERAL SUMMARY OF THE CHAPTER
Firstly in this chapter, the self and self-esteem theories were outlined under five
sections: the self in James’s pioneer work; the looking-glass self or self in symbolic
interactionism (Cooley & Mead); the self in Freudian and Neo-Freudian theories
(Freud, Jung, Adler, Horney, Fromm, Sullivan and Erikson) the self in the humanistic
perspectives (Maslow, & Rogers); the self-enhancement, & self-consistency theories;
and finally, attitudes toward the self or self worth (Rosenberg, & Coopersmith).
Although there are a variety of theoretical explanations on the nature of the self and
self-esteem, it is obvious that most theorists agree that the self is an important concept
in understanding human behaviour. Under the framework of these theories, most of the
recent researchers are still enthusiastically exploring the nature of self-esteem.
Secondly, the conceptual problems of self-esteem and self-concept were briefly
examined. Although self-esteem became interesting both in psychology and education,
and its construct has been discussed in many theories since W. James and his work
(1890), there is still a lack of consensus in terms of a proper definition. Both the past
and the present reviews and definitions indicate that not only self-esteem and self-
concept, but also the other self-terms (such as self-image, self-evaluation, self-value,
self-perception, self-assessment etc.) are used interchangeably. Many researchers used
self-esteem scales to measure self-concept, as well as using self-concept scales in order
to measure self-esteem. Sometimes authors used both of the concepts to refer to the
same construct. Despite a great number of studies being conducted to distinguish self-
esteem and self-concept constructs and to clarify the definitions of them, there remains
controversy over the definitions of the concepts. Therefore, in the present study, the
terms self-esteem and self-concept will be used interchangeably, as used by previous
C h a p t e r T w o
- 98 -
psychologists such as Wylie (1968), Shavelson, et al. (1976), Rosenberg (1979), Burns
(1981), Abdallah, (1989), Cassidy (1991), and Burnet (1994).
The self-esteem measurement methods and some problems in measuring self-esteem
were also briefly discussed in this chapter. As with any personality measure, there are
also problems in self-esteem assessment. The literature review revealed that there have
been countless numbers of self-esteem measures, however, no firm body of evidence
exists yet with which to justify them. Wylie (1974) points out that a large number of
studies which she reviewed lacked information about validity and reliability of the
scales. Another difficulty of self-esteem measures, is the non-equivalence of the
measures, i.e. one cannot compare the test results. It is not possible to validate a self-
esteem measure by comparing it with the results of another self-esteem measure.
However, more recently researchers have developed self-esteem instruments
specifically to measure particular aspects of self-esteem that are based on a theoretical
model. This approach has produced instruments in which multiple facets of self-esteem
are clearly identified (e.g. Harter, 1982; Marsh et al., 1984; Coopersmith, 1991).
After these general explanations, three main sections followed in this chapter. They
were a) the relation of self-esteem with academic achievement, b) sex differences in
self-esteem, and c) self-esteem and cultural differences. These sections were given close
attention because of their relation to some of the main objectives of this study. Each of
these three sections included some brief theoretical explanation, as well as related
empirical findings of past research.
The past research suggests that there is a moderate relationship between self-esteem and
achievement. Although, a large proportion of studies have reported a significant self-
esteem / academic achievement relationship, the correlations have been uniformly low
between the two variables. The issue was summarised by Wylie (1974) who stated:
“The correlations of achievement indices and overall self-regard indices tend to be
C h a p t e r T w o
- 99 -
small in absolute terms, offering no support to the commonly accepted lore that
achievement and self-concept are strongly associated” (p.406). Although the review
studies of Uguroglu & Walberg (1979) and Hansford & Hattie (1982), and most of the
studies whose findings are outlined in this section, reveal, in the aggregate, self-esteem
is significantly associated with academic achievement. Most of these studies, however,
do not provide strong enough evidence to determine the causal direction between self-
esteem and academic achievement. The correlational data also indicates that the
academic achievement / self-esteem relationship is slightly stronger among boys than
among girls.
Although much research has been conducted in the last three to four decades concerning
self-esteem (or self-concept) and academic achievement, it has to be pointed out that the
causal relation between these two constructs has yet to be clearly defined. Though many
researchers have used predominantly correlational data, they have commonly stated that
self-esteem causes academic achievement. Though in recent years researchers have used
more advanced statistical techniques and models (such as longitudinal data, cross-
lagged panel analyses etc.) than simple correlations or variance analyses to determine
the causal relationship between self-esteem and academic achievement, the research
data still does not provide consistent evidence to determine which comes first, positive
self-esteem or academic success. However, despite limitations of clear evidence it
seems logical that educators do not necessarily have to make a decision whether to
follow either the basic-skills or the self-esteem enhancement model. The findings of
Owens (1991) support this idea, and suggests that “we should integrate self-
enhancement and skill-development strategies rather than polarise them” (176).
Moreover, enhancing self-esteem is not only important because it helps to increase
academic achievement, it is also crucial in the promotion of good social and emotional
adjustment and mental health. Therefore, educators and policymakers should be
C h a p t e r T w o
- 100 -
encouraged to structure school curricula or programmes to facilitate the achievement of
both goals, by following them both simultaneously.
Although the review revealed that a considerable number of studies were undertaken in
the Western world in order to investigate self-esteem-achievement relationships, there
have been only a few studies in Turkey. When past self-esteem studies in Turkey were
examined it could be seen that almost all of them had been undertaken during the 1980s
and 1990s. In order to find out the relationship between self-esteem and academic
achievement, a total of five studies were conducted in Turkey (Arseven, 1986; Can,
1986; Gürel, 1986; Dogusal, 1987; Ersek, 1992) and only one of them focused on
secondary school students. These data clearly indicate that the number of Turkish
studies are very limited. Therefore one of the main objectives of this study is to
investigate self-esteem-achievement relationships for Turkish subjects.
Sex differences in self-esteem was another subject examined in this chapter. In many
societies and cultures, it is commonly acknowledged that men and women are expected
to perform different roles, and have different attitudes, and functions. Although, Carlson
(1965) suggests that self-esteem is a relatively stable dimension of self and independent
of sex role, some social theorists argue that it is the socialisation process that guides
men and women in different directions (Rosenberg & Simmons, 1975). In order to have
an idea about sex differences in self-esteem the findings of some 60 past and recent
studies from 1959 to 1994 were examined in this chapter. The summary of these studies
can be seen in Appendix C, Table 2. Although about 75% of all the comparisons failed
to obtain a significant sex difference in self-esteem, the number of comparisons which
showed that males had significantly higher self-esteem scores than females, more than
double the comparisons found that females had higher self-esteem scores than males.
While the present review, overall, does show girls to have somewhat lower self-esteem
than boys, the differences are quite modest. In fact, many recent discussions have
C h a p t e r T w o
- 101 -
emphasised the importance of women’s changing self-concept. The influence of the
recent feminist movement might be an important factor in relation to these results.
However, evidence across different studies is largely consistent, revealing a common
core of stereotyped characteristics. Males are described as competent and logical,
possessing self-confidence, direct in manner and dominant. Females are described as
warm and sensitive, socially skilled and inclined toward interpersonal and artistic
interests. Despite the fact that women now constitute a greater percentage of the
nation’s workforce than in the past, female roles still continue to be stereotyped
primarily in terms of domestic responsibilities in many societies. Such stereotypes are
slow to change within a culture. However, the modern women’s movement does take
the position that basic changes in attitudes are essential to achieve true equality of
opportunity.
When the studies were analysed, it could be seen that most of these studies were
American. However, a total of eight British, and thirteen Turkish studies were included
in this review and when the findings of these studies were examined separately, the data
still showed that the majority of the studies obtained no sex differences. In contrast to
what was expected, sex differences among Turkish students in favour of boys were only
found in one study. In summary, the majority of the reviewed studies fail to support a
relationship between sex and self-esteem. Although various speculative interpretations
may be offered to explain the repeated finding of null results, no firm conclusions can
yet be drawn. The questions of sex differences remain unresolved.
Self-esteem and cultural differences was another section in this chapter. As one of the
objectives of this study was to find out self-esteem differences between the English and
the Turkish groups, the findings of past cross-cultural research were outlined in this
chapter. The review suggested that cross-cultural studies on self-esteem were few in
number and there have been a remarkably small number of studies conducted outside of
C h a p t e r T w o
- 102 -
the USA and Western Europe. Furthermore, most of these studies have concentrated on
examining self-esteem differences between different ethnic groups within the same
country. There has not been any cross-cultural study comparing self-esteem of the
British and the Turkish subjects in the literature.
Locus of control as being another personality variable, will be the subject of the next
chapter. The related literature and review of locus of control will be summarised. After
a brief theoretical explanation, the relation of locus of control with academic
achievement, sex, and cultural differences will be examined.
CHAPTER 3
LITERATURE REVIEW AND RESEARCH OF
LOCUS OF CONTROL
C h a p t e r T h r e e
- 2 -
3.1 INTRODUCTION
In this chapter, firstly, theoretical explanation of locus of control construct will be
briefly outlined and later, four main sections will follow. They will be a) the relation of
locus of control with academic achievement, b) sex differences in locus of control, c)
locus of control and cultural differences, and d) the relationship between locus of
control and self-esteem. These sections are relevant to the main objectives of this study.
They each consist of a short introduction, relevant empirical findings of past research,
and a brief summary.
3.2 THEORETICAL PERSPECTIVE OF LOCUS OF CONTROL
Though the construct of locus of control has been the subject of psychological research
since the late 1950s (Phares, 1957; James & Rotter, 1958; Rotter, Seeman, & Liverant,
1962; Lefcourt, 1966), interest in the study started with Rotter’s (1966) monograph,
which presented the locus of control concept from a social-learning theory point of
view, with an easy-scoring scale for its measurement. The idea spread rapidly, resulting
in a burst of psychological and educational interest.
The performance of the students in the classroom has been of great concern to educators
and psychologists for many years. Many studies examining the relationship between IQ,
sex, race, and socio-economic level variables and classroom achievement have been
undertaken. More recently, with increased emphasis being placed on individualised
instruction, the consideration of personality factors has gained in importance. Locus of
control as a personality factor has been correlated with hundreds of different variables
in the last 30 years. It has also received great attention as it relates to academic
achievement.
C h a p t e r T h r e e
- 3 -
Locus of control is concerned with “the question of whether or not an individual
believes that his own behaviour, skills or internal disposition determine what
reinforcements he receives” (Rotter et al., 1972), and refers to a person’s beliefs about
control over life events. Those with an internal locus of control believe that the
consequences of their behaviour are under their personal control and that they are
effective in controlling their destiny and determining the occurrence of reinforcement,
and feel personally responsible for the things that happen to them; those with an
external locus of control believe that the outcomes of their performances in life are
determined by forces beyond their control (e.g., fate, chance, luck, powerful others and
supernatural forces) and that they determine the occurrence of specified events. It might
be described as a self appraisal of the degree to which an individual views him/herself
as having a causal role in determining specific events. As Rotter (1966) pointed out, the
effect of reinforcement “depends on whether or not the person perceives a causal
relationship between his own behaviour and the reward” (p. 1). Nowicki & Strickland
(1973) noted that this perception may differ in degree from person to person and even
within the same person over time and situations. In a social learning theory, Rotter
(1966) pointed out that:
“When a reinforcement is perceived by the subject as following some action
of his own but not being entirely contingent upon his action, then, in our
culture, it is typically perceived as the result of luck, chance, fate, as under
the control of powerful others, or as unpredictable because of the great
complexity of the forces surrounding him. When the event is interpreted in
this way by an individual, we have labelled this a belief in external control.
If the person perceives that the event is contingent upon his own behaviour
or his own relatively permanent characteristics, we have termed this a belief
in internal control” (p. 1).
To assess a person’s locus of control as either internally oriented or externally oriented,
Rotter developed a test instrument consisting of 29 pairs of statements, one statement
C h a p t e r T h r e e
- 4 -
representing an internal control view of life and the other statement representing an
external control view of life. Two examples of these statements are below:
a) No matter how hard you try some people just don’t like you.
(versus)
b) People who can’t get others to like them don’t understand how to get
along with others.
a) Who gets to be the boss often depends on who was lucky enough
to be in the right place first.
(versus)
b) Getting people to do the right thing depends upon ability, luck has
little or nothing to do with it.
Beliefs in internal or external locus of control were understood to be generalised
expectancies that people hold regarding the potential efficacy of their behaviour
(Rotter’s early theory). In general, it has been observed that individuals differ in their
perception of locus of control. People are called externals when they are said to have a
generalised expectancy that reinforcements are not under their control across varying
situations. As Lefcourt (1966) says, in layman’s language, these people may be
described as lacking self-confidence, or in Adler’s terminology, suffering from
inferiority feelings. Rotter (1966, 1972) and others (Davis and Davis, 1972; Phares,
1976) later went beyond this perception of generalised expectancies and suggested that
the statement of external belief serves as a defensive function for some individuals.
Some others also argued that external locus of control represents a defence of self-
esteem, rather than a general expectancy (Davis & Davis, 1972; Hochreich, 1975;
Gregory, 1978; Evans, 1980). Quoting Phares (1979):
“Failing and at the same time admitting to a belief in internal control,
frequently imply personal inadequacy. But failure coupled with an avowal of
external belief would enable the individual to evade personal responsibility,
thereby mitigating some of the unpleasant effects of the failure”.
C h a p t e r T h r e e
- 5 -
Research evidences has shown that externally oriented individuals require validation by
significant others regarding their behaviour, so they know whether their behaviour is
appropriate or inappropriate for the current situation (Phares, 1976). Research evidence
also suggests that internals are more socially competent than externals (Bledsoe &
Baber, 1978; Lefcourt, 1976). Findings also indicate a positive relationship between
externality and anxiety (Bar-Tal & Bar-Zohar, 1980). In addition, externals have been
found to be less trusting (Phares, 1976) and more insecure in interpersonal relationships
than internals (Bledsoe & Baber, 1978). Externals also have been found to spend less
time conversing with strangers than internals do (Dudley, 1977). Children with a high
perception of internal locus of control tend to view their success or failure in terms of
their own will, initiative or drive. On the other hand, students whose perceptions are
externally oriented tend to view their success or failure as being the result of fate, luck,
or circumstance.
Internally controlled individuals may be further characterised as more active in
achievement-oriented endeavour and in problem-solving activities, not easily influenced
by others, having high self-concepts and self-esteem, more alert to what is happening in
their environment, and psychologically better adjusted (Spring & Khanna, 1982;
Friedberg, 1982). Those who are externally controlled tend to have the opposite
characteristics and are further characterised as being less assertive, experiencing
depression and anxiety more often, and tending to be less rational in their thinking
(Traub, 1982a).
Loeb (1975) suggests that locus of control (whether internal or external in one’s
personal beliefs about one’s control) is learned in childhood. Loeb reached this
conclusion after observing interactions between parents and their preadolescent sons as
they worked on a project together. The parents of internals tended to make more
C h a p t e r T h r e e
- 6 -
suggestions and to issue fewer orders whereas the parents of externals tended to issue
many orders and make few suggestions.
Scheck & Rhodes (1980) found a strong relationship between internal-external locus of
control and rated competence of teachers. They concluded that instructors scoring high
on internal control are much more likely to be rated high on competency than are those
scoring low on internal control. Porter & Cohen (1977) determined that teachers’ locus
of control was directly and consistently related to students’ achievement. Murray and
Staebler (1974) reported similar findings.
After having completed a large-scale study of United States school children, Coleman
(Coleman et al, 1966) emphasised the crucial role of locus of control beliefs in
understanding the academic achievement of students. The authors concluded that “a
pupil attitude factor, which appears to have a stronger relationship to achievement than
do all the school factors together, is the extent to which an individual feels that he has
some control over his own destiny” (p. 23).
Since Coleman’s report (1966) was published, a considerable number of studies have
focused on investigating the relationship between the locus of control construct and
academic achievement. In the following section, the relationship of these two variables
will be examined in the light of the findings of some previous and recent studies. The
examination of the relationship between locus of control and academic achievement
will be carried out in general, as well as with the perspective of gender.
C h a p t e r T h r e e
- 7 -
3.3 THE RELATIONSHIP of LOCUS OF CONTROL WITH
ACHIEVEMENT
3.3.1 Introduction
Research in the area of locus of control has largely focused on the investigation of the
relationship between the perception of locus of control and various behaviours,
attitudes, and/or personality characteristics (Lefcourt, 1976; Phares, 1976; Bar-Tal
1980; Findley & Cooper 1983). The relationship between locus of control and academic
achievement or related activities has also received extensive concern, and several
reviews have been conducted on the issue. These studies have great potential value for
educators: If a students personality or motivation is more likely to change than their
ability, then achievement might be enhanced indirectly through educational practices
that positively affect personality and motivational development. Both educational
experts and psychologists would expect a positive relationship between internal locus of
control and academic achievement, because internals are expected to be motivated to
achieve, whereas in contrast, externals are expected to have low motivation. Perceived
control of events is one motivational variable that appears to affect children’s academic
achievement.
The main objective of this review is to provide evidence of the relationship between
achievement and locus of control in general, as well as considering the perspective of
gender. In order to examine these relationships some 34 representative and best known
research studies are described below.
3.3.2 Empirical Findings
In this section, firstly, the finding of six previous reviews on locus of control research
will be given, (Phares, 1976; Lefcourt, 1976; Bar-Tal & Bar-Zohar, 1977; Uguroglu &
C h a p t e r T h r e e
- 8 -
Walberg, 1979; Stipek & Weisz, 1981; Findley & Cooper, 1983) later the researcher
will report the findings of each individual study that he has collected.
3.3.2.1 Previous Reviews
Phares (1976) examined the link between locus of control and achievement in children.
Most of the studies reviewed by him used the Intellectual Achievement Responsibility
Scale (IAR) and he asserted that internals tend to show superior academic achievement.
In general, the achievements of internal students, as reflected in school grades and test
scores, are more substantial than those of externals. He also pointed out that locus of
control was more strongly related to academic achievement among children than among
adults.
The conclusion of Lefcourt’s review (1976) was also similar to that of Phares (1976). In
addition, he pointed out that the relationship between locus of control and academic
achievement may be mediated by gender as well as age. He also suggested that the
relations between locus of control and achievement may be stronger for males than
females.
Bar-Tal and Bar-Zohar (1977) investigated the relationship between perception of locus
of control and academic achievement in their review of 36 studies. Although the results
were inconsistent, internal perception of control tended to be positively correlated with
academic achievement and systematically related to behaviours which increased the
probability of successful academic performance. Among 36 reviewed studies, only one
contained a negative relationship between internal perception and academic
achievement. Four studies did not detect a significant relationship, while the rest of the
studies, 31, found a positive relationship. They concluded that “there is a firm trend
indicating that the perception of locus of control is related to academic achievement.
C h a p t e r T h r e e
- 9 -
This trend suggests that the more internal the individual’s orientation, the higher the
individual’s achievement” (p.132).
Uguroglu & Walberg (1979), investigating the relationship between motivational
factors and academic achievement, found the average correlation of r=.32 between locus
of control and grades or ability tests among 13 correlations in their more general review.
Stipek and Weisz (1981) investigated the relationship between children’s control beliefs
and achievement. They found very little to support the hypothesis that locus of control
measures are more highly correlated with achievement than more general measures.
They concluded that any definite assertions regarding this relationship were difficult to
make. Like Lefcourt (1976), they discussed several factors that appeared to mediate the
relationship. Firstly, they found it difficult to obtain satisfactory evidence when
comparing the relationship between academic achievement and locus of control for
achievement outcomes, with the relationship between academic achievement and locus
of control for nonachievement outcomes. Secondly, they pointed out that the
relationship between locus of control and achievement would be enhanced by greater
specificity of the measures used. Therefore, finally, they recommended the use of new
measures of children’s perceptions of locus of control which included items that
allowed subscores for different reinforcement domains.
Another review investigating the relationship between locus of control and academic
achievement was conducted by Findley & Cooper (1983). After reviewing 98 studies,
they found that more internal beliefs are associated with greater academic achievement.
Of the 275 hypothesis tests, 193 resulted in positive findings, 25 resulted in negative
findings, and the others fell into the null category. In all, 126 significant positive
findings and 9 significant negative findings were reported. The relationship tended to be
stronger for adolescents than for adults or children (r=.14 for college, r=.23 for high
school, r=.35 for junior high school r=.24 for 4th-6th grade, and r=.04 for 1st-3th
C h a p t e r T h r e e
- 10 -
grade). According to this review, stronger effects were associated with specific locus of
control measures (r=.30) than global locus of control scales (r=.18). Finally, locus of
control was correlated to standardised achievement tests (r=.21) more strongly than
classroom related teacher grades (r=.16). One of the important results of this review is
that the relationship between specific locus of control measures and academic
achievement is stronger than the relationship between academic achievement and
nonspecific (global) locus of control measures, which supports the suggestions of Stipek
and Weisz (1981). It seems logical that a specific locus of control measure would allow
greater prediction of behaviour than would a broad generalised expectancy measure.
Therefore, one might expect school achievement to be more highly correlated with
perceptions of control in academic achievement situations than with perceptions of
control in diverse situations.
The general finding of the previous review studies suggests that there is a trend
indicating that locus of control of students is related to their academic performance. The
educational experts, school psychologists and teachers, may all benefit from those
findings, for example applying a specific academic locus of control scale, might be
more useful than a general locus of control scale on the prediction of students
achievements.
3.3.2.2 Present Review
Crandall et al., (1962), using the IAR academic locus of control scale with 20 boys and
20 girls of 1st, 2nd, and 3rd grade students, found a positive correlation between the
locus of control and the California Achievement Test, among boys. The IAR correlated
with a reading achievement test of 0.51, and arithmetic achievement test of 0.38.
However, no significant relationships were found for girls. The authors also found that
total I scores (subscales were not used) were highly associated with the amount of time
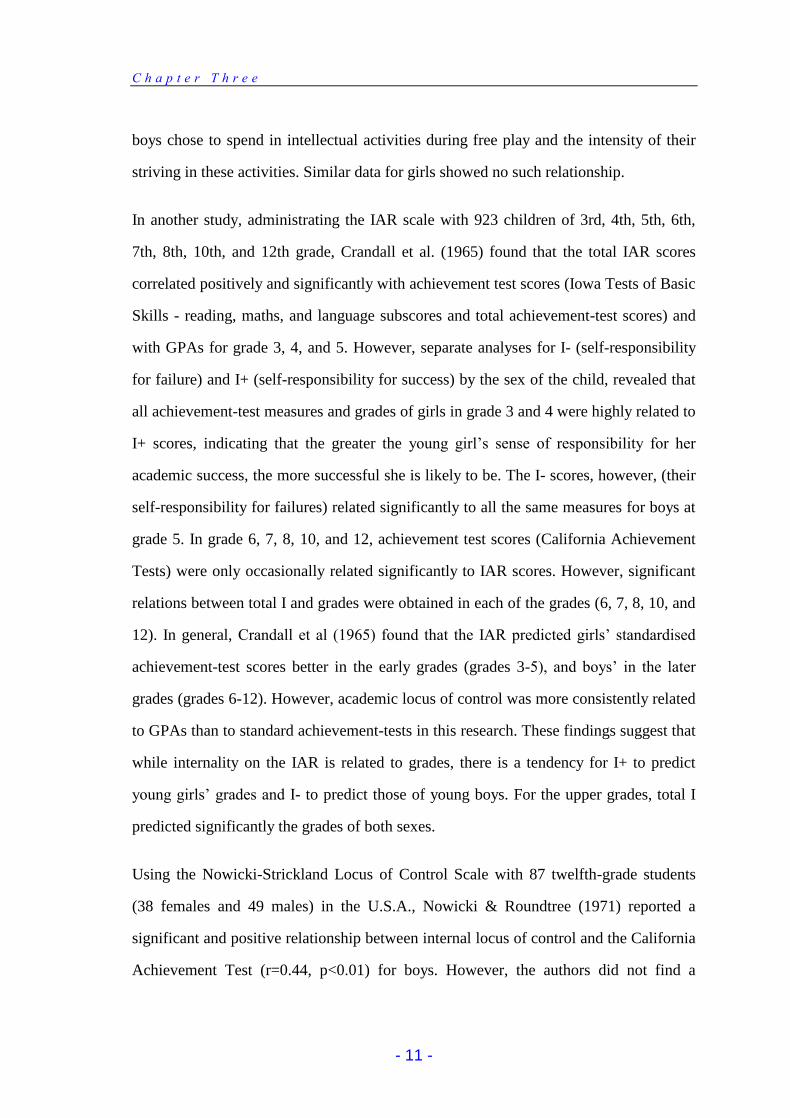
C h a p t e r T h r e e
- 11 -
boys chose to spend in intellectual activities during free play and the intensity of their
striving in these activities. Similar data for girls showed no such relationship.
In another study, administrating the IAR scale with 923 children of 3rd, 4th, 5th, 6th,
7th, 8th, 10th, and 12th grade, Crandall et al. (1965) found that the total IAR scores
correlated positively and significantly with achievement test scores (Iowa Tests of Basic
Skills - reading, maths, and language subscores and total achievement-test scores) and
with GPAs for grade 3, 4, and 5. However, separate analyses for I- (self-responsibility
for failure) and I+ (self-responsibility for success) by the sex of the child, revealed that
all achievement-test measures and grades of girls in grade 3 and 4 were highly related to
I+ scores, indicating that the greater the young girl’s sense of responsibility for her
academic success, the more successful she is likely to be. The I- scores, however, (their
self-responsibility for failures) related significantly to all the same measures for boys at
grade 5. In grade 6, 7, 8, 10, and 12, achievement test scores (California Achievement
Tests) were only occasionally related significantly to IAR scores. However, significant
relations between total I and grades were obtained in each of the grades (6, 7, 8, 10, and
12). In general, Crandall et al (1965) found that the IAR predicted girls’ standardised
achievement-test scores better in the early grades (grades 3-5), and boys’ in the later
grades (grades 6-12). However, academic locus of control was more consistently related
to GPAs than to standard achievement-tests in this research. These findings suggest that
while internality on the IAR is related to grades, there is a tendency for I+ to predict
young girls’ grades and I- to predict those of young boys. For the upper grades, total I
predicted significantly the grades of both sexes.
Using the Nowicki-Strickland Locus of Control Scale with 87 twelfth-grade students
(38 females and 49 males) in the U.S.A., Nowicki & Roundtree (1971) reported a
significant and positive relationship between internal locus of control and the California
Achievement Test (r=0.44, p<0.01) for boys. However, the authors did not find a
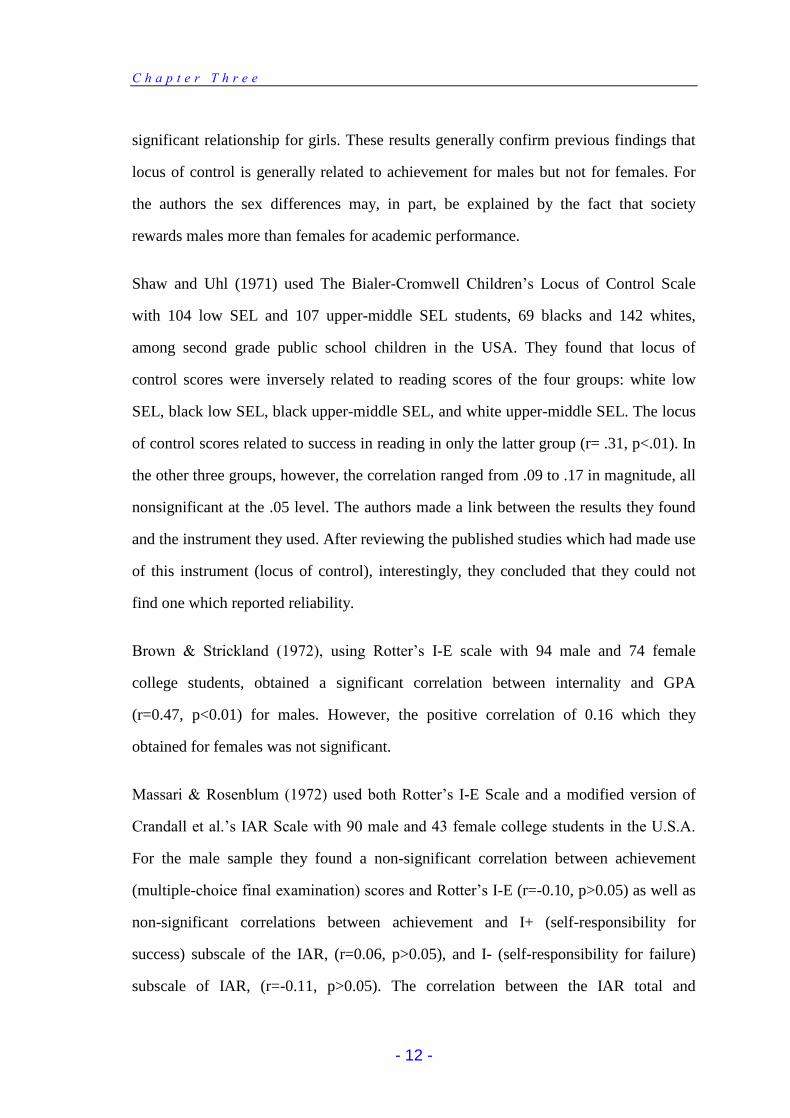
C h a p t e r T h r e e
- 12 -
significant relationship for girls. These results generally confirm previous findings that
locus of control is generally related to achievement for males but not for females. For
the authors the sex differences may, in part, be explained by the fact that society
rewards males more than females for academic performance.
Shaw and Uhl (1971) used The Bialer-Cromwell Children’s Locus of Control Scale
with 104 low SEL and 107 upper-middle SEL students, 69 blacks and 142 whites,
among second grade public school children in the USA. They found that locus of
control scores were inversely related to reading scores of the four groups: white low
SEL, black low SEL, black upper-middle SEL, and white upper-middle SEL. The locus
of control scores related to success in reading in only the latter group (r= .31, p<.01). In
the other three groups, however, the correlation ranged from .09 to .17 in magnitude, all
nonsignificant at the .05 level. The authors made a link between the results they found
and the instrument they used. After reviewing the published studies which had made use
of this instrument (locus of control), interestingly, they concluded that they could not
find one which reported reliability.
Brown & Strickland (1972), using Rotter’s I-E scale with 94 male and 74 female
college students, obtained a significant correlation between internality and GPA
(r=0.47, p<0.01) for males. However, the positive correlation of 0.16 which they
obtained for females was not significant.
Massari & Rosenblum (1972) used both Rotter’s I-E Scale and a modified version of
Crandall et al.’s IAR Scale with 90 male and 43 female college students in the U.S.A.
For the male sample they found a non-significant correlation between achievement
(multiple-choice final examination) scores and Rotter’s I-E (r=-0.10, p>0.05) as well as
non-significant correlations between achievement and I+ (self-responsibility for
success) subscale of the IAR, (r=0.06, p>0.05), and I- (self-responsibility for failure)
subscale of IAR, (r=-0.11, p>0.05). The correlation between the IAR total and
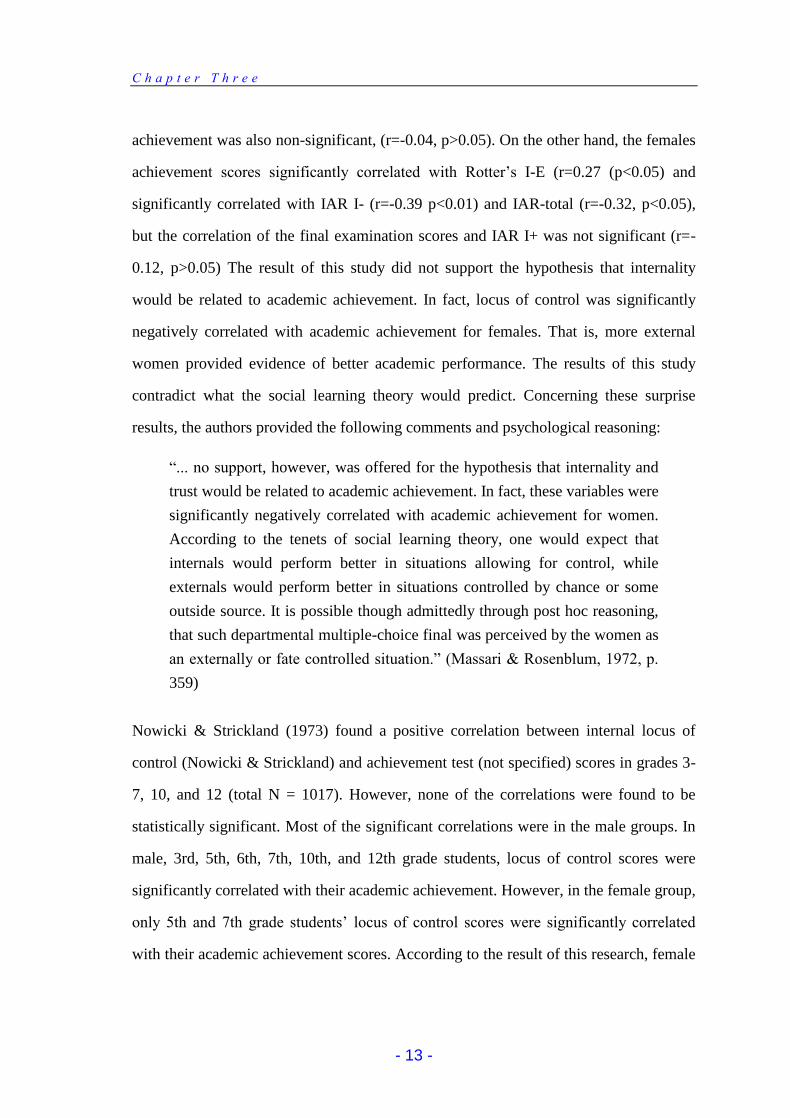
C h a p t e r T h r e e
- 13 -
achievement was also non-significant, (r=-0.04, p>0.05). On the other hand, the females
achievement scores significantly correlated with Rotter’s I-E (r=0.27 (p<0.05) and
significantly correlated with IAR I- (r=-0.39 p<0.01) and IAR-total (r=-0.32, p<0.05),
but the correlation of the final examination scores and IAR I+ was not significant (r=-
0.12, p>0.05) The result of this study did not support the hypothesis that internality
would be related to academic achievement. In fact, locus of control was significantly
negatively correlated with academic achievement for females. That is, more external
women provided evidence of better academic performance. The results of this study
contradict what the social learning theory would predict. Concerning these surprise
results, the authors provided the following comments and psychological reasoning:
“... no support, however, was offered for the hypothesis that internality and
trust would be related to academic achievement. In fact, these variables were
significantly negatively correlated with academic achievement for women.
According to the tenets of social learning theory, one would expect that
internals would perform better in situations allowing for control, while
externals would perform better in situations controlled by chance or some
outside source. It is possible though admittedly through post hoc reasoning,
that such departmental multiple-choice final was perceived by the women as
an externally or fate controlled situation.” (Massari & Rosenblum, 1972, p.
359)
Nowicki & Strickland (1973) found a positive correlation between internal locus of
control (Nowicki & Strickland) and achievement test (not specified) scores in grades 3-
7, 10, and 12 (total N = 1017). However, none of the correlations were found to be
statistically significant. Most of the significant correlations were in the male groups. In
male, 3rd, 5th, 6th, 7th, 10th, and 12th grade students, locus of control scores were
significantly correlated with their academic achievement. However, in the female group,
only 5th and 7th grade students’ locus of control scores were significantly correlated
with their academic achievement scores. According to the result of this research, female
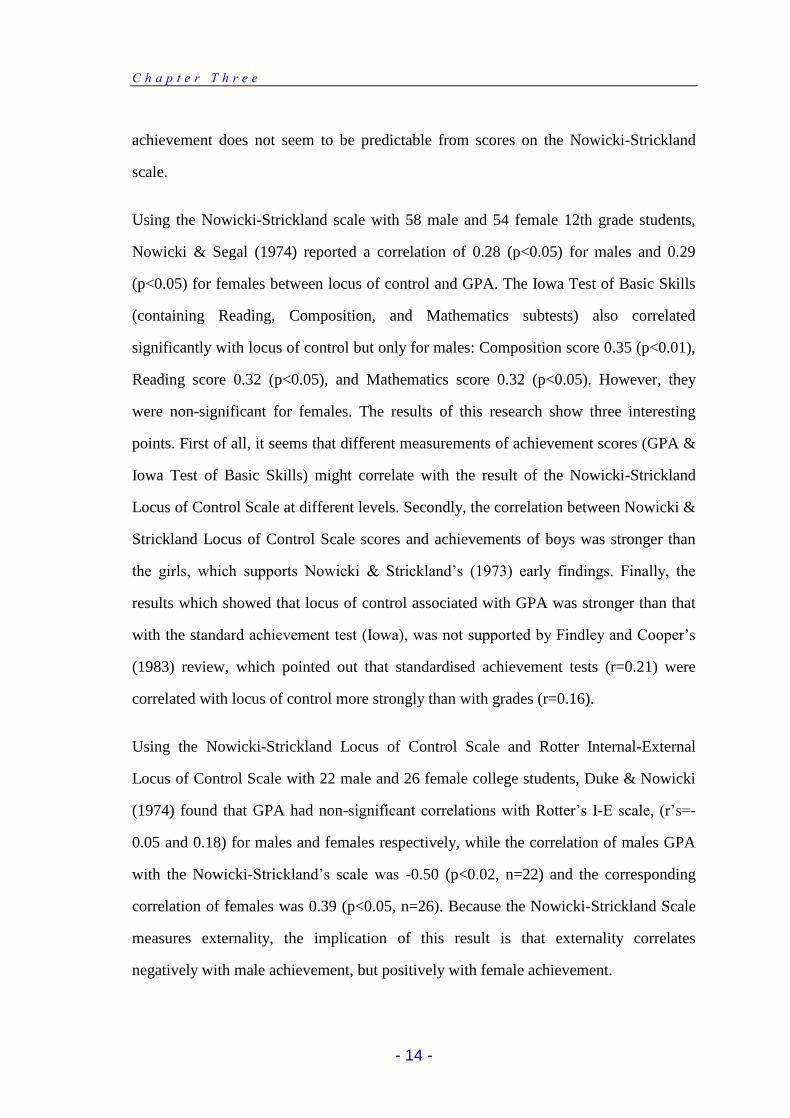
C h a p t e r T h r e e
- 14 -
achievement does not seem to be predictable from scores on the Nowicki-Strickland
scale.
Using the Nowicki-Strickland scale with 58 male and 54 female 12th grade students,
Nowicki & Segal (1974) reported a correlation of 0.28 (p<0.05) for males and 0.29
(p<0.05) for females between locus of control and GPA. The Iowa Test of Basic Skills
(containing Reading, Composition, and Mathematics subtests) also correlated
significantly with locus of control but only for males: Composition score 0.35 (p<0.01),
Reading score 0.32 (p<0.05), and Mathematics score 0.32 (p<0.05). However, they
were non-significant for females. The results of this research show three interesting
points. First of all, it seems that different measurements of achievement scores (GPA &
Iowa Test of Basic Skills) might correlate with the result of the Nowicki-Strickland
Locus of Control Scale at different levels. Secondly, the correlation between Nowicki &
Strickland Locus of Control Scale scores and achievements of boys was stronger than
the girls, which supports Nowicki & Strickland’s (1973) early findings. Finally, the
results which showed that locus of control associated with GPA was stronger than that
with the standard achievement test (Iowa), was not supported by Findley and Cooper’s
(1983) review, which pointed out that standardised achievement tests (r=0.21) were
correlated with locus of control more strongly than with grades (r=0.16).
Using the Nowicki-Strickland Locus of Control Scale and Rotter Internal-External
Locus of Control Scale with 22 male and 26 female college students, Duke & Nowicki
(1974) found that GPA had non-significant correlations with Rotter’s I-E scale, (r’s=-
0.05 and 0.18) for males and females respectively, while the correlation of males GPA
with the Nowicki-Strickland’s scale was -0.50 (p<0.02, n=22) and the corresponding
correlation of females was 0.39 (p<0.05, n=26). Because the Nowicki-Strickland Scale
measures externality, the implication of this result is that externality correlates
negatively with male achievement, but positively with female achievement.
C h a p t e r T h r e e
- 15 -
Moreover, Nowicki and Duke (1974), using the Nowicki-Strickland Scale, obtained
similar results to Duke and Nowicki (1974). They found a negative correlation between
externality and males GPA (r=-0.42, p<0.05, n=26) and a positive correlation between
externality and females GPA (r=0.42, p<0.05, n=28). Since the Nowicki-Strickland’s
scale is a measure of external locus of control, it can be seen that its correlations with
males achievements are in the expected direction, but its correlations with females
achievements are in the opposite direction. Duke and Nowicki attributed the positive
correlations between externality and the achievement of female students to their fear of
success, which leads to defensive externality, i.e. denial of personal responsibility for
success.
Using Levenson’s Internal, Powerful Other and Chance locus of control scale with 33
male and 56 female students, Prociuk & Breen (1974) found that Internality correlated
significantly with GPA, (r=0.28, P< 0.01, n=89), and Externality, as measured by
Chance scale, had a significant negative correlation with GPA (r= -0.24, P< 0.05,
n=89).
Prociuk & Breen (1975) found a correlation of 0.41 for males, and 0.47 for females
between locus of control (Levenson’s Internal Scale) and GPA among 66 male and 94
female college students.
Gordon (1977), using the Nowicki-Strickland LOC Scale with 113 ten-year-old, fourth
grade children (60 males and 53 females), found that internal locus of control
orientation was associated with academic achievement as measured by GPA (r= -0.20,
P<0.05), by language (r=-0.23, p<0.05), and by maths achievement test scores (r=-0.21,
p<0.05). When separate analyses for sexes were carried out, for girls internality was
positively related to composite achievement test scores (r=-0.27, p<0.05), but not GPA.
For boys however, children’s locus of control scores were not related to achievement
test scores, but were related to GPA (r=-0.25, p<0.05). In this research, it can be seen
C h a p t e r T h r e e
- 16 -
that locus of control was found to be related to one measure of achievement for boys
(grades) and to a different measure for girls (achievement test scores). These two
measures of academic achievement reflect different variables. Since internality was
associated with high self-esteem only for boys in this research, it is possible that the
higher grades that internal boys received, added to their positive self-concept. Internal
girls, on the other hand, probably received little recognition for having higher
achievement test scores; hence they did not have higher self-esteem.
Bar-Tal et al., (1980) conducted an extensive study in Israel using a large sample of
ninth grade students (N=2438). The ethnic comparison was between Jewish children of
Asian-African origin and Jewish children of Euro-American origin. The authors
reported strong correlations between LOC and academic achievement. The relationship
between LOC and achievement was significantly higher for the Asian-African origin
Israeli students (r=0.41 than for the European-American origin Israeli students (r=0.29).
The correlations were reduced but remained highly significant when the effect of SES
were partialled out.
Moore (1980) revealed that Crandall et al.’s academic locus of control (IAR) scale
scores were significantly correlated with reading (r= .48) and maths (r= .60) for 8 year-
old students. However no significant relationship was found for either 11 or 13 year-old
students in England.
Reid & Croucher (1980) administered Crandall et al.’s IAR Scale to more than 1000
British school children attending junior schools in a northern British city. As expected,
they found I+ to be correlated with Vocabulary and Achievement in mathematics (0.34
and 0.32 respectively) and with I- having smaller but still reliable correlations (0.17 and
0.19). When they used a mean split to separate their sample into internals and externals,
they found consistently higher correlations for the internals. Reid and Croucher reported
that their results were quite consistent with the US data reported by Crandall et al.
C h a p t e r T h r e e
- 17 -
(1965) and provided “further validation of the Crandall et al.’s IAR scale in the setting
of the British junior schools”. They also assert that “the IAR scales appear to be
relatively independent of intelligence.”
Using the Rotter Internal-External Locus of Control Scale (1966) with 137 freshman
college students (81 females and 56 males) in a course in General Psychology, in the
USA, Traub (1982b) found that I-E scores were significantly related to GPA (r=0.16,
p<0.05, one tailed test). In this study, locus of control beliefs accounted for, at most, 3%
of the total variance in GPA. The author pointed out that these findings were consistent
with Rotter’s (1966) contention that generalised control measures are not likely to yield
substantial relationships in specific areas, such as academic achievement. If generalised
beliefs in control have any impact on academic achievement, their influence is probably
mediated through other intervening variables, such as specific control expectancies and
reinforcement values. However, when separate analyses were performed to find out sex
differences, I-E scores were significantly related to the grade point average for females
(r=0.18, p<0.05) but not for males (r=-0.10, n.s.). Unlike Massari & Rosenblum (1972),
Duke & Nowicki (1974) and Nowicki & Duke (1974), this study indicates that the
negative correlation between externality and academic achievement is more significant
for females than males, and it is more consistent with Rotter’s proposition of defensive
externality among males than the sex role or fear of success explanation provided by
Duke and Nowicki.
Trice (1985) used a test of beliefs in personal control over academic outcome with two
groups of university students. The Education group consisted of 64 females and 43
males and the second group included 82 students, 46 males and 36 females, enrolled in
a general psychology course. He obtained significant correlations between the amount
of extra credits earned and locus of control for the Psychology course group and the
Education group, respectively (r= -0.38, P< 0.01 and r= -0.36, P< 0.01). Moreover, with
C h a p t e r T h r e e
- 18 -
the Psychology course group he obtained a significant correlation between locus of
control and the final examination grades (-0.32, P< 0.01, n=82). However, the
correlation between the final examination grades of the Education group and locus of
control was not significant (-0.19, P>0.05, n=107) but the result was in the expected
direction.
Administering Rotter’s I-E Locus of Control Scale to 46 male and 107 female
undergraduate students in a College of Education, in the U.S.A., Crump, Hickson &
Laman (1985) did not find a significant difference between GPAs of 66 externals and
99 internals where the F value was 0.07 (n.s.). The authors discussed whether, since
women outnumber men in the teaching profession by a ratio of two to one, in the USA,
it can be speculated that the trend may be for the teaching profession to become largely
comprised of people whose motivation is largely external and who consider themselves
as governed by circumstances over which they have little or no control.
Using Levenson’s Internal, Powerful Others, and Chance Locus of Control Scale with
68 female and 61 male university students, Gadzella, Williamson & Ginther (1985)
found non significant correlations between GPA of the 129 students and their scores in
the three Levenson’s scales, “the Internal” (0.08, n.s.), “Powerful Others” (0.01, n.s.)
and “Chance” (r=-0.08, n.s.). When separate analyses for both sexes were carried out,
again non-significant correlations between GPA and locus of control were obtained
both for men and for women. Females GPA correlated 0.15 with Internal, 0.17 with
Powerful Others, and 0.00 with Chance. All three correlations are non-significant and
the correlation of GPA with Internal is in the expected direction while its correlation
with Powerful Others is positive. The males’ GPA correlated -0.03 with Internal, -0.12
with Powerful Others, and -0.11 with Chance. Though the correlations of Powerful
Others and Chance with GPA are in the expected direction, they are not significant.
C h a p t e r T h r e e
- 19 -
When administering Rotter’s I-E Locus of Control Scale to 148 (male =76, female = 72)
Transkeian students enrolled in a teacher training programme, Mwamwenda &
Mwamwenda (1986) found that internally controlled female students outperformed
externally controlled females (p< 0.01) in their educational psychology course. After a
similar analysis was carried out for men, although the internally controlled males’ mean
score on the course was found to be higher than those externally controlled males, the
mean difference was not significant (t=1.53, df=70, p>0.05). The results of this research
suggest that female achievement is significantly and negatively related to externality
while the relation of male achievement and locus of control was not significant, but it is
in the expected direction. Mwamwenda & Mwamwenda’s explanation of this result,
that there was no significant relationship between locus of control and academic
achievement for male students, was perhaps because the sample of internally controlled
male subjects (n=24) was relatively small. However, according to Rotter’s theory
(1966), the non-significant relation between externality and males achievement may be
attributed to the effect of defensive externality. As Majdub (1990) points out, socially,
one would expect that African females would have more need to achieve success, rather
than fear it because they need to prove themselves.
Korkut (1986) revealed significant differences in the Nowicki-Strickland locus of
control scale among 540 Turkish primary school students who belonged to different
achievement levels. The results showed that students who had higher achievement, had
significantly higher locus of control scores (p<0.001) than students who had either
moderate or low achievement. Students who had moderate achievement had also
significantly (p<0.05) higher locus of control scores than students who had low
achievement.
Yesilyaprak (1988), using the Nowicki-Strickland locus of control scale found that
Turkish secondary school students’ locus of control was not significantly related to their

C h a p t e r T h r e e
- 20 -
perception of either primary or middle school academic achievement, though the
correlation between locus of control and perception of middle school academic
achievement was close to the significant level. However, the author did not investigate
the relationship between the students’ actual secondary school academic achievement
and locus of control.
Chadha (1989) reported that locus of control (Rotter’s I-E Scale) was significantly
related to school achievement (r= 0.35, p< 0.01) of 12th grade Indian students. The
result of this study also indicated that being female rather than being male was the best
predictor of internal locus of control among 12th grade Indian students (156 males and
151 females).
Using the Sphere -of- Control Questionnaire with 400 British students (200 males and
200 females) and 450 Arab university students (225 males and 223 females) Abdallah
(1989a) found that locus of control scores of either English or Saudi Arabian
undergraduate students were not significantly related to their academic achievement
with the exception of “the socio-political control” subscale, and to some extent,
“Personal efficacy” amongst Arab students.
Strassburger et al., (1990) revealed a significant interaction between academic locus of
control and academic achievement for grade 7-9 Anglo students (p<0.001), but the
results show no interactions for Hispanic students.
Majdub (1990) found negative significant correlations between locus of control and
academic achievement among both an Education group (-0.27, p<0.02) and an Arabic
group (-0.33, p<0.02). However, when the effects of Study Habits and Academic
Achievement Motivation on the correlations of locus of control with academic
achievement were partialled out, the correlations in the Education Group dropped to -
0.14 (P>0.05) and the correlation in the Arabic group dropped to -0.13 (n.s.).
C h a p t e r T h r e e
- 21 -
Darko-Yeboah (1990) found that neither I- (self-responsibility for failure scale) nor I+
(self-responsibility for success scale) of locus of control (Crandall et al.’s IAR Scale)
score of 4th grade students in Canada, were significantly correlated with their reading
vocabulary or reading comprehension. But, 7th grade students’ I+ (self-responsibility
for success scale) scores were positively correlated with their reading comprehension
scores (r= 0.34).
Hagborg et al (1991) compared high school students with a prior history of grade
retention to a matched control group of nonretained students. Though the results
indicated no academic locus of control differences between the two groups, the retained
students’ score was associated with greater externality (r= -.28, p<0.05).
Maqsud & Rouhani (1991), using Clifford’s (1976) Academic Achievement
Accountability Scale (CAAAS), found that Locus of control scores of 9th grade
secondary school students (aged 16-17) in the Republic of Southern Africa, were
significantly and positively correlated with their English achievement (r=.30, p<0.01),
but not with their maths achievement.
Murk & Addleman (1992) found that locus of control significantly correlated with
College GPA (r=.12, p<0.001) among undergraduate students, in the USA.
Ferrary & Parker’s research (1992) on 319 private high school students in America,
revealed that academic locus of control was not significantly related to students’ autumn
academic performance (GPA).
Using the Clifford’s (1976) Academic Achievement Accountability Scale (CAAAS)
with 120 (60 male and 60 female) middle school students from Bophuthatswana
(Southern African region), Maqsud (1993) found a significant correlation (r=0.22,
p<0.05) between internality and academic achievement (English, Afrikaans, and
Setswana). A significant positive relationship between internality and academic
C h a p t e r T h r e e
- 22 -
achievement in this study is congruent with the conclusion of Bar-Tal & Bar-Zohar
(1977) who reported several studies showing a positive association between internality
and school achievement.
Yates et al., (1994) used the Nowicki-Strickland Internal-External Locus of Control
Scale with 44 female and 48 male, severely disturbed adolescents in the USA. The
authors found that the students achievement scores (PIAT - Peabody Individual
Achievement Test, and WRAT - Wide-Range Achievement Test) were not significantly
related to locus of control or its factors, all r’s p<0.16, (n.s.).
3.3.3 Summary
When the research studies undertaken to find out the relationship between locus of
control and academic achievement, demonstrated above, were analysed, it was difficult
to summarise the research briefly, because most of the studies had used a variety of
groups differing in race, socioeconomic status, age, sex, and educational level.
Moreover, the instruments used to measure academic achievement, and locus of control,
as well as statistical techniques to analyse data, had been quite varied.
A total of 34 studies between 1962 and 1994 were reviewed in order to find out the
relationship between locus of control and academic achievement. Out of those 34
studies, 2 studies were conducted in the 1960s, 11 of them were undertaken during the
1970s, 12 of them were performed during the 1980s, and 9 studies were undertaken
between 1990 and 1994.
When the findings of these studies are analysed it can be seen that among 34 studies
reviewed, only three studies (8.82%) contained negative relationships between internal
locus of control and academic achievement (Massari & Rosenblum, 1972; Nowicki &
Duke, 1974; Duke & Nowicki, 1974). Seven studies (20.59%) did not obtain a
significant relationship (Massari & Rosenblum, 1972; Crump, et al., 1985; Gadzella, et
C h a p t e r T h r e e
- 23 -
al., 1985; Yesilyaprak, 1988; Hagborg, 1991; Ferrary, & Parker, 1992; Yates, et al.,
1994). Of the rest of the studies however, 26 (76.47%), found at least one positive
relationship between internal locus of control and academic achievement. Though both
the studies of Nowicki & Duke, (1974), and Duke & Nowicki, (1974) contained
significant and negative correlations between internal locus of control and academic
achievement, they also contained significant and positive correlations between
internality and locus of control. However, the third study, which found significant
negative relationships (Massari & Rosenblum, 1972), did not find any significant
positive correlation.
Twenty out of 34 studies in this review, contained data for the total sample (both sexes
combined). However, these studies did not report their data separately for both sexes;
10 studies out of 34, were based on only sex differences with regards to the relationship
between locus of control and academic achievement. These studies contained data for
both males and females separately, but not for the combined sex sample. Finally, only
four studies contained data for the total sample (both sexes combined) as well as data
separately for both sexes (Crandall et al., 1965; Nowicki & Strickland, 1973; Traub,
1982b; Gadzella, et al., 1985).
3.3.3.1 The summary of the studies in general
As stated, 20 studies reported only the findings of the total sample (both sexes
combined). When the four studies which reported their findings both for the total
sample and for both sexes, are added to the 20 studies which reported their results for
the total, the sample reaches 24. When the data of these 24 studies are analysed, it can
be seen that out of these 24 studies, 19 obtained at least one positive and significant
relationship between internality and academic achievement (Crandall et al., 1965; Shaw
and Uhl, 1971; Nowicki & Strickland, 1973; Prociuk & Breen, 1974; Gordon, 1977;
Bar-Tal et al., 1980; Reid & Croucher, 1980; Moore, 1980; Traub, 1982b; Trice, 1985;
C h a p t e r T h r e e
- 24 -
Korkut, 1986; Chadha, 1989; Abdallah, 1989a; Strassburger et al, 1990; Majdub, 1990;
Darko-Yeboah, 1990; Maqsud & Rouhani, 1991; Murk & Addleman, 1992; Maqsud,
1993).
Nine studies out of 24 found only significant and positive relationships between
internality and academic achievement. These studies, however, did not report either a
nonsignificant or a negative correlation. (Prociuk & Breen, 1974; Gordon, 1977; Bar-
Tal et al., 1980; Reid & Croucher, 1980; Traub, 1982b; Korkut, 1986; Chadha, 1989;
Murk & Addleman, 1992; Maqsud, 1993).
Ten studies out of 24 which reported results of the total sample, obtained some
significant as well as some nonsignificant correlations (Crandall et al., 1965; Shaw and
Uhl, 1971; Nowicki & Strickland, 1973; Moore, 1980; Trice, 1985; Abdallah, 1989a;
Strassburger et al, 1990; Majdub, 1990; Darko-Yeboah, 1990; Maqsud & Rouhani,
1991).
Six studies out of these 24, however, did not obtain one significant or positive
correlation between internality and academic achievement. These six studies were:
Crump, Hickson & Laman, 1985; Gadzella, Williamson & Ginther, 1985; Yesilyaprak,
1988; Hagborg et al., 1991; Ferrary & Parker, 1992; Yates et al., 1994).
It has to be emphasised that none of these 24 studies which reported data on the total
sample, found a significant relationship between externality and academic achievement.
The general findings of this review are similar to previous reviews. Even though the
studies reviewed above do not always provide consistent data, there is a trend indicating
that the perception of locus of control is related to academic achievement. The general
results suggest that the more internal a person’s orientation is, the higher that person’s
achievement is likely to be. They also suggested that internals show superior academic
achievement. The general finding of positive relationships between internality and
C h a p t e r T h r e e
- 25 -
academic achievement in this review is congruent with the previous reviews of Phares
(1976), Lefcourt (1976), Bar-Tal & Bar-Zohar (1977), Uguroglu & Walberg (1979), and
Findley & Cooper (1983), who reported a number of studies showing a positive
association between internality and school achievement.
Although a considerable number of studies have been undertaken in the Western world
to investigate locus of control-achievement relationships, only two studies have been
identified in Turkey (Korkut, 1986; Yesilyaprak, 1988), and only one of them focused
on secondary school students. This data clearly indicates that the number of Turkish
studies is very limited. Therefore, one of the main objectives of this study is to
investigate the locus of control-achievement relationships in Turkish subjects.
In summarising the results of this review, it seems fair to assert that locus of control
generally relates to academic performance, but the findings are not always consistent.
Although it is not yet clearly known how to change students’ locus of control, teachers
can suggest ways to improve their awareness of cause-and-effect relationships (Clifford,
1981, p.383; Maqsud, 1993, p.17).
3.3.3.2 The summary of the studies on sex differences
When the 14 studies which reported data on the relationship between internality and
academic achievement for both males and females separately were examined, it could
be seen that 12 of them reported at least one significant and positive relationship
(Crandall et al., 1962; Crandall et al., 1965; Nowicki & Roundtree, 1971; Brown &
Strickland, 1972; Nowicki & Strickland, 1973; Nowicki & Segal, 1974; Duke and
Nowicki, 1974; Nowicki & Duke, 1974; Prociuk & Breen, 1975; Gordon, 1977; Traub,
1982b; Mwamwenda & Mwamwenda, 1986). Two studies, however (Massari &
Rosenblum, 1972; Gadzella, Williamson & Ginther, 1985) did not obtain any
significant and positive correlation.
C h a p t e r T h r e e
- 26 -
When these 14 studies were examined in terms of their findings for boys and for girls
separately, 10 studies for boys (Crandall et al., 1962; Crandall et al., 1965; Nowicki &
Roundtree, 1971; Brown & Strickland, 1972; Nowicki & Strickland, 1973; Nowicki &
Segal, 1974; Duke and Nowicki, 1974; Nowicki & Duke, 1974; Prociuk & Breen, 1975;
Gordon, 1977), and seven studies for girls (Crandall et al., 1965; Nowicki & Strickland,
1973; Nowicki & Segal, 1974; Prociuk & Breen, 1975; Gordon, 1977; Traub, 1982b;
Mwamwenda & Mwamwenda, 1986) obtained at least one significant and positive
relationship between internality and academic achievement. However, four studies for
boys (Massari & Rosenblum, 1972; Traub, 1982b; Gadzella, Williamson & Ginther,
1985; Mwamwenda & Mwamwenda, 1986) and seven studies for girls (Crandall et al.,
1962; Nowicki & Roundtree, 1971; Massari & Rosenblum, 1972; Brown & Strickland,
1972; Nowicki & Duke, 1974; Duke and Nowicki, 1974; Gadzella, Williamson &
Ginther, 1985) did not obtain any significant and positive correlation. Furthermore,
none of the 14 studies found a negative relationship between internal locus of control
and academic achievement for boys, but three studies were found for girls (Massari &
Rosenblum, 1972; Duke and Nowicki, 1974; Nowicki & Duke, 1974). Six studies for
boys (Crandall et al., 1962; Nowicki & Roundtree, 1971; Brown & Strickland, 1972;
Nowicki & Segal, 1974; Nowicki & Duke, 1974; Prociuk & Breen, 1975) and only
three studies for girls (Prociuk & Breen, 1975; Traub, 1982b; Mwamwenda &
Mwamwenda, 1986) reported that all of the correlations were significant.
Five studies found at least one significant and positive relationship between internal
LOC and AA both for boys as well as for girls (Crandall et al., 1965; Nowicki &
Strickland, 1973; Nowicki & Segal, 1974; Prociuk & Breen, 1975; Gordon, 1977).
None of the four studies (Crandall et al., 1962; Nowicki & Roundtree, 1971; Brown &
Strickland, 1972; Duke & Nowicki, 1974) found a significant and positive relationship
between internality and AA for girls, nevertheless they all found et least one for boys.
Two studies (Traub, 1982b; Mwamwenda & Mwamwenda, 1986) found significant
C h a p t e r T h r e e
- 27 -
positive relationships for girls, but none of them found any for boys. Only two studies
found no significant relationship either for boys or girls (Massari & Rosenblum, 1972;
Gadzella, Williamson & Ginther, 1985).
When these statistics are examined, it can be seen that the relationship between locus of
control and academic achievement of boys looks stronger than that of girls, and
compared to boys, girls shows inconsistent results in this review. The general finding of
this review supports the findings of Phares (1976), Lefcourt (1976), Findley & Cooper
(1983), Dyal (1984), and Majdub (1990). Findley & Cooper (1983) found that the
relationship between locus of control and academic achievement was more substantial
among males than among females (r=0.20 for males, and r=0.11 for females). However,
the findings of this review do not support the findings of Stipek & Weisz (1981). They
found no evidence that the relationship between locus of control and achievement of
boys was stronger than of girls in their review.
The Turkish literature does not provide any data to examine sex differences in the locus
of control / achievement relationship. As mentioned earlier, only two Turkish studies
were identified investigating the locus of control / achievement relationship, but none of
them provided data for males and females separately.
As previous studies indicate, gender often moderates the relationship between locus of
control scores and other behaviours (Phares, 1976; Lefcourt, 1976). Internality is one of
them and it is often related to a variety of achievement behaviours in males but is not as
consistent in females. Contrary to the theoretical expectation, negative correlations
between internality and females’ achievement have been found. In the previous studies,
three main psychological reasons have been offered to explain the inconsistency of the
relation between locus of control and academic achievement. They are: a) defensive
externality, b) fear of success, and c) attribution of some other variables (such as self-
esteem, motivation). The first reason has been used to explain the nonsignificant
C h a p t e r T h r e e
- 28 -
relation achievement and locus of control by Rotter (1966) and Duke & Nowicki (1974)
and Phares (1976). The second reason has been used by Duke & Nowicki (1974), and
Massari & Rosenblum (1972). The third reason has been used by Gordon (1977) and
Majdub (1990). While Duke & Nowicki (1974) point out that fear of success of female
students leads to defensive externality, i.e. denial of personal responsibility for success,
Phares (1976), however, states that defensive externality works better for males than for
females. He reasons that, due to greater cultural pressures for success, males seemingly
have a greater need to protect themselves against failure by recourse to external
attributions. It is also possible that such sex differences are mediated by differential
cultural roles commonly assigned to boys and girls. According to Platt et al., (Phares,
1976) the moderating effects of sex may be due to the greater socialisation undergone
by females, as contrasted to the greater responsiveness of males to situational
considerations. In order to explain female externality Gordon (1977) emphasises the
importance of self-esteem. He suggests that since internality is associated with high
self-esteem with only the boys in his research, it is possible that the higher grades that
internal boys receive add to their positive self-concept. Internal girls, on the other hand,
probably receive little recognition for having higher achievement in test scores, and
hence do not have such high self-esteem. Majdub (1990) emphasises the importance of
motivation. For him, although the relation of motivation with achievement and locus of
control may provide some explanation for the inconsistency of the relation between
locus of control and achievement, many studies he reviewed failed to examine this.
3.3.4 Educational Implications
The evidence of this review suggests that the perception of locus of control is related to
academic achievement in such way that students with internal orientation tend to
perform better on academic work than students with external orientation. Within this
framework, the crucial question that should be put forward is whether the perception of
C h a p t e r T h r e e
- 29 -
locus of control is a stable one or not. It is clear that if we accept that locus of control
orientation is a stable disposition, then we accept a deterministic view, a view which
does not include expectations that the student’s external orientation can change.
However, if we accept that locus of control orientation is determined, then we accept
the possibilities for changing the students’ locus of control orientations by modifying
their environments.
It is noted that Rotter has already underlined that “internal-external attitudes are
obviously not generalised across the board” (Rotter, 1966, p. 21). Mischel et al., (1974)
also suggest that: “social behaviour, rather than being determined by global, broadly
generalised personality traits, depends on the consequences of alternative courses of
action in the situation” (p.266). This view has been based on extensive research (Bar-
Tal & Bar-Zohar, 1977), which has shown that behaviour derived from certain
dispositional tendencies can be affected by a variety of stimulus conditions and can be
modified by numerous environmental changes.
Apart from the evidence of Mischel et al., (1974) which indicates that perception of
locus of control is affected by situational variables, numerous studies have shown that
special programs may change an individual’s perception of locus of control. For
example, a study by Bar-Tal, Bar-Tal, & Leinhardt (1975) indicated that in classrooms
which utilised individualised programs pupils had more internal perception of locus of
control than in classrooms which utilised a traditional method of teaching. Omizo &
Omizo (1988) found that their educational enhancement program demonstrated that the
perception of locus of control could be modified. These investigators found that seventh
and eighth grade Honolulu adolescents from divorced families who participated in a
group counselling program, manifested a clear and significant change in the direction
toward internal orientation, after 10 weekly counselling sessions of 45 minutes each.
Also, a study of Young-Sheng (1990) found that mean locus of control scores of first
C h a p t e r T h r e e
- 30 -
and fourth year middle school students in China, developed significantly after a four-
week instructional activity had been applied , while the mean score of the control group
showed no clear development. Moreover, different forms of instruction had different
effects on the development of students’ locus of control. Visor (1992) found that
students who participated in a five-session Supplemental Instruction Self-Esteem course
were more internally oriented for locus of control than were the control group.
In summary, the above studies suggest that perception of locus of control can be
modified by restructuring the environment. It appears that certain instructional programs
have succeeded in changing the perception of locus of control toward an internal
orientation. Moreover, these changes in the perception of locus of control were linked
with improvement in academic achievement. Children who increased their internal
orientation also improved their academic performance. These findings may have
important implications for educators. They suggest that educators could structure
classroom environments in such a way that they may stimulate and encourage internal
perceptions. The modifications should enable the students to perceive their environment
as one in which they are capable of making decisions and of taking responsibility for
their actions. Internal orientations may increase students’ efforts and persistence, which
should be reflected in higher grades.
Although a great number of research studies found a positive relationship between
internal locus of control and academic achievement, there have been only two studies
(Korkut, 1986; Yesilyaprak, 1988) which investigated this relationship with Turkish
samples. After searching the published literature, the present researcher could not find
any study which investigated the relationship between locus of control and academic
achievement for Turkish secondary school children. Korkut (1986) investigated this
relationship for primary school children, Yesilyaprak (1988), investigated secondary
school children, but she correlated the locus of control scores of children with their past
C h a p t e r T h r e e
- 31 -
primary and middle school achievement scores, and not with their actual secondary
school achievement. Therefore neither of the two researchers actually examined the
relationship between locus of control and academic achievement for secondary school
children. It seems both important and worthwhile, then, to investigate this area.
3.4 SEX DIFFERENCES IN LOCUS of CONTROL
3.4.1 Introduction
In the previous section sex differences were examined in the context of the relationship
between locus of control and academic achievement. However, the main objective of
this section is to consider sex comparisons in the locus of control construct and
therefore sex differences will be analysed separately. The review will consist of 29
research studies and 89 samples. A summary will follow the empirical findings.
3.4.2 Empirical Findings
Crandall et al., (1965) found that at grades 6, 8, 10 and 12 girls had significantly more
internal responses than boys. However, there were no sex differences at grades 3, 4, or
5.
Shaw and Uhl (1971) used The Bialer-Cromwell Children’s Locus of Control Scale
with 107 males and 104 females among second grade public school children in the USA
and found no sex differences in locus of control.
Massari & Rosenblum (1972), in their study with 90 male and 43 female college
students in the U.S.A., found no sex differences in Rotter’s I-E Scale. However, they
found significant sex differences in favour of females in Crandall’s IAR I Total
(p<0.05), and IAR I- (p<0.01).
C h a p t e r T h r e e
- 32 -
Using Rotter’s I-E scale with 175 Japanese (117 males and 58 females) and 119
American (59 males and 60 females) undergraduates, Bond & Tornatzky (1973) found
no sex differences on locus of control when the populations were tested either together
or separately. The lack of sex difference is perhaps surprising in the Japanese sample,
given Japanese traditions regarding the lower status of women. For the author, this
result might be explained by higher achievement motivation being generally correlated
with lower externality (Rotter, 1966). As the ratio of men to women in Japanese
universities is greater than 4: 1, it is probable, therefore, that this female population has
a relatively higher level of achievement motivation than their male counterparts.
Nowicki & Strickland (1973) found that females had more internal scores in grades 3, 5,
6, 8, 9, 10 and 11, whereas males had more internal scores only in grades 4, 7, and 12.
Though the authors pointed out that most of the mean differences were non significant,
they did not mention which mean differences were significant or which were non
significant. As they recorded neither t-test nor f-test results in order to find out whether
these sex differences were significant or not, it is difficult to have a clear idea about
their findings.
Using the Rotter Internal-External Locus of Control Scale with more than 1,500
students (719 males and 819 females) from Australia, Japan, New Zealand, Sweden,
and the United States, McGinnies et al., (1974) found a significant main effect of sex
difference at the 0.001 level on locus of control, and concluded that females had more
external mean I-E scores than males. However, in detail, the mean I-E score for males
was found to be significantly more internal than for females within the Australian and
Swedish samples (p<0.05), although sex differences were not significant within any of
the other three countries.
Parsons & Schneider (1974), using Rotter Internal-External Locus of Control Scale
(1966) with 539 university students, investigated locus of control differences among
C h a p t e r T h r e e
- 33 -
Eastern and Western societies. Data from eight countries including Japan, India, France,
Germany, Italy, Canada, the United States and Israel were subjected to an analysis of
variance. A significant sex effect (p<0.001) was found in favour of males. The authors
found that “consistently higher external scores for the females is a general finding
across countries”. However, it should be emphasised that the effect was small and that t-
tests of gender differences within countries were significant only for Israel.
Furthermore, the significant overall gender effect was limited to the “Luck-Fate” and
“Leadership-Success” dimensions. The others subscales were: “Politics”, “Respect”,
and “Academic”. Parsons & Schneider (1974) noted that females were not given equal
opportunity for leadership positions and therefore the results on the Leadership-Success
scale were not surprising.
Louden (1977) in his comparative research in minority group adolescents in English
multi-racial secondary schools, found no significant effect of sex on locus of control
when all samples were combined. However, English boys were more internal than
English girls. Asian girls were more internal than Asian boys, and there were no sex
differences between West Indian adolescents.
Moore (1980) found no sex differences in academic locus of control (Crandall et al.’s
IAR) among 8, 11, and 13 year old students in England.
Halpin, Halpin & Whiddon (1981) found no sex differences in Crandall et al.’s IAR
Scale among either American Indian (male = 51, female = 46) or White (male = 68,
female = 60) junior high and senior high school students.
Lok (1983) found no significant differences between the mean scores of 10-12 year old
English boys and girls, in locus of control.
C h a p t e r T h r e e
- 34 -
Trice (1985) found no sex differences in locus of control either among teacher-
education students at a state college, or among psychology course students at a private
college in the USA.
Using Rotter’s I-E Locus of Control Scale with 46 male and 107 female undergraduates
in the College of Education in the U.S.A., Crump, Hickson, & Laman (1985) found that
females were significantly more internally oriented than males. The study revealed that
females were relatively equally distributed according to their internal / external
preference (49.5% internal, 50.0% external), while males were classified as
predominantly internal (78.6%).
Korkut (1986) found no sex differences in locus of control among 540 Turkish primary
school students, using the Nowicki-Strickland LOC scale.
Using Rotter’s I-E Locus of Control Scale with 148 (male =76, female = 72) Transkeian
students enrolled in a teacher training programme, Mwamwenda & Mwamwenda
(1986) found a significant sex difference (p< 0.01) in favour of male students. The
authors argued that their sex differences in locus of control could be accounted for by
the fact that the males were older than the females. They also argued that sex
differences may be socially and culturally explained in the sense that normally, in
Transkeian society, men play a more dominant role than women.
Chiu (1987), in his research investigating locus of control differences between
American and Chinese adolescents (10th grade students), found that females had
significantly higher I- scores (more internal) than males (p<.01). The author pointed out
that the gender difference was caused mainly by the American subjects, as American
females were significantly more internal than American males (p< 0.01). However,
there were no sex differences both in I+ (self-responsibility for success) and I Total
(self-responsibility for success and failure situations).
C h a p t e r T h r e e
- 35 -
Yesilyaprak (1988) in her research to find out factors which effect students’ locus of
control, revealed no sex differences among 720 secondary school students, in Turkey.
Investigating sex differences in perceived locus of control, De Brabander & Boone
(1989) collected and analysed the responses to the Rotter scale of 87 male and 60
female undergraduates in Belgium, in an attempt to replicate the findings of Little,
(1979), McGinnies, Nordholm, Ward, & Bhanthumnavin, (1974), and Rotter, (1966). In
the study of De Brabander & Boone (1989), females appeared to be more external than
male students and sex differences were significant. Their results, however, indicated
that the Rotter scale may not measure the female perception of control. The internal
reliability of the female sample, measured with the Cronbach alpha, was lower when
compared with the male sample (0.56 and 0.73 respectively). They hypothesise that the
female responses to the items are determined by what they feel to be socially acceptable
answers, and the answers were a reflection of the general perception that in most
societies women are more dependent than men on external factors.
Using the Sphere -of- Control Questionnaire with 400 British (200 male and 200
female) and 450 Arab (225 male and 223 female) university students, Abdallah (1989a)
found no significant sex differences in locus of control among either group.
Jensen et al., (1990) reported that men scored more internally than women in a sample
numbering 11,729. The data was collected in 1981 and was obtained from the European
Value Study Group survey of basic human values. The statistics were from nine
Western European countries, including Britain, France, Germany, Italy, Holland,
Denmark, Belgium, Spain and Ireland. However, the authors did not give any
explanation of whether sex differences in this study was statistically significant or not.
Young-Sheng (1990) found no significant sex differences in the locus of control scores
of 1st and 4th year middle school students in China.
C h a p t e r T h r e e
- 36 -
Giderer (1990), in his research, tried to find out sex differences in locus of control
scores of students who belonged to different types of secondary schools, “the science
secondary school” and “the general secondary school”, in Turkey. The results showed
no sex differences among students of “the science secondary school”. However,
significant sex differences were found in favour of boys among students of “the general
secondary school”.
Singh & Verma (1990) revealed significant sex differences in favour of girls among 12-
28 year old subjects, in two Indian societies.
Tashakkori & Thompson (1991) collected data from a longitudinal sample of 14,721
White (7,193 men, 7,528 women) and 5,197 Black (2,400 men, 2,797 women)
American high school students. The data was tested first between ages 16 and 19, and
was then examined in two follow-ups, four and six years later, to determine sex
differences in locus of control orientation. The results indicated that female adolescents
tended to be more internal than males, within both Blacks and Whites. It also appeared
that sex differences between Whites were greater than between Blacks, but these
differences tended to be relatively small. However, the authors did not give any
information about whether these sex differences were statistically significant or not.
Karnes & D’ilio (1991), when investigating 68 rural, Southern American elementary
gifted students, aged 8 to 14 years, used the Nowicki-Strickland Locus of Control Scale,
and found that girls tended to be more internal than boys. Again, they did not state
whether the results of their findings was significant or not.
Maqsud & Rouhani (1991) found no sex differences in locus of control in 9th grade
secondary school students (aged 16-17), in the Republic of Southern Africa.
C h a p t e r T h r e e
- 37 -
Using the Clifford’s (1976) Academic Achievement Accountability Scale (CAAAS)
with 120 (60 male and 60 female) middle school students in Bophuthatswana, Maqsud
(1993) found no significant sex differences on academic locus of control.
Yates et al., (1994) using the Nowicki-Strickland Internal-External Locus of Control
Scale with 44 female and 48 male, severely disturbed adolescents in the USA, found
that neither gender differed significantly on locus of control.
The Nowicki-Strickland Internal-External Locus of Control Scale was used with
ethnically diverse, gifted, middle school students, in the USA. The study involved 90,
sixth, seventh and eighth grade African-American students (31 boys, 59 girls), 35 third-
generation Mexican-American students (17 boys, 18 girls), and 45 third-generation
Chinese-American students (35 boys, 9 girls). Yong (1994) found non-significant sex
differences for the three samples. The findings of this study suggest that ethnically
diverse students, regardless of their gender, tend to believe that they are in control of
their destiny, that their lives are not controlled by external factors and that they assume
responsibility for their failures.
3.4.3 Summary
There does not appear to be any simple way of summarising sex differences with regard
to locus of control scales. Many studies do not report separate means for males and
females. Some may report separate gender mean scores, but only for some of the scales
and not for others. Furthermore, there is sometimes no information given by researchers
as to whether sex differences on locus of control are statistically significant or not.
In this review, in order to find out sex differences in locus of control, 29 studies were
analysed. Four studies (Nowicki & Strickland, 1973; Jensen et al., 1990; Tashakkori &
Thompson, 1991; Karnes & D’ilio, 1991), however, were found to be unclear about
whether sex differences were statistically significant or not. Although some of these
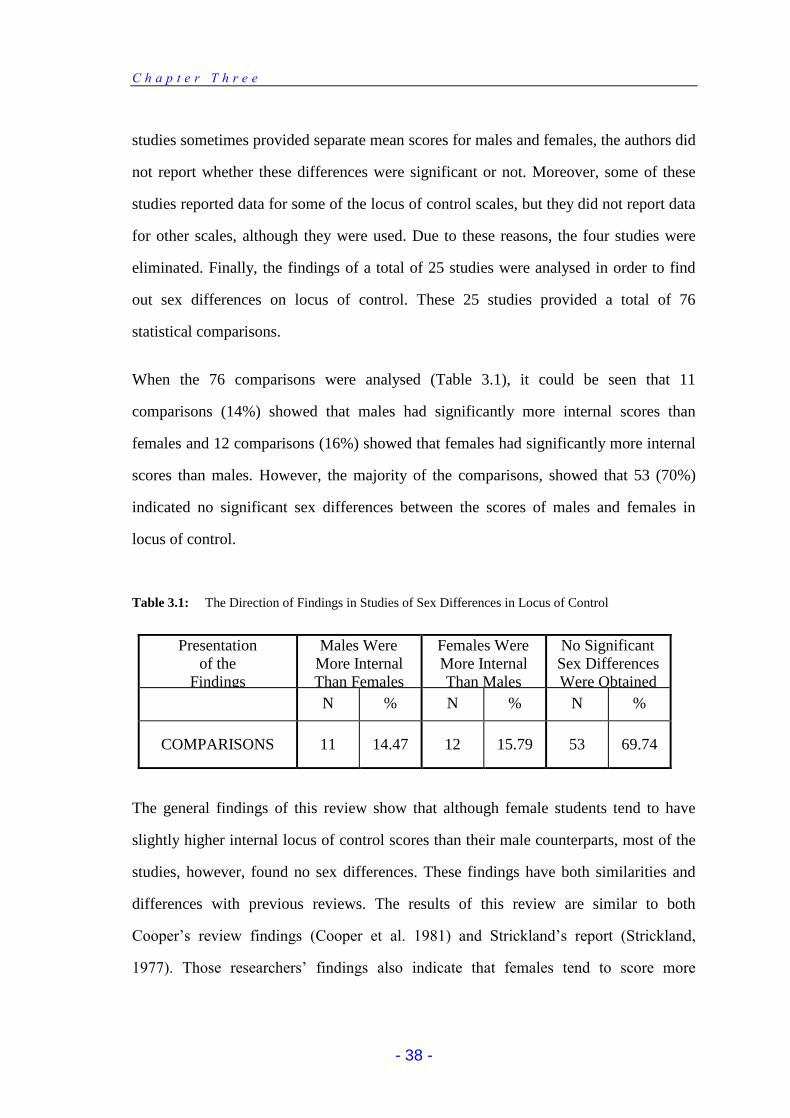
C h a p t e r T h r e e
- 38 -
studies sometimes provided separate mean scores for males and females, the authors did
not report whether these differences were significant or not. Moreover, some of these
studies reported data for some of the locus of control scales, but they did not report data
for other scales, although they were used. Due to these reasons, the four studies were
eliminated. Finally, the findings of a total of 25 studies were analysed in order to find
out sex differences on locus of control. These 25 studies provided a total of 76
statistical comparisons.
When the 76 comparisons were analysed (Table 3.1), it could be seen that 11
comparisons (14%) showed that males had significantly more internal scores than
females and 12 comparisons (16%) showed that females had significantly more internal
scores than males. However, the majority of the comparisons, showed that 53 (70%)
indicated no significant sex differences between the scores of males and females in
locus of control.
Table 3.1: The Direction of Findings in Studies of Sex Differences in Locus of Control
Presentation
of the
Findings
Males Were
More Internal
Than Females
Females Were
More Internal
Than Males
No Significant
Sex Differences
Were Obtained
N % N % N %
COMPARISONS 11 14.47 12 15.79 53 69.74
The general findings of this review show that although female students tend to have
slightly higher internal locus of control scores than their male counterparts, most of the
studies, however, found no sex differences. These findings have both similarities and
differences with previous reviews. The results of this review are similar to both
Cooper’s review findings (Cooper et al. 1981) and Strickland’s report (Strickland,
1977). Those researchers’ findings also indicate that females tend to score more
C h a p t e r T h r e e
- 39 -
internally than males in locus of control. Cooper et al., (1981) conducted a statistical
combination on past research (ten studies), examining gender differences in the locus of
control beliefs. The review revealed that females tended to score slightly more
internally than males in “total self-responsibility” and in “self-responsibility for failure”,
as measured by the Intellectual Achievement Responsibility (IAR) Scale. Though they
found greater female internality, the gender differences were small. Strickland (1977)
reported a general pattern indicating no sex differences in locus of control research.
However, the findings of the review do not support those of Rotter (1966),
Cellini & Kantorowski (1982) and Doherty (1983), as they reported that females were
more externally oriented than males. Rotter (1966) reported that American women were
more externally oriented than men. Cellini & Kantorowski (1982) found similar results
to Rotter. In a longitudinal study from 1968 to 1978, Doherty (1983) reported men as
being significantly more internal, with a sharp increase in the externality of women
from 1972 to 1978. He explained this sudden shift to the loss of control women may
have felt as awareness of sex discrimination heightened in the early 1970s.
To be able to see a general pattern of gender effect on locus of control, it might be
useful to examine the review by analysing the findings between 1960-1979 and 1980-
1990s separately.
When Table 3.2 was analysed it could be seen that a large percentage of studies
obtained non-significant sex differences (61.5%) during the period of 1960-1979.
During these years, the percentage of comparisons which found that males were
significantly more internal than females (20.5%), was slightly greater than the
percentage of comparisons which found sex differences in favour of females (17.9%).
However, the studies during the period of 1980-1994 indicate that the number of
comparisons which found that females were significantly more internal than males, was
slightly higher than the number of comparisons which found males were more internal
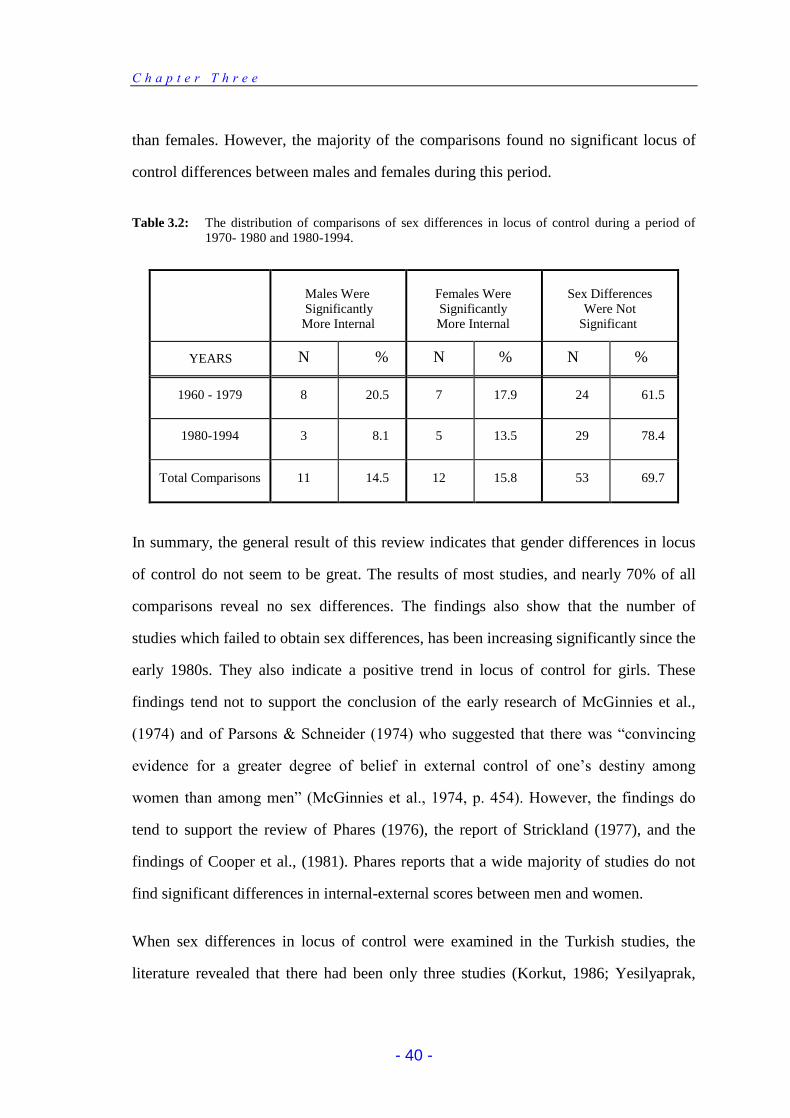
C h a p t e r T h r e e
- 40 -
than females. However, the majority of the comparisons found no significant locus of
control differences between males and females during this period.
Table 3.2: The distribution of comparisons of sex differences in locus of control during a period of 1970- 1980 and 1980-1994.
Males Were Significantly More Internal
Females Were Significantly More Internal
Sex Differences
Were Not Significant
YEARS N % N % N %
1960 - 1979 8 20.5 7 17.9 24 61.5
1980-1994 3 8.1 5 13.5 29 78.4
Total Comparisons 11 14.5 12 15.8 53 69.7
In summary, the general result of this review indicates that gender differences in locus
of control do not seem to be great. The results of most studies, and nearly 70% of all
comparisons reveal no sex differences. The findings also show that the number of
studies which failed to obtain sex differences, has been increasing significantly since the
early 1980s. They also indicate a positive trend in locus of control for girls. These
findings tend not to support the conclusion of the early research of McGinnies et al.,
(1974) and of Parsons & Schneider (1974) who suggested that there was “convincing
evidence for a greater degree of belief in external control of one’s destiny among
women than among men” (McGinnies et al., 1974, p. 454). However, the findings do
tend to support the review of Phares (1976), the report of Strickland (1977), and the
findings of Cooper et al., (1981). Phares reports that a wide majority of studies do not
find significant differences in internal-external scores between men and women.
When sex differences in locus of control were examined in the Turkish studies, the
literature revealed that there had been only three studies (Korkut, 1986; Yesilyaprak,
C h a p t e r T h r e e
- 41 -
1988; Giderer, 1990). While the first two studies obtained no sex differences in locus of
control, the third study (Giderer, 1990) found mixed results. The study of Giderer
(1990) revealed that while there were no differences between locus of control scores of
boys and girls in a secondary school, boys had significantly more internal scores than
girls in another secondary school. The data showed that only two of the three studies
were based on secondary school students, and therefore it is difficult to form firm
conclusions about the Turkish students.
3.5 LOCUS of CONTROL & CULTURAL DIFFERENCES
3.5.1 Introduction
Starting after World War II, and later in the 1950s and 1960s, in the United States the
civil rights movement focused on cultural, social and personal aspirations of American
minorities. Responding to these sociocultural processes, as Dyal (1984) notes social
psychologists directed their research energies toward a better understanding of socially
relevant issues. Similarly, American personality theorists focused on such culturally
relevant constructs as the need for achievement, aspiration, expectation of success-
failure, and locus of control. Not surprisingly, locus of control instruments were almost
immediately used for making comparisons among American ethnic groups, and later
among national-cultural groups. As noted by Phares (1976), “such cross-cultural
comparisons are particularly important, not just because they may ultimately mediate
group differences in certain kinds of behaviour, but also because of their implications
with respect to the antecedents of internal-external beliefs” (p.45).
In the aftermath of this movement the locus of control construct has extensively been
the subject of cross-cultural studies, and several reviews have been published (Lefcourt,
1966; Lefcourt, 1976; Phares, 1976; Furnham & Henry 1980; Hui, 1982; Dyal, 1984)
and most of them reveal social antecedents to the locus of control (Lefcourt, 1966;
C h a p t e r T h r e e
- 42 -
Phares, 1976; Hui, 1982; Dyal, 1984). Researchers have also hypothesised that the
belief in externality is highly probable in social groups having a small access to power,
material resources, and social mobility (Hui, 1982). Reviewing research prior to 1981,
Hui (1982) found that the results of cross-cultural studies on locus of control were
inconsistent, and he pointed out a number of methodological issues, such as
dimensionality of measuring instruments and representativity of the samples. However,
the previous research generally supports the view that people from Eastern countries are
more external than Western people (Abdallah, 1989a); people from the lower classes
are more external than people from the middle classes (Rotter, 1966; Gruen & Ottinger,
1969; Phares, 1976; Schmidt, Lamm, & Trommsdorff, 1978); workers from
economically developed cultures and countries are likely to be more internal in areas
such as leadership and success than those workers from developing countries (Reitz &
Groff, 1974 ); blacks are more external than whites (Rotter, 1966; Du Cette, Wolk, &
Friedman, 1972; Phares, 1976); West Indian adolescents are more external than English
(Louden, 1977); Japanese students are more external than Americans (Bond &
Tornatzky, 1973); and American Catholics are more external than American Protestants
(Geist & Bangham, 1980).
The aim of this review is to consider whether locus of control as an intrapersonal
variable affects social behaviour differently in different cultures. Therefore some of the
well known previous and recent studies have been included.
3.5.2 Empirical Findings
One of the earliest cross-cultural comparisons was undertaken by Hsieh, Shybut, &
Lotsof (1969) and compared Hong Kong Chinese adolescents (17 year olds) with
Chinese-American and Anglo-Americans. They found that Anglo-Americans were more
internal than either American-born Chinese or Chinese born in Hong Kong. However,
among Chinese, Chinese-Americans were more internal than native born Chinese.
C h a p t e r T h r e e
- 43 -
Cross-cultural differences among groups from the United States, Denmark, West
Germany and Japan have been studied by Parsons, Schneider & Hansen (1970). They
revealed that internal-external orientations of American students were similar to Danish
students. When statistical analyses were carried out separately for the different sexes,
however, Danish males were slightly more external than the American males, though no
difference was found between American and Danish females.
Schneider & Parsons (1970) in their more detailed study, divided the Internal-External
scale into five subscales, based on the content of items of the Rotter scale (1966), and
revealed that American and Danish students were significantly different in their patterns
of scoring.
Using Rotter’s I-E scale with 175 Japanese undergraduates (117 male and 58 female)
and 119 White American undergraduates (59 male and 60 female), Bond & Tornatzky
(1973) found that Japanese students showed greater externality of response than did
students from the United States (p<0.001) on locus of control. The result of the
Japanese students might be explained by the fact that Japan is regarded as a vertically
integrated society, with great importance attached to group norms, and loyalty to
tradition.
Parsons and Schneider (1974), using the Rotter Internal-External Locus of Control
Scale (1966) with 539 university students, investigated locus of control differences
among Eastern and Western societies. Data from eight countries including Japan, India,
France, Germany, Italy, Canada, the United States and Israel was subjected to analysis
of variance and a significant cultural effect (p<0.001) was found. It was revealed that
the two Eastern countries (Japan and India) represented the extremes. Japanese students
scored in a significantly more external direction than all other students, and Indian
students were found to be the most internal group. Though Asian countries had the
greatest differences between scoring pattern, the smallest differences were obtained
C h a p t e r T h r e e
- 44 -
among European countries. However, the prediction of Western-Oriental difference was
not supported by Parson & Schneider’s data, where Japanese appeared as the most
external while the Indians were the most internal, with all other Western and Middle-
Eastern peoples in between.
Using the Rotter Internal-External Locus of Control Scale with more than 1,500
students (719 males and 819 females) from Australia, Japan, New Zealand, Sweden,
and the United States, McGinnies, Nordholm, Ward, & Bhanthumnavin (1974) found a
significant cultural effect at the 0.001 level. The mean I-E score was most external
among subjects from Sweden, followed by those from Japan, Australia, the United
States, and then New Zealand. Mean I-E scores among the Australians, New
Zealanders, and Americans did not differ significantly. The means for the Japanese and
Swedish subjects, however, were found to differ significantly from those of the three
former groups as well as from each other (p<0.05). The similarity in locus of control
scores among subjects from Australia, New Zealand, and the United States might be
explained by their Anglo-Saxon background and common cultural structure. The
Protestant ethic which induces hard work and individual initiative is supposedly
characteristic of all three countries. The result of being more external for Japanese
subjects might be associated with the structure of Japanese culture and society, where
individuals are reared in a society that values traditions of politeness, obedience, and
conformity and might be expected to believe more in external than internal control. The
case of Swedish subjects being the most external group might be associated with their
age. Unlike the other groups (university students), the Swedish subjects were upper
secondary school students. However, Parsons & Schneider’s (1974) findings were
partially replicated by a five-country study by McGinnies, et al., (1974) which was that
externality was highest for Swedish subjects, followed by Japanese.
C h a p t e r T h r e e
- 45 -
In another study Carment (1974) found that Canadian students were more external than
their Indian counterparts. Comparisons on separate factors of the scale, suggested that
the Indian students were more external on the “Personal control” factor, but more
internal on the other factors -”Control ideology” and “System modifiability”. The
common belief that westernisation entails internal belief is not supported in this study.
When investigating cultural differences in locus of control, Garza & Ames (1974),
using Rotter’s I-E Scale with 47 Anglo-Americans and 47 Mexican-Americans,
obtained significant cultural differences in locus of control: Mexican Americans were
significantly more internally oriented than Anglo-Americans on the total I-E scale (p<
0.01). Significant differences were also found on two of the five dimensional categories.
Mexican-Americans were significantly more internally oriented than Anglo-American
students on the “luck and fate” (p<0.05), and “respect” (p<0.02) dimensions. There
were no significant cultural differences on the other dimensions of locus of control:
“politics”, “leadership success” and “academic”.
Rfaei & Rahman (1976) found no significant differences between Malaysian secondary
students and Australian university students, but when secondary students alone were
compared; the Australians were more external than the Malaysians.
Comparing Greeks and Americans, Malikiosi & Ryckman (1977) found that Greeks had
a stronger belief that their lives were controlled by “Powerful Others” and “Chance”
(Lavenson IPC scale). However, no cultural differences were present on the
“Internality” dimension and the two groups were alike on this dimension of the
Lavenson locus of control scale. As noted by Dyal (1982) “the strong cultural
differences on the Powerful Others and Chance dimensions may be understood as
reflecting a veridical perception by the Greeks of their cultural constraints, in that data
was collected in 1973 shortly before the overthrow of the military dictatorship” (p.224-
225).
C h a p t e r T h r e e
- 46 -
In his comparative research in minority group adolescents in English multi-racial
secondary schools, Louden (1977) found a significant effect of race on locus of control
(p< 0.01). English and Asian adolescents were more internal than West Indian
adolescents.
Administering Rotter's I-E Locus of Control Scale to male, Catholic, business
administration students in the United States (n = 86), West Germany (n = 54), Ireland (n
= 47), and Mexico (n = 57), Cole et al., (1978) revealed that the mean score for
Mexican respondents was significantly more internally oriented than students from each
of the other nations (p< 0.05). No significant differences were found between the means
of any of the other national groups. Apart from these cross-cultural comparisons, Cole
et al., (1978) also compared locus of control scores for 151 Anglo and 95 Chicano,
senior high school students. The data revealed no significant locus of control
differences and scores of those two nations were nearly identical on each of the
Lavenson scales (Internal, Powerful Others, and Chance). However, within ethnic
groups, the college-bound Chicano male rejected control by chance more than did his
non-college-bound counterpart (p< 0.05). The finding of this study did not support the
stereotype of Mexican and Chicano students as being fatalistic, believing that his own
actions are irrelevant to personal outcomes. Instead, these groups appear equally, or
more, internal in perceived locus of control than their American counterparts or other
groups with whom they have been compared.
As a result of the common historical roots and the strong cultural similarities among the
Anglo-Celtic countries in the British Commonwealth, large differences in locus of
control would not be expected, and indeed none have been obtained. Reid & Croucher
(1980) validated the Crandall et al.’s IAR questionnaire on 1000 British primary school
children and obtained results that were highly similar to Crandall et al.’s (1965)
normative data for American subjects. These findings were also similar to the findings
C h a p t e r T h r e e
- 47 -
of McGinnies, Nordholm, Ward, & Bhanthumnavin (1974) research, where they found
no overall differences in I-E among students in the United States, Australia and New
Zealand. Similar results were also obtained by Parsons & Schneider (1974), where
results of their study showed no differences between Canadian and US students on the
overall I-E score or on any of the subscale scores. The findings of Cole et al, (1978) also
supporting this expectation. They reported no differences between students in the
United States and Ireland.
Geist & Bangham (1980) investigated the relationship between locus of control and
religions with 83 subjects (18 Catholics, 34 Protestants, and 31 agnostics, atheist, or
other religions) from an introductory psychology course, in the USA, and used the
Rotter IE scale and a questionnaire identifying religious affiliation. Analysis indicated
greater externality for Catholics (10.61) than for the Protestants (8.12, t=2.06, p<0.025).
Although the present results suggest that Catholics possess a greater belief in external
control relative to Protestant students, the findings may not be conclusive. The authors
indicated that Catholics in America were not a homogeneous group. More liberal
Catholics, in comparison with traditional Catholics, were advocating liturgical changes
and other reforms. Therefore, liberal Catholics would be assumed to be more internally
oriented than traditional Catholics.
Furnham & Henry (1980) investigated locus of control differences among 108 second-
year female nurses in three (racially segregated) hospitals in South Africa. The subjects
were 27 Africans, 37 Indians and 44 Europeans and they all had equivalent educational
qualifications and experience, and were at the same stage of their professional training.
However, the authors did not obtain a significant locus of control difference among the
three groups scores using Rotter’s IE scale (F=0.34, df=2/78, p>0.05). These non-
significant findings were attributed by the authors to socio-economic class differences,
sex role differences, and response bias. Moreover, the authors reviewed over thirty
C h a p t e r T h r e e
- 48 -
cross-cultural locus of control studies and reported that most of these studies neglected
the multidimensionality nature of locus of control construct.
Using IAR locus of control scale with 97 American Indians (51 male, 46 female) and
128 Whites (68 male, 60 female) high and senior high school students, Halpin, Halpin,
& Whiddon (1981) obtained that the two groups did not differ significantly, contrary to
previous research and theory. The authors’ explanation on the result was that both the
Whites and the Indians in this study, who were relatively successful students and were
still attending school, felt that they did have some measure of control over intellectual-
academic events.
Chandler et al., (1981) used Lefcourt’s MMCS (Lefcourt, Von Baeyer, Ware, & Cox,
1979) in India, South Africa, the United States, Japan and Yugoslavia. The study
revealed the Japanese sample to be highly external in the attribution of their successes,
but they were the most internal of all samples in attributing their failures. Lack of effort
was the strongest attribution of their failure. In contrast, the United States subjects
regarded effort as a cause of their success.
Chiu (1987), in his research investigating locus of control differences between 194
American (97 male and 97 female) and 194 Taiwanese Chinese (97 male and 97
female) Tenth grade adolescent students, found that the American adolescents were
significantly more internal (Crandall et al.’s IAR Scale) than their Chinese counterparts
in success situations, whereas Chinese adolescents were significantly more internal than
American adolescents in failure situations.
Using the Sphere -of- Control Questionnaire with 400 British (200 male and 200
female) and 450 Arab (225 male and 223 female) university students, Abdallah (1989a)
found a significant main effect for country on “Personal efficacy” (F=1,174 =28.515;
p<0.001), and “Sociopolitical control” (F=1,174 = 23.721; p<0.001), indicating that
C h a p t e r T h r e e
- 49 -
Arab students had significantly higher scores than their British counterparts. However,
there was no significant effect for country on the “Interpersonal control” subscale.
Jensen et al (1990) reported that society as an independent variable was more influential
on perceived locus of control than other variables ( age, sex, life cycle and social class).
A sample of 11,729 (the data was collected in 1981, and obtained from the European
Value Study Group survey of basic human values) was taken from nine Western
European countries, including Britain, France, Germany, Italy, Holland, Denmark,
Belgium, Spain and Ireland.
Tashakkori and Thompson (1991) collected data from a longitudinal sample of 14,721
White (7,193 men, 7,528 women) and 5,197 Black (2,400 men, 2,797 women)
American high school students. The data was tested first between the ages of 16 and 19.
In two follow-ups, four and six years later, they were examined to determine Black-
White differences in locus of control orientation. The sample as a whole, for both the
black and the white adolescents, shifted toward greater internal control over time.
Despite these shifts, Blacks consistently perceived less internal control than Whites
across all three waves, but the mean differences tended to be relatively small.
Lester et al., (1991) in their research among Turkish, American, and Philippino
undergraduate students, found that Philippino students were significantly more internal
than both American and Turkish students. However, there were no significant locus of
control differences between Turkish and American undergraduates. This study is the
only cross-cultural study which includes Turkish subjects, as far as it is known.
Obtaining no LOC differences between American and Turkish subjects, the study does
not support the general conclusion of some past reviews reporting that Asian subjects
were more externally oriented than American. In line with Hsieh et al., (1969)
“individuals raised in a culture that values self-reliance and individualism are likely to
be more internally oriented than those brought up in a different set of values”. It seems
C h a p t e r T h r e e
- 50 -
as though the finding of this research does not support the conclusion of Hsieh et al.
(1969). However, Lester et al (1991) do not report any explanation for their findings.
The Nowicki-Strickland Internal-External Locus of Control Scale was used with
ethnically diverse, gifted, middle school students in the USA. The sample involved 90,
sixth, seventh and eighth grade African-American students (31 boys, 59 girls), 35 third-
generation Mexican-American students (17 boys, 18 girls), and 45 third-generation
Chinese-American students (35 boys, 9 girls). Yong (1994) found no significant group
differences on locus of control.
3.5.3 Summary
When the previous reviews (Hui, 1982; Abdallah, 1989a) or the present review are
analysed, it can be seen that most of the cross-cultural studies included American
subjects. A total of sixteen studies (70%) reviewed in this section contained American
subjects, either compared to subjects from other countries or among them. As Hui
(1982) points out, a large cross-ethnic research study in America compared blacks with
whites. Apart from comparisons of blacks with whites, Anglo-Americans, Hispanics,
American-Indians, Chinese-Americans and Mexican-Americans were also commonly
compared in the U.S.A. Many researchers presupposed that minority groups in America
were more disadvantaged than the Anglos and directly compared the locus of control
scores for the various populations. Most of the researches involving Black-White
comparisons have tended to support the externality of Black (e.g. Coleman et al., 1966;
Shaw & Uhl, 1971; Louden, 1977; Tashakkori & Thompson, 1991). The result of
several meta-analyses conducted on these issue were in agreement that the probability
that US Blacks are more external than US Whites, is high.
Since Parsons, Schneider & Hansen’s (1970) study, which was the first cross-national
comparisons of two Western cultures, some research has been conducted either between
C h a p t e r T h r e e
- 51 -
two, or sometimes between more than two Western cultures, to see the locus of control
differences. In summary it can be said that cultural differences within Euro-Western
traditions are weak and may apply only to some subsamples, gender, or SES, and
national comparisons are made using an overall locus of control scale.
Despite its diversity in racial and ethnic groups, language, climate and economics, Asia
is sometimes given the all-inclusive label “Orient”, to distinguish it from the west. The
most common Asian groups subjected to cross-cultural studies are the Japanese,
Chinese and Indians. These subjects have been commonly compared with American
subjects and sometimes with European subjects. Japanese samples are consistently
found to be external, particularly when they are compared with Western samples.
However, some studies show that though Japanese subjects are external in overall locus
of control, they are significantly internal in “Leadership Success” (McGinnies,
Nordholm, Ward, & Bhanthumnavin, 1974). The data, however, is less consistent for
the Chinese and Indian subjects.
Reviewing cross-cultural studies before 1981, Hui (1982) revealed that the results of
cross-cultural studies on locus of control were not consistent and the data contradicted
prediction. He pointed out several methodological issues such as dimensionality of
measuring instruments. Furnham & Henry (1980) also considered the importance of
psychometric aspect of the scales used in cross-cultural studies. In their review of over
30 studies, Furnham & Henry (1980) found that most of the cross-cultural studies
neglected the multidimensionality nature of the locus of control construct. In fact to be
able to obtain valid and reliable results, while investigating cultural or national
differences, one of the most important aspects of cross-cultural methodology is to
ensure that both subjects are valid representatives of their culture. Simply taking two
samples from two different countries or cultures, or even within the some country, is not
sufficient for obtaining matched equivalent samples. In particular, students from
C h a p t e r T h r e e
- 52 -
developing countries may not represent the cultural group from which they come. As
Fawcett & Bornstein (1973) point out, they might often be quantitatively and
qualitatively differently educated from their peers, of higher socio-economic status, and
be more modern than their more traditional rural peers.
In summary, despite the popularity of the use of the locus of control concept in cross-
cultural studies, a number of problems still exist with the research construct. In spite of
difficulties about prediction, many cross-cultural studies report significant differences in
locus of control. However, there have been no specific studies of cross-cultural
comparisons between British and Turkish groups.
3.6 LOCUS of CONTROL AND SELF-ESTEEM
3.6.1 Introduction
Self-esteem and locus of control are thought to be educationally important variables.
They are both considered to be central educational objectives in themselves and to be
factors which effect educational outcomes. The Coleman Report (1966) on the equality
of educational opportunity supports this idea. He found that measures of self-esteem
and locus of control were among the best predictors of academic achievement. There
have been a great number of studies both on self-esteem (Wylie, 1974 and 1979,
Coopersmith, 1967; Rosenberg, 1965 and 1979; Burns, 1981 and 1982; Lawrence, 1981
and 1988) and locus of control (Rotter, 1966; Lefcourt, 1976; Phares, 1976) considered
separately. However, some studies focused on the relationship between these two
academically important variables.
Theoretically, someone’s attitudes about himself or herself should bear some relation to
locus of control. A person who feels insecure, lacking in self worth and low in feelings
of personal adequacy is expected to be oriented towards external control rather than
internal control. The high-self-esteem individual, with his positive sense of adequacy
C h a p t e r T h r e e
- 53 -
should feel more in control of what he does and what happens to him rather than under
control from outside forces. Externals may not only perceive a lack of control over
themselves but may actively seek external control, because of their feelings of personal
inadequacy. The results of many studies examining beliefs in personal control and self-
esteem, suggest that the internal control person has higher self-esteem, probably
because he or she is more able to accept personal responsibility for his or her success
(Lefcourt, 1976). Bellak (1975) found that externals produced lower self-evaluation.
Externals also found difficulty with interpersonal relations (McDonald, 1971), with low
self evaluation (Hersh & Schiebe, 1969), and with poor personal adjustment (Warehime
& Foulds, 1971). They are also found to have large discrepancies between self, ideal
and perceived internal control as their ideal (Lombardo, Saverio & Solheim, 1975).
However, the main objective of this review is to show the findings of some studies on
the relationship between locus of control and self-esteem. A brief summary will follow
the empirical findings in this section.
3.6.2 Empirical Findings
Louden (1977), in his comparative research of minority group adolescents in English
multi-racial secondary schools, found a significant relationship between locus of control
and self-esteem among English adolescents (p<0.01). However, no significant
relationships were found among either Asian or West Indian adolescents.
Gordon (1977), by using the Nowicki-Strickland LOC Scale and the Piers-Harris
Children’s Self-Concept Test with 60 male and 53 female ten-year-old, fourth grade
students, found a significant relationship between internal locus of control and self-
esteem (r= -0.26, p< 0.01). However, when the analysis was carried out separately for
sex, it was revealed that internal locus of control was associated with high self-esteem
for males (r= -.28, p<0.05)) but not for females (r= -0.21, n.s.) though the correlation
C h a p t e r T h r e e
- 54 -
was in the expected direction for females. Moreover, the author pointed out that self-
esteem and locus of control were independently associated with academic achievement.
Furthermore, he concluded that “it may be that the socialisation of LOC and self-esteem
follows similar courses ...” (p.384). When the previous LOC studies (early 1970s) were
analysed, it could be seen that some of the research findings suggested that sex was a
significant variable. LOC was found to be related to one measure of achievement for
boys (GPA) and to a different measure for girls (standard achievement test scores). As
internality was associated with high self-esteem only for boys, it is possible that the
higher the grades the internal boys receive, adds to their self-esteem. However, internal
girls probably receive little recognition for having higher achievement test scores, hence
they do not have higher self-esteem. The findings of this research can be compared with
the previous findings which suggest that the relationship between achievement and LOC
for girls has not been found to be as consistent as it is for boys.
Gorges et al., (1980) using Rotter’s I-E Locus of Control Scale and Coopersmith Self-
Esteem Inventory with 169 college students (85 females and 84 males), obtained a
significant negative correlation between external locus of control and total self-esteem
(r=-0.25, p<0.05). Moreover, though the correlation between external locus of control
and academic self-esteem was in the expected direction, it did not reach a significant
level (r=-0.17, n.s..). However, the relationship between locus of control and self-
esteem was not the main concern of this study, therefore the authors did not report the
relationship separately for each sex.
Using Rotter’s Internal-External Control Scale, Gurin et al.’s Personal Control Scale,
and Bachman’s self-esteem scale of his Family Relations Scale, with 56 black male, 60
white male, 79 black female and 45 white female high school students, in the USA,
Hendrix (1980) found a significant positive correlation of 0.35 (P< 0.001) between
external locus of control and self-esteem for black students. No significant relationship
C h a p t e r T h r e e
- 55 -
was found for white students. A positive correlation between personal control and self-
esteem was also found for both black and white youth. However, a stronger correlation
between personal control and self-esteem was found for black (r=0.25, p<0.004) as
compared to white (r=0.18, p<0.042) students. The results of this study indicate that an
external orientation on the more general scale (Rotter’s I-E) for blacks, represents the
recognition of the existence of external control factors which influence the success or
failure of black Americans.
Dönmez (1985), using a 25-item of the Coopersmith SEI (short form) and 12 selected
items of Rotter’s I-E scale, found a significant correlation (r=0.24, p<0.05) between
internal locus of control and self-esteem among 402, third and fourth year Turkish
undergraduate students.
Using Rotter’s I-E Locus of Control Scale and the Tennessee Self-Concept Scale
(which has six self-concept subscales of physical, moral-ethical, personal, family, self-
criticism and behaviour) with 46 male and 107 female undergraduates in the College of
Education, in the USA, Crump, Hickson, & Laman (1985) found that the internal group
exhibited “behaviour” significantly more congruent with a positive self-concept than
did the external group. The internal group also expressed significantly more positive
self-concepts relative to identification with their families (family self) as well as self-
assessed traits which were more positively identified with “moral self” and “personal
self”. Though total self-concept and four subscales of self-concept were significantly
associated with the internal group, however, two subscales (self-criticism and personal)
were not significantly different between internal and external groups.
Using Levenson’s Internal, Powerful Others, and Chance Locus of Control Scale and
the Tennessee Self-Concept Scale, with 68 female and 61 male university students,
Gadzella, Williamson & Ginther (1985) found significant correlations between the
Total Self-Concept scores of the 129 students and their scores in locus of control
C h a p t e r T h r e e
- 56 -
subscales: “Internal” (r=0.30, p<0.05), “Powerful Others” (r=-.27, p<0.05), and
“Chance” (r=-0.29, p<0.05). Moreover, the correlations between the locus of control
subscales (Internal, Powerful Others, Chance) and the self-concept subscales (Identity,
Self-Satisfaction, Behaviour, Physical Self, Moral-Ethical Self, Personal Self, Family
Self, and Social Self) were considered, and 20 out of 24 correlations were found to be
significant at p<0.05 level. When the data was further analysed for men and women,
significant correlations were found between Total Self-Concept and all the subscales of
locus of control: “Internal” (r=0.27, p<0.05), “Powerful Others” (r=-0.38, p<0.05), and
“Chance” (r=-0.42, p<0.05) for men. When women were considered separately, a
significant correlation was obtained between Total Self-Concept and “internal” (r=0.33,
p<0.05), but no significant correlation was found between Total Self-Concept and either
“Powerful Others” or “Chance” for females, in this study.
Yesilyaprak (1988) found a correlation coefficient of 0.58 between locus of control
(Nowicki-Strickland Locus of Control Scale) and self-esteem (a subscale of Shortstrom
Personal Orientation Inventory) among 109 secondary school students, in Turkey.
Abdallah (1989b), using the Sphere of Control Questionnaire and the Taisir Self-
Esteem Questionnaire with 300 males, found significant relationships between locus of
control and self-esteem among college men in Saudi Arabia. In this study the self-
esteem scale provided “total self-esteem” scores, as well as “self-worth” scores, and
“negative self-image” scores. The locus of control scale, however, provided “personal
efficacy” scores, “interpersonal control” scores and “socio-political control” scores. It
was revealed that the Total Self-esteem, as well as the Self-worth, and the Negative
Self-image subscales all positively and significantly correlated with the Interpersonal
Control, and the Socio-political Control subscales of locus of control. However, neither
Total Self-esteem nor its subscales was significantly correlated with Interpersonal
Control.
C h a p t e r T h r e e
- 57 -
Using Rotter’s I-E scale and Chadha’s self-concept scale with 307 students (156 males
and 151 females) Chadha (1989) found a significant correlation between locus of
control and self-esteem among 12th grade Indian students (r= 0.18, p<0.01). In this
study both locus of control and self-esteem had a small but significant relation with
academic achievement, independently of the other antecedents. This result does lend
some support to Gordon’s (1977) hypothesis that self-esteem and locus of control are
independently related to academic achievement.
Darko-Yeboah (1990) found that the Crandall et al.’s academic locus of control scale’s
total score was not correlated with either Coopersmith SEI Total score or any of its
subscales in the 7th grade. However, it was correlated significantly with the Home SE
subscale (r= 0.36, p< 0.05), with the Academic SE subscale (r= 0.36, p< 0.05) and with
the General SE subscale (r= 0.33, p< 0.05) in the 4th grade.
Using Clifford’s (1976) Academic Achievement Accountability Scale (CAAAS),
Brookover’s Self-Concept of Ability Scale (BSCAAS) (Brookover et al., 1967), and
Barker-Lunn’s (1970) Academic Self-Image Scale (BLASIS) with 120 (60 male and 60
female) middle school students in Bophuthatswana, Maqsud (1993) obtained a
significant correlation between academic locus of control and academic self-image (r=
0.28, p<0.01). He also obtained significant correlation between academic locus of
control and academic self-concept (r=0.33, p<0.001).
The Nowicki-Strickland Internal-External Locus of Control and a Self-Concept Scale
for Gifted Children (Feldhusen & Kolloff, 1981) were used with ethnically diverse,
gifted, middle school students in the USA. The sample involved 90, sixth, seventh and
eighth grade African-American students (31 boys, 59 girls), 35 third-generation
Mexican-American students (17 boys, 18 girls), and 45 third-generation Chinese-
American students (35 boys, 9 girls). Yong (1994) found that self-concept was
significantly correlated with internal locus of control (r=0.32, p<0.001).
C h a p t e r T h r e e
- 58 -
3.6.3 Summary
A total of 13 studies undertaken between 1977 and 1994 were reviewed in order to find
out the relationship between locus of control and self-esteem. When the findings of
these studies were analysed, it could be seen that all of the 13 studies reported at least
one significant and positive relationship between internal locus of control and self-
esteem. However, one investigator obtained a negative correlation between internality
and self-esteem (Hendrix, 1980). He reported a positive correlation of 0.35 (P< 0.001)
between external locus of control and self-esteem for Black secondary school students.
Some studies in this review consisted of more than one sample (Louden, 1977; Hendrix,
1980; Darko-Yeboah , 1990), others used more than one instrument or subscale (Borges
et al., 1980; Hendrix, 1980; Crump et al., 1985; Gadzella et al., 1985; Abdallah, 1989b;
Darko-Yeboah , 1990; and Maqsud, 1993) whilst two studies reported data for boys as
well as for girls, separately, (Gordon, 1977; and Gadzella, et al., 1985). Therefore a total
of 77 correlation coefficients were obtained. In these 77 coefficients, 54 of them found
significant relationships between internal locus of control and self-esteem, while one
study, Hendrix (1980), reported a significant and positive correlation between
externality and self-esteem. However, 23 correlations out of 77 were nonsignificant.
Two Turkish studies (Dönmez, 1985; and Yesilyaprak, 1988) were identified and both
of them obtained a significant relationship between high self-esteem and internal locus
of control.
To investigate the relationships between self-esteem and locus of control, it was
expected that self-esteem would be positively correlated with locus of control. Most of
the studies in this review concluded that high self-esteem was associated with internal
locus of control. The findings of this review support previous studies which indicated
that a relationship exists between both constructs.
C h a p t e r T h r e e
- 59 -
3.7 IMPLICATIONS
Locus of control and self-esteem tend to be important predictors of academic
achievement (Coleman, 1966; Uguroglu et al., 1979; Lefcourt, 1983). Enhancement of
self-esteem and internal locus of control should be the key educational goals for
schools. These two variables might be related to the motivation which is necessary for
the academic performance of students and the realisation of their intellectual potential.
These constructs are probably the major psychological variables that motivate
individuals to work, investigate, achieve, solve problems and compete (Harty, Adkins,
& Hungate, 1984; Feldhusen & Hoover, 1986). As these constructs are so important in
education, self-esteem and locus of control of students can be enhanced through
numerous approaches, such as setting realistic goals and objectives, using instructional
material and resources that encourage parental participation in their children’s learning,
providing consistent and positive feedback on students’ performance, stressing
independent learning (Mark, 1987), and helping students to become aware of their own
attributions (Canfield, 1990). In terms of intervention, past research indicates that
remediation in the areas of locus of control and self-esteem can improve students’
efforts and persistence, which should be reflected in attaining higher grades. Omizo &
Omizo (1988) revealed a significant difference (p< 0.01) between experimental and
control groups on both total locus of control and self-esteem post-test measures of
Honolulu adolescent students, after 10 weekly counselling sessions of 45 minutes each.
Young-Sheng (1990) found that mean locus of control scores of first and fourth year
middle school students in China developed significantly (p<0.001) after a four-week
instructional activity had been applied , while the mean score of the control group
showed no clear development. Moreover, different forms of instruction had different
effects on the development of students’ locus of control. Visor (1992) found that
students who participated in a five-session Supplemental Instruction Self-Esteem course
were more internally oriented for locus of control than were the control group.
C h a p t e r T h r e e
- 60 -
The enhancement of both self-esteem and locus of control is important because the
constructs are related to many other variables that contribute to academic, social, and
emotional successes. Individuals with higher levels of self-esteem seem to be at an
advantage in most situations. The past studies show that being aware of one’s feelings
and being able to express them, giving and receiving positive feedback and knowing
that others were experiencing similar feelings and behaviours, had a positive impact on
the self-evaluations of participants who were receiving intervention programs. It seems
that group counselling sessions promise a way to enhance locus of control and self-
esteem among students (Omizo & Omizo, 1988; Young-Sheng, 1990; Visor, 1992).
Although school teachers can help their pupils to improve their self-esteem and internal
control, in some circumstances, intervention programs could be conducted by school
counsellors (Kagıtçıbası, 1990).
C h a p t e r T h r e e
- 61 -
3.8 GENERAL SUMMARY of the CHAPTER
In this chapter, after a brief theoretical explanation, four main sections took place.
These were a) the relation of locus of control with academic achievement, b) sex
differences in locus of control, c) locus of control and cultural differences, and d) the
relationship between locus of control and self-esteem. These sections were given close
attention because of their relation to some of the main objectives of this study. Each of
these three sections included some brief theoretical explanation, as well as related
empirical findings of past research, which were summarised.
The following are summaries of the relation between locus of control and the variables
(academic achievement, sex, self-esteem, and cultural differences); the summaries are
based on the studies reviewed in this chapter.
The expected positive relationship between internal locus of control and academic
achievement is generally supported by the findings of the studies reviewed in this
chapter. The general finding of positive relationship between internality and academic
achievement in this review, is congruent with the previous reviews of Phares (1976),
Lefcourt (1976), Bar-Tal & Bar-Zohar (1977), Uguroglu & Walberg (1979), and
Findley & Cooper (1983). However, when the sex of the subjects are taken into account,
the relationship between locus of control and academic achievement of boys looks
stronger than of girls and, compared to boys, girls show inconsistent results in this
review. Contrary to the theoretical expectation, the analyses have produced negative
correlations between internality and females’ achievement. However, this supports the
findings of some past studies (Phares, 1976; Lefcourt, 1976; Findley & Cooper, 1983;
Dyal, 1984; and Majdub, 1990). Moreover, researchers did not agree in their theoretical
expectation concerning sex differences in defensive externality. While Rotter (1966)
and Phares (1976) expected males to have more defensive externality than females,
C h a p t e r T h r e e
- 62 -
Duke & Nowicki (1974) expected that females would have more defensive externality
than males.
Although a considerable number of studies were undertaken in the Western world to
investigate locus of control-achievement relationships two studies (Korkut, 1986;
Yesilyaprak, 1988) were identified in Turkey and only one of them focused on
secondary school students. Furthermore, the Turkish literature does not provide any data
in order to examine sex differences in locus of control / achievement relationships.
Neither of the two Turkish studies provided data for males and females separately. This
clearly indicates that the number of Turkish studies is very limited. Therefore one of the
main objectives of this study is to investigate locus of control-achievement relationships
for Turkish subjects.
The studies reviewed in this chapter also indicate that gender differences in locus of
control are not generally significant. Most of the studies reveal no sex differences.
These findings tend not to support the conclusion of the early research (such as
McGinnies et al., 1974 and Parsons & Schneider, 1974). One important finding of this
review is that sex differences in locus of control have been changing significantly in
favour of females. Contrary to the early findings, recent studies generally report no sex
differences in locus of control. These studies indicate a positive trend in locus of control
for girls in recent years.
When sex differences in locus of control were examined in Turkish studies, the
literature revealed that there had been only three studies (Korkut, 1986; Yesilyaprak,
1988; Giderer, 1990). While the first two studies obtained no sex differences in locus of
control, the third study (Giderer, 1990) found mixed results. The study of Giderer
(1990) revealed that while there were no differences between locus of control scores of
boys and girls in a secondary school, boys had significantly more internal scores than
girls in another secondary school. Although Turkish data indicated no sex differences in
C h a p t e r T h r e e
- 63 -
locus of control, the number of studies was limited and therefore it was difficult to
make a firm conclusion.
The studies reviewed in this chapter, with regard to investigating cross-cultural
differences on locus of control, indicate that most of the cross-cultural studies include
American subjects. Seventy percent of the reviewed studies contained American
subjects, compared either to subjects from other countries or among themselves. Most
of the researches involving Black-White comparisons have tended to support the
externality of Black subjects. The data also indicated that cultural differences within the
Euro-Western tradition were generally weak and may apply only in some subsamples,
gender, or SES, when national comparisons were made using an overall locus of control
scale. The most common Asian group subjected to cross-cultural studies are the
Japanese, Chinese and Indians. These subjects have been commonly compared with
American subjects and sometimes with European subjects. Japanese samples were
consistently found to be external, particularly when compared with Western samples.
The data, however, is less consistent for the Chinese and Indian subjects. In general, the
results of cross-cultural studies are not always consistent and the data contradicts
prediction. Despite the popularity of the use of the locus of control concept in cross-
cultural studies, a number of problems still exist with the research construct. To be able
to obtain valid and reliable results while investigating cultural or national differences,
one of the most important aspects of cross-cultural methodology is to ensure that both
subjects are valid representatives of their culture. The dimensionality of measuring
instruments is also considered in cross-cultural studies. In spite of the difficulties
encountered over prediction, many cross-cultural studies report significant differences
in locus of control. However, there have been no specific studies investigating cross-
cultural comparisons between British and Turkish groups.
C h a p t e r T h r e e
- 64 -
Finally, to investigate the relationships between self-esteem and locus of control, it was
expected that self-esteem would be positively correlated with locus of control. Most of
the studies in this review concluded that high self-esteem was associated with internal
locus of control. Among all studies, two Turkish studies (Dönmez, 1985; and
Yesilyaprak, 1988) were also identified and both of them obtained a significant
relationship between high self-esteem and internal locus of control. The findings of this
review, including the two Turkish studies, generally support previous studies which
indicated that a relationship exists between both constructs.
The next chapter will be concerned with the design of the present study; the questions
research is expected to answer; the research hypothesis; samples and data collection;
pilot studies; the instruments used in data collection and the reasons for selecting them;
statistical methods etc.
CHAPTER 4
DESIGN of the STUDY
C h a p t e r F o u r
- 168 -
4.1 INTRODUCTION
In this chapter first of all the questions of the research will be presented followed by the
research hypotheses. The research hypotheses will be based on either a brief theoretical
explanation or findings of past research which are reported in the literature review and
research sections of the thesis. These explanations will be given after each of the
hypotheses. In the next section, the variables of the study will be listed and later some
information will be given on the instruments used for the present research. This section
will consist of the selection of the instruments, the reasons for their selection and their
technical support. Before giving information about a pilot study carried out both in
England and Turkey, the translation and adaptation process of the instruments into
Turkish will be explained. Preliminary reliability studies of the instruments for the
Turkish pilot group will also be the subject of this chapter. The English and Turkish
samples will also be introduced. This will be followed by the section on statistical
analyses. Some information will be given about the statistical techniques which were
used in order to analyse data of the present study.
4.2 The QUESTIONS ASKED BY THE STUDY
The aim of this study is to seek answers to the following empirical questions:
1. Are the instruments which were used in this body of research reliable for and
applicable to English and Turkish samples?
2. Are there differences between Turkish and English students in self-esteem?
3. Are there differences between Turkish and English students in global and
academic locus of control?
4. Are there sex differences with regard to self-esteem and locus of control
variables?
C h a p t e r F o u r
- 169 -
5. Is there a relationship between self-esteem and locus of control?
6. Is there a relationship between self-esteem and academic achievement?
7. Is academic achievement more strongly related to academic self-esteem than
the other self-esteem subscales.
8. Is there a relationship between locus of control variables and academic
achievement?
9. Is academic achievement more strongly related to academic locus of control
than the global locus of control?
10. Which psychological variables are the best independent predictors of
academic achievement?
4.3 The RESEARCH HYPOTHESIS
1. It was hypothesised that there will be differences between the Turkish and the
English groups in self-esteem. The self-esteem of the English students is
expected to be higher than the Turkish students.
Cross-cultural research in self-esteem does not reveal any study comparing
the self-esteem of English and Turkish subjects. The present researcher has
not identified any study comparing the self-esteem of Turkish subjects with
subjects from another country, with the exception the studies of Verkuyten
(1988, 1989, 1990). In his studies, Verkuyten compared the self-esteem of
Dutch students with minority Turkish students, and obtained mixed results.
Since the Turkish subjects in these studies were a minority, the findings of
Verkuyten could not help us in terms of having a hypothesis for the present
study.
In Turkey, the courses that year-11 school students take, are highly
competitive in terms of being significant criteria for the University Entrance
Examination (UEE). School performance, particularly the result of the
university entrance exam is highly valued by society and parents, and high
achievers are highly respected among their peers and neighbours. Year-11
students who are in the last year of secondary education, spend a great deal of
time preparing themselves for the very competitive UEE exam. A percentage
C h a p t e r F o u r
- 170 -
of their marks at secondary school is added to their UEE score. This means
that students, who have obtained high average marks at secondary school,
have a better chance of entering university. In addition, the top secondary
school students are awarded special recognition by the universities.
Therefore, the performance of students in school hypothetically influences
their levels of self-esteem and anxiety.
To achieve success in passing UEE is very desirable for both Turkish
students and their families, because it has a highly respected status in society.
Therefore, nearly all secondary school leavers from all sorts of secondary
schools take part in this centralised exam, with the hope of entering
university. A university education is considered important for all families,
regardless of social class and also for economic and prestigious reasons.
Consequently, a very high proportion of year-11 students take private courses
to prepare themselves for this nation-wide exam.
There is, therefore, a great deal of pressure on students, which comes not
only from the parents, but also from the dramatically increasing number of
candidates. For instance, in the 1965-1966 academic year, the proportion of
students accepted by universities was 60%, but this percentage had fallen by
13% by the end of the 1977-1978 academic year (Kaya, 1984, p.225), and by
22% by the end of 1990-1991. The number of candidates is sharply
increasing every year, not only because of new school leavers but also
because students who had failed to gain a place at university in the past,
repeat the exam. For example, in 1990, the number of candidates was about
720,000 but only 287,978 of them were new school leavers (SSP
Examination Results, 1990, p.2). This means that about 420,000 candidates
who took the exam were repeating. If we look at the results of the exam in
that year, we can see that only 63,691 out of 287,978 new graduates managed
to enter Turkish universities. In other words, only 22% of them passed while
78% of those who wanted higher education were unable to obtain a place.
We can see from these figures that the proportion of new school leavers who
passed the exam was only 11% of all the candidates. The number of
candidates in 1993 who attended the exam had increased to over 1,200,000.
Although the government, for political reasons, has doubled the number of
universities in the last ten years, over 80% of the candidates still have no
chance of getting a place.
C h a p t e r F o u r
- 171 -
All of these reasons place students under a great deal of pressure.
Consequently, the year 11 students feel very vulnerable because of their
families and society’s expectations and pressures. Past studies show that there
is a relationship between anxiety and low self-esteem (Coopersmith, 1967;
Many & Many, 1975; Lundgreen & Schwab, 1977; Lundgreen, 1978).
Although the English subjects were GCSE students and were probably also
under pressure, it was considered that the pressure placed on Turkish subjects
was greater. Therefore, it was expected that Year-11 Turkish students’ self-
esteem would be lower that their English counterparts.
2. Similarly, it was hypothesised that there would be differences between the
Turkish and the English students on global and academic locus of control.
The English students were expected to be more internal in their perceived
control than the Turkish students.
The past cross-cultural studies on the locus of control revealed that the
results were not consistent and the data contradicted predictions of East and
West differences. Moreover, there have been no specific studies of cross-
cultural comparisons between British and Turkish groups. However, when
Turkish and English societies were compared, some significant differences
between the two cultures could be identified. It is known that the British way
of life is individual-centred and places a great deal of emphasis on self-
reliance. If individuals are successful, the success is generally attributed to
their own efforts or abilities. Turkish culture, in contrast, is situation-centred.
It emphasises the interdependence of individuals within larger groups, such
as the family. If individuals are successful, the success is attributed to, and
shared with, those who are related to them. Accordingly, it can be predicted
that British students will be more internal than Turkish students.
3. It was hypothesised that there would be no major sex differences in self-
esteem and locus of control for both the English and Turkish subjects.
Although it was expected that there would be no major differences between
the two sexes, it was expected that the self-esteem of boys would be slightly
higher than that of girls, in both countries. Similarly, it was expected that the
locus of control of boys would be slightly more internal than the girls, in both
countries.
C h a p t e r F o u r
- 172 -
The majority of the reviewed studies fail to support a relationship between
sex and self-esteem both in Western countries and in Turkey. Previous
Turkish studies revealed that eleven out of twelve studies found no
significant differences between the self-esteem of Turkish male and female
students. Therefore, it was hypothesised that there would not be major sex
differences in self-esteem in the Turkish and English groups.
Similarly, previous locus of control studies revealed no sex differences. The
results of nearly 70% of all comparisons reviewed, revealed no sex
differences. Previous studies also show that the number of studies which
failed to obtain sex differences, have been increasing significantly since the
early 1980s. The findings of these studies also indicate a positive trend in
locus of control for girls. When sex differences in locus of control were
examined in the case of the Turkish studies, the literature revealed that there
had been only three studies. These three studies compared four separate
samples and only one of them found that males were significantly more
internal than girls, while the other three studies found no sex differences
between the locus of control of boys and girls. Therefore, no major
differences are expected between the locus of control of boys and girls in
either the English or the Turkish groups.
4. The fourth hypothesis is based on the relationship between self-esteem and
locus of control variables.
Theoretically, someone’s attitudes about himself or herself should bear some
relation to locus of control. A person who feels insecure, lacking in self-
worth and low in feelings of personal adequacy is expected to be oriented
towards external control rather than internal control. Furthermore, most of the
past research studies indicated that high self-esteem was associated with
internal locus of control. A similar result was also expected from the outcome
of the present research. To be more specific, it was expected that global self-
esteem would be more strongly associated with the global locus of control,
whereas academic self-esteem would be more strongly associated with the
academic locus of control.
5. It is expected that there will be a significant, positive relationship between
self-esteem and academic achievement for both the English and Turkish
samples.
C h a p t e r F o u r
- 173 -
Previous research suggests that there is a relationship between self-esteem
and achievement, although a large proportion have reported that correlations
have been uniformly low or moderate between the two variables. The review
studies of Uguroglu & Walberg (1979) and Hansford & Hattie (1982), and
most of the studies whose findings are outlined in Table 1, in Appendix C
reveals in the aggregate, self-esteem is significantly associated with academic
achievement. Apart from studies in the Western world, a limited number of
Turkish studies investigating self-esteem-achievement relationships also
found a positive relationship between the two constructs, therefore similar
results were expected from the present study.
6. It was also expected that achievement would be more strongly associated
with academic self-esteem than with the other self-esteem subscales.
7. The sixth hypothesis based on a relationship between locus of control and
academic achievement.
The expected positive relationship between internal locus of control and
academic achievement is generally supported by the findings of past studies,
although the findings were not always consistent. Furthermore, there were
only two identified Turkish studies and only one of them focused on
secondary school students. However, it was hypothesised that there would be
a moderate relationship between locus of control and achievement.
8. It was also expected that achievement would be more strongly associated
with academic locus of control than global locus of control.
9. Finally it was hypothesised that academic self-esteem would be the best
independent predictor of academic achievement for both the English and
Turkish groups.
4.4 The VARIABLES OF THE STUDY
The following variables were included in this study:
1) Self-esteem:
a) Total Self-Esteem
b) General Self-Esteem
c) Social Self-Esteem
C h a p t e r F o u r
- 174 -
d) Home-Parents Self-Esteem
e) School-Academic Self-Esteem
2) Global locus of control
3) Academic locus of control
a) Total academic locus of control
b) Academic locus of control in success situations
c) Academic locus of control in failure situations
4) Academic achievement
a) English / Turkish language achievement
b) Maths achievement
c) Science achievement
d) GPA (= English / Turkish + Maths. + Science / 3)
4.5 SELECTION & DESCRIPTION of the INSTRUMENTS
The instruments employed for the present study were the Coopersmith Self-Esteem
Inventory School Form (Coopersmith, 1991) and its Short Form (Coopersmith, 1991),
the Nowicki-Strickland Internal-External Control Scale (Nowicki-Strickland, 1973),
and the Crandall et al.’s Intellectual-Achievement Responsibility Scale (Crandall et al.,
1965). The three instruments as well as measurement of academic achievement will
each be addressed separately.
4.5.1 Self-Esteem Measurement
In order to measure the self-esteem of subjects, the Coopersmith Self-Esteem Inventory
(SEI) was chosen. The English and Turkish forms of the Coopersmith SEI, and scoring
key of the instrument can be seen in Appendix A (2, 3, 4 and 9).
4.5.2 Reasons for Selecting the Coopersmith SEI
There are several measures of self-esteem, but the Coopersmith SEI was chosen
because it was one of the most widely-used scales and also there were numerous studies
supporting its reliability and validity. It was designed not only to measure global self-
C h a p t e r F o u r
- 175 -
esteem but also the areas of general, home, social, and school experience. Therefore, it
provides a total score as well as scores on four subscales. Since its development, the
inventory has been administered to tens of thousands of children and adults
participating in research studies or in educational or clinical programs to enhance self-
esteem. All socio-economic ranges and many ethnic and cultural groups are represented
(Coopersmith, 1991). The inventory also had several significant correlations with
academic achievement (Coopersmith, 1959; Simon & Simon, 1975; Cheng & Page,
1989). The instrument had been used in Britain by several researchers (Jones 1977;
Bagley, Mallick, & Verma, 1979; Moore, 1980; Lok, 1983; Hart, 1985) as well as in
Turkey (Onur, 1981; Özogul, 1988; Güçray, 1989). The technical support of the
instrument will be given under a separate title. After examining the British studies, the
present researcher found that one of the commonly used self-esteem inventories was the
LAWSEQ Questionnaire. Although this scale had a secondary school version and was
useful to make a quick assessment, the instrument was developed in order to measure
only global self-esteem, therefore this questionnaire was not able to measure the other
areas of self-esteem (such as academic self-esteem). During the pilot study, in addition
to the Coopersmith Self-Esteem Inventory (SEI), The Culture-Free SEI Form-B
(formerly Canadian Self-Esteem Inventory) (Battle, 1981) was also used. The
instrument contains 30 items and the following five subscales: general self-esteem,
social / peer-related self-esteem, academic / school-related self-esteem, parents / home-
related self-esteem, and lie scale (items which indicate defensiveness). The instrument
without the lie scale contains 25 items, intended to measure an individual's perception
in four areas: general self, social, school, and parents. The individual marks each item
as either "yes" or "no". After examining both instruments in detail, it was decided to
choose the Coopersmith SEI rather than Battle’s SEI. One of the reasons was because
the Coopersmith SEI had been more commonly used and more studies had been
conducted on reliability and validity studies than with Battle’s SEI. Secondly, though
C h a p t e r F o u r
- 176 -
Battle’s SEI consisted of similar subscales and similar questions (most of the items
were derived from Coopersmith SEI), the psychometric studies of the instrument were
done particularly on students who had special needs. Thirdly, Battle’s SEI had not been
used in Turkey or in England, as far as the present researcher has been able to discover.
4.5.3 Description of the Coopersmith SEI
The Coopersmith SEI is a widely- used scale consisting of 58 items which requires
approximately 10 minutes to complete (Coopersmith, 1991). The self-esteem items
yield a total score and five separate subscale scores, (General Self, Social Self-Peers,
Home-Parents, School-Academic, and Lie). When the items from all four subscales are
tallied (an 8-item Lie Scale excluded), the overall score will yield a global self-esteem
evaluation. The format required the student to read each statement (which are self-
evaluative statements) and respond "like me" or "unlike me". The answers which were
indicative of high self-esteem were given two points. For example, if a student
responded to the statement "I find it very hard to talk in front of the class" with "Unlike
Me", he or she received two points and no point if he or she responded "Like Me".
Negative items were scored as correct (for example, “I get upset easily at home”), if
they were answered “Unlike Me”. The Total Self-score, which is the sum of the number
of correctly answered items (excluding those items used for the detection of lies), was
multiplied by two, resulting in a maximum possible total self score of 100. A brief
explanation of the subscales of the instrument and some example items follow:
4.5.3.1 General Self
This is an individual’s overall feeling of self-worth and is based on the child’s
evaluation of all parts of himself / herself. Some examples of general or global self-
esteem items of Coopersmith SEI are:
I can make up my mind without too much trouble.
C h a p t e r F o u r
- 177 -
I often wish I were someone else.
I really don't like being a boy / girl.
4.5.3.2 Social -Peers Self
The social area surrounds the child’s feelings about himself / herself in relation to his /
her friends. Do other children like him / her, find his / her ideas valuable or do they
accept him / her as a friend in their social activities? Does he / she feel happy and
comfortable in his / her relationships with friends? Some examples of Social-Peers self-
esteem items of Coopersmith SEI are:
I'm popular with kids my own age.
Kids usually follow my ideas.
I'm a lot of fun to be with.
4.5.3.3 Home-Parents Self
The Home-Parents self-esteem is related to his / her feelings about himself / herself as a
member of his / her family. If he / she feels that he / she is being loved and respected by
his / her parents and the other members of the family, his / her self-esteem in this area is
expected to be positive. If he / she feels that he / she is not really being loved, respected
and valued in the family, he / she will probably have low self-esteem in the area of
family. Some examples of Home-Parents self-esteem items of Coopersmith SEI are:
I get upset easily at home.
My parents usually consider my feelings.
There are many times when I'd like to leave home.
4.5.3.4 School-Academic Self
C h a p t e r F o u r
- 178 -
The academic area is related to the child’s evaluation of himself / herself as a student. If
he attains the standards for academic achievement which are mainly formed by his
family, peers and teachers, his / her academic self-esteem will expected to be positive.
Some examples of School-Academic self-esteem items of Coopersmith SEI are:
I find it very hard to talk in front of the class.
I often get discouraged at school.
I'm not doing as well in school as I'd like to.
4.5.4 Technical Support of the Coopersmith SEI
There are numerous studies supporting its test-re-test reliability (r = 0.80 and above)
and validity (Coopersmith, 1991). For the total score, Coopersmith (1959) quotes test-
retest reliability of 0.88 (over 5 weeks) and 0.70 (over 3 years). Kuder-Richardson
reliability for the total scale score is 0.91 for girls and 0.80 for boys (Coopersmith,
1967). In an internal consistency study, including students of all socio-economic ranges,
Kimball (1972) obtained Kuder-Richardson reliability estimates (KR-20) of 0.92 and
0.89 for grades 4 and 7 respectively, for the total self-esteem score. A study of the SEI
construct validity was reported by Kimball (1972). The SEI was administered to 7,600
public school children in two northern IIIinois school districts. The sample was
purported to be representative of the general population of the United States. Norms
were compiled by grade and sex for children in grades 4 to 10 inclusive. Kimball
reported that, "Percentile equivalents showed a consistency of score values at a given
percentile regardless of the population" (p. 1131). Johnson, Redfield, Miller & Simpson
(1983) conducted a more recent construct validation study of the SEI. They examined
scores on the SEI using a modified version of the Sabers and Whitney (1976) model for
construct validation. The SEI, Piers-Harris Children's Self Concept Scale (CSCS)
(Piers, 1969; Piers & Harris, 1964), and the Children's Social Desirability Scale (CSDS)
(Crandall, Crandall & Katkowsky, 1965), were administered to 55 males and 50
C h a p t e r F o u r
- 179 -
females enrolled in the 5th grade. Each student also received a teacher rating of self-
concept using the Coopersmith Behavioural Academic Assessment Scale -BASE-
(Coopersmith & Gilberts, 1982). Regression analysis indicated that the SEI had
convergent validity with regard to the CSCS and BASE, had discriminant validity with
regard to the CSDS, was sensitive to differences in achievement level, and was
internally consistent (coefficient alpha = 0.86). So it can be seen from this evidence that
Coopersmith SEI has very high reliability and validity. Internal consistency reliability
for the four subscales of the SEI ranged from 0.28 to 0.82 for boys and girls at third,
fifth, seventh, ninth and eleventh grades (Owens, 1991).
In this study, in order to find out global self-esteem, The Coopersmith SEI Short Form
is used as well as School Form. The Coopersmith SEI School Short Form is used with
the same age group as the School Form. The Short Form consisted of the first 25 items
of the School Form, and does not include the Lie Scale items and does not elicit
subscale scores. There have not been many studies on the reliability of the instruments.
However, in the manual of SEI, Coopersmith reports a total score correlation of 0.86
(n=121) between the School Short Form and the School Form (Coopersmith, 1991).
4.5.5 Global Locus of Control Measurement
Locus of control was assessed by the Nowicki-Strickland Internal-External Control
Scale (Nowicki-Strickland, 1973). The English and Turkish form of the instrument, and
its scoring key can be seen in Appendix A (5, 6, and 10).
C h a p t e r F o u r
- 180 -
4.5.6 Reasons for Selecting the Nowicki-Strickland IE Control
Scale
The literature review revealed that the Nowicki-Strickland Internal-External Control
scale (1973) was one of the three most commonly used scales in terms of measuring
global locus of control (Findley and Cooper, 1983). The other two were the Bialer
(1961) Locus of Control Scale, and the Rotter (1966) Internal-External Locus of Control
Scale. The reason for choosing the Nowicki-Strickland Internal-External Control scale
was because the reliability and validity correlations were found satisfactory in many
studies. The instrument was also used for several studies both in Britain and Turkey.
Moreover, the scale had significant correlations with academic achievement.
4.5.7 Description of the Nowicki-Strickland I-E Control Scale
The scale consists of 40 yes-no questions which assess the degree to which a person
perceives a causal relationship existing between their behaviour and resultant
reinforcement. The items describe reinforcement situations across interpersonal and
motivational areas such as affiliation, achievement, and dependency. Only the external
responses received a score. Therefore, the subjects with a high score are considered
external and those with low scores are considered as having internal locus of control.
However, for the purposes of this study the scoring system was changed. In the present
study, internal responses received a score, the subjects with a high score are considered
internal and those with low scores are considered external. The reason for that change
was because the scoring system of the Global and Academic locus of control scales
were the opposite of each other. While high scores were considered as internal
orientation for the Academic locus of control scale, in contrast, low scores were for the
Global locus of control scale. In order to make this equivalent, the change was made.
After the change, the subjects with a high score are considered internal and those with
C h a p t e r F o u r
- 181 -
low scores are considered external for both scales. Global locus of control scores range
from 0 to 40. There is no set scale for global locus of control. Subjects can only be said
to display characteristics of either internals or externals. In order to determine if a
student displays either internal or external traits, the median score was used as the
midpoint. Students who score above the median were considered external. Students
who score below the median were considered to be internal.
4.5.8 Technical Support of the Nowicki-Strickland I-E Control
Scale
Reliability and validity information was taken from an earlier study performed under
similar conditions (Cook and Chi, 1984). Retest reliability was reported as r= 0.71. The
instrument was shown to have concurrent validity, displaying a significant relationship
between the Nowicki-Strickland Scale of Locus of Control for children and the Rotter
IE (r= 0.68). Duke and Nowicki (1974) found a test retest coefficient of 0.83. Majdub
(1990) in his study, found a coefficient of 0.66 among ARP students. Both the reliability
and validity correlations were considered satisfactory for this study.
4.5.9 Academic Locus of Control Measurement
Academic locus of control was measured using the Intellectual Achievement
Responsibility (IAR) questionnaire (Crandall et al., 1965). The English and Turkish
form of the instrument, and its scoring key can be seen in Appendix A (7, 8, and 11).
4.5.10 Reasons for Selecting the Crandall IAR Scale
The literature review revealed that the Crandall Intellectual Achievement Responsibility
(IAR) Scale was the most commonly used scale in terms of measuring academic locus
of control (Findley and Cooper, 1983). Apart from evidence supporting its test-retest
reliability and validity, it is frequently used in research relating to academic locus of

C h a p t e r F o u r
- 182 -
control. Another reason for choosing this scale was because of its significant correlation
with achievement performance. Although the instrument has been commonly used all
over the world to measure academic locus of control, it has been used only once in
Turkey and the reliability studies of it have not yet been done. In fact when the Turkish
literature were examined, no other academic locus of control instruments were found.
Therefore, it was thought that it would be useful to assess the reliability of the scale and
its use for this study. The instrument has been used for some of the British studies
(Moore, 1980; Reid & Croucher, 1980).
4.5.11 Description of the Crandall IAR Scale
The instrument is designed to measure the extent to which students attribute their
academic successes and failures to themselves or to others in their environment. There
are 34 items on the IAR, which require approximately 15 minutes to complete. The
scale was designed to assess 7 to 16 year old students’ perceptions of locus of control in
academic situations. The rating level is appropriate for grades 6 to 12, and it has been
normed on this grade range. The instrument (IAR) provides a total score as well as
scores for success situations, and for failure situations. It utilises a forced-choice format
in which the student must choose between an internal and external explanation for
performance. The children are asked to explain hypothetical results in terms of two sets
of options, one attributing the results to their own efforts or abilities, the other blaming
outside circumstances. They have to indicate which of the two would probably explain
the result in their own case. For example:
If you solve a puzzle quickly, is it-
(a) because it was not a very hard puzzle, or
(b) because you worked on it carefully?
When you forget something you heard in class, is it-
C h a p t e r F o u r
- 183 -
(a) because the teacher did not explain it very well, or
(b) because you did not try very hard to remember?
4.5.12 Technical Support of the Crandall IAR Scale
There is evidence supporting its test-retest reliability ( from r = 0.47 to r = 0.74 ) and
validity (Crandall, Katkovsky, & Crandall, 1965), and it is frequently used in research
concerning academic locus of control. In terms of convergent validity a moderately high
correlation has been found between this measure and report card grades (r =0.54 - 0.58)
(Crandall, Katkovsky, & Crandall, 1965). Test-retest reliability of the IAR was reported
by Crandall, Katkovsky, & Crandall (1965) and the test-retest reliability was 0.66 for
internal positive, 0.74 for internal negative and 0.69 for total internal scores on the IAR
after a two-month interval. These correlations were all significant at the p<0.001 level.
Seventy ninth-grade subjects were similarly tested and reliability coefficients of 0.47 for
internal positive, 0.69 for internal negative, and 0.65 for total internal scores were
significant at the p<0.001 level. Crandall, Katkovsky, & Crandall (1965) used a sample
of 923 elementary and high-school students in their study. These children came from
five different schools and had different backgrounds. Split-half reliabilities of 0.54
(internal success) and 0.57 (internal failure) for the IAR were obtained from a random
sample of elementary students. A similar random sample with older children revealed
split-half reliability of 0.60 for both internal success and internal failure scores.
4.5.13 Academic Achievement Measurement
Academic achievement for English participants was measured by two indicators:
1. Students' June GCSE exam grade and
2. The November Teacher attainment grade.
Classification was based on their academic performance of the GCSE exam (June 1992)
while the November attainment grade was given by the teachers as a regular procedure
C h a p t e r F o u r
- 184 -
of the college. In this study (in Britain) students' marks in English, Maths, and Science,
the main compulsory subjects, were calculated in order to classify their academic
performances. In British Schools, letter grades are used to differentiate and evaluate
students’ academic achievement, therefore, in this research the same grades were used.
When the academic achievement data of students was collected, it was seen that their
marks ranged from A to G. These letters were averaged to compute a single measure of
academic achievement a "grade-point average". To calculate the grade-point average,
the letters were assigned precise meanings. The letters were converted to numbers as
follow: A = 7, B = 6, C = 5, D = 4, E = 3, F = 2, and G = 1.
The Turkish participants' academic achievement was measured in a similar way. At the
end of the first term (January) and the second term (June), students are examined and
receive marks accordingly. For this research, students' January exam grades were used.
The classification of students' academic performances in Turkey is based on a 10 point
scale, with the lowest mark of 0 and the highest of 10.
4.6 THE TRANSLATION OF THE INSTRUMENTS INTO TURKISH
The Coopersmith Self-Esteem Inventory-School Form and the Crandall Intellectual
Achievement Responsibility Scale were translated separately into Turkish by three
Turkish doctoral students and one MA student. These were linguistics student at the
University of Leicester, who were proficient in both Turkish and English. The
researcher collected the four translations and discussed the results with these people to
decide upon the most appropriate draft. Three Turkish teachers, two of whom are
currently teaching English at a University in Ankara, and one at a private college in
Istanbul, were then asked to translate the Turkish version of the two tests back into
English. The researcher compared the SEI and IAR tests that had been translated into
Turkish and back again into English, to the original English version of these tests, to

C h a p t e r F o u r
- 185 -
determine if any differences existed between the original versions and the translated
versions. Final corrections were then made on the SEI and IAR tests.
The purpose of doing these translations was to ensure that the wording of the items in
Turkish was equivalent to the original meaning of the items in English. After the final
corrections were finished, the translated Turkish versions of the SEI and IAR were sent
to Turkey to be administered.
4.7 ADAPTATION OF THE INSTRUMENTS FOR THE TURKISH
SAMPLE
Since the instruments were developed with respect to western culture, they had to be
adapted to Turkish culture. As far as measuring the psychological constructs is
concerned, it is expected that some items will be valid across different cultures while
others may be valid for specific ones. Each item was examined concerning its adequacy
for Turkish culture. As a result of this examination it was understood that no major
change was needed for the Coopersmith SEI and the Nowicki-Strickland I-E Control
Scale for it to be meaningful when translated into Turkish. However, some items of the
Crandall IAR Scale were not suitable for the Turkish culture, therefore this scale needed
some alteration.
4.8 THE ADAPTATION OF THE CRANDALL IAR SCALE TO
TURKISH CULTURE
Since some of locus of control items may be meaningful in some cultures but are not
meaningful in others, the Crandall IAR Scale items were therefore, carefully examined
and the following changes were made:
Item 2 says “When you do well on a test at school, it is more likely to be...” This item
was changed to the following “When you answered well the questions of an exam at
C h a p t e r F o u r
- 186 -
school, is the most appropriate reason for you...”. The same change was also made in
item 19, because it was the reverse of item 2.
Item 11 says “Suppose you study to become a teacher, scientist, or doctor...” and Item
25 says “Suppose you became a famous teacher, scientist or doctor...” The words of
“teacher” in item 11, and “famous teacher” in item 25 were omitted, because becoming
a teacher is not really related to hard work, and sometimes those who do not work hard
and make great efforts, become teachers in Turkey. In addition to this, there is no
concept of a famous teacher in Turkey. Therefore it was irrelevant to Turkish culture.
Item 22 says “If a teacher did not pass you to the next grade...” was changed to “If a
teacher has you stay down (fail) in his subject ...”
Item 23 says “Suppose you do not do as well as usual in a subject at school...” changed
to “Suppose your homework was less successful than usual...”.
Item 26 says “Suppose your parents say you are not doing well in your school work...”
was changed to “Suppose your parents say you are not successful at school...”.
Item 28 says “When you find it easy to work arithmetic or maths problems at school...”
was changed to “ When you find it easy to solve maths problems at lesson your teacher
gave you...”.
Item 34 says “If a teacher says to you, try to do better, would it be...” was changed to “If
a teacher says to you ‘try to do your homework better’, would it be...”.
4.9 PILOT STUDY
A pilot study was carried out both in England and in Turkey, followed by the main
research exercise.
C h a p t e r F o u r
- 187 -
4.9.1 The Pilot Study in England
4.9.1.1 The English Pilot Sample
The pilot sample in England consisted of 21 GCSE (Year 11) students of a class at a
secondary school in Hinckley. Although all the students in a class of 23 were planned to
participate in the pilot study, two of them were absent on the day of the research. As a
result, a total of 21 students, [10 girls (48%) and 11 boys (52%) were chosen as the
participants for this research, carried out during PSE lessons on the 26th November,
1992. The participants ranged in age from 15.3 to 16.2 years old, with a mean age of
15.7 years. There was not any age difference between male and female participants.
4.9.1.2 The Specific Aims of the Pilot Study in England
a) to find out how long it takes for students to fill in each questionnaire. The
questionnaires were a) the Coopersmith SEI, b) the Culture-Free SEI (Battle,
1981), c) the Nowicki-Strickland I-E Control Scale, and d) Crandall IAR
Scale.
b) to see whether the wording of the questionnaires was clear enough and
adequate for the level of the students,
c) to see what kind of problems existed during the application and what sort
of help they required,
d) to choose the more adequate self-esteem questionnaire from between the
Coopersmith SEI and the Battle’s SEI.
4.9.1.3 How the Pilot Study Influenced my Decision
During the pilot study, it was understood that all the students completed the four
instruments between 35-50 minutes. This showed that a lesson of 50 minutes would be
long enough for all students to complete the three instruments in the main research.
C h a p t e r F o u r
- 188 -
To choose one of the two self-esteem inventories, the researcher decided to use
Coopersmith SEI for the main research. One of the reasons for that was because
Coopersmith SEI had been more commonly used and technical supports of the
Coopersmith SEI were found to be stronger than Battle’s SEI. Secondly, though Battle’s
SEI has consisted of similar subscales and similar questions (most of the items were
derived from Coopersmith SEI), the psychometric studies of the instrument were done
particularly on students with special needs.
During the filling out of the questionnaires, students did not ask many questions.
However, they did have two common complaints. One was that too many of the
questions were duplicated in both the Coopersmith SEI and the Battle SEI. This led
some of the respondents to become bored and therefore to lose interest. After
eliminating one of the self-esteem inventories this problem would not exist in the main
study.
The second common problem was that the students did not understand some of the
American words used in the Crandall IAR Scale. Similarly, it was clear that a few items
in the Crandall’s IAR Scale were not meaningful for the British students. This was
because the questionnaire was developed in the United States. The pilot study showed
that students did not have any problems either with the Coopersmith SEI or with the
Nowicki-Strickland I-E Scale, therefore it was clear that these two scales did not need
any alterations. However, the Crandall IAR Scale needed some verbal alterations.
Before making any changes to this scale, the researcher considered all the feedback and
complaints and later discussed the issues with some of the teachers at the college, some
MA students at the School of Education who were teachers, and some lecturers in the
same institution. The changes made for this scale are shown below:
Item 1 says If a teacher passes you to the next grade, would it probably be
a) because she or he liked you, or

C h a p t e r F o u r
- 189 -
b) because of the work you did?
Due to the differences between educational systems of the United States and Britain ,
this item was not appropriate for the British students. For that reason “If a teacher
passes you to the next grade, would it probably be” was changed to “If a teacher moves
you up a set would it probably be”. The same problem existed for Item 22 which was
the reverse question of item 1. In this item “If a teacher didn’t pass you to the next
grade ...” was also changed to “If a teacher didn’t move you up a set ...”
Item 7 says “When you lose at a game of cards or checkers, does it usually happen...”
Because the word “checkers” is not commonly used in British English most of the
students did not understood it. Therefore it was substituted by the word “draughts”.
Item 10 says “If a boy or girl tells you that you are dumb, is it more likely that they say
that:
a) because they are mad at you, or
b) because what you did really wasn’t very bright?
In this item the words “dumb” and “mad at” were changed to “thick” and “cross with”
which are the British equivalents.
Item 13 says “If a teacher says to you, ‘your work is fine’, is it ” In this item the word
“fine” was discussed by some teachers. They suggested that one of the words from
“satisfactory”, “OK.” or “good” would be better than “fine”. Therefore “fine” was
changed to “good”.
Item 18 says “If your parents tell you you’re acting silly and not thinking clearly, is it
more likely to be;
a) because of something you did, or
b) because they happen to be feeling cranky?
C h a p t e r F o u r
- 190 -
In this item, “b” choice was changed to “because they are in a bad mood“. A similar
change was made for item 26. In this item “Suppose your parents say you aren’t doing
well in your school work. Is this likely to happen more
a) because your work isn’t very good, or
b) because they are feeling cranky?
In this item “b” choice was changed to “because they are in a bad mood”
Finally a small change was made in items 14 and 28. In these items the American
version of “math” was changed to its British version of “maths”.
4.9.2 The Pilot Study in Turkey
4.9.2.1 The Pilot Sample
The pilot sample in Turkey consisted of 100 year-11 secondary school students of three
classes at a secondary school in Ankara. After collecting these pieces of data it was clear
that some of them were incomplete. As a result, the number of cases with no missing
data was 85. Accordingly, 54 girls ( 63%) and 31 boys (37%) were chosen as the
participants for this research, carried out in February 1993. The participants ranged in
age from 15.6 to 19.4 years old, with the mean age of 16.8 years. There was a non-
significant mean age difference between male and female students. The mean ages of
male and female students were 17.0, and 16.7 respectively.
During the pilot work, the Coopersmith Self-Esteem Inventory-School Form, and the
Crandall Intellectual Achievement Responsibility Scale were used. The reason the
Nowicki-Strickland Internal-External Control Scale was not used in the pilot study was
because it had been translated into Turkish by another researcher and used in several
pieces of research in Turkey. Therefore, the researcher preferred not to spend time on
retranslating it into Turkish.
C h a p t e r F o u r
- 191 -
The translated Turkish versions of the instruments for the pilot study were administered
by the two lecturers of the Department of Psychological Services in Education of the
Educational Sciences Faculty of Ankara University. This was because the researcher
was not able to go to Turkey.
4.9.2.2 The specific aims of the Pilot Study in Turkey
a) to find out how long it takes for students to fill in each questionnaire. The
questionnaires were a) the Coopersmith SEI, b) Crandall IAR Scale.
b) To find out whether the languages of the translated version of the
Coopersmith SEI and Crandall IAR scales were clear enough for students to
understand,
c) to see what kind of problems existed during the application and what sort of
help they required,
d) To find out the preliminary reliability of the two instruments.
After completing the pilot study, the raw data was sent to the present researcher with an
observational report, including comments from the administrators. From this report it
was understood that the students completed the two instruments (the Coopersmith SEI
and the Crandall IAR-Scale) between 20-40 minutes. This showed that a lesson of 45
minutes would be long enough for all students to complete the three instruments in the
main research. It was also clear from the administrators’ report that during the filling
out of the questionnaires, students did not ask many questions. Their report showed that
students did not have any problem with either of the instruments. However, to be able to
estimate the reliability of the instruments for the year-11 Turkish secondary school
children, the preliminary reliability of the instruments were assessed. The results are
presented in the next section.
C h a p t e r F o u r
- 192 -
4.10 RELIABILITY STUDIES OF THE INSTRUMENTS for the
TURKISH PILOT SAMPLE
4.10.1 Introduction
As mentioned, one of the research questions of the study was to investigate the
reliability of the instruments which were used in this research, for year 11 Turkish and
English secondary school students. Before using the instruments in the main sample, it
was thought both useful and necessary to determine the reliability of the two
instruments for the Turkish pilot sample. The first study involved the Coopersmith Self-
Esteem Inventory (SEI) and Crandall et al.’s Intellectual-Achievement Responsibility
Scale (IAR). The Turkish pilot sample, which consisted of 85 students, was included in
this study. The third instrument, the Nowicki-Strickland Internal-External Control
Scale, was not applied, because, as explained earlier, this instrument had been already
translated into Turkish and used in several research studies in Turkey (Özyürek, 1982;
Basal, 1983; Korkut, 1986; Yesilyaprak, 1988).
To assess the reliability of the two instruments, the Kuder-Richardson Formula-20 (KR-
20) was employed as well as the Split-Half reliability formulae. The Kuder-Richardson
formula is applicable to tests whose items are scored as right or wrong, or according to
some other all-or-none system. The technique is based on an examination of
performance on each item, rather than requiring two half-scores, as Mehrens &
Lehmann (1978) note that the reliability coefficient estimated by KR-20 equals the
average of all possible split-half reliability coefficients. According to Anastasi, (1982,
p.116), the technique is the most common one for assessing interitem consistency. To
find the split-half reliability, or as it is sometimes called the coefficient of internal
consistency, of the instruments, the 1st half-2nd half and odd-even items were used and
their correlation coefficients were found, and later the Spearman-Brown formula was
C h a p t e r F o u r
- 193 -
applied. The reason that this formula was applied was because of the weakness of the
technique. As it is noted in many psychometric books (Ebel, 1972; Mehrens &
Lehmann, 1978; Anastasi, 1982) , half-test correlation only gives the reliability of a
half-test, rather than a whole test. For example, the entire test of Crandall et al.’s
Intellectual Achievement Responsibility Questionnaire consists of 34 items and the
correlation is computed between two sets of scores, each of which is based on only 17
items. The other weakness of the technique comes from the shortening of the test. The
longer a test, if other things are equal, the more reliable it will be (Anastasi, 1982,
p.114). The Spearman-Brown Formula is widely used to combat the effects of
shortening the instrument on their coefficients. For determining reliability by the split-
half method, many test manuals report reliability with this form.
4.10.2 Results
Initially, students’ responses to the instruments were examined for homogeneity and
reliability. To assess the homogeneity of the instruments, the Kuder-Richardson
Formula 20 (Kuder & Richardson, 1937), which assumes equal difficulty of items, was
employed. The results are shown in Table 4.1. The Kuder-Richardson (KR-20) indices
showed that, on the whole, both the Coopersmith SEI-Total Self-Esteem (r = 0.79), and
its Short-Form (r = 0.76) showed higher internal consistency than Crandall et al.’s IAR
Scale (r=0.62), although, Crandall et al.’s IAR scale showed reasonably high internal
consistency. The subscales of the SEI: the General-Self-Esteem (r = 0.74), the Home-
Self-Esteem (r = 0.72) and the Lie (r = 0.67), all show higher internal consistency than
the Social Self-Esteem (r=0.30) and the Academic Self-Esteem (r = 0.34) subscales.
Table 4.1 shows that the highest reliability coefficient is for SEI-Total (r = 0.79), and
the lowest is for Social Self-Esteem (r = 0.30) as assessed by KR-20.
The Spearman-Brown 1st half-2nd half, and odd-even formulae were also applied in
order to assess the reliability of the instruments for the Turkish pilot sample, with
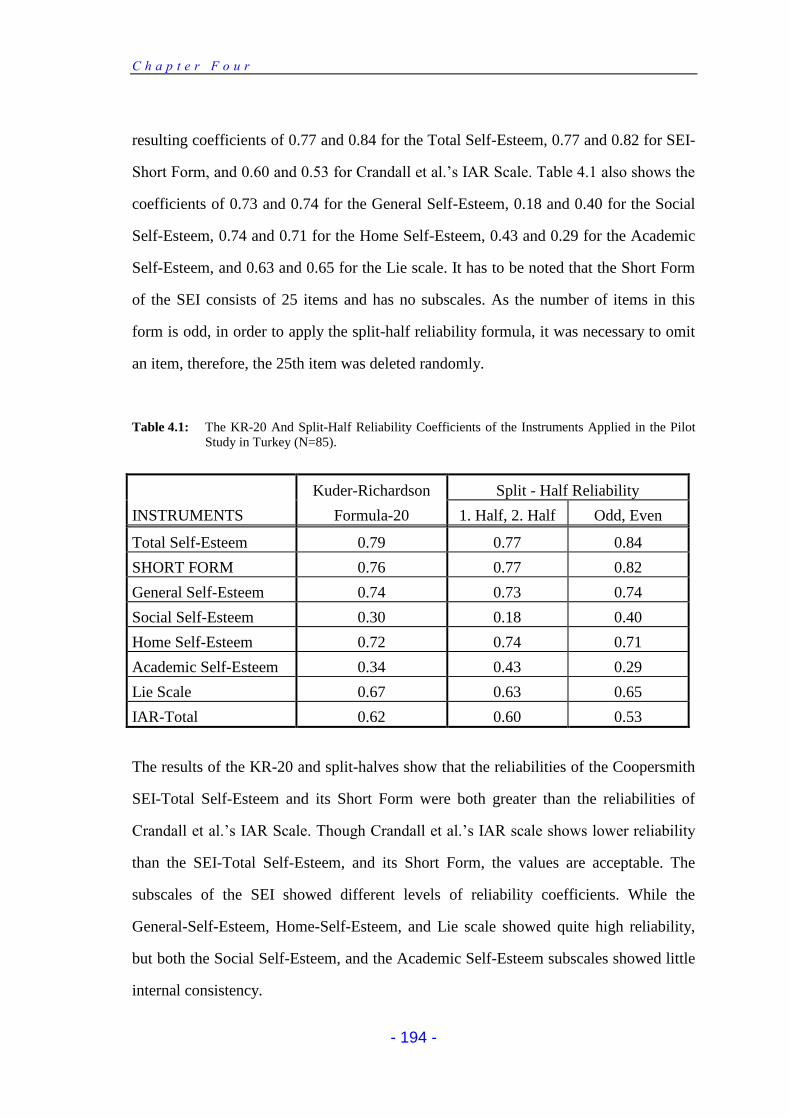
C h a p t e r F o u r
- 194 -
resulting coefficients of 0.77 and 0.84 for the Total Self-Esteem, 0.77 and 0.82 for SEI-
Short Form, and 0.60 and 0.53 for Crandall et al.’s IAR Scale. Table 4.1 also shows the
coefficients of 0.73 and 0.74 for the General Self-Esteem, 0.18 and 0.40 for the Social
Self-Esteem, 0.74 and 0.71 for the Home Self-Esteem, 0.43 and 0.29 for the Academic
Self-Esteem, and 0.63 and 0.65 for the Lie scale. It has to be noted that the Short Form
of the SEI consists of 25 items and has no subscales. As the number of items in this
form is odd, in order to apply the split-half reliability formula, it was necessary to omit
an item, therefore, the 25th item was deleted randomly.
Table 4.1: The KR-20 And Split-Half Reliability Coefficients of the Instruments Applied in the Pilot Study in Turkey (N=85).
Kuder-Richardson Split - Half Reliability
INSTRUMENTS Formula-20 1. Half, 2. Half Odd, Even
Total Self-Esteem 0.79 0.77 0.84
SHORT FORM 0.76 0.77 0.82
General Self-Esteem 0.74 0.73 0.74
Social Self-Esteem 0.30 0.18 0.40
Home Self-Esteem 0.72 0.74 0.71
Academic Self-Esteem 0.34 0.43 0.29
Lie Scale 0.67 0.63 0.65
IAR-Total 0.62 0.60 0.53
The results of the KR-20 and split-halves show that the reliabilities of the Coopersmith
SEI-Total Self-Esteem and its Short Form were both greater than the reliabilities of
Crandall et al.’s IAR Scale. Though Crandall et al.’s IAR scale shows lower reliability
than the SEI-Total Self-Esteem, and its Short Form, the values are acceptable. The
subscales of the SEI showed different levels of reliability coefficients. While the
General-Self-Esteem, Home-Self-Esteem, and Lie scale showed quite high reliability,
but both the Social Self-Esteem, and the Academic Self-Esteem subscales showed little
internal consistency.
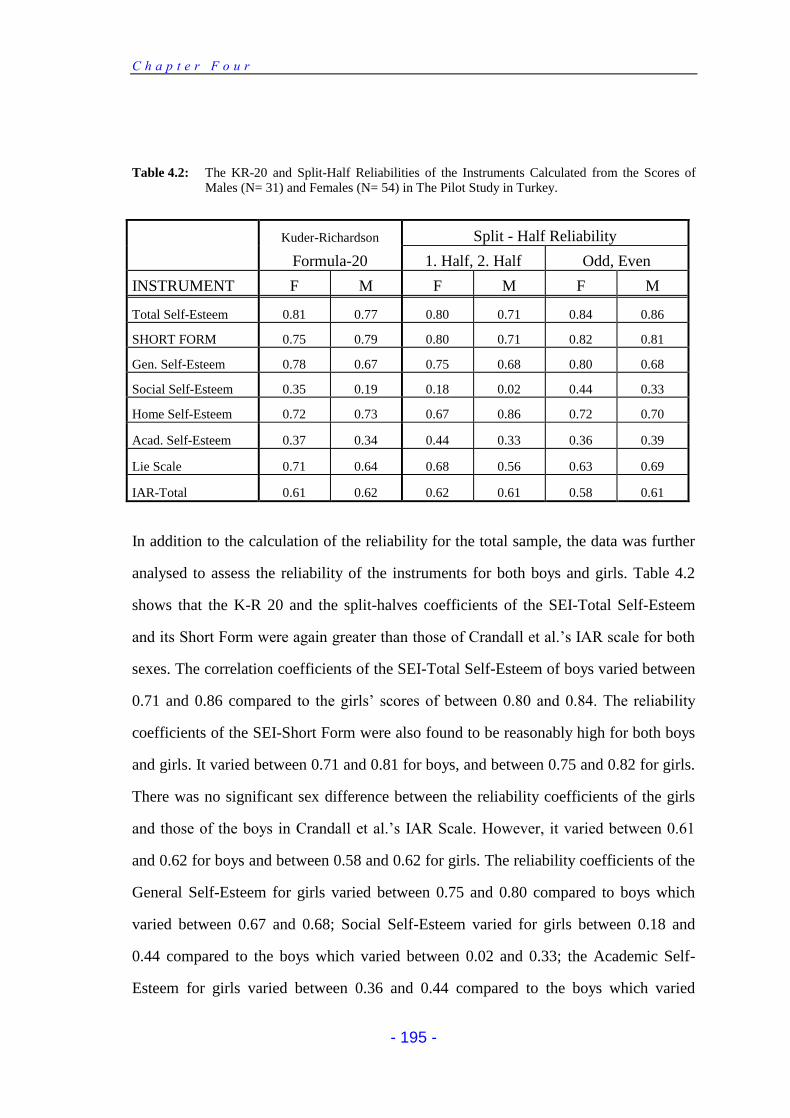
C h a p t e r F o u r
- 195 -
Table 4.2: The KR-20 and Split-Half Reliabilities of the Instruments Calculated from the Scores of Males (N= 31) and Females (N= 54) in The Pilot Study in Turkey.
Kuder-Richardson Split - Half Reliability
Formula-20 1. Half, 2. Half Odd, Even
INSTRUMENT F M F M F M
Total Self-Esteem 0.81 0.77 0.80 0.71 0.84 0.86
SHORT FORM 0.75 0.79 0.80 0.71 0.82 0.81
Gen. Self-Esteem 0.78 0.67 0.75 0.68 0.80 0.68
Social Self-Esteem 0.35 0.19 0.18 0.02 0.44 0.33
Home Self-Esteem 0.72 0.73 0.67 0.86 0.72 0.70
Acad. Self-Esteem 0.37 0.34 0.44 0.33 0.36 0.39
Lie Scale 0.71 0.64 0.68 0.56 0.63 0.69
IAR-Total 0.61 0.62 0.62 0.61 0.58 0.61
In addition to the calculation of the reliability for the total sample, the data was further
analysed to assess the reliability of the instruments for both boys and girls. Table 4.2
shows that the K-R 20 and the split-halves coefficients of the SEI-Total Self-Esteem
and its Short Form were again greater than those of Crandall et al.’s IAR scale for both
sexes. The correlation coefficients of the SEI-Total Self-Esteem of boys varied between
0.71 and 0.86 compared to the girls’ scores of between 0.80 and 0.84. The reliability
coefficients of the SEI-Short Form were also found to be reasonably high for both boys
and girls. It varied between 0.71 and 0.81 for boys, and between 0.75 and 0.82 for girls.
There was no significant sex difference between the reliability coefficients of the girls
and those of the boys in Crandall et al.’s IAR Scale. However, it varied between 0.61
and 0.62 for boys and between 0.58 and 0.62 for girls. The reliability coefficients of the
General Self-Esteem for girls varied between 0.75 and 0.80 compared to boys which
varied between 0.67 and 0.68; Social Self-Esteem varied for girls between 0.18 and
0.44 compared to the boys which varied between 0.02 and 0.33; the Academic Self-
Esteem for girls varied between 0.36 and 0.44 compared to the boys which varied
C h a p t e r F o u r
- 196 -
between 0.33 and 0.39 and the Lie Scale for girls varied between 0.63 and 0.71
compared to the boys which varied between 0.56 and 0.69. The reliability of these
subscales was slightly greater for the girls than for the boys. However, the reliability of
the Home Self-Esteem scale for the boys (between 0.70 and 0.86) was greater than for
the girls (between 0.67 and 0.72).
As a whole, all instruments showed reasonably high reliability for both sexes. However,
when the subscales of the SEI were analysed, the correlation coefficients of the Social
Self and the Academic Self subscales showed low reliability for both sexes. The
reliability of the Social Self-Esteem scale for boys in particular was remarkably low.
Therefore, it was decided to repeat the reliability studies of the instruments by using a
larger main sample. The results of these will be shown in the next chapter.
4.11 THE MAIN SAMPLES
4.11.1 The Main Sample in England
The main sample in England consisted of 190 GCSE (Year 11) students of 10 classes at
a secondary school in Hinckley where the pilot study was also done. Although 238 sets
of questionnaires were delivered to the participants, 48 of them were not properly
completed. As a result, a total of 190 students, (100 boys 52.6%) and (90 girls 47.4%)
were chosen as the participants for this research, on the 21st January 1993. These
subjects ranged in age from 15.5 to 17.1 years old, with a mean age of 16.0 years. There
was no age difference between male and female participants. In order to protect the
confidentiality of the participants’ answers, students were not asked to write their names
on the answering sheets of the questionnaires, but they were expected to write their sex,
date of birth, June exam grades and November attainment grades on the first page of the
test booklet. In order to carry out the research, the researcher sent letters to six different
colleges in Leicestershire requesting permission. Only the one mentioned above gave a
C h a p t e r F o u r
- 197 -
positive answer for this research, on condition that research should be carried out during
the one hour PSE (Personal and Social Education) lesson. As a result, the researcher
himself was not able to administer all the groups. Therefore, the researcher had a
meeting with the teachers who were going to administer their classes, and informed
them about their roles as research administrators. In addition to verbal explanations,
they were given an instruction sheet. The administrators were asked to make sure that
they checked through the scripts before the students were dismissed, in order to ensure
that all the pieces of information were recorded on the forms, as absence of any one item
would have invalidated the script. The administrators were informed that the average
time to be taken to finish all the questions was 35-40 minutes. If some of the students
had not finished after this period, they could be given some more time. They were also
informed that it was crucial that students answered for themselves and that they should
not interact with others in the group during the course of the test. If some of the students
needed some words to be clarified, the administrators could explain the meaning of
these words, but were urged to try not to influence the examinees’ responses by making
any statement which might seem inherently positive or negative. They were reminded
that the test consisted of 9 pages. When the students had completed their papers, the
administrators checked through to make sure that they had not inadvertently missed a
page.
4.11.2 The Main Sample in Turkey
The main sample in Turkey consisted of 315 Year-11 students (164 girls, 52.1% and
151 boys, 47.9%) at the two secondary schools in Ankara. The 85 students who
participated in the pilot study were not used for the main sample. The number of
students from the second school who were given instruments in the main study was 252.
After collecting the data it was found that 32 students’ questionnaires were incomplete.
C h a p t e r F o u r
- 198 -
As a result, a total of 230 students, 120 boys (52.2%) and 110 girls (47.8%) were chosen
as the participants for this research, carried out in April, 1993.
The Coopersmith SEI, the Nowicki-Strickland Internal-External Control Scale, and the
Crandall IAR Scale were all administered in the classrooms with the class teachers
being present. The school’s two counsellors and the researcher were visiting the classes
while the students were filling the questionnaires, and checking whether all the details
were correct.
Although both the Turkish and English students' school ages are similar (Year 11),
Turkish students are often a year or more older than English students, because they start
their schooling one year later than their English counterparts and also they may have to
repeat the same programme of study should they fail in the final exam. For these
reasons, it was not possible to equate Turkish and English participants in terms of both
calendar age and schooling age. Therefore, the Turkish and English samples used the
school age rather than calendar age, due to the belief that the effects of school age upon
self-esteem and locus of control was greater than that of calendar age.
Secondary education in Turkey covers General, Vocational and Technical High
Schools, which give a minimum of three years schooling. Every student who has
completed 8 years of basic education is eligible for secondary education. The samples
for both the pilot and main research in Turkey consisted of students of two general high
schools in Ankara. Students from other types of secondary schools were not represented
in the sample. Therefore, the result of the research will not be generalised for all
secondary schools in Turkey, or in Ankara, though the distribution of students at the
secondary level indicates that "general secondary schools" are in a majority of 60%. The
sample is intended to represent middle socio-economic level State general high schools
in Ankara.
C h a p t e r F o u r
- 199 -
4.12 STATISTICAL ANALYSIS
In order to examine research questions statistical techniques will be used as
follows:
1. In order to assess the reliability of the instruments used in this study, the
Kuder-Richardson 20 formula, Spearman Brown split-half reliabilities (1.
half-second half and odd-even numbers), and intercorrelations of the scales
will be calculated.
2. In order to find out self-esteem and locus of control differences between
English and Turkish groups, and sex differences in these variables, 2 X 2
(culture by sex) variance analyses, and t-test will be used.
3. In order to find out the relationships between self-esteem and locus of control
variables, the Pearson Product-Moment correlations will be performed.
4. In order to examine the relationship of academic achievement with self-
esteem and locus of control, the Pearson Product-Moment correlations will be
performed.
5. In order to find out the best predictor of academic achievement, multiple
regression analyses will be performed. The procedure selected for this
analysis is the Stepwise procedure. In using the multiple regression
technique, the aim is to identify those variables that best predict the key
variable of academic achievement. As the multiple regression technique uses
partial correlations, the confounding effect of variables can be controlled.
The Stepwise method is a combination of both Forward and Backward, and
is the most commonly used and recommended (Meyer, 1993).
CHAPTER 5
RELIABILITY STUDIES OF THE
INSTRUMENTS
C h a p t e r F i v e
- 201 -
5.1 INTRODUCTION
One of the research questions of this study is to investigate the reliability of the
instruments which are used in this research, for year 11 Turkish and English secondary
school students. To do this, similar techniques will be used, as were used for the pilot
sample. They will be the Kuder-Richardson Formula-20 (KR-20) and the Split-Half
reliability formulae. As noted earlier, the Kuder-Richardson formula is applicable to
tests whose items are scored as right or wrong, or according to some other all-or-none
system. The technique is based on an examination of performance on each item, rather
than requiring two half-scores, and as Mehrens & Lehmann (1978) point out, the
reliability coefficient estimated by KR-20 equals the average of all possible split-half
reliability coefficients. According to Anastasi, (1982, p.116), the technique is the most
common one for assessing interitem consistency. To find the split-half reliability, or as
it is sometimes called, the coefficient of internal consistency, of the instruments, the 1st
half-2nd half and odd-even items were used and their correlation coefficients were
found, and then the Spearman-Brown formula was applied. The reason that the
Spearman-Brown formula was applied to the correlation coefficients of the split-halves
was because of the weakness of the technique. As noted in many psychometric books
(Ebel, 1972; Mehrens & Lehmann, 1978; Anastasi, 1982), half-test correlations only
give the reliability of a half-test, rather than a whole test. For example, the entire test of
Crandall et al.’s Intellectual Achievement Responsibility Questionnaire consists of 34
items and the correlation is computed between two sets of scores, each of which is
based on only 17 items. The other weakness of the technique comes from the shortening
of the test. The longer a test, if other things are equal, the more reliable it will be
(Anastasi, 1982, p.114). The Spearman-Brown Formula is widely used to combat the
C h a p t e r F i v e
- 202 -
effects of shortening the instrument on their coefficients. For determining reliability by
the split-half method, many test manuals report reliability with this form.
5.2 The RELIABILITY STUDIES of the INSTRUMENTS for the
TURKISH SAMPLE
5.2.1 Introduction
In this section, the reliability of the instruments, including their subscales for Turkish
students will be assessed. The subjects of the pilot study will be added to the main
sample, consequently the number of Turkish subjects will be increased from 85 to 315
for assessing the reliability of the Coopersmith SEI and Crandall et al.’s IAR scale.
However, the number in the sample which are involved with assessing the Nowicki-
Strickland Internal-External scale will be 230, because, as mentioned earlier, this
instrument was not used during the pilot study. In addition to the assessment of the
reliability of Crandall et al.’s IAR-Total scale, IAR-Success and IAR-Failure scales will
also be assessed in this section, since they were not assessed for the pilot sample. In
order to assess the reliability of the three instruments and their subscales, the same
techniques (KR-20 index, and Spearman Brown split-half reliabilities) will be used, as
they were used for the pilot study. Moreover, intercorrelations of the Coopersmith SEI,
and locus of control scales will also be examined. Although intercorrelation coefficients
of subscales are not commonly used in order to assess the reliability of the instruments,
some authors have investigated the reliability of instruments by using this technique
(Coopersmith, 1991).
5.2.2 The Results of KR-20 and Split-Half Reliabilities
The Kuder-Richardson (KR-20) indices (Table 5.1) indicated that, on the whole, both
the Coopersmith SEI-Total Self-Esteem (r = 0.81), and its Short-Form (r = 0.76),
showed higher internal consistency than both the global locus of control scale (r = 0.64)
C h a p t e r F i v e
- 203 -
(Nowicki-Strickland Internal-External Control Scale) and the academic locus of control
scale-Total scale (r = 0.59) (Crandall et al.’s IAR Scale), although both of the scales
showed reasonably high internal consistency. The subscales of the Coopersmith SEI: the
General-Self-Esteem (r = 0.78), the Home-Self-Esteem (r = 0.66), the Academic Self-
Esteem (r = 0.47), the Social Self-Esteem (r=0.45), and the Lie (r = 0.56), all show
reasonably higher internal consistency. Table 5.1 shows that the highest reliability
coefficient is for the SEI-Total (r = 0.81), and the lowest is for Social Self-Esteem (r =
0.45) as assessed by KR-20. The data indicates that when the number of students
increased from 85 to 315, the reliability of the scales increased as well. The internal
consistency of the Social Self-Esteem was increased from 0.30 for the pilot sample to
0.45 for the entire Turkish sample. Similarly, the reliability of the Academic Self-
Esteem also increased. The reliability coefficient of 0.34 for the pilot sample was
compared to 0.47 for entire Turkish sample. The reliability of global locus of control as
measured by the Nowicki-Strickland I-E Control Scale was not assessed for the Turkish
pilot sample. However, it showed relatively high internal consistency (r = 0.64). Since
the academic locus of control scale as measured by Crandall et al.’s IAR Scale provides
Total scores as well as scores in success situations and failure situations, the internal
consistency of Success (IAR-Success) and Failure (IAR-Failure) subscales, were also
assessed in addition to the Total scale. The data shows that the internal consistency of
the academic locus of control scale as measured by Crandall et al.’s IAR Scale, IAR-
Total (r = 0.59) is higher than the IAR-Success (r = 0.42), and the IAR-Failure (r =
0.49) scales.
The Spearman-Brown 1. half-2. half, and odd-even formulae were also applied in order
to assess the reliability of the instruments for the Turkish sample (see Table 5.1), with
resulting coefficients of 0.82 and 0.86 for the Total Self-Esteem; 0.76 and 0.81 for the
SEI-Short Form; 0.77 and 0.80 for the General Self-Esteem; 0.45 and 0.45 for the
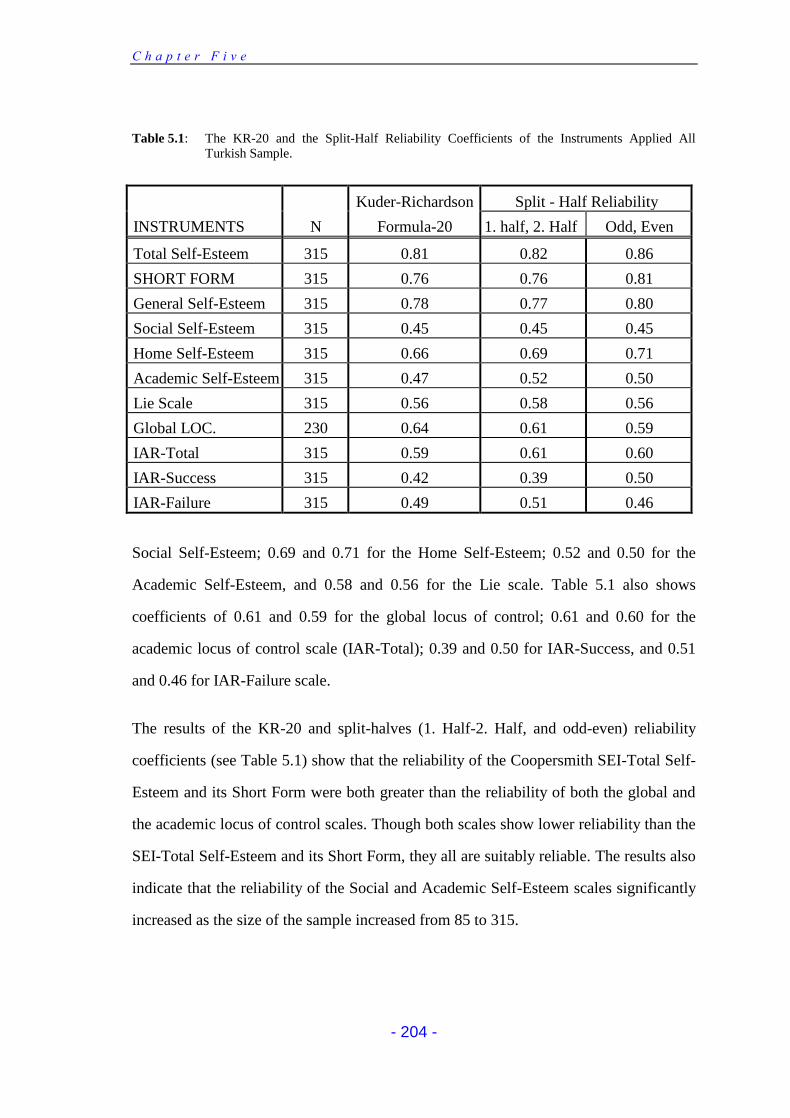
C h a p t e r F i v e
- 204 -
Table 5.1: The KR-20 and the Split-Half Reliability Coefficients of the Instruments Applied All Turkish Sample.
Kuder-Richardson Split - Half Reliability
INSTRUMENTS N Formula-20 1. half, 2. Half Odd, Even
Total Self-Esteem 315 0.81 0.82 0.86
SHORT FORM 315 0.76 0.76 0.81
General Self-Esteem 315 0.78 0.77 0.80
Social Self-Esteem 315 0.45 0.45 0.45
Home Self-Esteem 315 0.66 0.69 0.71
Academic Self-Esteem 315 0.47 0.52 0.50
Lie Scale 315 0.56 0.58 0.56
Global LOC. 230 0.64 0.61 0.59
IAR-Total 315 0.59 0.61 0.60
IAR-Success 315 0.42 0.39 0.50
IAR-Failure 315 0.49 0.51 0.46
Social Self-Esteem; 0.69 and 0.71 for the Home Self-Esteem; 0.52 and 0.50 for the
Academic Self-Esteem, and 0.58 and 0.56 for the Lie scale. Table 5.1 also shows
coefficients of 0.61 and 0.59 for the global locus of control; 0.61 and 0.60 for the
academic locus of control scale (IAR-Total); 0.39 and 0.50 for IAR-Success, and 0.51
and 0.46 for IAR-Failure scale.
The results of the KR-20 and split-halves (1. Half-2. Half, and odd-even) reliability
coefficients (see Table 5.1) show that the reliability of the Coopersmith SEI-Total Self-
Esteem and its Short Form were both greater than the reliability of both the global and
the academic locus of control scales. Though both scales show lower reliability than the
SEI-Total Self-Esteem and its Short Form, they all are suitably reliable. The results also
indicate that the reliability of the Social and Academic Self-Esteem scales significantly
increased as the size of the sample increased from 85 to 315.
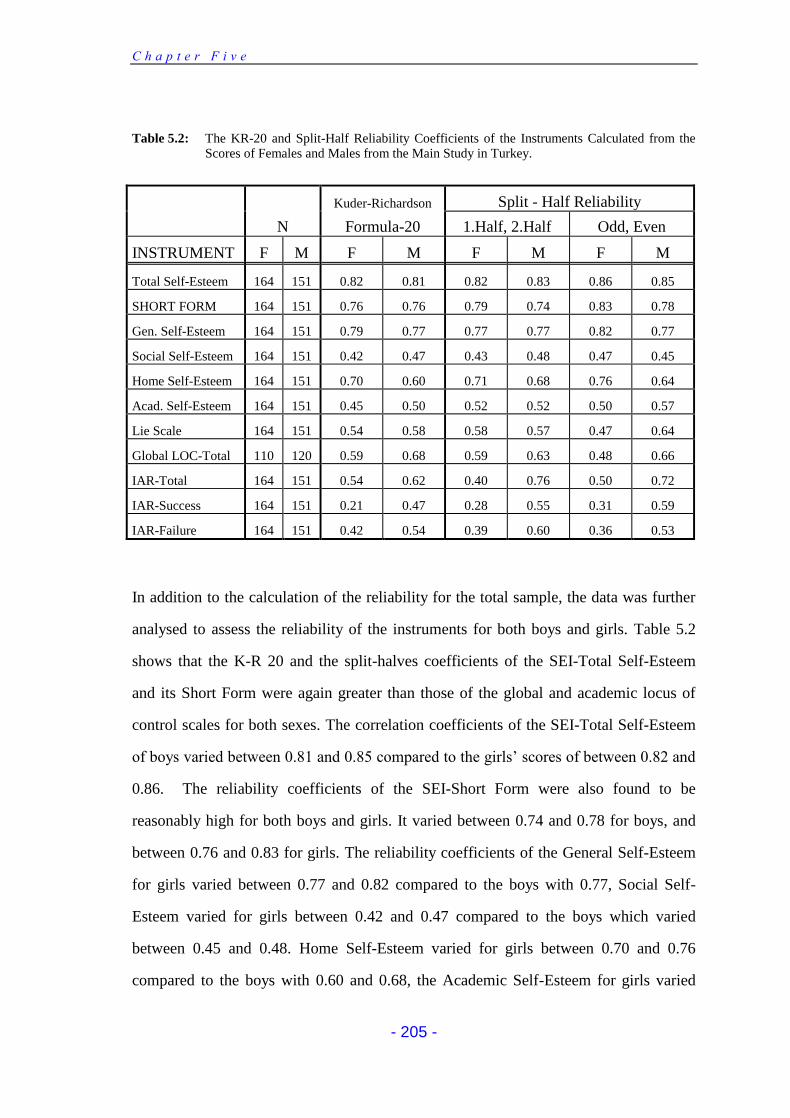
C h a p t e r F i v e
- 205 -
Table 5.2: The KR-20 and Split-Half Reliability Coefficients of the Instruments Calculated from the Scores of Females and Males from the Main Study in Turkey.
Kuder-Richardson Split - Half Reliability
N Formula-20 1.Half, 2.Half Odd, Even
INSTRUMENT F M F M F M F M
Total Self-Esteem 164 151 0.82 0.81 0.82 0.83 0.86 0.85
SHORT FORM 164 151 0.76 0.76 0.79 0.74 0.83 0.78
Gen. Self-Esteem 164 151 0.79 0.77 0.77 0.77 0.82 0.77
Social Self-Esteem 164 151 0.42 0.47 0.43 0.48 0.47 0.45
Home Self-Esteem 164 151 0.70 0.60 0.71 0.68 0.76 0.64
Acad. Self-Esteem 164 151 0.45 0.50 0.52 0.52 0.50 0.57
Lie Scale 164 151 0.54 0.58 0.58 0.57 0.47 0.64
Global LOC-Total 110 120 0.59 0.68 0.59 0.63 0.48 0.66
IAR-Total 164 151 0.54 0.62 0.40 0.76 0.50 0.72
IAR-Success 164 151 0.21 0.47 0.28 0.55 0.31 0.59
IAR-Failure 164 151 0.42 0.54 0.39 0.60 0.36 0.53
In addition to the calculation of the reliability for the total sample, the data was further
analysed to assess the reliability of the instruments for both boys and girls. Table 5.2
shows that the K-R 20 and the split-halves coefficients of the SEI-Total Self-Esteem
and its Short Form were again greater than those of the global and academic locus of
control scales for both sexes. The correlation coefficients of the SEI-Total Self-Esteem
of boys varied between 0.81 and 0.85 compared to the girls’ scores of between 0.82 and
0.86. The reliability coefficients of the SEI-Short Form were also found to be
reasonably high for both boys and girls. It varied between 0.74 and 0.78 for boys, and
between 0.76 and 0.83 for girls. The reliability coefficients of the General Self-Esteem
for girls varied between 0.77 and 0.82 compared to the boys with 0.77, Social Self-
Esteem varied for girls between 0.42 and 0.47 compared to the boys which varied
between 0.45 and 0.48. Home Self-Esteem varied for girls between 0.70 and 0.76
compared to the boys with 0.60 and 0.68, the Academic Self-Esteem for girls varied
C h a p t e r F i v e
- 206 -
between 0.45 and 0.52 compared to the boys which varied between 0.50 and 0.57 and
the Lie Scale for girls varied between 0.47 and 0.58 compared to the boys which varied
between 0.57 and 0.64. The data shows that reliability of the Short Form, General Self-
Esteem, and Home Self-Esteem is slightly greater for the girls than for the boys.
However, the reliability of the Social Self-Esteem and Academic Self-Esteem as well as
all locus of control scales for the boys, was greater than for the girls.
On the whole, all instruments showed reasonably high reliability coefficients for both
sexes, with the exception of academic locus of control scales of Success which (ranged
between r=0.21 and r=0.31) and Failure which (ranged between r=0.36 and r=0.42) for
girls. The internal consistency of the Total academic locus of control showed moderate
reliability (r=0.40 and r=0.54). The data also indicates that the internal consistency of
both the Social and Academic Self-Esteem scales have increased for girls as well as for
boys, as the number of subjects increased. Compared with the internal consistency of
Social Self-Esteem for girls, which ranged between 0.18 and 0.44 for the pilot sample,
the entire Turkish sample varied between r=0.42 and r=0.47. Similarly, the reliability of
the scale for males also increased. The reliability coefficients for the pilot sample
ranged between r=002 and r=0.33 in comparison with the entire sample, which ranged
between r=0.45 and r=0.48. A similar trend can be seen for the reliability of the
Academic Self-Esteem scale. For females it ranged between r=0.36 to r=0.44 for the
pilot sample, and between r=0.45 and r=0.52 for the larger sample. The level of increase
in the reliability of Academic Self-Esteem for male subjects was even more remarkable.
For males, it ranged between r=0.33 to r=0.39 for pilot sample, and between r=0.52 and
r=0.57 for the entire sample.
5.2.3 The Results of Intercorrelations of the Scales
Although the data (Table 5.1 and 5.2) indicates that the internal consistency of all three
instruments for the Turkish subjects is satisfactory, it was thought to be useful to assess
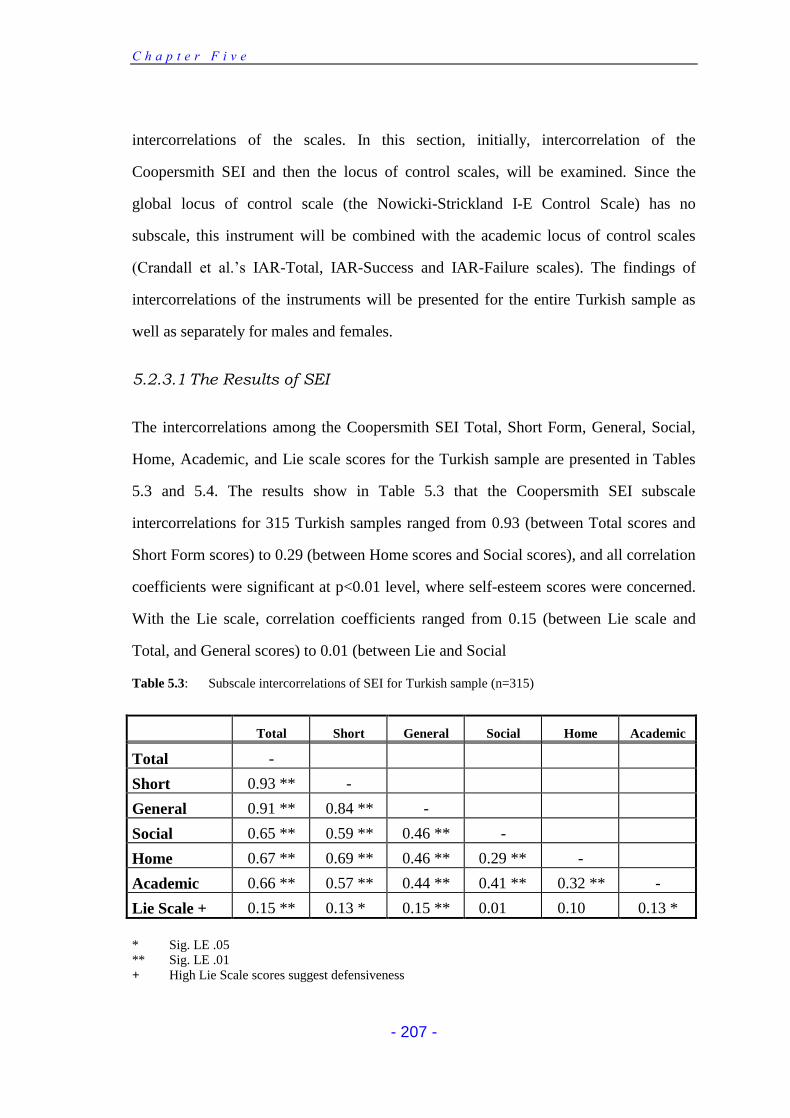
C h a p t e r F i v e
- 207 -
intercorrelations of the scales. In this section, initially, intercorrelation of the
Coopersmith SEI and then the locus of control scales, will be examined. Since the
global locus of control scale (the Nowicki-Strickland I-E Control Scale) has no
subscale, this instrument will be combined with the academic locus of control scales
(Crandall et al.’s IAR-Total, IAR-Success and IAR-Failure scales). The findings of
intercorrelations of the instruments will be presented for the entire Turkish sample as
well as separately for males and females.
5.2.3.1 The Results of SEI
The intercorrelations among the Coopersmith SEI Total, Short Form, General, Social,
Home, Academic, and Lie scale scores for the Turkish sample are presented in Tables
5.3 and 5.4. The results show in Table 5.3 that the Coopersmith SEI subscale
intercorrelations for 315 Turkish samples ranged from 0.93 (between Total scores and
Short Form scores) to 0.29 (between Home scores and Social scores), and all correlation
coefficients were significant at p<0.01 level, where self-esteem scores were concerned.
With the Lie scale, correlation coefficients ranged from 0.15 (between Lie scale and
Total, and General scores) to 0.01 (between Lie and Social
Table 5.3: Subscale intercorrelations of SEI for Turkish sample (n=315)
Total Short General Social Home Academic
Total -
Short 0.93 ** -
General 0.91 ** 0.84 ** -
Social 0.65 ** 0.59 ** 0.46 ** -
Home 0.67 ** 0.69 ** 0.46 ** 0.29 ** -
Academic 0.66 ** 0.57 ** 0.44 ** 0.41 ** 0.32 ** -
Lie Scale + 0.15 ** 0.13 * 0.15 ** 0.01 0.10 0.13 *
* Sig. LE .05 ** Sig. LE .01
+ High Lie Scale scores suggest defensiveness
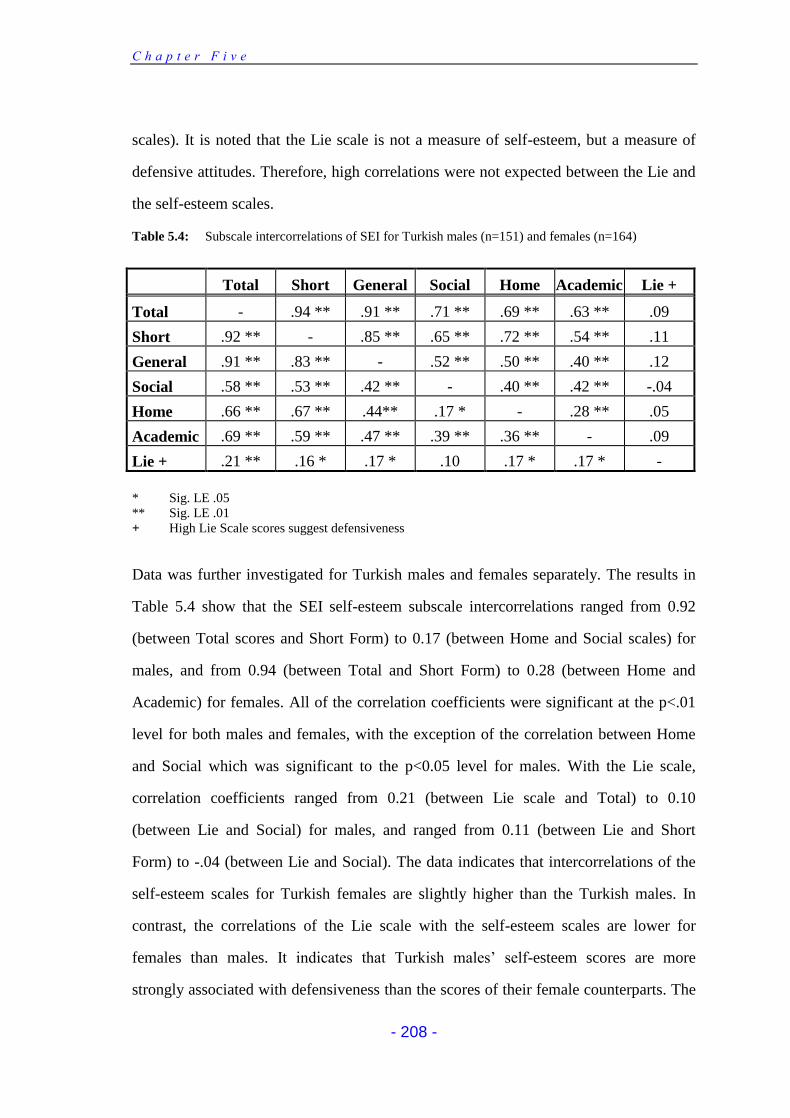
C h a p t e r F i v e
- 208 -
scales). It is noted that the Lie scale is not a measure of self-esteem, but a measure of
defensive attitudes. Therefore, high correlations were not expected between the Lie and
the self-esteem scales.
Table 5.4: Subscale intercorrelations of SEI for Turkish males (n=151) and females (n=164)
Total Short General Social Home Academic Lie +
Total - .94 ** .91 ** .71 ** .69 ** .63 ** .09
Short .92 ** - .85 ** .65 ** .72 ** .54 ** .11
General .91 ** .83 ** - .52 ** .50 ** .40 ** .12
Social .58 ** .53 ** .42 ** - .40 ** .42 ** -.04
Home .66 ** .67 ** .44** .17 * - .28 ** .05
Academic .69 ** .59 ** .47 ** .39 ** .36 ** - .09
Lie + .21 ** .16 * .17 * .10 .17 * .17 * -
* Sig. LE .05 ** Sig. LE .01
+ High Lie Scale scores suggest defensiveness
Data was further investigated for Turkish males and females separately. The results in
Table 5.4 show that the SEI self-esteem subscale intercorrelations ranged from 0.92
(between Total scores and Short Form) to 0.17 (between Home and Social scales) for
males, and from 0.94 (between Total and Short Form) to 0.28 (between Home and
Academic) for females. All of the correlation coefficients were significant at the p<.01
level for both males and females, with the exception of the correlation between Home
and Social which was significant to the p<0.05 level for males. With the Lie scale,
correlation coefficients ranged from 0.21 (between Lie scale and Total) to 0.10
(between Lie and Social) for males, and ranged from 0.11 (between Lie and Short
Form) to -.04 (between Lie and Social). The data indicates that intercorrelations of the
self-esteem scales for Turkish females are slightly higher than the Turkish males. In
contrast, the correlations of the Lie scale with the self-esteem scales are lower for
females than males. It indicates that Turkish males’ self-esteem scores are more
strongly associated with defensiveness than the scores of their female counterparts. The

C h a p t e r F i v e
- 209 -
data also clearly shows that the intercorrelations among Total, Short Form, and General
Self-Esteem which (ranged from 0.84 to 0.93) are significantly greater than
intercorrelations among Social, Home, and Academic scales which (ranged from 0.29 to
0.42). This fact might be explained by the length of scales. The Coopersmith SEI Total
score consisted of 50 items, the Short Form, 25 items, the General Self-Esteem scale, 26
items, the Social Self-Esteem, 8 items, the Home Self-Esteem, 8 items, the Academic
Self-Esteem, 8 items, and the Lie scale, 8 items. It can be seen from these figures that
the number of items that the first three scales have are significantly higher than the other
scales (Social, Home, and Academic). It is also known that the reliability coefficients
would be increased when the number of items increased (Coopersmith, 1991).
5.2.3.2 The Results of Locus of Control
The intercorrelations of the locus of control scales for the Turkish sample are presented
in Tables 5.5 and 5.6. The results show that coefficients ranged from 0.85 (between
IAR-Total and IAR-Failure) to 0.27 (between Global LOC and IAR-Failure), and all the
correlation coefficients were significant at p<.01 level. Similar results were obtained,
when the data was further investigated for Turkish males and females separately (see
the Table 5.6).
Table 5.5: Intercorrelations of Locus of Control Scales for Turkish Sample (n= 315 for IAR; n=230 for Global LOC).
Global LOC IAR-Total IAR-Success
IAR-Total 0.37 ** -
IAR-Success 0.33 ** 0.78 ** -
IAR- Failure 0.27 ** 0.85 ** 0.32 **
** Sig. LE .01
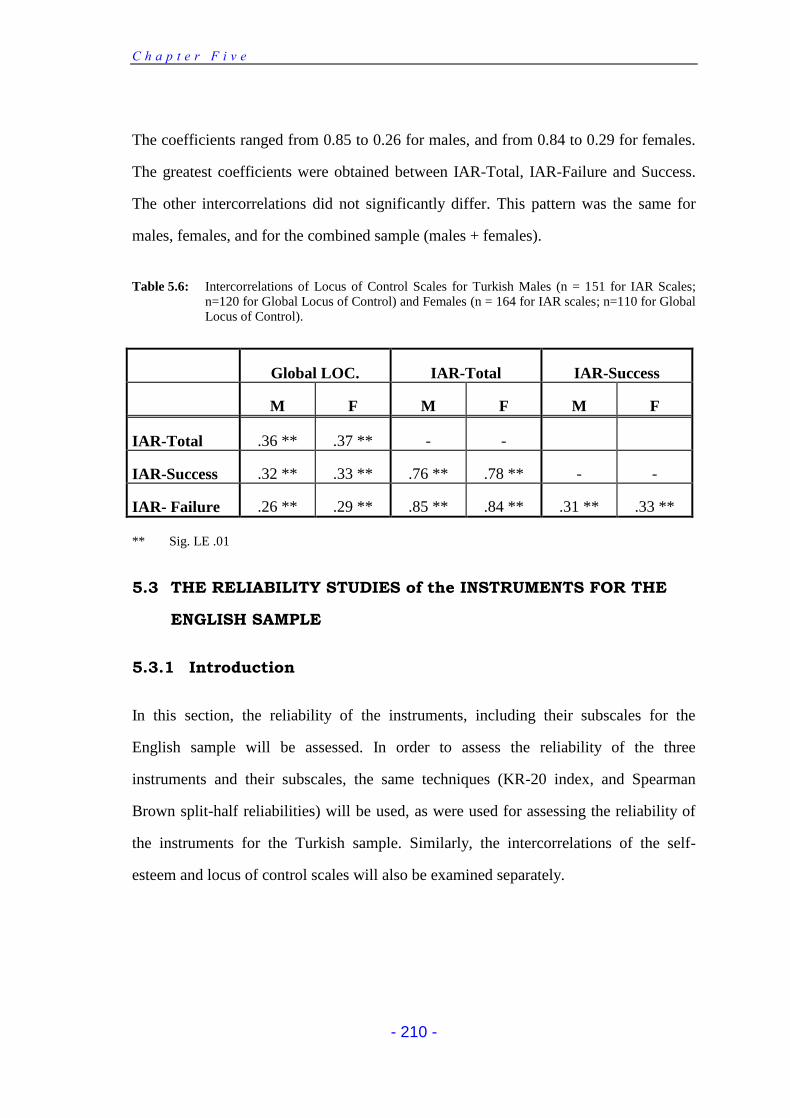
C h a p t e r F i v e
- 210 -
The coefficients ranged from 0.85 to 0.26 for males, and from 0.84 to 0.29 for females.
The greatest coefficients were obtained between IAR-Total, IAR-Failure and Success.
The other intercorrelations did not significantly differ. This pattern was the same for
males, females, and for the combined sample (males + females).
Table 5.6: Intercorrelations of Locus of Control Scales for Turkish Males (n = 151 for IAR Scales; n=120 for Global Locus of Control) and Females (n = 164 for IAR scales; n=110 for Global Locus of Control).
Global LOC. IAR-Total IAR-Success
M F M F M F
IAR-Total .36 ** .37 ** - -
IAR-Success .32 ** .33 ** .76 ** .78 ** - -
IAR- Failure .26 ** .29 ** .85 ** .84 ** .31 ** .33 **
** Sig. LE .01
5.3 THE RELIABILITY STUDIES of the INSTRUMENTS FOR THE
ENGLISH SAMPLE
5.3.1 Introduction
In this section, the reliability of the instruments, including their subscales for the
English sample will be assessed. In order to assess the reliability of the three
instruments and their subscales, the same techniques (KR-20 index, and Spearman
Brown split-half reliabilities) will be used, as were used for assessing the reliability of
the instruments for the Turkish sample. Similarly, the intercorrelations of the self-
esteem and locus of control scales will also be examined separately.
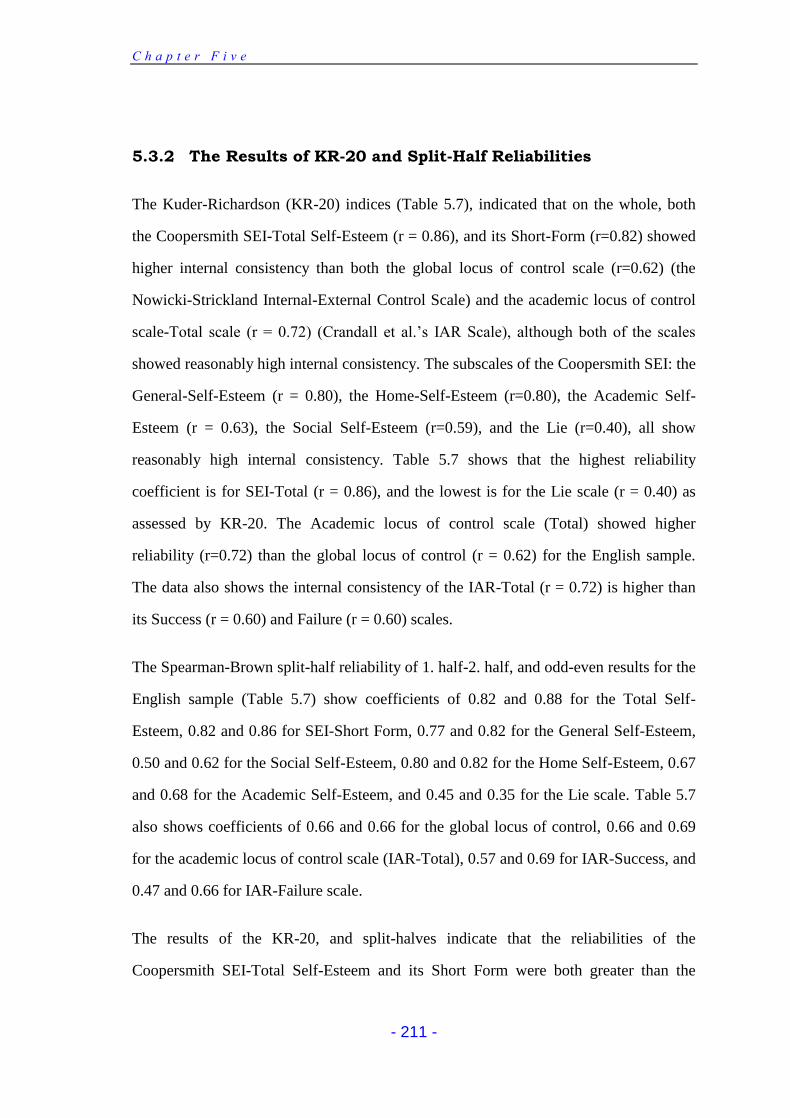
C h a p t e r F i v e
- 211 -
5.3.2 The Results of KR-20 and Split-Half Reliabilities
The Kuder-Richardson (KR-20) indices (Table 5.7), indicated that on the whole, both
the Coopersmith SEI-Total Self-Esteem (r = 0.86), and its Short-Form (r=0.82) showed
higher internal consistency than both the global locus of control scale (r=0.62) (the
Nowicki-Strickland Internal-External Control Scale) and the academic locus of control
scale-Total scale (r = 0.72) (Crandall et al.’s IAR Scale), although both of the scales
showed reasonably high internal consistency. The subscales of the Coopersmith SEI: the
General-Self-Esteem (r = 0.80), the Home-Self-Esteem (r=0.80), the Academic Self-
Esteem (r = 0.63), the Social Self-Esteem (r=0.59), and the Lie (r=0.40), all show
reasonably high internal consistency. Table 5.7 shows that the highest reliability
coefficient is for SEI-Total (r = 0.86), and the lowest is for the Lie scale (r = 0.40) as
assessed by KR-20. The Academic locus of control scale (Total) showed higher
reliability (r=0.72) than the global locus of control (r = 0.62) for the English sample.
The data also shows the internal consistency of the IAR-Total (r = 0.72) is higher than
its Success (r = 0.60) and Failure (r = 0.60) scales.
The Spearman-Brown split-half reliability of 1. half-2. half, and odd-even results for the
English sample (Table 5.7) show coefficients of 0.82 and 0.88 for the Total Self-
Esteem, 0.82 and 0.86 for SEI-Short Form, 0.77 and 0.82 for the General Self-Esteem,
0.50 and 0.62 for the Social Self-Esteem, 0.80 and 0.82 for the Home Self-Esteem, 0.67
and 0.68 for the Academic Self-Esteem, and 0.45 and 0.35 for the Lie scale. Table 5.7
also shows coefficients of 0.66 and 0.66 for the global locus of control, 0.66 and 0.69
for the academic locus of control scale (IAR-Total), 0.57 and 0.69 for IAR-Success, and
0.47 and 0.66 for IAR-Failure scale.
The results of the KR-20, and split-halves indicate that the reliabilities of the
Coopersmith SEI-Total Self-Esteem and its Short Form were both greater than the
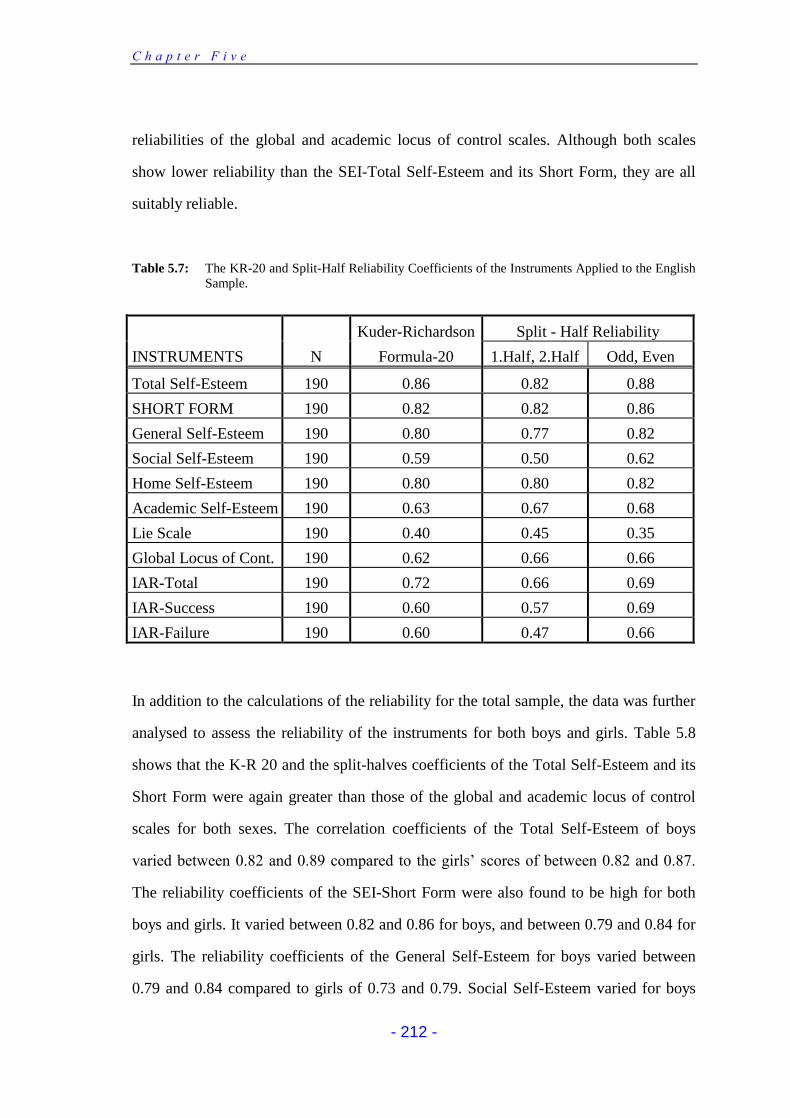
C h a p t e r F i v e
- 212 -
reliabilities of the global and academic locus of control scales. Although both scales
show lower reliability than the SEI-Total Self-Esteem and its Short Form, they are all
suitably reliable.
Table 5.7: The KR-20 and Split-Half Reliability Coefficients of the Instruments Applied to the English Sample.
Kuder-Richardson Split - Half Reliability
INSTRUMENTS N Formula-20 1.Half, 2.Half Odd, Even
Total Self-Esteem 190 0.86 0.82 0.88
SHORT FORM 190 0.82 0.82 0.86
General Self-Esteem 190 0.80 0.77 0.82
Social Self-Esteem 190 0.59 0.50 0.62
Home Self-Esteem 190 0.80 0.80 0.82
Academic Self-Esteem 190 0.63 0.67 0.68
Lie Scale 190 0.40 0.45 0.35
Global Locus of Cont. 190 0.62 0.66 0.66
IAR-Total 190 0.72 0.66 0.69
IAR-Success 190 0.60 0.57 0.69
IAR-Failure 190 0.60 0.47 0.66
In addition to the calculations of the reliability for the total sample, the data was further
analysed to assess the reliability of the instruments for both boys and girls. Table 5.8
shows that the K-R 20 and the split-halves coefficients of the Total Self-Esteem and its
Short Form were again greater than those of the global and academic locus of control
scales for both sexes. The correlation coefficients of the Total Self-Esteem of boys
varied between 0.82 and 0.89 compared to the girls’ scores of between 0.82 and 0.87.
The reliability coefficients of the SEI-Short Form were also found to be high for both
boys and girls. It varied between 0.82 and 0.86 for boys, and between 0.79 and 0.84 for
girls. The reliability coefficients of the General Self-Esteem for boys varied between
0.79 and 0.84 compared to girls of 0.73 and 0.79. Social Self-Esteem varied for boys
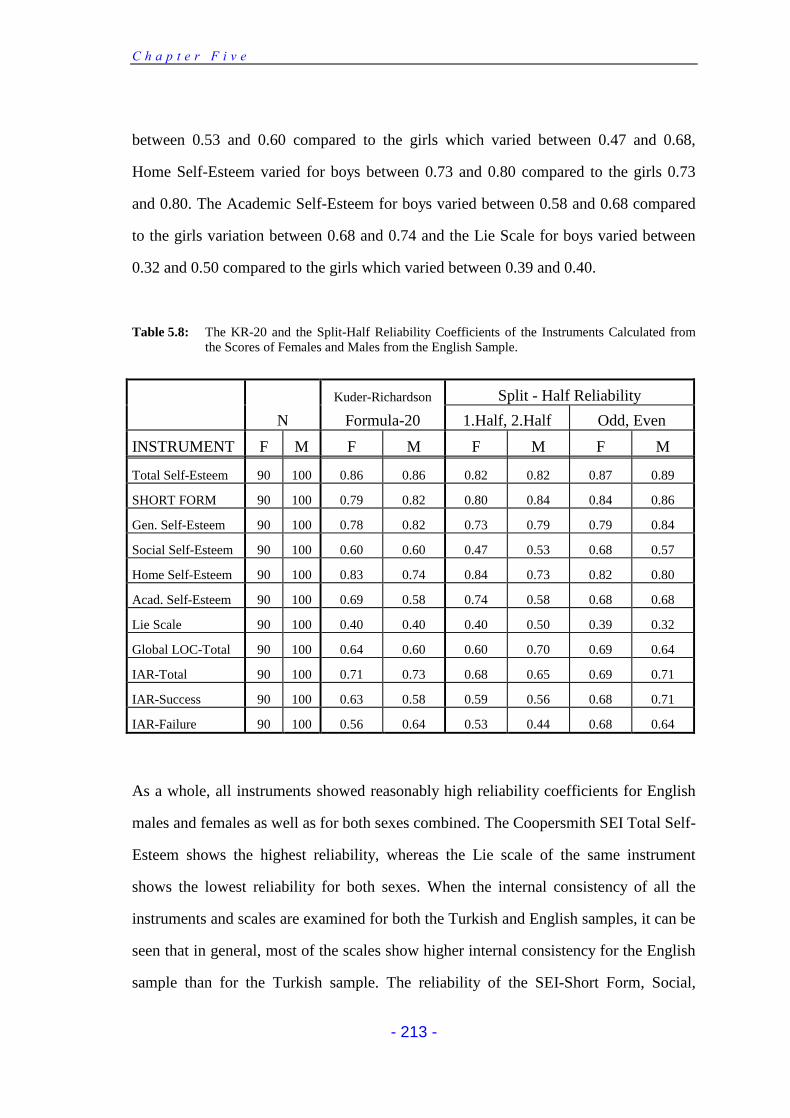
C h a p t e r F i v e
- 213 -
between 0.53 and 0.60 compared to the girls which varied between 0.47 and 0.68,
Home Self-Esteem varied for boys between 0.73 and 0.80 compared to the girls 0.73
and 0.80. The Academic Self-Esteem for boys varied between 0.58 and 0.68 compared
to the girls variation between 0.68 and 0.74 and the Lie Scale for boys varied between
0.32 and 0.50 compared to the girls which varied between 0.39 and 0.40.
Table 5.8: The KR-20 and the Split-Half Reliability Coefficients of the Instruments Calculated from the Scores of Females and Males from the English Sample.
Kuder-Richardson Split - Half Reliability
N Formula-20 1.Half, 2.Half Odd, Even
INSTRUMENT F M F M F M F M
Total Self-Esteem 90 100 0.86 0.86 0.82 0.82 0.87 0.89
SHORT FORM 90 100 0.79 0.82 0.80 0.84 0.84 0.86
Gen. Self-Esteem 90 100 0.78 0.82 0.73 0.79 0.79 0.84
Social Self-Esteem 90 100 0.60 0.60 0.47 0.53 0.68 0.57
Home Self-Esteem 90 100 0.83 0.74 0.84 0.73 0.82 0.80
Acad. Self-Esteem 90 100 0.69 0.58 0.74 0.58 0.68 0.68
Lie Scale 90 100 0.40 0.40 0.40 0.50 0.39 0.32
Global LOC-Total 90 100 0.64 0.60 0.60 0.70 0.69 0.64
IAR-Total 90 100 0.71 0.73 0.68 0.65 0.69 0.71
IAR-Success 90 100 0.63 0.58 0.59 0.56 0.68 0.71
IAR-Failure 90 100 0.56 0.64 0.53 0.44 0.68 0.64
As a whole, all instruments showed reasonably high reliability coefficients for English
males and females as well as for both sexes combined. The Coopersmith SEI Total Self-
Esteem shows the highest reliability, whereas the Lie scale of the same instrument
shows the lowest reliability for both sexes. When the internal consistency of all the
instruments and scales are examined for both the Turkish and English samples, it can be
seen that in general, most of the scales show higher internal consistency for the English
sample than for the Turkish sample. The reliability of the SEI-Short Form, Social,
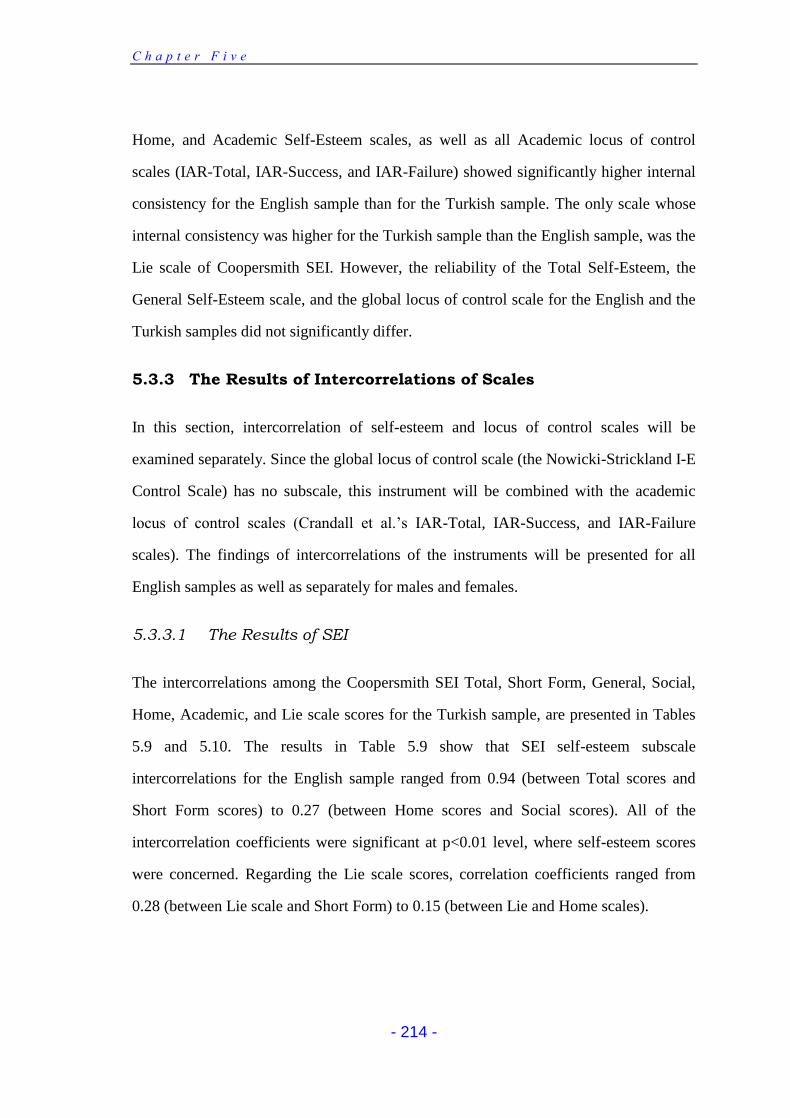
C h a p t e r F i v e
- 214 -
Home, and Academic Self-Esteem scales, as well as all Academic locus of control
scales (IAR-Total, IAR-Success, and IAR-Failure) showed significantly higher internal
consistency for the English sample than for the Turkish sample. The only scale whose
internal consistency was higher for the Turkish sample than the English sample, was the
Lie scale of Coopersmith SEI. However, the reliability of the Total Self-Esteem, the
General Self-Esteem scale, and the global locus of control scale for the English and the
Turkish samples did not significantly differ.
5.3.3 The Results of Intercorrelations of Scales
In this section, intercorrelation of self-esteem and locus of control scales will be
examined separately. Since the global locus of control scale (the Nowicki-Strickland I-E
Control Scale) has no subscale, this instrument will be combined with the academic
locus of control scales (Crandall et al.’s IAR-Total, IAR-Success, and IAR-Failure
scales). The findings of intercorrelations of the instruments will be presented for all
English samples as well as separately for males and females.
5.3.3.1 The Results of SEI
The intercorrelations among the Coopersmith SEI Total, Short Form, General, Social,
Home, Academic, and Lie scale scores for the Turkish sample, are presented in Tables
5.9 and 5.10. The results in Table 5.9 show that SEI self-esteem subscale
intercorrelations for the English sample ranged from 0.94 (between Total scores and
Short Form scores) to 0.27 (between Home scores and Social scores). All of the
intercorrelation coefficients were significant at p<0.01 level, where self-esteem scores
were concerned. Regarding the Lie scale scores, correlation coefficients ranged from
0.28 (between Lie scale and Short Form) to 0.15 (between Lie and Home scales).
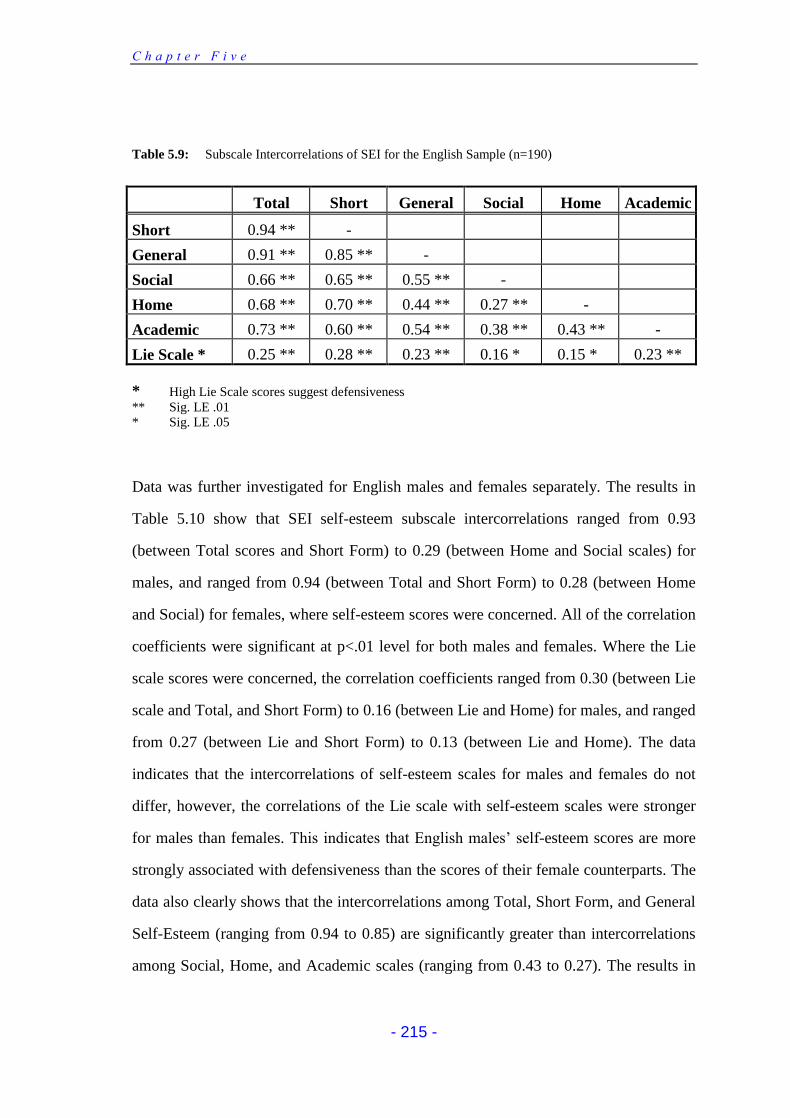
C h a p t e r F i v e
- 215 -
Table 5.9: Subscale Intercorrelations of SEI for the English Sample (n=190)
Total Short General Social Home Academic
Short 0.94 ** -
General 0.91 ** 0.85 ** -
Social 0.66 ** 0.65 ** 0.55 ** -
Home 0.68 ** 0.70 ** 0.44 ** 0.27 ** -
Academic 0.73 ** 0.60 ** 0.54 ** 0.38 ** 0.43 ** -
Lie Scale * 0.25 ** 0.28 ** 0.23 ** 0.16 * 0.15 * 0.23 **
* High Lie Scale scores suggest defensiveness
** Sig. LE .01 * Sig. LE .05
Data was further investigated for English males and females separately. The results in
Table 5.10 show that SEI self-esteem subscale intercorrelations ranged from 0.93
(between Total scores and Short Form) to 0.29 (between Home and Social scales) for
males, and ranged from 0.94 (between Total and Short Form) to 0.28 (between Home
and Social) for females, where self-esteem scores were concerned. All of the correlation
coefficients were significant at p<.01 level for both males and females. Where the Lie
scale scores were concerned, the correlation coefficients ranged from 0.30 (between Lie
scale and Total, and Short Form) to 0.16 (between Lie and Home) for males, and ranged
from 0.27 (between Lie and Short Form) to 0.13 (between Lie and Home). The data
indicates that the intercorrelations of self-esteem scales for males and females do not
differ, however, the correlations of the Lie scale with self-esteem scales were stronger
for males than females. This indicates that English males’ self-esteem scores are more
strongly associated with defensiveness than the scores of their female counterparts. The
data also clearly shows that the intercorrelations among Total, Short Form, and General
Self-Esteem (ranging from 0.94 to 0.85) are significantly greater than intercorrelations
among Social, Home, and Academic scales (ranging from 0.43 to 0.27). The results in
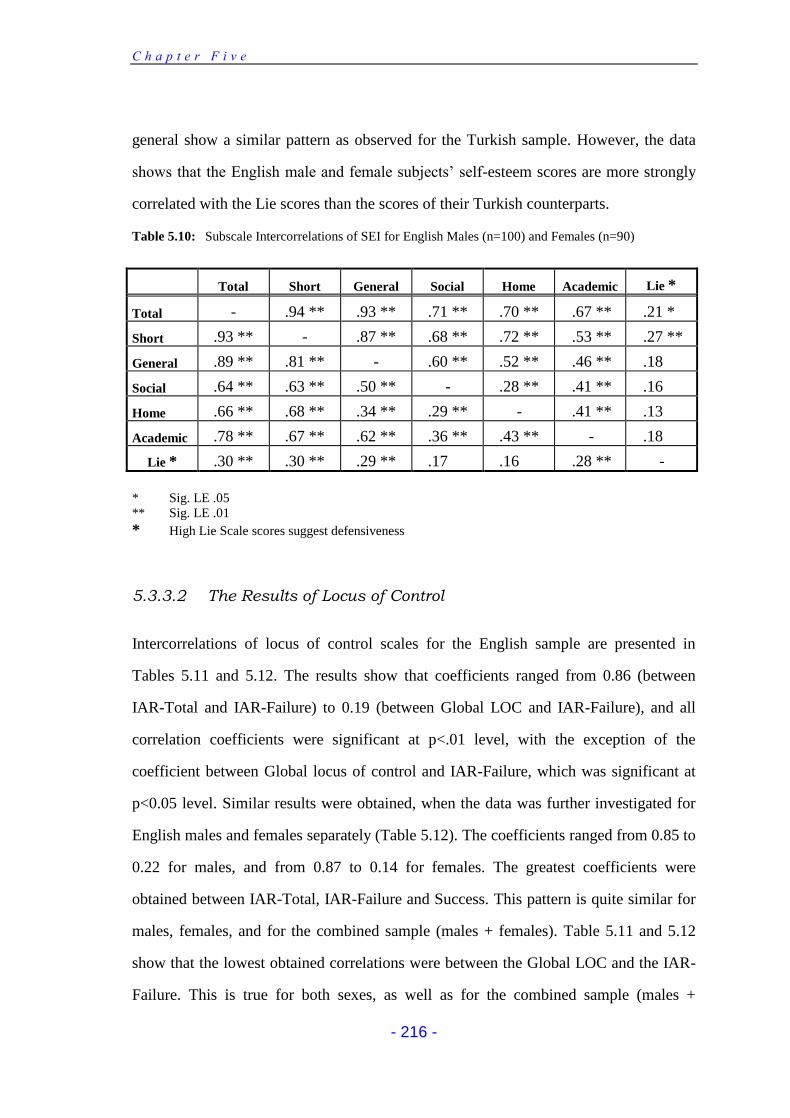
C h a p t e r F i v e
- 216 -
general show a similar pattern as observed for the Turkish sample. However, the data
shows that the English male and female subjects’ self-esteem scores are more strongly
correlated with the Lie scores than the scores of their Turkish counterparts.
Table 5.10: Subscale Intercorrelations of SEI for English Males (n=100) and Females (n=90)
Total Short General Social Home Academic Lie *
Total - .94 ** .93 ** .71 ** .70 ** .67 ** .21 *
Short .93 ** - .87 ** .68 ** .72 ** .53 ** .27 **
General .89 ** .81 ** - .60 ** .52 ** .46 ** .18
Social .64 ** .63 ** .50 ** - .28 ** .41 ** .16
Home .66 ** .68 ** .34 ** .29 ** - .41 ** .13
Academic .78 ** .67 ** .62 ** .36 ** .43 ** - .18
Lie * .30 ** .30 ** .29 ** .17 .16 .28 ** -
* Sig. LE .05 ** Sig. LE .01
* High Lie Scale scores suggest defensiveness
5.3.3.2 The Results of Locus of Control
Intercorrelations of locus of control scales for the English sample are presented in
Tables 5.11 and 5.12. The results show that coefficients ranged from 0.86 (between
IAR-Total and IAR-Failure) to 0.19 (between Global LOC and IAR-Failure), and all
correlation coefficients were significant at p<.01 level, with the exception of the
coefficient between Global locus of control and IAR-Failure, which was significant at
p<0.05 level. Similar results were obtained, when the data was further investigated for
English males and females separately (Table 5.12). The coefficients ranged from 0.85 to
0.22 for males, and from 0.87 to 0.14 for females. The greatest coefficients were
obtained between IAR-Total, IAR-Failure and Success. This pattern is quite similar for
males, females, and for the combined sample (males + females). Table 5.11 and 5.12
show that the lowest obtained correlations were between the Global LOC and the IAR-
Failure. This is true for both sexes, as well as for the combined sample (males +
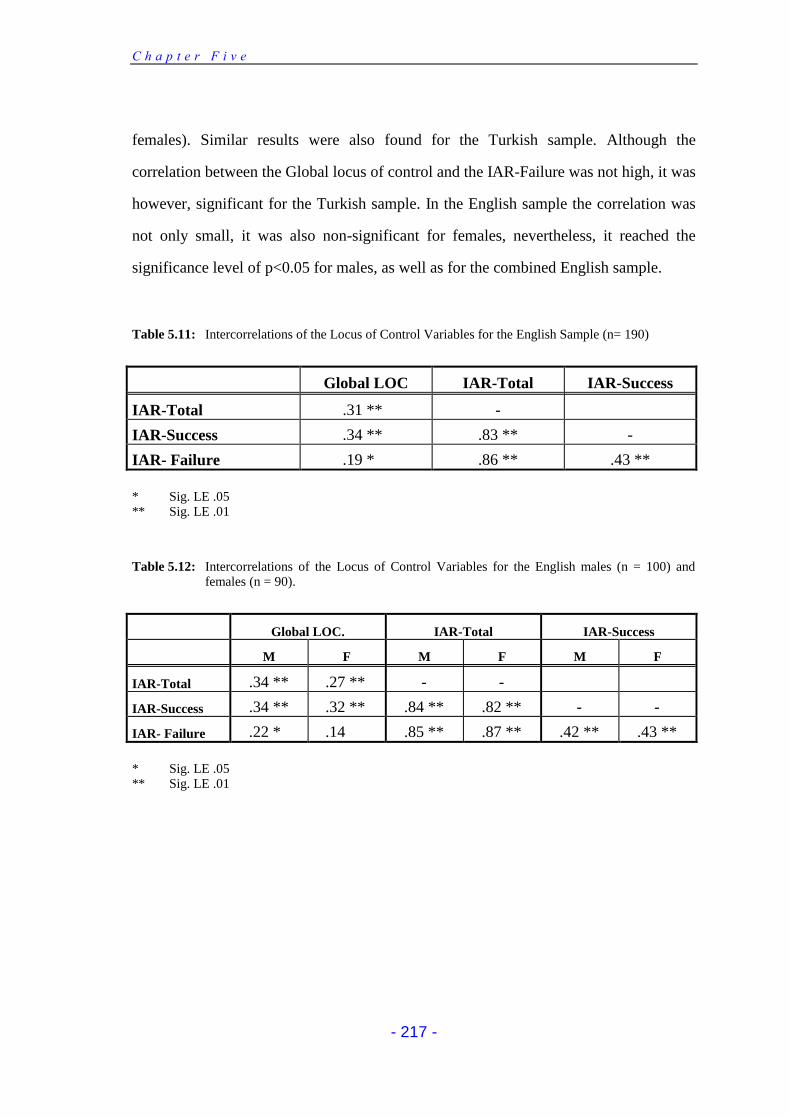
C h a p t e r F i v e
- 217 -
females). Similar results were also found for the Turkish sample. Although the
correlation between the Global locus of control and the IAR-Failure was not high, it was
however, significant for the Turkish sample. In the English sample the correlation was
not only small, it was also non-significant for females, nevertheless, it reached the
significance level of p<0.05 for males, as well as for the combined English sample.
Table 5.11: Intercorrelations of the Locus of Control Variables for the English Sample (n= 190)
Global LOC IAR-Total IAR-Success
IAR-Total .31 ** -
IAR-Success .34 ** .83 ** -
IAR- Failure .19 * .86 ** .43 **
* Sig. LE .05 ** Sig. LE .01
Table 5.12: Intercorrelations of the Locus of Control Variables for the English males (n = 100) and females (n = 90).
Global LOC. IAR-Total IAR-Success
M F M F M F
IAR-Total .34 ** .27 ** - -
IAR-Success .34 ** .32 ** .84 ** .82 ** - -
IAR- Failure .22 * .14 .85 ** .87 ** .42 ** .43 **
* Sig. LE .05 ** Sig. LE .01
C h a p t e r F i v e
- 218 -
5.4 SUMMARY & DISCUSSION of the RESULTS
5.4.1 The Turkish Sample
The results show that the internal consistency of the Coopersmith SEI was greater than
both the global and academic locus of control scales. The reliability of the instruments
ranged from 0.81 to 0.86 for the Coopersmith SEI (Total), from 0.59 to 0.64 for the
Nowicki-Strickland I-E Control Scale, and from 0.59 to 0.61 for the Crandall IAR Scale
(Total). Although both of the locus of control scales show lower reliability than the
Coopersmith SEI (Total), they all are suitably reliable. In addition to the calculation of
the reliability for the total sample, the data was further analysed to assess the reliability
of the instruments for boys and girls. The results show again that the reliability of the
Coopersmith SEI was greater than those of the global and academic locus of control
scales for boys as well as for girls.
Although the Coopersmith SEI (Total) had higher internal consistency, the Social and
the Academic subscales of it had low reliability. While the internal consistency of the
Social Self-Esteem subscale was found to be 0.45, the reliability of the Academic Self-
Esteem scale ranged from 0.47 to 0.52. Similarly IAR-Success (0.39-0.50) and IAR-
Failure (0.46-0.51) subscales of the Crandall IAR showed low reliability. These results
are consistent when analyses were carried out separately for both sexes. However when
the reliability of the Crandall IAR scales (IAR-Total, IAR-Success, and IAR-Failure)
were analysed separately for boys and girls, the data showed that the reliability of these
scales was particularly low for girls rather than boys.
The data indicates that intercorrelations of the self-esteem scales for Turkish females
are slightly higher than the Turkish males. In contrast, the correlations of the Lie scale
with the self-esteem scales are lower for females than males. This indicates that Turkish
males’ self-esteem scores are more strongly associated with defensiveness than the
C h a p t e r F i v e
- 219 -
scores of their female counterparts. The data also clearly shows that the intercorrelations
among Total, Short Form, and General Self-Esteem which (ranged from 0.84 to 0.93)
are significantly greater than intercorrelations among Social, Home, and Academic
scales which (ranged from 0.29 to 0.42). This might be explained by the length of the
scales. The Coopersmith SEI Total score consisted of 50 items, the Short Form, 25
items, the General Self-Esteem scale, 26 items, the Social Self-Esteem, 8 items, the
Home Self-Esteem, 8 items, the Academic Self-Esteem, 8 items and the Lie scale, 8
items. It can be seen from these figures that the number of items that the first three
scales have are significantly higher than the other scales (Social, Home, and Academic).
It is also commonly known that the reliability coefficients would be increased when the
number of items increased (Coopersmith, 1991).
In line with previous reliability studies of the three instruments for the Turkish samples,
the first reliability study on the Coopersmith SEI was done by Güçray in 1989. Güçray
found a coefficient of 0.70 for 51 (23 boys and 28 girls) third, fourth, and fifth-year
primary school children who were tested two weeks apart. Later, the author found a 0.83
correlation coefficient of KR-21 among 583, 9-11 year old primary school students. One
year before the Güçray's study (1988), Özogul (1988) found a reliability coefficient of
0.77 among 120, fourth and fifth year primary school students, however, the author in
her description of the Coopersmith SEI interestingly claimed that the highest possible
score of Coopersmith SEI was 58. In fact, even though the SEI consists of 58 questions,
as Coopersmith (1981) emphasises, 8 of them are “lie” questions and measure defensive
attitude, not self-esteem. Therefore, Coopersmith suggests that researchers should not
add the lie scores to total self-esteem scores, so the highest possible SEI-total score
actually is either 50 or 100 when the scores are multiplied by 2. It seems that researchers
in Turkey are not aware of this and 8 items of lie questions have been added to total
self-esteem scores. Furthermore, it is noted that the past reliability studies of the
Coopersmith SEI were only given to primary school students. As far as it is known, no
C h a p t e r F i v e
- 220 -
reliability studies have been undertaken for secondary school students, in Turkey.
Moreover, none of the researchers who are mentioned above either used or assessed the
reliability of the short form or subscales of SEI. Therefore, it was necessary to find out
the reliability of the inventory before using it in the research of year-11 secondary
school children.
When past reliability studies of the Nowicki-Strickland Locus of Control for the Turkish
samples were considered, the instrument was translated for the first time and used by
Özyürek (1982) and Basal (1983). Neither of the researchers did any reliability and
validity studies on the scale before using it. The first reliability study was done by
Korkut in 1986. By using the short form of the instrument (19 items), she found test-
retest reliability of 0.63 for 3rd year students (n= 49), 0.65 for 5th year students (n= 52),
0.74 for 8th year students and 0.81 for 12th year students, two weeks apart. Two years
later, Yesilyaprak (1988) administered the whole scale to 130 secondary school students
(with a two week interval) and found a test-retest reliability of 0.87. In the same study,
she also reported a KR-21 of 0.71 correlation coefficient. The concurrent validity of the
scale was reported by Yesilyaprak, who correlated The Nowicki-Strickland Locus of
Control Scale with two subscales of the Shortstrom Personal Orientation Inventory
scores of 109 students of the same group, and obtained coefficients of 0.40 for and 0.58
for two of the subscales.
Even though the Crandall Intellectual Academic Responsibility Scale is one of the most
commonly used academic locus of control scales in the Western world, it has been used
only once in Turkey. Gündüz (1986) translated the scale and used it for her MA research
without assessing the reliability of the instrument for Turkish students. While the
present researcher was in Ankara to undertake his research, he contacted Gündüz, who
is a school counsellor in Ankara, and found that she has not done any further studies on
the instrument.
C h a p t e r F i v e
- 221 -
To sum up, when past reliability studies for the Turkish samples were examined, it
could be seen that the correlation coefficients ranged between r=0.70 and r=0.83 for the
Coopersmith SEI (Total), and between r=0.71 and r=0.87 for the global locus of control
scale. It was noted that the reliability studies of the Coopersmith SEI were only given to
primary school students, and as far as it is known, no reliability studies have been
undertaken for secondary school students, in Turkey. Furthermore, there have been no
reliability studies of either the Short Form or the subscales of the inventory. Moreover,
no reliability studies were found for Crandall et al’s Intellectual Achievement
Responsibility scale for the Turkish samples.
5.4.2 The English Sample
The results show that the internal consistency of the Coopersmith SEI was greater than
both the global and academic locus of control scales for the English sample. The
reliability of the instruments ranged from 0.82 to 0.88 for the Coopersmith SEI (Total),
from 0.66 to 0.72 for the Crandall IAR Scale (Total), and from 0.62 to 0.66 for the
Nowicki-Strickland I-E Control Scale. Similar results were obtained when the data was
further investigated for English males and females separately. Although both of the
locus of control scales show lower reliability than the Coopersmith SEI (Total), they are
all reasonably reliable. These results also show that the internal consistency of the
instruments is slightly higher for the English sample than for the Turkish sample.
As a whole, all instruments showed reasonably high reliability coefficients for English
males and females as well as for both sexes combined. The Coopersmith SEI Total Self-
Esteem shows the highest reliability, whereas the Lie scale of the same instrument
shows the lowest reliability for both sexes. When the internal consistency of all the
instruments and scales are examined, for both the Turkish and English samples, it can
be seen that in general, most of the scales show higher internal consistency for the
English sample than for the Turkish sample. The reliability of the SEI-Short Form,
C h a p t e r F i v e
- 222 -
Social, Home, and Academic Self-Esteem scales, as well as all Academic locus of
control scales (IAR-Total, IAR-Success, and IAR-Failure) showed significantly higher
internal consistency for the English sample than for the Turkish sample. The only scale
whose internal consistency was higher for the Turkish sample was the Lie scale of
Coopersmith SEI. However, the reliability of the Total Self-Esteem, the General Self-
Esteem scale, and the global locus of control scale for English and for Turkish samples
did not significantly differ.
The data also indicates that the intercorrelations of self-esteem scales for males and
females do not differ, however, the correlations of the Lie scale with self-esteem scales
were stronger for males than females. This indicates that English males’ self-esteem
scores are more strongly associated with defensiveness than the scores of their female
counterparts. The data also clearly shows that the intercorrelations among Total, Short
Form, and General Self-Esteem which (ranged from 0.94 to 0.85) are significantly
greater than intercorrelations among Social, Home, and Academic scales which (ranged
from 0.43 to 0.27). The results in general, show a similar pattern as observed for the
Turkish sample. However, the data shows that the English male and female subjects’
self-esteem scores are more strongly correlated with the Lie scores than the scores of
their Turkish counterparts.
When past reliability studies of the instruments were considered, the internal
consistency of the SEI-Total has varied from 0.80 to 0.92 (Coopersmith, 1991). As the
manual of Coopersmith SEI (Coopersmith, 1991) shows, only one past study reports
any internal consistency of the Short Form. Bedeian et al (1977), in their study, found
KR-20s of 0.74 for males and 0.71 for females. In another study, the SEI Short Form is
significantly correlated with the SEI School Form, r = 0.86 (Coopersmith (1991).
Interestingly, the manual of the SEI does not report any internal consistency coefficients
for any subscales of SEI. However, Donaldson (1974) reports subscale intercorrelations
C h a p t e r F i v e
- 223 -
which range from r=0.02 to r=0.52 for school children in grades 3 to 8. In a recent
study, Owens (1991) reports internal consistency reliability for the subscales of the SEI,
which ranged from 0.28 to 0.82 for students between grades 5-11. Similarly, the past
reliability studies for the Nowicki-Strickland Internal-External Control scale show that
the reliability of the instrument ranged from 0.66 to r=0.83 (Duke & Nowicki, 1974;
Cook & Chi, 1984; Majdub, 1990). The past reliability studies for Crandall et al’s
Intellectual Achievement Responsibility (IAR) scale indicate that the reliability of the
instrument ranged from 0.65 to 0.69 for IAR-Total, from 0.47 to 0.66 for IAR-Success,
and 0.57 and 0.74 for IAR-Failure. However, when only split-half reliabilities were
concerned for the IAR scale, it ranged from 0.54 to 0.60 for all three IAR scales
(Crandall et al., 1965).
To sum up the present results, on the reliability of the Coopersmith SEI, the Nowicki-
Strickland Internal-External Control Scale, and the Crandall Intellectual Achievement
Responsibility scale, all showed reasonably high internal consistency for the English as
well as for the Turkish sample, as revealed by the KR-20 index and the split-half
reliability (Spearman Brown 1st half-2nd half, and odd-even). The findings of this study
also indicate that the instruments which are used for this study are as reliable as the
previous studies report.
CHAPTER 6
STATISTICAL ANALYSIS & RESULT
DISCUSSION
C h a p t e r S i x
- 225 -
6.1 CROSS-CULTURAL COMPARISONS of SELF-ESTEEM
6.1.1 Introduction
This section reports on cross-cultural comparisons (British versus Turkish) in self-
esteem. Students’ self-esteem was evaluated using the Coopersmith Self-Esteem
Inventory-SEI (Coopersmith, 1991). Four areas (General, Social, Home, and Academic)
as well as the Total, Short Form and Lie scale of the instrument were examined as
dependent variables. The 2 X 2 (Culture = English, Turkish; and Sex = male, female)
analysis of variance tables, and the tables showing group means, standard deviation,
minimum and maximum scores are presented in this section, but the t-test tables for
group comparisons are presented in Appendix B (1). The results for the different self-
esteem areas are reported separately, but all findings are discussed together at the end of
the section. Finally, the results of the hypotheses which related to this section are
summarised. The hypotheses related to this section are as follow:
Hypothesis 1: The English subjects would have higher self-esteem than their Turkish
counterparts.
Hypothesis 2: There would not be sex differences in self-esteem for either of the
Turkish or the English subjects.
6.1.2 Total Self-Esteem
The means and the standard deviations on the Coopersmith SEI Total score for the
English and Turkish samples are shown in Table 6.1. A two-way (country by sex)
ANOVA between subjects was performed on the Coopersmith SEI total scores. The
results show that there was a significant main effect of country (F = 16.52; p<0.001)
indicating that English subjects have a significantly higher Total Self-Esteem score than
the Turkish subjects. However, the results of variance analysis presented in Table 6.2
show that there was no significant main effect of sex, but the 2-way interactions
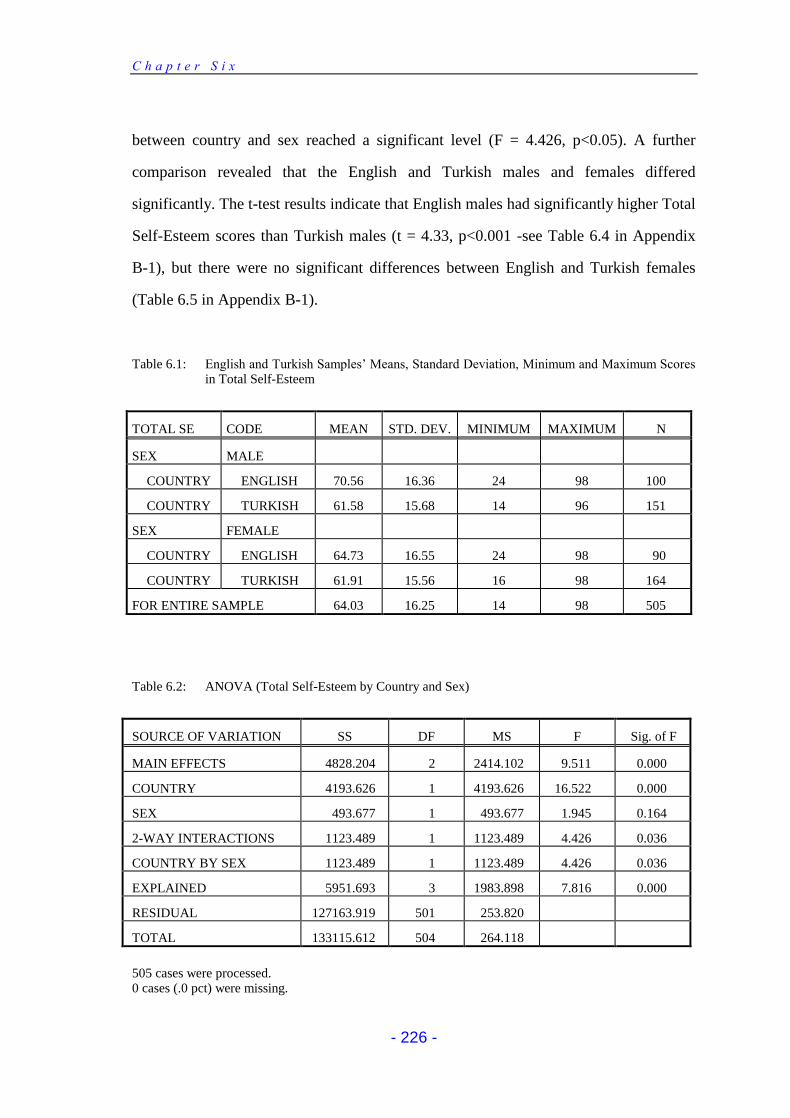
C h a p t e r S i x
- 226 -
between country and sex reached a significant level (F = 4.426, p<0.05). A further
comparison revealed that the English and Turkish males and females differed
significantly. The t-test results indicate that English males had significantly higher Total
Self-Esteem scores than Turkish males (t = 4.33, p<0.001 -see Table 6.4 in Appendix
B-1), but there were no significant differences between English and Turkish females
(Table 6.5 in Appendix B-1).
Table 6.1: English and Turkish Samples’ Means, Standard Deviation, Minimum and Maximum Scores in Total Self-Esteem
TOTAL SE CODE MEAN STD. DEV. MINIMUM MAXIMUM N
SEX MALE
COUNTRY ENGLISH 70.56 16.36 24 98 100
COUNTRY TURKISH 61.58 15.68 14 96 151
SEX FEMALE
COUNTRY ENGLISH 64.73 16.55 24 98 90
COUNTRY TURKISH 61.91 15.56 16 98 164
FOR ENTIRE SAMPLE 64.03 16.25 14 98 505
Table 6.2: ANOVA (Total Self-Esteem by Country and Sex)
SOURCE OF VARIATION SS DF MS F Sig. of F
MAIN EFFECTS 4828.204 2 2414.102 9.511 0.000
COUNTRY 4193.626 1 4193.626 16.522 0.000
SEX 493.677 1 493.677 1.945 0.164
2-WAY INTERACTIONS 1123.489 1 1123.489 4.426 0.036
COUNTRY BY SEX 1123.489 1 1123.489 4.426 0.036
EXPLAINED 5951.693 3 1983.898 7.816 0.000
RESIDUAL 127163.919 501 253.820
TOTAL 133115.612 504 264.118
505 cases were processed. 0 cases (.0 pct) were missing.
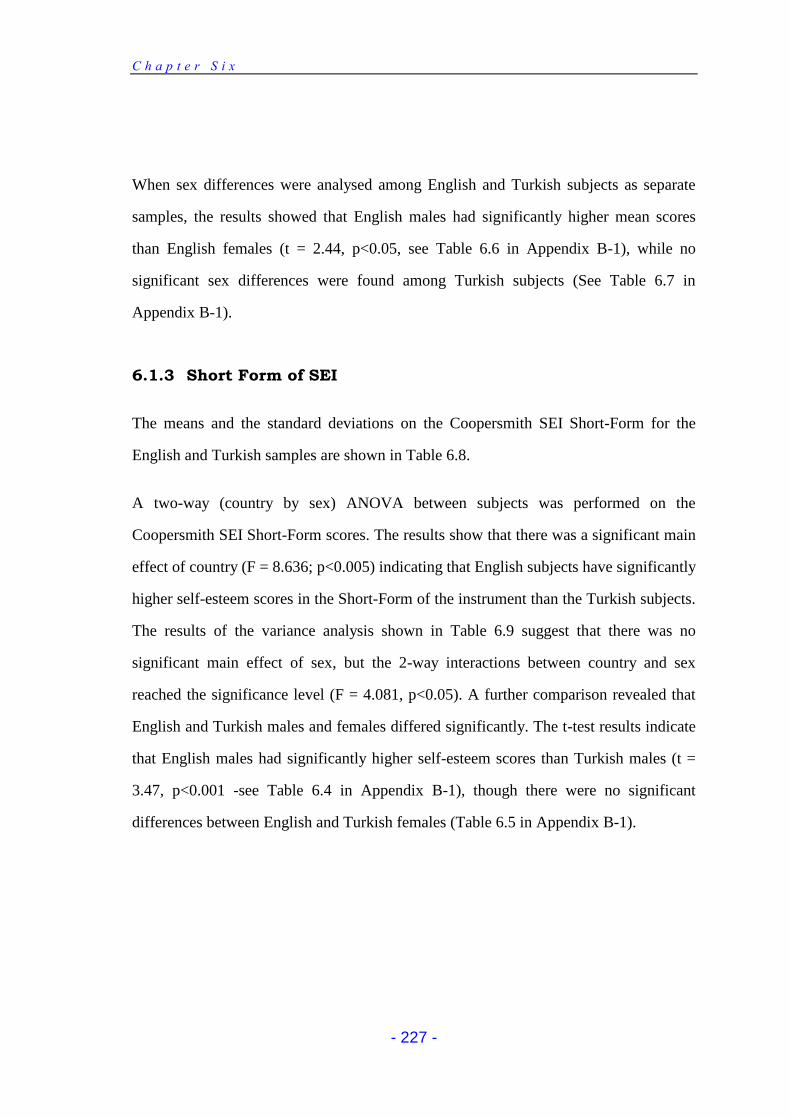
C h a p t e r S i x
- 227 -
When sex differences were analysed among English and Turkish subjects as separate
samples, the results showed that English males had significantly higher mean scores
than English females (t = 2.44, p<0.05, see Table 6.6 in Appendix B-1), while no
significant sex differences were found among Turkish subjects (See Table 6.7 in
Appendix B-1).
6.1.3 Short Form of SEI
The means and the standard deviations on the Coopersmith SEI Short-Form for the
English and Turkish samples are shown in Table 6.8.
A two-way (country by sex) ANOVA between subjects was performed on the
Coopersmith SEI Short-Form scores. The results show that there was a significant main
effect of country (F = 8.636; p<0.005) indicating that English subjects have significantly
higher self-esteem scores in the Short-Form of the instrument than the Turkish subjects.
The results of the variance analysis shown in Table 6.9 suggest that there was no
significant main effect of sex, but the 2-way interactions between country and sex
reached the significance level (F = 4.081, p<0.05). A further comparison revealed that
English and Turkish males and females differed significantly. The t-test results indicate
that English males had significantly higher self-esteem scores than Turkish males (t =
3.47, p<0.001 -see Table 6.4 in Appendix B-1), though there were no significant
differences between English and Turkish females (Table 6.5 in Appendix B-1).
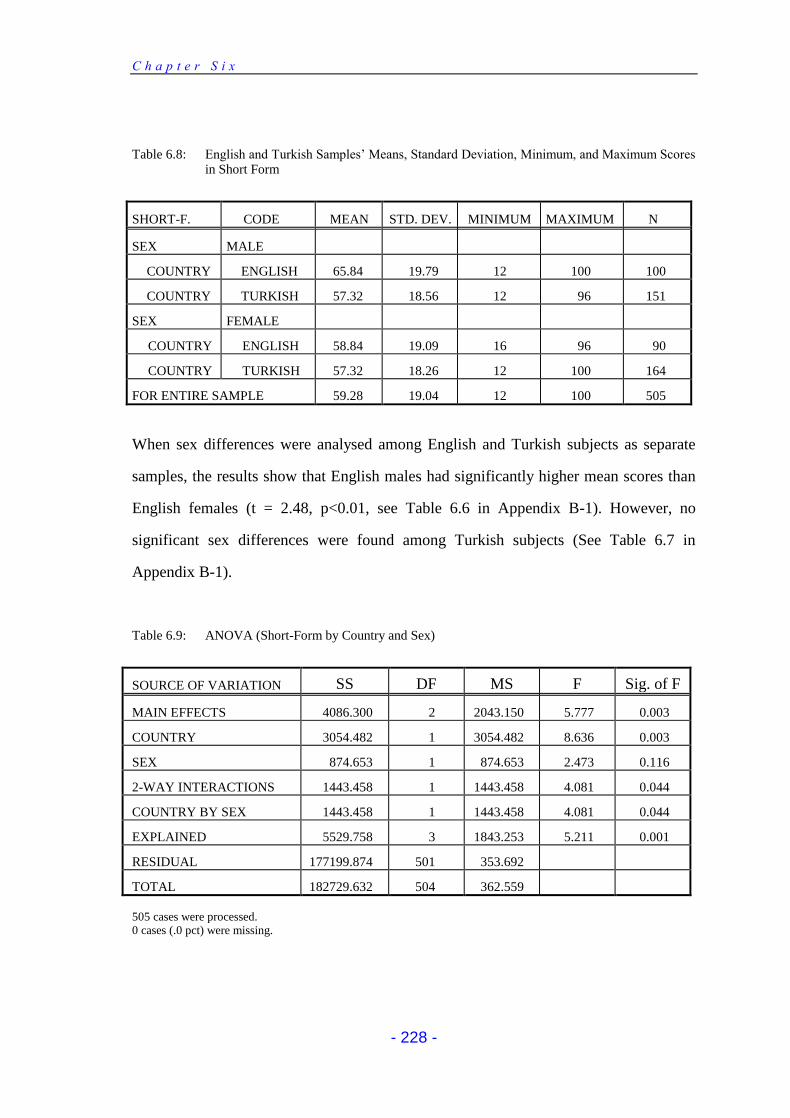
C h a p t e r S i x
- 228 -
Table 6.8: English and Turkish Samples’ Means, Standard Deviation, Minimum, and Maximum Scores in Short Form
SHORT-F. CODE MEAN STD. DEV. MINIMUM MAXIMUM N
SEX MALE
COUNTRY ENGLISH 65.84 19.79 12 100 100
COUNTRY TURKISH 57.32 18.56 12 96 151
SEX FEMALE
COUNTRY ENGLISH 58.84 19.09 16 96 90
COUNTRY TURKISH 57.32 18.26 12 100 164
FOR ENTIRE SAMPLE 59.28 19.04 12 100 505
When sex differences were analysed among English and Turkish subjects as separate
samples, the results show that English males had significantly higher mean scores than
English females (t = 2.48, p<0.01, see Table 6.6 in Appendix B-1). However, no
significant sex differences were found among Turkish subjects (See Table 6.7 in
Appendix B-1).
Table 6.9: ANOVA (Short-Form by Country and Sex)
SOURCE OF VARIATION SS DF MS F Sig. of F
MAIN EFFECTS 4086.300 2 2043.150 5.777 0.003
COUNTRY 3054.482 1 3054.482 8.636 0.003
SEX 874.653 1 874.653 2.473 0.116
2-WAY INTERACTIONS 1443.458 1 1443.458 4.081 0.044
COUNTRY BY SEX 1443.458 1 1443.458 4.081 0.044
EXPLAINED 5529.758 3 1843.253 5.211 0.001
RESIDUAL 177199.874 501 353.692
TOTAL 182729.632 504 362.559
505 cases were processed. 0 cases (.0 pct) were missing.
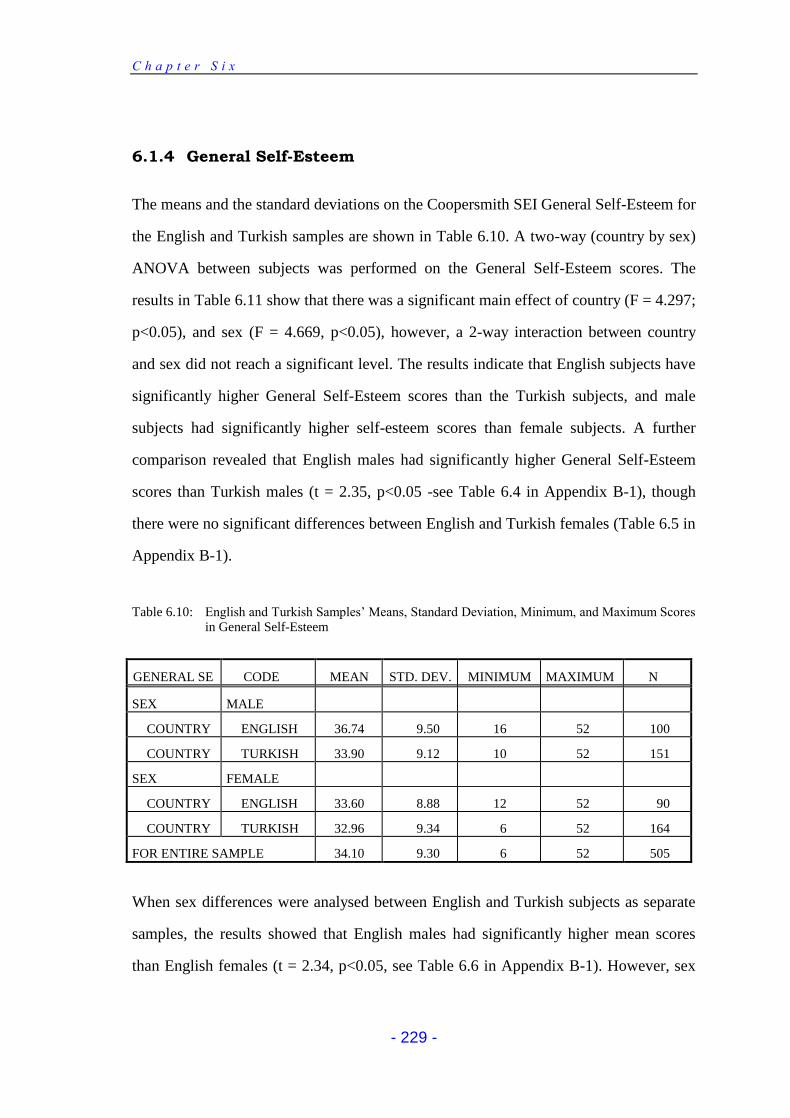
C h a p t e r S i x
- 229 -
6.1.4 General Self-Esteem
The means and the standard deviations on the Coopersmith SEI General Self-Esteem for
the English and Turkish samples are shown in Table 6.10. A two-way (country by sex)
ANOVA between subjects was performed on the General Self-Esteem scores. The
results in Table 6.11 show that there was a significant main effect of country (F = 4.297;
p<0.05), and sex (F = 4.669, p<0.05), however, a 2-way interaction between country
and sex did not reach a significant level. The results indicate that English subjects have
significantly higher General Self-Esteem scores than the Turkish subjects, and male
subjects had significantly higher self-esteem scores than female subjects. A further
comparison revealed that English males had significantly higher General Self-Esteem
scores than Turkish males (t = 2.35, p<0.05 -see Table 6.4 in Appendix B-1), though
there were no significant differences between English and Turkish females (Table 6.5 in
Appendix B-1).
Table 6.10: English and Turkish Samples’ Means, Standard Deviation, Minimum, and Maximum Scores in General Self-Esteem
GENERAL SE CODE MEAN STD. DEV. MINIMUM MAXIMUM N
SEX MALE
COUNTRY ENGLISH 36.74 9.50 16 52 100
COUNTRY TURKISH 33.90 9.12 10 52 151
SEX FEMALE
COUNTRY ENGLISH 33.60 8.88 12 52 90
COUNTRY TURKISH 32.96 9.34 6 52 164
FOR ENTIRE SAMPLE 34.10 9.30 6 52 505
When sex differences were analysed between English and Turkish subjects as separate
samples, the results showed that English males had significantly higher mean scores
than English females (t = 2.34, p<0.05, see Table 6.6 in Appendix B-1). However, sex
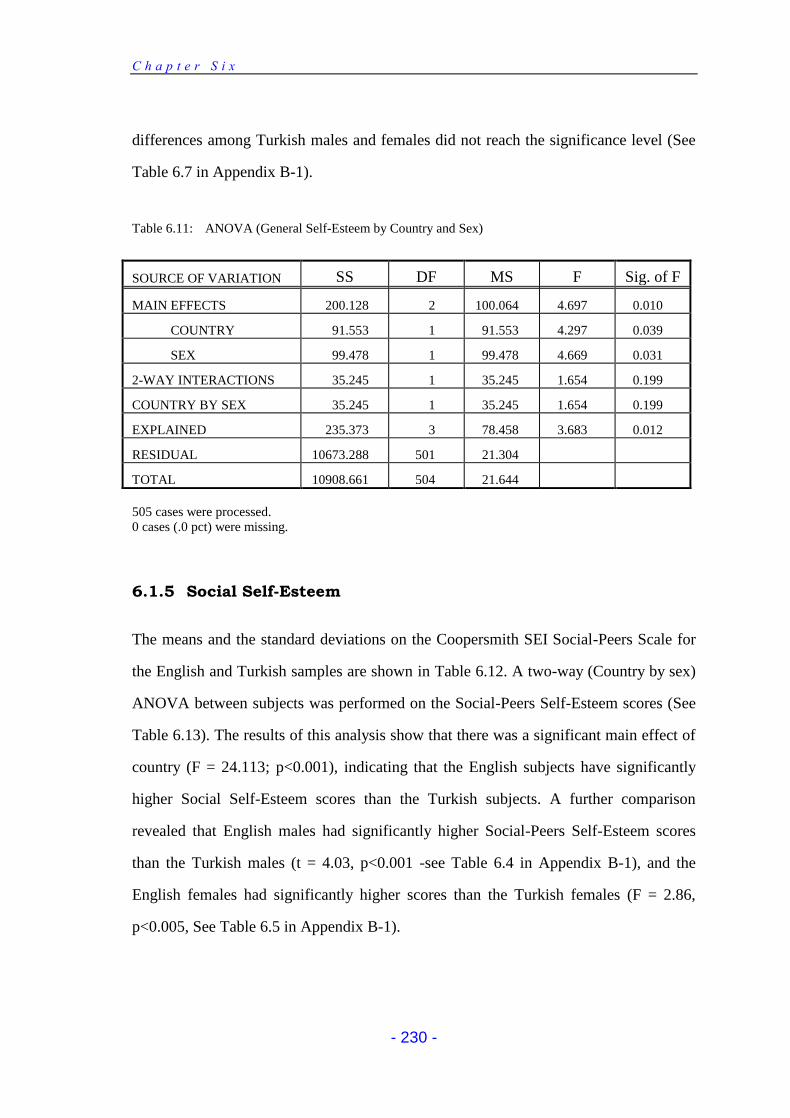
C h a p t e r S i x
- 230 -
differences among Turkish males and females did not reach the significance level (See
Table 6.7 in Appendix B-1).
Table 6.11: ANOVA (General Self-Esteem by Country and Sex)
SOURCE OF VARIATION SS DF MS F Sig. of F
MAIN EFFECTS 200.128 2 100.064 4.697 0.010
COUNTRY 91.553 1 91.553 4.297 0.039
SEX 99.478 1 99.478 4.669 0.031
2-WAY INTERACTIONS 35.245 1 35.245 1.654 0.199
COUNTRY BY SEX 35.245 1 35.245 1.654 0.199
EXPLAINED 235.373 3 78.458 3.683 0.012
RESIDUAL 10673.288 501 21.304
TOTAL 10908.661 504 21.644
505 cases were processed. 0 cases (.0 pct) were missing.
6.1.5 Social Self-Esteem
The means and the standard deviations on the Coopersmith SEI Social-Peers Scale for
the English and Turkish samples are shown in Table 6.12. A two-way (Country by sex)
ANOVA between subjects was performed on the Social-Peers Self-Esteem scores (See
Table 6.13). The results of this analysis show that there was a significant main effect of
country (F = 24.113; p<0.001), indicating that the English subjects have significantly
higher Social Self-Esteem scores than the Turkish subjects. A further comparison
revealed that English males had significantly higher Social-Peers Self-Esteem scores
than the Turkish males (t = 4.03, p<0.001 -see Table 6.4 in Appendix B-1), and the
English females had significantly higher scores than the Turkish females (F = 2.86,
p<0.005, See Table 6.5 in Appendix B-1).
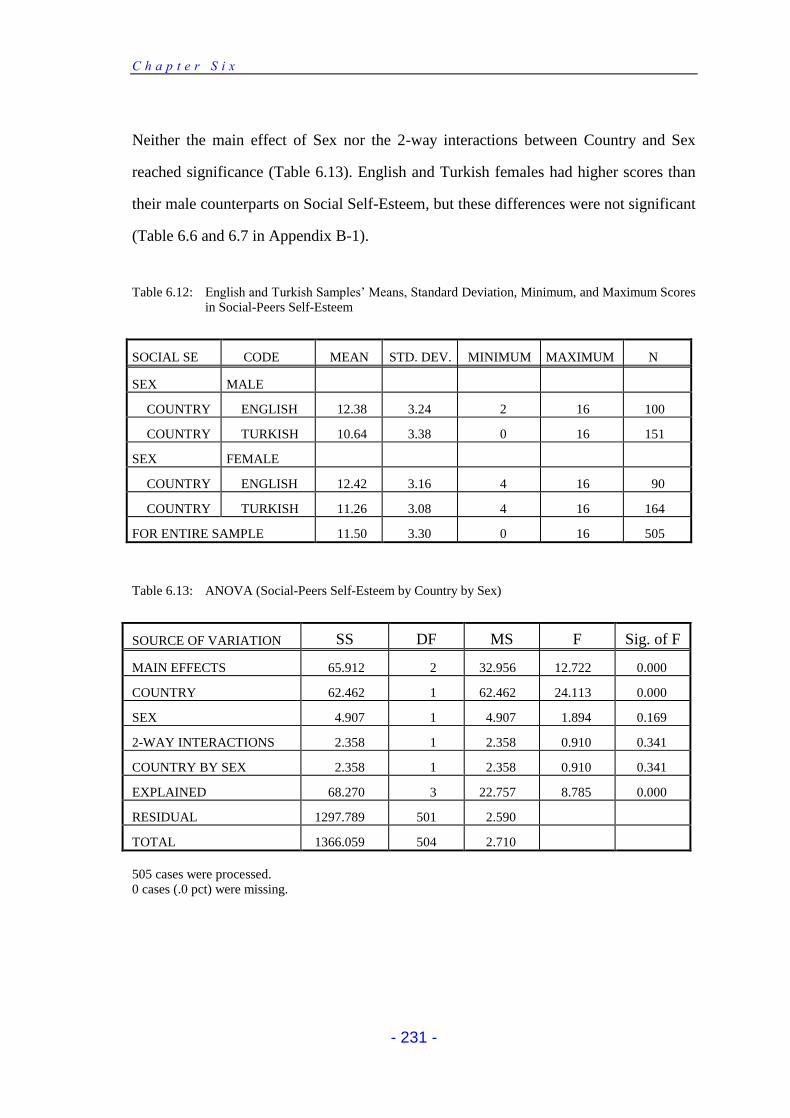
C h a p t e r S i x
- 231 -
Neither the main effect of Sex nor the 2-way interactions between Country and Sex
reached significance (Table 6.13). English and Turkish females had higher scores than
their male counterparts on Social Self-Esteem, but these differences were not significant
(Table 6.6 and 6.7 in Appendix B-1).
Table 6.12: English and Turkish Samples’ Means, Standard Deviation, Minimum, and Maximum Scores in Social-Peers Self-Esteem
SOCIAL SE CODE MEAN STD. DEV. MINIMUM MAXIMUM N
SEX MALE
COUNTRY ENGLISH 12.38 3.24 2 16 100
COUNTRY TURKISH 10.64 3.38 0 16 151
SEX FEMALE
COUNTRY ENGLISH 12.42 3.16 4 16 90
COUNTRY TURKISH 11.26 3.08 4 16 164
FOR ENTIRE SAMPLE 11.50 3.30 0 16 505
Table 6.13: ANOVA (Social-Peers Self-Esteem by Country by Sex)
SOURCE OF VARIATION SS DF MS F Sig. of F
MAIN EFFECTS 65.912 2 32.956 12.722 0.000
COUNTRY 62.462 1 62.462 24.113 0.000
SEX 4.907 1 4.907 1.894 0.169
2-WAY INTERACTIONS 2.358 1 2.358 0.910 0.341
COUNTRY BY SEX 2.358 1 2.358 0.910 0.341
EXPLAINED 68.270 3 22.757 8.785 0.000
RESIDUAL 1297.789 501 2.590
TOTAL 1366.059 504 2.710
505 cases were processed. 0 cases (.0 pct) were missing.
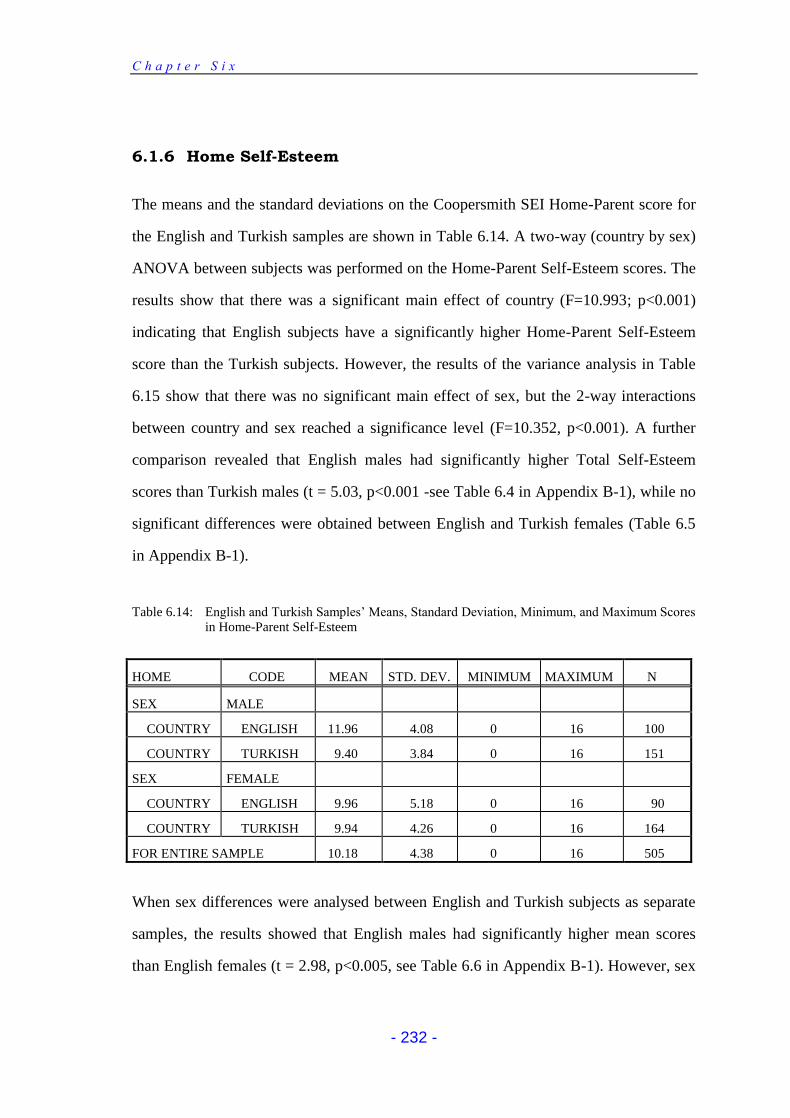
C h a p t e r S i x
- 232 -
6.1.6 Home Self-Esteem
The means and the standard deviations on the Coopersmith SEI Home-Parent score for
the English and Turkish samples are shown in Table 6.14. A two-way (country by sex)
ANOVA between subjects was performed on the Home-Parent Self-Esteem scores. The
results show that there was a significant main effect of country (F=10.993; p<0.001)
indicating that English subjects have a significantly higher Home-Parent Self-Esteem
score than the Turkish subjects. However, the results of the variance analysis in Table
6.15 show that there was no significant main effect of sex, but the 2-way interactions
between country and sex reached a significance level (F=10.352, p<0.001). A further
comparison revealed that English males had significantly higher Total Self-Esteem
scores than Turkish males (t = 5.03, p<0.001 -see Table 6.4 in Appendix B-1), while no
significant differences were obtained between English and Turkish females (Table 6.5
in Appendix B-1).
Table 6.14: English and Turkish Samples’ Means, Standard Deviation, Minimum, and Maximum Scores in Home-Parent Self-Esteem
HOME CODE MEAN STD. DEV. MINIMUM MAXIMUM N
SEX MALE
COUNTRY ENGLISH 11.96 4.08 0 16 100
COUNTRY TURKISH 9.40 3.84 0 16 151
SEX FEMALE
COUNTRY ENGLISH 9.96 5.18 0 16 90
COUNTRY TURKISH 9.94 4.26 0 16 164
FOR ENTIRE SAMPLE 10.18 4.38 0 16 505
When sex differences were analysed between English and Turkish subjects as separate
samples, the results showed that English males had significantly higher mean scores
than English females (t = 2.98, p<0.005, see Table 6.6 in Appendix B-1). However, sex
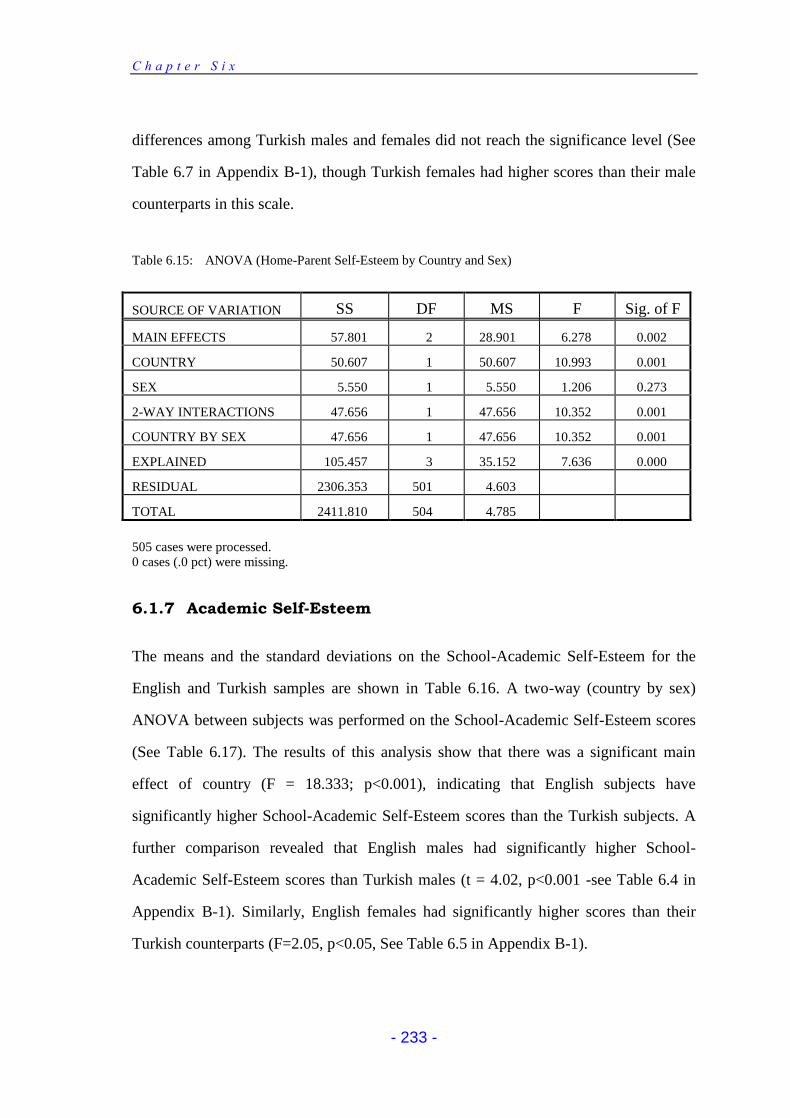
C h a p t e r S i x
- 233 -
differences among Turkish males and females did not reach the significance level (See
Table 6.7 in Appendix B-1), though Turkish females had higher scores than their male
counterparts in this scale.
Table 6.15: ANOVA (Home-Parent Self-Esteem by Country and Sex)
SOURCE OF VARIATION SS DF MS F Sig. of F
MAIN EFFECTS 57.801 2 28.901 6.278 0.002
COUNTRY 50.607 1 50.607 10.993 0.001
SEX 5.550 1 5.550 1.206 0.273
2-WAY INTERACTIONS 47.656 1 47.656 10.352 0.001
COUNTRY BY SEX 47.656 1 47.656 10.352 0.001
EXPLAINED 105.457 3 35.152 7.636 0.000
RESIDUAL 2306.353 501 4.603
TOTAL 2411.810 504 4.785
505 cases were processed. 0 cases (.0 pct) were missing.
6.1.7 Academic Self-Esteem
The means and the standard deviations on the School-Academic Self-Esteem for the
English and Turkish samples are shown in Table 6.16. A two-way (country by sex)
ANOVA between subjects was performed on the School-Academic Self-Esteem scores
(See Table 6.17). The results of this analysis show that there was a significant main
effect of country (F = 18.333; p<0.001), indicating that English subjects have
significantly higher School-Academic Self-Esteem scores than the Turkish subjects. A
further comparison revealed that English males had significantly higher School-
Academic Self-Esteem scores than Turkish males (t = 4.02, p<0.001 -see Table 6.4 in
Appendix B-1). Similarly, English females had significantly higher scores than their
Turkish counterparts (F=2.05, p<0.05, See Table 6.5 in Appendix B-1).
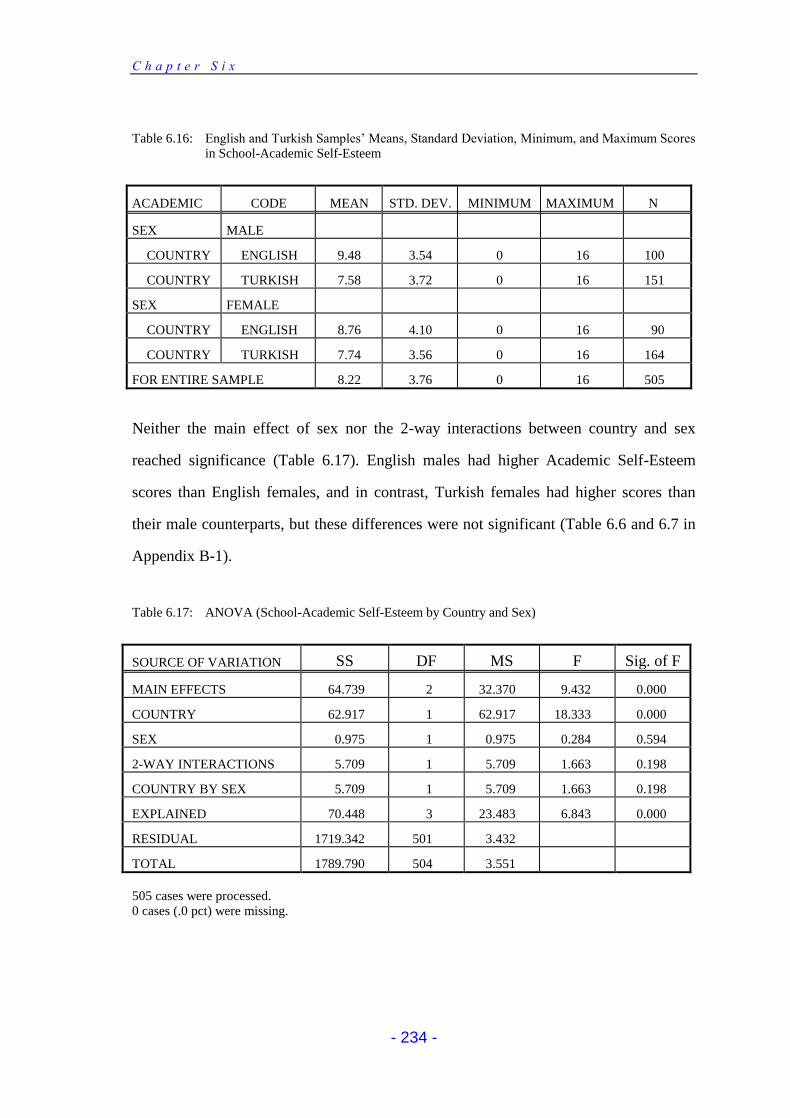
C h a p t e r S i x
- 234 -
Table 6.16: English and Turkish Samples’ Means, Standard Deviation, Minimum, and Maximum Scores in School-Academic Self-Esteem
ACADEMIC CODE MEAN STD. DEV. MINIMUM MAXIMUM N
SEX MALE
COUNTRY ENGLISH 9.48 3.54 0 16 100
COUNTRY TURKISH 7.58 3.72 0 16 151
SEX FEMALE
COUNTRY ENGLISH 8.76 4.10 0 16 90
COUNTRY TURKISH 7.74 3.56 0 16 164
FOR ENTIRE SAMPLE 8.22 3.76 0 16 505
Neither the main effect of sex nor the 2-way interactions between country and sex
reached significance (Table 6.17). English males had higher Academic Self-Esteem
scores than English females, and in contrast, Turkish females had higher scores than
their male counterparts, but these differences were not significant (Table 6.6 and 6.7 in
Appendix B-1).
Table 6.17: ANOVA (School-Academic Self-Esteem by Country and Sex)
SOURCE OF VARIATION SS DF MS F Sig. of F
MAIN EFFECTS 64.739 2 32.370 9.432 0.000
COUNTRY 62.917 1 62.917 18.333 0.000
SEX 0.975 1 0.975 0.284 0.594
2-WAY INTERACTIONS 5.709 1 5.709 1.663 0.198
COUNTRY BY SEX 5.709 1 5.709 1.663 0.198
EXPLAINED 70.448 3 23.483 6.843 0.000
RESIDUAL 1719.342 501 3.432
TOTAL 1789.790 504 3.551
505 cases were processed. 0 cases (.0 pct) were missing.
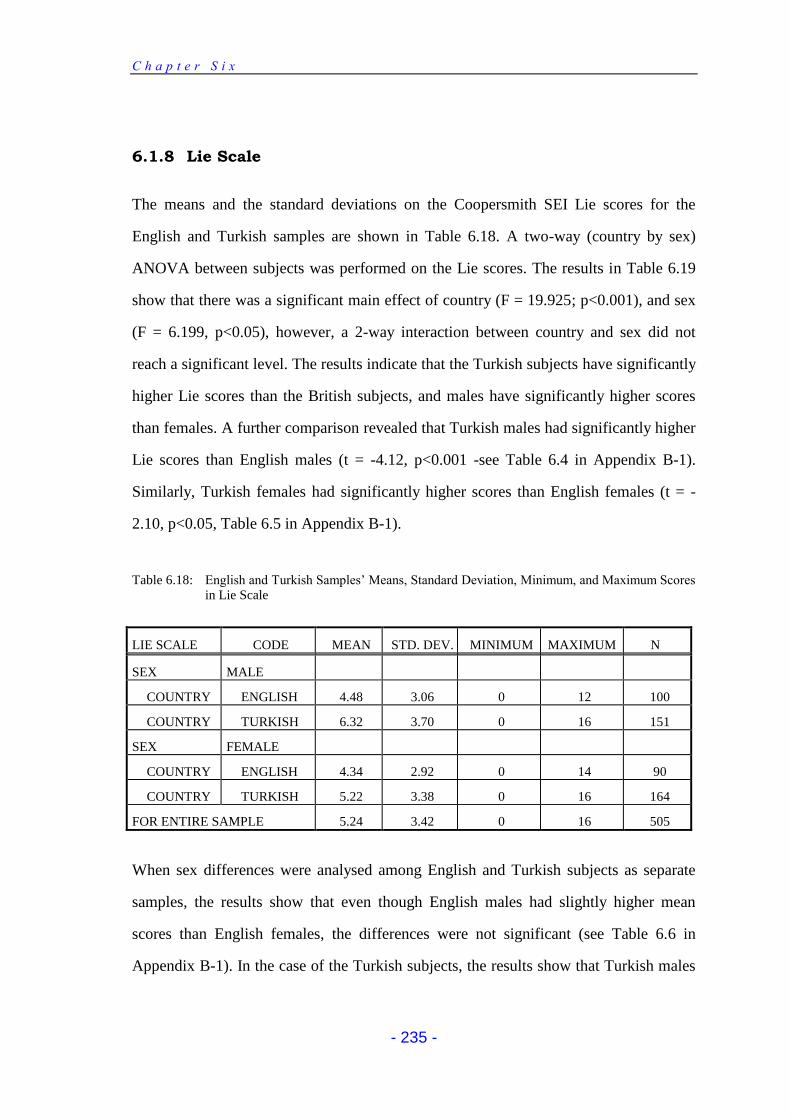
C h a p t e r S i x
- 235 -
6.1.8 Lie Scale
The means and the standard deviations on the Coopersmith SEI Lie scores for the
English and Turkish samples are shown in Table 6.18. A two-way (country by sex)
ANOVA between subjects was performed on the Lie scores. The results in Table 6.19
show that there was a significant main effect of country (F = 19.925; p<0.001), and sex
(F = 6.199, p<0.05), however, a 2-way interaction between country and sex did not
reach a significant level. The results indicate that the Turkish subjects have significantly
higher Lie scores than the British subjects, and males have significantly higher scores
than females. A further comparison revealed that Turkish males had significantly higher
Lie scores than English males (t = -4.12, p<0.001 -see Table 6.4 in Appendix B-1).
Similarly, Turkish females had significantly higher scores than English females (t = -
2.10, p<0.05, Table 6.5 in Appendix B-1).
Table 6.18: English and Turkish Samples’ Means, Standard Deviation, Minimum, and Maximum Scores in Lie Scale
LIE SCALE CODE MEAN STD. DEV. MINIMUM MAXIMUM N
SEX MALE
COUNTRY ENGLISH 4.48 3.06 0 12 100
COUNTRY TURKISH 6.32 3.70 0 16 151
SEX FEMALE
COUNTRY ENGLISH 4.34 2.92 0 14 90
COUNTRY TURKISH 5.22 3.38 0 16 164
FOR ENTIRE SAMPLE 5.24 3.42 0 16 505
When sex differences were analysed among English and Turkish subjects as separate
samples, the results show that even though English males had slightly higher mean
scores than English females, the differences were not significant (see Table 6.6 in
Appendix B-1). In the case of the Turkish subjects, the results show that Turkish males
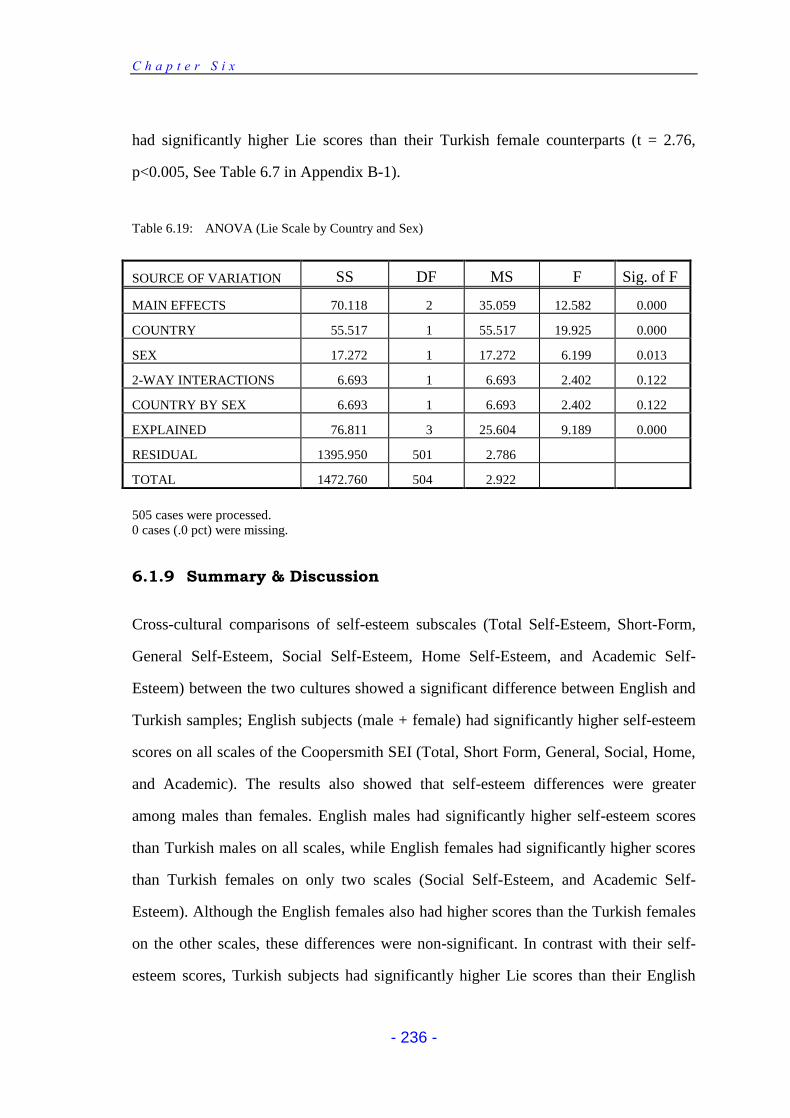
C h a p t e r S i x
- 236 -
had significantly higher Lie scores than their Turkish female counterparts (t = 2.76,
p<0.005, See Table 6.7 in Appendix B-1).
Table 6.19: ANOVA (Lie Scale by Country and Sex)
SOURCE OF VARIATION SS DF MS F Sig. of F
MAIN EFFECTS 70.118 2 35.059 12.582 0.000
COUNTRY 55.517 1 55.517 19.925 0.000
SEX 17.272 1 17.272 6.199 0.013
2-WAY INTERACTIONS 6.693 1 6.693 2.402 0.122
COUNTRY BY SEX 6.693 1 6.693 2.402 0.122
EXPLAINED 76.811 3 25.604 9.189 0.000
RESIDUAL 1395.950 501 2.786
TOTAL 1472.760 504 2.922
505 cases were processed. 0 cases (.0 pct) were missing.
6.1.9 Summary & Discussion
Cross-cultural comparisons of self-esteem subscales (Total Self-Esteem, Short-Form,
General Self-Esteem, Social Self-Esteem, Home Self-Esteem, and Academic Self-
Esteem) between the two cultures showed a significant difference between English and
Turkish samples; English subjects (male + female) had significantly higher self-esteem
scores on all scales of the Coopersmith SEI (Total, Short Form, General, Social, Home,
and Academic). The results also showed that self-esteem differences were greater
among males than females. English males had significantly higher self-esteem scores
than Turkish males on all scales, while English females had significantly higher scores
than Turkish females on only two scales (Social Self-Esteem, and Academic Self-
Esteem). Although the English females also had higher scores than the Turkish females
on the other scales, these differences were non-significant. In contrast with their self-
esteem scores, Turkish subjects had significantly higher Lie scores than their English
C h a p t e r S i x
- 237 -
counterparts. These significant cultural differences on the Lie scores were obtained not
only for the total samples, but also for males and females, indicating that the Turkish
subjects were more defensive with their answers than the English subjects.
In contrast to cultural differences, the results of the variance analysis revealed a lack of
main effects for gender (except General Self-Esteem). On the General Self-Esteem
scale, males (English + Turkish) had significantly higher self-esteem scores than
females. On most of the self-esteem scales (Total, Short-Form, Home, and Academic),
males had higher scores, while females had higher scores on only the Social Self-esteem
scale. However, the sex differences in all these scales did not reach the significance
level. When considering the sex differences on the Lie scale, males had significantly
higher scores than females, indicating that males had significantly more defensive
attitudes than their female counterparts. In general, the lack of sex differences in self-
esteem is consistent with previous findings, where similar results have also been
obtained (Coopersmith, 1959 and 1967; Piers & Harris, 1964; Maccoby & Jacklin,
1974; Wylie, 1979; Marsh et al., 1984; Abdallah, 1989a; Wilson & Fasko, 1992; Yong,
1994). Although in general, the results of ANOVA reveal no sex differences when both
the English and the Turkish samples were combined, sex differences nevertheless did
exist when the two samples were analysed separately. As seen in Table 6.6 (in
Appendix B-1) among English subjects, males had significantly higher self-esteem
scores than females on Total Self-Esteem, Short-Form, General Self-Esteem, and Home
Self-Esteem while no sex differences were found between Turkish males and females
on any of the self-esteem scales (see Table 6.7 in Appendix B-1).
Relating the findings of this study to other cross-cultural studies, Abdallah (1989a)
found that overall, English subjects had significantly higher self-esteem scores than
Arab subjects (p<0.01). They attained higher scores than Arabs in Total self-esteem, as
well as in Physical Appearance, in Trustworthiness, and in Positive Self-Worth. Arab
C h a p t e r S i x
- 238 -
students, however, had higher scores than their English counterparts in Negative Self-
Image. Bond & Cheung (1983) compared the self-concept of American, Japanese and
Hong Kong university students. The study revealed that of the seven category variables
tested, six (Self, Social, Choice, Aspiration, General Psychological Attribute and
Personal Facts) showed cultural effects at beyond the (p<0.01) level, however, there
were no cultural effects for the role category. The Japanese use of categories was
different from the American and Chinese, who showed similar levels of category
frequency. With the exception of the Social category, there were no significant
differences between American and Chinese (Hong Kong) subjects. Lerner et al., (1980)
found that Japanese youth had less favourable views of their bodies than American
youth. Olowu, (1983) found that English subjects had more positive self-concepts on all
the physical self-concept scales, and on most of the other subscales, than Nigerian
subjects, but the Nigerians had significantly more positive self-concepts on the religious
non-religious subscale. In a recent research, Bochner (1994) compared the self-concept
of Malaysian, Australian and British subjects. As predicted, the study revealed that the
self-concepts of the Malaysians were significantly more group anchored than those of
the British and the Australians. Malaysians were also significantly less individualist
than Australians. However, differences on individualism between the Malaysian and the
British were in the expected direction, but did not reach significance. The self-concept
of the Malaysians was significantly more group anchored, and less individualist, than
those of the combined Australian / British samples. As expected, there were no
significant differences between the self-references of the Australian and British groups
on either.
The results of this study provide some interesting cross-cultural comparisons
concerning the structure and the component of self-esteem in two cultures. The results
indicate that overall, English subjects had higher self-esteem than Turkish subjects.
Cross-cultural research in self-esteem does not reveal any past study comparing the self-

C h a p t e r S i x
- 239 -
esteem of English and Turkish subjects. The present researcher has not identified any
study comparing the self-esteem of Turkish subjects with subjects from another country.
Therefore, it is difficult to link the findings of this study with other studies.
However, year-11 Turkish secondary school students have lower self-esteem than their
English counterparts and this may be explained by the fact that they are under more
pressure than their English counterparts. The courses that year-11 school students take
are highly competitive in terms of being significant criteria for the University Entrance
Examination (UEE). School performance, particularly the result of the university
entrance exam is highly valued by society and parents, and high achievers are highly
respected among their peers and neighbours. Year-11 students who are in the last year
of secondary education, spend a great deal of time preparing themselves for the very
competitive the UEE exam. Therefore, the performance of students in school
hypothetically influences their levels of self-esteem and anxiety. Being able to pass the
UEE is very important for Turkish students and their families because the UEE has a
very high status in society. Therefore, nearly all secondary school leavers from all sorts
of secondary schools take part in this centralised exam, with the hope of entering
university. University education is important for all families of whatever social class,
for economic as well as prestigious reasons. Therefore a very high proportion of year-11
students take private courses to prepare themselves for this nation-wide exam. There is,
consequently, a great deal of pressure on students which comes not only from the
parents, but also from the dramatically increasing number of candidates who take part in
the exam. The number of candidates is sharply increasing every year. This is because of
the high number of new school leavers and also because previous candidates who failed
to gain a place at university in the past, repeat the exam. For example, in 1990, the
number of new school leavers who passed the exam was only 11% of all candidates.
The number of candidates who attended the exam had increased to over 1,200,000 in
1993. Consequently, the Turkish year 11 students are very vulnerable because of their
C h a p t e r S i x
- 240 -
families and society’s expectations and pressures. In line with the past studies, there is a
relationship between anxiety and low self-esteem (Coopersmith, 1967; Many & Many,
1975; Lundgreen & Schwab, 1977; Lundgreen, 1978). Although the English subjects
were GCSE students and were also under pressure, it was thought that the pressure of
the Turkish subjects was greater and that this might affect their self-esteem negatively.
Self-esteem differences may also be explained by the differences in social and religious
factors between the two samples. English subjects are considered to have more freedom
than Turkish subjects. Compared to a British family, the structure of a Turkish family is
quite strong, where parents or sometimes elder brothers or sisters may be authority
figures. Though the Eastern type of family does provide support and psychological
comfort for the child, on the other hand, parents’ over protective attitudes often obstruct
a child’s freedom and individuality. As a result, these attitudes often hinder the child’s
self-development, self-confidence and self-esteem.
Apart from the family, the school environment is another important area affecting a
child’s self-esteem. Although a child’s self-esteem may have been established in the
early years of childhood, it remains flexible during the school years. As self-esteem is
the product of social interaction and emerges as a result of the individual’s perception of
the responses of “significant others” to him or to her, there is reason to assume that the
school is the second institution after the family which determines the young individual’s
concept of himself and his attitudes of self acceptance or self rejection. However,
schools can be places for developing a negative self-concept and a low self-esteem as
well, because schools are the places where students face failure, rejection and daily
reminders of their limitations. The self-esteem differences obtained in this study may be
explained by the differences in teachers’ attitudes, teaching methods and also teachers’
self-esteem. However, these factors were not measured for the present study and
therefore, it is difficult to make a firm link between them.
C h a p t e r S i x
- 241 -
The result in this study which revealed self-esteem differences between the two
countries is not surprising, since some cultural, religious and social differences exist
between the two samples. Indeed, Mead (1934) put forward that the self is essentially a
social phenomenon. Self-esteem is an object which occurs in social interaction as a
consequence of the individual’s concern about how others react to him or her. It is non-
existent at birth, “but arises in the process of social experience ... through the
individual’s relations with the entire process and the individuals within the social
construct” (p. 139). From her point of view, it is not possible for self-esteem to be
formed outside the social experience. This is similar to Cooley’s (1902) idea. He
emphasised that “self and society are twin born ... and the notion of a separate and
independent ego is an illusion” (p. 5).
There are certain limitations in this study which should be discussed. First of all, the
two samples, English and Turkish, may be not representative of the student population
in their countries. In fact to be able to obtain valid and reliable results while
investigating cultural or national differences, one of the most important aspects of
cross-cultural methodology is to ensure that both subjects are valid representatives of
their culture. As Fawcett & Bornstein (1973) point out, simply taking two samples from
two different countries or cultures or even within the same country is not sufficient for
obtaining matched equivalent samples. Secondly, the use of instruments in cross-
cultural comparisons and research has the recognised limitation that questions may have
different meanings in different cultures. Since the English and Turkish samples
represent two cultures, there are obviously some remarkable differences in culture,
social life, language, and religion. In spite of its limitations, however the findings of this
study may yield valuable information regarding different cultural groups.
In the case of sex difference, it was hypothesised that the self-esteem of English males
and females would not differ, however, this expectation was not confirmed by the
C h a p t e r S i x
- 242 -
findings of the present study. The results revealed that the self-esteem of English
students was higher than their female counterparts. The finding of this study support the
findings of Louden, 1977; Bagley, Mallick, & Verma, 1979; Lee, 1986. All these
studies found that the self-esteem of boys was significantly higher than the girls.
However, the finding of the present study do not support the findings of Moore, 1980;
Lok, 1983; Abdallah, 1989a; Lalkhen & Norwich, 1990. These studies found no
differences between the self-esteem of boys and girls. However, Cassidy (1991)
obtained mixed results. The author found sex differences in favour of males in one
group, while he obtained no sex differences for another sample. As far as the past
British studies were concerned, none of the eight that were reviewed found that the self-
esteem of girls was higher than the boys. Therefore, it could be said that the finding of
this study are not unexpected. In many societies and cultures, it is commonly
acknowledged that men and women are expected to perform different roles and have
different attitudes and functions. Although Carlson (1965) suggests that self-esteem is a
relatively stable dimension of self and is independent of the sex role, some social
theorists argue that it is the socialisation process that guides men and women in
different directions (Rosenberg & Simmons, 1975). They assume that females will have
lower self-esteem than males because of the expectation of society, such as the
promotion of the male image as superior, beliefs in the inferiority of females and so on,
which all undermine the female identity (Skaalvik, 1986). According to Freeman (1970)
the inferior social status of women is generally reflected in low self-esteem.
In view of relatively stronger sex role divisions in Turkish society, it could be expected
that there would be significant differences in self-esteem between males and females in
the Turkish sample. However, for this study, it was hypothesised that there would be no
major sex differences in self-esteem. This hypothesis is mainly based on the findings of
past Turkish studies which investigated sex differences in self-esteem. The majority of
these revealed no differences between the self-esteem scores of boys and girls.
C h a p t e r S i x
- 243 -
Similarly, the present study also revealed no differences between the self-esteem of
Turkish boys and girls. The absence of any sex difference in self-esteem for the Turkish
subjects, in this study, might perhaps be attributable to the changes in Turkish society,
since the early years of the Kemalist secular regime that replaced the Ottoman rule. In
fact, compared to their counterparts in other developing countries, especially those in
the Muslim world, Turkish women have enjoyed considerable civil and political rights
and have been more visible in the public domain. As early as the 1920s, they gained
several legal rights including the right to choose their own spouses, initiate divorce and
to demand child custody. Elementary education was made mandatory and free for both
sexes in 1923. In the 1930s, women were granted certain political rights: the right to
vote and run for election in municipal elections in 1930, and in national elections in
1934. Consequently, many women in Turkey gained access to education, public office,
and employment opportunities comparable to those in industrialised countries, although
not equally enjoyed by the whole female population (Arat, 1994). The statistical
indicators of female representation among professionals in Turkey have been more
impressive than those in many Western countries. Figures from the 1970s indicate that
one in every five lawyers and one in every six doctors in Turkey was a woman (Öncü,
1982, 253), and Turkey ranked third, following the United States and Canada, among all
countries in the world (not including the former Eastern Block nations) in recruiting
women into academia (Cosar, 1978). The establishment of co-education in the Turkish
education system also goes back as early as the first years of the Republic. Though co-
education was established at primary education and university levels earlier, co-
education in the middle schools was only initiated during the 1927-1928 academic year
(Tan, 1981, 18). These changes have meant that Turkish women have become much
more aware of the need for change in traditional sex role stereotyped social roles. It has
to be emphasised that the gap between men and women is greater among the rural and
lower classes, compared to the urban, upper and middle classes. As Arat (1994) points
C h a p t e r S i x
- 244 -
out, reforms in women’s rights have been ineffective or have had only a modest impact,
especially in rural areas, owing to the dominance of conservative groups. No self-
esteem differences between Turkish males and females may be interpreted in terms of
the subjects belonging to mainly middle and upper class families in Ankara (the capital
city, and the second biggest city after Istanbul), which may weaken the gap between
men and women. All of these factors in conjunction may explain the absence of sex
differences in the present sample. The findings of this study also support previous
studies in Turkey. In contrast to what was expected, sex differences among Turkish
subjects in favour of boys were found to be absent in all but one study (Özogul, 1988).
The ten previous Turkish studies failed to find sex differences between the self-esteem
scores of Turkish boys and girls (Koyuncu, 1979; Onur, 1981; Serifi, 1985; Can, 1986;
Dogusal, 1987; Süzen, 1987; Yurdagül, 1987; Güçray, 1989; Türkmen, 1989; and
Ersek, 1992). However, when these studies the present study were examined, it could be
seen that nearly all of them were conducted either in Ankara or Istanbul. Therefore, the
findings may not truly represent the whole of Turkey. This is because the sex roles of
women are very different in rural areas and in the Eastern part of the country. Therefore,
any firm conclusion should be avoided.
6.1.10 Conclusion
It was hypothesised that the self-esteem of the English sample would be higher than the
Turkish sample. The results of this study confirm the prediction. The study revealed that
overall, the English subjects had significantly higher self-esteem than the Turkish
subjects. These differences were found to be greater among males than among females.
It was also hypothesised that there would be no sex differences in self-esteem for the
English as well as for the Turkish samples. This hypothesis was partially supported. The
results showed that while self-esteem of the Turkish males and females did not
C h a p t e r S i x
- 245 -
significantly differ, the self-esteem of English boys was significantly higher than their
female counterparts.
6.2 CROSS-CULTURAL COMPARISONS OF LOCUS OF CONTROL
6.2.1 Introduction
This section reports on cross-cultural comparisons (British versus Turkish) using scores
on global and academic locus of control. Students’ global locus of control were
evaluated by using the Nowicki-Strickland Internal-External Control Scale. In order to
evaluate their academic locus of control, Crandall et al.’s Intellectual Achievement
Responsibility Scale (IAR) was used. The 2 X 2 (Culture = English, Turkish; and Sex =
male, female) analysis of variance tables, and the tables showing group means, standard
deviation, minimum and maximum scores of subjects on the global and academic locus
of control, are presented in this section, but the t-test tables for group comparisons are
reported in Appendix B (2). The results for the different areas are reported separately,
but all findings are discussed together at the end of the section. Finally, the results of the
hypotheses which related to this section are summarised, as follows:
Hypothesis 1: The English subjects would be more internally oriented in their global
locus of control than their Turkish counterparts.
Hypothesis 2: The English subjects would be more internally oriented in their
academic locus of control than their Turkish counterparts.
Hypothesis 3: There would be no sex differences in global locus of control for either
the Turkish or the English subjects.
Hypothesis 4: There would be no sex differences in academic locus of control for
either he Turkish or the English subjects.
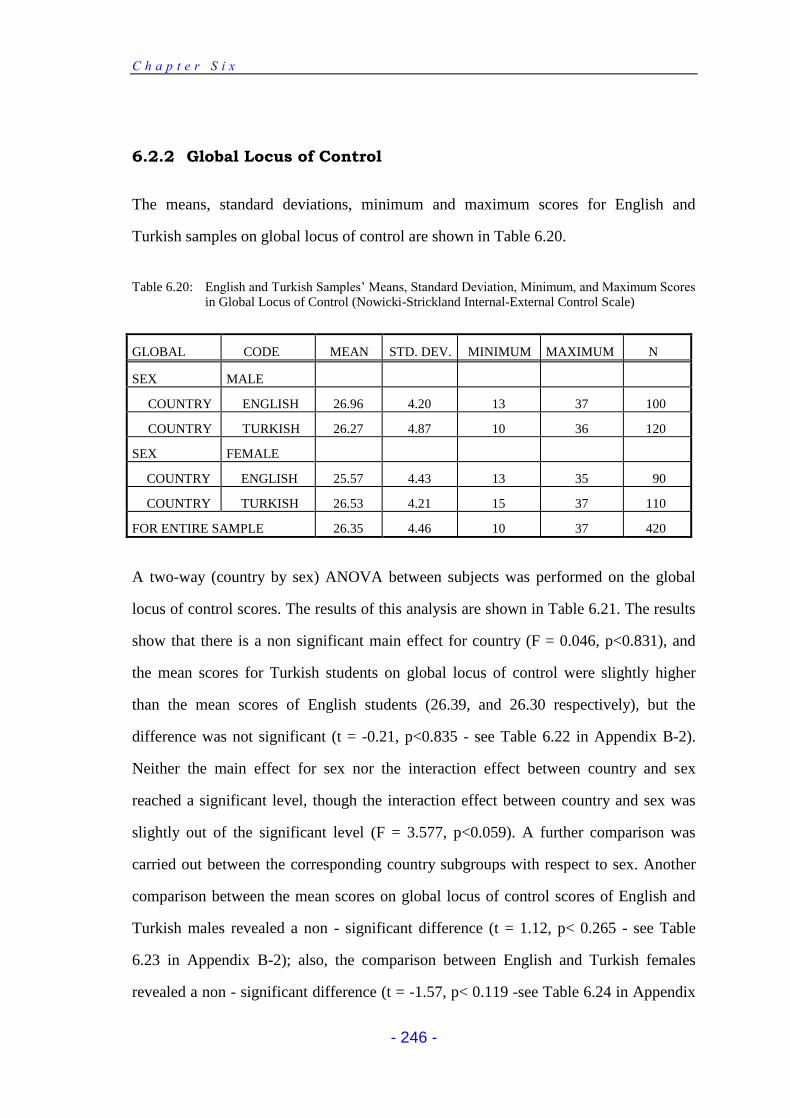
C h a p t e r S i x
- 246 -
6.2.2 Global Locus of Control
The means, standard deviations, minimum and maximum scores for English and
Turkish samples on global locus of control are shown in Table 6.20.
Table 6.20: English and Turkish Samples’ Means, Standard Deviation, Minimum, and Maximum Scores in Global Locus of Control (Nowicki-Strickland Internal-External Control Scale)
GLOBAL CODE MEAN STD. DEV. MINIMUM MAXIMUM N
SEX MALE
COUNTRY ENGLISH 26.96 4.20 13 37 100
COUNTRY TURKISH 26.27 4.87 10 36 120
SEX FEMALE
COUNTRY ENGLISH 25.57 4.43 13 35 90
COUNTRY TURKISH 26.53 4.21 15 37 110
FOR ENTIRE SAMPLE 26.35 4.46 10 37 420
A two-way (country by sex) ANOVA between subjects was performed on the global
locus of control scores. The results of this analysis are shown in Table 6.21. The results
show that there is a non significant main effect for country (F = 0.046, p<0.831), and
the mean scores for Turkish students on global locus of control were slightly higher
than the mean scores of English students (26.39, and 26.30 respectively), but the
difference was not significant (t = -0.21, p<0.835 - see Table 6.22 in Appendix B-2).
Neither the main effect for sex nor the interaction effect between country and sex
reached a significant level, though the interaction effect between country and sex was
slightly out of the significant level (F = 3.577, p<0.059). A further comparison was
carried out between the corresponding country subgroups with respect to sex. Another
comparison between the mean scores on global locus of control scores of English and
Turkish males revealed a non - significant difference (t = 1.12, p< 0.265 - see Table
6.23 in Appendix B-2); also, the comparison between English and Turkish females
revealed a non - significant difference (t = -1.57, p< 0.119 -see Table 6.24 in Appendix
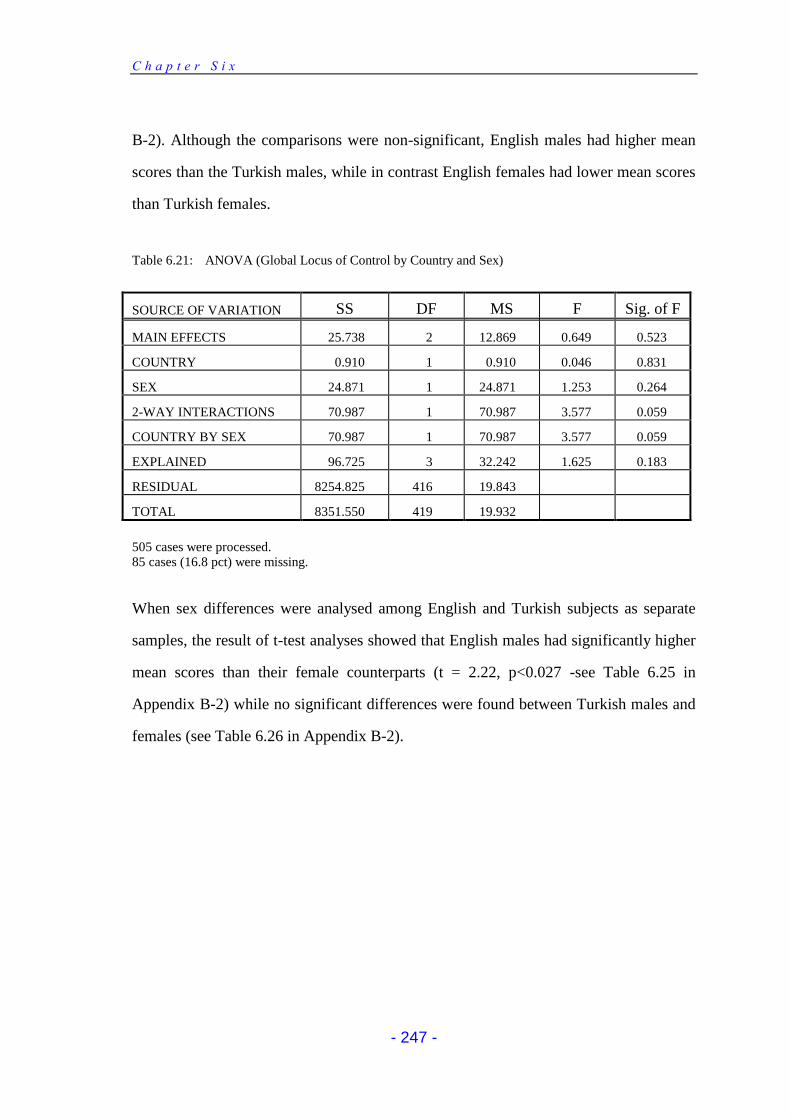
C h a p t e r S i x
- 247 -
B-2). Although the comparisons were non-significant, English males had higher mean
scores than the Turkish males, while in contrast English females had lower mean scores
than Turkish females.
Table 6.21: ANOVA (Global Locus of Control by Country and Sex)
SOURCE OF VARIATION SS DF MS F Sig. of F
MAIN EFFECTS 25.738 2 12.869 0.649 0.523
COUNTRY 0.910 1 0.910 0.046 0.831
SEX 24.871 1 24.871 1.253 0.264
2-WAY INTERACTIONS 70.987 1 70.987 3.577 0.059
COUNTRY BY SEX 70.987 1 70.987 3.577 0.059
EXPLAINED 96.725 3 32.242 1.625 0.183
RESIDUAL 8254.825 416 19.843
TOTAL 8351.550 419 19.932
505 cases were processed. 85 cases (16.8 pct) were missing.
When sex differences were analysed among English and Turkish subjects as separate
samples, the result of t-test analyses showed that English males had significantly higher
mean scores than their female counterparts (t = 2.22, p<0.027 -see Table 6.25 in
Appendix B-2) while no significant differences were found between Turkish males and
females (see Table 6.26 in Appendix B-2).
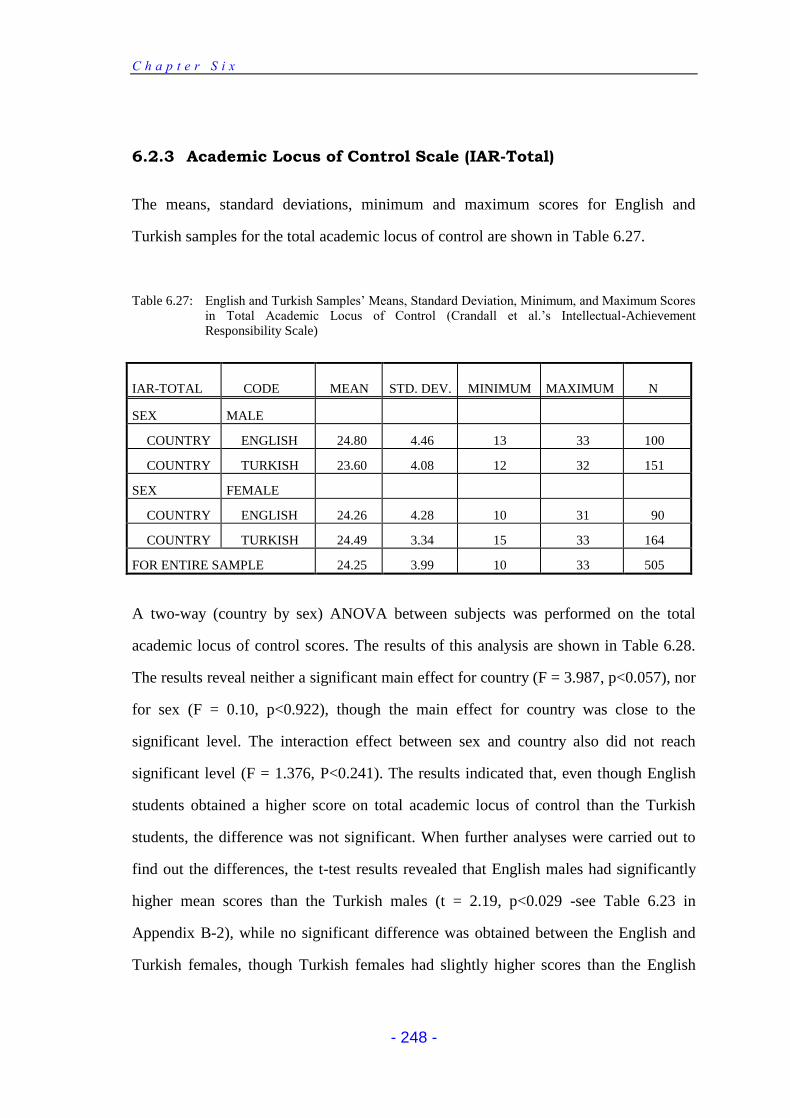
C h a p t e r S i x
- 248 -
6.2.3 Academic Locus of Control Scale (IAR-Total)
The means, standard deviations, minimum and maximum scores for English and
Turkish samples for the total academic locus of control are shown in Table 6.27.
Table 6.27: English and Turkish Samples’ Means, Standard Deviation, Minimum, and Maximum Scores in Total Academic Locus of Control (Crandall et al.’s Intellectual-Achievement Responsibility Scale)
IAR-TOTAL CODE MEAN STD. DEV. MINIMUM MAXIMUM N
SEX MALE
COUNTRY ENGLISH 24.80 4.46 13 33 100
COUNTRY TURKISH 23.60 4.08 12 32 151
SEX FEMALE
COUNTRY ENGLISH 24.26 4.28 10 31 90
COUNTRY TURKISH 24.49 3.34 15 33 164
FOR ENTIRE SAMPLE 24.25 3.99 10 33 505
A two-way (country by sex) ANOVA between subjects was performed on the total
academic locus of control scores. The results of this analysis are shown in Table 6.28.
The results reveal neither a significant main effect for country (F = 3.987, p<0.057), nor
for sex (F = 0.10, p<0.922), though the main effect for country was close to the
significant level. The interaction effect between sex and country also did not reach
significant level (F = 1.376, P<0.241). The results indicated that, even though English
students obtained a higher score on total academic locus of control than the Turkish
students, the difference was not significant. When further analyses were carried out to
find out the differences, the t-test results revealed that English males had significantly
higher mean scores than the Turkish males (t = 2.19, p<0.029 -see Table 6.23 in
Appendix B-2), while no significant difference was obtained between the English and
Turkish females, though Turkish females had slightly higher scores than the English
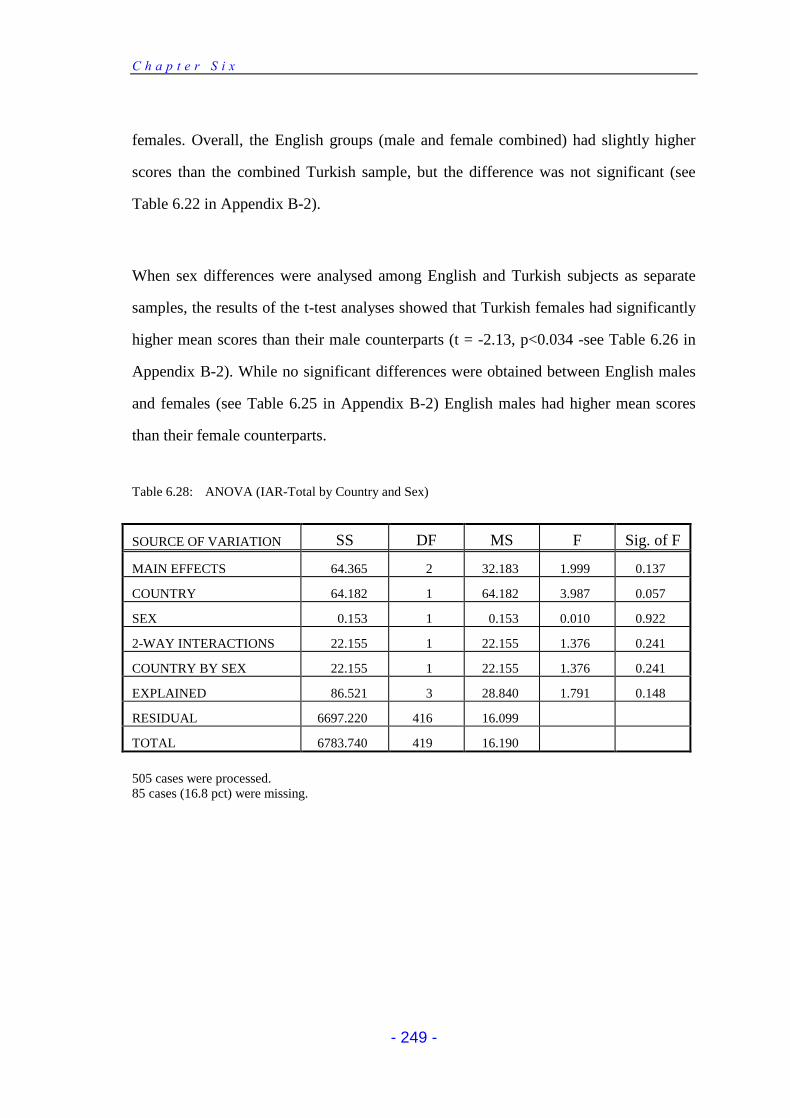
C h a p t e r S i x
- 249 -
females. Overall, the English groups (male and female combined) had slightly higher
scores than the combined Turkish sample, but the difference was not significant (see
Table 6.22 in Appendix B-2).
When sex differences were analysed among English and Turkish subjects as separate
samples, the results of the t-test analyses showed that Turkish females had significantly
higher mean scores than their male counterparts (t = -2.13, p<0.034 -see Table 6.26 in
Appendix B-2). While no significant differences were obtained between English males
and females (see Table 6.25 in Appendix B-2) English males had higher mean scores
than their female counterparts.
Table 6.28: ANOVA (IAR-Total by Country and Sex)
SOURCE OF VARIATION SS DF MS F Sig. of F
MAIN EFFECTS 64.365 2 32.183 1.999 0.137
COUNTRY 64.182 1 64.182 3.987 0.057
SEX 0.153 1 0.153 0.010 0.922
2-WAY INTERACTIONS 22.155 1 22.155 1.376 0.241
COUNTRY BY SEX 22.155 1 22.155 1.376 0.241
EXPLAINED 86.521 3 28.840 1.791 0.148
RESIDUAL 6697.220 416 16.099
TOTAL 6783.740 419 16.190
505 cases were processed. 85 cases (16.8 pct) were missing.
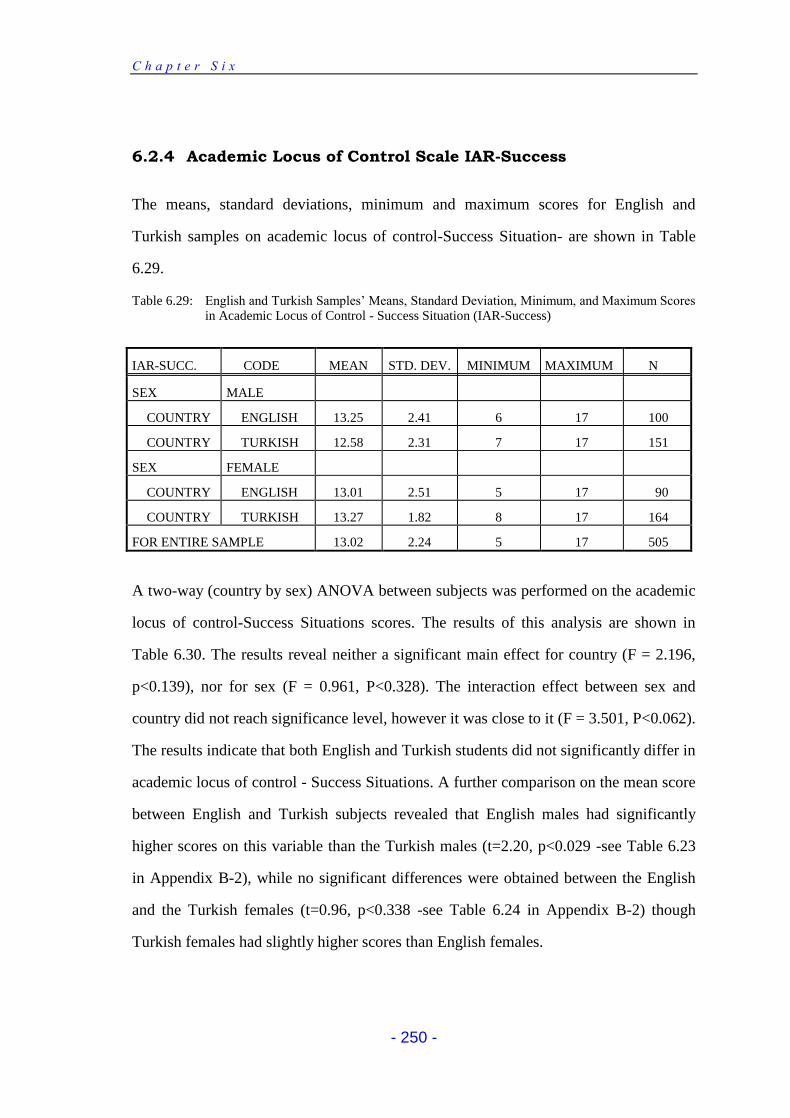
C h a p t e r S i x
- 250 -
6.2.4 Academic Locus of Control Scale IAR-Success
The means, standard deviations, minimum and maximum scores for English and
Turkish samples on academic locus of control-Success Situation- are shown in Table
6.29.
Table 6.29: English and Turkish Samples’ Means, Standard Deviation, Minimum, and Maximum Scores in Academic Locus of Control - Success Situation (IAR-Success)
IAR-SUCC. CODE MEAN STD. DEV. MINIMUM MAXIMUM N
SEX MALE
COUNTRY ENGLISH 13.25 2.41 6 17 100
COUNTRY TURKISH 12.58 2.31 7 17 151
SEX FEMALE
COUNTRY ENGLISH 13.01 2.51 5 17 90
COUNTRY TURKISH 13.27 1.82 8 17 164
FOR ENTIRE SAMPLE 13.02 2.24 5 17 505
A two-way (country by sex) ANOVA between subjects was performed on the academic
locus of control-Success Situations scores. The results of this analysis are shown in
Table 6.30. The results reveal neither a significant main effect for country (F = 2.196,
p<0.139), nor for sex (F = 0.961, P<0.328). The interaction effect between sex and
country did not reach significance level, however it was close to it (F = 3.501, P<0.062).
The results indicate that both English and Turkish students did not significantly differ in
academic locus of control - Success Situations. A further comparison on the mean score
between English and Turkish subjects revealed that English males had significantly
higher scores on this variable than the Turkish males (t=2.20, p<0.029 -see Table 6.23
in Appendix B-2), while no significant differences were obtained between the English
and the Turkish females (t=0.96, p<0.338 -see Table 6.24 in Appendix B-2) though
Turkish females had slightly higher scores than English females.
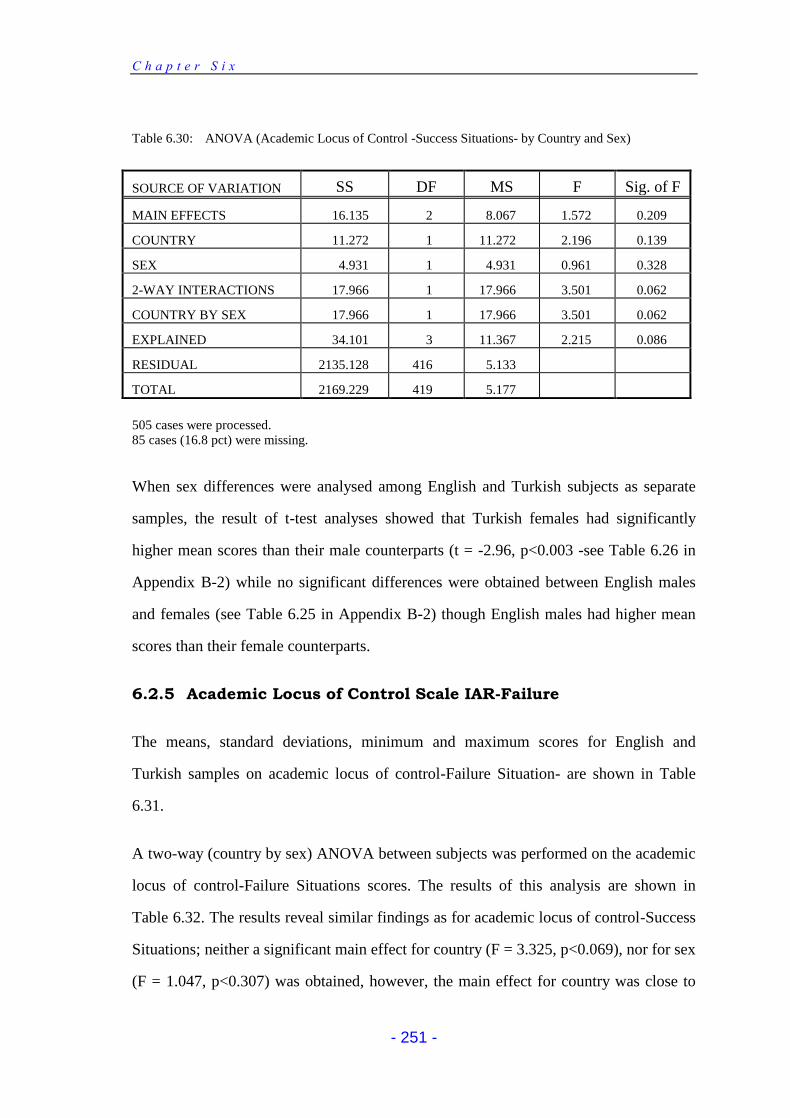
C h a p t e r S i x
- 251 -
Table 6.30: ANOVA (Academic Locus of Control -Success Situations- by Country and Sex)
SOURCE OF VARIATION SS DF MS F Sig. of F
MAIN EFFECTS 16.135 2 8.067 1.572 0.209
COUNTRY 11.272 1 11.272 2.196 0.139
SEX 4.931 1 4.931 0.961 0.328
2-WAY INTERACTIONS 17.966 1 17.966 3.501 0.062
COUNTRY BY SEX 17.966 1 17.966 3.501 0.062
EXPLAINED 34.101 3 11.367 2.215 0.086
RESIDUAL 2135.128 416 5.133
TOTAL 2169.229 419 5.177
505 cases were processed. 85 cases (16.8 pct) were missing.
When sex differences were analysed among English and Turkish subjects as separate
samples, the result of t-test analyses showed that Turkish females had significantly
higher mean scores than their male counterparts (t = -2.96, p<0.003 -see Table 6.26 in
Appendix B-2) while no significant differences were obtained between English males
and females (see Table 6.25 in Appendix B-2) though English males had higher mean
scores than their female counterparts.
6.2.5 Academic Locus of Control Scale IAR-Failure
The means, standard deviations, minimum and maximum scores for English and
Turkish samples on academic locus of control-Failure Situation- are shown in Table
6.31.
A two-way (country by sex) ANOVA between subjects was performed on the academic
locus of control-Failure Situations scores. The results of this analysis are shown in
Table 6.32. The results reveal similar findings as for academic locus of control-Success
Situations; neither a significant main effect for country (F = 3.325, p<0.069), nor for sex
(F = 1.047, p<0.307) was obtained, however, the main effect for country was close to
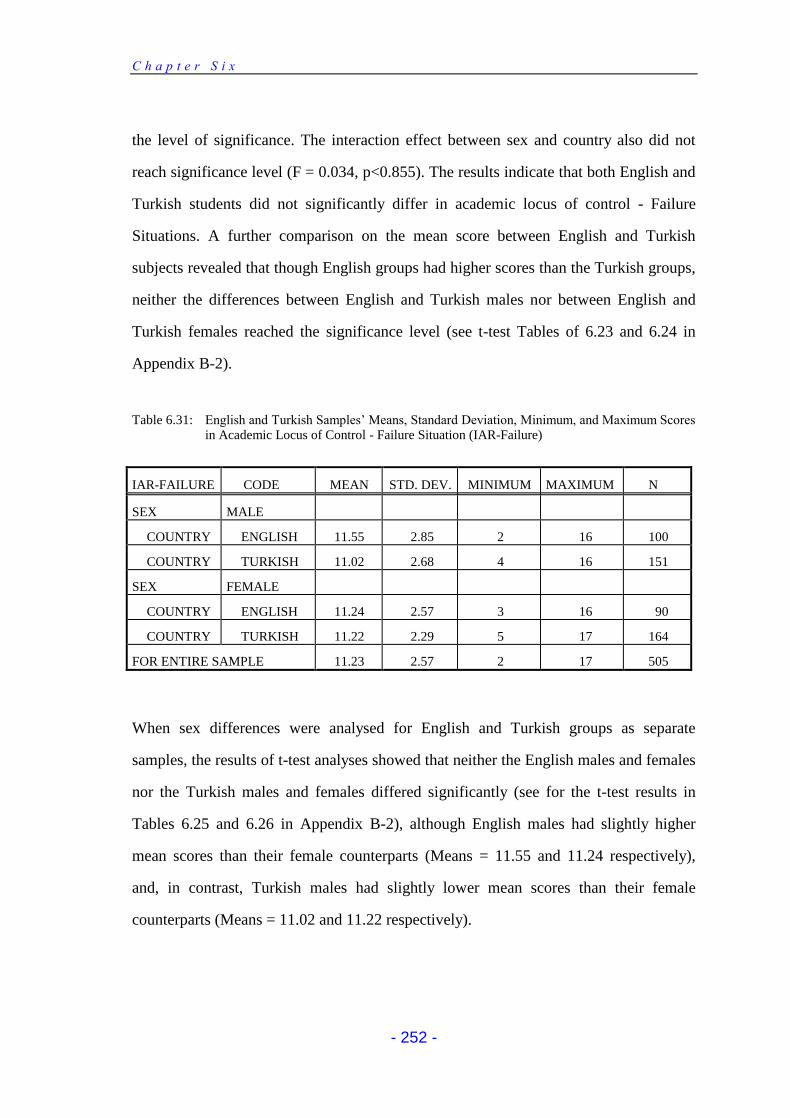
C h a p t e r S i x
- 252 -
the level of significance. The interaction effect between sex and country also did not
reach significance level (F = 0.034, p<0.855). The results indicate that both English and
Turkish students did not significantly differ in academic locus of control - Failure
Situations. A further comparison on the mean score between English and Turkish
subjects revealed that though English groups had higher scores than the Turkish groups,
neither the differences between English and Turkish males nor between English and
Turkish females reached the significance level (see t-test Tables of 6.23 and 6.24 in
Appendix B-2).
Table 6.31: English and Turkish Samples’ Means, Standard Deviation, Minimum, and Maximum Scores in Academic Locus of Control - Failure Situation (IAR-Failure)
IAR-FAILURE CODE MEAN STD. DEV. MINIMUM MAXIMUM N
SEX MALE
COUNTRY ENGLISH 11.55 2.85 2 16 100
COUNTRY TURKISH 11.02 2.68 4 16 151
SEX FEMALE
COUNTRY ENGLISH 11.24 2.57 3 16 90
COUNTRY TURKISH 11.22 2.29 5 17 164
FOR ENTIRE SAMPLE 11.23 2.57 2 17 505
When sex differences were analysed for English and Turkish groups as separate
samples, the results of t-test analyses showed that neither the English males and females
nor the Turkish males and females differed significantly (see for the t-test results in
Tables 6.25 and 6.26 in Appendix B-2), although English males had slightly higher
mean scores than their female counterparts (Means = 11.55 and 11.24 respectively),
and, in contrast, Turkish males had slightly lower mean scores than their female
counterparts (Means = 11.02 and 11.22 respectively).
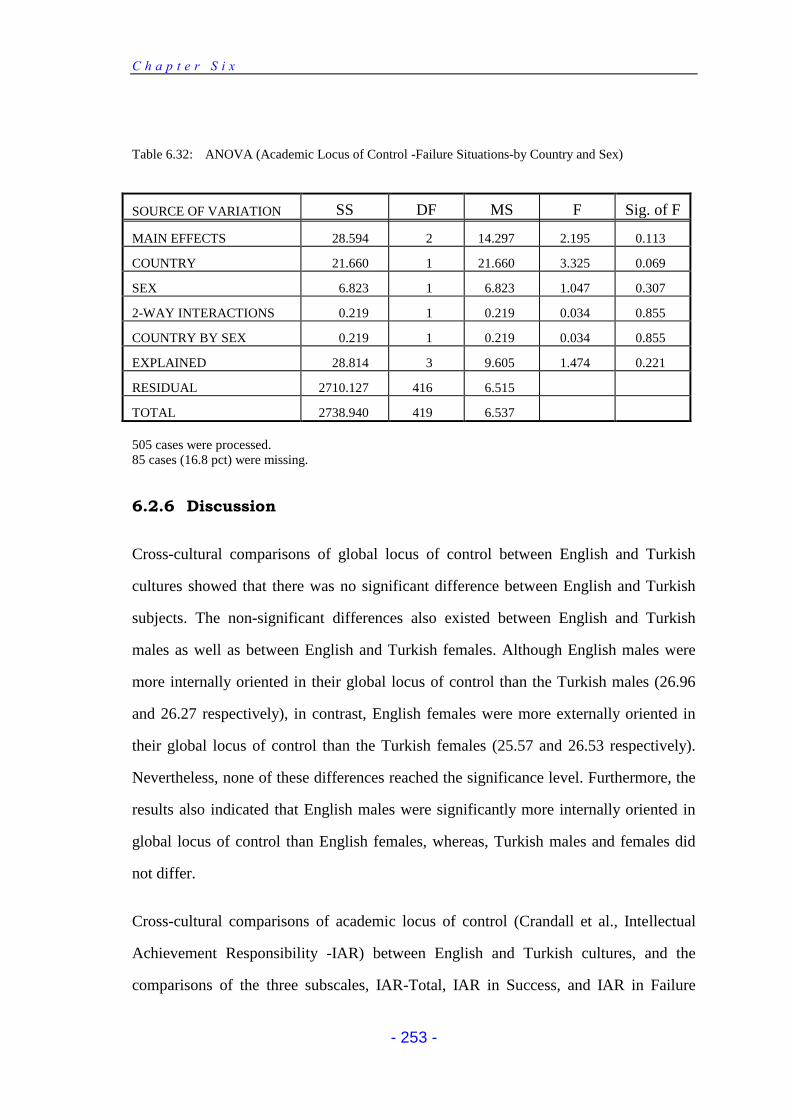
C h a p t e r S i x
- 253 -
Table 6.32: ANOVA (Academic Locus of Control -Failure Situations-by Country and Sex)
SOURCE OF VARIATION SS DF MS F Sig. of F
MAIN EFFECTS 28.594 2 14.297 2.195 0.113
COUNTRY 21.660 1 21.660 3.325 0.069
SEX 6.823 1 6.823 1.047 0.307
2-WAY INTERACTIONS 0.219 1 0.219 0.034 0.855
COUNTRY BY SEX 0.219 1 0.219 0.034 0.855
EXPLAINED 28.814 3 9.605 1.474 0.221
RESIDUAL 2710.127 416 6.515
TOTAL 2738.940 419 6.537
505 cases were processed. 85 cases (16.8 pct) were missing.
6.2.6 Discussion
Cross-cultural comparisons of global locus of control between English and Turkish
cultures showed that there was no significant difference between English and Turkish
subjects. The non-significant differences also existed between English and Turkish
males as well as between English and Turkish females. Although English males were
more internally oriented in their global locus of control than the Turkish males (26.96
and 26.27 respectively), in contrast, English females were more externally oriented in
their global locus of control than the Turkish females (25.57 and 26.53 respectively).
Nevertheless, none of these differences reached the significance level. Furthermore, the
results also indicated that English males were significantly more internally oriented in
global locus of control than English females, whereas, Turkish males and females did
not differ.
Cross-cultural comparisons of academic locus of control (Crandall et al., Intellectual
Achievement Responsibility -IAR) between English and Turkish cultures, and the
comparisons of the three subscales, IAR-Total, IAR in Success, and IAR in Failure

C h a p t e r S i x
- 254 -
situations scores, also showed that there was no significant differences between English
and Turkish students. Although English and Turkish samples did not significantly differ
in any of the academic locus of control scales, English students had higher scores than
Turkish students in all three of the scales, indicating that the English students tended to
be slightly more internal than the Turkish students in the attribution of their success and
failure. When English and Turkish males and females were compared, the results
showed that, although there were no significant differences between English and
Turkish females in any of the academic locus of control scales, English males were
more internal than the Turkish males in IAR-Total, and IAR-Success, while no
significant difference was obtained in the IAR-Failure for males. Furthermore, the
results also indicated that Turkish females were more internal than Turkish males in all
the three academic locus of control scales, but these differences were significant only in
the IAR-Total, and the IAR-Success scales, indicating that Turkish female students
tended to be more internal in general academic situations and in the attribution of their
success, whereas, English males and females did not significantly differ in any of these
scales, although males had higher scores.
Traditionally, Turkey has been regarded as a vertical society, with great importance
attached to group solidarity, deference to all forms of authority, and loyalty to tradition.
Anthropological and psychological studies have characterised traditional culture as a
group-oriented culture, with tightly knit social networks and little place for personal
initiative (Kagıtçıbası, 1990). As it is commonly agreed, the British way of life is
individual-centred and places a great deal of emphasis on self-reliance. Turkish culture,
in contrast, is situation-centred. It emphasises the interdependence of individuals within
larger groups such as the family. In British culture, if an individual is successful, the
success is generally attributed to his or her own efforts or abilities whereas in Turkish
culture the success is attributed to, and shared with, those who are related to them.
Markus & Kitiyama (1991) point out that people in individualist cultures will have
C h a p t e r S i x
- 255 -
selves, or self-cognitions, that refer to themselves as independent, self-contained,
autonomous, and distinct units. In contrast, people in collectivist cultures will have a
more interdependent or sociocentric identity because their definition of themselves and
their personal interests are located in their group membership. Therefore, people in
individualist countries are expected to see themselves as more differentiated and
separate from others, and place more importance on asserting their individuality. On the
other hand, people in collectivist countries, are expected to regard themselves as less
differentiated from, and more connected with, other people, especially those whom they
regard as significant, and are expected to put much value on their interpersonal
relationships. Because of all these reasons, Turkish students are expected to be more
oriented toward external locus of control than are English students. However, since the
revolution of Atatürk, the secularist regime that replaced the Ottoman rule, Turkish
society has been rapidly changing from traditional, agricultural communities into a
modern, urbanised nation. Studies of modern Turkish culture suggest integration of old
collectivist group loyalties with new individualistic achievement (Phalet & Claeys,
1993). Although traditional group orientation is apparently preserved and highly valued
in families and in society, evidence is found for increased achievement motivation in
modern Turkish youth, together with more internal control and future orientation (e.g.,
Kagıtçıbası, 1973; Lecompte & Lecompte, 1970). Despite the radical changes, it was
hypothesised that Turkish students in general, will show less internality of response than
students from Britain. Despite the prediction, Turkish students did not significantly
differ either in global or academic locus of control to English students. One of the
reasons might be that the Turkish students’ average age is almost one year greater than
that of the English students, and this one year age difference might have contributed
positively to the Turkish students’ locus of control level. Most of the past research
indicates that students’ internal control orientation slightly increases with age (Crandall
et al., 1965; Nowicki-Strickland, 1973; Darko-Yeboah, 1990; Karnes & D’ilio, 1991).
C h a p t e r S i x
- 256 -
Although the Turkish and English samples’ grade levels were similar, the one year age
differences in favour of Turkish students possibly affects their perceived control. In a
recent longitudinal study, Tashakkori & Thompson (1991) found that 18 year old
teenagers’ scores in locus of control were higher than 17 year olds both for whites and
blacks as well as for males and females. Another explanation might be that the Turkish
samples were obtained in Ankara, the capital city. This is a large metropolitan city with
a population of about three million, where the social and cultural life does not truly
represent the whole of Turkey, the life style is mainly modern and very different to the
more conservative parts of Turkey. It may be that population affects the locus of control
level of Turkish students in a positive way. A large part of the Turkish sample belongs
to the middle-upper class socio-economic level. Previous research studies show that
locus of control beliefs and socio-economic status have been related (Rotter, 1966;
Gruen & Ottinger, 1969; Stephens & Delys, 1973; Robinowitz, 1978; Bar-Tal et al.,
1980; Jensen et al., 1990; Maqsud & Rouhani, 1991). Although, in general, the attitude
of Turkish teachers can be criticised in terms of improving students’ locus of control, it
has to be pointed out that one of the main conditions for a teacher to be appointed to a
school in Ankara is experience, and this fact perhaps contributes to Turkish students’
global as well as academic locus of control.
No significant locus of control differences between the English and Turkish samples
appear in the present study, which supports the study of Lester et al (1991). They also
found no significant locus of control differences between Turkish and American
undergraduates. In another cross-comparison study, Phalet & Claeys (1993) compared
309 Turkish and 341 Belgian secondary school students. In contrast to their
expectations, they found that Turkish youths were significantly less committed to
“Group Loyalty”, and more committed to “Autonomy” than their Belgian counterparts.
In another study, in a sample of 679 Turkish students, Basaran (1988) found that
“Freedom” and “Independence” were among the five most preferred Rokeach values,
C h a p t e r S i x
- 257 -
along with social or moral values like “A World at Peace” and “Responsible”. When the
findings of these studies were examined, the findings of the present study were perhaps
not surprising. In so far as they are the only two cross-cultural studies of Turkish
subjects included, the studies of Lester et al., (1991) and Phalet & Claeys (1993) are
significant and they do not also support the general conclusion of some past studies
which report that Eastern subjects are more externally oriented than Western. In line
with Hsieh et al., (1969) “individuals raised in a culture that values self-reliance and
individualism are likely to be more internally oriented than those brought up in a
different set of values”. The findings of the present research do not appear to support
the conclusion of Hsieh et al. (1969) The findings of Parsons & Schneider (1974) do not
support the idea of Hsieh et al (1969) either. Parsons & Schneider (1974), using the
Rotter Internal-External Locus of Control Scale (1966) with 539 university students,
investigated locus of control differences among Eastern and Western societies. Data
from eight countries including Japan, India, France, Germany, Italy, Canada, the United
States, and Israel was subjected to analysis of variance and a significant cultural effect
(p<0.001) was found. It was revealed that the two Eastern countries (Japan and India)
represented the extremes. Japanese students scored in a significantly more external
direction than all other students, and Indian students were found to be the most internal
group. However, the prediction of Western-Oriental difference was not supported by
Parson & Schneider’s data, as the Japanese appeared as the most external while the
Indians were the most internal, with all other Western and Middle-Eastern peoples in
between. Finally, the idea that people from Western societies are more internal than
people from Eastern societies is not supported by a recent study. Abdallah (1989a), in
his investigation of locus of control differences between British and Arab university
students, found that the Arab students were significantly more internal than the English
students on two out of three subscales (Personal Efficacy, and Sociopolitical Control).
However there were no significant differences on the “Interpersonal control” subscale.
C h a p t e r S i x
- 258 -
There are no differences attributable to sex when the English and Turkish samples are
tested together. The result of sex differences between Turkish male and females in
global locus of control is perhaps surprising. In fact, these findings support previous
research undertaken in Turkey. Using the same global locus of control scale, Korkut
(1986) found no sex differences between Turkish males and females. Later, Yesilyaprak
(1988) in her research based on 700 secondary school students, also reported similar
results to Korkut, indicating that Turkish male and female students did not differ in
global locus of control. In a recent study, Giderer (1990) obtained mixed results for two
different samples in Turkey. The author concluded that males were significantly more
internal than females in general secondary schools, whereas males and females did not
differ in science secondary schools. Perhaps a more surprising result of the present
study is that Turkish females were found significantly more internal than their male
counterparts in two academic locus of control scales. Unlike the prediction, these results
are perhaps surprising in the Turkish sample, given Turkish traditions with regard to the
relatively lower status of woman. Similar to the findings of the present study, Bond &
Tarnatzky (1973) failed to obtain sex differences in favour of males for a Japanese
sample, which is regarded as a traditional society where women generally have lower
status than men. Obtaining no significant sex differences in favour of male students for
the Turkish sample may be interpreted in terms of the Turkish subjects belonging to
mainly middle and upper class families in Ankara, where males and females tend to
have more freedom, and the gap between the sexes is relatively smaller. This fact might
be instrumental in obtaining the present results. The sex differences in favour of females
in academic locus of control for Turkish subjects might also be attributable to their
relatively higher level of achievement motivation than their male counterparts. The
findings of Phalet & Claeys (1993) support this idea. They concluded that Turkish girls
had significantly higher achievement commitment than Turkish boys. Their findings
indicate the impact of socio-cultural change in Turkey on women’s roles (Kagıtçıbası,
C h a p t e r S i x
- 259 -
1986). Rotter (1966) has shown that higher achievement motivation is generally
correlated with lower externality. In the literature there has been a considerable number
of research studies indicating a significant relationship between internal locus of control
and academic achievement. In fact, the present data shows that Turkish females achieve
significantly higher results in academic achievement than Turkish males, in general
achievement as well as in Maths, Science, and Turkish (see section 6.6 in this chapter).
A similar explanation might also be suitable for the British samples. The present
findings show that English males are significantly more internal than English females in
global locus of control. In academic locus of control, however, the differences were not
significant although males had higher scores than females. When the achievement levels
of the English sample is analysed it can be seen that overall, males are more successful
than females. The academic achievement data shows that English males were
significantly more successful than English females in the June GCSE (Maths and
Science) and in the November Teacher Assessment (Maths). Although no significant
sex differences were found in average academic achievement, males had higher scores
both in the June GCSE Exam results, and in the November teacher attainment results
(see section 6.6 in this chapter). It is possible that the academic achievement level of
English males may contribute to their locus of control level. The findings of the present
study are congruent with previous British studies. The studies of Moore (1980), Lok
(1983), and Abdallah (1989a) reveal no differences between English males and females,
whereas the study of Louden reveals sex differences in favour of males. Apart from all
these possible reasons, another explanation for English females being less internal than
their male counterparts, might be that they have female-oriented attitudes and are less
assertive than males. In line with the study of Campbell et al (1990), the authors found
that feminine-oriented females who were rated higher on physical attractiveness were
more external, but those who rated themselves lower on physical attractiveness were
more internal in their locus of control. In contrast to females, physically attractive males
C h a p t e r S i x
- 260 -
were found to be significantly more assertive than those less physically attractive. As
several research studies indicate, a positive relationship exists between internal locus of
control and assertiveness (Cooley & Nowicki, 1974; Hartwig et al., 1980; Replogle, et
al., 1980). Since students’ assertiveness, and perceived physical attractiveness were not
measured for the present study, these explanations do not go further than a simple
assumption. Therefore, further research needs to be undertaken in order to have a
clearer idea on this issue.
Even though the data did not confirm the null hypotheses, care needs to be taken in the
interpretations of these results. The methodological considerations are mentioned here.
A possible interpretation that is present in nearly all cross-cultural studies is that any
difference that is found between cultural groups is due merely to non-equivalence in
measuring instruments, samples, procedures, and so forth. The limitations of this study
may be listed as follow: first, the Turkish sample was asked to respond to the translated
version of both global and academic locus of control instruments (the Nowicki-
Strickland Internal-External Control Scale, and Crandall et al.’s Intellectual
Achievement Responsibility Scale). Despite the fact that a standard back translation
method was employed to validate the authenticity of the original, the two versions of the
instruments may have had different meanings. Second, the instruments may not measure
the same thing in the two cultures. Third, the Turkish subjects were on average one year
older than their British counterparts. Fourth, the Turkish sample was living in a large
metropolitan city, whereas the British students were living in a relatively small town,
Hinckley, in Leicestershire. It is obvious that either age or area differences might affect
students’ locus of control levels. Fifth, although several research studies show that there
is a relationship between socio-economic status and locus of control, in the present
study, the level of SES for English and Turkish samples was not ensured by using
standard criteria. Finally, factor analysis of the instruments has not been applied for this
research. Oppenheim (1966) has pointed out that only if an attitude scale is translated
C h a p t e r S i x
- 261 -
and factor analysed in different countries and it yields a similar factor structure in each
can it be used for cross-cultural comparison. Unfortunately, very few studies have factor
analysed cross-cultural data (Furnham & Henry, 1980).
Despite these limitations, it is apparent that the beliefs in locus of control varied
according to cultures. This study found that there is no significant cultural difference
either in global or academic locus of control between English and Turkish samples. The
data also reveals no sex differences when both English and Turkish samples were
combined. However, sex differences existed when data was analysed separately.
English males tended to be more internal than English females in global locus of
control, whereas Turkish females tended to be more internal than Turkish males in
academic locus of control. Further research is needed with different and larger samples
to confirm these results.
6.2.7 Conclusions
It was hypothesised that the English subjects would be more internally oriented in their
global locus of control than the Turkish subjects. This hypothesis was not confirmed.
Cross-cultural comparisons of global locus of control between English and Turkish
subjects showed that there was no significant difference between them. The non-
significant differences also existed between the English and the Turkish males as well
as between the females.
The second hypothesis was based on cross-cultural differences on academic locus of
control. It was predicted that the English subjects would be more internally oriented in
their academic locus of control than their Turkish counterparts. This hypothesis was
partially confirmed. The study revealed that although the English and the Turkish
subjects did not significantly differ in any of the academic locus of control scales,
English students had higher scores than the Turkish subjects in all three academic locus
C h a p t e r S i x
- 262 -
of control scales, indicating that English students tended to be slightly more internally
oriented in academic situations than their Turkish counterparts. Furthermore, the results
showed that there were no differences between English and Turkish females, whereas
English males were more internally oriented in academic locus of control than the
Turkish males.
The third hypothesis was that there would be no sex differences in global locus of
control for both of the samples. This hypothesis was partially confirmed. The results
showed that English males were significantly more internally oriented in their global
locus of control than English females, whereas, Turkish males and females did not
significantly differ in their global locus of control.
It was also hypothesised that there would be no sex differences in academic locus of
control. This hypothesis was confirmed for the English subjects, but was rejected for the
Turkish subjects. This was because the study revealed that English males and females
did not significantly differ in their academic locus of control orientation, whereas
Turkish females were found to be more internally oriented in their academic locus of
control than their male counterparts. Therefore this hypothesis was partially confirmed.
C h a p t e r S i x
- 263 -
6.3 CORRELATIONS BETWEEN SELF-ESTEEM AND LOCUS of
CONTROL
6.3.1 Introduction
In this section, Pearson product-moment correlations between scores on the
Coopersmith SEI scales (Total, General, Social, Home, and Academic self-esteem), the
Nowicki-Strickland Internal-External Control Scale, and Crandall et al. Intellectual
Academic Responsibility Scales (Total, Success, and Failure) for both English and
Turkish samples as well as for both sexes are presented, and the matrix of correlations
for the samples are shown in Tables 6.33-6.36. At the end of the section the findings on
the relationship between self-esteem and locus of control variables will be briefly
discussed. Finally, the results of the hypotheses which related to this section will be
summarised in the conclusion section. The hypotheses related to this section are as
follows:
Hypothesis 1: There would be a positive relationship between high self-esteem and
internal locus of control (global) for both samples.
Hypothesis 2: There would be a positive relationship between high self-esteem and
internal locus of control (academic) for both samples.
Hypothesis 3: The global self-esteem would be more strongly related to the global
locus of control than the academic locus of control.
Hypothesis 4: The academic self-esteem would be more strongly related to the
academic locus of control than the global locus of control.
6.3.2 Results of the English Sample
Pearson product-moment correlations between scores on self-esteem scales, global
locus of control scales, and academic locus of control scales for the total English group
are presented in Table 6.33. The data indicates that all self-esteem subscales scores had
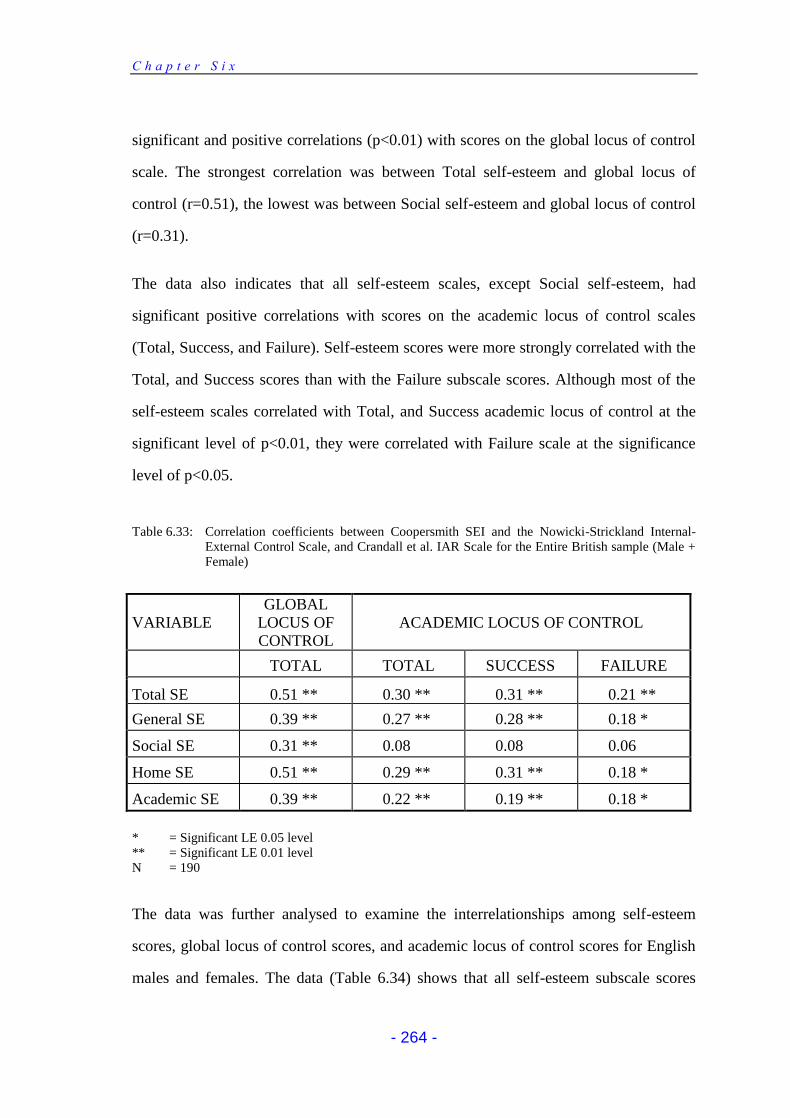
C h a p t e r S i x
- 264 -
significant and positive correlations (p<0.01) with scores on the global locus of control
scale. The strongest correlation was between Total self-esteem and global locus of
control (r=0.51), the lowest was between Social self-esteem and global locus of control
(r=0.31).
The data also indicates that all self-esteem scales, except Social self-esteem, had
significant positive correlations with scores on the academic locus of control scales
(Total, Success, and Failure). Self-esteem scores were more strongly correlated with the
Total, and Success scores than with the Failure subscale scores. Although most of the
self-esteem scales correlated with Total, and Success academic locus of control at the
significant level of p<0.01, they were correlated with Failure scale at the significance
level of p<0.05.
Table 6.33: Correlation coefficients between Coopersmith SEI and the Nowicki-Strickland Internal-External Control Scale, and Crandall et al. IAR Scale for the Entire British sample (Male + Female)
VARIABLE
GLOBAL
LOCUS OF
CONTROL
ACADEMIC LOCUS OF CONTROL
TOTAL TOTAL SUCCESS FAILURE
Total SE 0.51 ** 0.30 ** 0.31 ** 0.21 **
General SE 0.39 ** 0.27 ** 0.28 ** 0.18 *
Social SE 0.31 ** 0.08 0.08 0.06
Home SE 0.51 ** 0.29 ** 0.31 ** 0.18 *
Academic SE 0.39 ** 0.22 ** 0.19 ** 0.18 *
* = Significant LE 0.05 level ** = Significant LE 0.01 level N = 190
The data was further analysed to examine the interrelationships among self-esteem
scores, global locus of control scores, and academic locus of control scores for English
males and females. The data (Table 6.34) shows that all self-esteem subscale scores
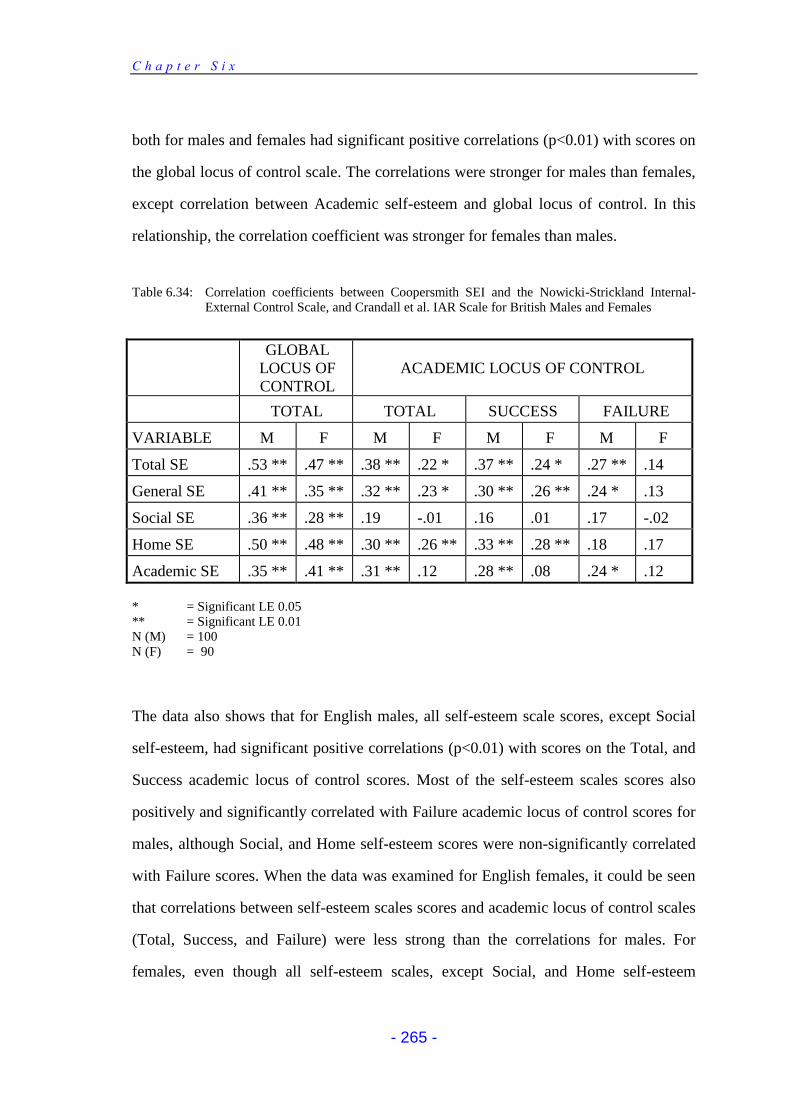
C h a p t e r S i x
- 265 -
both for males and females had significant positive correlations (p<0.01) with scores on
the global locus of control scale. The correlations were stronger for males than females,
except correlation between Academic self-esteem and global locus of control. In this
relationship, the correlation coefficient was stronger for females than males.
Table 6.34: Correlation coefficients between Coopersmith SEI and the Nowicki-Strickland Internal-External Control Scale, and Crandall et al. IAR Scale for British Males and Females
GLOBAL
LOCUS OF
CONTROL
ACADEMIC LOCUS OF CONTROL
TOTAL TOTAL SUCCESS FAILURE
VARIABLE M F M F M F M F
Total SE .53 ** .47 ** .38 ** .22 * .37 ** .24 * .27 ** .14
General SE .41 ** .35 ** .32 ** .23 * .30 ** .26 ** .24 * .13
Social SE .36 ** .28 ** .19 -.01 .16 .01 .17 -.02
Home SE .50 ** .48 ** .30 ** .26 ** .33 ** .28 ** .18 .17
Academic SE .35 ** .41 ** .31 ** .12 .28 ** .08 .24 * .12
* = Significant LE 0.05 ** = Significant LE 0.01 N (M) = 100 N (F) = 90
The data also shows that for English males, all self-esteem scale scores, except Social
self-esteem, had significant positive correlations (p<0.01) with scores on the Total, and
Success academic locus of control scores. Most of the self-esteem scales scores also
positively and significantly correlated with Failure academic locus of control scores for
males, although Social, and Home self-esteem scores were non-significantly correlated
with Failure scores. When the data was examined for English females, it could be seen
that correlations between self-esteem scales scores and academic locus of control scales
(Total, Success, and Failure) were less strong than the correlations for males. For
females, even though all self-esteem scales, except Social, and Home self-esteem

C h a p t e r S i x
- 266 -
scales, were positively and significantly correlated with Total, and Success scores, none
of the self-esteem scales significantly correlated with Failure scale scores.
6.3.3 Results of the Turkish Sample
Pearson product-moment correlations between scores on self-esteem scales, global
locus of control scales, and academic locus of control scales for the total Turkish group
are presented in Table 6.35. The data indicates that all self-esteem subscale scores had
significant positive correlations (p<0.01) with scores on the global locus of control
scale. The strongest correlation was between Total self-esteem and global locus of
control (r=0.56), and the lowest was between Social self-esteem and global locus of
control (r=0.31), although all correlations between self-esteem and global locus of
control were significant at p<0.01 level.
Table 6.35: Correlation coefficients between Coopersmith SEI and the Nowicki-Strickland Internal-External Control Scale, and Crandall et al. IAR Scale for Entire Turkish sample (Male + Female)
VARIABLE
GLOBAL
LOCUS OF
CONTROL
ACADEMIC LOCUS OF CONTROL
TOTAL TOTAL SUCCESS FAILURE
Total SE 0.56 ** 0.24 ** 0.24 ** 0.16 **
General SE 0.50 ** 0.16 ** 0.16 ** 0.11
Social SE 0.31 ** 0.20 ** 0.22 ** 0.12 *
Home SE 0.47 ** 0.24 ** 0.20 ** 0.19 **
Academic SE 0.33 ** 0.19 ** 0.21 ** 0.11
* = Significant LE 0.05 ** = Significant LE 0.01 N = 230 for correlations between SEI and Global LOC N = 315 for correlations between SEI and Academic LOC
The data also indicates that all self-esteem scales had significant and positive
correlations with scores on the Total, and Success academic locus of control scores
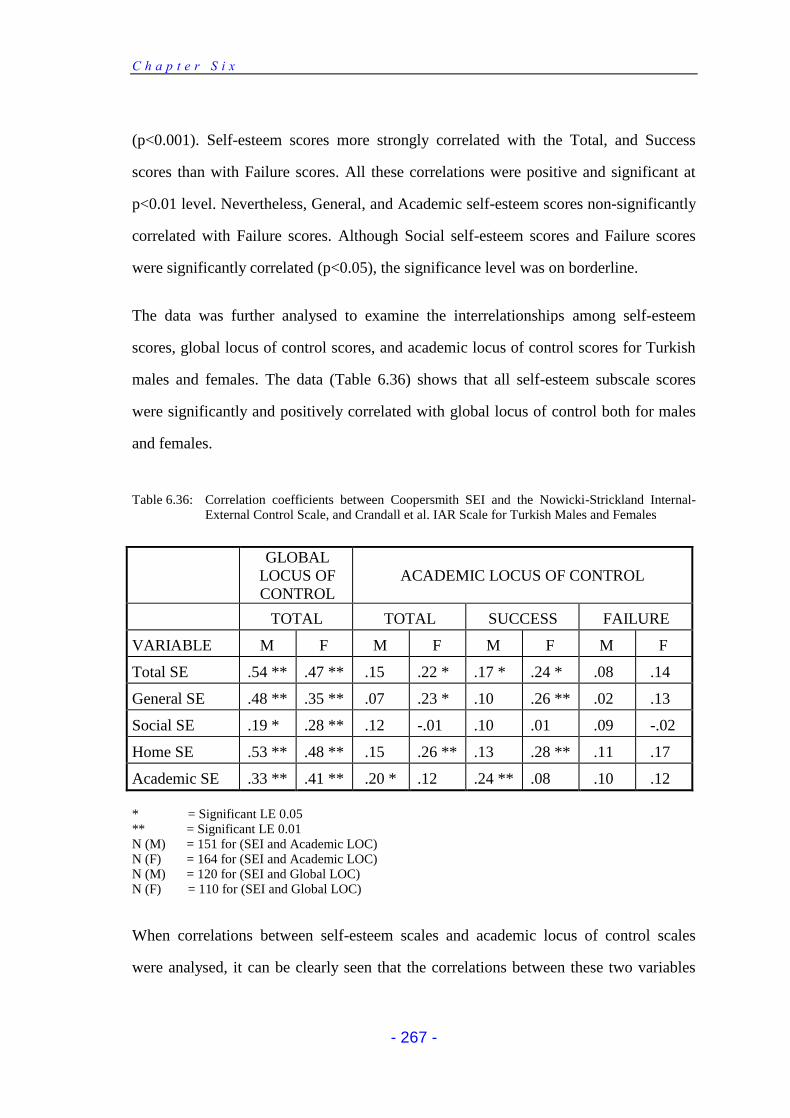
C h a p t e r S i x
- 267 -
(p<0.001). Self-esteem scores more strongly correlated with the Total, and Success
scores than with Failure scores. All these correlations were positive and significant at
p<0.01 level. Nevertheless, General, and Academic self-esteem scores non-significantly
correlated with Failure scores. Although Social self-esteem scores and Failure scores
were significantly correlated (p<0.05), the significance level was on borderline.
The data was further analysed to examine the interrelationships among self-esteem
scores, global locus of control scores, and academic locus of control scores for Turkish
males and females. The data (Table 6.36) shows that all self-esteem subscale scores
were significantly and positively correlated with global locus of control both for males
and females.
Table 6.36: Correlation coefficients between Coopersmith SEI and the Nowicki-Strickland Internal-External Control Scale, and Crandall et al. IAR Scale for Turkish Males and Females
GLOBAL
LOCUS OF
CONTROL
ACADEMIC LOCUS OF CONTROL
TOTAL TOTAL SUCCESS FAILURE
VARIABLE M F M F M F M F
Total SE .54 ** .47 ** .15 .22 * .17 * .24 * .08 .14
General SE .48 ** .35 ** .07 .23 * .10 .26 ** .02 .13
Social SE .19 * .28 ** .12 -.01 .10 .01 .09 -.02
Home SE .53 ** .48 ** .15 .26 ** .13 .28 ** .11 .17
Academic SE .33 ** .41 ** .20 * .12 .24 ** .08 .10 .12
* = Significant LE 0.05 ** = Significant LE 0.01 N (M) = 151 for (SEI and Academic LOC) N (F) = 164 for (SEI and Academic LOC) N (M) = 120 for (SEI and Global LOC) N (F) = 110 for (SEI and Global LOC)
When correlations between self-esteem scales and academic locus of control scales
were analysed, it can be clearly seen that the correlations between these two variables
C h a p t e r S i x
- 268 -
are not as strong as between self-esteem and global locus of control scores. For males,
most of the correlations between self-esteem scales and academic locus of control scales
are non-significant. For them, Total academic locus of control scores were positively
and significantly correlated only with Academic self-esteem scores (r=0.20, p<0.05).
Success academic locus of control scores of males, significantly correlated with Total
self-esteem scores (r=0.17, p<0.05), and with Academic self-esteem scores (r=0.24,
p<0.01). For males, none of the other correlations between self-esteem and academic
locus of control reached the significance level. For females, Total academic locus of
control scores were significantly and positively correlated with Total self-esteem
(r=0.22, p<0.05), with General self-esteem (r=0.23, p<0.05), and with Home self-
esteem (r=0.26, p<0.01). Success scores of females were also significantly and
positively correlated with Total self-esteem scores (r=0.24, p<0.05), with General self-
esteem scores (r=0.26, p<0.01), and with Home self-esteem scores (r=0.28, p<0.01). An
interesting point here is that none of the correlations between Failure academic locus of
control and self-esteem scales were significant for males as well as for females.
6.3.4 Discussion
To investigate the correlations between self-esteem and locus of control, it was
predicted that self-esteem would be positively correlated to global locus of control. The
results showed that the global locus of control was significantly related to Total, and all
other self-esteem subscales for English, and Turkish samples. All correlation
coefficients were significant for English and Turkish males and females. These findings
suggest high self-esteem is associated with internal global locus of control. These
results are consistent with previous results (Louden, 1977; Dönmez, 1985; Crump et al.,
1985; Abdallah, 1989b; Chadha, 1989) in terms of the relationship between self-esteem
and internal locus of control. What these correlations show is that both the English and
C h a p t e r S i x
- 269 -
Turkish, males and females’ self-esteem were influenced by their beliefs about control
over life events or vice versa.
Similarly it was hypothesised that self-esteem would be positively correlated to
academic locus of control. When total English, and total Turkish samples were
considered, the data showed that most of the self-esteem scales were significantly
correlated to the academic locus of control scales, although not as strongly related as to
global locus of control. For the English sample, twelve out of fifteen coefficients were
significant. The Social self-esteem scale was the only self-esteem scale whose
relationship with academic locus of control scales (IAR-Total, IAR-Success, and IAR-
Failure) did not reach the significance level, although the relationships were positive
and in the expected direction. For the Turkish sample, thirteen out of fifteen coefficients
were significant. Again in the Turkish sample, the General, and Academic self-esteem
scales did not reach the significance level with their correlation with Failure scale,
although the relationships were positive and in the expected direction. It can be seen
from Tables 6.34 and 6.35 that among academic locus of control scales, Failure scale
had the weakest relationship with self-esteem for the English as well as for the Turkish
sample. Moreover, when the correlations between self-esteem and academic locus of
control were examined for English and Turkish males and females separately, the data
showed that coefficients between self-esteem and academic locus of control scales were
significantly weaker than those found for the combined sex sample of English and
Turkish samples. The data also shows that self-esteem was more strongly correlated to
academic locus of control for English males than females (for males a total of eleven
out of fifteen correlations were significant, for females however, six of them were
significant). In the Turkish sample, in contrast, self-esteem more strongly correlated to
academic locus of control for female than for males (for females a total of six out of
fifteen correlations were significant, for males however, only three of them were
significant). In general, the correlation coefficients between self-esteem and academic
C h a p t e r S i x
- 270 -
locus of control are stronger for English males and females than Turkish males and
females. Another interesting point has to be emphasised, that none of the self-esteem
scales (including Total self-esteem) significantly correlated to Failure scale with the
exception the Total self-esteem (r=0.27, p<0.01), with General self-esteem (r=0.24,
p<0.05), and with Academic self-esteem (r=0.24, p<0.05) for English males.
It was also expected that academic self-esteem would be more strongly related to
academic locus of control than to global locus of control. However, the data shows that
the academic self-esteem scale, like all other self-esteem scales, more strongly
correlated to the global locus of control than the academic locus of control. These
findings are consistent for the English and Turkish samples as well as for males and
females.
It had been expected that self-esteem scores would be correlated significantly both with
global and academic locus of control scores of English and Turkish as well as males and
females. The results show that all correlations were significant for global locus of
control. In the case of academic locus of control, however, the correlations were neither
large enough to justify the relationships, nor small enough to permit the relationships.
The relationships between self-esteem scales and IAR-Failure, in particular, were quite
low. This result indicates that students’ self-esteem is only partially influenced by their
understanding of why they succeed or fail in intellectual tasks. The results suggest
further research on the relationship between self-esteem and the components of locus of
control is warranted.
Self-esteem and locus of control are thought to be educationally important variables.
They are considered both to be central educational objectives in themselves and to be
factors which effect educational outcomes. The Coleman Report (1966) on the equality
of educational opportunity supports this idea. He found that measures of self-esteem
and locus of control were among the best predictors of academic achievement.
C h a p t e r S i x
- 271 -
Theoretically, someone’s attitudes about himself or herself should bear some relation to
locus of control. A person who feels insecure, lacking in self worth and low in feelings
of personal adequacy is expected to be oriented towards external control rather than
internal control. The high-self-esteem individual, with his positive sense of adequacy,
should feel more in control of what he does and what happens to him rather than under
control from outside forces. Externals may not only perceive a lack of control over
themselves but actively seek external control, because of their feelings of personal
inadequacy. The results of many studies examining beliefs in personal control and self-
esteem suggest that the internal control person has higher self-esteem, probably because
he or she is more able to accept personal responsibility for his or her success (Lefcourt,
1976). Bellak (1975) found that externals produced lower self-evaluation. Externals
also found difficulty with interpersonal relations (McDonald, 1971), with low self
evaluation (Hersh & Schiebe, 1969), and with poor personal adjustment (Warehime &
Foulds, 1971). They are also found to have large discrepancies between self, ideal and
perceived internal control as their ideal (Lombardo, Saverio & Solheim, 1975).
To investigate the relationships between self-esteem and locus of control, it was
expected that self-esteem would be positively correlated with locus of control. The
findings of this study generally suggest that high self-esteem was associated with
internal locus of control. They support previous studies which indicated that a
relationship existed between both constructs.
6.3.5 Conclusion
The first hypothesis was that there would be a positive relationship between high self-
esteem and internal locus of control (global) for both of the samples (English &
Turkish). The study revealed that high self-esteem was significantly correlated with the
internal locus of control (global) for the English and the Turkish samples as well as for
males and females in both countries. Therefore, this hypothesis was confirmed.
C h a p t e r S i x
- 272 -
The second hypothesis was that there would be a positive relationship between high
self-esteem and internal locus of control (academic) for both of the samples (English
and Turkish). The study revealed that the relationship of self-esteem scales with the
academic locus of control scales were found to be not consistent, particularly when data
was further analysed separately for males and females. Therefore this hypothesis was
partially confirmed.
The third hypothesis was that the global self-esteem would be more strongly related to
the global locus of control than the academic locus of control. This hypothesis was
confirmed for all samples, English, Turkish, as well as males and females.
The fourth hypothesis was that the academic self-esteem would be more strongly related
to the academic locus of control than the global locus of control. This hypothesis was
not confirmed by the result of this study. The data show that like all other self-esteem
scales, academic self-esteem scale, also correlated more strongly to the global locus of
control scale rather than the academic locus of control scales. This result is consistent
for the English and the Turkish samples as well as for males and females. Therefore the
fourth hypothesis was not supported by the findings of the present study.
C h a p t e r S i x
- 273 -
6.4 SEX COMPARISONS in ACADEMIC ACHIEVEMENT
6.4.1 Introduction
Academic achievement was measured by two indicators for the English sample, the
November Teacher Assessment grades and the June GCSE scores, and one indicator for
the Turkish sample (the January exam grades). Both indicators for the English samples
included scores in English language, Maths, Science, and GPA (the average of these
three scores). Similarly, the students’ scores in Turkish language, Maths, Science, and
GPA were obtained. As mentioned in the methodology chapter (Chapter 4, section
4.6.8), the English students’ grades ranged from A to G. These letters were converted to
numbers as follow: A = 7, B = 6, C = 5, D = 4, E = 3, F = 2, and G = 1. The Turkish
participants' academic achievement was measured in a similar way. For this research,
the Turkish students' January exam grades were used. The classification of the students'
academic performances was based on a 10 point scale, with the lowest mark of 0 and
the highest of 10.
Before reporting the results on the relationship between self-esteem and academic
achievement, it is necessary to report on the academic achievement comparisons
between the English males and females as well as the Turkish males and females. Since
comparing the academic achievement scores of both the English and the Turkish
samples is not an objective of this study, only the sex differences among these subjects
were analysed.
6.4.2 Results of the English Sample
6.4.2.1 Comparisons in June GCSE Exam Grades
The English sample’s (both sexes combined) mean, standard deviation, minimum and
maximum scores in the June GCSE exam grades included scores in English, Maths,
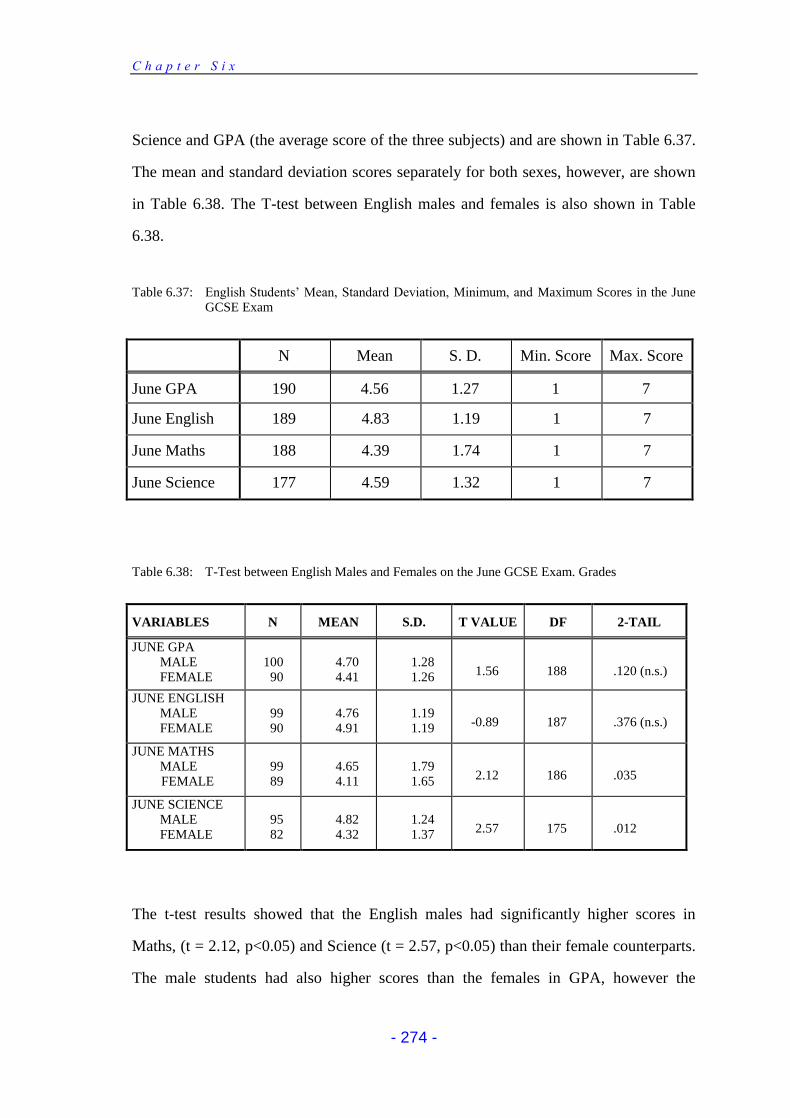
C h a p t e r S i x
- 274 -
Science and GPA (the average score of the three subjects) and are shown in Table 6.37.
The mean and standard deviation scores separately for both sexes, however, are shown
in Table 6.38. The T-test between English males and females is also shown in Table
6.38.
Table 6.37: English Students’ Mean, Standard Deviation, Minimum, and Maximum Scores in the June GCSE Exam
N Mean S. D. Min. Score Max. Score
June GPA 190 4.56 1.27 1 7
June English 189 4.83 1.19 1 7
June Maths 188 4.39 1.74 1 7
June Science 177 4.59 1.32 1 7
Table 6.38: T-Test between English Males and Females on the June GCSE Exam. Grades
VARIABLES N MEAN S.D. T VALUE DF 2-TAIL
PROB JUNE GPA MALE FEMALE
100
90
4.70 4.41
1.28 1.26
1.56
188
.120 (n.s.)
JUNE ENGLISH MALE FEMALE
99 90
4.76 4.91
1.19 1.19
-0.89
187
.376 (n.s.)
JUNE MATHS MALE FEMALE
99 89
4.65 4.11
1.79 1.65
2.12
186
.035
JUNE SCIENCE MALE FEMALE
95 82
4.82 4.32
1.24 1.37
2.57
175
.012
The t-test results showed that the English males had significantly higher scores in
Maths, (t = 2.12, p<0.05) and Science (t = 2.57, p<0.05) than their female counterparts.
The male students had also higher scores than the females in GPA, however the
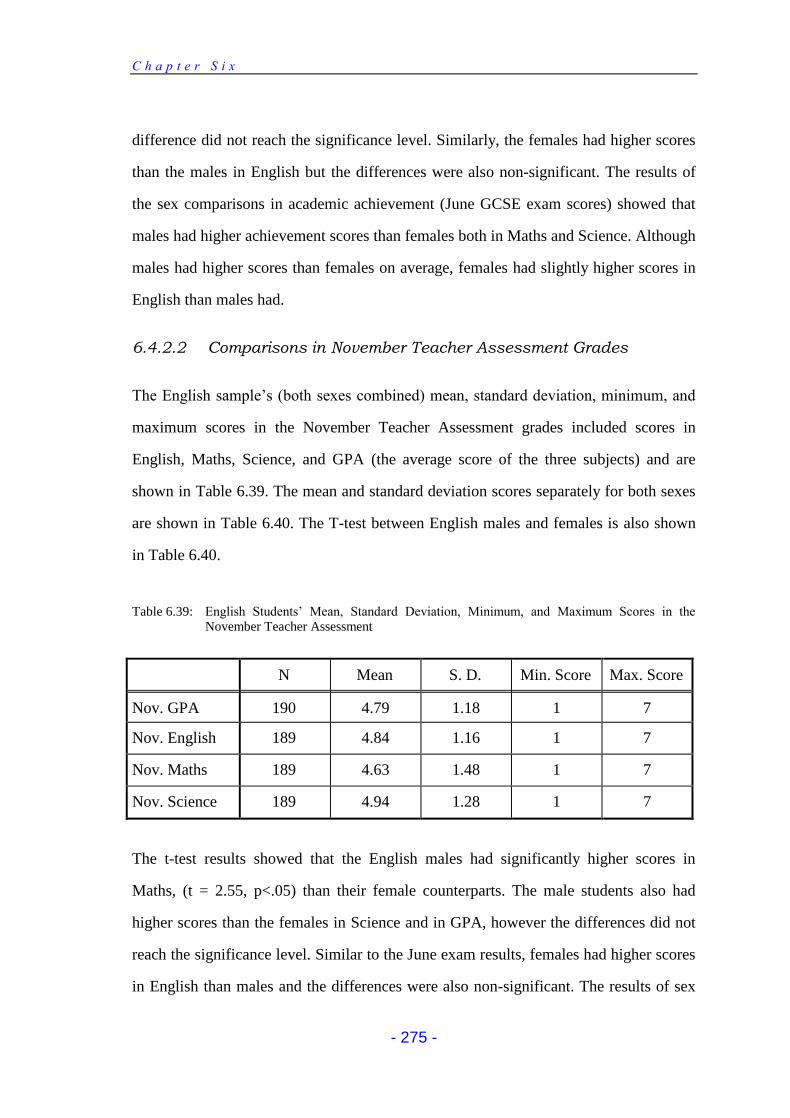
C h a p t e r S i x
- 275 -
difference did not reach the significance level. Similarly, the females had higher scores
than the males in English but the differences were also non-significant. The results of
the sex comparisons in academic achievement (June GCSE exam scores) showed that
males had higher achievement scores than females both in Maths and Science. Although
males had higher scores than females on average, females had slightly higher scores in
English than males had.
6.4.2.2 Comparisons in November Teacher Assessment Grades
The English sample’s (both sexes combined) mean, standard deviation, minimum, and
maximum scores in the November Teacher Assessment grades included scores in
English, Maths, Science, and GPA (the average score of the three subjects) and are
shown in Table 6.39. The mean and standard deviation scores separately for both sexes
are shown in Table 6.40. The T-test between English males and females is also shown
in Table 6.40.
Table 6.39: English Students’ Mean, Standard Deviation, Minimum, and Maximum Scores in the November Teacher Assessment
N Mean S. D. Min. Score Max. Score
Nov. GPA 190 4.79 1.18 1 7
Nov. English 189 4.84 1.16 1 7
Nov. Maths 189 4.63 1.48 1 7
Nov. Science 189 4.94 1.28 1 7
The t-test results showed that the English males had significantly higher scores in
Maths, (t = 2.55, p<.05) than their female counterparts. The male students also had
higher scores than the females in Science and in GPA, however the differences did not
reach the significance level. Similar to the June exam results, females had higher scores
in English than males and the differences were also non-significant. The results of sex
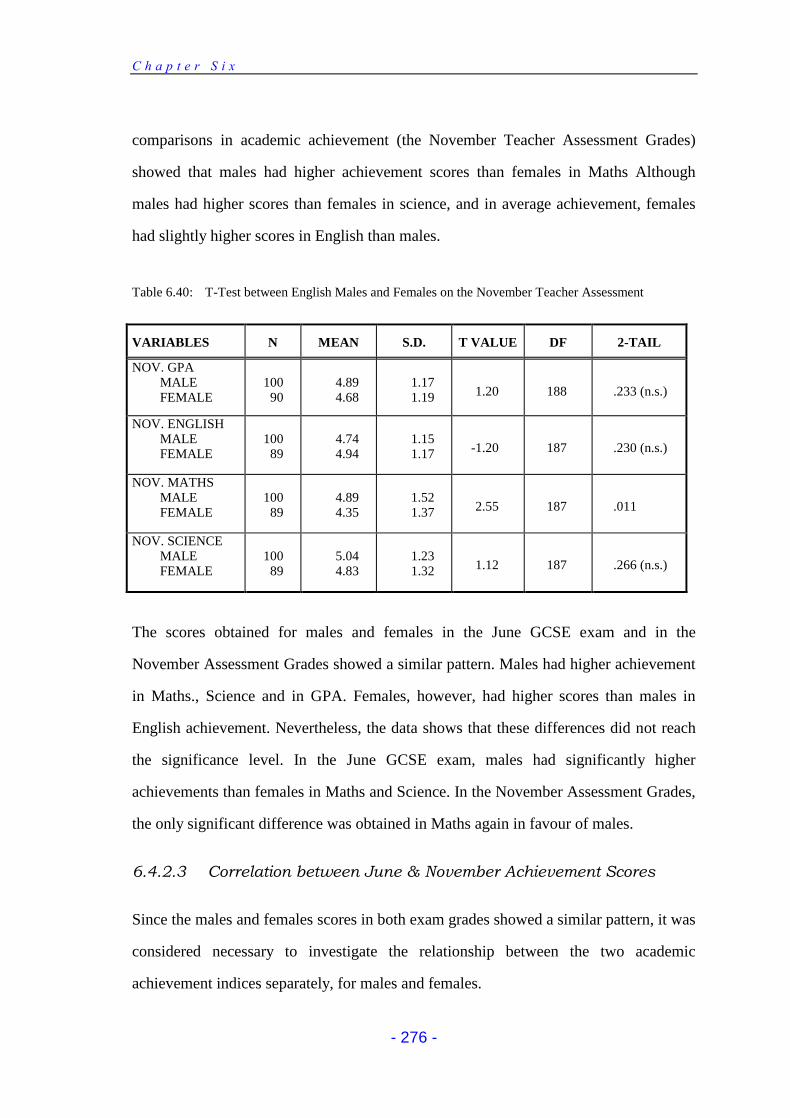
C h a p t e r S i x
- 276 -
comparisons in academic achievement (the November Teacher Assessment Grades)
showed that males had higher achievement scores than females in Maths Although
males had higher scores than females in science, and in average achievement, females
had slightly higher scores in English than males.
Table 6.40: T-Test between English Males and Females on the November Teacher Assessment
VARIABLES N MEAN S.D. T VALUE DF 2-TAIL
PROB NOV. GPA MALE FEMALE
100
90
4.89 4.68
1.17 1.19
1.20
188
.233 (n.s.)
NOV. ENGLISH MALE FEMALE
100
89
4.74 4.94
1.15 1.17
-1.20
187
.230 (n.s.)
NOV. MATHS MALE FEMALE
100
89
4.89 4.35
1.52 1.37
2.55
187
.011
NOV. SCIENCE MALE FEMALE
100
89
5.04 4.83
1.23 1.32
1.12
187
.266 (n.s.)
The scores obtained for males and females in the June GCSE exam and in the
November Assessment Grades showed a similar pattern. Males had higher achievement
in Maths., Science and in GPA. Females, however, had higher scores than males in
English achievement. Nevertheless, the data shows that these differences did not reach
the significance level. In the June GCSE exam, males had significantly higher
achievements than females in Maths and Science. In the November Assessment Grades,
the only significant difference was obtained in Maths again in favour of males.
6.4.2.3 Correlation between June & November Achievement Scores
Since the males and females scores in both exam grades showed a similar pattern, it was
considered necessary to investigate the relationship between the two academic
achievement indices separately, for males and females.
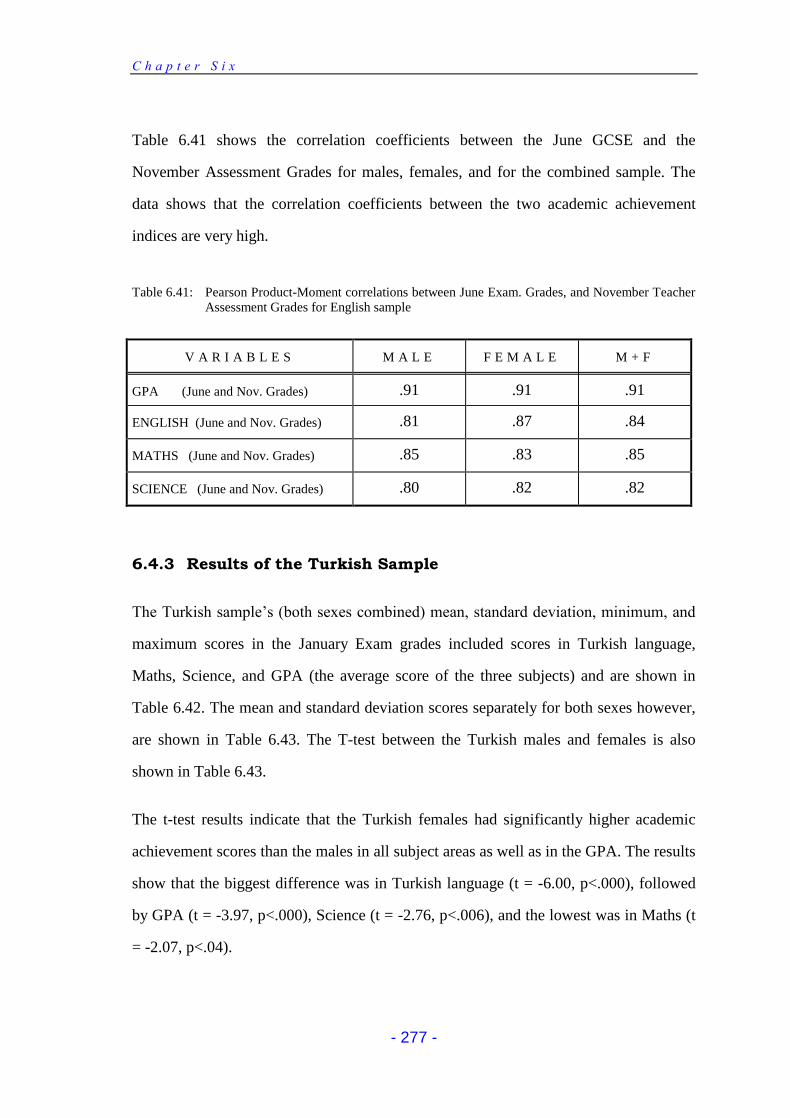
C h a p t e r S i x
- 277 -
Table 6.41 shows the correlation coefficients between the June GCSE and the
November Assessment Grades for males, females, and for the combined sample. The
data shows that the correlation coefficients between the two academic achievement
indices are very high.
Table 6.41: Pearson Product-Moment correlations between June Exam. Grades, and November Teacher Assessment Grades for English sample
V A R I A B L E S M A L E F E M A L E M + F
GPA (June and Nov. Grades) .91 .91 .91
ENGLISH (June and Nov. Grades) .81 .87 .84
MATHS (June and Nov. Grades) .85 .83 .85
SCIENCE (June and Nov. Grades) .80 .82 .82
6.4.3 Results of the Turkish Sample
The Turkish sample’s (both sexes combined) mean, standard deviation, minimum, and
maximum scores in the January Exam grades included scores in Turkish language,
Maths, Science, and GPA (the average score of the three subjects) and are shown in
Table 6.42. The mean and standard deviation scores separately for both sexes however,
are shown in Table 6.43. The T-test between the Turkish males and females is also
shown in Table 6.43.
The t-test results indicate that the Turkish females had significantly higher academic
achievement scores than the males in all subject areas as well as in the GPA. The results
show that the biggest difference was in Turkish language (t = -6.00, p<.000), followed
by GPA (t = -3.97, p<.000), Science (t = -2.76, p<.006), and the lowest was in Maths (t
= -2.07, p<.04).
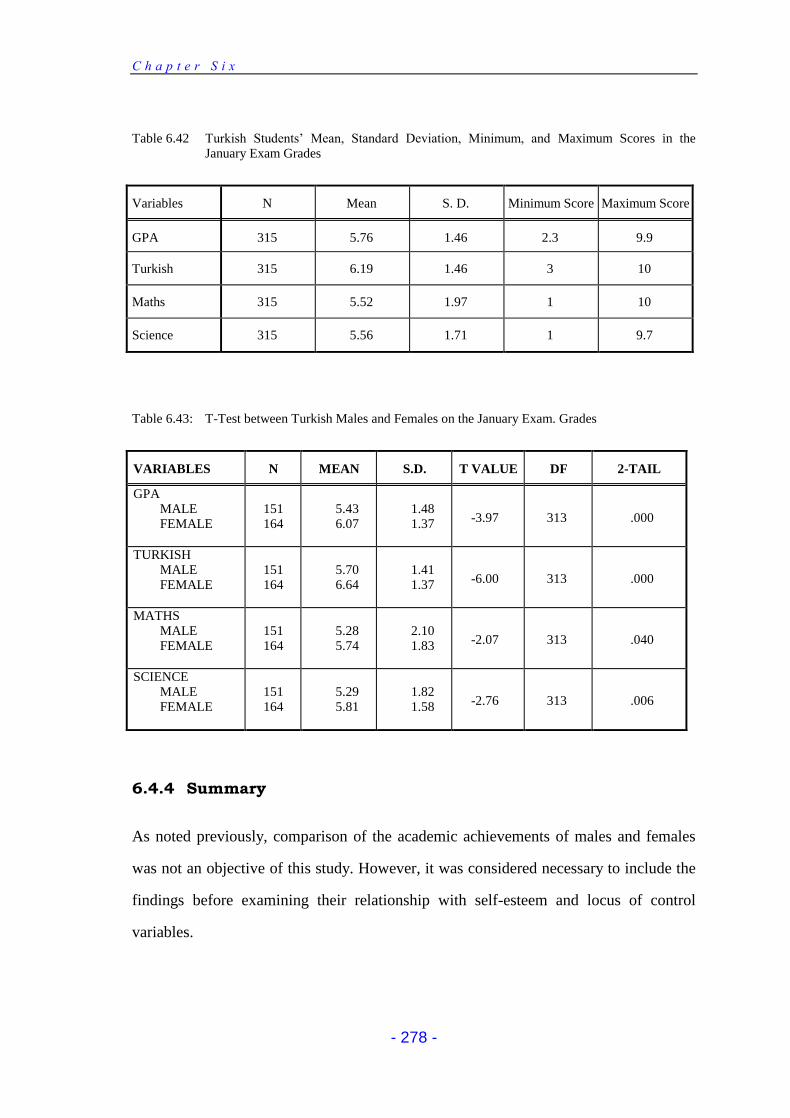
C h a p t e r S i x
- 278 -
Table 6.42 Turkish Students’ Mean, Standard Deviation, Minimum, and Maximum Scores in the January Exam Grades
Variables N Mean S. D. Minimum Score Maximum Score
GPA 315 5.76 1.46 2.3 9.9
Turkish 315 6.19 1.46 3 10
Maths 315 5.52 1.97 1 10
Science 315 5.56 1.71 1 9.7
Table 6.43: T-Test between Turkish Males and Females on the January Exam. Grades
VARIABLES N MEAN S.D. T VALUE DF 2-TAIL
PROB GPA MALE FEMALE
151 164
5.43 6.07
1.48 1.37
-3.97
313
.000
TURKISH MALE FEMALE
151 164
5.70 6.64
1.41 1.37
-6.00
313
.000
MATHS MALE FEMALE
151 164
5.28 5.74
2.10 1.83
-2.07
313
.040
SCIENCE MALE FEMALE
151 164
5.29 5.81
1.82 1.58
-2.76
313
.006
6.4.4 Summary
As noted previously, comparison of the academic achievements of males and females
was not an objective of this study. However, it was considered necessary to include the
findings before examining their relationship with self-esteem and locus of control
variables.
C h a p t e r S i x
- 279 -
The results in general show that, the English males were more successful than the
females in their GCSE and teacher assessment grades. Males were more successful in
GPA, Maths and Science, whereas females were more successful in English. However,
when significant differences were examined, males were more successful in Maths and
Science in their GCSE exam grades, as well as in Science in their November teacher
assessment grade, and the other differences were not significant. The English data also
show that the correlation coefficients between the two academic achievement indices
were very high for males, females and for the combined sample.
In the case of the Turkish subjects, the data shows that the Turkish females were
significantly more successful than their male counterparts in all the subjects areas of
Turkish, Maths, Science, and GPA.
C h a p t e r S i x
- 280 -
6.5 RELATIONSHIP between SELF-ESTEEM & ACHIEVEMENT
6.5.1 Introduction
The purpose of this section is to determine whether a relationship exists between the
self-esteem and academic achievement of English and Turkish year-11 secondary
school students. Therefore this section deals with the results concerning the relationship
between self-esteem and academic achievement.
From the literature review (see Chapter 2.6) it was concluded that the studies
consistently revealed a positive relationship between self-esteem and academic
achievement (Coopersmith, 1960; Simon & Simon, 1975; Lawrence, 1981; Hansford &
Hattie, 1982; Abdallah, 1989a). For the present study, in order to find out the
relationship of self-esteem with academic achievement, data was analysed from both the
English and Turkish samples as well as separately for both sexes. The English sample
consisted of 190 year-11 secondary school students in Hinckley (Leicestershire). Of the
190 students, 100 were males and 90 were females. The Turkish sample consisted of
315 year-11 secondary school students in Ankara. Of the 315 students, 151 were males
and 164 were females. Self-esteem scores of students were measured by the Short Form,
and School Form of the Coopersmith self-esteem inventory. The School Form consisted
of General Self, Social Self-Peers, Home-Parents and School-Academic Self subscales.
In addition, the scoring produced a total self-esteem score (Coopersmith, 1991).
Academic achievement scores were measured by the November Teacher Assessment
Scores (English language, Maths., Science, and GPA) for the English sample, and the
January Exam Scores (Turkish language, Maths, Science, and GPA) for the Turkish
sample. Although there were two academic achievement indices for the English sample,
the correlation coefficients between the two indices were very high, therefore one of
C h a p t e r S i x
- 281 -
them (the June GCSE exam grades) was eliminated. The reason that the November
Assessment grades were chosen was because the students were assessed later.
The interpretations of these correlation coefficients were based on two criteria: a) test of
significance. For this criteria, if a correlation coefficient reached the significance level
of p<0.05 it was accepted as significant; b) the obtained correlation coefficients were
assessed by descriptors developed by Davis (1971), and are as follow:
Negligible association = .00 - .09
Low association = .10 - .29
Moderate association = .30 - .49
Substantial association = .50 - .69 and
Very strong association = .70 or higher.
The results on the self-esteem / academic achievement relationship will be presented
separately for the English and the Turkish samples. However the findings will be
discussed at the end of the section. Finally, the results of the hypotheses which related
to this section will be summarised. These are as follows:
Hypothesis 1: There would be a significant but moderate relationship between self-
esteem and academic achievement for both samples.
Hypothesis 2: Academic achievement would be more strongly related to the
academic self-esteem rather than the other types of self-esteem.
6.5.2 Results of the English Sample
Pearson product-moment correlations were computed between the Coopersmith SEI
scores (Total, Short-Form, General, Social, Home, and Academic self-esteem) and
academic achievement scores (English language, Maths, Science, and GPA) for the
combined English sample (Table 6.44) as well as for both sexes separately (Table 6.45).
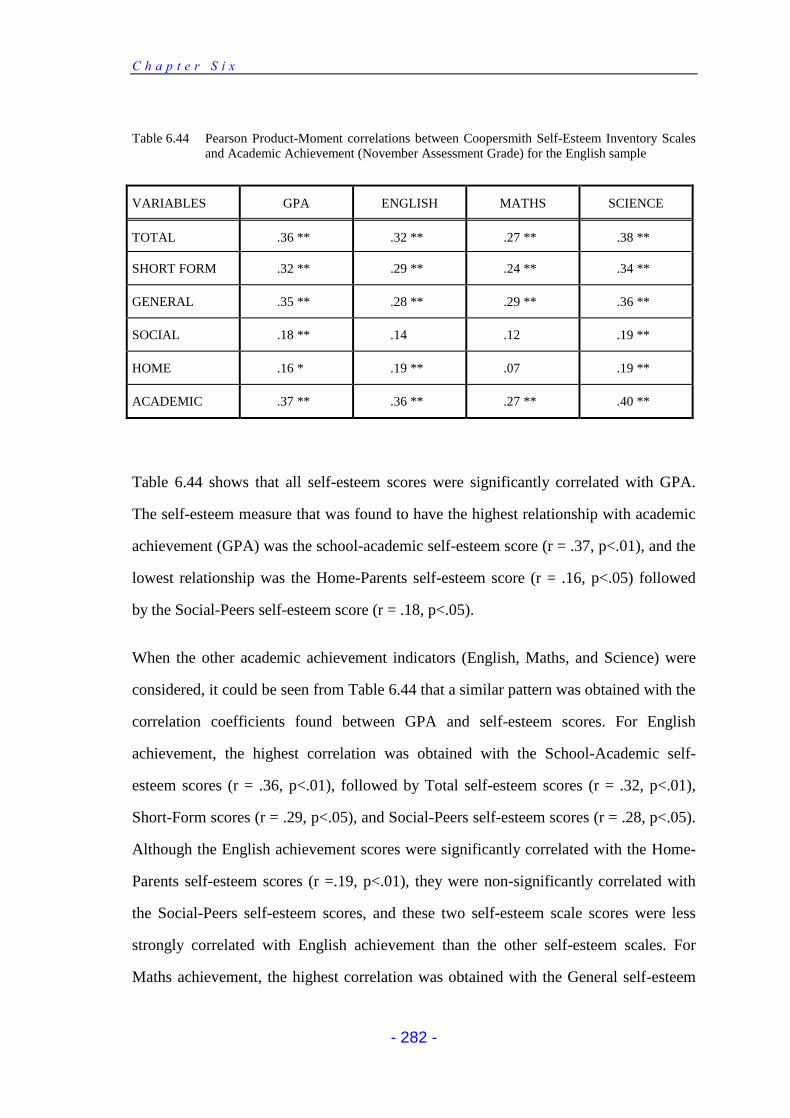
C h a p t e r S i x
- 282 -
Table 6.44 Pearson Product-Moment correlations between Coopersmith Self-Esteem Inventory Scales and Academic Achievement (November Assessment Grade) for the English sample
VARIABLES GPA ENGLISH MATHS SCIENCE
TOTAL .36 ** .32 ** .27 ** .38 **
SHORT FORM .32 ** .29 ** .24 ** .34 **
GENERAL .35 ** .28 ** .29 ** .36 **
SOCIAL .18 ** .14 .12 .19 **
HOME .16 * .19 ** .07 .19 **
ACADEMIC .37 ** .36 ** .27 ** .40 **
Table 6.44 shows that all self-esteem scores were significantly correlated with GPA.
The self-esteem measure that was found to have the highest relationship with academic
achievement (GPA) was the school-academic self-esteem score (r = .37, p<.01), and the
lowest relationship was the Home-Parents self-esteem score (r = .16, p<.05) followed
by the Social-Peers self-esteem score (r = .18, p<.05).
When the other academic achievement indicators (English, Maths, and Science) were
considered, it could be seen from Table 6.44 that a similar pattern was obtained with the
correlation coefficients found between GPA and self-esteem scores. For English
achievement, the highest correlation was obtained with the School-Academic self-
esteem scores (r = .36, p<.01), followed by Total self-esteem scores (r = .32, p<.01),
Short-Form scores (r = .29, p<.05), and Social-Peers self-esteem scores (r = .28, p<.05).
Although the English achievement scores were significantly correlated with the Home-
Parents self-esteem scores (r =.19, p<.01), they were non-significantly correlated with
the Social-Peers self-esteem scores, and these two self-esteem scale scores were less
strongly correlated with English achievement than the other self-esteem scales. For
Maths achievement, the highest correlation was obtained with the General self-esteem
C h a p t e r S i x
- 283 -
scores (r = .29, p<.01), followed by the School-Academic and the Total self-esteem
scores (r’s = .27, p<.01), and the Short Form scores (r = .24, p<.01). Similar with the
English achievement scores, the Maths achievement scores were also found to be less
strongly associated with Social-Peers, and Home-Parents self-esteem scores, and none
of the two coefficients reached the significance level of 0.05. Table 6.44 shows that the
Science achievement scores were more strongly correlated with the self-esteem scores
than the English and the Maths achievement scores. The correlation coefficients
between the Science achievement scores and the self-esteem scales ranged between 0.40
(School-Academic self-esteem scale) and 0.19 (Social-Peers, and Home-Parents self-
esteem scales). All of the correlation coefficients between Science and the self-esteem
scale scores were significant at p<0.01 level. In general, the findings indicate that the
School-Academic self-esteem scale and the Total self-esteem scores, had the highest
correlation coefficients, whereas Home-Parents and the Social-Peers self-esteem scales,
had the lowest correlation coefficients with academic achievement.
Using Davis’s descriptors, the relationship of GPA with Total, Short-Form, General,
and School-Academic self-esteem scores, was classified as moderate. Of the remaining
self-esteem scores, two (Social-Peers and Home-Parents) were found to have a low
degree of relationship with GPA. When the relationship of the other academic
achievement indicators (English, Maths. and Science) with self-esteem scores were
considered, of the 18 correlation coefficients, six were classified as moderate, eleven of
them were classified as low, and one of them was classified as negligible.
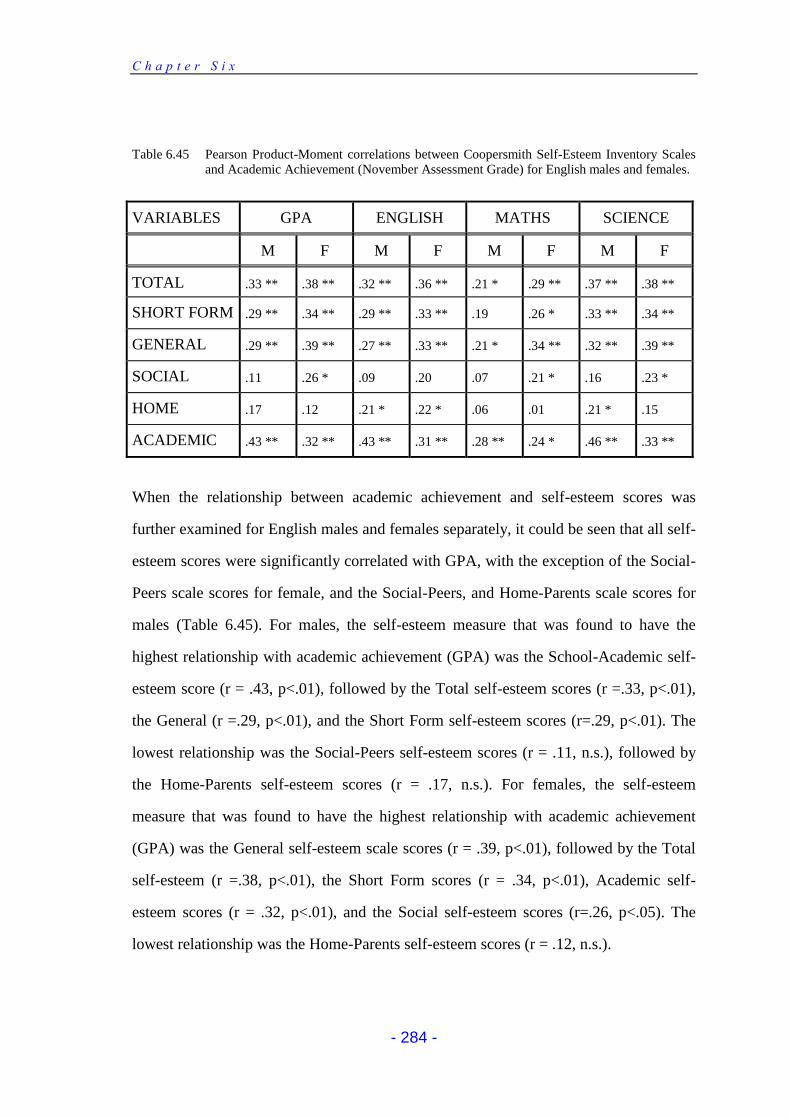
C h a p t e r S i x
- 284 -
Table 6.45 Pearson Product-Moment correlations between Coopersmith Self-Esteem Inventory Scales and Academic Achievement (November Assessment Grade) for English males and females.
VARIABLES GPA ENGLISH MATHS SCIENCE
M F M F M F M F
TOTAL .33 ** .38 ** .32 ** .36 ** .21 * .29 ** .37 ** .38 **
SHORT FORM .29 ** .34 ** .29 ** .33 ** .19 .26 * .33 ** .34 **
GENERAL .29 ** .39 ** .27 ** .33 ** .21 * .34 ** .32 ** .39 **
SOCIAL .11 .26 * .09 .20 .07 .21 * .16 .23 *
HOME .17 .12 .21 * .22 * .06 .01 .21 * .15
ACADEMIC .43 ** .32 ** .43 ** .31 ** .28 ** .24 * .46 ** .33 **
When the relationship between academic achievement and self-esteem scores was
further examined for English males and females separately, it could be seen that all self-
esteem scores were significantly correlated with GPA, with the exception of the Social-
Peers scale scores for female, and the Social-Peers, and Home-Parents scale scores for
males (Table 6.45). For males, the self-esteem measure that was found to have the
highest relationship with academic achievement (GPA) was the School-Academic self-
esteem score (r = .43, p<.01), followed by the Total self-esteem scores (r =.33, p<.01),
the General (r =.29, p<.01), and the Short Form self-esteem scores (r=.29, p<.01). The
lowest relationship was the Social-Peers self-esteem scores (r = .11, n.s.), followed by
the Home-Parents self-esteem scores (r = .17, n.s.). For females, the self-esteem
measure that was found to have the highest relationship with academic achievement
(GPA) was the General self-esteem scale scores (r = .39, p<.01), followed by the Total
self-esteem (r =.38, p<.01), the Short Form scores (r = .34, p<.01), Academic self-
esteem scores (r = .32, p<.01), and the Social self-esteem scores (r=.26, p<.05). The
lowest relationship was the Home-Parents self-esteem scores (r = .12, n.s.).
C h a p t e r S i x
- 285 -
When the other academic achievement indicators (English, Maths, and Science) were
examined, it could be seen that a similar pattern was obtained with correlation
coefficients found between GPA and self-esteem scores (Table 6.45). For English
achievement, the correlation coefficients ranged from .43 (School-Academic) to .09
(Social-Peers) for males, and they ranged from .36 (Total self-esteem) to .20 (Social-
Peers) for females. Five out of six correlation coefficients between English language
achievement and self-esteem measurements were significant both for male and female
students. The only non-significant correlation coefficient was between English
achievement and the Social self-esteem scores, both for males and females. For Maths
achievement, the correlation coefficients ranged from .28 (School-Academic) to .06
(Home-Parents) for males, and they ranged from .34 (General self-esteem) to .01
(Home-Parents) for females. When the data was analysed, it could be seen that the
correlation coefficients between the Maths achievement and the self-esteem
measurements were more strongly correlated for females than for males. For females,
five out of six coefficients were significant, whereas only three coefficients were
significant for males. The Short-Form, Social-Peers, and the Home-Parents scale scores
for males, and the Home-Parents self-esteem scores for females, were non-significantly
correlated with the Maths achievement. For Science achievement, the correlation
coefficients ranged from .46 (School-Academic) to .16 (Social-Peers) for males, and
they ranged from .39 (General self-esteem) to .15 (Home-Parents) for females. Five out
of six correlation coefficients between the Maths scores and self-esteem measurements
were significant both for male and female students. The Social-Peers self-esteem for
males, and the Home-Parents self-esteem scores for females were nonsignificantly
correlated with the Science achievement scores.
Using Davis’s descriptors, the relationship of GPA with the School-Academic and Total
self-esteem scores was classified as moderate. The remaining self-esteem scores,
(Short-Form, General, Social-Peers and Home-Parents) were found to have a low
C h a p t e r S i x
- 286 -
degree of relationship with GPA for males. For females, the relationship of GPA with
the Total, Short-Form, General, School-Academic, and Social-Peers self-esteem scores,
was classified as moderate. The Home-Parents self-esteem was the only self-esteem
scale for females that was found to have a low degree of relationship with GPA.
When the relationship of the other academic achievement indicators (English, Maths
and Science) with self-esteem scores were examined, of the 18 correlation coefficients,
six were classified as moderate, nine were classified as low, and three were classified as
negligible, for males. For females, nine were classified as moderate, eight were
classified as low, and only one was classified as negligible.
To summarise, the data indicates that most of the self-esteem scales had a significant
relationship with academic achievement for the combined English sample, as well as for
the male and female samples. The academic achievement scores were found to be more
strongly related to the School-Academic, Total, Short-Form and General self-esteem
scores than the Social-Peers, and the Home-Parents self-esteem scores. This pattern
seems to be similar for males, females and for both sexes combined. Although the
relationship between academic achievement and the School-Academic self-esteem were
found to be stronger for males than females, in general, the number of significant
correlation coefficients obtained for females was higher than for males. 17 out of 24
coefficients were significant for males and 20 coefficients were significant for females.
When both sexes were combined, 21 out of 24 correlation coefficients were found to be
significant. However, when the Davis’ descriptors were considered it could be seen that
the majority of the correlation coefficients between self-esteem and academic
achievement measures would be classified as moderate or low.
The first hypothesis for this section was that there would be a significant but moderate
relationship between self-esteem and academic achievement for the English sample.
The data shows that the majority of the correlation coefficients between self-esteem and
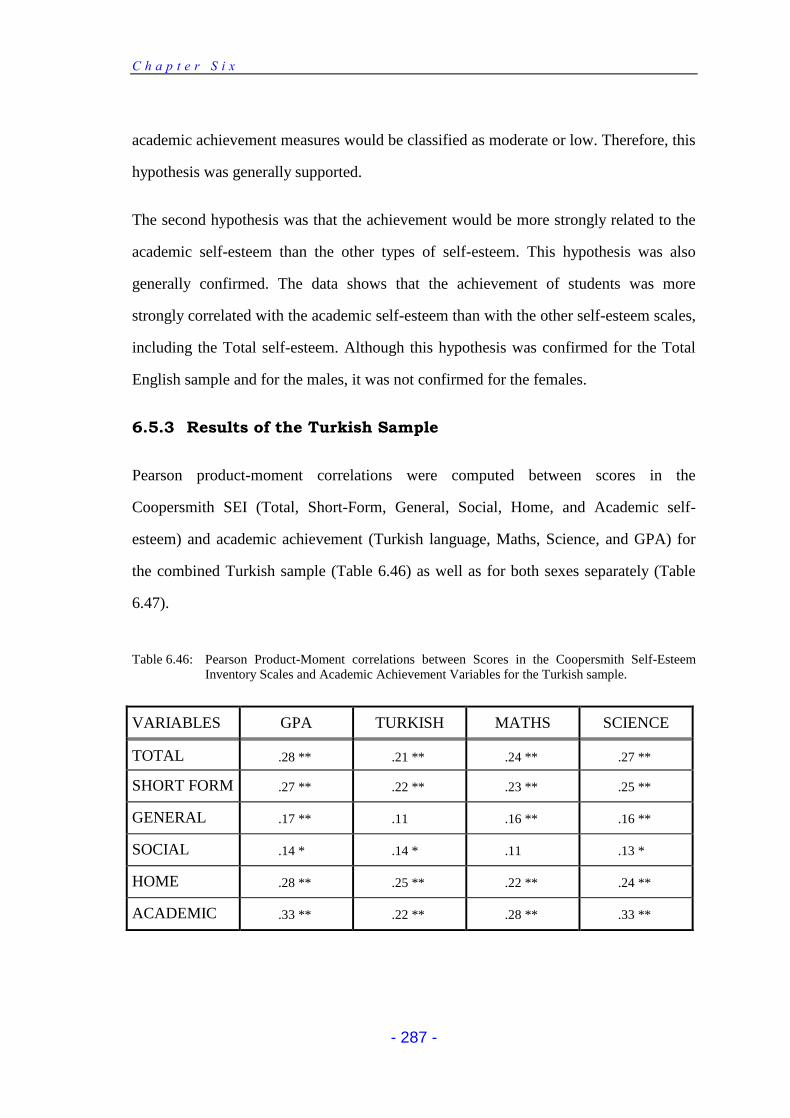
C h a p t e r S i x
- 287 -
academic achievement measures would be classified as moderate or low. Therefore, this
hypothesis was generally supported.
The second hypothesis was that the achievement would be more strongly related to the
academic self-esteem than the other types of self-esteem. This hypothesis was also
generally confirmed. The data shows that the achievement of students was more
strongly correlated with the academic self-esteem than with the other self-esteem scales,
including the Total self-esteem. Although this hypothesis was confirmed for the Total
English sample and for the males, it was not confirmed for the females.
6.5.3 Results of the Turkish Sample
Pearson product-moment correlations were computed between scores in the
Coopersmith SEI (Total, Short-Form, General, Social, Home, and Academic self-
esteem) and academic achievement (Turkish language, Maths, Science, and GPA) for
the combined Turkish sample (Table 6.46) as well as for both sexes separately (Table
6.47).
Table 6.46: Pearson Product-Moment correlations between Scores in the Coopersmith Self-Esteem Inventory Scales and Academic Achievement Variables for the Turkish sample.
VARIABLES GPA TURKISH MATHS SCIENCE
TOTAL .28 ** .21 ** .24 ** .27 **
SHORT FORM .27 ** .22 ** .23 ** .25 **
GENERAL .17 ** .11 .16 ** .16 **
SOCIAL .14 * .14 * .11 .13 *
HOME .28 ** .25 ** .22 ** .24 **
ACADEMIC .33 ** .22 ** .28 ** .33 **
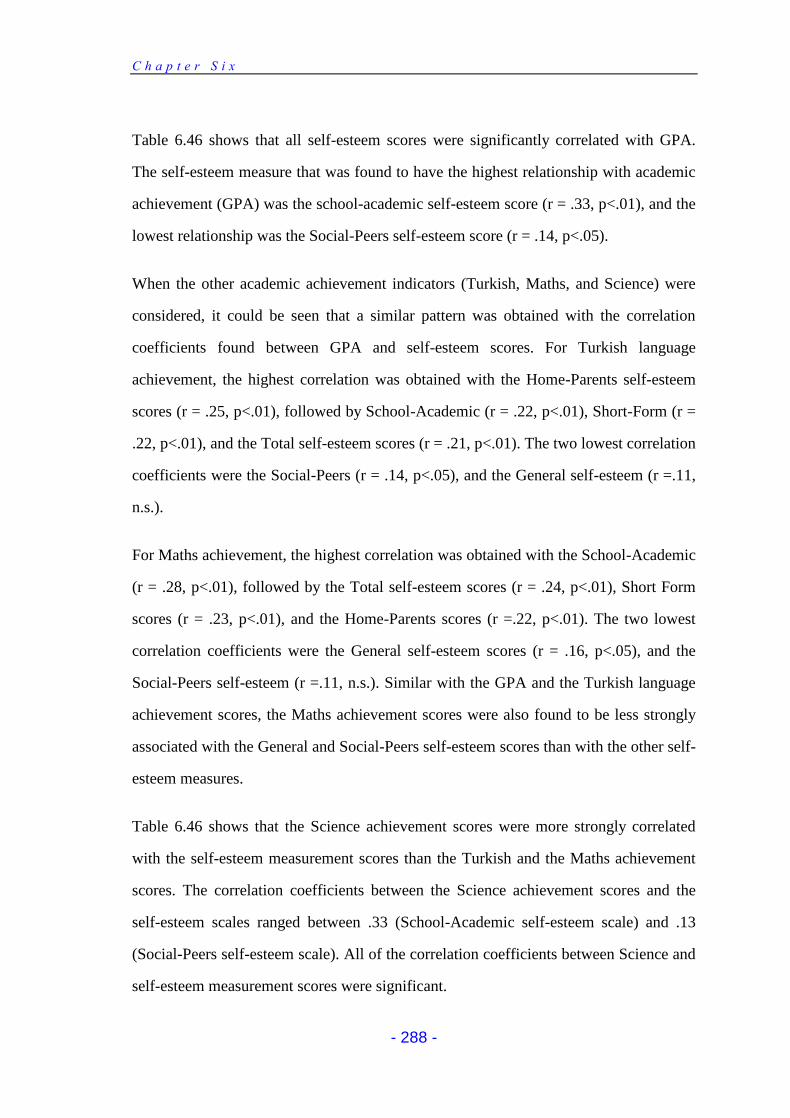
C h a p t e r S i x
- 288 -
Table 6.46 shows that all self-esteem scores were significantly correlated with GPA.
The self-esteem measure that was found to have the highest relationship with academic
achievement (GPA) was the school-academic self-esteem score (r = .33, p<.01), and the
lowest relationship was the Social-Peers self-esteem score (r = .14, p<.05).
When the other academic achievement indicators (Turkish, Maths, and Science) were
considered, it could be seen that a similar pattern was obtained with the correlation
coefficients found between GPA and self-esteem scores. For Turkish language
achievement, the highest correlation was obtained with the Home-Parents self-esteem
scores (r = .25, p<.01), followed by School-Academic (r = .22, p<.01), Short-Form (r =
.22, p<.01), and the Total self-esteem scores (r = .21, p<.01). The two lowest correlation
coefficients were the Social-Peers (r = .14, p<.05), and the General self-esteem (r =.11,
n.s.).
For Maths achievement, the highest correlation was obtained with the School-Academic
(r = .28, p<.01), followed by the Total self-esteem scores (r = .24, p<.01), Short Form
scores (r = .23, p<.01), and the Home-Parents scores (r =.22, p<.01). The two lowest
correlation coefficients were the General self-esteem scores (r = .16, p<.05), and the
Social-Peers self-esteem (r =.11, n.s.). Similar with the GPA and the Turkish language
achievement scores, the Maths achievement scores were also found to be less strongly
associated with the General and Social-Peers self-esteem scores than with the other self-
esteem measures.
Table 6.46 shows that the Science achievement scores were more strongly correlated
with the self-esteem measurement scores than the Turkish and the Maths achievement
scores. The correlation coefficients between the Science achievement scores and the
self-esteem scales ranged between .33 (School-Academic self-esteem scale) and .13
(Social-Peers self-esteem scale). All of the correlation coefficients between Science and
self-esteem measurement scores were significant.
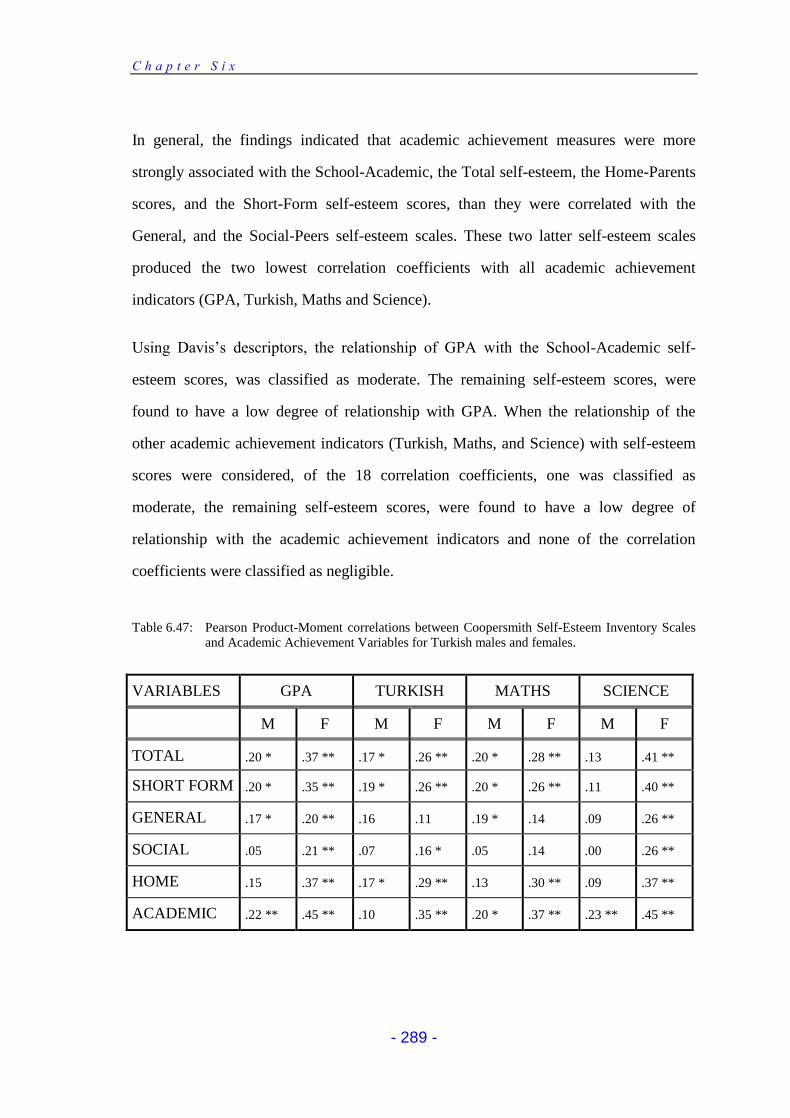
C h a p t e r S i x
- 289 -
In general, the findings indicated that academic achievement measures were more
strongly associated with the School-Academic, the Total self-esteem, the Home-Parents
scores, and the Short-Form self-esteem scores, than they were correlated with the
General, and the Social-Peers self-esteem scales. These two latter self-esteem scales
produced the two lowest correlation coefficients with all academic achievement
indicators (GPA, Turkish, Maths and Science).
Using Davis’s descriptors, the relationship of GPA with the School-Academic self-
esteem scores, was classified as moderate. The remaining self-esteem scores, were
found to have a low degree of relationship with GPA. When the relationship of the
other academic achievement indicators (Turkish, Maths, and Science) with self-esteem
scores were considered, of the 18 correlation coefficients, one was classified as
moderate, the remaining self-esteem scores, were found to have a low degree of
relationship with the academic achievement indicators and none of the correlation
coefficients were classified as negligible.
Table 6.47: Pearson Product-Moment correlations between Coopersmith Self-Esteem Inventory Scales and Academic Achievement Variables for Turkish males and females.
VARIABLES GPA TURKISH MATHS SCIENCE
M F M F M F M F
TOTAL .20 * .37 ** .17 * .26 ** .20 * .28 ** .13 .41 **
SHORT FORM .20 * .35 ** .19 * .26 ** .20 * .26 ** .11 .40 **
GENERAL .17 * .20 ** .16 .11 .19 * .14 .09 .26 **
SOCIAL .05 .21 ** .07 .16 * .05 .14 .00 .26 **
HOME .15 .37 ** .17 * .29 ** .13 .30 ** .09 .37 **
ACADEMIC .22 ** .45 ** .10 .35 ** .20 * .37 ** .23 ** .45 **
C h a p t e r S i x
- 290 -
When the relationship between academic achievement and self-esteem scores were
further examined for the Turkish males and females separately, it could be seen from
Table 6.47 that all self-esteem scores were significantly correlated with GPA, with the
exception of the Social-Peers and Home-Parents scales for males. For males, the self-
esteem measure that was found to have the highest relationship with academic
achievement (GPA) was the School-Academic self-esteem score (r = .22, p<.01),
followed by the Total self-esteem scores (r =.20, p<.01), the Short Form self-esteem
scores (r=.20, p<.01), and the General (r =.17, p<.05). The lowest relationship was the
Social-Peers self-esteem scores (r = .05, n.s.), followed by the Home-Parents self-
esteem scores (r = .15, n.s.). For females, the self-esteem measure that was found to
have the highest relationship with academic achievement (GPA) was the School-
Academic self-esteem score (r = .45, p<.01), followed by the Total self-esteem (r =.37,
p<.01), the Home-Parents self-esteem scores (r = .37, p<.01), the Short-Form self-
esteem scores (r =.35, p<.01), the Social self-esteem scores (r=.21, p<.01), and the
General self-esteem scale scores (r = .20, p<.01). The relationship between GPA and
self-esteem measures were stronger for the Turkish females than the Turkish males. For
females ,all of the correlation coefficients were significant at .01 level, while for males,
only one reached this significance level.
When the other academic achievement indicators (Turkish, Maths, and Science) were
examined, it could be seen from Table 6.47 that for Turkish language achievement, the
correlation coefficients ranged from .19 (Short-Form) to .07 (Social-Peers) for males,
and they ranged from .35 (School-Academic) to .11 (General self-esteem) for females.
Three out of six correlation coefficients between the Turkish language achievement and
the self-esteem measurements were significant for males whereas five were significant
for female students. The General, Social-Peers, and School-Academic self-esteem
scores for males, and only the General self-esteem scores for females, were non-
significantly correlated with their Turkish achievement scores.

C h a p t e r S i x
- 291 -
For Maths achievement, the correlation coefficients ranged from .20 (Total, Short-
Form, and School-Academic) to .05 (Social-Peers) for males, and they ranged from .37
(School-Academic) to .14 (General, and Social-Peers) for females. Four out six
coefficients were significant, both for males and females. The Social-Peers, and the
Home-Parents scale scores for males, and the General, and Social-Peers self-esteem
scores for females were non-significantly correlated with Maths achievement.
When the relationship between self-esteem measurements and the Science achievement
scores were examined, the correlation coefficients ranged from .23 (School-Academic)
to .00 (Social-Peers) for males, and they ranged from .45 (School-Academic) to .26
(General, and Social-Peers) for females. While all of the six correlation coefficients
between the Maths scores and self-esteem measurements were significant (p<.01) for
females, only one (School-Academic) was significant for male students. The data shows
that the self-esteem measurements have the strongest relationship with Science
achievement scores, for females, however, they were the lowest for males.
Using Davis’s descriptors, the relationship of GPA with Total, Short-Form, Home-
Parents, and the School-Academic self-esteem scores were classified as moderate. The
remaining two self-esteem scores, (General, and Social-Peers) were found to have a low
degree of relationship with GPA for females. For males, they were however, lower. For
them, all of the self-esteem scores were found to have a low degree of relationship with
GPA, with the exception of the relationship between Social-Peers and GPA which was
negligible.
When the relationship of the other academic achievement indicators (Turkish, Maths.,
and Science) with self-esteem scores were considered, of the 18 correlation coefficients,
7 were classified as moderate, and 11 were classified as low, for females. For males, 13
coefficients were classified as low, and 5 were classified as negligible.
C h a p t e r S i x
- 292 -
To summarise, the data indicates that the majority of the self-esteem scales had a
significant relationship with the academic achievement for the combined Turkish
sample, as well as for the male and female samples. The academic achievement scores
were found to be more strongly related to the School-Academic, Total, Short-Form and
the Home-Parents self-esteem scores than the Social-Peers, and the General self-esteem
scores. This pattern seems to be similar for males as well as for females. The findings in
this study indicate that the relationship between self-esteem and academic achievement
is much stronger for Turkish females than for Turkish males. 21 out of 24 coefficients
were significant for females, and 12 coefficients were significant for males. When both
sexes were combined, 22 out 24 correlation coefficients were found to be significant.
However when the Davis’ descriptors were considered, it could be seen that the
majority of the correlation coefficients between self-esteem and academic achievement
measures would be classified as moderate or low.
The first hypothesis for this section was that there would be a significant but moderate
relationship between self-esteem and academic achievement for the Turkish sample.
The data shows that the majority of the self-esteem scales had significant relationships
with academic achievement for the combined Turkish sample, as well as for the males
and females. Therefore, this hypothesis was generally supported.
The second hypothesis was that the achievement would be more strongly related to the
academic self-esteem than the other types of self-esteem. The data shows that the
achievement of students was more strongly correlated with the academic self-esteem
than the other self-esteem scales (including the Total self-esteem) for the combined
Turkish sample as well as for the male and the female groups. Therefore, this
hypothesis was confirmed.

C h a p t e r S i x
- 293 -
6.5.4. Discussion
The data indicates that most of the self-esteem scales had a significant relationship with
the academic achievements of the English and the Turkish samples, as well as for males
and females. These results are consistent with the literature (Uguroglu & Walberg,
1979; Burns, 1982; Hansford & Hattie, 1982; Gürel, 1986; Lee, 1986; Abdallah, 1989a;
Heyman, 1990). Purkey (1970) concluded that “there is a persistent and significant
relationship between the self-concept and academic achievement” (p. 27). Although the
majority of the correlation coefficients between self-esteem and academic achievement
measures were found to be either moderate or low, they were, however, significant.
When males and females within countries were compared it was found that in general,
self-esteem / achievement relationships were slightly stronger for the English females
than the English males, although academic self-esteem was more strongly associated
with the males’ achievement than the females’ achievement. When Turkish males and
females were compared, it was found that self-esteem / achievement relationships were
significantly stronger for the females than the males. Although the literature reviewed
was specifically concerned with the relationship between self-esteem and achievement,
a number of studies revealed contradictory findings related to sex differences. In
general, most of the studies contained findings which indicated a self-esteem and
achievement relationship which is either greater (a high correlation) for males than
females (Piers, 1969; Sears, 1970; Bagley, Mallick & Verma, 1979; Cheung, 1986; Sax,
1994), or significant correlations were found for males but not for females (Bledsoe,
1967; Kubiniec, 1970; Alberti, 1971; Gadzella, Williamson & Ginther, 1985). Some
studies have findings which indicated that for females, a self-esteem variable
contributed more to an achievement variable than for males (Rubin, 1978; Uguroglu &
Walberg, 1979; Abdallah, 1989a). But Jones & Grieneeks (1970) reported that self-
esteem was a better predictor of achievement for males than for females. Hansford &
C h a p t e r S i x
- 294 -
Hattie, 1982 found a stronger relationship between self-esteem and school achievement
for males than for females. Gadzella, Williamson, & Gunther (1985) reported that GPA
positively and significantly correlated with self-satisfaction, moral-ethical self, and
personal self for males, but not for females.
As Abdallah (1989a) points out, the differences between males and females can perhaps
be interpreted by considering that high academic achievement may negatively affect a
girl’s social image, with academic ability interfering with popularity. Consequently, the
academically oriented female may perceive her achievements as a barrier to her social
status and may begin to view herself in a less positive manner (Winchell et al., 1974;
Horner, 1972). Williams (1977) indicated that high achieving females experience a
paradox “because the feminine image does not include the display of intelligence,
competence, and skill mastery, nor is it compatible with high-level academic or
vocational achievement” (p. 185). In the present study, sex differences amongst Turkish
subjects may have resulted from significant changes in Turkish society in recent years.
The findings of this study suggest that an adequate degree of self-esteem is essential for
students, because it affects their achievement. Educational or academic achievement is
not, and cannot be, a product of a single factor. It is instead, an outcome of a series of
numerous and different interacting factors, the individual’s intelligence, abilities,
motivation, attitude and self-value. Although each of these are not sufficient as separate
and independent factors in achievement, positive self-perceptions of learners appear to
be generally necessary (Brookover, 1967; Purkey, 1970) and there have been numerous
studies supporting the importance of self-esteem in achievement. The question arises as
to whether teachers can enhance the self-esteem of pupils in order to increase their
achievement, and how they can do it.
As commonly accepted, the teacher is the most significant person affecting the self-
esteem of children after they enter school (Burns, 1982; Battle, 1981). This is because
C h a p t e r S i x
- 295 -
school has an environment that provides a wider range of interactions and learning
experiences that possibly affect the student’s feelings about himself / herself. It also
provides a suitable area in which to increase independence from parents. It allows more
exploration of the physical and the social environment and it places more emphasis on
the child’s own performance. Therefore the school is a place where academic, social
and physical evaluation take place and the teacher is a very important feedback agent.
Evaluation in school is also pervasive, continuous and systematic. Most of the children
are being evaluated many times every day and for most of the time there are some
failures as well as some success. Before and after examinations the child considers the
expectations of others and their reactions, and he / she cannot avoid non-verbal
feedback from teachers and peers.
At school the child faces more evaluation than he/she has faced at home, in academic
work, sporting activities and social behaviour. Most of the students face daily reminders
of their potential and their limitations. Rewards, punishments, success and failure are
part of the daily life of pupils at school. Although every child experiences failures and
success long before he/she reaches school age. It is only when a child enters the
classroom that their achievements or failures become official, in the sense that a public
record of their progress begins to accumulate and they must accept that the spirit of
evaluation will dominate their school years (Burns, 1982).
Although self-evaluation begins long before children enter school, it probably becomes
more clearly visible in school. Therefore, psychological experiences that the student
faces in school are likely to affect the individual’s self-esteem and therefore teachers
have a crucial role in being significant others. To emphasise the importance of teachers
in terms of creating high or low self-esteem of students Canfield & Wells (1976, p. 4)
state that “it is possible to change self-concepts, and it is possible for teachers to effect
the changes either way, both positive and negative”. Like our body and our thoughts,
C h a p t e r S i x
- 296 -
our emotions are changing as well. We know that the cells in our bodies are constantly
wearing out and being replaced, in fact we do not have a single cell now that was there
eight years ago. Over an eight-year cycle, the body is completely renewed (Fontana,
1988). The importance of self-esteem comes from its changeable character. There have
been numerous studies showing effectiveness of programmes in term of increasing
students’ self-esteem (Friedman et al., 1975; Zeeman, 1982; Omizo & Omizo, 1988;
Canfield, 1990; Necessary, 1993; Weaver & Matthews, 1993).
As being significant others, how teachers interact with their students significantly
affects their students’ self-esteem. One of the earliest studies by Staines (1958)
examined attitudes of a group of teachers and found that students with teachers who
used democratic methods, made positive comments and took into account the
consideration of the student’s self-concept, made positive changes in the self-concept of
their children. The students who were found to be insecure and maladjusted were those
whose teachers did not recognise the important role that perceptions of self, play, in the
learning process, and instead stressed correctness of subject matter. Staines made the
following comment:
... The educational significance of the self is reaffirmed when
it is realised that changes in the self picture are an inevitable
part of both outcomes and conditions of learning in every
classroom, whether or not the teacher is aware of them ... It
is clear that teaching methods can be adapted so that definite
teaching methods can be adapted so that definite changes of
the sought will occur in the self. The self can be deliberately
produced by suitable teaching methods (p. 109).
Although writers have claimed that many activities enhance self-esteem (e.g. Canfield
& Wells, 1976; Owens, 1991) empirical data in terms of the effectiveness of these
activities is not always strong (Battle, 1981). Some studies obtained empirical data
C h a p t e r S i x
- 297 -
supporting the effectiveness of activities in enhancing self-esteem. When self-esteem
enhancement programmes were examined it could be seen that most of them were based
on several factors. Most of the commonly used factors can be summarised as follow: a)
recognising the multi-dimensional nature of self-concept, b) developing feelings of self-
efficacy, c) unconditional positive regard, d) empathy, e) genuineness, f) balance
between inner and other sources of information about self-concept and g) moral
behaviour. Because the main objective of this study is not to develop a self-esteem
enhancement programme, no detailed information on activities and techniques is given
here. However, there have been several studies based on self-esteem enhancing
activities. They can be listed as follow: 100 Ways to Enhance Self-Esteem (Jack
Canfield & Harold Wells, 1976), Out From Behind the Desk (Chris Kingsley-Miles,
Sylvia McNamara, & Lesley Woodward, 1992), Self-Esteem Enhancement with
Children and Adolescents (Alice W. Pope, et al., 1988), Enhancing Self-Esteem in the
Classroom (Denis Lawrence, 1988), Looking Out / Looking In (Ronald B. Adler & Neil
Towne, 1987), Feeling Good - Raising Self-Esteem in the Primary School Classroom
(Noreen Wetton & Peter Cansell, 1993), Developing Understanding of Self and Other
(Don Dinkmeyer, 1970), Dimensions of Personality (Walter Limbacker, 1973).
Although, there has been numerous evidence supporting the crucial role of self-esteem
in education, particularly in the achievement process, it has to be pointed out that only
limited practical work has been conducted to enhance the self-esteem of students, both
in Turkey and Britain. In order to fulfil their responsibility, it is essential for teachers
that they attend to the self-esteem needs of their students, because self-esteem is a major
variable affecting academic achievement in developing children and youth. Educators
particularly in Turkey have unfortunately often been unsuccessful in their attempts to
develop the potential of students because they have failed to recognise the role that self-
esteem plays in the educational process. A consequence of this failure is vividly
C h a p t e r S i x
- 298 -
reflected in emphasising the development of cognitive skills and they have generally
tended to ignore the affective domain of the developing child.
What can be done? First of all staff development is necessary. All staff members should
be aware of the role of self-esteem. Through effective inservice programmes they can
come to understand the contribution of self-esteem to students' well-being and learning.
Youngs (1993) stresses “when educators feel unprepared, their own self-esteem suffers,
and they lessen their commitment to teaching excellence”. There is evidence showing
that the more positive the teachers’ self-esteem, the more accurate their evaluation of
pupils’ self-esteem will be (Itskowitz et al., 1989). Studies on the teacher’s self-esteem
found that the teachers’ defensiveness scores were slightly high (Fitts, 1970), and the
majority of teachers were found to have exaggerately positive self-concepts, exceeding
the normal range (Itskowitz et al., 1986, & 1989). The findings are in agreement with
the approach of Rogers according to whom, the more positive a person’s self-esteem,
the more he/she is able to perceive others accurately (Rogers, 1965). There are other
studies showing that there is a link between positive self-concept and effective teachers
(Combs, 1965; Rosenberg, 1955; Murray, 1972). The study of Peck et al., (1977) shows
that teachers with a highly positive attitude produce greater increase in student self-
esteem than medium or low teachers, in that order. Similarly, teachers who rated
themselves high on efficiency produced larger gains in student self-esteem than medium
or low teachers, in that order. These studies show that to improve students’
achievement, we need to improve students’ self-esteem, as well as teachers’ self-
esteem. Improving teachers’ self-esteem in order to improve students’ self-esteem is not
a main objective of this study. No studies have been traced about teachers’ self-esteem
and its link with students’ self-esteem in Turkish literature, therefore it might be a
useful research project for future studies.
C h a p t e r S i x
- 299 -
Apart from the popularity of self-esteem, the credibility of the self-esteem movement
has been questioned since the 1990s in America. The main criticism focused on two
issues: a) the activities and special programmes to enhance self-esteem were not
realistic or genuine, b) establishing state funded Self-Esteem Task Forces and projects
were expensive and did not warrant the cast incurred.
One of the issues that causes credibility problems for the self-esteem movement is that
it appears to be one of the bases for the political correctness movement, whose
educational manifestation is called censorship. In her article called “the negative
consequences of the self-esteem movement”, Neuman (1992) claims that censorship in
the name of never offending anyone and trying to make everyone “feel good” is both
intellectually dishonest and educationally unsound. She states “when you reduce
everything to bland pap, you are missing great opportunities for discussion and
understanding”. What she actually means is that some activities, in order to enhance
self-esteem of children, are not the source of genuine self-esteem. She also emphasises
some contradiction in the practical work of self-esteem. She states: “we give our
students a mixed message when we suggest that there is no such thing as failure, that
their progress will be judged on their own personal growth, and then publicise test
results. We are doing our students a disservice by not giving them a safe experience of
failure ...”. She emphasises that a great deal of effort and planning must go into
programmes that genuinely improve self-esteem. Jones (1990) is another author who
criticises the self-esteem movement. He ironically states that “self-esteem is the social
vaccine that could be the answer to all our problems, few of us have enough of it and
there’s no ‘ten-easy-steps’ formula to attaining it”. Like Neuman he too criticises the
cost of the Self-Esteem Task Force. Gwin (1990) also questions the effectiveness of
self-esteem in achievement. He supports the notion that there is no link between self-
esteem and achievement. In order to substantiate his idea he gives the results of a recent
international survey of industrialised nations which revealed that Korean students
C h a p t e r S i x
- 300 -
ranked at the top in mathematics, and American students ranked at the bottom. When
asked if they thought they were good at the subjects, Americans ranked first and the
Koreans last. For more detail of the criticism on the self-esteem issue, there are studies
by Johnson (1993), Black (1991), and Stevenson (1992).
When these criticisms are examined it can be seen that one of the sources where the
problem arises is probably the concept of self-esteem. As Black (1991) points out, more
than 20 terms are used to approximately define the meaning of self-esteem (such as self-
worth, self-image, self-awareness). The imprecise terminology contributes to confusion,
misunderstanding, and misapplication of findings. Another issue is probably that
teachers and administrators know little about self-esteem (Black, 1991) therefore they
may consider their activities as raising students’ self-esteem, when in fact they may be
misguided. The experience of Black (1991) is interesting: “recently, one fifth grade
teacher told me she never has her students do any classwork on Fridays because she
wants one day each week to improve the children’s self-esteem. On Fridays, her
students play games they bring from home, make videotapes, and watch movies.” That
sounds like fun, but does it have anything to do with self-esteem?
Although there have been several criticisms and discussions on the practical
effectiveness of self-esteem programmes in the USA, most of the studies show that well
organised self-esteem intervention programmes are effective in increasing students’
self-esteem and their achievement. The USA is a country where improving self-esteem
is a state policy. Furthermore there is a National Council for Self-Esteem and many
counties have Centres for self-esteem, and state funded Self-Esteem Task Forces are
available (Jones, 1990; Reasoner, 1992). As a result of these developments, education
has begun to integrate self-esteem into its curriculum in most school district (Gwin,
1990). When self-esteem studies in Turkey were examined it can be seen that the
number of studies were minimal and almost all of them were focused on measuring the
C h a p t e r S i x
- 301 -
self-esteem of students by using one of the translated version of instruments. Almost all
of these studies were based on an individual academic interest, not on school or state
policy. As far as the researcher is aware, there have not been any self-esteem studies
based on intervention programmes in Turkey. One of the reasons is that perhaps
education authorities, school directors, and teachers are not aware of the role of self-
esteem in achievement, because of the lack of relevant research in this area. Another
reason might be the difficulty of integrating self-esteem into the curriculum. It is not
perhaps an easy job for a teacher to develop and employ a special integration self-
esteem programme into curriculum. To be able to achieve that, professional experts are
required who are experienced in both the theoretical and practical aspects of self-
esteem. Furthermore, the organisation of inservice education programmes for teachers
in order to develop their skills in terms of self-esteem is not an easy task and requires
economical support from the government, since state funds in educational research are
very limited. Due to these reasons self-esteem is not recognised sufficiently in the
Turkish educational system, and teachers prefer to focus on only cognitive aspects of
the learning process.
C h a p t e r S i x
- 302 -
6.6 RELATIONSHIP between LOCUS of CONTROL & ACHIEVEMENT
6.6.1 Introduction
The purpose of this section is to determine if a relationship exists between academic
achievement and Global and Academic locus of control for English and Turkish year-11
secondary school students.
In order to find out the relationship of academic achievement with the Global and
Academic locus of control scores, data was analysed for both the English and the
Turkish samples, as well as separately for both sexes. The English sample consisted of
190 year-11 secondary school students in Hinckley (Leicestershire). Of the 190
students, 100 were males and 90 were females. The Turkish sample consisted of 315
year-11 secondary school students in Ankara. Of the 315 students, 151 were males and
164 were females. Although 315 Turkish students were subjects for the Academic locus
of control, 230 of them (M=100, F=90) were subjects for the Global locus of control
(for more information about the subjects of the study, see the Methodology Chapter).
The Global locus of control scores of students were measured by the Nowicki-
Strickland Internal-External Control Scale, whereas the Academic locus of control
scores of the students were measured by Crandall et al.’s Intellectual Achievement
Responsibility Scale (IAR). Academic achievement scores were measured by the
November Teacher Assessment Scores (English language, Maths, Science and GPA) for
the English sample, and the January Exam Scores (Turkish language, Maths, Science
and GPA) for the Turkish sample.
The interpretations of these correlation coefficients will be based on the two criteria: a)
test of significance. For this criteria, if a correlation coefficient reaches the significance
level of p<.05, it will be accepted as significant. b) the obtained correlation coefficients
will be assessed by descriptors developed by Davis (1971), and are as follows:
C h a p t e r S i x
- 303 -
Negligible association = .00 - .09
Low association = .10 - .29
Moderate association = .30 - .49
Substantial association = .50 - .69 and
Very strong association = .70 or higher.
The results on the locus of control / academic achievement relationship will be
presented separately for the English and the Turkish samples. However the findings will
be discussed at the end of the section. Finally, the results of the hypotheses which
related to this section will be summarised. These are as follows:
Hypothesis 1: There would be a significant but moderate relationship between
global locus of control and academic achievement for both of the
samples.
Hypothesis 2: There would be a significant but moderate relationship between
academic locus of control and academic achievement for both of the
samples.
Hypothesis 3: Academic achievement would be more strongly related to the
academic locus of control than the global locus of control.
6.6.2 Results of the English Sample
Pearson product-moment correlations were computed between academic achievement
(GPA, English achievement, Maths, and Science) and Global, and Academic locus of
control (Total, Success, and Failure) scores for the combined English sample (see Table
6.48) as well as for both sexes separately (Table 6.49).
Table 6.48 shows that both the Global, and the Academic locus of control (IAR-Total,
IAR-Success, and IAR-Failure) scores were significantly correlated with GPA. The
locus of control measure that was found to have the highest relationship with academic
achievement (GPA) was the Global locus of Control score (r = .31, p<.01), and the

C h a p t e r S i x
- 304 -
lowest relationship was the Academic locus of control-Failure (IAR-Failure) score (r =
.14, p<.05). The data clearly shows that the Global locus of control scores were more
strongly associated with the GPA than the Academic locus of control scales (IAR-Total,
IAR-Success, and IAR-Failure).
Table 6.48: Pearson Product-Moment correlations between Global, and Academic Locus of Control scales (IAR-Total, IAR-Success, and IAR-Failure) and Academic Achievement for the English sample
VARIABLES GPA ENGLISH MATHS SCIENCE
Global LOC .31 ** .21 ** .29 ** .33 **
IAR-Total .18 * .18 * .14 * .15 *
IAR-Success .16 * .13 .15 * .16 *
IAR-Failure .14 * .18 * .09 .09
When the other academic achievement indicators (English, Maths, and Science) were
considered, it could be seen from Table 6.48 that, like GPA, they were more strongly
correlated with the Global locus of control scores than with the Academic locus of
control scales. The correlation coefficients between the academic achievement
indicators (English, Maths, and Science) and the Global locus of control, ranged from
.33 (Science) to .21 (English), whereas between the academic achievement indicators
and the Academic locus of control (IAR-Total) there was a range from .18 (English) to
.14 (Maths.). Although all of the correlation coefficients between the Global locus of
control and the achievement indicators (English, Maths, and Science) were significant
at .01 level, the correlation coefficients between the Total Academic locus of control
and the achievement indicators (English, Maths, and Science) were significant at .05
level. Furthermore, when the IAR-Success, and the IAR-Failure subscales of the
Academic locus of control scale were examined, it could be seen that they were less
strongly correlated with the academic achievement than the IAR-Total scores were. One
C h a p t e r S i x
- 305 -
correlation coefficient for the IAR-Success (English achievement), and two for the IAR-
Failure (Maths and Science) were non-significant. The IAR-Success scores were
slightly more strongly associated with academic achievement scores than were the IAR-
Failure scores.
Using Davis’s descriptors, the relationship of GPA with the Global locus of control was
classified as moderate whereas the Academic locus of control scores (IAR-Total, IAR-
Failure, and IAR-Failure) were all found to have a low degree of relationship with GPA.
When the relationship of the other academic achievement indicators (English, Maths
and Science) with the Global, and the Academic locus of control scores were examined,
of the three correlation coefficients, one was classified as moderate, the other two,
however ,were classified as low, for the Global locus of control. For the Academic
locus of control scales (IAR-Total, IAR-Failure, and IAR-Failure), of the nine
correlation coefficients, seven were classified as low, two of them, however, were
negligible.
When the relationship between GPA and the General, and Academic locus of control
(the IAR-Total, IAR-Success, and IAR-Failure) scores were further examined for the
English males and females separately, it could be seen (Table 6.49) that although the
GPA scores had a significant correlation with the Global locus of control (p<.01) for
both males and females, they were non-significantly correlated with the Academic locus
of control scales, including the IAR-Total, as well as the IAR-Success, and the IAR-
Failure.
When the other academic achievement indicators (English, Maths, and Science) were
considered, it could be seen (Table 6.49) that the Global locus of control scores of both
male and female students were significantly correlated with the English, Maths, and
Science achievement scores. The only exception of that was the relationship between
the Global locus of control and the English achievement for males, it was non-
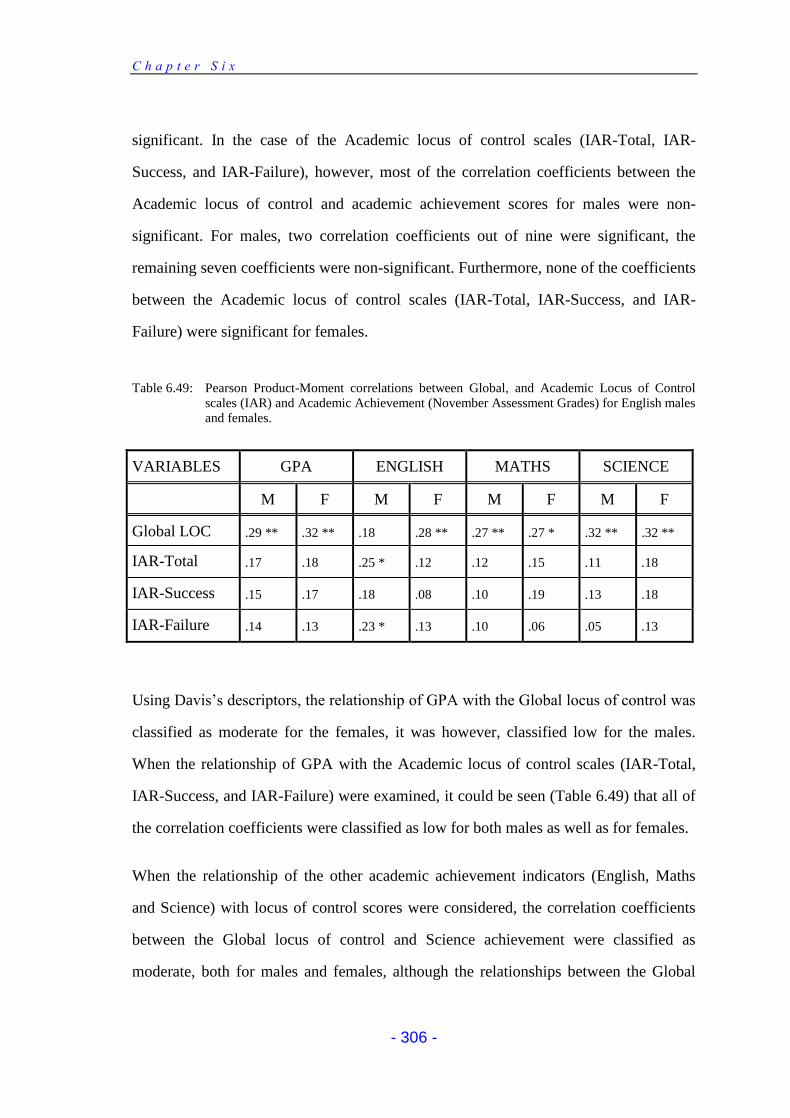
C h a p t e r S i x
- 306 -
significant. In the case of the Academic locus of control scales (IAR-Total, IAR-
Success, and IAR-Failure), however, most of the correlation coefficients between the
Academic locus of control and academic achievement scores for males were non-
significant. For males, two correlation coefficients out of nine were significant, the
remaining seven coefficients were non-significant. Furthermore, none of the coefficients
between the Academic locus of control scales (IAR-Total, IAR-Success, and IAR-
Failure) were significant for females.
Table 6.49: Pearson Product-Moment correlations between Global, and Academic Locus of Control scales (IAR) and Academic Achievement (November Assessment Grades) for English males and females.
VARIABLES GPA ENGLISH MATHS SCIENCE
M F M F M F M F
Global LOC .29 ** .32 ** .18 .28 ** .27 ** .27 * .32 ** .32 **
IAR-Total .17 .18 .25 * .12 .12 .15 .11 .18
IAR-Success .15 .17 .18 .08 .10 .19 .13 .18
IAR-Failure .14 .13 .23 * .13 .10 .06 .05 .13
Using Davis’s descriptors, the relationship of GPA with the Global locus of control was
classified as moderate for the females, it was however, classified low for the males.
When the relationship of GPA with the Academic locus of control scales (IAR-Total,
IAR-Success, and IAR-Failure) were examined, it could be seen (Table 6.49) that all of
the correlation coefficients were classified as low for both males as well as for females.
When the relationship of the other academic achievement indicators (English, Maths
and Science) with locus of control scores were considered, the correlation coefficients
between the Global locus of control and Science achievement were classified as
moderate, both for males and females, although the relationships between the Global
C h a p t e r S i x
- 307 -
locus of control and the English and the Maths achievements were classified as low for
both sexes. When the relationship of English, Maths and Science with the Academic
locus of control scales were examined, all of the correlation coefficients for males were
classified as low, except the relationship between the IAR-Failure and Science which
was classified as negligible. For females, seven out of nine correlation coefficients were
classified as low, although two correlation coefficients were classified as negligible.
To summarise, the data indicates that there is a significant relationship between the
General locus of control and academic achievement for males and females, as well as
for the combined sample. However, the data also shows that the Academic locus of
control scales were not correlated with academic achievement as strongly as were the
Global locus of control scale scores. The data shows that the majority of the correlation
coefficients were significant between the Academic locus of control scales (IAR-Total,
IAR-Success, and IAR-Failure) and the academic achievement indicators (English,
Maths and Science), when the combined English sample (male + female) was
considered. However, when the analyses were carried out for males and females
separately, the data showed that the Academic locus of control scales were not
significantly correlated with academic achievement.
6.6.3 Results of the Turkish Sample
Pearson product-moment correlations were computed between academic achievement
(GPA, Turkish achievement, Maths, and Science) and Global, and Academic locus of
control (Total, Success, and Failure) scores for the combined Turkish sample (Table
6.50) as well as for both sexes separately (Table 6.51).
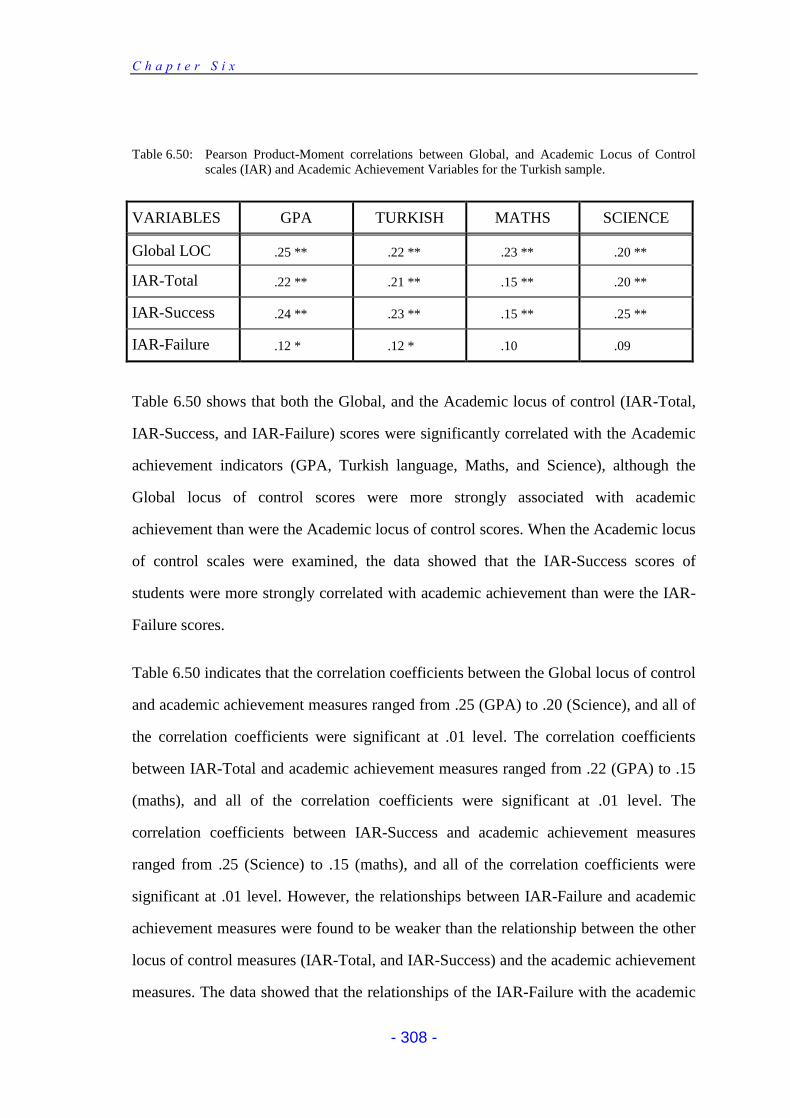
C h a p t e r S i x
- 308 -
Table 6.50: Pearson Product-Moment correlations between Global, and Academic Locus of Control scales (IAR) and Academic Achievement Variables for the Turkish sample.
VARIABLES GPA TURKISH MATHS SCIENCE
Global LOC .25 ** .22 ** .23 ** .20 **
IAR-Total .22 ** .21 ** .15 ** .20 **
IAR-Success .24 ** .23 ** .15 ** .25 **
IAR-Failure .12 * .12 * .10 .09
Table 6.50 shows that both the Global, and the Academic locus of control (IAR-Total,
IAR-Success, and IAR-Failure) scores were significantly correlated with the Academic
achievement indicators (GPA, Turkish language, Maths, and Science), although the
Global locus of control scores were more strongly associated with academic
achievement than were the Academic locus of control scores. When the Academic locus
of control scales were examined, the data showed that the IAR-Success scores of
students were more strongly correlated with academic achievement than were the IAR-
Failure scores.
Table 6.50 indicates that the correlation coefficients between the Global locus of control
and academic achievement measures ranged from .25 (GPA) to .20 (Science), and all of
the correlation coefficients were significant at .01 level. The correlation coefficients
between IAR-Total and academic achievement measures ranged from .22 (GPA) to .15
(maths), and all of the correlation coefficients were significant at .01 level. The
correlation coefficients between IAR-Success and academic achievement measures
ranged from .25 (Science) to .15 (maths), and all of the correlation coefficients were
significant at .01 level. However, the relationships between IAR-Failure and academic
achievement measures were found to be weaker than the relationship between the other
locus of control measures (IAR-Total, and IAR-Success) and the academic achievement
measures. The data showed that the relationships of the IAR-Failure with the academic
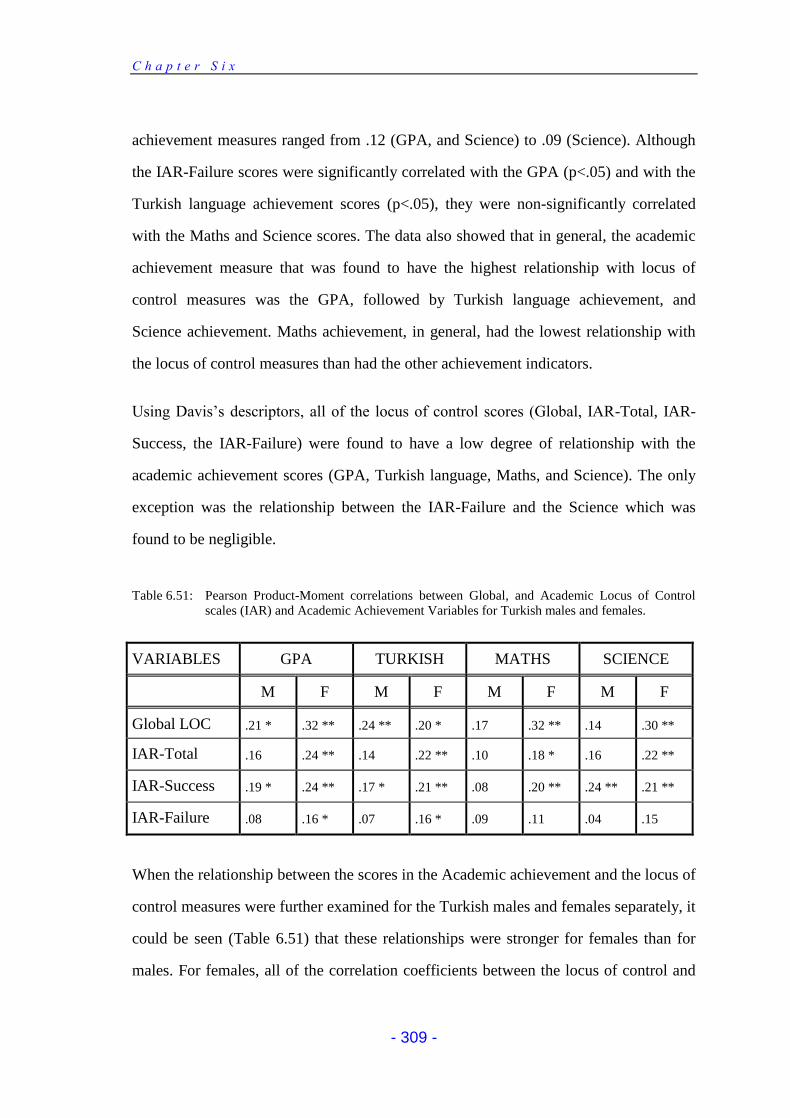
C h a p t e r S i x
- 309 -
achievement measures ranged from .12 (GPA, and Science) to .09 (Science). Although
the IAR-Failure scores were significantly correlated with the GPA (p<.05) and with the
Turkish language achievement scores (p<.05), they were non-significantly correlated
with the Maths and Science scores. The data also showed that in general, the academic
achievement measure that was found to have the highest relationship with locus of
control measures was the GPA, followed by Turkish language achievement, and
Science achievement. Maths achievement, in general, had the lowest relationship with
the locus of control measures than had the other achievement indicators.
Using Davis’s descriptors, all of the locus of control scores (Global, IAR-Total, IAR-
Success, the IAR-Failure) were found to have a low degree of relationship with the
academic achievement scores (GPA, Turkish language, Maths, and Science). The only
exception was the relationship between the IAR-Failure and the Science which was
found to be negligible.
Table 6.51: Pearson Product-Moment correlations between Global, and Academic Locus of Control scales (IAR) and Academic Achievement Variables for Turkish males and females.
VARIABLES GPA TURKISH MATHS SCIENCE
M F M F M F M F
Global LOC .21 * .32 ** .24 ** .20 * .17 .32 ** .14 .30 **
IAR-Total .16 .24 ** .14 .22 ** .10 .18 * .16 .22 **
IAR-Success .19 * .24 ** .17 * .21 ** .08 .20 ** .24 ** .21 **
IAR-Failure .08 .16 * .07 .16 * .09 .11 .04 .15
When the relationship between the scores in the Academic achievement and the locus of
control measures were further examined for the Turkish males and females separately, it
could be seen (Table 6.51) that these relationships were stronger for females than for
males. For females, all of the correlation coefficients between the locus of control and
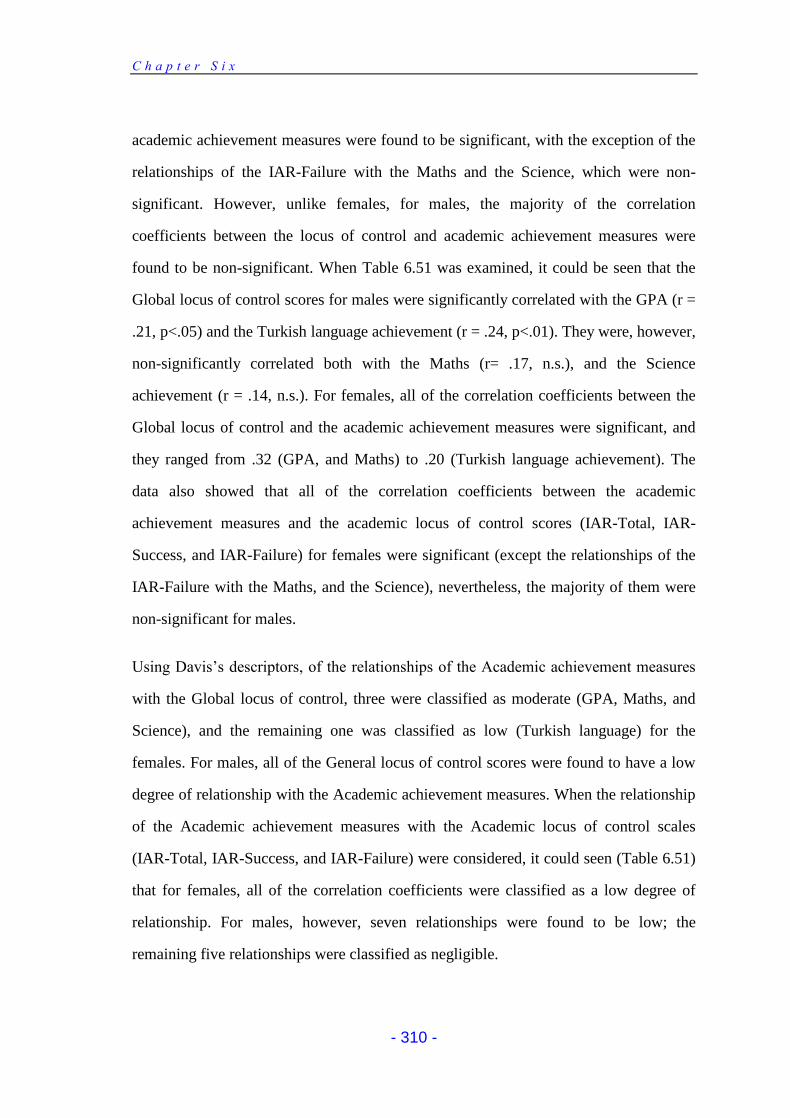
C h a p t e r S i x
- 310 -
academic achievement measures were found to be significant, with the exception of the
relationships of the IAR-Failure with the Maths and the Science, which were non-
significant. However, unlike females, for males, the majority of the correlation
coefficients between the locus of control and academic achievement measures were
found to be non-significant. When Table 6.51 was examined, it could be seen that the
Global locus of control scores for males were significantly correlated with the GPA (r =
.21, p<.05) and the Turkish language achievement (r = .24, p<.01). They were, however,
non-significantly correlated both with the Maths (r= .17, n.s.), and the Science
achievement (r = .14, n.s.). For females, all of the correlation coefficients between the
Global locus of control and the academic achievement measures were significant, and
they ranged from .32 (GPA, and Maths) to .20 (Turkish language achievement). The
data also showed that all of the correlation coefficients between the academic
achievement measures and the academic locus of control scores (IAR-Total, IAR-
Success, and IAR-Failure) for females were significant (except the relationships of the
IAR-Failure with the Maths, and the Science), nevertheless, the majority of them were
non-significant for males.
Using Davis’s descriptors, of the relationships of the Academic achievement measures
with the Global locus of control, three were classified as moderate (GPA, Maths, and
Science), and the remaining one was classified as low (Turkish language) for the
females. For males, all of the General locus of control scores were found to have a low
degree of relationship with the Academic achievement measures. When the relationship
of the Academic achievement measures with the Academic locus of control scales
(IAR-Total, IAR-Success, and IAR-Failure) were considered, it could seen (Table 6.51)
that for females, all of the correlation coefficients were classified as a low degree of
relationship. For males, however, seven relationships were found to be low; the
remaining five relationships were classified as negligible.
C h a p t e r S i x
- 311 -
To summarise, the data indicated that there was a significant relationship between the
General, and the Academic locus of control and academic achievement measures for the
combined Turkish sample (males + females). However, the data also showed that the
Global locus of control scale scores were more strongly correlated with academic
achievement than were the Academic locus of control scales. The data also showed that
IAR-Failure had the weakest relationships compared to the other Academic locus of
control scales (IAR-Total, and IAR-Success) than with the academic achievement
indicators (GPA, Turkish language, Maths, and Science) when the combined Turkish
sample (male + female) was considered.
However, when the analyses were carried out for males and females separately, the data
showed that in general, the relationships between locus of control (Global, IAR-Total,
IAR-Success, and IAR-Failure) and the academic achievement measures (GPA, Turkish
language, Maths, and Science) were stronger for the females than for the males.
Although the majority of the relationships between locus of control and academic
achievement measures were significant for females (14 / 16), they were non-significant
for males (5 / 14). The Academic locus of control measure that was found to have the
weakest relationship with academic achievement measures was the IAR-Failure scale
for both males and females.
6.6.4 Discussion
The findings of this study show that there is a significant relationship between locus of
control and academic achievement. These results are also in agreement with past
studies. Most of the published studies have resulted in a significant relationship between
locus of control questionnaire scores and achievement, at least for some of the groups of
student studies. The correlation between school achievement and locus of control is
frequently interpreted to mean that an internal locus of control affects school
achievement. Ames, Ames, & Felker (1976); Friend & Neale (1972), for example,
C h a p t e r S i x
- 312 -
report that children tend to take more responsibility for their success than their failures.
Thus, the relationship between locus of control and achievement might merely
demonstrate that students who do well in school take responsibility for their
performance and students who do poorly attribute responsibility to external causes. The
relationship between locus of control and achievement could also be spurious; shared
variance with some third variable such as socioeconomic status, or IQ, might account
for the relationship. A positive relation between locus of control beliefs and
achievement is logical and intuitively appealing. Logically, if success is positively
valued, people who feel more able to control outcomes should exert more effort. Also,
internals and externals may react differently to success and failure. Internals take pride
in good outcomes and feel shame in bad outcomes, whereas externals experience less
intense emotions (Phares, 1976). This difference should enhance the relative
“attractiveness” of the success experience for the internal. In addition to the logical
appeal, a number of studies have associated internal locus of control beliefs with
behaviours that affect the probability of attaining success. For instance, the study of
Bledsoe & Baber (1978) and Lefcourt (1976) suggest that internals are more socially
competent than externals. Traub (1982a) found that externals tend to exhibit less
assertiveness. Rotter & Mulry (1965) have found a positive association between
internality and preference to perform in skill, rather than in chance situations. Findings
also indicate a positive relationship between externality and anxiety (Bar-Tal & Bar-
Zohar, 1980). Each tendency should mean internals have a greater likelihood of
achievement.
In line with the past review studies, Phares (1976) found that internals tend to show
superior academic achievement. In general, the achievement of internal students, as
reflected in school grades and test scores, were more substantial than those of externals.
The conclusion of Lefcourt’s review (1976) was also similar to that of Phares (1976). In
another review Bar-Tal & Bar-Zohar (1977) have found that internal perception of
C h a p t e r S i x
- 313 -
control tends to be positively correlated with academic achievement and is
systematically related to behaviours which increase the probability of successful
academic performance. They concluded that “there is a firm trend indicating that the
perception of locus of control is related to academic achievement. This trend suggests
that the more internal the individual’s orientation, the higher the individual’s
achievement” (p. 132). Uguroglu & Walberg (1979), investigating the relationship
between motivational factors and academic achievement, found the average correlation
of r=.32 between locus of control and grades or ability tests among 13 correlations in
their more general review. After reviewing 98 studies, Findley & Cooper (1983) found
that more internal beliefs are associated with greater academic achievement. Of the 275
hypothesis tests, 193 resulted in positive findings, 25 resulted in negative findings, and
the others fell into the null category. In all, 126 significant positive findings and 9
significant negative findings were reported. The general finding of the present study
supports the findings of the previous review studies.
One of the research questions of the present study was to investigate whether academic
locus of control scale was more strongly related to achievement than was global locus
of control. It seems logical that a specific locus of control measure would allow greater
prediction of behaviour than would a broad generalised expectancy measure. Therefore,
one might expect school achievement to be more highly correlated with perceptions of
control in academic achievement situations than with perceptions of control in diverse
situations. However, the present study shows that, unlike prediction, the academic locus
of control scale (IAR) was less strongly correlated with the academic achievement than
the global locus of control scale was for the English and the Turkish groups. Stipek &
Weisz’s (1981) questioned the same problem in their review studies and found very
little support for their assumption that locus of control measures concerning only
achievement situations were more likely to be correlated with achievement than were
global locus of control measures. Although their studies obtained no significant
C h a p t e r S i x
- 314 -
difference, a trend was revealed for academic locus of control measures to have a
stronger relation. In another review study, Findley & Cooper (1983) investigated the
same problem and found that the relationship between specific locus of control
measures and academic achievement was stronger than the relationship between
academic achievement and global locus of control measures, which supports the
suggestion of Stipek & Weisz (1981). Their study revealed that stronger effects were
associated with academic locus of control measures (r=.30) than global locus of control
scales (r=.18). Therefore, the finding of this study contradicted the conclusion of past
studies. When the data of the present studies was further investigated for the English
and the Turkish males and females separately, even stronger effects were associated
with global locus of control than the academic locus of control. In fact the data showed
that the majority of the correlation coefficients between academic locus of control and
academic achievement were nonsignificant for the English males and females.
Furthermore, the data of the present study suggests that the relationship between locus
of control and academic achievement is stronger among females than males, and the sex
differences are higher in the Turkish group than in the English group. These findings do
not support the conclusions of past studies, whose findings generally indicate that the
relationship between locus of control and academic achievement of boys looks stronger
than that of girls (Phares, 1976; Lefcourt, 1976); Findley & Cooper, 1983); Dyal, 1984;
and Majdub, 1990). Lefcourt (1976) suggested that the relations between locus of
control and achievement may be stronger for males than for females. Findley & Cooper
(1983) found that the relationship between locus of control and academic achievement
was more substantial among males than among females (r=0.20 for males, and r=0.11
for females). However, Stipek & Weisz (1981) found no evidence that the relationship
between locus of control and achievement of boys was stronger than of girls in their
review. However, they suggested that sex differences might be explained by social
desirability. Social desirability, as a moderator of gender differences, is not testable with
C h a p t e r S i x
- 315 -
the present data. Contrary to past research, the findings of the present data indicate that
the locus of control / achievement relationship is stronger among the Turkish female
subjects than among the Turkish male subjects. However, the previous Turkish
literature which was examined did not provide any data in order to examine sex
differences in locus of control / achievement relationship. Only two previous Turkish
studies were identified investigating the locus of control / achievement relationship, but
none of them provided data for males and females separately. Although, Duke &
Nowicki (1974) point out that fear of success of female students leads to defensive
externality, i.e. denial of personal responsibility for success, Phares (1976) however,
points out that defensive externality works better for males than females. Maybe the
reason for that is because of greater cultural pressures for success, the Turkish males
seemingly have a greater need to protect themselves against failure by recourse to
external attributions. It is also possible that such sex differences are mediated by
differential cultural roles commonly assigned to boys and girls. According to Platt et al.,
(Phares, 1976) the moderating effects of sex may be due to the greater socialisation
undergone by females as contrasted to the greater responsiveness of males to situational
considerations. Moreover, Majdub (1990) emphasises the importance of motivation.
Although the relation of motivation with achievement and locus of control may provide
some explanation for the inconsistency of the relation between academic locus of
control and achievement, the present study failed to examine the effect of motivation on
the relation between locus of control and academic achievement.
6.6.5 Conclusion
From the results of the present study these basic conclusions can be identified: a) locus
of control and academic achievement are significantly positively related, but the
magnitude of the relation is small to medium, b) global locus of control is more strongly
correlated with achievement than is the academic locus of control, in both the English
C h a p t e r S i x
- 316 -
and Turkish groups, particularly when the data was further investigated for each sex, c)
the locus of control / achievement relationship looks stronger among females than
males, particularly in the Turkish group.
The first hypothesis of this section was that there would be a significant but moderate
relationship between global locus of control and academic achievement for the English
and the Turkish subjects. The data showed that the global locus of control scores were
significantly correlated with the academic achievement (GPA) for the English and
Turkish samples, as well as for males and females. Using Davis’s descriptors, the
relationship of GPA with the global locus of control were classified as moderate for the
combined English sample, and low for the combined Turkish sample. The separate
analyses for males and females showed that although the correlations were classified as
moderate for the English and the Turkish males, they were classified low for the
females in both countries. Therefore, the first hypothesis was confirmed by the findings
of the present study.
Similarly, it was expected that academic achievement would be significantly correlated
with academic locus of control. The data showed that the academic locus of control
scale scores (IAR-Total, IAR-Success, and IAR-Failure) were significantly correlated
with the academic achievement (GPA) for the English and the Turkish samples. When
these relationships were further examined for males and females separately, it was
found to be significant only for the Turkish females. While all of the correlations
between GPA and academic locus of control scales (IAR-Total, IAR-Success, and IAR-
Failure) were significant for the Turkish females, they were nonsignificant for the
English males and females. One significant correlation that was obtained for the
Turkish males was between the GPA and the IAR-Success. Using Davis’s descriptors,
all of the correlation coefficients between academic achievement (GPA) and the
academic locus of control measures (IAR-Total, IAR-Success, and IAR-Failure) were
C h a p t e r S i x
- 317 -
found to be low for the English and the Turkish samples as well as for males and
females in both countries. The only exception was that the correlation coefficient
between the GPA and the IAR-Failure was classified as negligible for the Turkish
males. Therefore, the second hypothesis was partially confirmed.
The third hypothesis was that academic achievement would be more strongly related to
the academic locus of control than the global locus of control. The data clearly showed
that, unexpectedly, the GPA scores of the subjects were more strongly associated with
the global locus of control scores than with the academic locus of control scores for all
groups, as well as for males and females in both countries. Therefore, the third
hypothesis was rejected.
C h a p t e r S i x
- 318 -
6.7 MULTIPLE REGRESSION ANALYSIS
6.7.1 Introduction
In order to answer the question “What are the most important predictors of academic
achievement? Multiple regression analyses were carried out using the Stepwise
procedure. In using the multiple regression technique, the aim is to identify those
variables that best predict the key variable of academic achievement. As the multiple
regression technique uses partial correlations, the confounding effect of variables can be
controlled.
The Stepwise method is a combination of both Forward and Backward. It is the one
which is most commonly used and is a recommended method (Meyer, 1993). In the
stepwise multiple regression approach, the variable with the largest F-value is entered
into the equation first (the manner of Forward selection), then another variable is
entered. The first variable is examined in the manner of Backward selection for
elimination. This continues until all variables are examined and no more variables meet
entry or elimination criteria. At each subsequent step, the variable that makes the
greatest contribution to the multiple correlation is entered, providing its F-value exceeds
the level specified. This variable will be the one that has the highest partial correlation
with the criterion variable after all the variables already in the equation have been
partialled out. The stepwise programme also removes from the equation any variable
that has lost its original usefulness as a predictor in the light of the contributions made
by variables entered at a later stage.
In this section, results of the regression analyses will be reported separately for the
English and Turkish groups. Data will also be further investigated for males and
females separately in both groups. Finally, the results of the hypotheses which related to
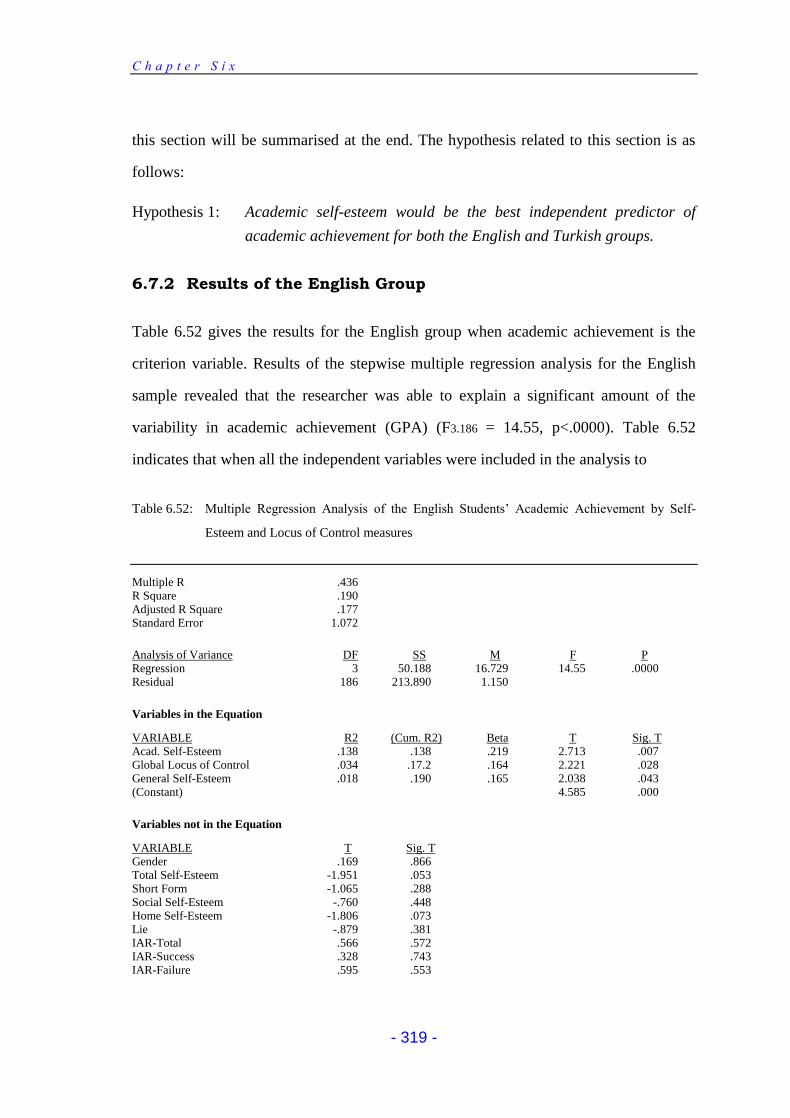
C h a p t e r S i x
- 319 -
this section will be summarised at the end. The hypothesis related to this section is as
follows:
Hypothesis 1: Academic self-esteem would be the best independent predictor of
academic achievement for both the English and Turkish groups.
6.7.2 Results of the English Group
Table 6.52 gives the results for the English group when academic achievement is the
criterion variable. Results of the stepwise multiple regression analysis for the English
sample revealed that the researcher was able to explain a significant amount of the
variability in academic achievement (GPA) (F3.186 = 14.55, p<.0000). Table 6.52
indicates that when all the independent variables were included in the analysis to
Table 6.52: Multiple Regression Analysis of the English Students’ Academic Achievement by Self-
Esteem and Locus of Control measures
Multiple R .436 R Square .190 Adjusted R Square .177 Standard Error 1.072
Analysis of Variance DF SS M F P Regression 3 50.188 16.729 14.55 .0000 Residual 186 213.890 1.150
Variables in the Equation
VARIABLE R2 (Cum. R2) Beta T Sig. T Acad. Self-Esteem .138 .138 .219 2.713 .007 Global Locus of Control .034 .17.2 .164 2.221 .028 General Self-Esteem .018 .190 .165 2.038 .043 (Constant) 4.585 .000
Variables not in the Equation
VARIABLE T Sig. T Gender .169 .866 Total Self-Esteem -1.951 .053 Short Form -1.065 .288 Social Self-Esteem -.760 .448 Home Self-Esteem -1.806 .073 Lie -.879 .381 IAR-Total .566 .572 IAR-Success .328 .743 IAR-Failure .595 .553
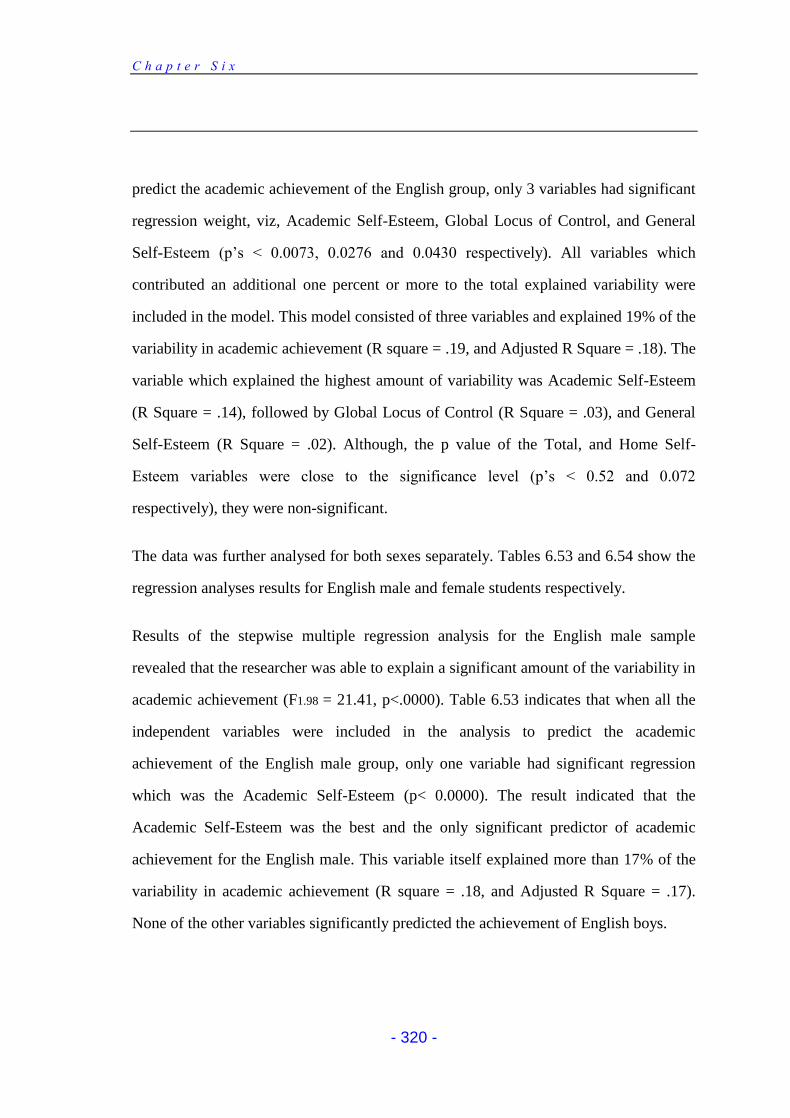
C h a p t e r S i x
- 320 -
predict the academic achievement of the English group, only 3 variables had significant
regression weight, viz, Academic Self-Esteem, Global Locus of Control, and General
Self-Esteem (p’s < 0.0073, 0.0276 and 0.0430 respectively). All variables which
contributed an additional one percent or more to the total explained variability were
included in the model. This model consisted of three variables and explained 19% of the
variability in academic achievement (R square = .19, and Adjusted R Square = .18). The
variable which explained the highest amount of variability was Academic Self-Esteem
(R Square = .14), followed by Global Locus of Control (R Square = .03), and General
Self-Esteem (R Square = .02). Although, the p value of the Total, and Home Self-
Esteem variables were close to the significance level (p’s < 0.52 and 0.072
respectively), they were non-significant.
The data was further analysed for both sexes separately. Tables 6.53 and 6.54 show the
regression analyses results for English male and female students respectively.
Results of the stepwise multiple regression analysis for the English male sample
revealed that the researcher was able to explain a significant amount of the variability in
academic achievement (F1.98 = 21.41, p<.0000). Table 6.53 indicates that when all the
independent variables were included in the analysis to predict the academic
achievement of the English male group, only one variable had significant regression
which was the Academic Self-Esteem (p< 0.0000). The result indicated that the
Academic Self-Esteem was the best and the only significant predictor of academic
achievement for the English male. This variable itself explained more than 17% of the
variability in academic achievement (R square = .18, and Adjusted R Square = .17).
None of the other variables significantly predicted the achievement of English boys.
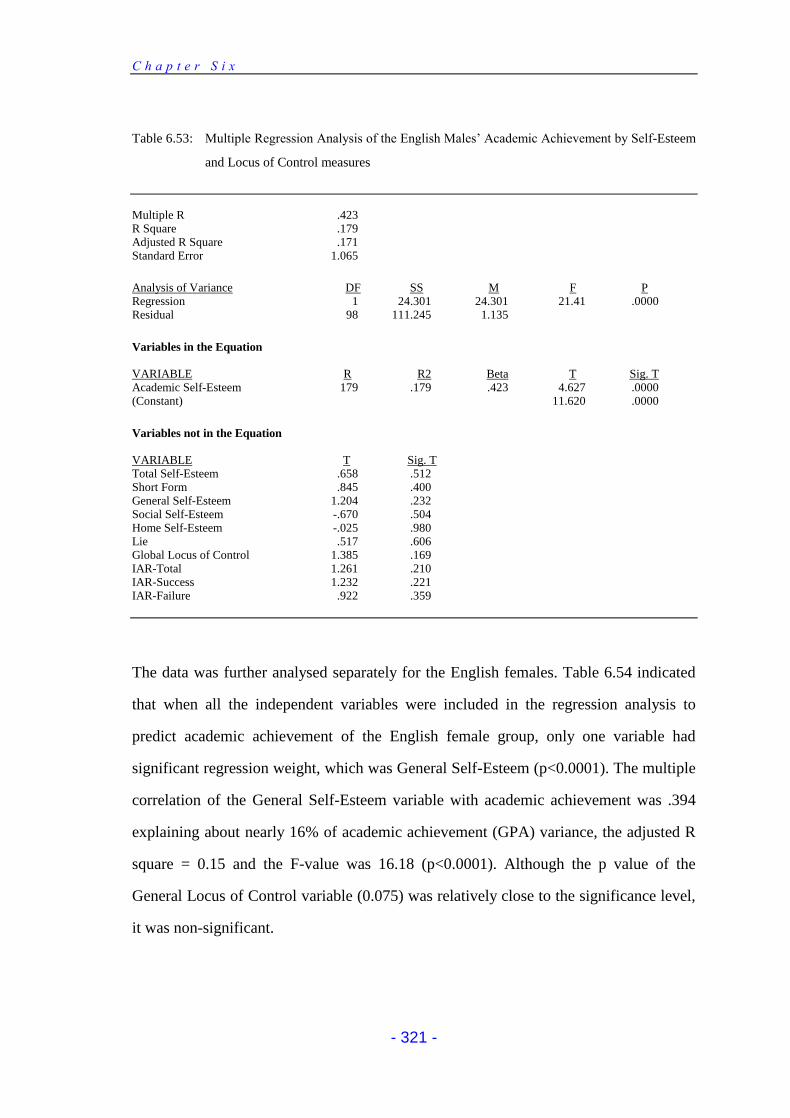
C h a p t e r S i x
- 321 -
Table 6.53: Multiple Regression Analysis of the English Males’ Academic Achievement by Self-Esteem
and Locus of Control measures
Multiple R .423 R Square .179 Adjusted R Square .171 Standard Error 1.065
Analysis of Variance DF SS M F P Regression 1 24.301 24.301 21.41 .0000 Residual 98 111.245 1.135
Variables in the Equation
VARIABLE R R2 Beta T Sig. T Academic Self-Esteem 179 .179 .423 4.627 .0000 (Constant) 11.620 .0000
Variables not in the Equation
VARIABLE T Sig. T Total Self-Esteem .658 .512 Short Form .845 .400 General Self-Esteem 1.204 .232 Social Self-Esteem -.670 .504 Home Self-Esteem -.025 .980 Lie .517 .606 Global Locus of Control 1.385 .169 IAR-Total 1.261 .210 IAR-Success 1.232 .221 IAR-Failure .922 .359
The data was further analysed separately for the English females. Table 6.54 indicated
that when all the independent variables were included in the regression analysis to
predict academic achievement of the English female group, only one variable had
significant regression weight, which was General Self-Esteem (p<0.0001). The multiple
correlation of the General Self-Esteem variable with academic achievement was .394
explaining about nearly 16% of academic achievement (GPA) variance, the adjusted R
square = 0.15 and the F-value was 16.18 (p<0.0001). Although the p value of the
General Locus of Control variable (0.075) was relatively close to the significance level,
it was non-significant.
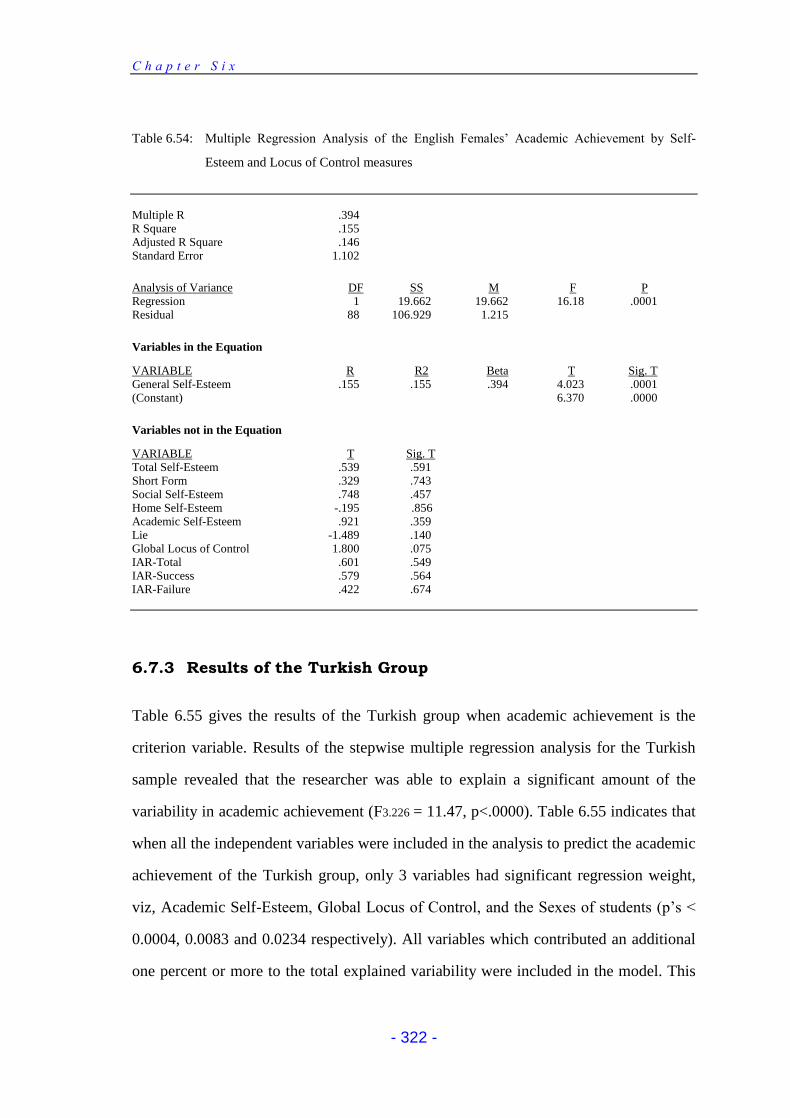
C h a p t e r S i x
- 322 -
Table 6.54: Multiple Regression Analysis of the English Females’ Academic Achievement by Self-
Esteem and Locus of Control measures
Multiple R .394 R Square .155 Adjusted R Square .146 Standard Error 1.102
Analysis of Variance DF SS M F P Regression 1 19.662 19.662 16.18 .0001 Residual 88 106.929 1.215
Variables in the Equation
VARIABLE R R2 Beta T Sig. T General Self-Esteem .155 .155 .394 4.023 .0001 (Constant) 6.370 .0000
Variables not in the Equation
VARIABLE T Sig. T Total Self-Esteem .539 .591 Short Form .329 .743 Social Self-Esteem .748 .457 Home Self-Esteem -.195 .856 Academic Self-Esteem .921 .359 Lie -1.489 .140 Global Locus of Control 1.800 .075 IAR-Total .601 .549 IAR-Success .579 .564 IAR-Failure .422 .674
6.7.3 Results of the Turkish Group
Table 6.55 gives the results of the Turkish group when academic achievement is the
criterion variable. Results of the stepwise multiple regression analysis for the Turkish
sample revealed that the researcher was able to explain a significant amount of the
variability in academic achievement (F3.226 = 11.47, p<.0000). Table 6.55 indicates that
when all the independent variables were included in the analysis to predict the academic
achievement of the Turkish group, only 3 variables had significant regression weight,
viz, Academic Self-Esteem, Global Locus of Control, and the Sexes of students (p’s <
0.0004, 0.0083 and 0.0234 respectively). All variables which contributed an additional
one percent or more to the total explained variability were included in the model. This
C h a p t e r S i x
- 323 -
model consisted of three variables and explained more than 13% of the variability in
academic achievement (R square = .133, and Adjusted R Square = .121). The variable
which explained the highest amount of variability was Academic Self-Esteem (R
Square = .083), followed by Global Locus of Control (R Square = .029), and Sex (R
Square = .020) variables. None of the other independent variables reached the
significance level, although the p value of the Home Self-Esteem variable was closer to
the significance level (p< 0.09) than the other variables, it was however non-significant.
Table 6.55: Multiple Regression Analysis of the Turkish Students’ Academic Achievement by Self-
Esteem and Locus of Control measures Multiple R .364 R Square .132 Adjusted R Square .121 Standard Error 1.433
Analysis of Variance DF SS M F P Regression 3 70.651 23.550 11.47 .0000 Residual 226 463.961 2.053
Variables in the Equation
VARIABLE R2 R2 (Cum.) Beta T Sig. T Academic Self-Esteem .083 .083 .236 3.595 .0004 Global Locus of Control .029 .112 .175 2.665 .0083 Gender .020 .132 -.142 -2.283 .0234 (Constant) 6.320 .0000
Variables not in the Equation
VARIABLE T Sig. T Total Self-Esteem -.094 .925 Short Form .254 .800 General Self-Esteem -.500 .618 Social Self-Esteem -1.170 .243 Home Self-Esteem 1.677 .095 Lie -.052 .958
IAR-Total .180 .857 IAR-Success 1.222 .223 IAR-Failure -.776 .439
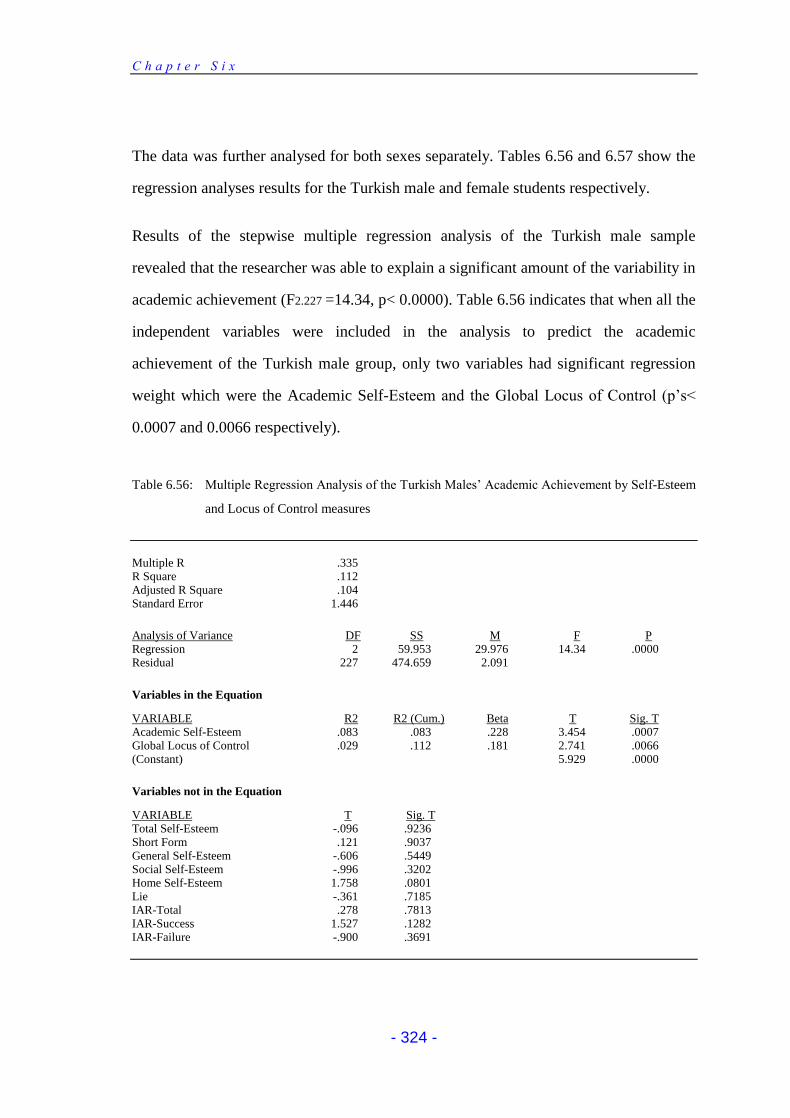
C h a p t e r S i x
- 324 -
The data was further analysed for both sexes separately. Tables 6.56 and 6.57 show the
regression analyses results for the Turkish male and female students respectively.
Results of the stepwise multiple regression analysis of the Turkish male sample
revealed that the researcher was able to explain a significant amount of the variability in
academic achievement (F2.227 =14.34, p< 0.0000). Table 6.56 indicates that when all the
independent variables were included in the analysis to predict the academic
achievement of the Turkish male group, only two variables had significant regression
weight which were the Academic Self-Esteem and the Global Locus of Control (p’s<
0.0007 and 0.0066 respectively).
Table 6.56: Multiple Regression Analysis of the Turkish Males’ Academic Achievement by Self-Esteem
and Locus of Control measures
Multiple R .335 R Square .112 Adjusted R Square .104 Standard Error 1.446
Analysis of Variance DF SS M F P Regression 2 59.953 29.976 14.34 .0000 Residual 227 474.659 2.091
Variables in the Equation
VARIABLE R2 R2 (Cum.) Beta T Sig. T Academic Self-Esteem .083 .083 .228 3.454 .0007 Global Locus of Control .029 .112 .181 2.741 .0066 (Constant) 5.929 .0000
Variables not in the Equation
VARIABLE T Sig. T Total Self-Esteem -.096 .9236
Short Form .121 .9037 General Self-Esteem -.606 .5449 Social Self-Esteem -.996 .3202 Home Self-Esteem 1.758 .0801 Lie -.361 .7185 IAR-Total .278 .7813 IAR-Success 1.527 .1282 IAR-Failure -.900 .3691
C h a p t e r S i x
- 325 -
The results indicated that Academic Self-Esteem was the best predictor of academic
achievement and this variable itself explained more than 8% of academic achievement
(R square = 0.083), followed by Global Locus of Control (R square = 0.029). These two
variables together explained more than 11% of the variability in academic achievement
(R square = .112, and Adjusted R Square = .104). None of the other variables
significantly predicted the achievement of the Turkish boys. It is worth mentioning that,
although it was non-significant (p<0.08), the Home-Parents Self-Esteem scores of the
Turkish boys were found to be a better predictor of achievement than the other
independent variables.
The data was further analysed separately for the Turkish females. Table 6.57 indicates
that when all the independent variables were included in the regression analysis to
predict academic achievement of the Turkish female group, only two variables had
significant regression weight, which were the Academic, and the Home-Parents Self-
Esteem variables (p’s <0.0006 and 0.0076 respectively). The multiple correlation of
both the variables with academic achievement was .49 explaining more than 24% of
academic achievement (GPA) variance, the adjusted R square = 0.23 and the F-value
was 17.18 (p<0.0000). The data showed that Academic Self-Esteem is the best
predictor of the academic achievement of the Turkish female students, and this variable
itself predicted more than 19% of the achievement variance. As the second best
independent predictor, the Home-Parents Self-Esteem variable predicted more than 5%
of the academic achievement variance. None of the other independent variables were
found to be a significant predictor of academic achievement for the Turkish girls.
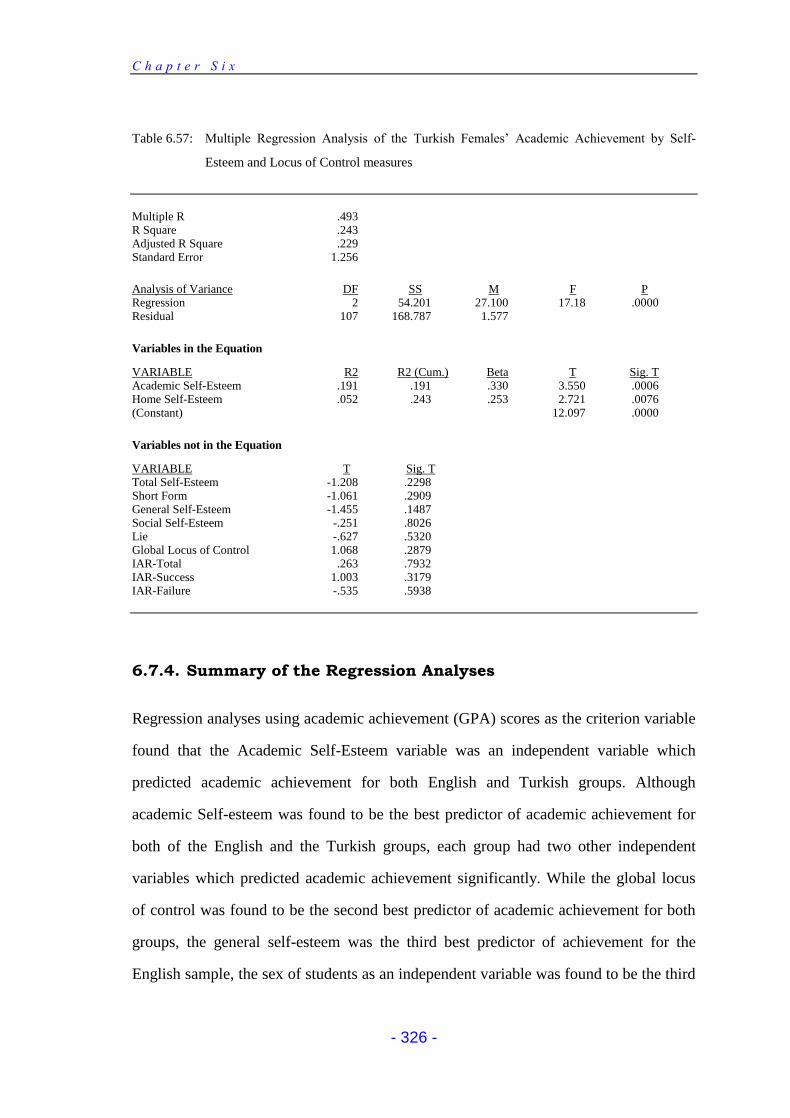
C h a p t e r S i x
- 326 -
Table 6.57: Multiple Regression Analysis of the Turkish Females’ Academic Achievement by Self-
Esteem and Locus of Control measures
Multiple R .493 R Square .243 Adjusted R Square .229 Standard Error 1.256
Analysis of Variance DF SS M F P Regression 2 54.201 27.100 17.18 .0000 Residual 107 168.787 1.577
Variables in the Equation
VARIABLE R2 R2 (Cum.) Beta T Sig. T Academic Self-Esteem .191 .191 .330 3.550 .0006 Home Self-Esteem .052 .243 .253 2.721 .0076 (Constant) 12.097 .0000
Variables not in the Equation
VARIABLE T Sig. T Total Self-Esteem -1.208 .2298 Short Form -1.061 .2909 General Self-Esteem -1.455 .1487 Social Self-Esteem -.251 .8026 Lie -.627 .5320 Global Locus of Control 1.068 .2879 IAR-Total .263 .7932 IAR-Success 1.003 .3179 IAR-Failure -.535 .5938
6.7.4. Summary of the Regression Analyses
Regression analyses using academic achievement (GPA) scores as the criterion variable
found that the Academic Self-Esteem variable was an independent variable which
predicted academic achievement for both English and Turkish groups. Although
academic Self-esteem was found to be the best predictor of academic achievement for
both of the English and the Turkish groups, each group had two other independent
variables which predicted academic achievement significantly. While the global locus
of control was found to be the second best predictor of academic achievement for both
groups, the general self-esteem was the third best predictor of achievement for the
English sample, the sex of students as an independent variable was found to be the third
C h a p t e r S i x
- 327 -
best predictor of achievement for the Turkish group. Although academic self-esteem
was the best predictor of academic achievement for both the English and the Turkish
groups, it may be worth mentioning that it predicted the academic achievement of the
English students better than of the Turkish students. This variable explained 14% of the
achievement scores of the English students while it explained only 8% of the Turkish
students.
When the analyses were carried out to find out the best predictor of academic
achievement separately for males and females in both the English and the Turkish
samples, it was found again that the academic self-esteem as an independent variable
was the best predictor of academic achievement for the Turkish males and females as
well as for the English males. The only exception was for the English females. For
them, general self-esteem was the best predictor of academic achievement. Although
there was only one independent variable that significantly predicted achievement of the
English males (academic self-esteem) as well as females (general self-esteem), there
were two independent variables that significantly predicted achievement of the Turkish
males and females. Whilst the Home-Parents self-esteem variable was the second
significant predictor of achievement for the Turkish females, in contrast the global locus
of control variable was the second significant predictor for the Turkish males.
As far as the prediction of the achievement of students is concerned, the results of
regression analysis show that the independent variables account for not more than 24%
of the variance in academic achievement for any group. They account for only 19% of
the variance in achievement for the English group and 13% of the variance for the
Turkish group. Where sexes of the samples are considered, the data shows that the
independent variables account for 18% of the variance in achievement for the English
males and only 16% of the variance for the English females. Where the Turkish males
and females are concerned, the results of the regression analysis show that the
C h a p t e r S i x
- 328 -
independent variables account for more percentage of the variance in achievement for
females than for males. While only 11% of the variance in males’ academic
achievement is explained by the independent variables, the independent variables
account for 24% of the variance in the females’ achievement.
It is evident from the present study that the absence of intellectual factors from the
variables must have created limits in the prediction of achievement. In a study of Gose
et al., (1980) it was found that the contribution of intelligence and the related academic
self-concept measure of intelligence and the related academic self-concept measure
accounted for more achievement variance than did intelligence alone. However, in the
present study, no measure of intellectual ability was included which could, however,
have taken up some of the residual variance. In this study, the independent variables
only explain about 19% of the variance in the English group, and 13% in the Turkish
group. It is possible that the remaining 81% for the English group and 89% for the
Turkish group can be explained by other multiple factors, such as school, home,
environmental and cognitive factors. These may also include internal school factors,
socioeconomic status, environment, cognitive ability, etc.
6.7.5 Conclusion
It was hypothesised that academic self-esteem would be the best independent predictor
of academic achievement for both the English and Turkish groups. The results of the
regression analyses confirmed this hypothesis. Regression analyses using academic
achievement (GPA) scores as the criterion variable found that the Academic Self-
Esteem variable was the best independent variable in the prediction of academic
achievement for both of the groups. However, the results of regression analysis show
that academic self-esteem accounted for only 13% of the variance in achievement for
the English group and 8% of the variance for the Turkish group. Where all independent
variables were analysed together, they explained 19% of the variance for the English
C h a p t e r S i x
- 329 -
group and 13% of the variance for the Turkish group. It is possible that the remaining
81% for the English group and 87% for the Turkish group can be explained by other
multiple factors such as school, home, environmental and cognitive factors. It is evident
from the present study that the absence of intellectual factors from the variables must
create limits in the prediction of achievement.
CHAPTER 7
GENERAL SUMMARY, CONCLUSIONS,
IMPLICATIONS & LIMITATIONS OF THE
STUDY
C h a p t e r S e v e n
- 331 -
7.1 INTRODUCTION
This chapter will attempt to summarise the main findings from the present research and
relate them to the initial hypotheses. The findings of this study will also be combined
with conclusions. The wider implications of the work will also be considered together
with suggestions for future research.
7.2 GENERAL SUMMARY & CONCLUSIONS
1. The first question posed in this research concerned the reliability of the
instruments (the Coopersmith SEI, the Nowicki-Strickland I-E Control Scale, and
Crandall et al.’s IAR Scale) for the English and the Turkish samples.
One of the aims was to assess the reliability of the instruments used in this study for
year 11 English and Turkish secondary school students. Past studies show that the
Coopersmith SEI is not only one of the most popular and most commonly used self-
esteem inventories, but there also exist a great number of studies which support its
validity and reliability. However, in searching the published literature, the present
researcher could find no Turkish studies assessing the reliability of the Coopersmith SEI
for Turkish secondary school students. Moreover, the Turkish literature revealed that
the instrument had never been used in any research predicting the relationship between
self-esteem and achievement for Turkish secondary school students. It was also
discovered that there have been only a few studies on locus of control. Crandall et al.’s
IAR Scale, the most commonly used academic locus of control measurement in the
Western World, has not been used for studies of Turkish secondary school students.
Furthermore, the reliability of the instrument has not been assessed for any age group in
Turkey. In the case of the Nowicki-Strickland I-E Control Scale, there has been only
one Turkish study assessing the reliability of the instrument for secondary school
C h a p t e r S e v e n
- 332 -
students. Therefore, it seemed both crucial and worthwhile to estimate the reliability of
these instruments for Turkish students.
In this study, in order to assess the reliability of the instruments, the KR-20 formula was
employed as well as the Split-Half reliability formulae. To find out the split-half
reliability (or as it is sometimes called, the coefficients of internal consistency) of the
instruments, firstly the 1st half-2nd half and odd-even items were used and their
correlation coefficients were found, and later the Spearman-Brown formula was
applied. The intercorrelation of the scales was also examined for the self-esteem as well
as for the locus of control variables.
The KR-20 indices indicated that the internal consistency of the Coopersmith SEI scales
ranged from 0.86 (Total self-esteem) to 0.59 (Social-Peer self-esteem) for the English
sample, and from 0.81 (Total self-esteem) to 0.45 (Social-Peer self-esteem) for the
Turkish sample. The KR-20 indices also showed that the internal consistency of the
global locus of control scale (the Nowicki-Strickland I-E Control Scale) were 0.62 and
0.64 for the English and the Turkish groups respectively. The internal consistency of the
academic locus of control scale (Crandall et al.’s IAR Scale) found 0.72 and 0.59 for the
English and the Turkish samples respectively. When split-half reliability coefficients
were calculated for the English and the Turkish groups, similar results were obtained.
To summarise the present results, the reliability of the Coopersmith SEI, the Nowicki-
Strickland I-E Control Scale, and Crandall et al.’s IAR scale all showed reasonably high
internal consistency for the English as well as for the Turkish sample. The findings of
this study also indicated that the instruments which were used were as reliable as the
previous studies had reported.
2. The second empirical question was to find out self-esteem differences between the
English and the Turkish samples. Sex differences in self-esteem were also
C h a p t e r S e v e n
- 333 -
considered together with this question. The hypotheses related to this section were
as follows:
Hypothesis 1: The English subjects would have higher self-esteem than their Turkish
counterparts.
Hypothesis 2: There would be no sex differences in self-esteem for whether the
Turkish or the English subjects.
Another aim of this study was to compare differences in self-esteem in English and
Turkish students. The importance of cross-cultural studies cannot be overemphasised.
As Lambert & Weisbrod (1971) point out, cross-cultural studies not only provide
information and ideas about behaviour in other cultures, which is of interest in itself,
but they may indirectly increase our understanding of behaviour in our culture. The
findings of past cross-cultural research suggest that cross-cultural comparisons of self-
esteem studies are few. As Bond & Cheung (1983) report, there has been a remarkably
small number of studies on self-esteem undertaken in cultures outside North America
and Northern Europe. Moreover, cross-cultural research on self-esteem has not only
been few but also as Knight et al., (1978) point out it has been inconclusive.
Furthermore, most of these studies have concentrated on examining self-esteem
differences between different ethnic groups within the same country. However, there
has not been any cross-cultural study comparing the self-esteem of British and Turkish
subjects, in the literature.
It was hypothesised that there would be no major sex differences in self-esteem for both
the English and Turkish subjects. The majority of the reviewed studies fail to support a
relationship between sex and self-esteem both in Western countries and Turkey. Past
Turkish studies reveal that eleven out of twelve found no significant differences
between the self-esteem of male and female students. Therefore, it was hypothesised
C h a p t e r S e v e n
- 334 -
that there would not be a major sex difference in self-esteem between the Turkish and
English groups.
In this study, the Coopersmith SEI (1991) was used to investigate the self-esteem of
both the English and the Turkish samples. Cross-cultural comparisons of self-esteem
between the two cultures showed a significant difference between the English and
Turkish samples; English subjects had significantly higher self-esteem scores on all
scales of the Coopersmith SEI (Total, Short Form, General, Social, Home, and
Academic). The results also showed that cultural differences were higher among males
than among females: English males had significantly higher self-esteem scores than
Turkish males on all scales, while English females had significantly higher scores than
Turkish females on only two scales (Social Self-Esteem, and Academic Self-Esteem).
Though English females had higher scores than the Turkish females on the other scales
(Total Self-Esteem, Short-Form, General Self-Esteem, and Home Self-Esteem), the
differences were non-significant. In contrast with their self-esteem scores, Turkish
subjects had significantly higher Lie scores than their English counterparts. These
significant cultural differences on Lie scores existed not only for the total samples, but
also for males and females, indicating that Turkish subjects were more defensive with
their answers than the English subjects.
The first hypothesis relating to this section was based on self-esteem and cultural
differences and it was expected that the self-esteem of English subjects would be higher
than the Turkish subjects. The results of this study showed that the English students had
higher self-esteem than their Turkish counterparts. Therefore the first hypothesis was
confirmed.
The second hypothesis relating to this section was that there would be no sex
differences in self-esteem among the English and the Turkish subjects. In contrast to
cultural differences, the results of variance analysis revealed lack of main effects for sex
C h a p t e r S e v e n
- 335 -
in self-esteem (except General Self-Esteem). On General Self-Esteem scale, males had
significantly higher scores than females. On most of the self-esteem scales (Total,
Short-Form, Home, and Academic), males had higher scores, while females had higher
scores on only the Social Self-esteem scale. However, the sex differences in all these
scales did not reach the significance level. Considering sex differences on the Lie scale,
males had significantly higher scores than females, indicating that males had
significantly more defensive attitudes than their female counterparts. In general, lack of
sex differences in self-esteem was consistent with the previous findings, since a great
number of studies reported no significant difference between males and females self-
esteem (Coopersmith, 1959 and 1967; Piers & Harris, 1964; Maccoby & Jacklin, 1974;
Wylie, 1979; Marsh et al., 1984; Abdallah, 1989a; Wilson & Fasko, 1992; Yong, 1994).
Although in general, the results of ANOVA revealed no sex differences when both the
English and the Turkish samples were combined, sex differences did exist when the two
samples were analysed separately. Among English subjects, males had significantly
higher self-esteem scores than females on Total Self-Esteem, Short-Form, General Self-
Esteem, and Home Self-Esteem while no sex differences existed between Turkish males
and females on any of the self-esteem scales.
The second hypothesis was that the self-esteem of males and females would not differ
in either group (English and Turkish subjects). The data showed that in general there
was no sex difference in self-esteem when the English and the Turkish samples were
combined. However, when the samples were analysed separately, the data showed that
the English boys had higher self-esteem than the English girls, while sex differences did
not exist for the Turkish sample. Therefore, this hypothesis was partially confirmed.
3. The third empirical question was to find out locus of control differences between
the English and the Turkish samples. Sex difference in locus of control was also
C h a p t e r S e v e n
- 336 -
considered together with this question. The hypotheses related to this section were
as follows:
Hypothesis 1: The English subjects would be more internally oriented in their global
locus of control than their Turkish counterparts.
Hypothesis 2: The English subjects would be more internally oriented in their
academic locus of control than their Turkish counterparts.
Hypothesis 3: There would not be sex differences in global locus of control for both
the Turkish and English subjects.
Hypothesis 4: There would not be sex differences in academic locus of control for
both the Turkish and English subjects.
Cross-cultural studies on locus of control have been inconsistent and the data
contradicted prediction (Hui, 1982). Although the previous research generally supports
the view that people from Eastern countries are more externally oriented than Western
people (Abdallah, 1989a), there have been no specific cross-cultural studies comparing
locus of control of English and Turkish samples. However, Turkish and English
societies, were compared, some significant differences between the two cultures were
observed. It is known that the British way of life is individual-centred and places a great
deal of emphasis on self-reliance. If individuals are successful, the success is generally
attributed to their own efforts or abilities. Turkish culture, in contrast, is situation-
centred. It emphasises the interdependence of individuals within larger groups such as
the family. If individuals are successful, the success is attributed to, and shared with,
those who are related to them. Accordingly, it could be predicted that British students
would be more internal than Turkish students.
The past locus of control studies reveal no sex differences. The results of nearly 70 % of
all comparisons reviewed, reveal no sex differences (see Chapter 2). Past studies also
show that the number of studies which failed to obtain sex differences have been
C h a p t e r S e v e n
- 337 -
increasing significantly since the early 1980s. The findings of these studies also indicate
a positive trend in locus of control for girls. When sex differences in locus of control
were examined in the case of Turkish studies, the Turkish literature revealed that there
had been only three studies. These three studies compared four separate samples and
only one of them found that males were significantly more internal than females, while
the other three studies found no sex differences between locus of control of boys and
girls. Therefore no major differences were expected between locus of control of boys
and girls in both the English and Turkish groups.
In this study, the global locus of control of subjects was measured by the Nowicki-
Strickland Internal-External Control Scale. Cross-cultural comparisons of global locus
of control between English and Turkish cultures showed that there was no significant
difference between English and Turkish subjects. The non-significant differences also
existed between English and Turkish males, as well as between English and Turkish
females. Although English males were more internal than the Turkish males, in
contrast, English females were less internal than the Turkish females, but none of these
differences reached the significant level. It was hypothesised that the English subjects
would be more internally oriented in their global locus of control than the Turkish
subjects. Cross-cultural comparisons of global locus of control between English and
Turkish subjects showed that there was no significant difference between them. Non-
significant differences also existed between the English and the Turkish males as well
as between the females. Therefore, this hypothesis was not confirmed.
The second hypothesis was based on cross-cultural differences on academic locus of
control. The academic locus of control of students was measured by Crandall et al.’s
Intellectual Achievement Responsibility Scale (IAR). It was predicted that the English
subjects would be more internally oriented in their academic locus of control than their
Turkish counterparts. This hypothesis was partially confirmed. Cross-cultural
C h a p t e r S e v e n
- 338 -
comparisons of academic locus of control between English and Turkish cultures, and
the comparisons of the three subscales, IAR-Total, IAR in Success, and IAR in Failure
scores, showed that there were no significant differences between English and Turkish
students. The study revealed that although the English and the Turkish subjects did not
significantly differ in any of the academic locus of control scales, English students had
higher scores than the Turkish subjects in all three academic locus of control scales,
indicating that English students tended to be slightly more internally oriented in
academic situations than their Turkish counterparts. Furthermore, the results showed
that there were no differences between English and Turkish females, whereas English
males were more internally oriented in academic locus of control than the Turkish
males.
The third hypothesis was that there would be no sex differences in global locus of
control for both of the samples. This hypothesis was partially confirmed. The results
showed that English males were significantly more internally oriented in their global
locus of control than English females, whereas, Turkish males and females did not
significantly differ in their global locus of control.
It was also hypothesised that there would be no sex differences in academic locus of
control. This hypothesis was confirmed for the English subjects, however, it was
rejected for the Turkish subjects. The results indicated that Turkish females had higher
internal scores than the Turkish males in all three academic locus of control scales, but
these differences were significant only in IAR-Total, and IAR-Success scales, indicating
that Turkish females tended to be more internal in general academic situations, and in
the attribution of their success, whereas, English males and females did not significantly
differ in any of the academic locus of control scales, although males had higher scores.
Therefore this hypothesis was partially confirmed by the results of this study.
C h a p t e r S e v e n
- 339 -
4. The fourth empirical question posed in this research concerned the relationship
between self-esteem and locus of control variables for the English and the Turkish
samples. Hypotheses relating to this section were as follows:
Hypothesis 1: There would be a positive relationship between high self-esteem and
internal locus of control (global) for both samples.
Hypothesis 2: There would be a positive relationship between high self-esteem and
internal locus of control (academic) for both samples.
Hypothesis 3: The global self-esteem would be more strongly related to the global
locus of control than the academic locus of control.
Hypothesis 4: The academic self-esteem would be more strongly related to the
academic locus of control than the global locus of control.
Theoretically, someone’s attitudes about himself or herself should bear some relation to
locus of control. A person who feels insecure, lacking in self-worth and low in feelings
of personal adequacy is expected to be oriented towards external control rather than
internal control. Furthermore, most of the past research studies indicate that high self-
esteem was associated with internal locus of control. A similar result was expected from
the outcome of the present research as well. Specifically, it was expected that global
self-esteem would be more strongly associated with the global locus of control, whereas
academic self-esteem would be more strongly associated with the academic locus of
control.
The results of the study showed that all of the self-esteem scales were significantly
related to global locus of control for the English, as well as for the Turkish samples. All
correlation coefficients were significant for English and Turkish males and females.
Therefore, the first hypothesis was confirmed. These findings suggest high self-esteem
is associated with internal global locus of control. The results of this study are
consistent with the results of previous studies (Louden, 1977; Dönmez, 1985; Crump et
C h a p t e r S e v e n
- 340 -
al., 1985; Abdallah, 1989b; Chadha, 1989) in terms of the relationship between self-
esteem and internal locus of control. These correlations show that both the English and
Turkish, male and female students’ self-esteem was influenced by their beliefs about
control over life events.
Similarly it was hypothesised that self-esteem would be positively correlated to
academic locus of control. When the English and the Turkish samples were studied, the
data showed that most of the self-esteem scales were significantly correlated to the
academic locus of control scales, although not as strongly related as to global locus of
control. For the English sample, twelve out of fifteen coefficients were significant. The
Social self-esteem scale was the only self-esteem scale whose relationship with
academic locus of control scales (IAR-Total, IAR-Success, and IAR-Failure) did not
reach the significance level, although the relationships were positive and in the expected
direction. For the Turkish sample, thirteen out of fifteen coefficients were significant. In
addition, the General, and Academic self-esteem scales did not reach the significance
level with their correlation with the Failure scale, although the relationships were
positive and in the expected direction. Among academic locus of control scales, the
Failure scale had the weakest relationship with self-esteem for the English as well as for
the Turkish sample. Moreover, when the correlations between self-esteem and academic
locus of control were examined for English and Turkish males and females separately,
the data showed that coefficients between self-esteem and academic locus of control
scales were not found to be strong. The data also showed that self-esteem was more
strongly correlated to academic locus of control for English males than females (for
males a total of eleven out of fifteen correlations were significant, for females however,
six of them were significant). In the case of the Turkish sample, in contrast, self-esteem
more strongly correlated to academic locus of control for females than for males (for
females a total of six out of fifteen correlations were significant, for males however,
only three of them were significant). In general, the correlation coefficients between
C h a p t e r S e v e n
- 341 -
self-esteem and academic locus of control were stronger for English males and females
than for Turkish males and females. Another interesting point to be emphasised is that
none of the self-esteem scales significantly correlated to the IAR-Failure scale, with the
exception of Total self-esteem with General self-esteem, and with Academic self-
esteem for English males. These correlations were neither large enough to justify the
relationships, nor small enough to permit the relationships. The relationships between
self-esteem scales and IAR-Failure particularly, were quite low. This data showed that
the relationship of self-esteem scales with the academic locus of control scales was
found to be not consistent, particularly when data was further analysed separately for
males and females. This result indicated that students’ self-esteem was only partially
influenced by their understanding of why they succeeded or failed in intellectual tasks.
The study suggests that further research on the relationship between self-esteem and the
components of academic locus of control is warranted. Therefore, this hypothesis was
only partially confirmed.
The third hypothesis was that global self-esteem would be more strongly related to
global locus of control than academic locus of control. This hypothesis was confirmed
for all samples, English, Turkish as well as males and females.
The fourth hypothesis was that academic self-esteem would be more strongly related to
academic locus of control than global locus of control. This hypothesis was not
confirmed by the results of this study. The data showed that like all other self-esteem
scales, the academic self-esteem scale also correlated more strongly to the global locus
of control scale than the academic locus of control scales. This result is consistent for
the English and the Turkish samples as well as for males and females. Therefore the
third hypothesis was not supported by the findings of the present study.
C h a p t e r S e v e n
- 342 -
5. The fifth empirical question concerned the relationship between self-esteem
variables and academic achievement. The hypotheses related to this section were
as follows:
Hypothesis 1: There would be a significant but moderate relationship between self-
esteem and academic achievement for both of the samples (English &
Turkish).
Hypothesis 2: Academic achievement would be more strongly related to academic
self-esteem than the other types of self-esteem.
Past research suggests that there is a relationship between self-esteem and achievement,
although a large proportion of them have reported that correlations have been uniformly
low or moderate between the two variables. The review studies of Uguroglu & Walberg
(1979) and Hansford & Hattie (1982), and most of the studies whose findings are
outlined in Appendix C (Table 1) reveal, in the aggregate, self-esteem is significantly
associated with academic achievement. Apart from studies in the Western world, the
limited number of Turkish studies investigating self-esteem-achievement relationship
also found a positive relationship between the two constructs, therefore similar results
were expected for the present study. Self-esteem was measured by the Coopersmith SEI,
academic achievement was measured by the GPA (average scores calculated from
English / Turkish Language, Maths, and Science). In this section the results will be
summarised for the English and the Turkish samples separately.
The results for the English sample: The data indicated that most of the self-esteem
scales had a significant relationship with academic achievement for the combined
English sample, as well as for the male and female samples. The academic achievement
scores were found to be more strongly related to the School-Academic, Total, Short-
Form and General self-esteem scores than the Social-Peers, and the Home-Parents self-
esteem scores. This pattern seems to be similar for males, females and for both sexes
combined. Although the relationship between academic achievement and the School-
C h a p t e r S e v e n
- 343 -
Academic self-esteem was found to be stronger for males than females, in general the
number of significant correlation coefficients obtained for females were higher than for
males. 17 out of 24 coefficients were significant for males, and 20 coefficients were
significant for females. When both sexes were combined, 21 out 24 correlation
coefficients were found to be significant. However when the Davis’ descriptors were
considered, it could be seen that the majority of the correlation coefficients between
self-esteem and academic achievement measures would be classified as moderate or
low.
The results for the Turkish sample: The data indicated that the majority of the self-
esteem scales had a significant relationship with academic achievement for the
combined Turkish sample, as well as for the male and female samples. The academic
achievement scores were found to be more strongly related to the School-Academic,
Total, Short-Form and the Home-Parents self-esteem scores than the Social-Peers, and
the General self-esteem scores. This pattern seemed to be similar for males as well as
for females. The findings of this study indicated that the relationship between self-
esteem and academic achievement was much stronger for Turkish females than for the
Turkish males. 21 out of 24 coefficients were significant for females, and 12
coefficients were significant for males. When both sexes were combined, 22 out 24
correlation coefficients were found to be significant. However when the Davis’
descriptors were considered, it could be seen that the majority of the correlation
coefficients between self-esteem and academic achievement measures would be
classified as moderate or low.
The first hypothesis for this section was that there would be a significant but moderate
relationship between self-esteem and academic achievement for the English and the
Turkish samples. The data showed that the majority of the self-esteem scales had
significant relationships with academic achievement for the English and the Turkish
C h a p t e r S e v e n
- 344 -
samples, as well as for the males and females. Therefore, this hypothesis was generally
supported. These results were consistent with most of the previous studies.
The second hypothesis was that the achievement would be more strongly related to the
academic self-esteem than the other types of self-esteem. The data showed that the
achievement of students was more strongly correlated with academic self-esteem than
the other self-esteem scales (including the Total self-esteem) for both groups. Therefore,
this hypothesis was confirmed.
6. The sixth empirical question concerned the relationship between locus of control
variables and academic achievement. The hypotheses related to this section were
as follows:
Hypothesis 1: There would be a significant but moderate relationship between locus
of control (global) and academic achievement for both of the samples.
Hypothesis 2: There would be a significant but moderate relationship between locus
of control (academic) and academic achievement for both of the
samples.
Hypothesis 3: Academic achievement would be more strongly related to the
academic locus of control than the global locus of control.
The expected positive relationship between internal locus of control and academic
achievement is generally supported by the findings of the past studies, although the
findings were not always consistent. Furthermore, only two Turkish studies have been
identified and only one of them focused on secondary school students. However, it was
hypothesised that there would be a moderate relationship between locus of control and
achievement. The global locus of control was measured by the Nowicki-Strickland
Internal-External Control Scale, while the academic locus of control was measured by
Crandall et al.’s Intellectual Achievement Responsibility Scale (IAR). Academic
achievement was measured by the GPA (average score calculated from English /
C h a p t e r S e v e n
- 345 -
Turkish Language, Maths, and Science). In this section the academic achievement /
locus of control relationship will be summarised separately for the global and academic
locus of control measures.
Results for the achievement (GPA) / global locus of control relationship:
The first hypothesis was that there would be a significant relationship between global
locus of control and academic achievement for the English and the Turkish subjects.
The data showed that the global locus of control scores were significantly correlated
with academic achievement (GPA) for the English and Turkish samples as well as for
males and females . Using Davis’s descriptors, the relationship of GPA with the global
locus of control were classified as moderate for the combined English sample, and low
for the combined Turkish sample. The separate analyses for males and females showed
that although the correlations were classified as moderate for the English and the
Turkish males, they were classified as low for the females in both countries. Therefore,
the first hypothesis was confirmed by the findings of the present study.
Results for the achievement (GPA) / academic locus of control relationship:
Similarly, it was expected that academic achievement would be significantly correlated
with academic locus of control. The data showed that the academic locus of control
scale scores (IAR-Total, IAR-Success, and IAR-Failure) were significantly correlated
with academic achievement (GPA) for the English and the Turkish samples. When
these relationships were further examined for males and females separately, it was
found to be significant only for the Turkish females. While all of the correlations
between GPA and academic locus of control scales (IAR-Total, IAR-Success, and IAR-
Failure) were significant for the Turkish females, they were nonsignificant for the
English males and females. One significant correlation that was obtained for the
Turkish males was between the GPA and the IAR-Success. Using Davis’s descriptors,

C h a p t e r S e v e n
- 346 -
all of the correlation coefficients between academic achievement (GPA) and the
academic locus of control measures (IAR-Total, IAR-Success, and IAR-Failure) were
found to be low for the English and the Turkish as well as for males and females in both
countries, with the only exception that the correlation coefficient between the GPA and
the IAR-Failure was classified as negligible for the Turkish males. In light of these
results, it could be said that the second hypothesis was partially confirmed.
The third hypothesis was that academic achievement would be more strongly related to
the academic locus of control than the global locus of control. The data clearly showed
that, unexpectedly, the GPA scores of the subjects were more strongly associated with
the global locus of control scores than with the academic locus of control scores for all
groups, as well as for males and females in both countries. Therefore, the third
hypothesis was rejected.
7. The seventh empirical question to be considered in this section, concerned the
best independent predictors of academic achievement. It was hypothesised that
academic self-esteem would be the best independent predictor of the academic
achievement.
In order to answer this question multiple regression analyses were carried out using the
Stepwise procedure. In using the multiple regression technique, the aim is to identify
those variables that best predict the key variable of academic achievement. Regression
analyses using academic achievement (GPA) scores as the criterion variable found that
the Academic Self-Esteem variable as an independent variable was the best predictor of
academic achievement for both the English and Turkish groups. Although Academic
Self-Esteem was found to be the best predictor of achievement for both the English and
the Turkish groups, each group had another two independent variables which predicted
academic achievement significantly. While the Global Locus of Control was found to be
the second best predictor of academic achievement for both groups, the General Self-
C h a p t e r S e v e n
- 347 -
Esteem was the third best predictor of achievement for the English sample, the Sex of
students as an independent variable was found to be the third best predictor of
achievement for the Turkish group. Although the Academic Self-Esteem was the best
predictor of the academic achievement for both the English and the Turkish groups, it
may be worth mentioning that it predicted the achievement of the English students
better than of the Turkish students. This variable explained 14 % of the achievement
scores of the English students while it explained only 8 % for the Turkish students.
When the analyses were carried out separately for males and females in both the English
and the Turkish samples, it was again found that Academic Self-Esteem as an
independent variable was the best predictor of achievement for the Turkish males and
females as well as for the English males. For the English females, however, the General
Self-Esteem was the best predictor of achievement. Although there was only one
independent variable that significantly predicted achievement of the English males (the
Academic Self-Esteem) as well as females (General Self-Esteem), there were two
independent variables that were significantly predicted achievement of the Turkish
males and females. Whilst the Home-Parents Self-Esteem variable was the second
significant predictor of achievement for the Turkish females, the Global Locus of
Control variable was the second significant predictor for the Turkish males.
As far as the prediction of the achievement of students is concerned, the results of
regression analysis showed that the independent variables accounted not more than 24
% of the variance in academic achievement for any group. They accounted for only 19
% of the variance in achievement for the English group and 13 % of the variance for the
Turkish group. When sexes of the samples were considered, the data showed that the
independent variables accounted for 18 % of the variance in achievement for the
English males and only 16 % of the variance for the English females. When the Turkish
males and females were examined, the results of the regression analysis showed that the
C h a p t e r S e v e n
- 348 -
independent variables accounted for more percentage of the variance in achievement for
females than for males. While only 11 % of the variance in males’ academic
achievement was explained by the independent variables they accounted for 24 % of the
variance in females’ achievement.
It is evident from the present study that the absence of intellectual factors from the
variables must create limits in the prediction of achievement. In a study of Gose et al.,
(1980) it was found that the contribution of intelligence and the related academic self-
concept measure of intelligence accounted for more achievement variance than did
intelligence alone. However, in the present study, no measure of intellectual ability was
included which could, however, have taken up some of the residual variance. In this
study the independent variables only explained about 19 % of the variance in the
English group, and 13 % in the Turkish group. It is possible that the remaining 81 %
can be explained by other multiple factors (such as intelligence etc.) for the English
group. Similarly 87 % of the variance can be explained by the other factors for the
Turkish group.
C h a p t e r S e v e n
- 349 -
7.3 IMPLICATION FOR FURTHER STUDIES
One of the aims of the present study was to assess the reliability of the self-esteem and
locus of control scales for both the English and the Turkish samples. The lack of
validity and reliability studies on the Coopersmith SEI, the Nowicki-Strickland I-E
Control Scale, and Crandall IAR scale for the Turkish samples encouraged the
researcher to investigate the reliability of these instruments. The results indicated that
the reliability of these instruments all showed reasonably high internal consistency for
both samples, as revealed by the KR-20 index and the split-half reliability. The findings
also indicated that the instruments were as reliable as the previous studies had reported,
therefore they could be used in the assessment of secondary school students’ self-esteem
and locus of control. Since some of the reliability coefficients of the instruments used in
this study were low, they should not be used for decision making research until their
psychological qualities are improved. The Coopersmith SEI was found to be quite
highly reliable among both groups, indicating that an instrument developed in other
cultures can be successfully adapted to Turkish culture. Compared with the other two
instruments, Crandall et al.’s IAR Scale had lower internal consistency, particularly
among the Turkish subjects. As it was the first reliability study on Crandall et al.’s IAR
for the Turkish subjects, the instrument must obviously be tested through replication.
Although the results of the present study showed a moderate level of internal
consistency, the study suggests further investigation (such as assessment of test-retest
reliability) on the reliability of the instruments.
Another aim of the present study was to compare English and Turkish students
differences in self-esteem and locus of control. Past cross-cultural research on self-
esteem has been inconclusive (Knight et al., 1978). Bond & Cheung (1983) state that
there has been remarkably little research on self-concept done in cultures outside the
North America and Northern Europe. The present study, being the first cross-cultural
C h a p t e r S e v e n
- 350 -
study comparing English and Turkish students’ self-esteem and locus of control,
indicated that the self-esteem of English students was higher than the Turkish students,
but they did not differ in locus of control. Researchers may wish to examine further
cultural differences that may help to explain these findings. They of course, need to be
tested through replication. Self-esteem differences between English and Turkish
subjects may be attributed to other differences in these samples. These may stem from
differences in social values, culture or the socialisation process. This study is only a first
step in comparing English and Turkish students, and indicates the need for more
research with other samples and groups. Only after the accumulation of larger and
broader samples will generalisations and predictions be able to be made with any
confidence, but again, further research is needed on the role of self-esteem and locus of
control in Turkish society.
The findings of this study support the position that students who have more positive
views about themselves and their capacities actually do better in their studies than those
with more uncertain or negative views of themselves. Educational or academic
achievement is not, and cannot be, a product of a single factor, it is instead an outcome
of a series of numerous and different interacting factors such as the individual’s
intelligence, abilities, motivation, attitude and self-value. Indeed each these insufficient
as separate and independent factors in achievement. Positive self-perceptions of learners
appear to be generally necessary (Brookover, 1967; Purkey, 1970) and there have been
numerous studies supporting the importance of self-esteem in achievement. The
implication is that students who value themselves highly are more likely to perform
successfully.
Apart from the evidence showing a close relationship between high self-esteem and
high academic achievement, there has also been evidence showing significant
correlation between low self-esteem and academic failing (Burns, 1982; Lawrence,
C h a p t e r S e v e n
- 351 -
1987). The present study revealed that of the total variance in academic achievement, 13
% for the Turkish sample and 19 % for the English sample, were accounted for together
by self-esteem and locus of control variables. There have been many studies showing
evidence relating to academic performance and self-esteem. Furthermore, physical,
social and emotional development are equally important factors for educators and
therefore the development of self-esteem is placed somewhere in the centre of the non-
cognitive development. The recent trend in educational psychology suggests that
academic development cannot easily be isolated from other aspects of human
development. This study also indicates that teachers should consider the importance of
non-cognitive factors in achievement.
Locus of control and self-esteem tend to be important predictors of academic
achievement (Coleman, 1966; Uguroglu et al., 1979; Lefcourt, 1983). Enhancement of
self-esteem and internal locus of control should be key educational goals for schools.
These two variables might be related to the motivation which is necessary for academic
performance of students and realisation of their intellectual potential. These constructs
are probably the major psychological variables that motivate individuals to work,
investigate, achieve, solve problems, and compete (Harty, Adkins, & Hungate, 1984;
Feldhusen & Hoover, 1986). The self-esteem and locus of control of students can be
enhanced through numerous approaches, such as setting realistic goals and objectives,
using instructional material and resources that encourage parental participation in their
children’s learning, providing consistent and positive feedback on students’
performance, stressing independent learning (Mark, 1987), and helping students to
become aware of their own attributions (Canfield, 1990). In terms of intervention, past
research indicates that remediation in the areas of locus of control and self-esteem can
improve students’ effort and persistence, which should be reflected in higher grades.
Omizo & Omizo (1988) revealed a significant difference (p< .01) between experimental
and control groups on both total locus of control and self-esteem post-test measures of
C h a p t e r S e v e n
- 352 -
Honolulu adolescent students, after 10 weekly counselling sessions of 45 minutes each.
Young-Sheng (1990) found that mean locus of control scores of 1st and 4th year middle
school students in China developed greatly and significantly (p<0.001) after a four-
week instructional activity had been applied , while the mean score of the control group
showed no clear development. Moreover, different forms of instruction had different
effects on the development of students’ locus of control. Visor (1992) found that
students who participated in a 5-session Supplemental Instruction Self-Esteem course
were more internally oriented for locus of control than were the control group.
The enhancement of both self-esteem and locus of control is important because the
constructs are related to many other variables that contribute to academic, social, and
emotional successes. Individuals with higher levels of self-esteem seem to be at an
advantage in most situations. Past studies show that being aware of one’s feelings and
being able to express them, giving and receiving positive feedback, and knowing that
others were experiencing similar feelings and behaviours, had a positive impact on the
self-evaluations of participants who were receiving intervention programs. It seems that
group counselling sessions promise a way to enhance locus of control and self-esteem
among students (Omizo & Omizo, 1988; Young-Sheng, 1990; Visor, 1992). Although
school teachers can help their pupils to improve their self-esteem and internal control,
in some circumstances intervention programs could be conducted by school counsellors
(Kagıtçıbası, 1990).
Probably one of the most influential ideas in social psychology has been the notion that
our knowledge, our thinking and our feeling about ourselves is derived from what
others say to us and how they treat us. This idea has been emphasised by many writers
(Cooley, 1902; Sullivan, 1953; Dinkmeyer, 1965). In his well known formulation,
Cooley (1902) put forward that: “self and society are twin born” (p.5). Mead (1934)
also argued that self actually arises from social conditions, and suggested that the self
C h a p t e r S e v e n
- 353 -
was essentially a social process. These ideas indicate that a person’s view about himself
/ herself can be influenced by the ways in which others respond to him / her and the
expectations are important to perform well in school. Sullivan (1940, 1947, 1953) also
put great emphasis on sociological factors. In some respect, his ideas are close to
Cooley and Mead’s social interaction ideas. According to Sullivan the self-system is
purely a result of interpersonal experience arising out of anxiety encountered in the
pursuit of need satisfaction. But he stresses the role of the mother rather than society at
large. His description of the self was wholly interpersonal, and he emphasised the
function of symbolisation in its development. According to Sullivan, the self is built out
of experience by means of reflected appraisals and is entirely a learned phenomenon. He
posited no inherent self-drives or potential selves. This division arose as a result of
need-satisfaction or anxiety production by the parent when the child performed an act
which pleased or displeased.
The importance of self-esteem, perhaps comes from its dynamic character. In fact there
have been numerous studies showing the effectiveness of programmes in terms of
enhancing students’ self-esteem (Friedman et al., 1975; Zeeman, 1982; Omizo &
Omizo, 1988; Canfield, 1990; Necessary, 1993; Weaver & Matthews, 1993). The
findings of these studies suggest that considerable gains in pupil’s self-esteem can be
achieved through a programme of systematic but fairly basic counselling provided by a
class teacher.
To emphasise the importance of teachers in terms of creating high or low self-esteem of
students, Canfield & Wells (1976, p. 4) state that “it is possible to change self-concepts,
and it is possible for teachers to effect the changes either way, both positive and
negative”. Like our body and our thoughts, our emotions are changing as well.
As significant others, how teachers interact with their students noticeably affects their
students’ self-esteem. One of the earliest studies by Staines (1958) examined attitudes
C h a p t e r S e v e n
- 354 -
of a group of teachers, and found that students with teachers who used democratic
methods, made positive comments and took into consideration the student’s self-
concept, made positive changes in the self-concept of their children. Students who were
found to be insecure and maladjusted were those whose teachers did not recognise the
important role that perceptions of self, play, in the learning process, and stressed the
correctness of subject matter. As an implication of his results Staines made the
following comment:
... The educational significance of the self is reaffirmed when
it is realised that changes in the self picture are an inevitable
part of both outcomes and conditions of learning in every
classroom, whether or not the teacher is aware of them ... It
is clear that teaching methods can be adapted so that definite
changes of the sought will occur in the self. The self can be
deliberately produced by suitable teaching methods (p. 109).
Although writers have claimed that many activities enhance self-esteem (Canfield &
Wells, 1976; Owens, 1991) empirical data in terms of the effectiveness of these
activities are not always strong (Battle, 1981). Some studies obtained empirical data
supporting the effectiveness of activities in enhancing self-esteem.
Despite considerable evidence supporting the crucial role of self-esteem in education,
particularly in the achievement process, it has to be pointed out that limited practical
work has been conducted to enhance the self-esteem of students both in Turkey and in
Britain. In order to fulfil their responsibility, it is essential that teachers attend to the
self-esteem needs of their students, because self-esteem is a major variable affecting
academic achievement in developing children and youth. Educators particularly in
Turkey, have unfortunately, frequently been unsuccessful in their attempts to develop
the potential of students because they have failed to recognise the role that self-esteem
plays in the educational process. A consequence of this is vividly reflected in the
C h a p t e r S e v e n
- 355 -
emphasis of the development of cognitive skills, and they have generally tended to
ignore the affective domain of the developing child.
What can be done? First of all staff development is necessary. All staff members should
be aware of the role of self-esteem. Through effective inservice programmes they can
come to understand the contribution of self-esteem to students' well-being and learning.
This is important because ultimately, it may affect the student's future career. As
Youngs (1993) stresses “when educators feel unprepared, their own self-esteem suffers,
and they lessen their commitment to teaching excellence”. There is evidence showing
that the more positive the teachers’ self-esteem, the more accurate their evaluation of
pupils’ self-esteem would be (Itskowitz et al., 1989). There are other studies showing
that there is a link between positive self-concept and effective teachers (Combs, 1965;
Rosenberg, 1955; Murray, 1972). The study of Peck et al., (1977) showed that teachers
with a highly positive attitude produced greater increase in student self-esteem than
medium or low teachers, in that order. Similarly, teachers who rated themselves high on
efficiency produced larger gains in student self-esteem than medium or low teachers, in
that order. These studies show that in order to improve students’ achievement, students’
self-esteem, as well as teachers’ self-esteem needs to be improved. However, improving
teachers’ self-esteem in order to improve students’ self-esteem was not an objective of
this study. No studies were found about teachers’ self-esteem and its link with students’
self-esteem in Turkish literature, therefore it might be a useful research project for
future studies.
The evidence of this review suggests that the perception of locus of control is related to
academic achievement in a way that students with internal orientation tend to perform
better on academic work than students with external orientation. Within this framework,
the crucial question that should be put forward is whether the perception of locus of
control is a stable one or not. It is clear that if we accept that locus of control orientation
C h a p t e r S e v e n
- 356 -
is a stable disposition, then we accept a deterministic view, a view which does not
include expectations that the student’s external orientation can change. However, if we
accept that locus of control orientation is determined, then we accept the possibilities
for changing students’ locus of control orientations by modifying their environments.
It is noted that, Rotter has already underlined that “internal-external attitudes are
obviously not generalised across the board” (Rotter, 1966, p. 21). Apart from the
evidence indicating that perception of locus of control is affected by situational
variables, numerous studies have shown that special programmes may change an
individual’s perception of locus of control. For example, a study by Bar-Tal, Bar-Tal, &
Leinhardt (1975) indicated that in classrooms which utilised individualised programmes
pupils had more internal perception of locus of control than in classrooms which
utilised a traditional method of teaching. Omizo & Omizo (1988) found that their
educational enhancement program demonstrated that the perception of locus of control
can be modified. These investigators found that 7th and 8th grade Honolulu adolescents
from divorced families who participated in a group counselling program, manifested a
clear and significant change in the direction toward internal orientation, after 10 weekly
counselling sessions of 45 minutes each. Also, a study of Young-Sheng (1990) found
that mean locus of control scores of 1st and 4th year middle school students in China
developed greatly and significantly, after a four-week instructional activity had been
applied , while the mean score of the control group showed no clear development.
Moreover, different forms of instruction had different effects on the development of
students’ locus of control. Visor (1992) found that students who participated in a 5-
session Supplemental Instruction Self-Esteem course were more internally oriented for
locus of control than were the control group.
In summary, the above studies suggest that perception of self-esteem and locus of
control can be modified by restructuring the environment. It appears that certain
C h a p t e r S e v e n
- 357 -
instructional programmes have succeeded in changing the perception of self-esteem and
locus of control. Moreover, these changes were linked with improvement in academic
achievement. Children who increased their internal orientation also improved their
academic performance. These findings have important implications for educators. They
suggest that educators should structure classroom environments in such a way that may
stimulate and encourage internal perceptions. The modifications should enable the
students to perceive their environment as one in which they are capable of making
decisions and of taking responsibility for their actions. Internal orientations may
increase students’ effort and persistence, which should be reflected in higher grades.
C h a p t e r S e v e n
- 358 -
7.4 LIMITATION OF THE STUDY
The following limitations affect the interpretation and generalisation of the results of
this study.
First, the reliability of the instruments was assessed by using internal consistency
techniques. Although several techniques were used, such as KR-20 formula, split-half
reliability (first half-second half; odd-even items; the Spearman-Brown formula), and
intercorrelations of the scales and subscales, test-retest reliability of the instruments was
not assessed. The reliability of the instruments, by using internal consistency
techniques, showed reasonably high internal consistency for the English as well as for
the Turkish sample. However, no test-retest reliability of the instruments was assessed
for this study.
Second, factor analysis of the instruments has not been applied for this research.
Oppenheim (1966) has pointed out that only if an attitude scale is translated and factor
analysed in different countries and if it yields a similar factor structure in each can it be
used for cross-cultural comparison. Nevertheless, as Furnham & Henry (1980) state,
only a few studies have employed factor analysed cross-cultural data.
Third, self-esteem and locus of control data were collected by using the self-report
methods. The limitations of the self-report methods should be kept in mind before
interpreting the results of this study. Although some of the possible problems can be
controlled to some extent, as with any personality measure, there are some general
problems in self-esteem and locus of control assessment. Some potential problems with
these methods would be fakebility, social desirability, response styles, and
acquiescence. Self-report behaviour has usually taken the form of verbal response or of
a choice response, where the subject is instructed to indicate specified conscious
processes. One of the problems in measuring personality variables is that of social
C h a p t e r S e v e n
- 359 -
desirability. Subjects may attribute to themselves traits which social consensus would
indicate are socially desirable and acceptable while rejecting those that are socially
undesirable and unacceptable. It is easy to falsify responses so that a positive or a good
picture is presented on a self-report scale. Stair (1967) suggests that an individual with
low self-esteem will try to hide his/her feelings of inadequacy when he/she interacts
with other people whom he/she feels to be important. Another problem involves “faking
good” subjects. This type may hide their true appraisal of themselves because they are
afraid of the negative evaluation they will receive if they are honest. Wylie (1961) states
“no way has been worked out to determine in what cases and under what circumstances
the social desirability variable distorts individual self-reports away from validity in
reflecting subject’s phenomenal field” (p. 28). Similarly Cowen & Tongas (1959)
consider social desirability a very serious validity threat.
Fourth, in this study, the Turkish sample was asked to respond to the translated version
of the instruments. Despite the fact that a standard back translation method was
employed to validate the authenticity of the original, the two versions of the instruments
may have had different meanings.
Fifth, it can be the case that instruments may not measure the same thing in two
different cultures. The use of instruments in cross-cultural comparisons and research has
the recognised limitation that questions may have different meanings in different
cultures. Since the English and Turkish samples represent two cultures, there are
obviously some remarkable differences in culture, social life, language, and religion. It
should be added, that the questionnaire used in the Turkish study was adapted to take
into account the above mentioned differences.
Six, the two samples, English and Turkish, may be not representative of the student
population in their countries. The Turkish subjects were living in a big metropolitan
city, whereas the British subjects were living in a relatively small town, Hinckley, in
C h a p t e r S e v e n
- 360 -
Leicestershire. It is obvious that population differences might be effective on the results.
To be able to obtain valid and reliable results while investigating cultural or national
differences, one of the most important aspects of cross-cultural methodology is to
ensure that both subjects are valid representatives of their culture. As Fawcett &
Bornstein (1973) point out, simply taking two samples from two different countries or
cultures or even within the same country is not sufficient for obtaining matched
equivalent samples. In particular, students from developing countries may not represent
the cultural group from which they come. Fawcett & Bornstein, (1973) report that they
might be quantitatively and qualitatively differently educated from their peers, of higher
socio-economic status, and more modern than their more traditional rural peers.
Therefore care should be taken before making any firm conclusions.
Seven, although the formal educational level of the English and Turkish subjects was
equal (year 11), the average age of the Turkish sample was about one year older than
that of the English sample. This is because schooling begins one year later and in
addition, may have to be repeated the same programmes of study a student fail in the
final exam. Therefore, it was not possible to match both samples in schooling age and
physiological age.
Finally, although several research studies show that there is a relationship between
socio-economic status and personality variables, in the present study, the level of SES
for the English and Turkish samples were not ensured by using standard criteria.
REFERENCES
R e f e r e n c e s
- 2 -
REFERENCES
ABDALLAH, T. M. (1989a). A cross cultural study of self-esteem and locus of control.
Unpublished D.Phil. thesis. University of York.
ABDALLAH, T. M. (1989b). Self-esteem and locus of control of college men in Saudi
Arabia. Psychological Reports, 65, 1323-1326.
ADLER, A. (1927). The Practice and Theory of Individual Psychology, New York:
Harcourt Brace.
ADLER, R. B., & TOWNE, N. (1987). Looking Out / Looking In - Interpersonal
Communication. Holt, Rinehart and Winston, Inc.
ALBERTI, J. M. (1971). Correlates of self-perception in the school. Paper Read at the
American Educational Research Association Meeting, New York, February.
ALLPORT, G. (1961). Pattern and Growth in Personality New York: Holt, Rinehart, &
Winston.
AL-MANEEA, O. A. (1990). Self-Concept and Academic Achievement of Secondary
School Boys in Riyadh, Saudi Arabia. Unpublished Doctoral Dissertation.
University of Bristol.
AMES, C., AMES, R., & FELKER, D. W. (1976). Informational and dispositional
determinants of children’s achievement attributions. Journal of Educational
Psychology, 68, 63-69.
ARAT, Z. F. (1994). Kemalism and Turkish women. Women & Politics, 14, 4, 57-80.
ARGYLE, M. (1967). The Psychology of Interpersonal Behaviour. Penguin.
ARSEVEN, A. D. (1986). Benlik tasarımı gelisimi ve okul basarısıyla iliskisi.
Hacettepe Üniversitesi Egitim Bilimleri Fakültesi Dergisi, sayı 1, 15-26.
BACHMAN, J. G. (1970). Youth in Transition. Vol. 2, University of Michigan:
Institute for Social Research.
BACHMAN, J. G., & O’MALLEY, P. M. (1977). Self-esteem in young men. Journal of
Personality and Social Psychology, 35, 365-380.
R e f e r e n c e s
- 3 -
BACHMAN, J. G., & O’MALLEY, P. M. (1986). Self-concepts, self-esteem, and
educational experiences: The frog pond revisited (Again). Journal of
Personality and Social Psychology, 50, 35-46.
BAGLEY, C., MALLICK, K., & VERMA, G. K. (1979). Pupil self-esteem: a study of
Black and White teanagers in British schools. In Verma G. K. & C. Bagley
(Eds), Race, Education and Identity. (London, Macmillan).
BARKER-LUNN, J. C. (1970). Streaming in the Primary School (Sough, NFER).
BAR-TAL, D., BAR-TAL, Y., & LEINHARDT, G. (1975). The Environment, Locus of
Control and Feelings of Satisfaction, Pittsburgh: University of Pittsburgh,
Learning Research and Development Center. (LRDC Publication, 1975 / 27).
BAR-TAL, D., & BAR-ZOHAR, Y. (1977). The relationship between perception of
locus of control and academic achievement: review and some educational
implications. Contemporary Educational Psychology, 2, 181-199.
BAR-TAL, D., KFIR, D., BAR-ZAHOR, Y., & CHEN, M. (1980). The relationship
between locus of control and academic achievement, anxiety, and level of
aspiration. British Journal of Educational Psychology, 50, 53-60.
BASAL, H. A. (1983). Çevre büyüklügü ve 10-12 yas ilkokul çocuklarında denetim
odagı. Basılmamıs Yüksek Lisans Tezi. Ankara Universitesi Egitim Bilimleri
Fakultesi.
BASARAN, F. (1988). Turkish University Students’ Value Preferences. Unpublished
manuscript, Ankara University, Turkey.
BATTLE, J. (1977). Test-retest reliability of the Canadian self-esteem inventory for
children. Psychol. Rep. 40, 157-158.
BATTLE, J. (1981). Culture-Free SEI- Self-Esteem Inventories for Children and
Adults. Special Child Publications: Seattle.
BATTLE, J. (1981). Enhancing self-esteem: a new challenge to teachers. Academic
Therapy, 16, 5, 541-550.
BAYMUR, F., ÖZGÜVEN, E., KUZGUN, Y., KEPÇEOGLU, M., & KILIÇÇI, Y.
(1977). Üniversitede okuyan TUBITAK bursiyerlerinin basarılarını etkileyen
faktörler.
BEANE, J. A., & LIPKA, R. P. (1980). Self-concept and self-esteem: A construct
differentiation. Child Study Journal . 10, 1-6.
BEANE, J. A., & LIPKA, R. P. (1986). Self-concept, self-esteem and curriculum.
Colombia University. New York: Teachers College Press.
R e f e r e n c e s
- 4 -
BEDEIAN, A. G., GEAGUD, R. J., & ZMUD, R. W. (1977). Test-retest reliability and
internal consistency of the short form of Coopersmith’s Self-Esteem
Inventory. Psychological Reports, 41, 1041-1042.
BEKHUIS, T. C. H. M. (1994). The self-esteem of adolescents in American public high
schools: A multilevel analysis of individual differences. Person. Individ. Diff.,
16, 4, 579-588.
BELLAK, A. S. (1975). Self-evaluation, self reinforcement and locus of control.
Journal of Res. Pers, 9, 158-167.
BERBER, G. (1986). 16-20 yas arasındaki korunmaya muhtaç gençlerde benlik gelisimi
ve personel tutum (Self-esteem and personal attitude of 16-20 years old
homeless youth). Yayınlanmamıs Yüksek Lisans Tezi, Ankara Üniversitesi
Sosyal Bilimler Enstitüsü.
BLACK, S. (1991). Self-esteem sense and nonsense. American School Board Journal,
178, 7, 27-29.
BLACK, W. (1974). Self-concept as related to achievement and age in learning-
disabled children. Child Development. 45, 1137-1140.
BLEDSOE, J. C. (1964). Self-concepts of children and their achievement, interests, and
anxiety. Journal of Individual Psychology, 20, 18-25.
BLEDSOE, J. C. (1967). Self-concepts of children and their intelligence, achievement,
interests, and anxiety. Childhood Education, 43, 436-438.
BLEDSOE, J. C., & BABER, W. (1978). Personality correlates of locus of control
among college women. Psychological Reports, 43, 1129-1130.
BOCHNER, S. (1994). Cross-cultural differences in the self-concept - A test of
Hofstede’s Individualism / Collectivism distinction. Journal of Cross-Cultural
Psychology, 25, 2, 273-283.
BODWIN, R., & BRUCK, M. (1962). The relationship between self-concept and the
presence and absence of scholastic underachievement. Journal of Clinical
Psychology, 18, 181-182.
BOND, M. H., & CHEUNG, T.-S. (1983). College students’ spontaneous self-concept -
The effect of culture among respondents in Hong Kong, Japan, and the United
States. Journal of Cross-Cultural Psychology, 14, 2, 153-171.
BOND, M. H., & TORNATZKY, L. G. (1973). Locus of control in students from Japan
and the United States: Dimensions and levels of response. Psychologia, 16,
209-213.
R e f e r e n c e s
- 5 -
BORGES, M. A., ROTH, A., NICHOLS, G. T., AND NICHOLS, B. S. (1980). Effect
of gender, age, locus of control, and self-esteem on estimates of college
grades. Psychological Reports, 47, 831-837.
BRIDGEMAN, B., & SHIPMAN, V. C. (1978). Preschool measures of self-esteem and
achievement motivation as predictors of third grade achievement. Journal of
Educational Psychology, 70, 17-28.
BROOKOVER, W. B., ERIKSON, E. L., & JOINER, L. M. (1967). Self-concept of
ability and school achievement, III, Final Report on Cooperative Research
Project No. 2831 (East Lansing, Michigan State University).
BROOKOVER, W. B., LEPERE, J. M., HAMACHEK, D. E., THOMAS, S., &
ERIKSON, E. L. (1965). Self-concept of ability and school achievement, II:
Improving Academic Achievement Through Students’ Self-Concept
Enhancement. U.S. Office of Education, Cooperative Research Project No.
2831. East Lansing, Michigan: Office of Research and Publications, Michigan
State University.
BROOKOVER, W. B., THOMAS, S., PATTERSON, A. (1964). Self-concept of ability
and school achievement. Social Education 37, 271-279.
BROWN, J., & STRICKLAND, B. (1972). Belief in internal / External control of
reinforcement and participation in college activities. Journal of Clinical
Psychology, 38, 148.
BURNET, P. C. (1994). Self-concept and self-esteem in elementary school children.
Psychology in the schools, 31, 164-171.
BURNS, R. B. (1981). The Self-Concept, Theory, Measurement, Development and
Behaviour. London: Longman.
BURNS, R. B. (1982). Self-Concept Development and Education. London: Holt,
Rinehart and Winston.
BYRNE, B. M. (1986). Self-concept / academic achievement relations: An
investigation of dimensionality, stability, and causality. Canadian Journal of
Behavioral Science, 18, 173-186.
CALSYN, R. J. & KENNY, D. A. (1977). Self-concept of ability and perceived
evaluation of others: Cause or effect of academic achievement ?Journal of
Educational Psychology, 69, 2, 136-145.
CAMPBELL, K. E., OLSON, K. R. & KLEIM, D. M. (1990). Physical attractiveness,
locus of control, sex role, and conversational assertiveness. The Journal of
Social Psychology, 130 (2), 263-265.
CAN, G. (1986). Lise ögrencilerinin benlik tasarım düzeylerini etkileyen bazı etmenler.
Yayınlanmamıs Doktora Tezi. Hacettepe Üniversitesi.
R e f e r e n c e s
- 6 -
CANFIELD, J. (1990). Improving student’ self-esteem. Educational Leadership, 48, 48-
50.
CANFIELD, J., & WELLS, H. (1976). 100 Ways to Enhance Self-Concept in the
Classroom, New Jersey:Prentice Hall.
CANT, R., SPACKMAN, P. (1985). Short report. Educational Research. Vol. 27 No.1,
pp. 68-70.
CARLSON, R. (1965). Stability and change in the adolescent’s self-image. Child
Development, 36, 659-666.
CARMENT, D. W. (1974). Internal vs. external control in India and Canada.
International Journal of Psychology, 9, 45-50.
CARR, M., BORKOWSKI, J. G., & MAXWELL, S. E. (1991). Motivational
components of underachievement. Developmental Psychology, 27, 1, 108-118.
CASSIDY, A. E. (1991). The growth of competence and self-esteem in the science
revision students. Unpublished Doctoral Dissertation, The Queen’s University
of Belfast.
CATTEL, R. B., SEALY, A. P., & SWEENY, A. B. (1966). What can personality and
motivation source trait measurement add to the prediction of school
achievement? British Journal of Educational Psychology, 36, 280-295.
CELLINI, J. V., & KANTOROWSKI, L. A. (1982). Internal-external locus of control:
new normative data. Psychological Reports, 51, 231-235.
CHADHA, N. K. (1989). Causal antecedents of self-concept, locus of control and
academic achievement: A path analysis. Psychologia, 32, 264-268.
CHANDLER, T. A., SHARMA, D. D., WOLF, F. M., & PLANCHARD, S. K. (1981).
Multiattributional causality: A five cross-national samples study. Journal of
Cross-Cultural Psychology, 12, 207-22.
CHAPMAN, J. W., CULLEN, J. L., BOERSMA, F. J., & MAGUIRE, T. O. (1981).
Affective variables and school achievement: A study of possible causal
influences. Canadian Journal of Behavioral Science, 13, 181-192.
CHENG, H.-P., & PAGE, R. C. (1989). The relationships among sex, academic
performance, anxiety, and self-esteem of junior high school students in
Taiwan. Journal of Multicultural Counseling and Development, 17, 123-133.
CHEUNG, T. S. (1986). Sex differences in the effect of Academic achievement on self-
esteem: A Hong Kong case. Social Behavior and Personality, 14, 2, 161-165.
CHI, C. (1984). Cooperative behavior and locus of control among American and
Chinese-American boys. The Journal of Psychology. 118, 2, 169-177.
R e f e r e n c e s
- 7 -
CHIU, L. H. (1987). Locus of control differences between American and Chinese
adolescents. The Journal of Social Psychology, 128 (3), 411-413.
CLIFFORD, M. M. (1976). A revised measure of locus of control, Child Study Journal,
6, 85-90.
CLIFFORD, M. M. (1981). Practising Educational Psychology, Boston, Houghton
Mifflin Company.
COHEN, A. (1959). Some implications of self-esteem for social influence. In
Howlands, C. C. and Janis, J, (Eds). Personality and Persuasibility. New
Haven.
COLE, D., RODRIGUEZ, J., & COLE, S. A. (1978). Locus of control in Mexican and
Chicanos: The case of the missing fatalist. Journal of Consulting and Clinical
Psychology, 46, 1323-1329.
COLEMAN, J. (1980). The Nature of Adolescence. New York: Routledge.
COLEMAN, J. S., CAMPBELL, E. Q., HOBSON, C. J., MCPORTLAND, J., MOOD,
A. M., WEINFELD, F. D. & YORK, R. L. (1966). Equality of educational
opportunity. Superintendent of Documents Catalog No. FS 5.238: 38001, U.S.
Government Printing Office, Washington, D.C.
COMBS, A. W. (1965). The professional Education of Teachers: A Perceptual View of
Teacher Preparation. Boston, Mass.: Allyn & Bacon Inc.
COOLEY, C. H. (1912). Human Nature and the Social Order. New York: Charles
Schribner’s Sons.
COOLEY, E., & Nowicki, S., Jr. (1974). Locus of control and assertiveness in male and
female college students. Journal of Psychology, 117, 85-87.
COOPER, H. M., BURGER, J. M., & GOOD, T. L. (1981). Gender differences in the
academic locus of control beliefs of young children. Journal of Personality and
Social Psychology, 40, 3, 562-572.
COOPERSMITH, S. (1959). A method for determining types of self-esteem. Journal of
Abnormal and Social Psychology, 59, 87-94.
COOPERSMITH, S. (1960). Self-esteem and need achievement as determinants of
selective recall and repetition. Journal of Abnormal and Social Psychology,
60, 3, 310-317.
COOPERSMITH, S. (1967). The Antecedents of Self-Esteem. San Francisco: W. H.
Freeman.
R e f e r e n c e s
- 8 -
COOPERSMITH, S. (1975). Self-concept, race and education. In G. K. Verma & C.
Bagley (Eds.). Race and Education Across Cultures, Heinemann Educational
Books Ltd.
COOPERSMITH, S. (1991). SEI-Self-Esteem Inventories. Consulting Psychologist
Press, Inc. Palo Alto.
COOPERSMITH, S. & GILBERTS, R. (1982). Professional manual. Behavioral
Academic Self-Esteem. Palo Alto, CA: Consulting Psychologists Press.
COSAR, F. M. (1978). Women in Turkish society. In L. Beck & N. Keddie (Eds.),
Women in the Moslem World. Cambridge, Massachusetts: Harvard University
Press, 124-140.
COWEN, E. L., & TONGAS, P. (1959). The social desirability of traits descriptive
terms: Applications to self-concept inventory. Journal of Consulting
Psychology, 23, 361-367.
CRANDALL, R. C. (1973). The measurement of self-esteem and related constructs. In
J. Robinson & Shaver, (Eds.). Measures of Psychological Attitudes. Ann
Arbor, NI: Institute for Social Research.
CRANDALL, V. C., KATKOVSKY, W., & CRANDALL, V. J. (1965). Children
beliefs in their own control of reinforcement in intellectual-academic
achievement situations. Child Development, 36, 1, 91-110.
CRANDALL, V. J., KATKOVSKY, W., & PRESTON, A. (1962). Motivational and
ability determinants of young children’s intellectual achievement behaviors.
Child Development, 33, 643-661.
CRUMP, B., HICKSON, J., AND LAMAN, A. (1985). Relationship of locus of control
to achievement and self-concept in education major. Psychological Reports,
57, 1055-1060.
DAMON, W., & HART, D. (1982). The development of self-understanding from
infancy through adolescence. Child Development. 53, 841-864.
DARKO-YEBOAH, J. (1990). Developmental and individual differences in perceived
competence, locus of control, self-esteem and metacognitive reading
awareness. Unpublished Ph.D. thesis. The University of Alberta, Canada.
DAVIDSON, H. H., & LANG, G. (1960). Children’s perceptions of their teachers’
feelings towards them related to self-perception, school achievement and
behaviour. Journal of Experimental Psychology, 29, 107-118.
DAVIS, J. A. (1971). Elementary Survey Analysis. Englewood Cliffs, NJ: Perentice-
Hall.
R e f e r e n c e s
- 9 -
DAVIS, W. L. & DAVIS, D. E. (1972). Internal-external control and attribution of
responsibility for success and failure. Journal of Personality, 40, 123-136.
DEAUX, K., WRIGHTSMAN, L.S. (1988). Social Psychology (4th ed.) Brookes-Cole,
California.
DE BRABANDER, B. (1989). Sex differences in perceived locus of control. The
Journal of Social Psychology, 130, 2, 271-272.
DINKMEYER, D. C. (1965). Child Development ; The Emerging Self. Englewood
Cliffs, N. J. ; Prentic-Hall.
DINKMEYER, D. C. (1970). Developing Understanding of Self and Others. Circle
Pines, MN: American Guidance Service.
DOGUSAL-TEZEL, N. (1987). Ilkokul 5.sınıf ögrencilerinde benlik kavramının
akademik basarı üzerindeki etkisi. Unpublished M. A. Thesis. Hacettepe
Üniversitesi Sosyal Bilimler Enstitüsü.
DOHERTY, W. J. (1983). The impact of divorce on locus of control orientation in
adult women: a longitudinal study. Journal of Personality and Social
Psychology, 4, 834-840.
DONALDSON, T. S. (1974). Affective Testing in the Alum Rock Voucher Schools.
Rand Corporation.
DONCEEL, J. F. (1955). Philosophical Psychology. New York: Sheed & Ward, Inc.
DÖNMEZ, A. (1985). Denetim odagı ve üç degisken: çevre büyüklügü, yas, aile ortamı
. Egitim ve Bilim, cilt: 10, sayı, 55, sayfa: 4-15.
DRUMMOND, R. J. MC INTIRE, W. G., & RYAN, C. W. (1977). Stability and sex
differences on the Coopersmith Self-Esteem Inventory for students in grades
two to twelve. Psychological Reports, 40, 943-946.
DU CETTE, J., WOLK, S., & FRIEDMAN, S. (1972). Locus of control and creativity
in black and white children. Journal of Social Psychology, 88, 297-298.
DUDLEY, G. (1977). Predicting interpersonal behaviour from a measure of expectancy
for interpersonal control. Psychological Reports, 41, 1223-1230.
DUKE, M. & NOWICKI, S. (1971). Perceived interpersonal locus of control and
academic achievement. Journal of Personality and Social Psychology, 22, 234-
241.
DUKE, M.P., & NOWICKI, S. (1974). Locus of control and achievement - the
confirmation of a theoretical expectation. The Journal of Psychology, 87, 263-
267.
R e f e r e n c e s
- 10 -
DUKES, R. L., & MARTINEZ, R. (1994). The impact of Ethgender on self-esteem
among adolescents. Adolescence, 29, 113, 105-115.
DYAL, J. A. (1984). Cross-cultural research with the locus of control construct. In H.
M. Lefcourt (Ed.), Research with Locus of Control Construct. Academic
Press, Inc., Pp. 209-306.
EATON, W. O., & ENNS, L. R. (1986). Sex differences in Human Motor Activity
Level. Psychological Bulletin, 100, 1, 19-28.
EBEL, R. L. (1972). Essentials of Educational Measurement. Prentice-Hall, Inc.
Englewood Cliffs, New Jersey.
ENSOR, E. G. A. (1960). Comparison of dyadic interactions between high and low
self-concept of ability children and their teachers. Unpublished M.Sc, Thesis,
Bradford University.
ERIKSON, E. H. (1959). Identity and the Life Cycle: Selected Papers, with a Historical
Introduction by David Rapaport. New York: International Universities Press.
ERIKSON, E. H. (1963). Childhood and Society (2nd ed.). New York: Norton.
ERIKSON, E. H. (1968). Identity, Youth and Crises. London: Faber and Faber.
ERSEK, I. (1992). Isitme engelli ögrencilerin benlik kavramlarinin incelenmesi.
Yayınlanmamıs Yüksek Lisans Tezi, Ankara Üniversitesi.
EVANS, R. I. (1967). Dialogue with Erik Erikson. New York: Harper.
EVANS, R. G. (1980). Reactions to threat by defensive and congruent internals and
externals: A self-esteem analysis. Journal of Research and Personality, 14, 76-
90.
FAUST, V. (1980). Self-Esteem in the Classroom, San Diego, California: Thomas
Paine Press.
FAWCETT, J., & BORNSTEIN, M. (1973). Modernisation, individual modernity and
fertility. In J. Fawcett (Ed.), Psychological Perspectives on Population. New
York: Basic Books, Pp. 106-131.
FELDHUSEN, J. F., & HOOVER, S. M. (1986). A conception of giftedness:
Intelligence, self-concept and motivation. Roeper Review, 8, 140-143.
FELDHUSEN, J. F., & KOLLOFF, M. B. (1981). Me: A self-concept scale for gifted
students. Perceptual and Motor Skills, 53, 319-323.
FERRARY, J. R. & PARKER J. (1992). High school achievement, self-efficacy, and
locus of control as predictors of freshman academic performance.
Psychological Reports, 71, 515-518.
R e f e r e n c e s
- 11 -
FESTINGER, L. (1957). A Theory of Cognitive Dissonance. evaluations Stanford,
California: University Press.
FINDLEY, M. J. & COOPER, H. M. (1983). Locus of control and academic
achievement: A literature review. Journal of Personality and Social
Psychology, 44, 2, 419-427.
FITCH, G. (1970). Effects of self-esteem, perceived performance and choice on causal
attributions. Journal of Personality and Social Psychology, 16, 311-315.
FITTS, W. H. (1970). Interpersonal Competence: The Wheel Model. Research
Monograph No. 2. Nashville, TN: Dede Wallace Center.
FONTANA, D. (1988). Psychology for the Teachers. 2nd Rev. Ed.
FREEMAN, J. (1970). Growing up girlish. Transactions, 8, 36-43.
FREUD, S. (1923). The ego and the id. In the Standard Edition of the Complete
Psychological Works of Sigmond Freud. XIX. London: The Hogarth Press &
the Institute of Psychoanalysis.
FREUD, S. (1969). An Outline of Psychoanalysis. (J. Strachey, Trans. & Ed.) New
York: Norton.
FRICK, W. B. (1971). Humanistic Psychology: Interviews with Maslow, Murphy, and
Rogers. Charles E. Merrill Publishing Company.
FRIEDBERG, R. D. (1982). Locus of control and self-concept in a status offender
population. Psychological Reports, 50, 289-290.
FRIEDMAN, S., ROGERS, P. P., & GETTYS, J. (1975). Project re-ed: increase in self-
esteem as measured by the Coopersmith inventory. Perceptual and Motor
Skills, 40, 165-166.
FRIEND, R., & NEALE, J. (1972). Children’s perceptions of success and failure: An
attributional analysis of the effects of race and social class. Developmental
Psychology, 7, 124-128.
FROOM, E. (1939). Selfishness and self-love. Psychiatry, 2, 507-523.
FROOM, E. (1947). Man for Himself. New York: Holt, Rinehart & Winston.
FROMM, E. (1956). The Art of Loving. New York: Harper & Row.
FURNHAM, A., & HENRY, J. (1980). Cross-cultural locus of cultural studies:
experiment and critique. Psychological Reports, 47, 23-29.
R e f e r e n c e s
- 12 -
GADZELLA, B., WILLIAMSON, J., & GINTHER, D. (1985). Correlations of self-
concept with locus of control and academic performance. Perceptual and
Motor Skills, 61, 639-645.
GASPARD, M. R. & BERNETT, M. F. (1991). The relationship between self-esteem
and academic achievement of rural ninth grade students. Journal of Rural and
Small Schools, 4, 3, 2-9.
GARZA, R. T., & Ames, R. E. (1974). A comparison of Anglo- and Mexican-American
college students on locus of control. Journal of Consulting and Clinical
Psychology, Vol. 42, No. 6, 919.
GECAS, V. (1982). The self-concept. Annual Review of Sociology, 8, 1-33.
GEIST, C. R., & Bangham, W. R. (1980). Locus of control and religious affiliation,
Psychological Reports, 47, 1281-1282.
GEIST, C. R., & Borecki, S. (1982). Social avoidance and distress as a predictor of
perceived locus of control and level of self-esteem. Journal of Clinical
Psychology, 38, 611-613.
GERGEN, K. J. (1971). The Concept of Self. New York: Holt, Rinehart & Winston.
GIDERER, H. E. (1990). Fen lisesi ile Ömer Seyfettin lisesi ögrencilerinin denetim
odagına göre bazı degiskenler yönünden karsılastırılması. Unpublished M.A.
thesis. University of Hacettepe, Turkey.
GOOD, L. R. & GOOD, K. C. (1975). A measure of self-esteem. Psychology, 12, 32-
34.
GORDON, D. A. (1977). Children beliefs in internal-external control, and self-esteem
as related to academic achievement. Journal of Personality Assessment, 41, 4,
383-386.
GOSE, A., WOODEN, S., & MULLER, D. (1980). The relative potential of self-
concept and intelligence on predictors of achievement. Journal of Psychology,
104, 279-288.
GREGORY, W. L. (1978). Locus of control for positive and negative outcomes.
Journal of Personality and Social Psychology, 36, 840-849.
GROSS, R. D. (1993). Psychology - The Science of Mind and Behaviour. Hodder &
Stoughton.
GROWE, G. A. (1980). Parental behavior and self-esteem in children. Psychological
Reports, 47, 499-502.
GRUEN, G. E., KORTE, J. R., & BAUM, J. F. (1974). Group measures of locus of
control. Developmental Psychology, 10, 683-686.
R e f e r e n c e s
- 13 -
GRUEN, G. E., & OTTINGER, D. R. (1969). Skill and chance orientations as
determiners of problem-solving behavior in lower -and middle-class children.
Psychological Reports, 24, 207-214.
GÜÇRAY, S. (1989). Çocuk Yuvasında ve aile yanında kalan 9-10-11 yas çocuklarının
özsaygı gelisimini etkileyen bazı etkenler. Yayınlanmamıs Doktora Tezi,
Ankara.
GÜNDÜZ, Z. (1986). Okul basarısı ve ortaokul 1.sınıf ögrencilerinde denetim odagı.
Yayınlanmamıs Yüksek Lisans Tezi. Ankara Universitesi, Sosyal Bilimler
Enstitüsü, Ankara.
GÜNGÖR, A. (1989). Lise ögrencilerinin özsaygı düzeylerini etkileyen etmenler.
Yayınlanmamıs Doktora Tezi, Hacettepe Üniversitesi.
GÜREL, H. (1986). Yabancı dil olarak ingilizce ögrenme basarısı ile ögrencilerin
akademik benlik tasarımları ve tutumları arasındaki iliski. Yayınlanmamıs
Doktora Tezi, Hacettepe Üniversitesi.
GURNEY, P. (1987). Self-esteem enhancement in children: A review of research
findings. Educational Research, 29, 2, 130-136.
GWIN, J. (1990). Self-Esteem vs academic excellence: are the two on a collision
course? Crisis, 97, 10, 16-21.
HAGBORG, W. J., MASELLA, G., PALLADINO, P. & SHEPARDSON, J. (1991). A
follow-up study of high school students with a history of grade retention.
Psychology in the Schools, 28, 310-317.
HALPIN, G., HALPIN, G., & WHIDDON, T. (1981). Locus of control and self-esteem
among American Indians and Whites: A cross-cultural comparison.
Psychological Reports, 48, 91-98.
HAMACHEK, D. E. (1972). Effect of early school failure experiences on self-image:
development and implications for school counsellors. Paper Presented at the
Meeting of the American Educational Research Association, Chicago, April,
1972.
HANCOCK, B. W. & SHARP, P. M. (1993). Educational achievement and self-esteem
in a maximum security prison program. Journal of Offender Rehabilitation,
20, (1/2), 21-33.
HANSFORD , B. C., & HATTIE, J. A. (1982). The relationship between self and
achievement / performance measures. Review of Educational Research, 52, 1,
123-142.
HART, J. G. (1985). LAWSEQ: its relation to other measures of self-esteem and
academic ability. British Journal of Educational Psychology, 55, 167-169.
R e f e r e n c e s
- 14 -
HARTER, S. (1982). The perceived competence scale for children, Child Development,
53, 87-97.
HARTWIG, W., DICKSON, A., & ANDERSON, H. (1980). Locus of control and
assertiveness. Psychological Reports, 46, 1345-1346.
HARTY, H., ADKINS, D., & HUNGATE, E. (1984). Exploring self-concept and locus
of control of students in two recognised approaches to elementary school
gifted education. Roeper Review, 7, 88-91.
HENDRIX, B. L. (1980). The effect of locus of control on the self-esteem of black and
white youth. The Journal of Social Psychology, 112, 301-302.
HERSH, P. D., & Schiebe, K. (1967). Reliability and validity of internal-external
control as a personality dimension. Journal of Consulting Psychology, 31, 609-
613.
HEYMAN, W. B. (1990). The self-perception of a learning disability and its
relationship to academic self-concept and self-esteem. Journal of Learning
Disabilities, 23, 8, 472-475.
HIRSH, B. J., & Rapkin, B. D. (1987). The transition to junior high school, a
longitudinal study of self-esteem, psychological symptomatology, school life,
and social support. Child Development, 58, 1235-1243.
HOCHREICH, D. J. (1975). Defensive externality and blame following failure. Journal
of Personality and Social Psychology, 32, 540-546.
HOGE, D. R., SMIT, E. K., & HANSON, S. L. (1990). School experiences predicting
changes in self-esteem of sixth and seventh-grade students. Journal of
Educational Psychology, 82, 1, 117-127.
HORNER, M. S. (1972). Towards an understanding of achievement-related conflicts in
women. Journal of Social Issues, 28, 157-175.
HORNEY, K. (1945). Our Inner Conflicts. New York: W.W. Norton and Company,
Inc.
HORNEY, K. (1951). Neurosis and Human Growth -The Struggle Toward Self-
Realization New York: Norton.
HSIEH, T. T., SHYBUT, J., & LOTSOF, E. J. (1969). Internal versus external control
and ethnic group membership. Journal of Consulting and Clinical Psychology,
33, 122-124.
HUI, C-C, H. (1982). Locus of control. A review of cross-cultural research.
International Journal of Intercultural Relations, Vol. 6, pp. 301-323.
R e f e r e n c e s
- 15 -
IRWIN, F. S. (1967). Sentence completion responses and scholastic success or failure.
Journal of Counseling Psychology, 14, 269-271.
ITSKOWITZ, R., ABEND, T., & DIMITROWSKY, L. (1986). The relationship
between teachers’ self-concept and their tendency to refer students for
psychological help. School Psychology International, 7, 116-122.
ITSKOWITZ, R., NAVON, R., & STRAUSS, H. (1989). The effect of teachers’ self-
concept on the accuracy of their ratings of pupils’ self-concepts. School
Psychology International, 10, 283-291.
JAMES, W. (1890). Principal of Psychology. New York: Holt.
JAMES, W., & ROTTER, J. B. (1958). Partial and 100% reinforcement under chance
and skill conditions. Journal of Experimental Psychology, 55, 397-403.
JENSEN, L., OLSEN, J., & HUGHES, C. (1990). Association of country, sex, social
class, and life cycle to locus of control in Western European countries.
Psychological Reports, 67, 199-205.
JERSILD, A. T. (1952). In Search of Self: An Exploration of the Role of the School in
Promotion Self Understanding. New York: Bureau of Publications, Teachers
College, Colombia University.
JOHNSON, C. (1993). Self-esteem: from the inside out. Momentum, February / March,
59-62.
JOHNSON, D. C. (1981). Naturally acquired learned helplessness: The relationship of
school failure to achievement behavior, attributions, and self concept. Journal
of Educational Psychology 73, 174-180.
JONES, E. (1963). The Life and Work of Sigmond Freud. (L. Trilling & S. Marcus,
Eds.). Garden City. NY: Anchor Books.
JONES, J. G., & GRIENEEKS, L. (1970). Measures of self-perception as predictors of
scholastic achievement. Journal of Educational Research, 61, 201-203.
JONES, P. (1977). An evaluation of the effect of sport on the integration of West Indian
Schoolchildren. Unpublished Ph. D. Thesis, University of Surrey.
JONES, R. (1990). Self-Esteem goes political. Crisis, 97, 10, 19-21.
JONES, S. C. (1973). Self and interpersonal evaluations: esteem theories. Psychological
Bulletin, 79, 185-199.
JUNG, C. G. (1923). Psychological Types. New York: Harcourt.
JUNG, C. G. (1969). The Structure and Dynamics of the Psyche. (2nd ed.). Princeton,
NJ: Princeton University Press.
R e f e r e n c e s
- 16 -
KAGITÇIBASI, Ç. (1973). Psychological aspects of modernisation in Turkey. Journal
of Cross-Cultural Psychology, 4, 145-157.
KAGITÇIBASI, Ç. (1986). Status of women in Turkey: Cross-cultural perspectives.
International Journal of Middle-East Studies, 18 (4), 485-499.
KAGITÇIBASI, Ç. (1990). Family and socialisation in cross-cultural perspective: A
model of change. In R. A. Dienstbier & J. J. Berman 9Eds.), Nebraska
Symposition on Motivation (pp. 135-199). Lincoln: University of Nebraska
Press.
KARNES, F. A. & D’ILIO V. R. (1991). Locus of control in rural southern elementary
gifted students. Psychological Reports, 69, 927-928.
KASH, M. M., & BORICH, G. D. (1978). Teacher Behaviour and Pupil Self Concept.
Reading, Mass.: Addison-Wesley.
KEEFER, K. E. (1971). Characteristics of students who make accurate and inaccurate
self-predictions of college achievement. Journal of Educational Research, 64,
401-404.
KELLOGG, R. L. (1969). A direct approach to sex role identification of school related
objects, Psychological Reports, 24, 839-841.
KIMBALL, O. M. (1973). Developments of norms for the Coopersmith Self-Esteem
Inventory: Grades four through eight. Dissertation Abstracts International, 34,
1131-1132.
KINGSLEY-MILLS, C., MCNAMARA, S., & WOODWARD, L. (1992). Out From
Behind the Desk - A Practical Guide to Groupwork Skills and Processes.
Leicestershire County Council Publication.
KNIGHT, G., KAGAN, S., MELSON, W., & CUMBINER, J. (1978). Acculturation of
second and third generation Mexican American children. Journal of Cross-
Cultural Psychology, 2, 87-97.
KORKUT, F. (1986). Ilkokul ögrencilerinin kendilerine ve ailelerine iliskin bazı
degiskenlerinin denetim odakları üzerine etkisi. Yayınlanmamıs Yüksek
Lisans Tezi, Hacettepe Üniversitesi.
KOYUNCU, N. (1979). Üstün yetenekli ögrencilerin benlik tasarımı ve rehberlik
hizmetleri. Yayınlanmamıs Yüksek Lisans Tezi, Ankara Üniversitesi Egitim
Bilimleri Fakültesi.
KUBINIEC, C. N. (1970). The relative efficiency of various dimensions of the self-
concept in predicting academic achievement. American Educational Research
Journal, 2, 321-336.
R e f e r e n c e s
- 17 -
KUDER, G. F. & Richardson, M. W. (1937). The theory of the estimation of test
reliability. Psychometrika, 2, 151-160.
KUKLA, A. (1972). Attributional determinants of achievement-related behaviors.
Journal of Personality and Social Psychology , 48, 166-174.
KURTZ-COSTES, B & SCHNEIDER, W. (1994). Self-concepts, attributional beliefs,
and school achievement: A longitudinal Analysis. Contemporary Educational
Psychology, 19, 199-216.
LADD, G. M., & PRICE, J. M. (1986). Promoting children’s cognitive and social
competence: the relation between parents’ perception of task difficulty and
children’s perceived and actual competence. Child Development, 57, 446-460.
LA GRECA, A. M., STONE, W. L. (1990). LD status and achievement: confounding
variables in the study of children’s social status, self-esteem, and behavioral
functioning. Journal of Learning Disabilities, 23, 8, 483-490.
LALKHEN, Y., & NORWICH, B. (1990). The self-concept and self-esteem of
adolescents with physical impairments in integrated and special school
settings. European Journal of Special Needs Education, 5, 1, 1-12.
LAMBERT, W. W., & WEISBROD. (1971). Comparative Perspectives on Social
Psychology. Boston: Little Brown.
LANZA-KADUCE, L. (1992). Perceived parental communication and adolescent self-
esteem: predictors of academic performance and drop-out rates. ACA Bulletin,
82, 1-12.
LAWRENCE, D. (1981). Development of self-esteem questionnaire. British Journal of
Educational Psychology. Vol. 51 pp. 245-251.
LAWRENCE, D. (1988). Enhancing Self-Esteem in the Classroom. Paul Chapman
Publishing Ltd.
LECKY, P. (1945). Self-Consistency: A Theory of Personality. New York: Island Press.
LeCOMPTE, W. F., & LeCOMPTE, G. K. (1970). Effects of education and
intercultural contact on traditional attitudes in Turkey. Journal of Social
Psychology, 80, 11-12.
LEE, M. S. (1990). Self-esteem and causal attributions of success and failure regarding
achievement-related behaviour. Unpublished Ph. D. Thesis, Kent State
University Graduate School of Education.
LEE, R. G. (1986). A study of primary school pupils’ academic performance and self-
esteem in relation to their position in the family. Unpublished M. Ed. thesis,
School of Education, University of Leeds.
R e f e r e n c e s
- 18 -
LEFCOURT, H. M. (1966). Internal versus external control of reinforcement: A review.
Psychological Bulletin, Vol. 65, No. 4, 206-220.
LEFCOURT, H. M. (1976a). Locus of Control: current trends in theory and research.
Hillsdale, N. J.: Erlbaum.
LEFCOURT, H. M. (1976b). Effects of cue explication upon persons maintaining
external control expectancies. Journal of Personality and Social Psychology, 5,
372-378.
LEFCOURT, H. M. (1983). Research with the locus of control construct: Volume 2.
New York: Academic Press.
LEFCOURT, H. M., VON BAEYER, C. I., WARE, E. E., & COX, D. J. (1979). The
multidimensional-multiattributional causality Scale: The development of a
goal-specific locus of control scale. Canadian Journal of Behavioural Science,
11, 286-304.
LESTER, D., CASTROMAYOR, I. J. & IÇLI, T. (1991). Locus of control, depression,
and suicidal ideation among American, Philippine, and Turkish students.
Journal of Social Psychology, Vol. 131, No. 3, 447-449.
LEWIS, J., & ADANK, R. (1975). Intercorrelations among measures of IQ,
achievement, self esteem and anxiety in two groups of elementary school
pupils exposed to two different models of instruction. Educational and
Psychology Measurement, 35, 499-501.
LIMBACKER, W. (1973). Dimensions of Personality. Dayton:, Ohio: Pflaum.
LITTLE, C. B. (1979). Stability of internal-external control as measured by the Rotter
scale. Journal of Social Psychology, 108, 127-128.
LIU, X., KAPLAN, H.B. & RISSER,W. (1992). Decomposing the reciprocal
relationships between academic achievement and general self-esteem. Youth
& Society, 24, 2, 123-148.
LOEB, R. (1975). Concomitants of boy’s locus of control examined in parent-child
interactions. Developmental Psychology, 11, 353-358.
LOEB, R. C. & HORST, L. (1978). Sex differences in self - and teachers’ reports of
self-esteem in preadolescents. Sex Roles, 4, 5, 779-788.
LOK, P. P. D. (1983). Children’s self-esteem, teacher’s evaluation, and teacher-pupil
interactions in ESN(M) classrooms: an observational study. Unpublished
Ph.D. thesis. The University of Hall.
LOMAX, P. (1977). The self-concepts of girls in the context of a disadvantaging
environment. Educational Review, 29.
R e f e r e n c e s
- 19 -
LOMBARDO, J. P., SAVERIO, C. & SOLHEIM, G. (1975). The relationship of
internality-externality self-acceptance and self ideal discrepancies. Journal of
Genetic Psychology, 126, 281-288.
LOUDEN, D. M. (1977). A comparative study of self-concept, self-esteem, and locus
of control in minority group adolescents in English multi-racial schools.
Unpublished Ph.D. thesis. University of Bristol.
LUNDGREEN, D. C. (1978). Public esteem, self-esteem, and interpersonal stress.
Social Psychology, 41, 1, 68-73.
LUNDGREN, D. C., SCHWAB, M. R. (1977). Perceived appraisals by others, self-
esteem, and anxiety. The Journal of Psychology, 97, 205-213.
MACK, F. R-P. (1987). Understanding and enhancing self-concept in black children.
Momentum, 18, 22-25.
MAJDUB, G. (1990). The psychological determining of academic achievement,
Unpublished Ph.D. thesis. University of Bristol.
MALIKIOSI, M. X., RYCKMAN, R. M. (1977). Differences in perceived locus of
control among men and women adults and university students in America and
Greece. Journal of Social Psychology, 103, 177-183.
MANY, M. A., & MANY, W. A. (1975). The relationship between self-esteem and
anxiety in grades four through eight. Educational and Psychological
Measurement, 35, 1017-1021.
MASSARI, D. J., & ROSENBLUM, D. C. (1972). Locus of control, interpersonal trust
and academic achievement. Psychological Reports, 31, 355-360.
MAQSUD, M. (1993). Relationships of some personality variables to academic
attainment of secondary school pupils. Educational Psychology, Vol. 13, No.
1, 11-18.
MAQSUD, M. & ROUHANI, S. (1991). Relationships between socioeconomic status,
locus of control, self-concept, and academic achievement of Batswana
adolescents. Journal of Youth and Adolescence, Vol. 20, No. 1, 107-114.
MARKUS, H. R., & KITAYAMA, S. (1991). Culture and the self: Implications for
cognition, emotion, and motivation. Psychological Review, 98, 224-253.
MARSH, H. W. (1984). Relations among dimensions of self-attributions, dimensions of
self-concept, and academic achievement. Journal of Educational Psychology,
76, 1291-1308.
MARSH, H. W. (1990). Causal ordering of academic self-concept and academic
achievement: A multiwave, longitudinal panel analysis. Journal of Educational
Psychology, 82, 646-656.
R e f e r e n c e s
- 20 -
MARSH, H. W., BARNES, J., CAIRNS, L., & TIDMEN, M. (1984). Self-Description
Questionnaire: Age and sex effects in the structure and level of self-concept
for preadolescent children. Journal of Educational Psychology, 76, 5, 940-956.
MARSH, H. B., & SHAVELSON, R. J. (1985). Self-concept: Its multifaceted,
hierarchical structure. Educational Psychologist, 20, 107-125.
MARTINEZ, R. & DUKES, R. L. (1991). Ethnic and gender differences in self-esteem.
Youth & Society, 22, 3, 318-338.
MARUYAMA, G., RUBIN, R. A., & KINGBURY, G. (1981). Self-esteem and
educational achievement: Independent constructs with a common cause ?.
Journal of Personality and Social Psychology, 40, 962-975.
MASLOW, A. H. (1962). Toward A Psychology of Being. New York, Van Nostrand.
MASLOW, A. H. (1970). Motivation and Personality. (2nd ed.). New York: Harper &
Row.
MATHES, E. W. (1978). Self-actualization, metavalues, and creativity. Psychological
Reports, 43, 215-222.
MATTESON, D. R. (1977). Exploration and Commitment: Sex differences and
methodological problems in the use of the identity status categories. Journal of
Youth and Adolescence, 6, 353-374.
MBOYA, M. M. (1993). Self-concept of academic ability: relations with gender and
academic achievement. Perceptual and Motor Skills, 77, 1131-1137.
McCALLON, E. L. (1967). Self-Ideal discrepancy and the correlates sex and academic
achievement. The Journal of Experimental Education, 35, 4, 45-49.
McDONALD, A. P. (1971). Internal-external locus of control. Journal of Counselling
Psychology, 18, 111-116.
McGINNIES, E., NORDHOLM, L.A., WARD, C. D. & BHANTHUMNAVIN, D. L.
(1974). Sex and cultural differences in perceived locus of control among
students in five countries. Journal of Consulting and Clinical Psychology, 42,
451-455.
McGUIRE, W. J., & McGUIRE, C. V. (1982). Significant others in self space: sex
differences and developmental trends in the social self. In J. Suls (Ed.),
Psychological Perspectives on the Self, Vol. 1. Hillsdale, N. J.: Lawrence
Erlbaum Associates.
McGUIRE, W. J., & PADAWER-SINGER, A. (1976). Trait salience in the
spontaneous self-concept. Journal of Personality and Social Psychology, 33,
743-754.
R e f e r e n c e s
- 21 -
McNAMARA, S. & MORETON, G. (1993). Teaching Special Needs - Strategies and
Activities for Children in the Primary Classroom. London: David Fulton
Publishers Ltd.
McNAMARA, S. & MORETON, G. (1995). Changing Behaviour -Teaching Children
with Emotional and Behavioural Difficulties in Primary and Secondary
Classrooms. London: David Fulton Publishers Ltd.
MEAD, G. H. (1934). Mind, Self and Society. Chicago: University of Chicago Press.
MEHRENS, W., & LEHMANN, I. (1978). Measurement and Evaluation in Education
and Psychology, (2nd ed). New York: Holt Rinehart and Winston.
MEISELS, M., & FORD, L. (1969). Social desirability response set and semantic
differential evaluative judgements. Journal of Social Psychology, 78, 45-54.
MEYER, G. E. (1993). SPSS A Minimalist Approach. Holt, Rinehart & Winston, Inc.
MILLIGAN, C. D. (1992). Reassessing the at risk students: a quadripartite analysis of
secondary school students using self-esteem and locus of control. Unpublished
Ph. D. Thesis, the Faculty of The Claremont Graduate School, California,
USA.
MISCHEL, W., ZEISS, R., & ZEISS, A. (1974). Internal-external control and
persistence: Validation and implication of the Stanford Preschool Internal-
External Scale. Journal of Personality and Social Psychology, 29, 265-278.
MOONEY, S. P., SHERMAN, M. F., & LO PRESTO, C. T. (1991). Academic locus of
control, self-esteem, and perceived distance from home as predictors of
college adjustment. Journal of Counseling & Development, 69, 445-448.
MOORE, T. G. (1980). Self-esteem and academic self-concepts in school-age children.
Unpublished Ph.D. thesis. University of Surrey.
MORRISON, T. L., & MORRISON, R. L. (1978). Self-esteem, need for approval, and
self-estimates of academic performance. Psychological Reports, 43, 503-507.
MORRISON, T. L., & THOMAS, D. (1975). Self-esteem and classroom participation.
Journal of Educational Research, 68, 374-7.
MORRISON, T. L., THOMAS, D., & WEAVER, S. J. (1973). Self-esteem and self-
estimates of academic performances. Journal of Consulting and Clinical
Psychology, 41, 412-415.
MURK, D. A. & ADDLEMAN, J. A. (1992). Relations among moral reasoning, locus
of control, and demographic variables among college students. Psychological
Reports, 70, 467-476.
R e f e r e n c e s
- 22 -
MURRAY, E. (1972). Students’ perceptions of self-actualising and non self-actualising
teachers. Journal of Teacher Education, 23, 383-387.
MURRAY, H., & STAEBLER, B. K. (1974). Teachers’ locus of control and student
achievement gains. Journal of School Psychology, 12, 305-309.
MWAMWENDA, T. S., & MWAMWENDA, B. B. (1986). Transkeian students’ locus
of control and academic achievement. Psychological Reports, 59, 511-516.
NECESSARY, J. R., & PARISH, T. S. (1993). An attempt to enhance young children’s
self-concepts: A follow-up report. Reading Improvement, 50, 8, 12-13.
NEUMAN, S. G. (1992). The negative consequences of the self-esteem movement. The
Alberta Journal of Educational Research, 38, 4, 251-253.
NEWMAN, R. S. (1984). Children’s achievement and self-evaluations in mathematics:
A longitudinal study. Journal of Educational Psychology, 76, 857-873.
NOWICKI, S., DUKE, M., (1974). A locus of control scale for non-college as well as
college adults. Journal of Personality Assessment, 38, 136-137.
NOWICKI, S., & ROUNDTREE, J. (1971). Brief reports - Correlates of locus of
control in a secondary school population. Developmental Psychology, Vol. 4,
No. 3, 477-478.
NOWICKI, S. & SEGAL, W. (1974). Perceived parental characteristics, locus of
control orientation and behavioral correlates of locus of control.
Developmental Psychology, 10, 33-37.
NOWICKI, S. & STRICKLAND, B. R. (1973). A locus of control scale for children.
Journal of Consulting and Clinical Psychology, Vol. 40, No. 1, 148-154.
OKUN, M. A. & FOURNET, L. M. (1993). Academic self-esteem and perceived
validity of grades: A test of self-verification theory. Contemporary Educational
Psychology, 18, 414-426.
O’ MALLEY, P. M., & BACHMAN, J. G. (1979). Self-esteem and education: sex and
cohort comparisons among high school seniors. Journal of Personality and
Social Psychology. Vol. 37 No. 7 pp. 1153-1159.
O’MALLEY, P. M., & BACHMAN, J. G. (1983). Self-esteem: Change and stability
between ages 13 and 23. Developmental Psychology, 19, 257-268.
OMIZO, M. M. & OMIZO, S. A. (1988). On the scene: the effects on participation in
group counselling sessions on self-esteem and locus of control among
adolescents from divorced families. The School Counselling, V. 36, 54-60.
ONUR, E. P. (1981). Çocuklarda öz-saygının önkosulları. Yayınlanmamıs Yüksek
Lisans Tezi, Istanbul.
R e f e r e n c e s
- 23 -
OPPENHEIM, A. (1966). Questionnaire design and attitude measurement. London:
Heinemann.
OWENS, K. (1991). An integrative self-enhancement and basic-skill program and its
impact on students’ global self-esteem, academic self-concept, and acad.
performance. Unpublished Ph.D. thesis.
ÖNCÜ, A. (1982). Uzman Mesleklerde Türk Kadını (Turkish Women in Professional
Occupations). In N. Abadan-Unat (Ed.), Turk Toplumunda Kadın. (Women in
Turkish Society) Sosyal Bilimler Arastırmaları Dizisi 1., 2. Baskı. Istanbul:
Arastırma, Egitim, Ekin Yayınları, and Türk Sosyal Bilimler Dernegi.
ÖZOGUL, S. N. (1988) Annenin çalısmasının ve bazı bireysel niteliklerin çocugun
özsaygısına etkisi. Yayınlanmamıs Yüksek Lisans Tezi, Hacettepe Üniversitesi.
ÖZYÜREK, M. (1982). Normal ögrencilerle birlikte ve ayrı egitilen ortopedik arızalı
ögrencilerde benlik kavramı ve denetleme odagı. Yayınlanmamıs Doçentlik
Tezi (Unpublished Thesis for Associate Professorship) Ankara Universitesi,
Egitim Bilimleri Fakultesi.
PARSONS, O. A., & SCHNEIDER, J. M. (1974). Locus of control in university
students from Eastern and Western societies, Journal of Consulting and
Clinical Psychology, Vol. 42, No. 3, 456-464.
PARSONS, O. A., & SCHNEIDER, J. M., & HANSEN, A. S. (1970). Internal-external
locus of control and national stereotypes in Denmark and the United States.
Journal of Consulting and Clinical Psychology, 35, 30-37.
PECK, R. F., FOX, R. B., & MARSTON, P. T. (1977). Teacher effects on student
achievement and self-esteem. Paper Presented at the Annual Meeting of the
American Educational Research Association, New York, April 4-8.
PHALET, K., & CLAEYS, W. (1993). A comparative study of Turkish and Belgian
youth. Journal of Cross-Cultural Psychology, 24, 3, 319-343.
PHARES, E. J. (1957). Expectancy changes in skill and chance situations. Journal of
Abnormal and Social Psychology, 54, 339-342.
PHARES, E. J. (1976). Locus of control in personality. Morristown, N.J. General
Learning Press.
PHARES, E. J. (1979). Defensiveness and perceived control. Hillsdale N.J.: Lawrence
Erlbaum.
PIERS, E. V. (1969). Manual of Piers-Harris Children’s Self-Concept Scale, Nashville:
Counsellor Recordings and Tests.
PIERS, E. V., & HARRIS, D. (1964). Age and other correlates of self-concept in
children. Journal of Educational Psychology, 55, 91-95.
R e f e r e n c e s
- 24 -
POPE, A. W., MCHALE, S. M., & CRAIGHEAD, W. E. (1988). Self-Esteem
Enhancement with Children and Adolescent. Pergamon Press.
POTTEBAUM, S. M., KEITH, T. Z., & EHLY, S. W. (1986). Is there a causal relation
between self-concept and academic achievement. Journal of Educational
Research, 79, 3, 140-144.
PORTER, J., & COHEN, M. (1977). Personal causation and locus of control: an
analysis of selected teacher characteristics and their relation to student
achievement. Paper presented at the annual meeting of the American
Educational Research Association, New York, 1977. (ERIC Document
Reproduction Service No. ED 137 231)
PROCIUK, T. J., & BREEN, L. J, (1974). Locus of control, study habits and attitudes
and college academic performance. The Journal of Psychology, 88, 91-95.
PROCIUK, T. J., & BREEN, L. J. (1975). Defensive externality and its relation to
academic performance. Journal of Personality and Social Psychology, 31, 549-
556.
PURKEY, W. W. (1970). Self-Concept and School Achievement. Englewood Cliffs, N.
J.: Prentice-Hall.
RABINOWITZ, R. (1978). Internal-external control expectancies in black children of
differing socioeconomic status. Psychological Reports, 42, 1339-1345.
REASONER, R. W. (1992). What’s behind self-esteem programs: truth or trickery?
The School Administrator, 49, 4, 22-30.
REID, I., & CROUCHER, A. (1980). The Crandall Intellectual Achievement
Responsibilities Questionnaire: A British validation study. Educational and
Psychological Measurement, 40, 255-258.
REITZ, H. J., & GROFF, G. K. (1974). Economic development and belief in locus of
control among factory workers in four countries. Journal of Cross-Cultural
Psychology, 5, 344-355.
RENSHAW, P. (1990). Self-esteem research and equity programs for girls: A
reassessment. In J. Kenway & S. Willis (Eds.), Harts and Minds - Self-Esteem
and the Schooling of Girls. The Falmer Press.
REPLOGLE, W. H., O’BANNON, R. M., MC CULLOUGH, P. W., & CASHION, L.
N. (1980). Locus of control and assertive behavior. Psychological Reports, 47,
769-770.
RFAEI, W., & RAHMAN, A. (1976). Locus of control of reinforcement of Malay and
Australian secondary school students. Journal Pendidikan, U.K.M., 1-4.
R e f e r e n c e s
- 25 -
ROBISON-AWANA, P. (1987). Self-esteem, sex role perceptions, attributional style,
and sex role orientation during adolescence as a function of academic
achievement. Unpublished Ph. D. dissertation, The University of Utah.
ROBISON-AWANA, P., KEHLE, T. J. AND JENSEN, W. R. (1986). But what about
smart girls ? Adolescent self-esteem and sex-role perceptions as a function of
academic achievement. Journal of Educational Psychology., 78 (3), 179-183.
ROGERS, C. R. (1951). Client-Centred therapy: its current practice. Implications, and
theory. Boston: Houghton-Mifflin.
ROGERS, C. R. (1959). A theory of therapy, personality and interpersonal relationships
as developed in the client-centred framework, in S. Koch (ed.), psychology: A
Study of a Science, Vol. 3, New York: McGraw-Hill.
ROGERS, C. R. (1961). On Becoming a Person. Boston: Houghton Mifflin.
ROGERS, C. R. (1965). Client-Centered Therapy. Boston: Houghton Mifflin.
ROGERS, C.M., SMITH, M.D. AND COLEMAN, J. M.(1978). Social Comparison in
the classroom: The relationship between academic achievement and self-
concept. Journal of Educational Psychology. 70, 50-57
ROGERS, C. R. & SANFORD, R. C. (1984). Client-centred psychotherapy. In H. I.
Kaplan & B. J. Sadock (Eds.), Comprehensive Textbook of Psychiatry. Vol.4,
p.1374-1388. Baltimore: Williams & Wilkins.
ROSENBERG, F., & SIMMONS, R. G. (1975). Sex differences in the self-concept in
adolescence. Sex Roles, 1, 147-159.
ROSENBERG, M. (1955). Factors influencing change in occupational choice, in
Layerfield & Rosenberg (eds.) The Language of Social Research, 250-259,
New York: Glencoe Free Press.
ROSENBERG, M. (1965). Society and the Adolescent Self-Image. Princeton: Princeton
University Press.
ROSENBERG, M. (1979). Concerning the Self. New York: Basic Books.
ROSENBERG, M. (1985). Self-concept and psychological well-being in adolescence.
In R. L. Leahy (Ed.), The Development of the Self, (pp.205-246). Orlando:
Academic Press, Inc.
ROSENBERG, M., SCHOOLER, C., & SCHOENBACH, C. (1989). Self-esteem and
adolescent problems: modelling reciprocal effects. American Sociological
Review, 54, 1004-1018.
ROSENTHAL, J. H. (1973). Self-esteem in dyslexic children. Academic Therapy, 9,
27-39.
R e f e r e n c e s
- 26 -
ROTTER, J. B. (1966). Generalised expectancies for Internal versus external control of
reinforcement. Psychological Monographs, 80, No. 1 (Whole No. 609).
ROTTER, J. B., CHANGE, J., & PHARES, E. J. (Eds.) (1972). Applications of a
Social Learning Theory of Personality. New York: Holt, Rinehart and
Winston.
ROTTER, J., & MULRY, R. (1965). Internal versus external control of reinforcements
and decision time. Journal of Personality and Social Psychology, 2, 599-604.
ROTTER, J. B., SEEMAN, M., & LIVERANT, S. (1962). Internal versus external
control of reinforcement: A major variable in behavior theory. In N. F.
Washburne, (Ed.), Decisions, Values, and Groups, Vol. 2. London: Pergamon
Press, 473-516.
RUBIN, R. A. (1978). Stability of self-esteem ratings and their relation to academic
achievement: A longitudinal Study. Psychology in the Schools, 15, 3, 430-433.
RUBIN, R., DORLE, J., & SANDIDGE, S. (1976). The Coopersmith Self-Esteem
Inventory related to academic achievement and school behavior. Minneapolis,
MN: Minnesota University. ERIC Document Reproduction Service No. ED
159-199.
RYCKMAN, R. M. (1993). Theories of Personality. Fifth Ed. California: Brooks/Cole
Publishing Company. ISBN No: 0-534-16644-X.
RYCKMAN, R. M,. ROBBINS, M. A., THORNTON, B., GOLD, J. A., & KUEHNEL,
R. H. (1985). Physical self-efficacy and actualization. Journal of Research in
Personality, 19, 288-298.
SABERS, D. L. & WHITNEY, D. R. (1976) Suggestions for validating rating scales
and attitude inventories. Technical Bulletin No. 19. Iowa City: University of
Iowa , Evaluation and Examination Service.
SAMUELS, S. C. (1977). Enhanced Self-Concept in Early Childhood. Sciences Press.
SATILMIS, G. (1988). Yetistirme yurdunda yasayan ergenlerde benlik saygısı (Self-
esteem of adolescents who are living in homeless house). Yayınlanmamıs
Yüksek Lisans Tezi, Anadolu Üniversitesi, Eskisehir.
SAX, L. J. (1994). Mathematical self-concept: How college reinforces the gender gap.
Research in Higher Education, 35, 2, 141-166.
SCHECK, K. C., & RHODES, G. A. (1980). The relationship between junior high
school teachers’ rated competence and locus of control. Education, 100, 243-
244.
R e f e r e n c e s
- 27 -
SCHMIDT, R. W., LAMM, H., & TROMMSDORFF, G. (1978). Social class and sex
as determinant of future orientation (time perspective) in adults. European
Journal of Social Psychology, 8, 71-90.
SCHNEE, R. G. (1978). Relationship between self-esteem, achievement, and I.Q.
measures of elementary and secondary students. Washington, D.C.: National
Institute of Education. ERIC Document Reproduction Service No. ED 152
845.
SCHNEIDER, J. M., & PARSONS, O. A. (1970). Categories on the Locus of Control
Scale and cross-cultural comparisons in Denmark and the United States.
Journal of Cross-Cultural Psychology, 1, 131-138.
SEARS, R. R. (1970). The relation of early socialisation experiences to self-concepts
and gender role in middle childhood. Child Development, 41, 267-289.
SERIFI, D. (1985). Grupla psikolojik danısmanın lise ögrencilerinin problemleri ve
benlik tasarımlarına etkisi. Yayınlanmamıs Yüksek Lisans Tezi, Hacettepe
Üniversitesi, Sosyal Bilimler Enstitüsü.
SHARP, G., & MULLER, D. (1978). The effects of lowering self-concept on
associative learning. Journal of Psychology, 100, 233-242.
SHAVELSON, R. J., BOLUS, R. (1982). Self-concept: the interplay of theory and
methods. Journal of Educational Psychology. Vol. 74 No. 1 pp. 3-17.
SHAVELSON, R. J., HUBNER, J. J., & STANTON, G. C. (1976). Self-concept:
Validation of construct interpretations. Review of Educational Research, 46, 3,
407-441.
SHAW, R. L. & UHL, N. P. (1971). Control of reinforcement and academic
achievement. The Journal of Educational Research, Vol. 64, No. 5, 226-228.
SHRAUGER, J. S. & LUND, A. K. (1975). Self-evaluation and reactions to evaluations
from others. Journal of Personality, 43, 94-108.
SIMMONS, R. G. (1987). Self-esteem in adolescence. In: Self and Identity:
Perspectives Across the Life-Span. (Eds.) Honess, T. & Yardley, K. London &
New York: Routledge and Kegan Paul.
SIMON, W. E., & SIMON, M. G. (1975). Self-esteem, intelligence, and standardised
academic achievement, Psychology in the Schools, 12, 97-99.
SINGH, B. G. & VERMA, O. P. (1990). Cultural differences in locus of control beliefs
in two Indian societies. The Journal of Social Psychology, Vol. 130, No. 6,
725-729.
SKAALVIK, E. M. (1986). Sex differences in global self-esteem: A research review.
Scandinavian Journal of Educational Research, 30, 4, 167-179.
R e f e r e n c e s
- 28 -
SKAALVIK, E. M. (1990). Attribution of perceived academic results and relations with
self-esteem in senior high school students. Scandinavian Journal of
Educational Research, 34, 4, 259-269.
SKAALVIK, E. M., & HAGTVET, K. A. (1990). Academic achievement and self-
concept: An analysis of causal predominance in a developmental perspective.
Journal of Personality and Social Psychology, 58, 292-307.
SKINNER, B. F. (1972). Beyond Freedom and Dignity. New York: Alfred A. Knopf.
SOARES, A. T., & SOARES, L. M. (1969). Self-perception of culturally disadvantaged
children. American Educational Research Journal, 6, 31-45.
SONG, I. S., & HATTIE, J. (1984). Home environment, self-concept and academic
achievement: A causal modelling approach. Journal of Educational
Psychology, 76, 1269-1281.
SPRING, R., & KHANNA, P. (1982). Locus of control, repression, sensitisation and
interpersonal causality. Psychological Reports, 50, 175-197.
STAINES, J. W. (1958). The self picture as a factor in the classroom. British Journal of
Educational Psychology, 28, 2, 97-111.
STAIR, V. (1967). Conjoint Family Therapy. Pal Alto, Calif.: Science and Behavior
Books.
STEPHENS, M., & DELYS, P. (1973). A locus of control measure for preschool
children. Developmental Psychology, 9, 55-65.
STEVENSON, H. W. (1992). What’s behind self-esteem programs: truth or trickery?
The School Administrator, 49, 4, 22-30.
STIPEC, D. J. & WEISZ, J. R. (1981). Perceived personal control and academic
achievement. Review of Educational Research, 51, 101-137.
STRASSBURGER, L. A., ROSEN, L. A., MILLER, C. D. & CHAVEZ, E. L. (1990).
Hispanic-Anglo differences in academic achievement - The relationship of
self-esteem, locus of control and socioeconomic level with grade-point
average in the USA. School Psychology International, Vol. 11, 119-124.
STRICKLAND, B. R. (1977). Internal-external control of reinforcement. In T. Blass
(Ed.),Personality Variables in Social Behaviour. New York: Halstead Press
Wiley. Pp. 219-274.
SULLIVAN, H. S. (1940). Conceptions of Modern Psychiatry. Psychiatry, 3, 1-117.
SULLIVAN, H. S. (1947). The Meaning of Anxiety in Psychiatry and in Life.
Washington, D.C.: William Alanson White Institute of Psychiatry.
R e f e r e n c e s
- 29 -
SULLIVAN, H. S. (1953). The Interpersonal Theory of Psychiatry. New York: W. W.
Norton.
SÜZEN, D. (1987). Ilkokul 5.sınıf ögrencilerinde yaratıcı düsünme yetenegi ile benlik
kavramı arasındaki iliski. Yayınlanmamıs Yüksek Lisans Tezi, Hacettepe
Üniversitesi, Sosyal Bilimler Enstitüsü.
TAN, M. (1981). Atatürkçü Düsünüs ve Karma Egitim (Atatürkist Thinking and Co-
Education). Paper Presented at the International Conference on Atatürk, Paper
No: 61, Vol. 3, Bogaziçi Üniversitesi, November 9-13. Bebek, Istanbul:
Bogaziçi Üniversitesi Matbaası.
TASHAKKORI, A. & THOMPSON, V. D. (1991) Race differences in self-perception
and locus of control during adolescence and early adulthood: methodological
implications. Genetic, Social, and General Psychology Monographs, 117, (2),
135-152.
TRAUB, G. S. (1982a). Relationship between locus of control and maladaptive fears.
Psychological Reports, 50, 1249-1250.
TRAUB, G. S. (1982b). Relationship between locus of control and grade point average
in freshman college students. Psychological Reports, 50, 1294.
TRICE, A. D. (1985). An academic locus of control scale for college students.
Perceptual and Motor Skills, 61, 1043-1046.
TROWBRIDGE, N. (1972b). Socio-economic status and self-concept of children.
Journal of Teacher Education, 23, 63-65.
TÜRKMEN, F. (1989). Üniversite ögrencilerinin benlik kavramı. Yayınlanmamıs
Yüksek Lisans Tezi, Ankara Üniversitesi Sosyal Bilimler Enstitüsü.
UGUROGLU, M. E. & WALBERG, H. J. (1979). Motivation and achievement: A
quantitative synthesis. American Educational Research Journal, 16, 4, 375-
389.
VERKUYTEN, M. (1988). General self-esteem of adolescents from ethnic minorities in
the Netherlands and the reflected appraisal process. Adolescence, 23, 92, 863-
871.
VERKUYTEN, M. (1989). Self-esteem among Dutch and Turkish children in the
Netherlands. The Journal of Social Psychology, 129, 2, 269-271.
VERKUYTEN, M. (1990). Self-esteem and the evaluation of ethnic identity among
Turkish and Dutch adolescents in the Netherlands. The Journal of Social
Psychology, 130, 3, 285-297.
VERMA, G. K. & BAGLEY, C. (1975). Race and Education Across Cultures,
Heinemann: London.
R e f e r e n c e s
- 30 -
VISOR, J. N., JOHNSON, J. J. & COLE, L. N. (1992). The relationship of
supplemental instruction to affect. Journal of Developmental Education, 16, 2,
12-18.
WALSH, J., & WINNE, P. H. (1980). Cognitive-motivational characteristics of
children varying in reading ability: Evidence for learned helplessness in poor
readers. Journal of Educational Psychology, 72, 3, 423-424.
WAREHIME, R. G., & FOULDS, M. F. (1971). Perceived locus of control and
personal adjustment. Journal of Consulting and Clinical Psychology, 37, 250-
252.
WATKINS, D., & DHAWAN, N. (1989). Do we need to distinguish the constructs of
self-concept and self-esteem ? Journal of Social Behaviour and Personality, 4,
555-562.
WATKINS, D. & GUTIERREZ, M. (1990). Causal relationships among self-concept,
attributions, and achievement in Filipino students. The Journal of Social
Psychology, 130 (5), 625-631.
WEAT, C. R., FISH, J. A., STEVENS, J. A. (1980). General self-concept, self-concept
of academic ability and school achievement. Australian Journal of Education.
Vol. 24 pp. 194-213.
WEAVER, M. D., & MATTHEWS, D. B. (1993). The effects of a program to build the
self-esteem of at risk students. Journal of Humanistic Education and
Development, 31, 181-188.
WELLS, R. &MARWELL, G. (1976). Self-Esteem: Its Conceptualisation and
Measurements. Beverley Hills.
WEST, C. R., FISH, J. A., STEVENS, J. A. (1980). General self-concept, self-concept
of academic ability and school achievement. Australian Journal of Education
vol. 24, pp. 194-213.
WETTON, N., & CANSELL, P. (1993). Feeling Good - Raising Self-Esteem in the
Primary School Classroom, Forbes Publications Ltd.
WIGFIELD, A., ECCLES, J. S., MAC IVER, D., REUMAN, D. A., & MIDGLEY, C.
(1991). Transitions during early adolescence: Changes in children’s domain-
specific self-perceptions and general self-esteem across the transition to junior
high school. Developmental Psychology, 27, 4, 552-565.
WILLIAMS, J. (1977). Psychology of Women: Behaviour in Biosocial Context. New
York: W. W. Norton.
WILSON, J., & FASKO, D. (1992). Self-esteem, achievement, and career choices of
rural students. Journal of Humanistic Education and Development, 30, 131-
138.

R e f e r e n c e s
- 31 -
WINCHELL, R., FENNER, D., & SHAVER, P. (1974). Impact of coeducation on “fear
of success” imagery expressed by male and female high school students.
Journal of Educational Psychology, 66, 726-730.
WOLFE, R. N. & GROSCH, J. W. (1992). Negative relationship between achievement
in high school and self-concept in college. Paper presented at the Annual
Meeting of the Eastern Psychological Association, Boston, April, 3-5, 1992.
WYLIE, R. C. (1961). The Self-Concept: A Critical Survey of Pertinent Research
Literature. Lincoln: University of Nebraska Press.
WYLIE, R. C. (1968). The present status of the self theory, in E. F. Borgatta & W.
Lambert, (Eds.). Handbook on Personality, Theory and Research Ch. 12, pp
728-787, Chicago: Rand McNally.
WYLIE, R C. (1974). The Self-Concept: Vol. 1. -A Review of Methodological
Considerations and Measuring Instruments, Revised Edition, Lincoln and
London: University of Nebreska Press.
WYLIE, R. C. (1979). The Self-Concept: Vol. 2. Theory and Research on Selected
Topics. Lincoln / London: University of Nebraska Press.
YARWORTH, J. S. & GAUTHIER, Jr. W. J. (1978). Relationship of student self-
concept and selected personal variables to participation in school activities.
Journal of Educational Psychology, 70, 3, 355-344.
YATES, B. T., HECHT-LEWIS, R., FRITSCH, R. C., & GOODRICH, W. (1994).
Locus of control in severely disturbed adolescents: Loci for peers, parents,
achievement, relationships, and problems. Journal of Youth and Adolescence,
Vol. 23, No. 3, 289-314.
YEGER, T. A. & MIEZITIS, S. (1980). Self-concept and classroom behavior of pre-
adolescent Pupils. Journal of the Classroom Interaction, 15, 2, 31-37.
YESILYAPRAK, B. (1988). Lise ögrencilerinin içsel ya da dıssal oluslarını etkileyen
etmenler. Yayınlanmamıs Doktora Tezi. Hacettepe Universitesi, Sosyal
Bilimler Enstitüsü, Ankara.
YONG, F. L. (1994). Self-concepts, locus of control, and machiavellianism of
ethnically diverse middle school students who are gifted. Roeper Review,
1994, 16, 3, 192-194.
YOUNG, L., B. C. (1982). Self-Concept, Achievement and Multicultural Education.
(Edited by Gajendra K. Verma and Christopher Bagley) The Macmillan Press
Ltd. London.
YOUNG-SHENG, Z. (1990). Development of “locus of control” related to
responsibility in middle school students. Social Psychology International, 11,
209-215.
R e f e r e n c e s
- 32 -
YOUNGS, B. B. (1993). Self-esteem in the school: More than a “feel-good” movement.
NASSP Bulletin, 76, 549, 59-66.
YURDAGÜL, S. (1987). Bazı sosyo-ekonomik degiskenlerin lise ögrencilerinin benlik
tasarımlarına etkisi. Yayınlanmamıs Yüksek Lisans Tezi, Hacettepe
Üniversitesi Sosyal Bilimler Enstitüsü.
ZEEMAN, R. D. (1982). Creating change in academic self-concept and school
behaviour in alienated secondary school students’ School Psychology Review,
11, 459-461.
APPENDICES
A p p e n d i c e s
- 391 -
APPENDICES CONTENT
PAGE
Appendix A (1) Notes For Administrators .............................................. 394
Appendix A (2) The Coopersmith SEI-English Form 395
Appendix A (3) The Coopersmith SEI Subscales & Items 398
Appendix A (4) The Coopersmith SEI’s Scoring Key 399
Appendix A (5) The Nowicki-Strickland Internal-External Control Scale
English Form ................................................................. 400
Appendix A (6) The Nowicki-Strickland I-E Control Scale’s Scoring Key 403
Appendix A (7) The Crandall et al.’s Scale English Form 404
Appendix A (8) The Crandall IAR Scale’s Scoring Key 408
Appendix A (9) The Coopersmith SEI-Turkish Form 409
Appendix A (10) The Nowicki-Strickland I-E Control Scale Turkish Form. 412
Appendix A (11) The Crandall IAR Scale Turkish Form 415
Appendix B (1) Chapter Six, T-Test Tables (Self-Esteem Results)
Table 6.3 T-Test between English and Turkish Samples on
Coopersmith SEI (Total Self-Esteem, Short-Form,
General Self-Esteem, Social Self-Esteem, Home-
Parents Self-Esteem, School-Academic Self-Esteem
and Lie Scale) 419
Table 6.4 T-Test between English and Turkish Males on
Coopersmith SEI (Total Self-Esteem, Short-Form,
General Self-Esteem, Social Self-Esteem, Home-
Parents Self-Esteem, School-Academic Self-Esteem
and Lie Scale) 420
A p p e n d i c e s
- 392 -
Table 6.5 T-Test between English and Turkish Females on
Coopersmith SEI (Total Self-Esteem, Short-Form,
General Self-Esteem, Social Self-Esteem, Home-
Parents Self-Esteem, School-Academic Self-Esteem
and Lie Scale) 421
Table 6.6 T-Test between English Males and Females on
Coopersmith SEI (Total Self-Esteem, Short-Form,
General Self-Esteem, Social Self-Esteem,
Home-Parents Self-Esteem, School-Academic
Self-Esteem and Lie Scale) 422
Table 6.7 T-Test between Turkish Males and Females on Coopersmith
SEI (Total Self-Esteem, Short-Form, General Self-Esteem,
Social Self-Esteem, Home-Parents Self-Esteem,
School-Academic Self-Esteem and Lie Scale) 423
Appendix B (2) Chapter Six, T-Test Tables (Locus of Control Results)
Table 6.22 T-Test between English and Turkish Subjects on
Nowicki-Strickland Global Locus of Control, and
Crandall’s Academic Locus of Control Scales
(Total, Success and Failure) 424
Table 6.23 T-Test between English and Turkish Males on
Nowicki-Strickland Global Locus of Control,
and Crandall’s Academic Locus of Control Scales
(Total, Success and Failure) 424
Table 6.24 T-Test between English and Turkish Females
on Nowicki-Strickland Global Locus of Control,
and Crandall’s Academic Locus of Control Scales
(Total, Success and Failure) 425
Table 6.25 T-Test between English Males and Females on
Nowicki-Strickland Global Locus of Control,
and Crandall’s Academic Locus of Control Scales
(Total, Success and Failure) 425
A p p e n d i c e s
- 393 -
Table 6.26 T-Test between Turkish Males and Females on
Nowicki-Strickland Global Locus of Control,
and Crandall’s Academic Locus of Control Scales
(Total, Success and Failure) 426
Appendix C Chapter Two, Summary of Past Studies in Self-Esteem
Table 1 Summary of Studies Which Investigated A
Relationship Between Self-Esteem & Academic
Achievement 427
Table 2 Summary of Studies Which Investigated Sex
Differences in Self-Esteem 445
Table 3 Summary of Studies Which Investigated Cultural
Differences in Self-Esteem 456
A p p e n d i c e s
- 394 -
APPENDIX A (1)
NOTES FOR ADMINISTRATORS
NOTES FOR ADMINISTRATORS
1. Students do not have to write their name, but they are expected to write their sex,
date of birth, June exam grades and November attainment grades on the first page
of the test booklet.
2. Could you please check through the scripts before the students are dismissed, to
ensure that all the pieces of information as itemised in (1) are recorded on the
forms, as absence of any one item will invalidate the script for the research.
3. The average time it takes to finish all the questions is 35-40 minutes. If some of
the students are not finished after this period, they can be given some more time.
4. It is crucial that students answer for themselves so it may be helpful if they refrain
from interacting with the others in the group during the course of the test and
direct all questions to you.
5. If some of the students need some words to be clarified, please explain the
meaning of these words but try not to influence an examinee’s responses. Be sure
to avoid making any statement seem inherently positive or negative.
6. The test consists of 9 pages. When the students have completed their papers, can
you please check through to make sure that they have not inadvertently missed a
page.
I appreciate the time and effort you have given to help me with my research. I will
be happy to discuss any findings with you.
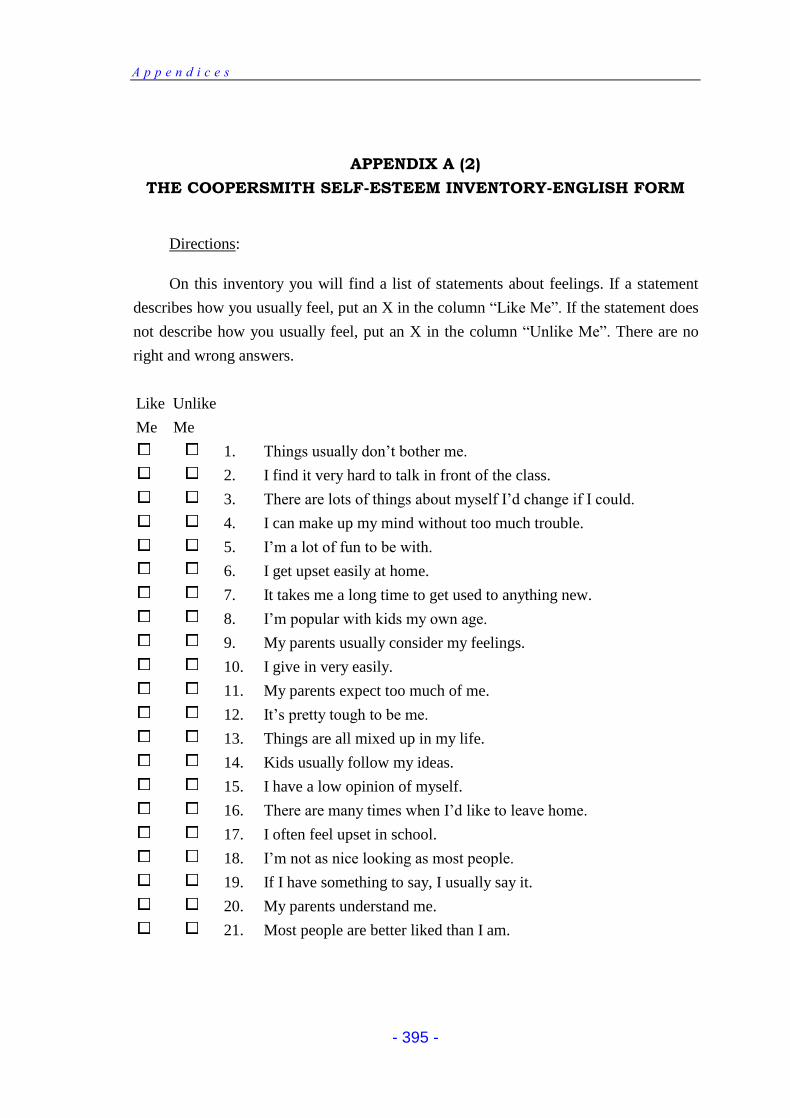
A p p e n d i c e s
- 395 -
APPENDIX A (2)
THE COOPERSMITH SELF-ESTEEM INVENTORY-ENGLISH FORM
Directions:
On this inventory you will find a list of statements about feelings. If a statement
describes how you usually feel, put an X in the column “Like Me”. If the statement does
not describe how you usually feel, put an X in the column “Unlike Me”. There are no
right and wrong answers.
Like Unlike
Me Me
1. Things usually don’t bother me.
2. I find it very hard to talk in front of the class.
3. There are lots of things about myself I’d change if I could.
4. I can make up my mind without too much trouble.
5. I’m a lot of fun to be with.
6. I get upset easily at home.
7. It takes me a long time to get used to anything new.
8. I’m popular with kids my own age.
9. My parents usually consider my feelings.
10. I give in very easily.
11. My parents expect too much of me.
12. It’s pretty tough to be me.
13. Things are all mixed up in my life.
14. Kids usually follow my ideas.
15. I have a low opinion of myself.
16. There are many times when I’d like to leave home.
17. I often feel upset in school.
18. I’m not as nice looking as most people.
19. If I have something to say, I usually say it.
20. My parents understand me.
21. Most people are better liked than I am.
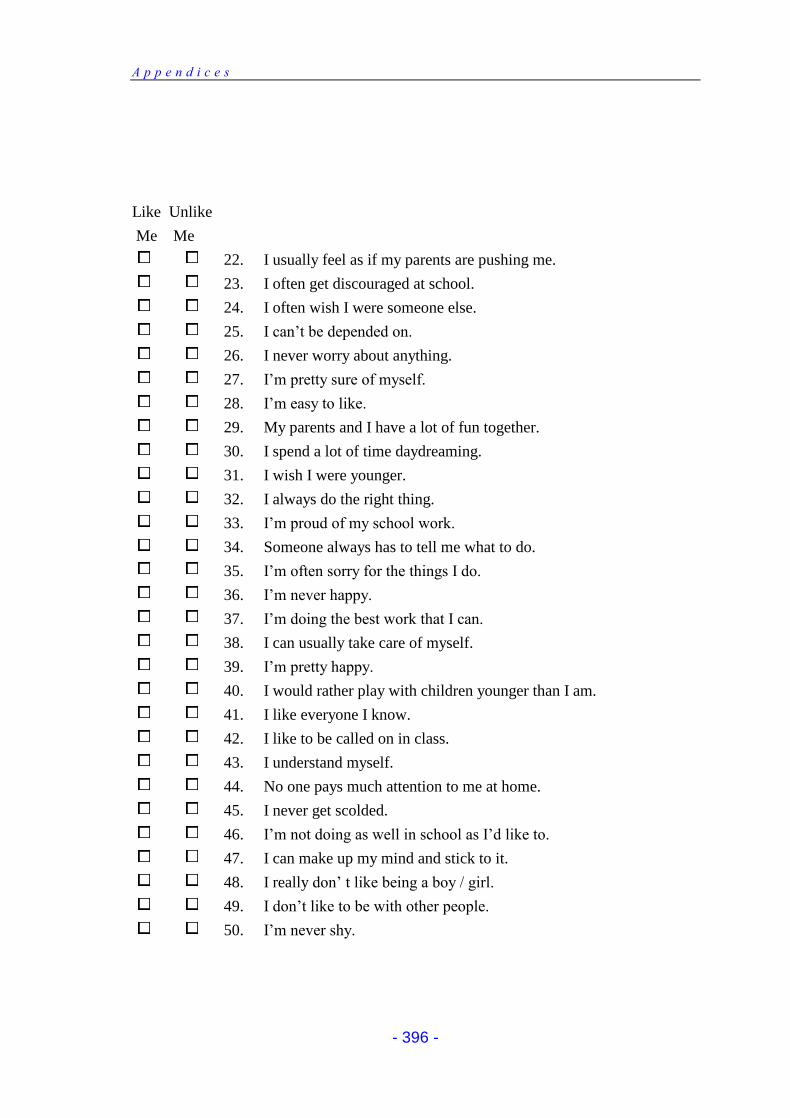
A p p e n d i c e s
- 396 -
Like Unlike
Me Me
22. I usually feel as if my parents are pushing me.
23. I often get discouraged at school.
24. I often wish I were someone else.
25. I can’t be depended on.
26. I never worry about anything.
27. I’m pretty sure of myself.
28. I’m easy to like.
29. My parents and I have a lot of fun together.
30. I spend a lot of time daydreaming.
31. I wish I were younger.
32. I always do the right thing.
33. I’m proud of my school work.
34. Someone always has to tell me what to do.
35. I’m often sorry for the things I do.
36. I’m never happy.
37. I’m doing the best work that I can.
38. I can usually take care of myself.
39. I’m pretty happy.
40. I would rather play with children younger than I am.
41. I like everyone I know.
42. I like to be called on in class.
43. I understand myself.
44. No one pays much attention to me at home.
45. I never get scolded.
46. I’m not doing as well in school as I’d like to.
47. I can make up my mind and stick to it.
48. I really don’ t like being a boy / girl.
49. I don’t like to be with other people.
50. I’m never shy.
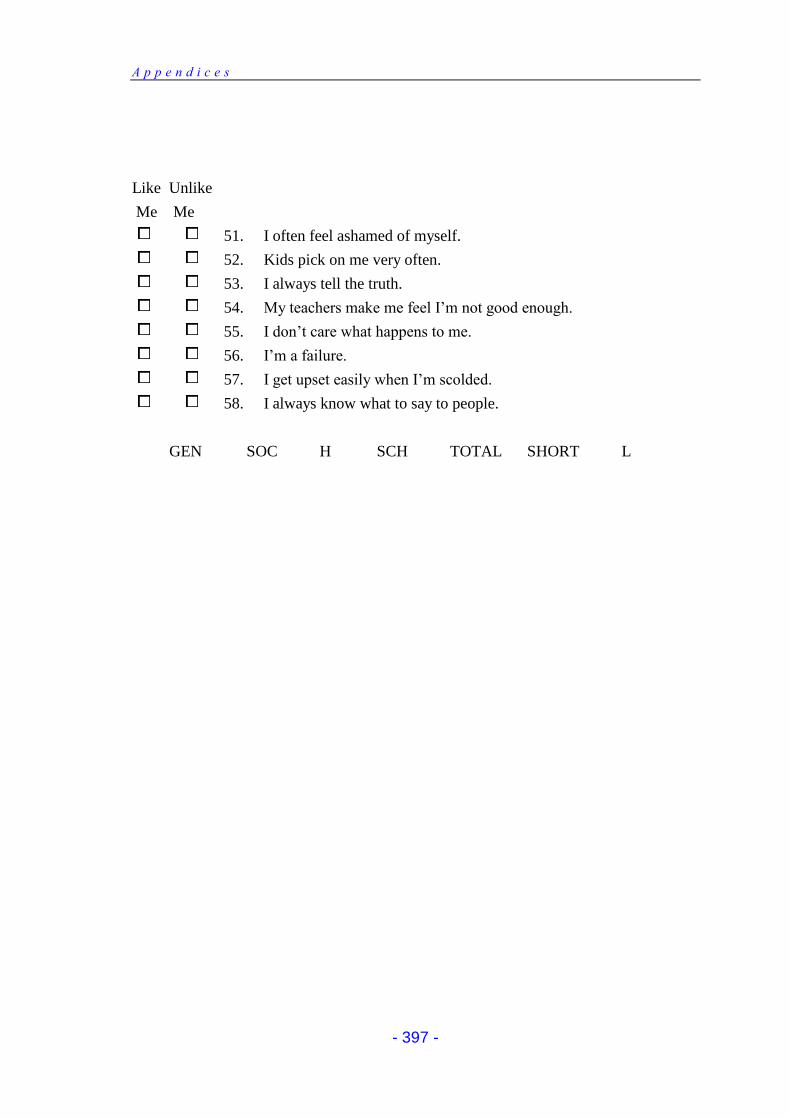
A p p e n d i c e s
- 397 -
Like Unlike
Me Me
51. I often feel ashamed of myself.
52. Kids pick on me very often.
53. I always tell the truth.
54. My teachers make me feel I’m not good enough.
55. I don’t care what happens to me.
56. I’m a failure.
57. I get upset easily when I’m scolded.
58. I always know what to say to people.
GEN SOC H SCH TOTAL SHORT L
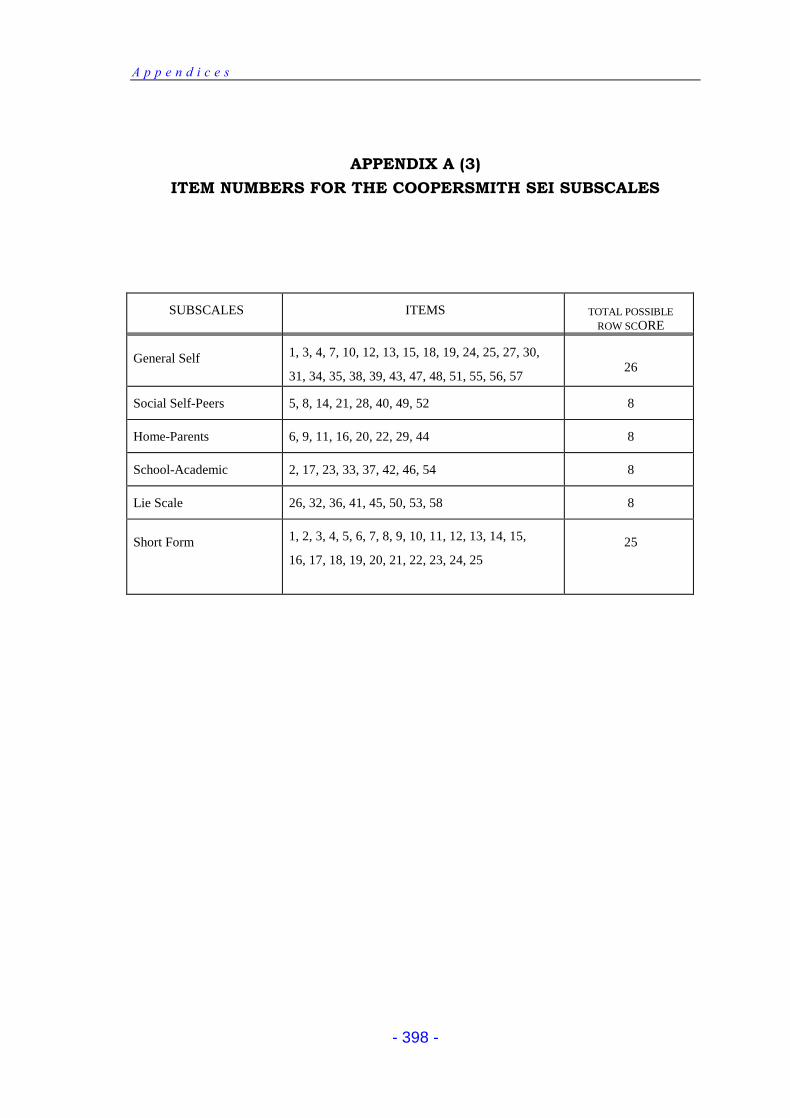
A p p e n d i c e s
- 398 -
APPENDIX A (3)
ITEM NUMBERS FOR THE COOPERSMITH SEI SUBSCALES
SUBSCALES ITEMS
TOTAL POSSIBLE
ROW SCORE
General Self
1, 3, 4, 7, 10, 12, 13, 15, 18, 19, 24, 25, 27, 30,
31, 34, 35, 38, 39, 43, 47, 48, 51, 55, 56, 57
26
Social Self-Peers 5, 8, 14, 21, 28, 40, 49, 52 8
Home-Parents 6, 9, 11, 16, 20, 22, 29, 44 8
School-Academic 2, 17, 23, 33, 37, 42, 46, 54 8
Lie Scale 26, 32, 36, 41, 45, 50, 53, 58 8
Short Form
1, 2, 3, 4, 5, 6, 7, 8, 9, 10, 11, 12, 13, 14, 15,
16, 17, 18, 19, 20, 21, 22, 23, 24, 25
25
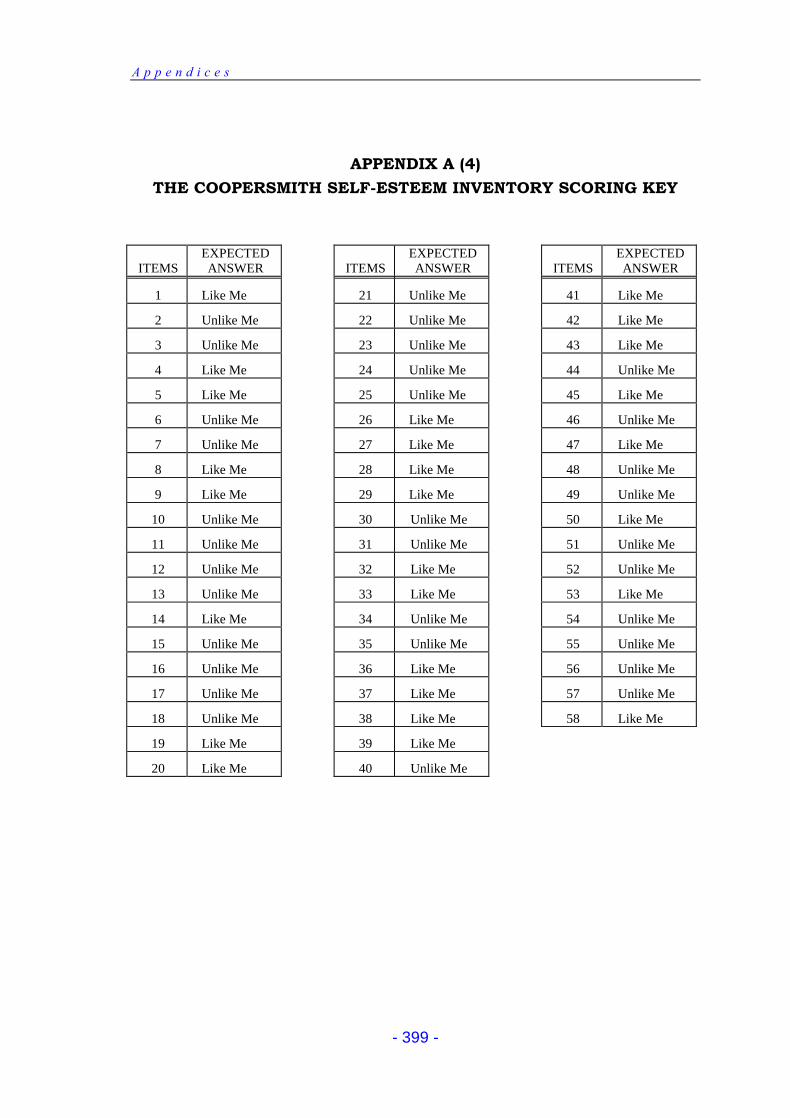
A p p e n d i c e s
- 399 -
APPENDIX A (4)
THE COOPERSMITH SELF-ESTEEM INVENTORY SCORING KEY
ITEMS EXPECTED ANSWER
ITEMS
EXPECTED ANSWER
ITEMS
EXPECTED ANSWER
1 Like Me 21 Unlike Me
41 Like Me
2 Unlike Me 22 Unlike Me
42 Like Me
3 Unlike Me 23 Unlike Me
43 Like Me
4 Like Me 24 Unlike Me
44 Unlike Me
5 Like Me 25 Unlike Me
45 Like Me
6 Unlike Me 26 Like Me
46 Unlike Me
7 Unlike Me 27 Like Me
47 Like Me
8 Like Me 28 Like Me
48 Unlike Me
9 Like Me 29 Like Me
49 Unlike Me
10 Unlike Me 30 Unlike Me
50 Like Me
11 Unlike Me 31 Unlike Me
51 Unlike Me
12 Unlike Me 32 Like Me
52 Unlike Me
13 Unlike Me 33 Like Me
53 Like Me
14 Like Me 34 Unlike Me
54 Unlike Me
15 Unlike Me 35 Unlike Me
55 Unlike Me
16 Unlike Me 36 Like Me
56 Unlike Me
17 Unlike Me 37 Like Me
57 Unlike Me
18 Unlike Me 38 Like Me
58 Like Me
19 Like Me 39 Like Me
20 Like Me 40 Unlike Me
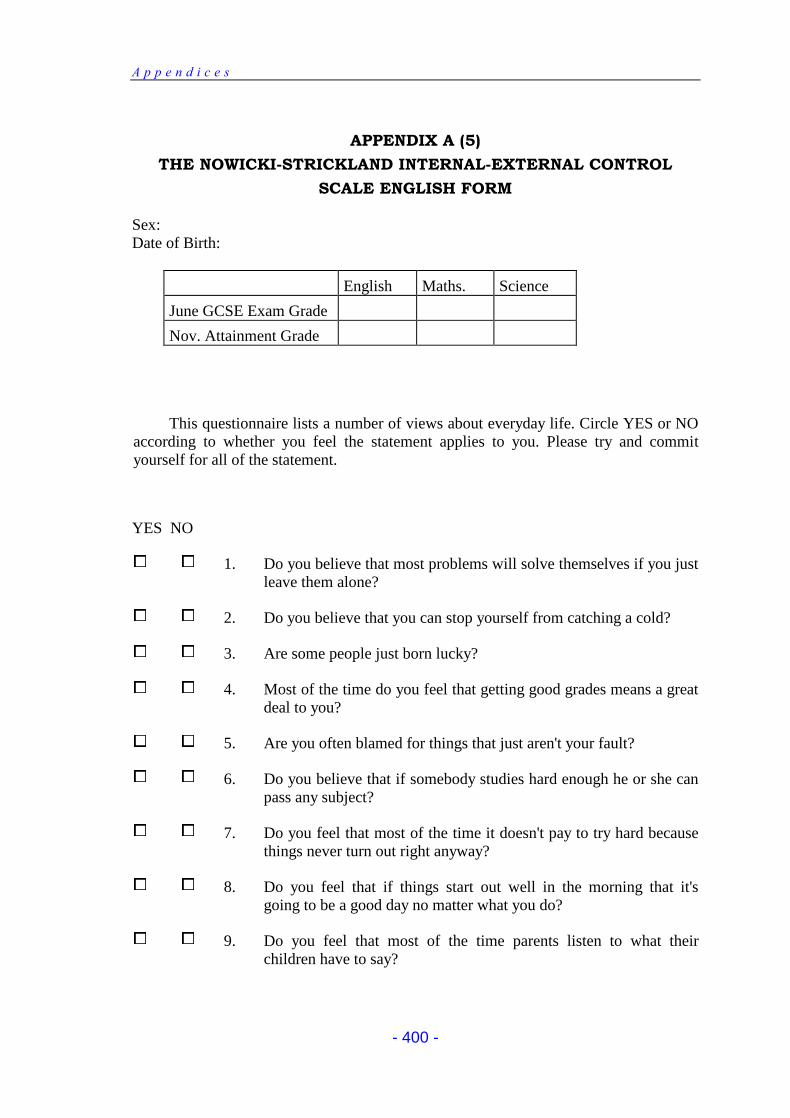
A p p e n d i c e s
- 400 -
APPENDIX A (5)
THE NOWICKI-STRICKLAND INTERNAL-EXTERNAL CONTROL
SCALE ENGLISH FORM
Sex:
Date of Birth:
English Maths. Science
June GCSE Exam Grade
Nov. Attainment Grade
This questionnaire lists a number of views about everyday life. Circle YES or NO
according to whether you feel the statement applies to you. Please try and commit
yourself for all of the statement.
YES NO
1. Do you believe that most problems will solve themselves if you just
leave them alone?
2. Do you believe that you can stop yourself from catching a cold?
3. Are some people just born lucky?
4. Most of the time do you feel that getting good grades means a great
deal to you?
5. Are you often blamed for things that just aren't your fault?
6. Do you believe that if somebody studies hard enough he or she can
pass any subject?
7. Do you feel that most of the time it doesn't pay to try hard because
things never turn out right anyway?
8. Do you feel that if things start out well in the morning that it's
going to be a good day no matter what you do?
9. Do you feel that most of the time parents listen to what their
children have to say?
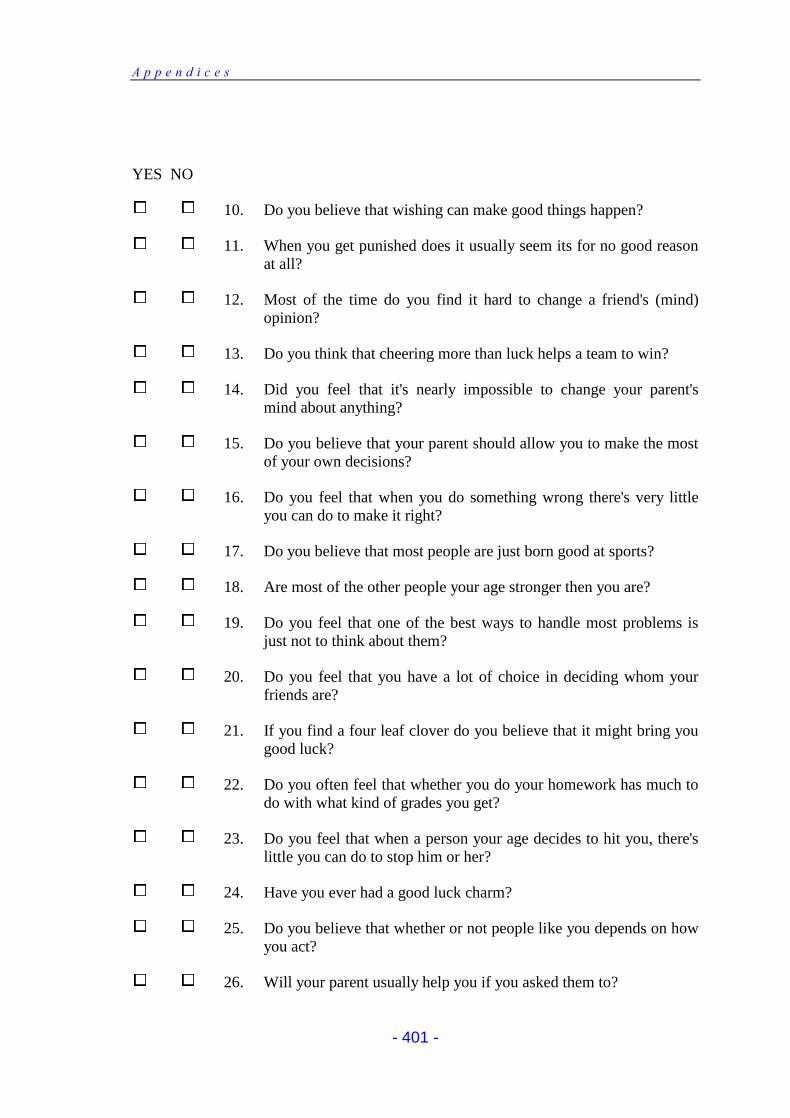
A p p e n d i c e s
- 401 -
YES NO
10. Do you believe that wishing can make good things happen?
11. When you get punished does it usually seem its for no good reason
at all?
12. Most of the time do you find it hard to change a friend's (mind)
opinion?
13. Do you think that cheering more than luck helps a team to win?
14. Did you feel that it's nearly impossible to change your parent's
mind about anything?
15. Do you believe that your parent should allow you to make the most
of your own decisions?
16. Do you feel that when you do something wrong there's very little
you can do to make it right?
17. Do you believe that most people are just born good at sports?
18. Are most of the other people your age stronger then you are?
19. Do you feel that one of the best ways to handle most problems is
just not to think about them?
20. Do you feel that you have a lot of choice in deciding whom your
friends are?
21. If you find a four leaf clover do you believe that it might bring you
good luck?
22. Do you often feel that whether you do your homework has much to
do with what kind of grades you get?
23. Do you feel that when a person your age decides to hit you, there's
little you can do to stop him or her?
24. Have you ever had a good luck charm?
25. Do you believe that whether or not people like you depends on how
you act?
26. Will your parent usually help you if you asked them to?
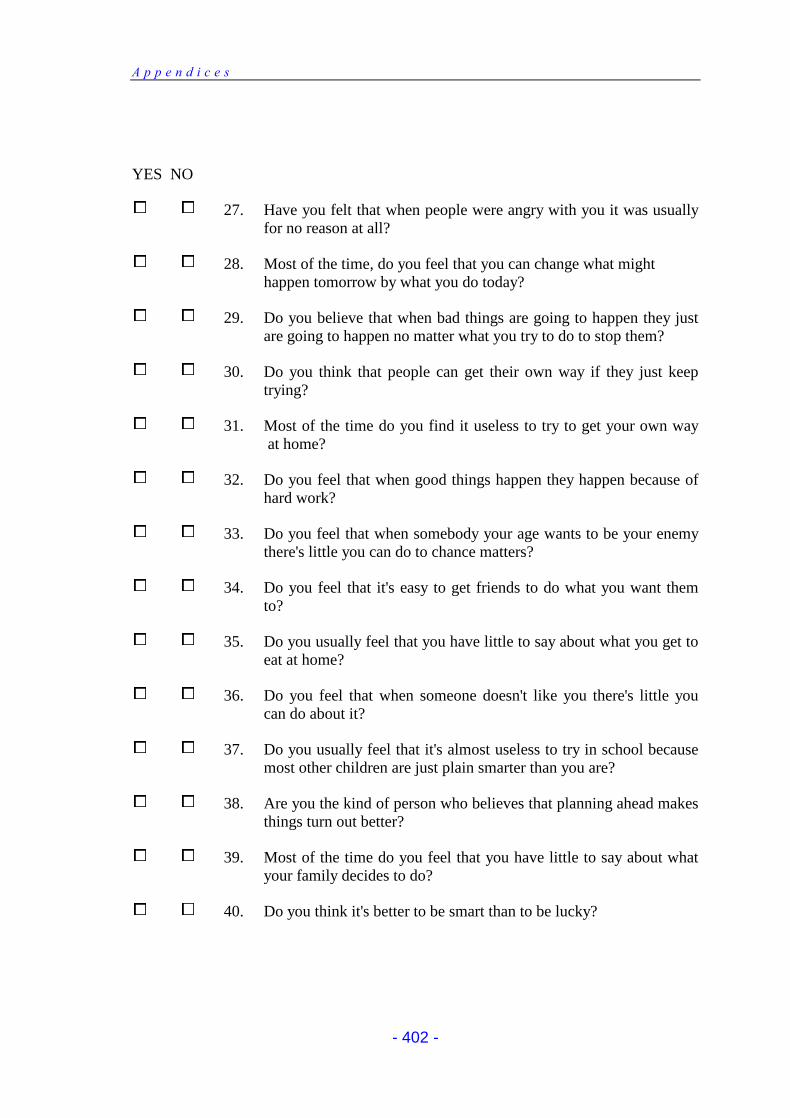
A p p e n d i c e s
- 402 -
YES NO
27. Have you felt that when people were angry with you it was usually
for no reason at all?
28. Most of the time, do you feel that you can change what might
happen tomorrow by what you do today?
29. Do you believe that when bad things are going to happen they just
are going to happen no matter what you try to do to stop them?
30. Do you think that people can get their own way if they just keep
trying?
31. Most of the time do you find it useless to try to get your own way
at home?
32. Do you feel that when good things happen they happen because of
hard work?
33. Do you feel that when somebody your age wants to be your enemy
there's little you can do to chance matters?
34. Do you feel that it's easy to get friends to do what you want them
to?
35. Do you usually feel that you have little to say about what you get to
eat at home?
36. Do you feel that when someone doesn't like you there's little you
can do about it?
37. Do you usually feel that it's almost useless to try in school because
most other children are just plain smarter than you are?
38. Are you the kind of person who believes that planning ahead makes
things turn out better?
39. Most of the time do you feel that you have little to say about what
your family decides to do?
40. Do you think it's better to be smart than to be lucky?
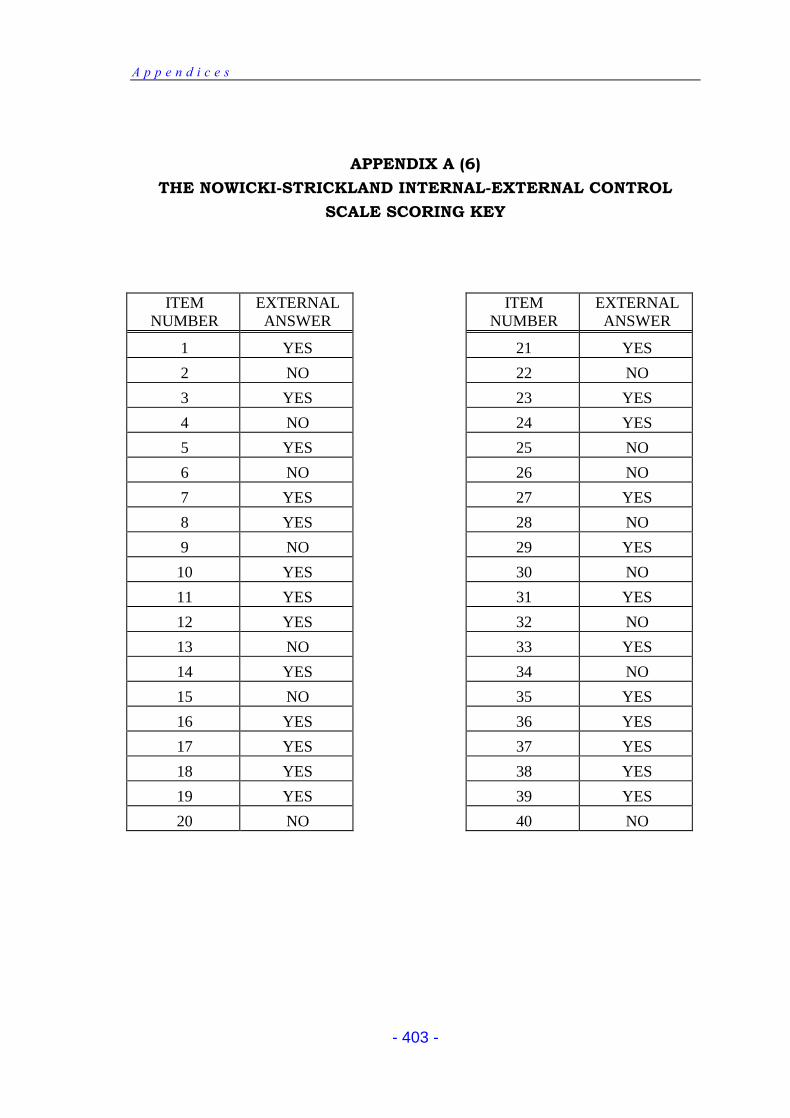
A p p e n d i c e s
- 403 -
APPENDIX A (6)
THE NOWICKI-STRICKLAND INTERNAL-EXTERNAL CONTROL
SCALE SCORING KEY
ITEM
NUMBER
EXTERNAL
ANSWER
ITEM
NUMBER
EXTERNAL
ANSWER
1 YES 21 YES
2 NO 22 NO
3 YES 23 YES
4 NO 24 YES
5 YES 25 NO
6 NO 26 NO
7 YES 27 YES
8 YES 28 NO
9 NO 29 YES
10 YES 30 NO
11 YES 31 YES
12 YES 32 NO
13 NO 33 YES
14 YES 34 NO
15 NO 35 YES
16 YES 36 YES
17 YES 37 YES
18 YES 38 YES
19 YES 39 YES
20 NO 40 NO
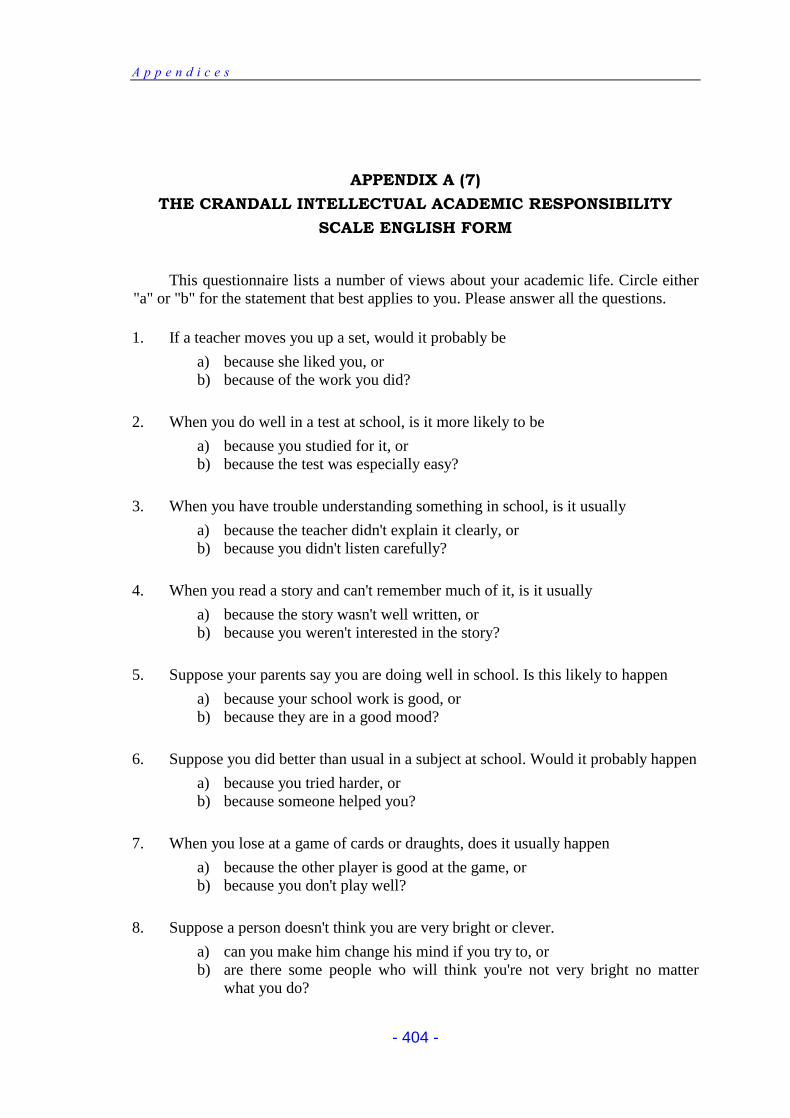
A p p e n d i c e s
- 404 -
APPENDIX A (7)
THE CRANDALL INTELLECTUAL ACADEMIC RESPONSIBILITY
SCALE ENGLISH FORM
This questionnaire lists a number of views about your academic life. Circle either
"a" or "b" for the statement that best applies to you. Please answer all the questions.
1. If a teacher moves you up a set, would it probably be
a) because she liked you, or
b) because of the work you did?
2. When you do well in a test at school, is it more likely to be
a) because you studied for it, or
b) because the test was especially easy?
3. When you have trouble understanding something in school, is it usually
a) because the teacher didn't explain it clearly, or
b) because you didn't listen carefully?
4. When you read a story and can't remember much of it, is it usually
a) because the story wasn't well written, or
b) because you weren't interested in the story?
5. Suppose your parents say you are doing well in school. Is this likely to happen
a) because your school work is good, or
b) because they are in a good mood?
6. Suppose you did better than usual in a subject at school. Would it probably happen
a) because you tried harder, or
b) because someone helped you?
7. When you lose at a game of cards or draughts, does it usually happen
a) because the other player is good at the game, or
b) because you don't play well?
8. Suppose a person doesn't think you are very bright or clever.
a) can you make him change his mind if you try to, or
b) are there some people who will think you're not very bright no matter
what you do?
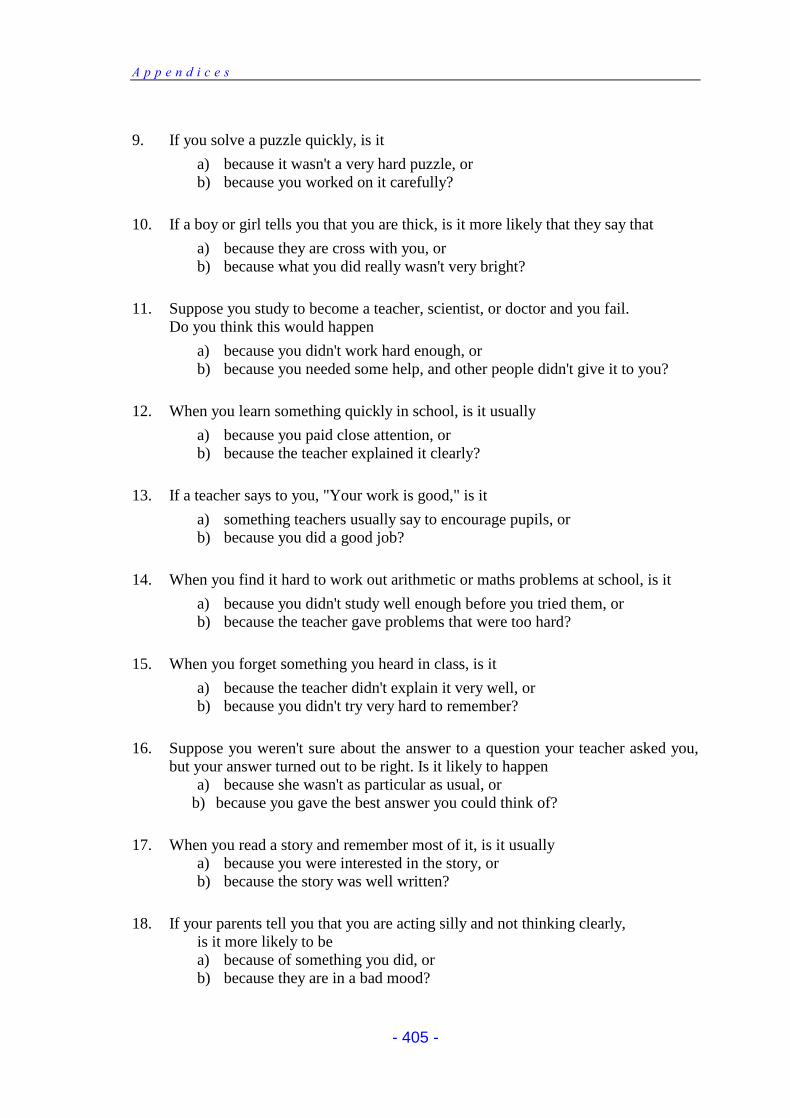
A p p e n d i c e s
- 405 -
9. If you solve a puzzle quickly, is it
a) because it wasn't a very hard puzzle, or
b) because you worked on it carefully?
10. If a boy or girl tells you that you are thick, is it more likely that they say that
a) because they are cross with you, or
b) because what you did really wasn't very bright?
11. Suppose you study to become a teacher, scientist, or doctor and you fail.
Do you think this would happen
a) because you didn't work hard enough, or
b) because you needed some help, and other people didn't give it to you?
12. When you learn something quickly in school, is it usually
a) because you paid close attention, or
b) because the teacher explained it clearly?
13. If a teacher says to you, "Your work is good," is it
a) something teachers usually say to encourage pupils, or
b) because you did a good job?
14. When you find it hard to work out arithmetic or maths problems at school, is it
a) because you didn't study well enough before you tried them, or
b) because the teacher gave problems that were too hard?
15. When you forget something you heard in class, is it
a) because the teacher didn't explain it very well, or
b) because you didn't try very hard to remember?
16. Suppose you weren't sure about the answer to a question your teacher asked you,
but your answer turned out to be right. Is it likely to happen
a) because she wasn't as particular as usual, or
b) because you gave the best answer you could think of?
17. When you read a story and remember most of it, is it usually
a) because you were interested in the story, or
b) because the story was well written?
18. If your parents tell you that you are acting silly and not thinking clearly,
is it more likely to be
a) because of something you did, or
b) because they are in a bad mood?
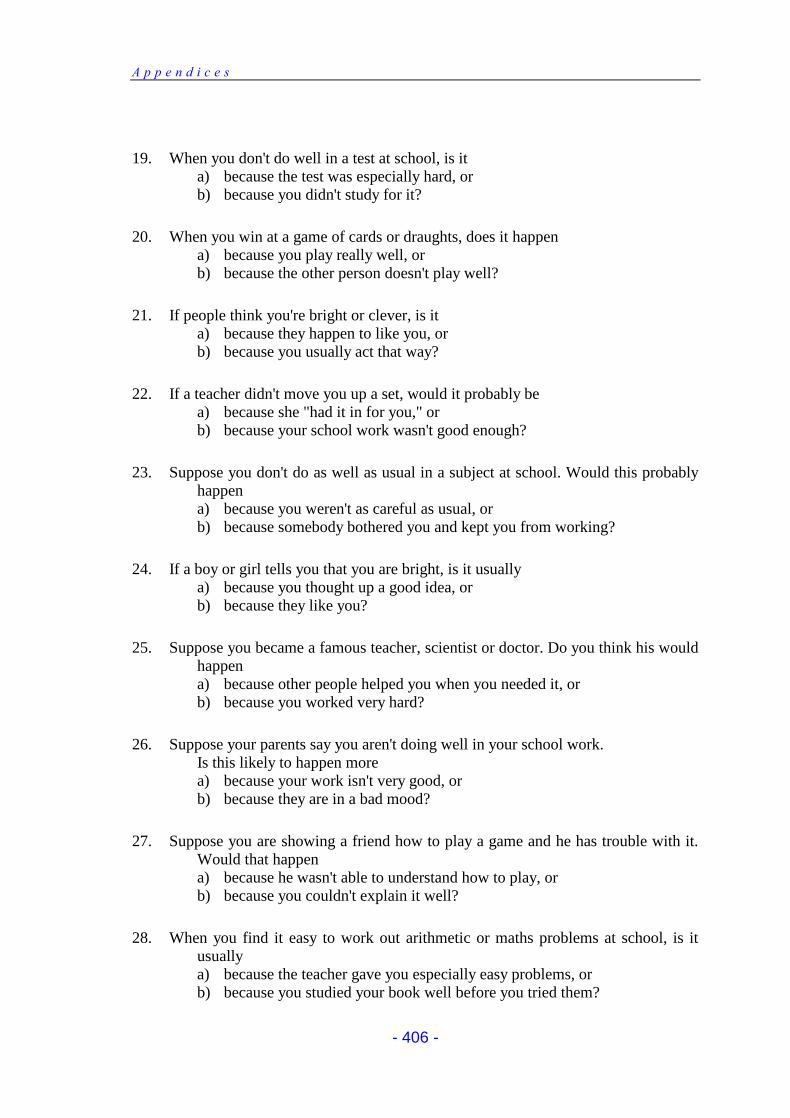
A p p e n d i c e s
- 406 -
19. When you don't do well in a test at school, is it
a) because the test was especially hard, or
b) because you didn't study for it?
20. When you win at a game of cards or draughts, does it happen
a) because you play really well, or
b) because the other person doesn't play well?
21. If people think you're bright or clever, is it
a) because they happen to like you, or
b) because you usually act that way?
22. If a teacher didn't move you up a set, would it probably be
a) because she "had it in for you," or
b) because your school work wasn't good enough?
23. Suppose you don't do as well as usual in a subject at school. Would this probably
happen
a) because you weren't as careful as usual, or
b) because somebody bothered you and kept you from working?
24. If a boy or girl tells you that you are bright, is it usually
a) because you thought up a good idea, or
b) because they like you?
25. Suppose you became a famous teacher, scientist or doctor. Do you think his would
happen
a) because other people helped you when you needed it, or
b) because you worked very hard?
26. Suppose your parents say you aren't doing well in your school work.
Is this likely to happen more
a) because your work isn't very good, or
b) because they are in a bad mood?
27. Suppose you are showing a friend how to play a game and he has trouble with it.
Would that happen
a) because he wasn't able to understand how to play, or
b) because you couldn't explain it well?
28. When you find it easy to work out arithmetic or maths problems at school, is it
usually
a) because the teacher gave you especially easy problems, or
b) because you studied your book well before you tried them?
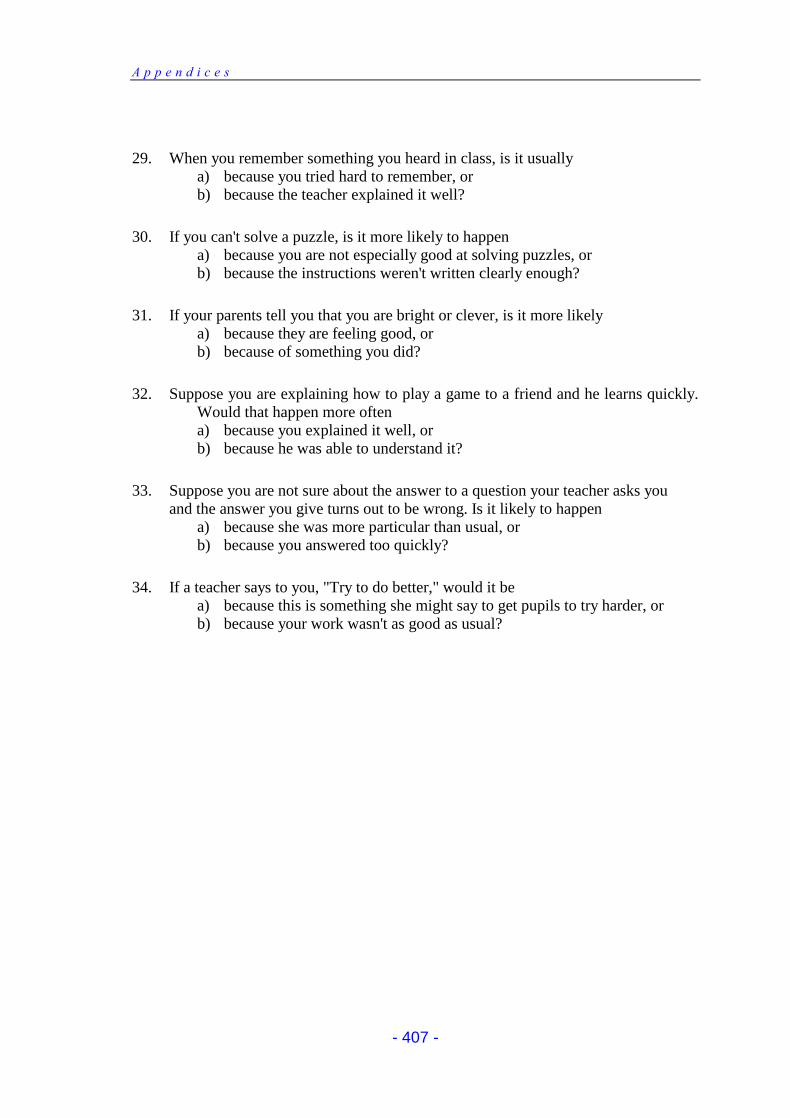
A p p e n d i c e s
- 407 -
29. When you remember something you heard in class, is it usually
a) because you tried hard to remember, or
b) because the teacher explained it well?
30. If you can't solve a puzzle, is it more likely to happen
a) because you are not especially good at solving puzzles, or
b) because the instructions weren't written clearly enough?
31. If your parents tell you that you are bright or clever, is it more likely
a) because they are feeling good, or
b) because of something you did?
32. Suppose you are explaining how to play a game to a friend and he learns quickly.
Would that happen more often
a) because you explained it well, or
b) because he was able to understand it?
33. Suppose you are not sure about the answer to a question your teacher asks you
and the answer you give turns out to be wrong. Is it likely to happen
a) because she was more particular than usual, or
b) because you answered too quickly?
34. If a teacher says to you, "Try to do better," would it be
a) because this is something she might say to get pupils to try harder, or
b) because your work wasn't as good as usual?
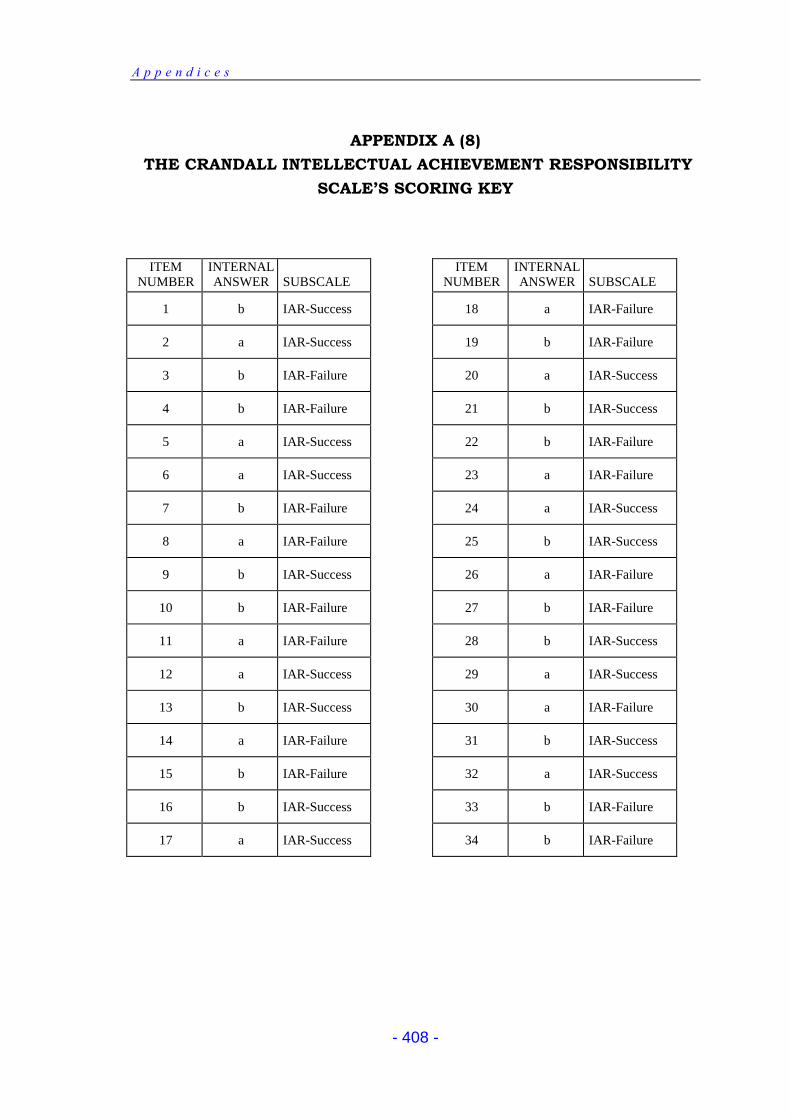
A p p e n d i c e s
- 408 -
APPENDIX A (8)
THE CRANDALL INTELLECTUAL ACHIEVEMENT RESPONSIBILITY
SCALE’S SCORING KEY
ITEM NUMBER
INTERNAL ANSWER
SUBSCALE
ITEM NUMBER
INTERNAL ANSWER
SUBSCALE
1 b IAR-Success 18 a IAR-Failure
2 a IAR-Success 19 b IAR-Failure
3 b IAR-Failure 20 a IAR-Success
4 b IAR-Failure 21 b IAR-Success
5 a IAR-Success 22 b IAR-Failure
6 a IAR-Success 23 a IAR-Failure
7 b IAR-Failure 24 a IAR-Success
8 a IAR-Failure 25 b IAR-Success
9 b IAR-Success 26 a IAR-Failure
10 b IAR-Failure 27 b IAR-Failure
11 a IAR-Failure 28 b IAR-Success
12 a IAR-Success 29 a IAR-Success
13 b IAR-Success 30 a IAR-Failure
14 a IAR-Failure 31 b IAR-Success
15 b IAR-Failure 32 a IAR-Success
16 b IAR-Success 33 b IAR-Failure
17 a IAR-Success 34 b IAR-Failure
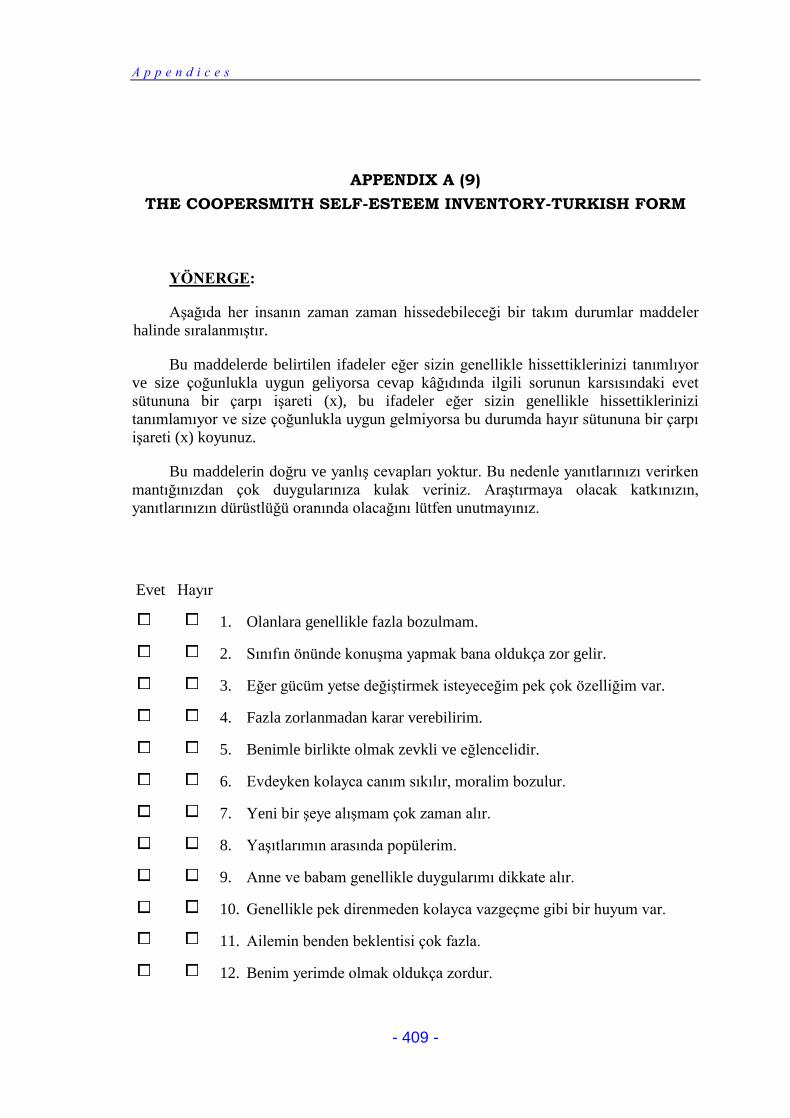
A p p e n d i c e s
- 409 -
APPENDIX A (9)
THE COOPERSMITH SELF-ESTEEM INVENTORY-TURKISH FORM
YÖNERGE:
Aşağıda her insanın zaman zaman hissedebileceği bir takım durumlar maddeler
halinde sıralanmıştır.
Bu maddelerde belirtilen ifadeler eğer sizin genellikle hissettiklerinizi tanımlıyor
ve size çoğunlukla uygun geliyorsa cevap kâğıdında ilgili sorunun karsısındaki evet
sütununa bir çarpı işareti (x), bu ifadeler eğer sizin genellikle hissettiklerinizi
tanımlamıyor ve size çoğunlukla uygun gelmiyorsa bu durumda hayır sütununa bir çarpı
işareti (x) koyunuz.
Bu maddelerin doğru ve yanlış cevapları yoktur. Bu nedenle yanıtlarınızı verirken
mantığınızdan çok duygularınıza kulak veriniz. Araştırmaya olacak katkınızın,
yanıtlarınızın dürüstlüğü oranında olacağını lütfen unutmayınız.
Evet Hayır
1. Olanlara genellikle fazla bozulmam.
2. Sınıfın önünde konuşma yapmak bana oldukça zor gelir.
3. Eğer gücüm yetse değiştirmek isteyeceğim pek çok özelliğim var.
4. Fazla zorlanmadan karar verebilirim.
5. Benimle birlikte olmak zevkli ve eğlencelidir.
6. Evdeyken kolayca canım sıkılır, moralim bozulur.
7. Yeni bir şeye alışmam çok zaman alır.
8. Yaşıtlarımın arasında popülerim.
9. Anne ve babam genellikle duygularımı dikkate alır.
10. Genellikle pek direnmeden kolayca vazgeçme gibi bir huyum var.
11. Ailemin benden beklentisi çok fazla.
12. Benim yerimde olmak oldukça zordur.
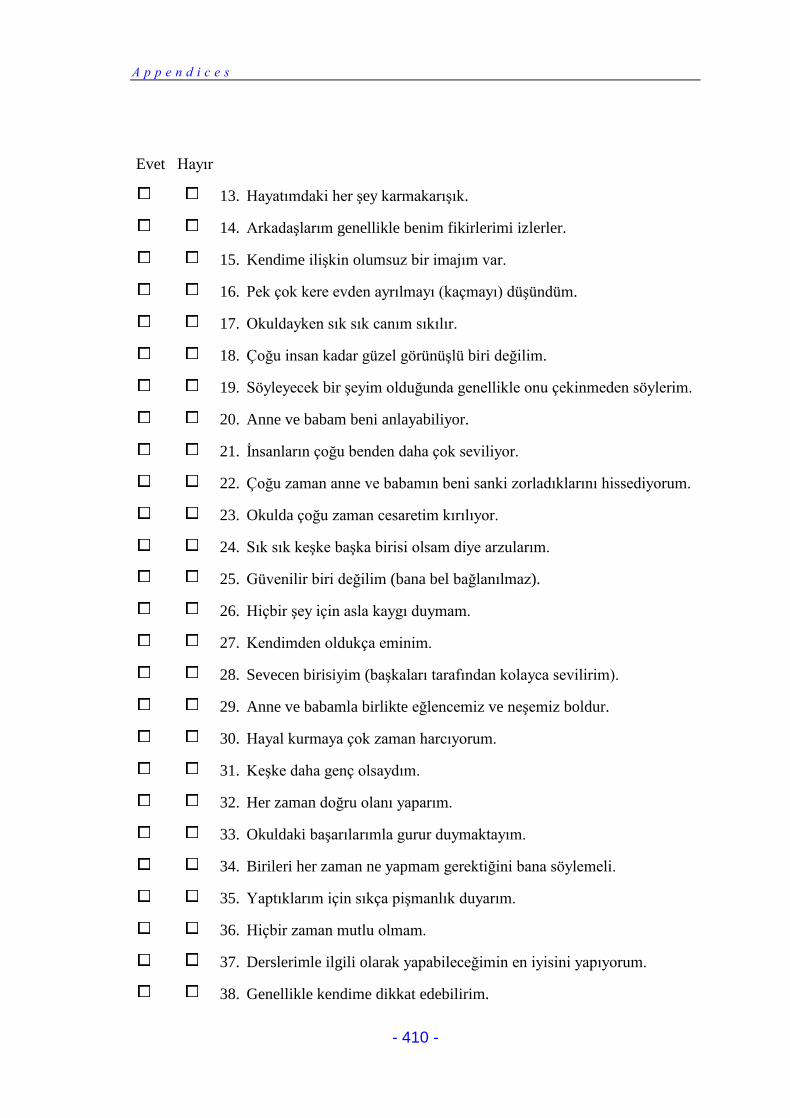
A p p e n d i c e s
- 410 -
Evet Hayır
13. Hayatımdaki her şey karmakarışık.
14. Arkadaşlarım genellikle benim fikirlerimi izlerler.
15. Kendime ilişkin olumsuz bir imajım var.
16. Pek çok kere evden ayrılmayı (kaçmayı) düşündüm.
17. Okuldayken sık sık canım sıkılır.
18. Çoğu insan kadar güzel görünüşlü biri değilim.
19. Söyleyecek bir şeyim olduğunda genellikle onu çekinmeden söylerim.
20. Anne ve babam beni anlayabiliyor.
21. İnsanların çoğu benden daha çok seviliyor.
22. Çoğu zaman anne ve babamın beni sanki zorladıklarını hissediyorum.
23. Okulda çoğu zaman cesaretim kırılıyor.
24. Sık sık keşke başka birisi olsam diye arzularım.
25. Güvenilir biri değilim (bana bel bağlanılmaz).
26. Hiçbir şey için asla kaygı duymam.
27. Kendimden oldukça eminim.
28. Sevecen birisiyim (başkaları tarafından kolayca sevilirim).
29. Anne ve babamla birlikte eğlencemiz ve neşemiz boldur.
30. Hayal kurmaya çok zaman harcıyorum.
31. Keşke daha genç olsaydım.
32. Her zaman doğru olanı yaparım.
33. Okuldaki başarılarımla gurur duymaktayım.
34. Birileri her zaman ne yapmam gerektiğini bana söylemeli.
35. Yaptıklarım için sıkça pişmanlık duyarım.
36. Hiçbir zaman mutlu olmam.
37. Derslerimle ilgili olarak yapabileceğimin en iyisini yapıyorum.
38. Genellikle kendime dikkat edebilirim.
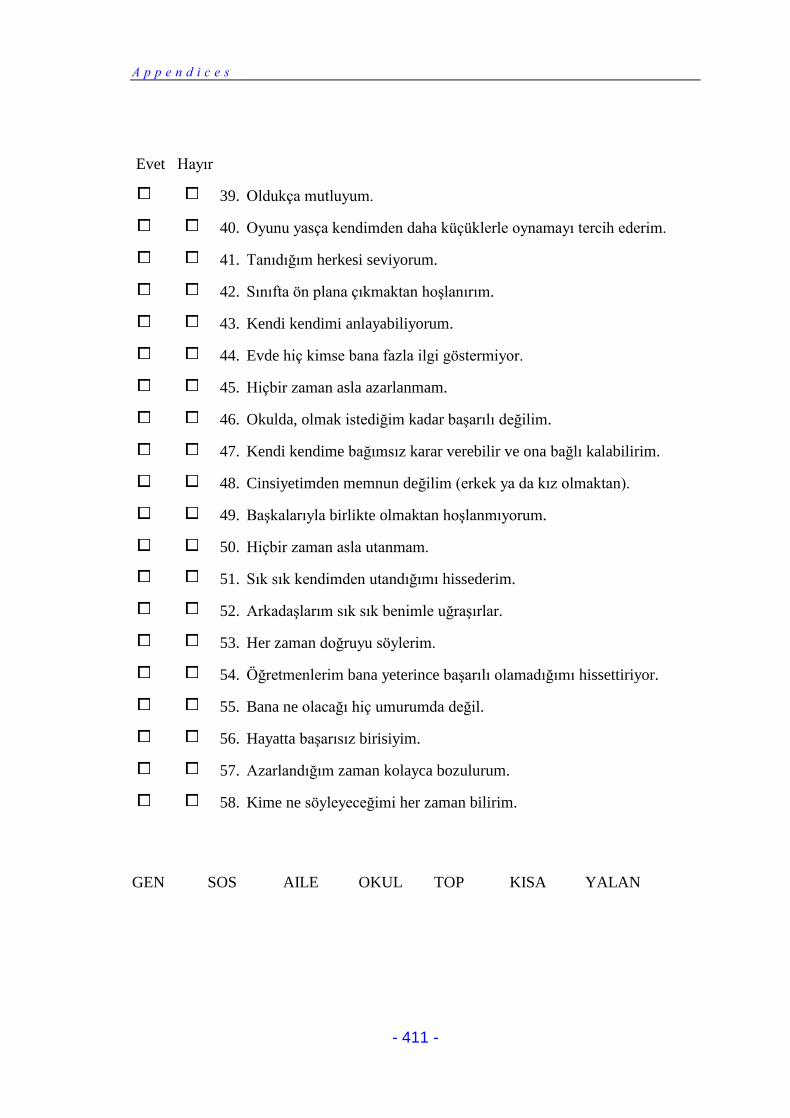
A p p e n d i c e s
- 411 -
Evet Hayır
39. Oldukça mutluyum.
40. Oyunu yasça kendimden daha küçüklerle oynamayı tercih ederim.
41. Tanıdığım herkesi seviyorum.
42. Sınıfta ön plana çıkmaktan hoşlanırım.
43. Kendi kendimi anlayabiliyorum.
44. Evde hiç kimse bana fazla ilgi göstermiyor.
45. Hiçbir zaman asla azarlanmam.
46. Okulda, olmak istediğim kadar başarılı değilim.
47. Kendi kendime bağımsız karar verebilir ve ona bağlı kalabilirim.
48. Cinsiyetimden memnun değilim (erkek ya da kız olmaktan).
49. Başkalarıyla birlikte olmaktan hoşlanmıyorum.
50. Hiçbir zaman asla utanmam.
51. Sık sık kendimden utandığımı hissederim.
52. Arkadaşlarım sık sık benimle uğraşırlar.
53. Her zaman doğruyu söylerim.
54. Öğretmenlerim bana yeterince başarılı olamadığımı hissettiriyor.
55. Bana ne olacağı hiç umurumda değil.
56. Hayatta başarısız birisiyim.
57. Azarlandığım zaman kolayca bozulurum.
58. Kime ne söyleyeceğimi her zaman bilirim.
GEN SOS AILE OKUL TOP KISA YALAN
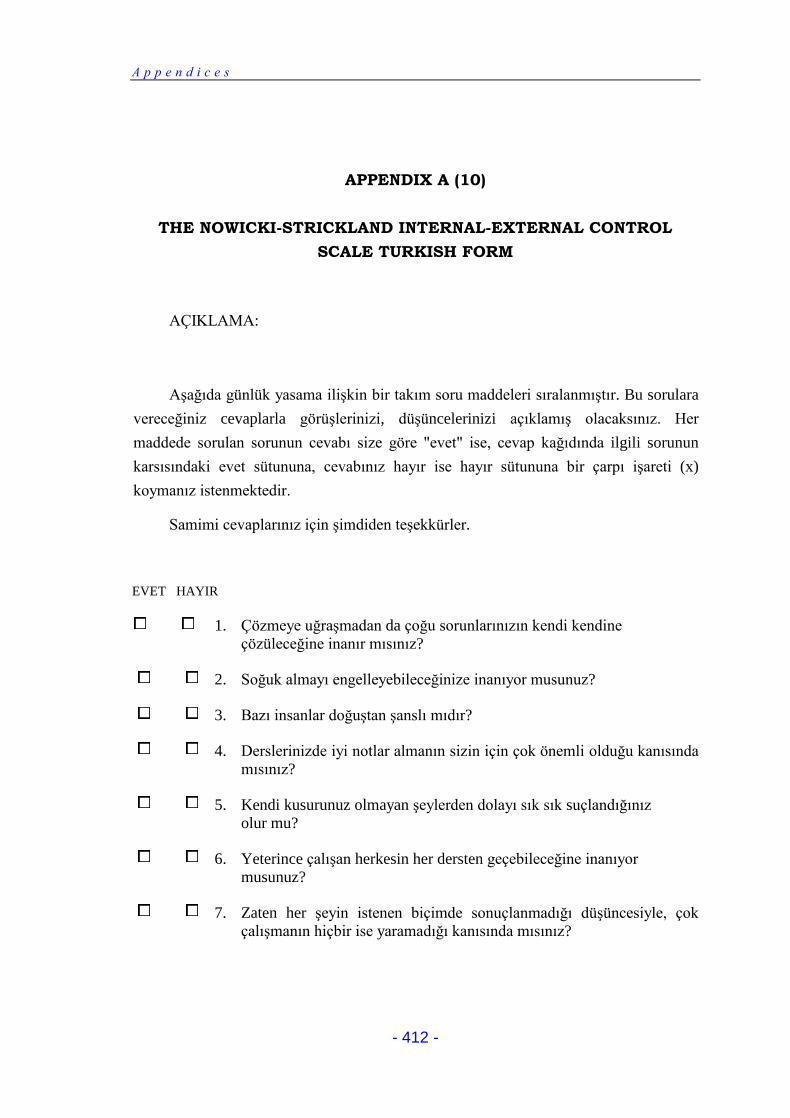
A p p e n d i c e s
- 412 -
APPENDIX A (10)
THE NOWICKI-STRICKLAND INTERNAL-EXTERNAL CONTROL
SCALE TURKISH FORM
AÇIKLAMA:
Aşağıda günlük yasama ilişkin bir takım soru maddeleri sıralanmıştır. Bu sorulara
vereceğiniz cevaplarla görüşlerinizi, düşüncelerinizi açıklamış olacaksınız. Her
maddede sorulan sorunun cevabı size göre "evet" ise, cevap kağıdında ilgili sorunun
karsısındaki evet sütununa, cevabınız hayır ise hayır sütununa bir çarpı işareti (x)
koymanız istenmektedir.
Samimi cevaplarınız için şimdiden teşekkürler.
EVET HAYIR
1. Çözmeye uğraşmadan da çoğu sorunlarınızın kendi kendine
çözüleceğine inanır mısınız?
2. Soğuk almayı engelleyebileceğinize inanıyor musunuz?
3. Bazı insanlar doğuştan şanslı mıdır?
4. Derslerinizde iyi notlar almanın sizin için çok önemli olduğu kanısında
mısınız?
5. Kendi kusurunuz olmayan şeylerden dolayı sık sık suçlandığınız
olur mu?
6. Yeterince çalışan herkesin her dersten geçebileceğine inanıyor
musunuz?
7. Zaten her şeyin istenen biçimde sonuçlanmadığı düşüncesiyle, çok
çalışmanın hiçbir ise yaramadığı kanısında mısınız?
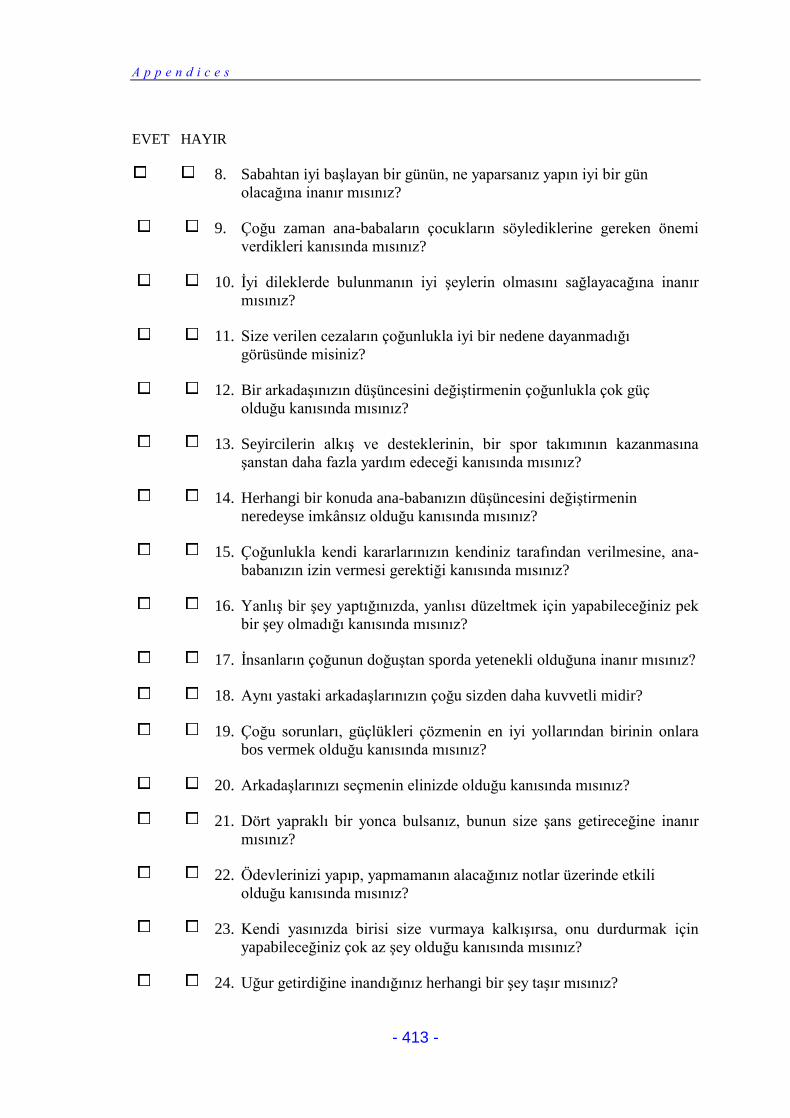
A p p e n d i c e s
- 413 -
EVET HAYIR
8. Sabahtan iyi başlayan bir günün, ne yaparsanız yapın iyi bir gün
olacağına inanır mısınız?
9. Çoğu zaman ana-babaların çocukların söylediklerine gereken önemi
verdikleri kanısında mısınız?
10. İyi dileklerde bulunmanın iyi şeylerin olmasını sağlayacağına inanır
mısınız?
11. Size verilen cezaların çoğunlukla iyi bir nedene dayanmadığı
görüsünde misiniz?
12. Bir arkadaşınızın düşüncesini değiştirmenin çoğunlukla çok güç
olduğu kanısında mısınız?
13. Seyircilerin alkış ve desteklerinin, bir spor takımının kazanmasına
şanstan daha fazla yardım edeceği kanısında mısınız?
14. Herhangi bir konuda ana-babanızın düşüncesini değiştirmenin
neredeyse imkânsız olduğu kanısında mısınız?
15. Çoğunlukla kendi kararlarınızın kendiniz tarafından verilmesine, ana-
babanızın izin vermesi gerektiği kanısında mısınız?
16. Yanlış bir şey yaptığınızda, yanlısı düzeltmek için yapabileceğiniz pek
bir şey olmadığı kanısında mısınız?
17. İnsanların çoğunun doğuştan sporda yetenekli olduğuna inanır mısınız?
18. Aynı yastaki arkadaşlarınızın çoğu sizden daha kuvvetli midir?
19. Çoğu sorunları, güçlükleri çözmenin en iyi yollarından birinin onlara
bos vermek olduğu kanısında mısınız?
20. Arkadaşlarınızı seçmenin elinizde olduğu kanısında mısınız?
21. Dört yapraklı bir yonca bulsanız, bunun size şans getireceğine inanır
mısınız?
22. Ödevlerinizi yapıp, yapmamanın alacağınız notlar üzerinde etkili
olduğu kanısında mısınız?
23. Kendi yasınızda birisi size vurmaya kalkışırsa, onu durdurmak için
yapabileceğiniz çok az şey olduğu kanısında mısınız?
24. Uğur getirdiğine inandığınız herhangi bir şey taşır mısınız?
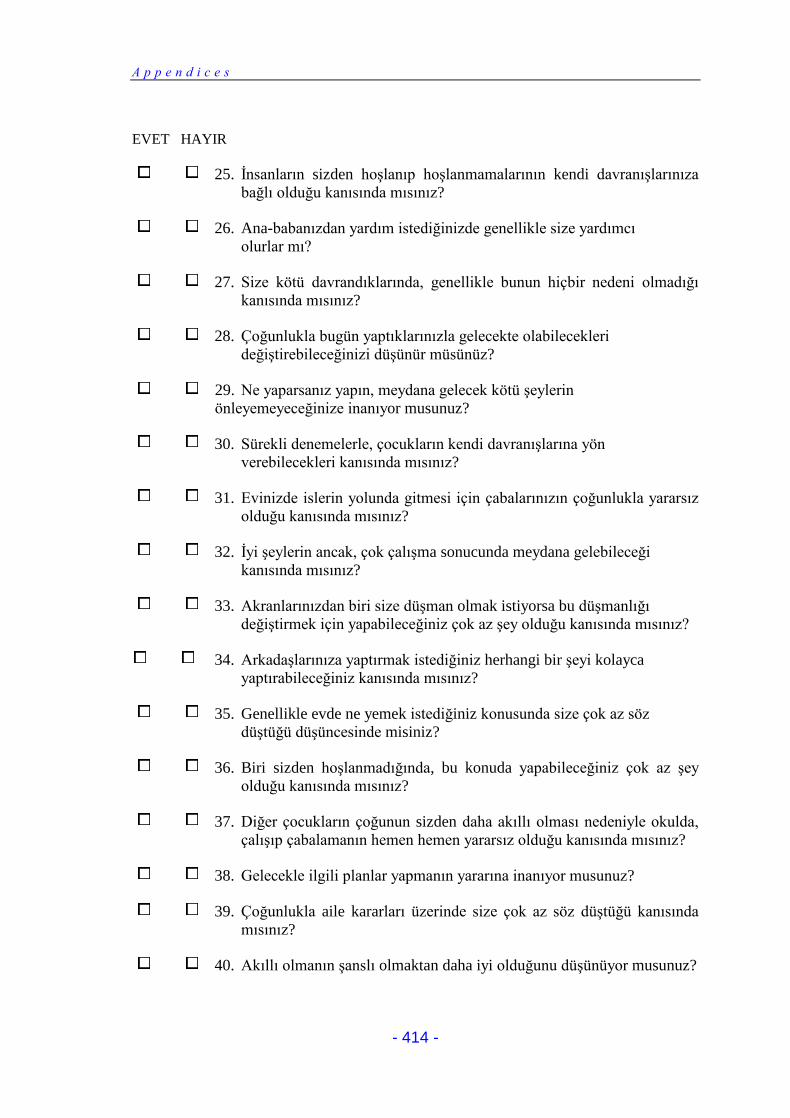
A p p e n d i c e s
- 414 -
EVET HAYIR
25. İnsanların sizden hoşlanıp hoşlanmamalarının kendi davranışlarınıza
bağlı olduğu kanısında mısınız?
26. Ana-babanızdan yardım istediğinizde genellikle size yardımcı
olurlar mı?
27. Size kötü davrandıklarında, genellikle bunun hiçbir nedeni olmadığı
kanısında mısınız?
28. Çoğunlukla bugün yaptıklarınızla gelecekte olabilecekleri
değiştirebileceğinizi düşünür müsünüz?
29. Ne yaparsanız yapın, meydana gelecek kötü şeylerin
önleyemeyeceğinize inanıyor musunuz?
30. Sürekli denemelerle, çocukların kendi davranışlarına yön
verebilecekleri kanısında mısınız?
31. Evinizde islerin yolunda gitmesi için çabalarınızın çoğunlukla yararsız
olduğu kanısında mısınız?
32. İyi şeylerin ancak, çok çalışma sonucunda meydana gelebileceği
kanısında mısınız?
33. Akranlarınızdan biri size düşman olmak istiyorsa bu düşmanlığı
değiştirmek için yapabileceğiniz çok az şey olduğu kanısında mısınız?
34. Arkadaşlarınıza yaptırmak istediğiniz herhangi bir şeyi kolayca
yaptırabileceğiniz kanısında mısınız?
35. Genellikle evde ne yemek istediğiniz konusunda size çok az söz
düştüğü düşüncesinde misiniz?
36. Biri sizden hoşlanmadığında, bu konuda yapabileceğiniz çok az şey
olduğu kanısında mısınız?
37. Diğer çocukların çoğunun sizden daha akıllı olması nedeniyle okulda,
çalışıp çabalamanın hemen hemen yararsız olduğu kanısında mısınız?
38. Gelecekle ilgili planlar yapmanın yararına inanıyor musunuz?
39. Çoğunlukla aile kararları üzerinde size çok az söz düştüğü kanısında
mısınız?
40. Akıllı olmanın şanslı olmaktan daha iyi olduğunu düşünüyor musunuz?
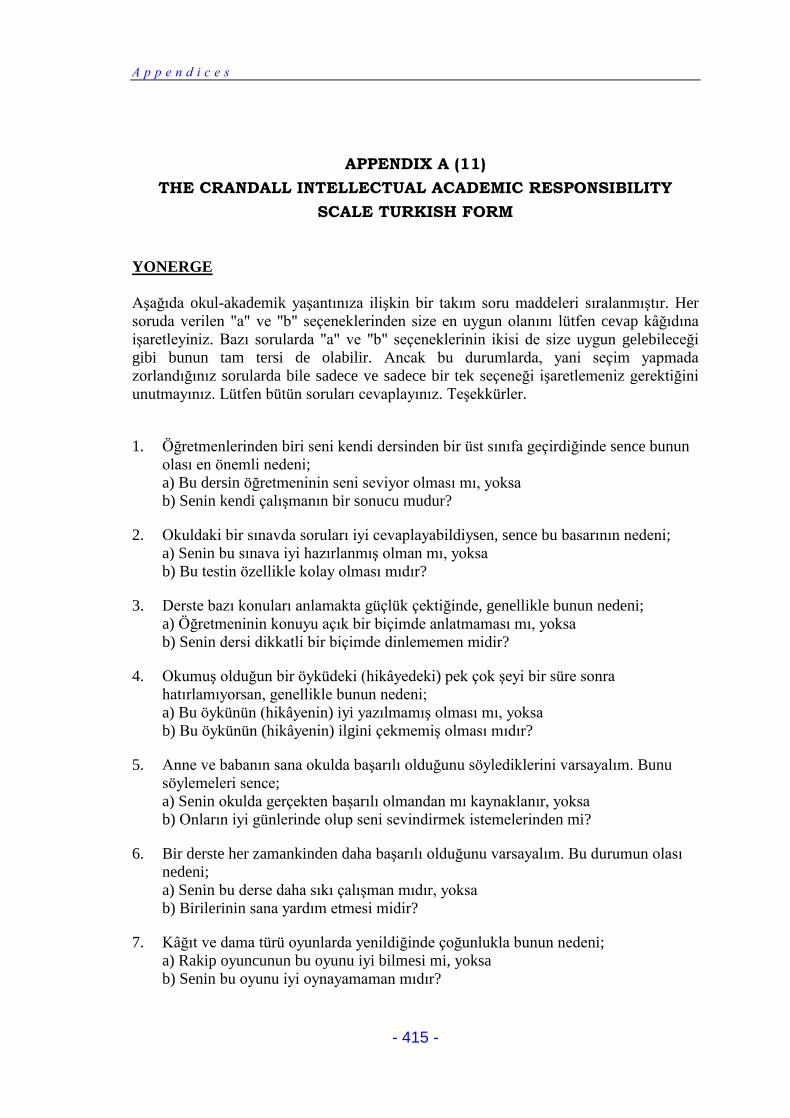
A p p e n d i c e s
- 415 -
APPENDIX A (11)
THE CRANDALL INTELLECTUAL ACADEMIC RESPONSIBILITY
SCALE TURKISH FORM
YONERGE
Aşağıda okul-akademik yaşantınıza ilişkin bir takım soru maddeleri sıralanmıştır. Her
soruda verilen "a" ve "b" seçeneklerinden size en uygun olanını lütfen cevap kâğıdına
işaretleyiniz. Bazı sorularda "a" ve "b" seçeneklerinin ikisi de size uygun gelebileceği
gibi bunun tam tersi de olabilir. Ancak bu durumlarda, yani seçim yapmada
zorlandığınız sorularda bile sadece ve sadece bir tek seçeneği işaretlemeniz gerektiğini
unutmayınız. Lütfen bütün soruları cevaplayınız. Teşekkürler.
1. Öğretmenlerinden biri seni kendi dersinden bir üst sınıfa geçirdiğinde sence bunun
olası en önemli nedeni;
a) Bu dersin öğretmeninin seni seviyor olması mı, yoksa
b) Senin kendi çalışmanın bir sonucu mudur?
2. Okuldaki bir sınavda soruları iyi cevaplayabildiysen, sence bu basarının nedeni;
a) Senin bu sınava iyi hazırlanmış olman mı, yoksa
b) Bu testin özellikle kolay olması mıdır?
3. Derste bazı konuları anlamakta güçlük çektiğinde, genellikle bunun nedeni;
a) Öğretmeninin konuyu açık bir biçimde anlatmaması mı, yoksa
b) Senin dersi dikkatli bir biçimde dinlememen midir?
4. Okumuş olduğun bir öyküdeki (hikâyedeki) pek çok şeyi bir süre sonra
hatırlamıyorsan, genellikle bunun nedeni;
a) Bu öykünün (hikâyenin) iyi yazılmamış olması mı, yoksa
b) Bu öykünün (hikâyenin) ilgini çekmemiş olması mıdır?
5. Anne ve babanın sana okulda başarılı olduğunu söylediklerini varsayalım. Bunu
söylemeleri sence;
a) Senin okulda gerçekten başarılı olmandan mı kaynaklanır, yoksa
b) Onların iyi günlerinde olup seni sevindirmek istemelerinden mi?
6. Bir derste her zamankinden daha başarılı olduğunu varsayalım. Bu durumun olası
nedeni;
a) Senin bu derse daha sıkı çalışman mıdır, yoksa
b) Birilerinin sana yardım etmesi midir?
7. Kâğıt ve dama türü oyunlarda yenildiğinde çoğunlukla bunun nedeni;
a) Rakip oyuncunun bu oyunu iyi bilmesi mi, yoksa
b) Senin bu oyunu iyi oynayamaman mıdır?
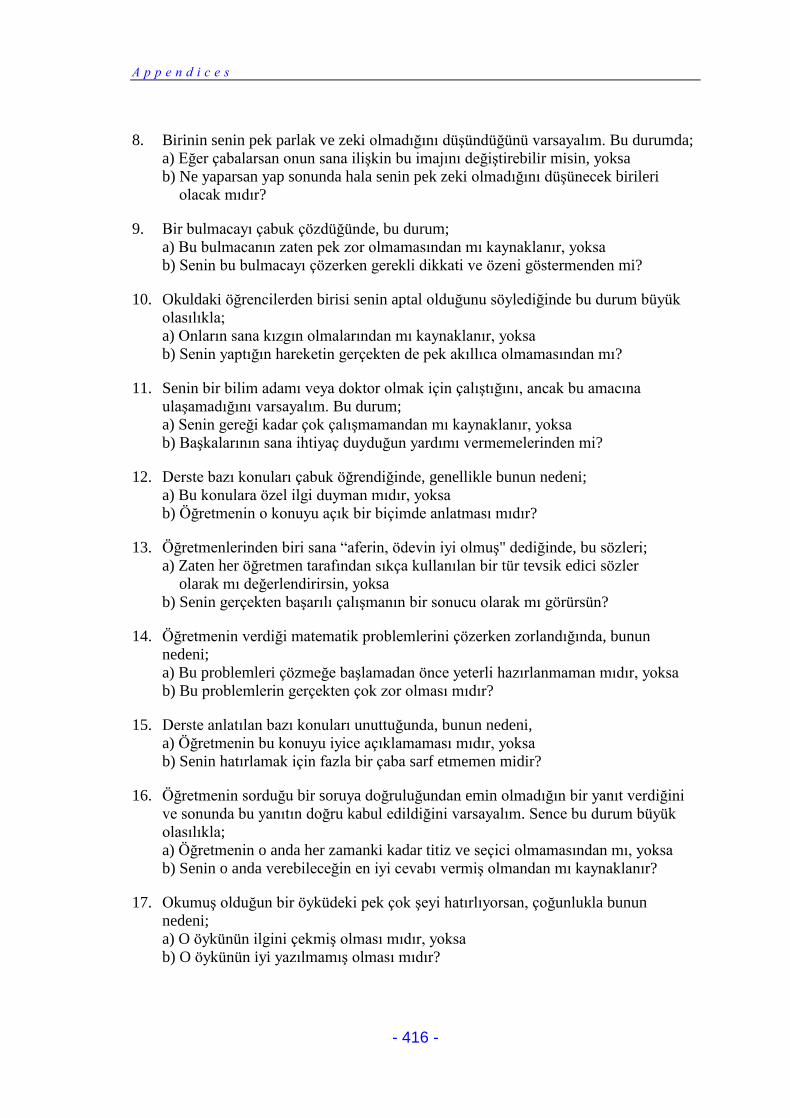
A p p e n d i c e s
- 416 -
8. Birinin senin pek parlak ve zeki olmadığını düşündüğünü varsayalım. Bu durumda;
a) Eğer çabalarsan onun sana ilişkin bu imajını değiştirebilir misin, yoksa
b) Ne yaparsan yap sonunda hala senin pek zeki olmadığını düşünecek birileri
olacak mıdır?
9. Bir bulmacayı çabuk çözdüğünde, bu durum;
a) Bu bulmacanın zaten pek zor olmamasından mı kaynaklanır, yoksa
b) Senin bu bulmacayı çözerken gerekli dikkati ve özeni göstermenden mi?
10. Okuldaki öğrencilerden birisi senin aptal olduğunu söylediğinde bu durum büyük
olasılıkla;
a) Onların sana kızgın olmalarından mı kaynaklanır, yoksa
b) Senin yaptığın hareketin gerçekten de pek akıllıca olmamasından mı?
11. Senin bir bilim adamı veya doktor olmak için çalıştığını, ancak bu amacına
ulaşamadığını varsayalım. Bu durum;
a) Senin gereği kadar çok çalışmamandan mı kaynaklanır, yoksa
b) Başkalarının sana ihtiyaç duyduğun yardımı vermemelerinden mi?
12. Derste bazı konuları çabuk öğrendiğinde, genellikle bunun nedeni;
a) Bu konulara özel ilgi duyman mıdır, yoksa
b) Öğretmenin o konuyu açık bir biçimde anlatması mıdır?
13. Öğretmenlerinden biri sana “aferin, ödevin iyi olmuş" dediğinde, bu sözleri;
a) Zaten her öğretmen tarafından sıkça kullanılan bir tür tevsik edici sözler
olarak mı değerlendirirsin, yoksa
b) Senin gerçekten başarılı çalışmanın bir sonucu olarak mı görürsün?
14. Öğretmenin verdiği matematik problemlerini çözerken zorlandığında, bunun
nedeni;
a) Bu problemleri çözmeğe başlamadan önce yeterli hazırlanmaman mıdır, yoksa
b) Bu problemlerin gerçekten çok zor olması mıdır?
15. Derste anlatılan bazı konuları unuttuğunda, bunun nedeni,
a) Öğretmenin bu konuyu iyice açıklamaması mıdır, yoksa
b) Senin hatırlamak için fazla bir çaba sarf etmemen midir?
16. Öğretmenin sorduğu bir soruya doğruluğundan emin olmadığın bir yanıt verdiğini
ve sonunda bu yanıtın doğru kabul edildiğini varsayalım. Sence bu durum büyük
olasılıkla;
a) Öğretmenin o anda her zamanki kadar titiz ve seçici olmamasından mı, yoksa
b) Senin o anda verebileceğin en iyi cevabı vermiş olmandan mı kaynaklanır?
17. Okumuş olduğun bir öyküdeki pek çok şeyi hatırlıyorsan, çoğunlukla bunun
nedeni;
a) O öykünün ilgini çekmiş olması mıdır, yoksa
b) O öykünün iyi yazılmamış olması mıdır?
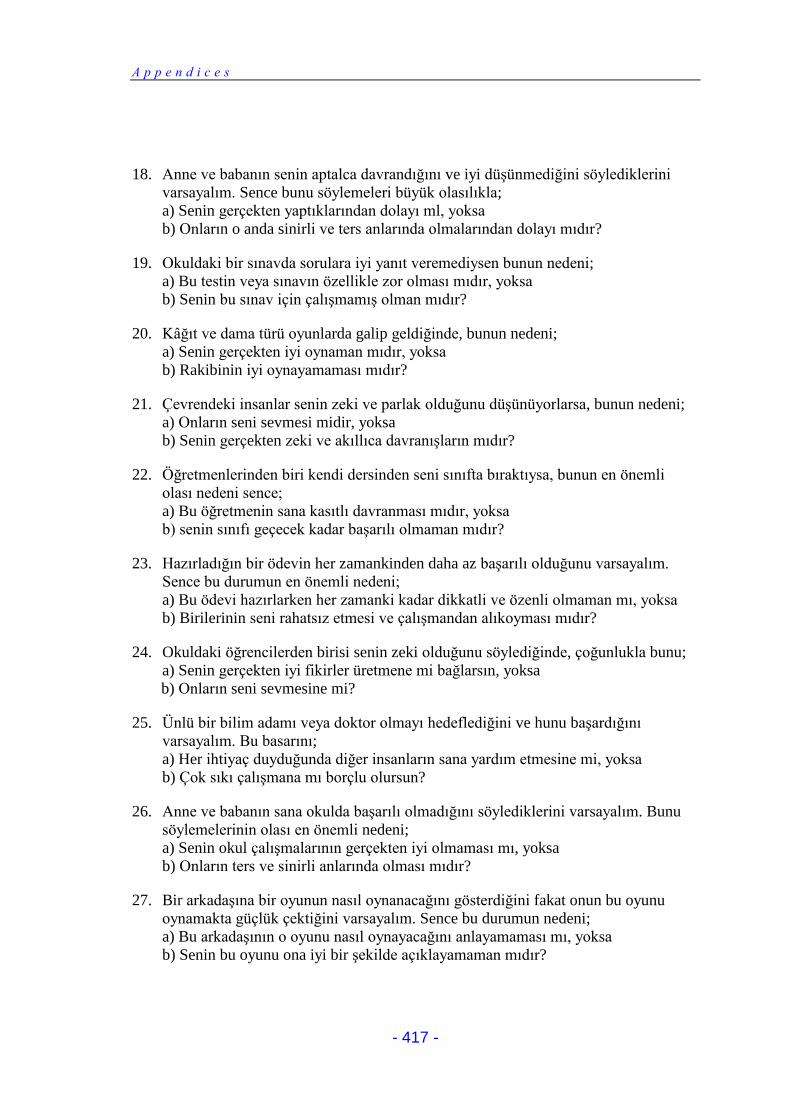
A p p e n d i c e s
- 417 -
18. Anne ve babanın senin aptalca davrandığını ve iyi düşünmediğini söylediklerini
varsayalım. Sence bunu söylemeleri büyük olasılıkla;
a) Senin gerçekten yaptıklarından dolayı ml, yoksa
b) Onların o anda sinirli ve ters anlarında olmalarından dolayı mıdır?
19. Okuldaki bir sınavda sorulara iyi yanıt veremediysen bunun nedeni;
a) Bu testin veya sınavın özellikle zor olması mıdır, yoksa
b) Senin bu sınav için çalışmamış olman mıdır?
20. Kâğıt ve dama türü oyunlarda galip geldiğinde, bunun nedeni;
a) Senin gerçekten iyi oynaman mıdır, yoksa
b) Rakibinin iyi oynayamaması mıdır?
21. Çevrendeki insanlar senin zeki ve parlak olduğunu düşünüyorlarsa, bunun nedeni;
a) Onların seni sevmesi midir, yoksa
b) Senin gerçekten zeki ve akıllıca davranışların mıdır?
22. Öğretmenlerinden biri kendi dersinden seni sınıfta bıraktıysa, bunun en önemli
olası nedeni sence;
a) Bu öğretmenin sana kasıtlı davranması mıdır, yoksa
b) senin sınıfı geçecek kadar başarılı olmaman mıdır?
23. Hazırladığın bir ödevin her zamankinden daha az başarılı olduğunu varsayalım.
Sence bu durumun en önemli nedeni;
a) Bu ödevi hazırlarken her zamanki kadar dikkatli ve özenli olmaman mı, yoksa
b) Birilerinin seni rahatsız etmesi ve çalışmandan alıkoyması mıdır?
24. Okuldaki öğrencilerden birisi senin zeki olduğunu söylediğinde, çoğunlukla bunu;
a) Senin gerçekten iyi fikirler üretmene mi bağlarsın, yoksa
b) Onların seni sevmesine mi?
25. Ünlü bir bilim adamı veya doktor olmayı hedeflediğini ve hunu başardığını
varsayalım. Bu basarını;
a) Her ihtiyaç duyduğunda diğer insanların sana yardım etmesine mi, yoksa
b) Çok sıkı çalışmana mı borçlu olursun?
26. Anne ve babanın sana okulda başarılı olmadığını söylediklerini varsayalım. Bunu
söylemelerinin olası en önemli nedeni;
a) Senin okul çalışmalarının gerçekten iyi olmaması mı, yoksa
b) Onların ters ve sinirli anlarında olması mıdır?
27. Bir arkadaşına bir oyunun nasıl oynanacağını gösterdiğini fakat onun bu oyunu
oynamakta güçlük çektiğini varsayalım. Sence bu durumun nedeni;
a) Bu arkadaşının o oyunu nasıl oynayacağını anlayamaması mı, yoksa
b) Senin bu oyunu ona iyi bir şekilde açıklayamaman mıdır?
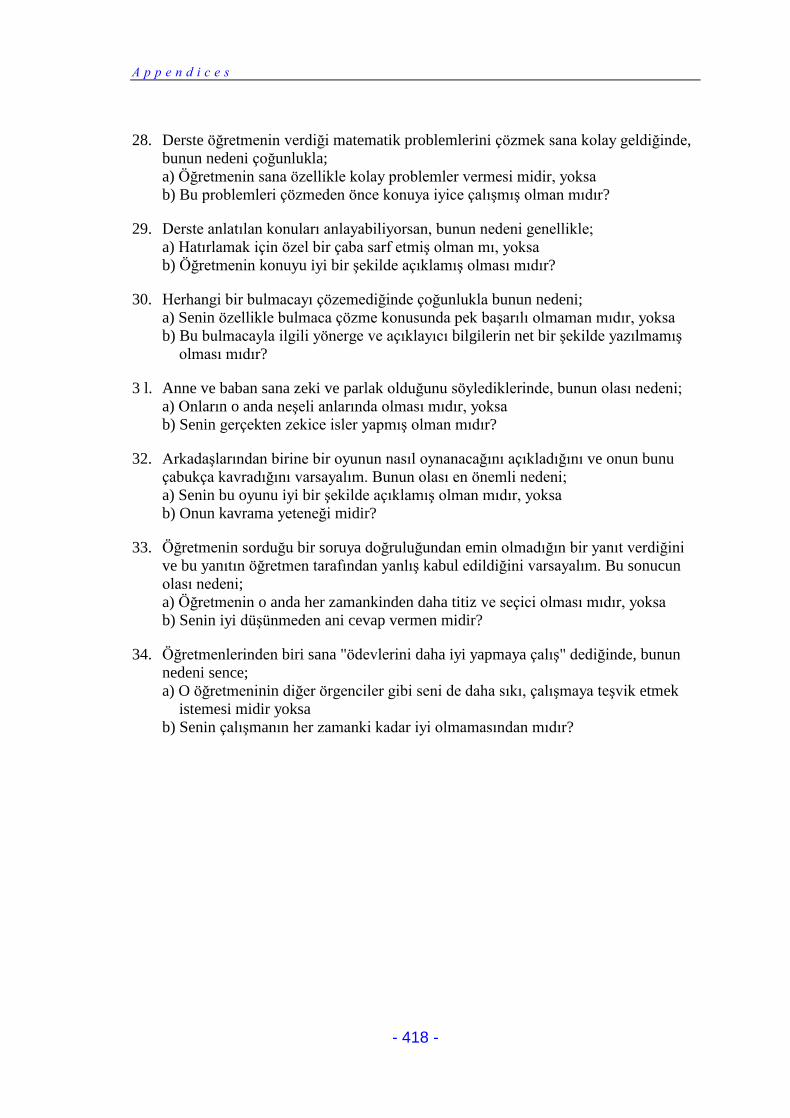
A p p e n d i c e s
- 418 -
28. Derste öğretmenin verdiği matematik problemlerini çözmek sana kolay geldiğinde,
bunun nedeni çoğunlukla;
a) Öğretmenin sana özellikle kolay problemler vermesi midir, yoksa
b) Bu problemleri çözmeden önce konuya iyice çalışmış olman mıdır?
29. Derste anlatılan konuları anlayabiliyorsan, bunun nedeni genellikle;
a) Hatırlamak için özel bir çaba sarf etmiş olman mı, yoksa
b) Öğretmenin konuyu iyi bir şekilde açıklamış olması mıdır?
30. Herhangi bir bulmacayı çözemediğinde çoğunlukla bunun nedeni;
a) Senin özellikle bulmaca çözme konusunda pek başarılı olmaman mıdır, yoksa
b) Bu bulmacayla ilgili yönerge ve açıklayıcı bilgilerin net bir şekilde yazılmamış
olması mıdır?
3 l. Anne ve baban sana zeki ve parlak olduğunu söylediklerinde, bunun olası nedeni;
a) Onların o anda neşeli anlarında olması mıdır, yoksa
b) Senin gerçekten zekice isler yapmış olman mıdır?
32. Arkadaşlarından birine bir oyunun nasıl oynanacağını açıkladığını ve onun bunu
çabukça kavradığını varsayalım. Bunun olası en önemli nedeni;
a) Senin bu oyunu iyi bir şekilde açıklamış olman mıdır, yoksa
b) Onun kavrama yeteneği midir?
33. Öğretmenin sorduğu bir soruya doğruluğundan emin olmadığın bir yanıt verdiğini
ve bu yanıtın öğretmen tarafından yanlış kabul edildiğini varsayalım. Bu sonucun
olası nedeni;
a) Öğretmenin o anda her zamankinden daha titiz ve seçici olması mıdır, yoksa
b) Senin iyi düşünmeden ani cevap vermen midir?
34. Öğretmenlerinden biri sana "ödevlerini daha iyi yapmaya çalış" dediğinde, bunun
nedeni sence;
a) O öğretmeninin diğer örgenciler gibi seni de daha sıkı, çalışmaya teşvik etmek
istemesi midir yoksa
b) Senin çalışmanın her zamanki kadar iyi olmamasından mıdır?
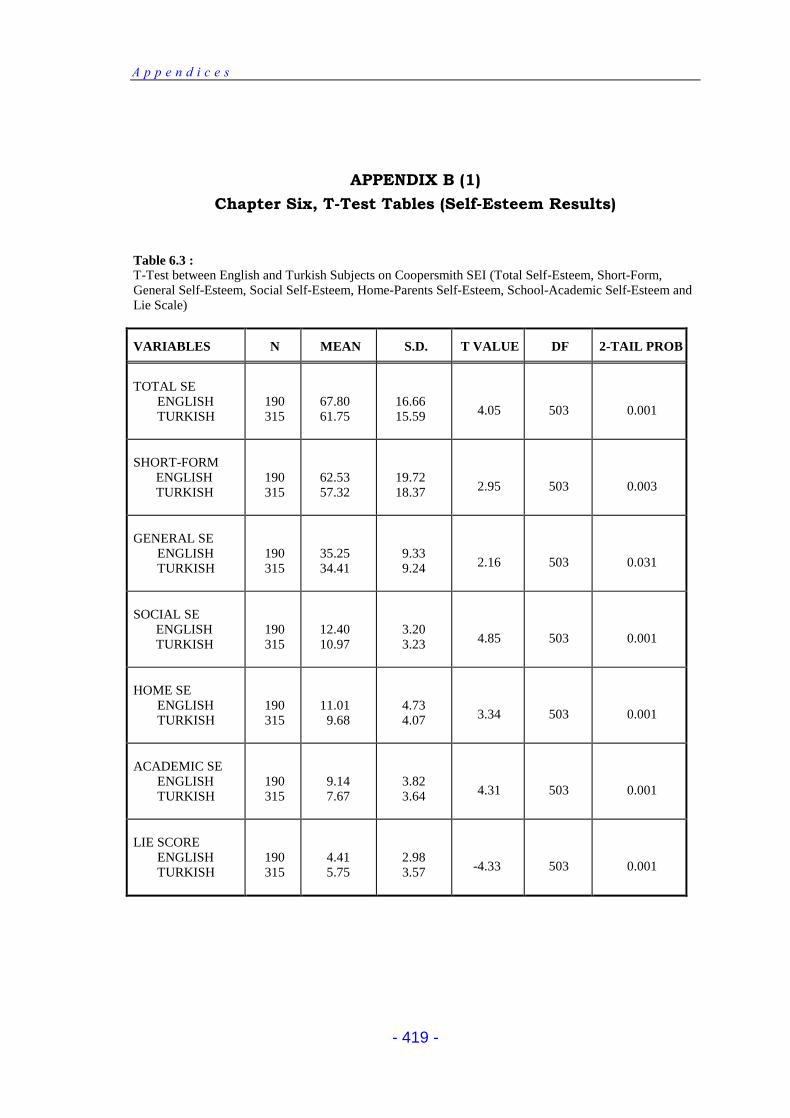
A p p e n d i c e s
- 419 -
APPENDIX B (1)
Chapter Six, T-Test Tables (Self-Esteem Results)
Table 6.3 : T-Test between English and Turkish Subjects on Coopersmith SEI (Total Self-Esteem, Short-Form, General Self-Esteem, Social Self-Esteem, Home-Parents Self-Esteem, School-Academic Self-Esteem and Lie Scale)
VARIABLES N MEAN S.D. T VALUE DF 2-TAIL PROB
TOTAL SE
ENGLISH TURKISH
190 315
67.80 61.75
16.66 15.59
4.05
503
0.001
SHORT-FORM
ENGLISH TURKISH
190 315
62.53 57.32
19.72 18.37
2.95
503
0.003
GENERAL SE
ENGLISH TURKISH
190 315
35.25 34.41
9.33 9.24
2.16
503
0.031
SOCIAL SE
ENGLISH TURKISH
190 315
12.40 10.97
3.20 3.23
4.85
503
0.001
HOME SE
ENGLISH TURKISH
190 315
11.01 9.68
4.73 4.07
3.34
503
0.001
ACADEMIC SE
ENGLISH TURKISH
190 315
9.14 7.67
3.82 3.64
4.31
503
0.001
LIE SCORE
ENGLISH TURKISH
190 315
4.41 5.75
2.98 3.57
-4.33
503
0.001
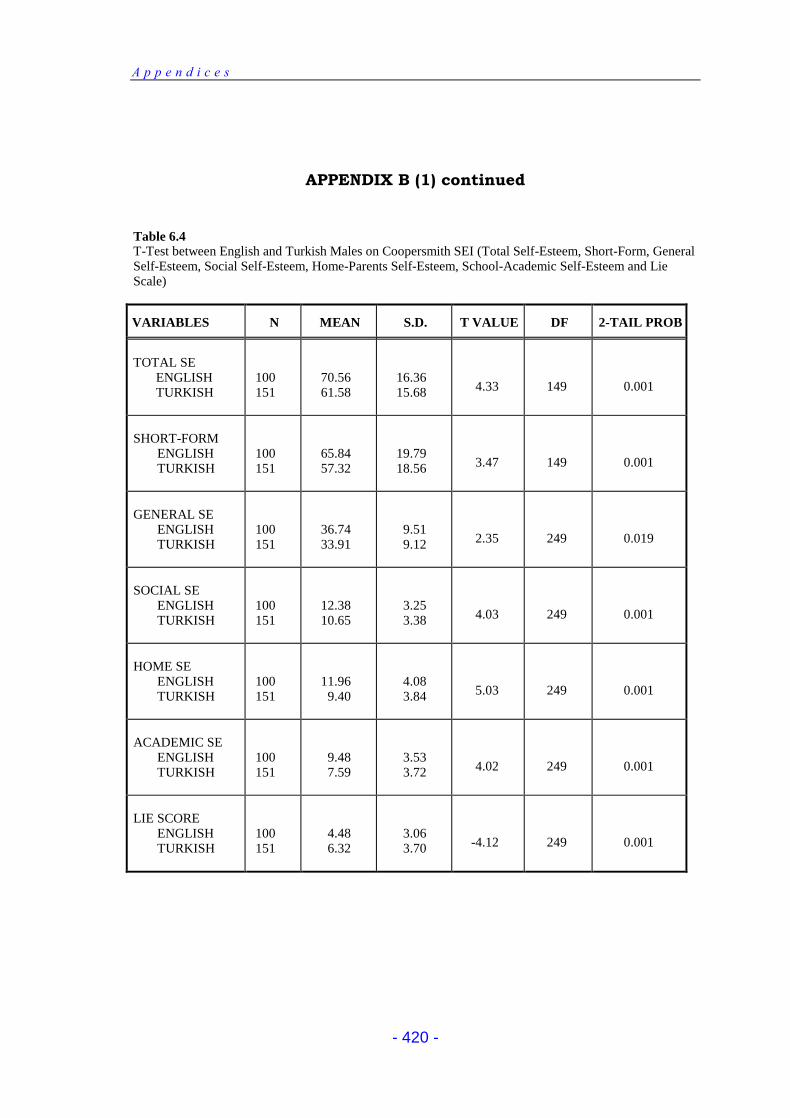
A p p e n d i c e s
- 420 -
APPENDIX B (1) continued
Table 6.4 T-Test between English and Turkish Males on Coopersmith SEI (Total Self-Esteem, Short-Form, General Self-Esteem, Social Self-Esteem, Home-Parents Self-Esteem, School-Academic Self-Esteem and Lie Scale)
VARIABLES N MEAN S.D. T VALUE DF 2-TAIL PROB
TOTAL SE
ENGLISH TURKISH
100 151
70.56 61.58
16.36 15.68
4.33
149
0.001
SHORT-FORM
ENGLISH TURKISH
100 151
65.84 57.32
19.79 18.56
3.47
149
0.001
GENERAL SE
ENGLISH TURKISH
100 151
36.74 33.91
9.51 9.12
2.35
249
0.019
SOCIAL SE
ENGLISH TURKISH
100 151
12.38 10.65
3.25 3.38
4.03
249
0.001
HOME SE
ENGLISH TURKISH
100 151
11.96 9.40
4.08 3.84
5.03
249
0.001
ACADEMIC SE
ENGLISH TURKISH
100 151
9.48 7.59
3.53 3.72
4.02
249
0.001
LIE SCORE
ENGLISH TURKISH
100 151
4.48 6.32
3.06 3.70
-4.12
249
0.001
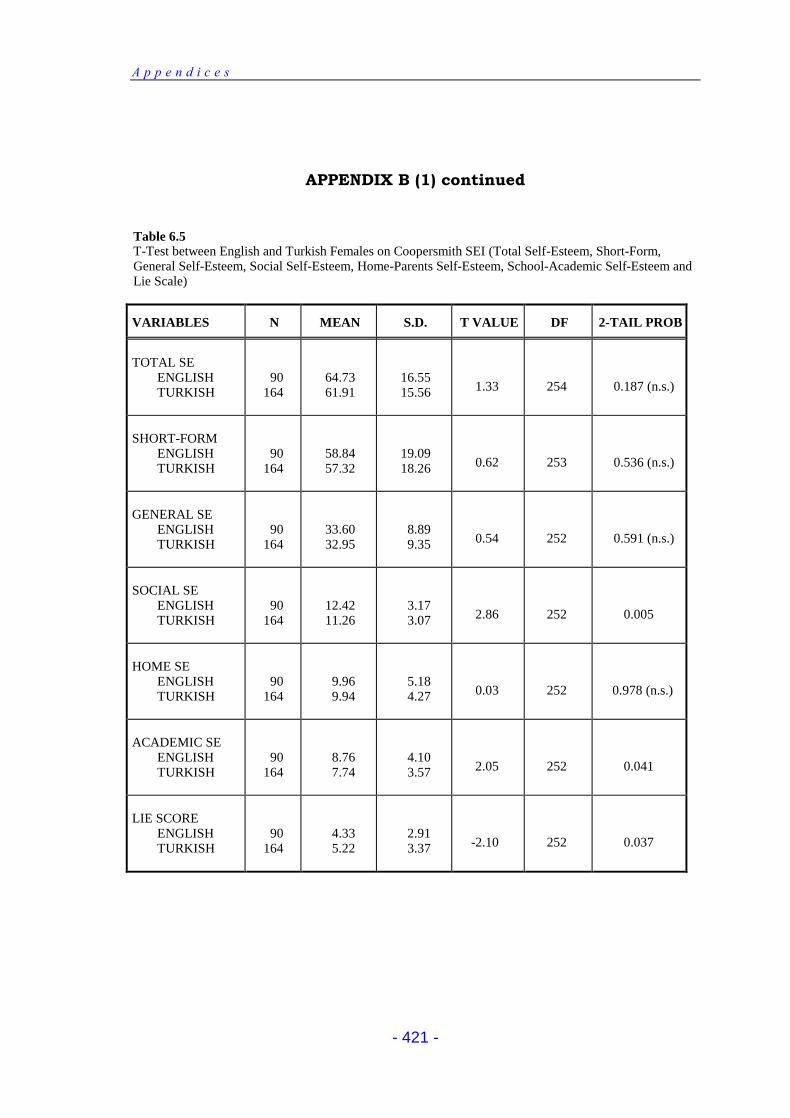
A p p e n d i c e s
- 421 -
APPENDIX B (1) continued
Table 6.5 T-Test between English and Turkish Females on Coopersmith SEI (Total Self-Esteem, Short-Form, General Self-Esteem, Social Self-Esteem, Home-Parents Self-Esteem, School-Academic Self-Esteem and Lie Scale)
VARIABLES N MEAN S.D. T VALUE DF 2-TAIL PROB
TOTAL SE
ENGLISH TURKISH
90 164
64.73 61.91
16.55 15.56
1.33
254
0.187 (n.s.)
SHORT-FORM
ENGLISH TURKISH
90 164
58.84 57.32
19.09 18.26
0.62
253
0.536 (n.s.)
GENERAL SE
ENGLISH TURKISH
90 164
33.60 32.95
8.89 9.35
0.54
252
0.591 (n.s.)
SOCIAL SE
ENGLISH TURKISH
90 164
12.42 11.26
3.17 3.07
2.86
252
0.005
HOME SE
ENGLISH TURKISH
90 164
9.96 9.94
5.18 4.27
0.03
252
0.978 (n.s.)
ACADEMIC SE
ENGLISH TURKISH
90 164
8.76 7.74
4.10 3.57
2.05
252
0.041
LIE SCORE
ENGLISH TURKISH
90 164
4.33 5.22
2.91 3.37
-2.10
252
0.037

A p p e n d i c e s
- 422 -
APPENDIX B (1) continued
Table 6.6 T-Test between English Males and Females on Coopersmith SEI (Total Self-Esteem, Short-Form, General Self-Esteem, Social Self-Esteem, Home-Parents Self-Esteem, School-Academic Self-Esteem and Lie Scale)
VARIABLES N MEAN S.D. T VALUE DF 2-TAIL PROB
TOTAL SE
MALE FEMALE
100 90
70.56 64.73
16.35 16.55
2.44
188
0.016
SHORT-FORM
MALE FEMALE
100 90
65.84 58.84
19.79 19.09
2.48
188
0.014
GENERAL SE
MALE FEMALE
100 90
36.74 33.60
9.51 8.89
2.34
188
0.020
SOCIAL SE
MALE FEMALE
100 90
12.38 12.42
3.25 3.17
0.09
188
0.928 (n.s.)
HOME SE
MALE FEMALE
100 90
11.96 9.96
4.08 5.18
2.98
188
0.003
ACADEMIC SE
MALE FEMALE
100 90
9.48 8.76
3.53 4.10
1.31
188
0.192 (n.s.)
LIE SCORE
MALE FEMALE
100 90
4.48 4.33
3.06 2.91
0.34
188
0.736

A p p e n d i c e s
- 423 -
APPENDIX B (1) continued
Table 6.7 T-Test between Turkish Males and Females on Coopersmith SEI (Total Self-Esteem, Short-Form, General Self-Esteem, Social Self-Esteem, Home-Parents Self-Esteem, School-Academic Self-Esteem and Lie Scale)
VARIABLES N MEAN S.D. T VALUE DF 2-TAIL PROB
TOTAL SE
MALE FEMALE
151 164
61.58 61.91
15.68 15.56
-0.19
313
0.848 (n.s.)
SHORT-FORM
MALE FEMALE
151 164
57.32 57.32
18.56 18.26
0.00
313
0.997 (n.s.)
GENERAL SE
MALE FEMALE
151 164
33.91 32.95
9.12 9.35
0.92
313
0.360 (n.s.)
SOCIAL SE
MALE FEMALE
151 164
10.65 11.26
3.38 3.07
-1.67
313
0.096 (n.s.)
HOME SE
MALE FEMALE
151 164
9.40 9.94
3.84 4.27
-1.17
313
0.245 (n.s.)
ACADEMIC SE
MALE FEMALE
151 164
7.59 7.74
3.72 3.57
-0.38
313
0.707 (n.s.)
LIE SCORE
MALE FEMALE
151 164
6.32 5.22
3.70 3.37
2.76
313
0.005
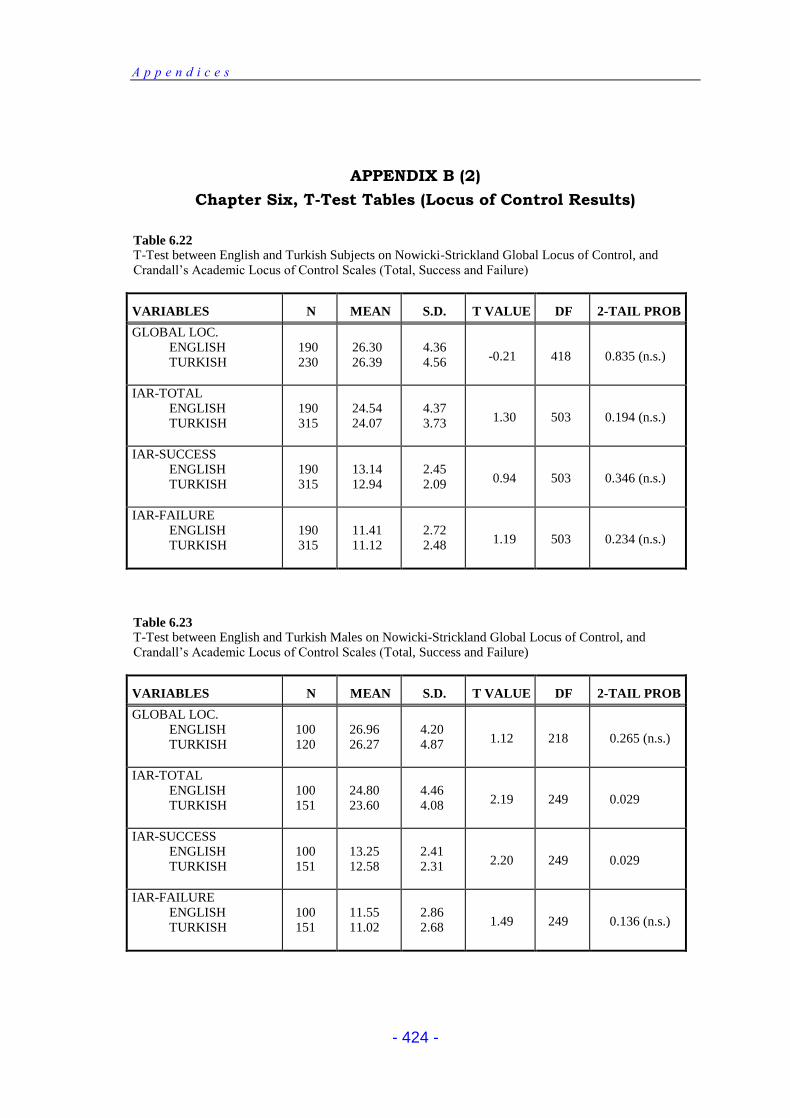
A p p e n d i c e s
- 424 -
APPENDIX B (2)
Chapter Six, T-Test Tables (Locus of Control Results)
Table 6.22 T-Test between English and Turkish Subjects on Nowicki-Strickland Global Locus of Control, and Crandall’s Academic Locus of Control Scales (Total, Success and Failure)
VARIABLES N MEAN S.D. T VALUE DF 2-TAIL PROB
GLOBAL LOC. ENGLISH TURKISH
190 230
26.30 26.39
4.36 4.56
-0.21
418
0.835 (n.s.)
IAR-TOTAL ENGLISH TURKISH
190 315
24.54 24.07
4.37 3.73
1.30
503
0.194 (n.s.)
IAR-SUCCESS ENGLISH TURKISH
190 315
13.14 12.94
2.45 2.09
0.94
503
0.346 (n.s.)
IAR-FAILURE ENGLISH TURKISH
190 315
11.41 11.12
2.72 2.48
1.19
503
0.234 (n.s.)
Table 6.23 T-Test between English and Turkish Males on Nowicki-Strickland Global Locus of Control, and Crandall’s Academic Locus of Control Scales (Total, Success and Failure)
VARIABLES N MEAN S.D. T VALUE DF 2-TAIL PROB
GLOBAL LOC. ENGLISH TURKISH
100 120
26.96 26.27
4.20 4.87
1.12
218
0.265 (n.s.)
IAR-TOTAL ENGLISH TURKISH
100 151
24.80 23.60
4.46 4.08
2.19
249
0.029
IAR-SUCCESS ENGLISH TURKISH
100 151
13.25 12.58
2.41 2.31
2.20
249
0.029
IAR-FAILURE ENGLISH TURKISH
100 151
11.55 11.02
2.86 2.68
1.49
249
0.136 (n.s.)
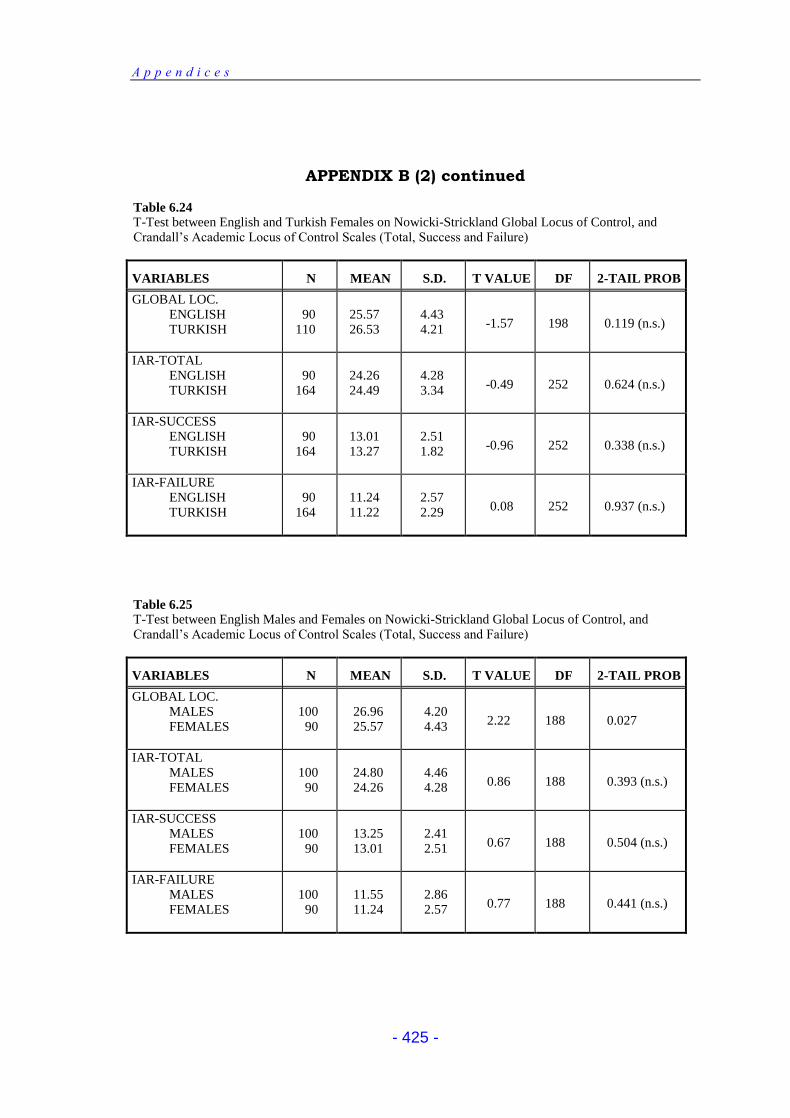
A p p e n d i c e s
- 425 -
APPENDIX B (2) continued
Table 6.24 T-Test between English and Turkish Females on Nowicki-Strickland Global Locus of Control, and Crandall’s Academic Locus of Control Scales (Total, Success and Failure)
VARIABLES N MEAN S.D. T VALUE DF 2-TAIL PROB
GLOBAL LOC. ENGLISH TURKISH
90
110
25.57 26.53
4.43 4.21
-1.57
198
0.119 (n.s.)
IAR-TOTAL ENGLISH TURKISH
90
164
24.26 24.49
4.28 3.34
-0.49
252
0.624 (n.s.)
IAR-SUCCESS ENGLISH TURKISH
90
164
13.01 13.27
2.51 1.82
-0.96
252
0.338 (n.s.)
IAR-FAILURE ENGLISH TURKISH
90
164
11.24 11.22
2.57 2.29
0.08
252
0.937 (n.s.)
Table 6.25 T-Test between English Males and Females on Nowicki-Strickland Global Locus of Control, and Crandall’s Academic Locus of Control Scales (Total, Success and Failure)
VARIABLES N MEAN S.D. T VALUE DF 2-TAIL PROB
GLOBAL LOC. MALES FEMALES
100
90
26.96 25.57
4.20 4.43
2.22
188
0.027
IAR-TOTAL MALES FEMALES
100
90
24.80 24.26
4.46 4.28
0.86
188
0.393 (n.s.)
IAR-SUCCESS MALES FEMALES
100
90
13.25 13.01
2.41 2.51
0.67
188
0.504 (n.s.)
IAR-FAILURE MALES FEMALES
100
90
11.55 11.24
2.86 2.57
0.77
188
0.441 (n.s.)
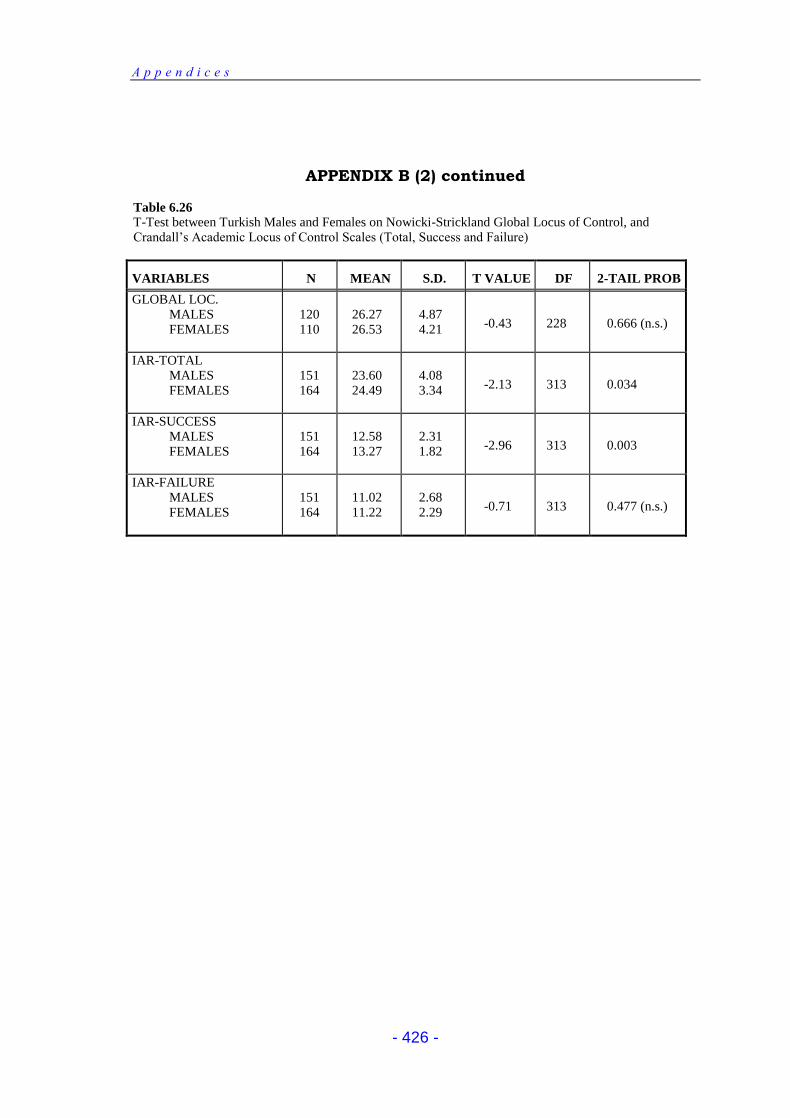
A p p e n d i c e s
- 426 -
APPENDIX B (2) continued
Table 6.26 T-Test between Turkish Males and Females on Nowicki-Strickland Global Locus of Control, and Crandall’s Academic Locus of Control Scales (Total, Success and Failure)
VARIABLES N MEAN S.D. T VALUE DF 2-TAIL PROB
GLOBAL LOC. MALES FEMALES
120 110
26.27 26.53
4.87 4.21
-0.43
228
0.666 (n.s.)
IAR-TOTAL MALES FEMALES
151 164
23.60 24.49
4.08 3.34
-2.13
313
0.034
IAR-SUCCESS MALES FEMALES
151 164
12.58 13.27
2.31 1.82
-2.96
313
0.003
IAR-FAILURE MALES FEMALES
151 164
11.02 11.22
2.68 2.29
-0.71
313
0.477 (n.s.)