selecting sites for a sports complex in st. louis area
TRANSCRIPT
Selecting Sites for a Sports Complex in St. Louis area
Blue Marble
G.I.S. Specialist
Clay Jarnagin
Blake Caldwell
Matthew Mittler
Mike McClure
Desiree Thompson
New Expansion in Major League Soccer (MLS)
Introduction
• Blue Marble was started in 2004 by a group of SIUE GIS graduates with experience in various GIS projects involving site selections, network analysis, service areas, as well as other geospatial analysis
• The Blue Marble understands that you, our client, need a sports stadium built in the St. Louis Metropolitan area, in which the primary tenant will be the a new MLS franchise
• Building a state of the art facility is essential, but it is our job to provide you with the optimal location for a new MLS franchise stadium by using GIS technologies
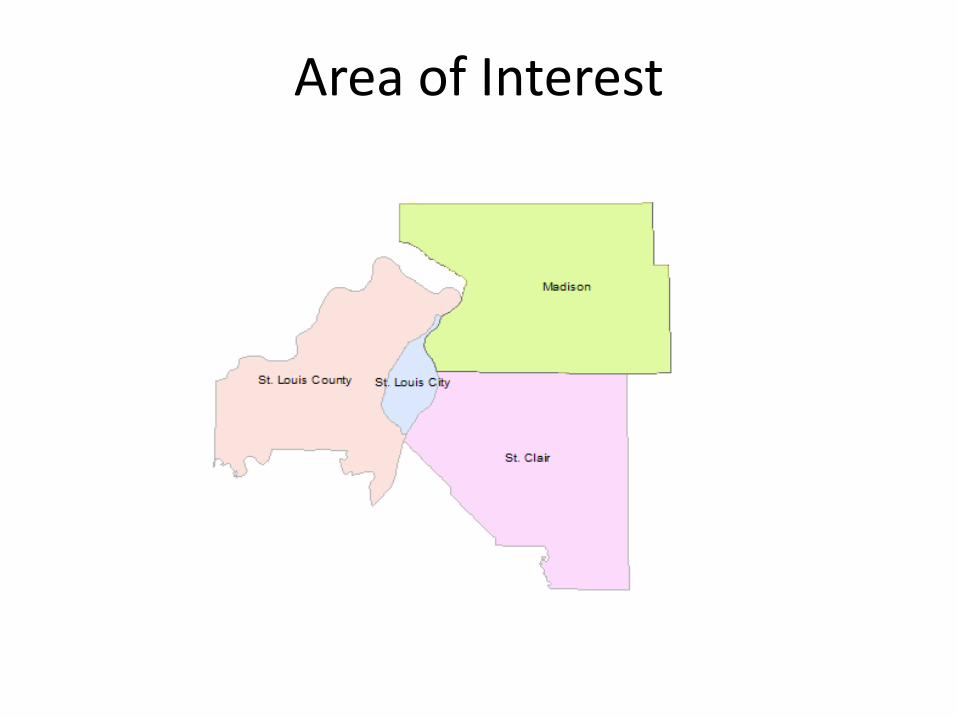
Area of Interest
Problem
• The location must avoid all potential physiographic issues as well as capture the business along with the human aspect
• The site must be large to support the facilities including stadium, parking and possible expansion areas
• The site must be easily accessible to the Metro St. Louis population
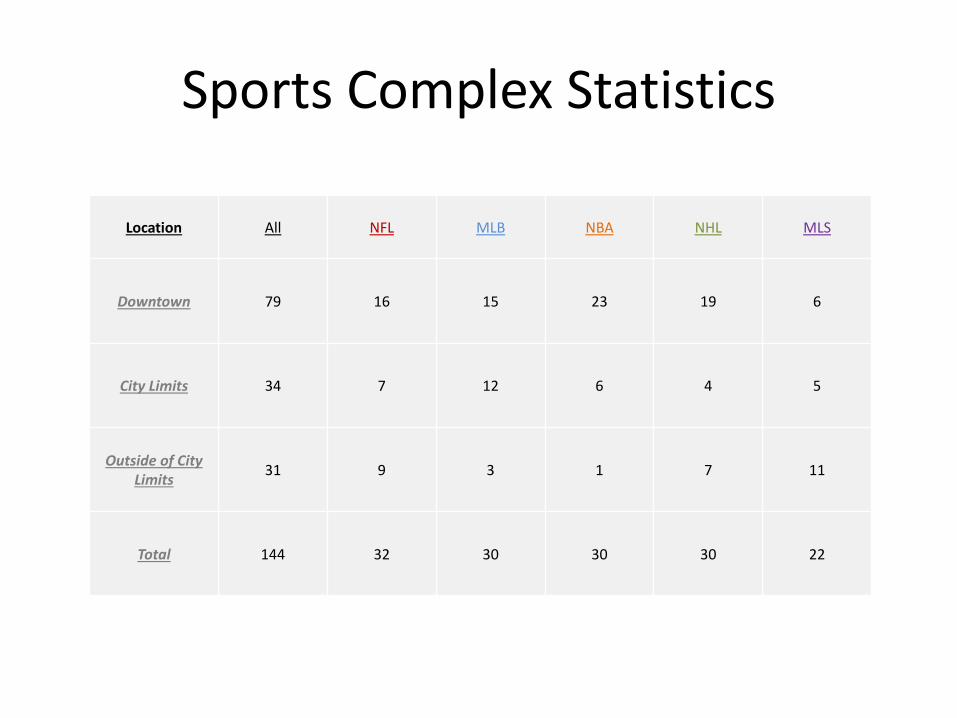
Sports Complex Statistics
Location All NFL MLB NBA NHL MLS
Downtown 79 16 15 23 19 6
City Limits 34 7 12 6 4 5
Outside of City Limits
31 9 3 1 7 11
Total 144 32 30 30 30 22
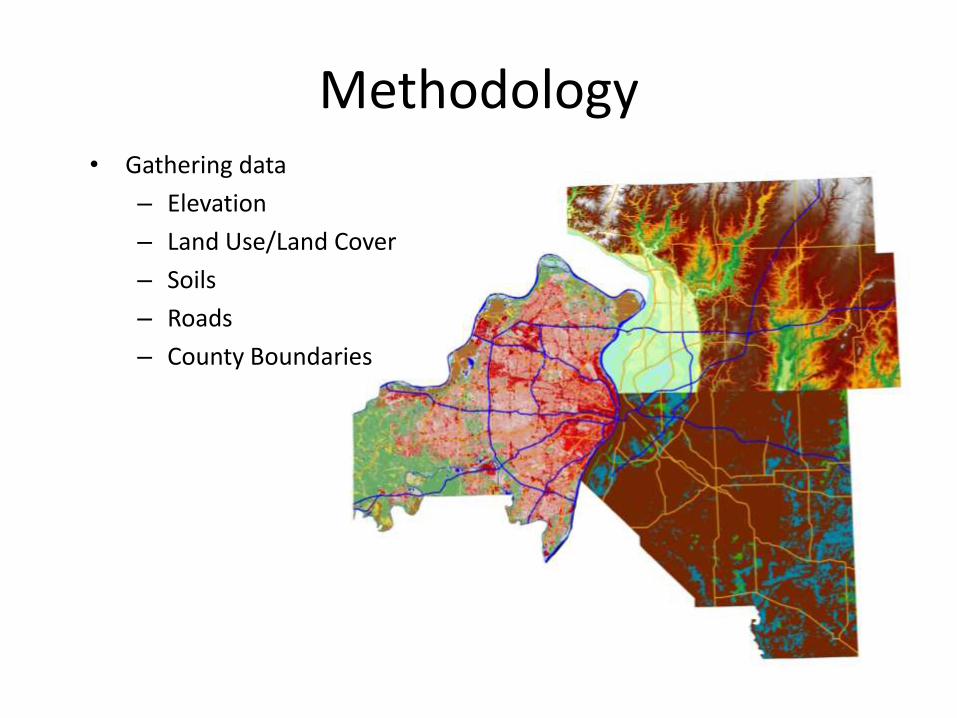
Methodology• Gathering data
– Elevation
– Land Use/Land Cover
– Soils
– Roads
– County Boundaries
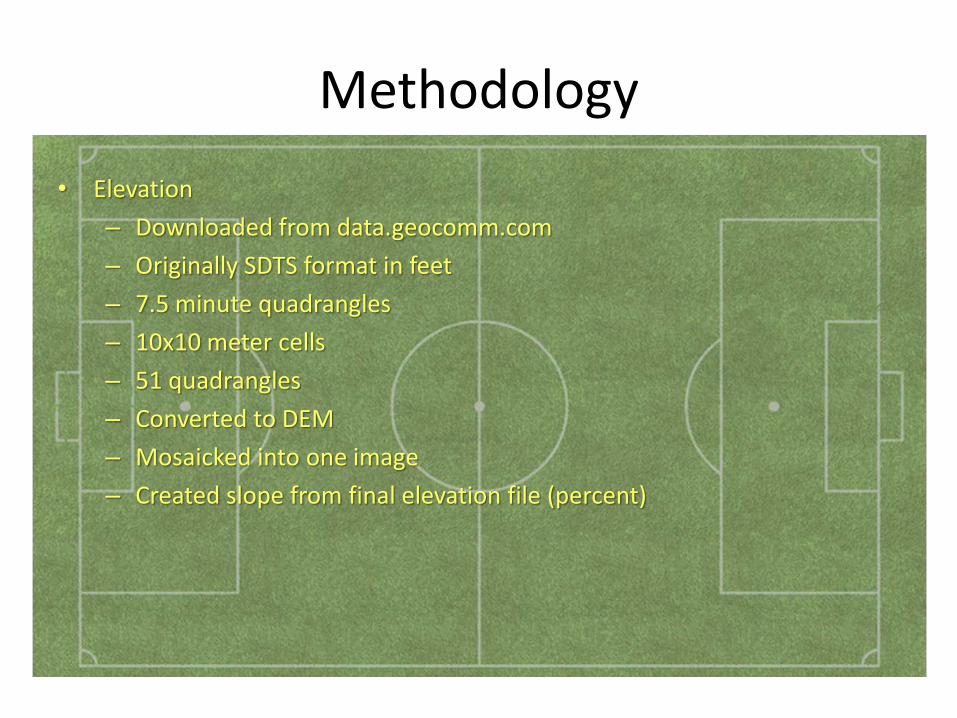
Methodology
• Elevation
– Downloaded from data.geocomm.com
– Originally SDTS format in feet
– 7.5 minute quadrangles
– 10x10 meter cells
– 51 quadrangles
– Converted to DEM
– Mosaicked into one image
– Created slope from final elevation file (percent)
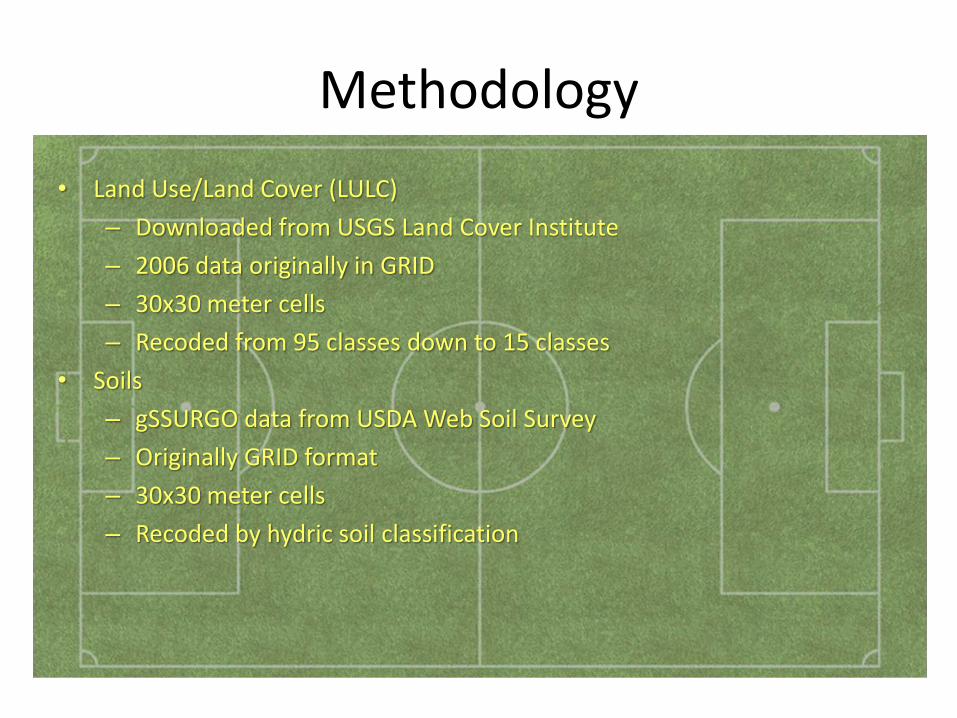
Methodology
• Land Use/Land Cover (LULC)
– Downloaded from USGS Land Cover Institute
– 2006 data originally in GRID
– 30x30 meter cells
– Recoded from 95 classes down to 15 classes
• Soils
– gSSURGO data from USDA Web Soil Survey
– Originally GRID format
– 30x30 meter cells
– Recoded by hydric soil classification
Methodology
• Roads
– Downloaded TIGER data from U.S. Census Bureau
– Reprojected to UTM
– Converted to Raster (.img)
– Created search buffer 1 mile off of roads (54 pixels)
• County Boundary
– Downloaded from Census
– Reprojected to UTM
– Selected counties from Area of Interest
Criteria
• Recoded LULC so that land uses we want are values of 1 and land uses we do not want are values of 0
• Used All Developed, Barren Land, Grassland/Herbaceous, Hay/Pasture, & Cultivated Crops
• Only included Non-hydric soils in criteria
• Only pixels within the ½ mile buffer off of roads were in criteria
• Clump criteria using 4 neighbor option
• Sieved off clumps smaller than 100 acres (450 pixels)
• 530 sites
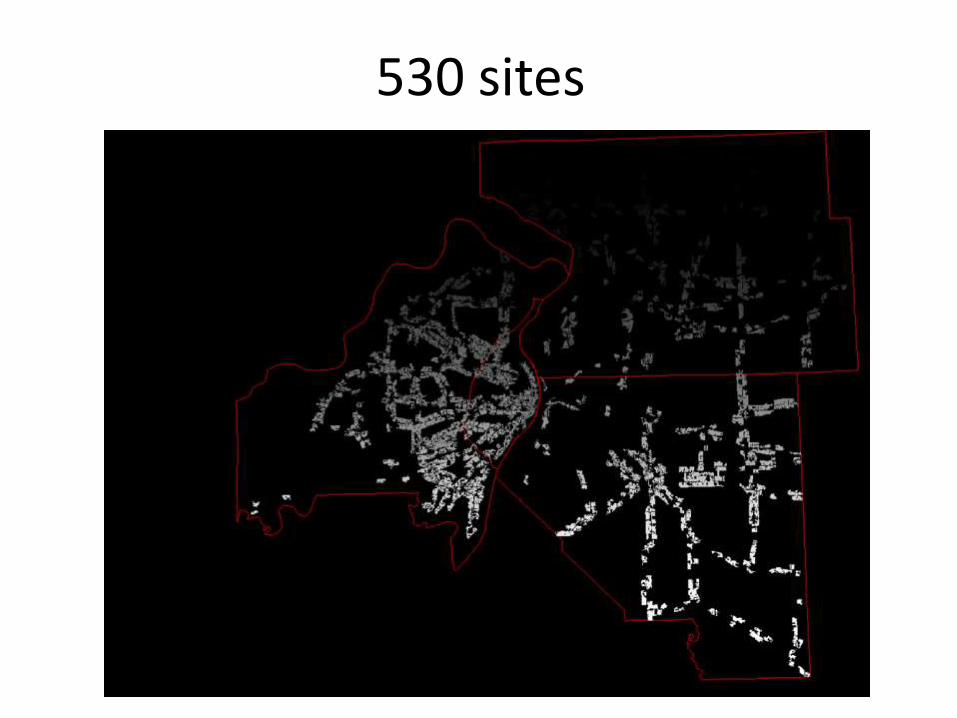
530 sites
Criteria
• Summary report of matrix using slope
• Export zonal statistics to the clump attribute table
• Perimeter tool on the clump
• Make a new field: perimeter/area
• Make two recodes of the clump– One so that values of 1 have an average slope of < 0.25%
– Another so that values of 1 have a perimeter/area less than 45 meters/acre
• After narrowing criteria, there are 94 sites
• Manually select sites to delete using Google Earth
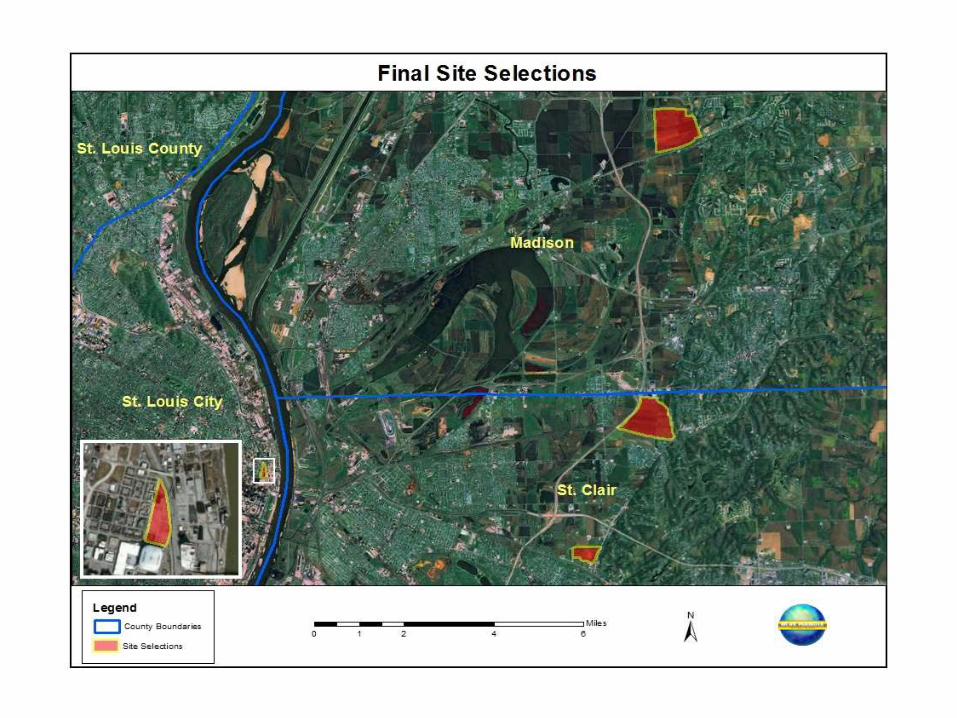
• 4 final sites were chosen
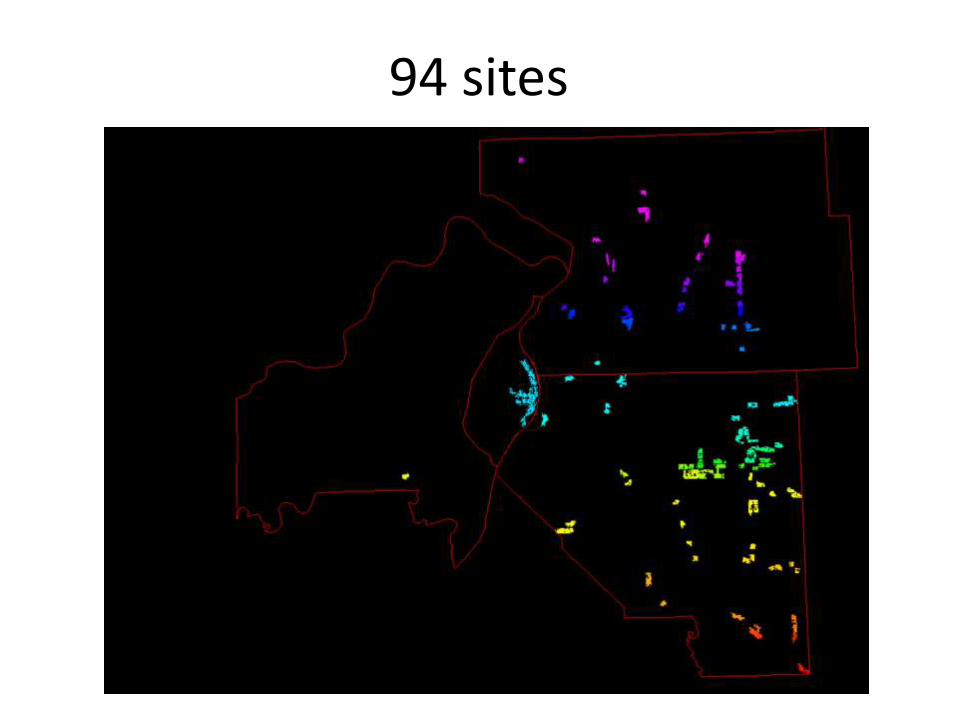
94 sites
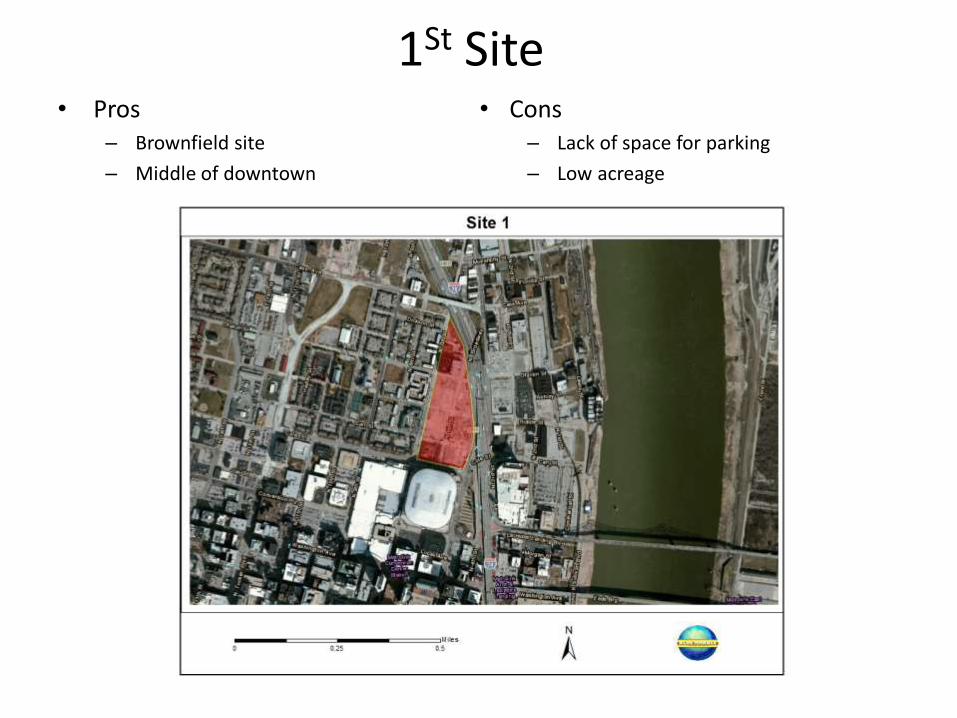
1St Site • Pros
– Brownfield site
– Middle of downtown
• Cons– Lack of space for parking
– Low acreage
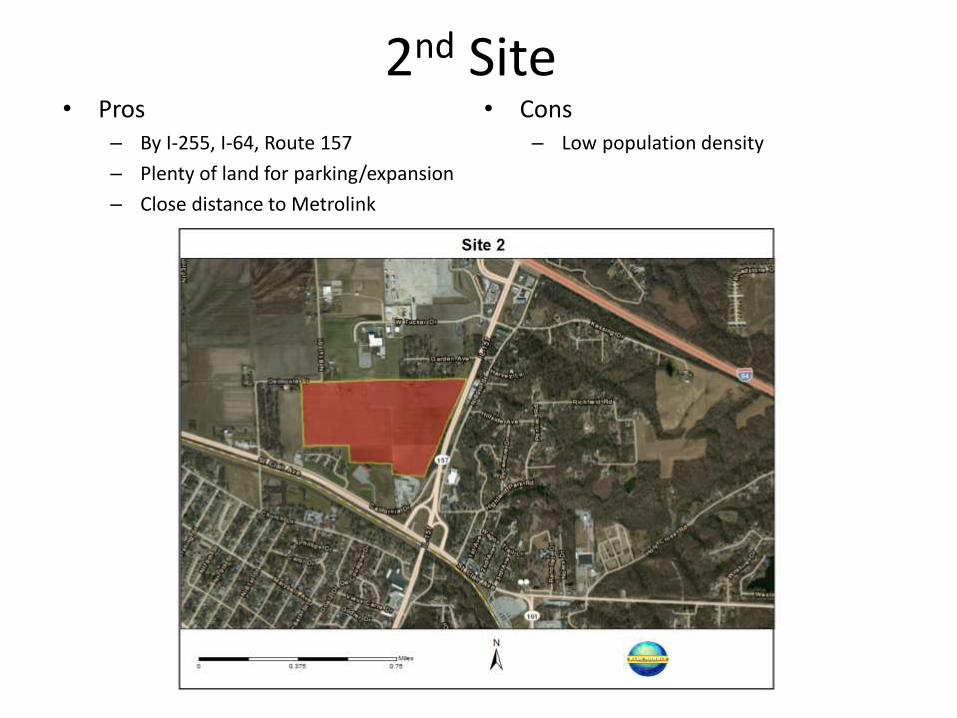
2nd Site• Pros
– By I-255, I-64, Route 157
– Plenty of land for parking/expansion
– Close distance to Metrolink
• Cons– Low population density
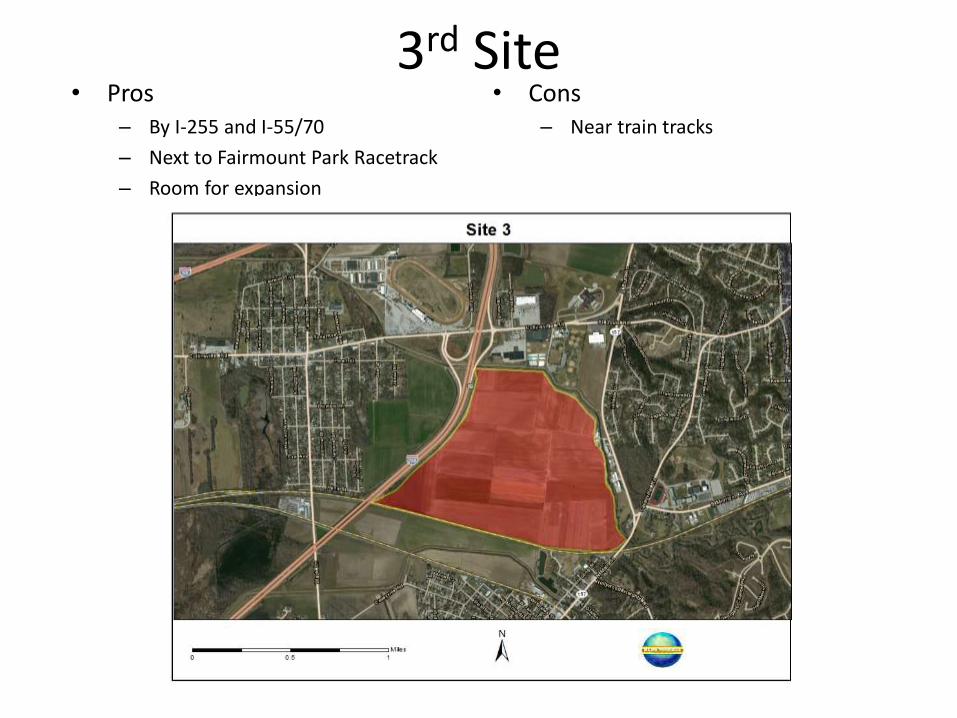
3rd Site • Pros
– By I-255 and I-55/70
– Next to Fairmount Park Racetrack
– Room for expansion
• Cons– Near train tracks
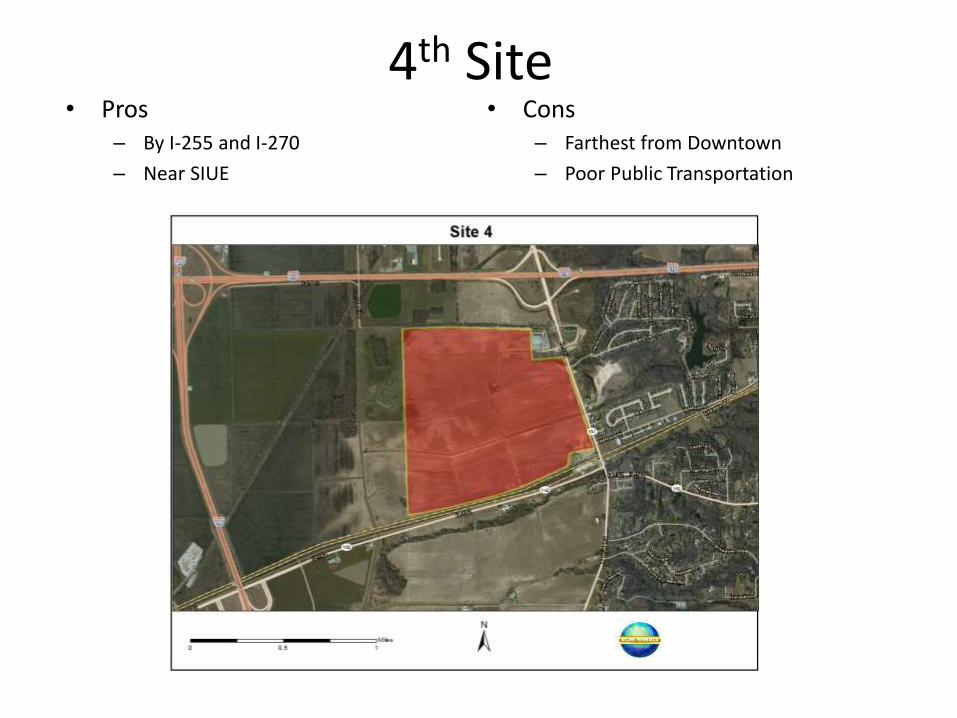
4th Site• Pros
– By I-255 and I-270
– Near SIUE
• Cons – Farthest from Downtown
– Poor Public Transportation
Conclusions
• Using Geographic Information System technologies our analysts at Blue Marble have chosen four site selections that we have determined to be the best locations for a Major League Soccer Stadium
• Highlighting Site 1 as the best location due to local, population, and transportation benefits