seismic activities of jazan area -...
TRANSCRIPT
Jazan University College of Engineering
Civil Engineering Department
Seismic Activities of Jazan Area
Case Study: Seismic Analysis of a Multi-Story R. C.
Building in Jazan City
By
Team Members:
Ahmed Mohammed Ahmed Tami 201120222 Bahir BahaaEldin Akasha Osman 201122248 Mousa Mohammed Hasan sayed 201020219 Sultan frhan Ahmed Mohammed 201120212 Yahya Mohammed Yahya Sahlouly 201021115 Supervisor: Assistant Prof. Dr. Ali Eltom Hassaballa
A Senior Project Final Report submitted in partial fulfillment
of the requirements for the degree of BACHELOR OF Science (B.Sc.), in
Civil Engineering (Completion Date: Dec. 2015) Examination committee
Jazan University College of Engineering
Civil Engineering Department
Seismic Activities of Jazan Area Case Study: Seismic Analysis of a Multi-Story R. C.
Building in Jazan City
By Team Members:
Ahmed Mohammed Ahmed Tami 201120222 Bahir BahaaEldin Akasha Osman 201122248 Mousa Mohammed Hasan Sayed 201020219 Sultan frhan Ahmed Mohammed 201120212 Yahya Mohammed Yahya Sahlouly 201021115 Supervisor: Assistant Prof. Dr. Ali Eltom Hassaballa
A Senior Project Final Report submitted in partial fulfillment
of the requirement for the degree of BACHELOR OF Science (B.Sc.), in
Civil Engineering (Completion Date: Dec. 2015) Examination committee
Jazan University
College of Engineering Civil Engineering Department
Seismic Activities of Jazan Area Case Study: Seismic Analysis of a Multi-Story R. C.
Building in Jazan City
APPROVAL RECOMMENDED:
______________________________ PROJECT SUPERVISOR (s)
______________________________ DATE
______________________________
DEPARTMENT HEAD ______________________________
DATE
______________________________ COURSE INSTRUCTOR
______________________________
DATE APPROVED: _____________________________ DEAN, COLLEGE OF ENGINEERING ____________________________________ DATE
ABSTRACT
Jazan area is located in the most active seismic zone region of the Kingdom
of Saudi Arabia where there is a complicated geological structures and
tectonics. This project reviews the seismic activities occurred in Jazan area
together with reviewing the Saudi Building (Seismic) Code (SBC-301-
2007). A multi-story reinforced concrete building in Jazan city was
seismically analyzed using the Equivalent Lateral Force Procedure with the
aid of STAAD PRO software. The building, which was Ordinary Reinforced
Concrete Moment Resisting Frame (ORCMRF), analyzed in compliance
with the provisions of (SBC-301-2007). The most important parameters
governing the analysis of this frame were dead load, live load and seismic
loads. Seismic loads were computed as pairs of accelerations versus times.
The damping ratio was taken as 0.05 (5% of the critical damping).
The ground accelerations versus time periods were calculated using SBC-
301-2007 together with parameters necessary to be used as input data for the
program to calculate the seismic parameters, i.e., reactions, displacements,
base shear, bending moments, shearing forces, drifts. The obtained results
show effects of earthquake ground motions on building studied herein is so
greater for the higher increases of the values of outputs resulting from
seismic loads comparing to that due to static load only.
Finally, the results obtained, clearly, show the importance of taking the
Saudi seismic code provisions into account when analyzing and designing
multi-story buildings in Jazan area.
iii

DEDICATION To my Families who, through his financial and moral support was the
source of inspiration and the mainstay in my attaining an education, I
dedicate this project.
iv

ACKNOWLEDGEMENT
The thanks giving phrases are ashamed of you, because you are the largest
of which. You have turned us from failure to success. Rises to the
peaks...you are the people of excellence.
Best regards to:
Assistant Prof. Dr. Ali Eltom Hassaballa for his supervision, guidance and
valuable comments and criticism throughout the stages of this project.
Special thanks are due to Assistant Prof. Dr. Fathalrahman M. Adam for his
continuous assistance and support. Thanks are extended to the staff of Civil
Engineering Department.

TABLE OF CONTENTS
PAGE ABSTRACT…….………………….…………………………………………………....iii DEDICATION…….…………………………………………………………….……….iv ACKNOWLEDGEMENT……..…….………………………………………….….…...v TABLE OF CONTENTS…..…….………………………… …….……..…………..vi LIST OF FIGURES ..…………………………………… .…..………………..…….viii LISTOFTABLES … ...… ……………………………..…..………...…..…………….ix
CHAPTER (1) INTRODUCTION …………………………… ….……….………...1
1.1 General Introduction ………………………….……….………………….1 1.2 Statement of Research Problem ……………………..……….………....2 1.3 Objectives of Research ………………………………...………………...2 1.4 Methodology of Research ………………………….….……...………….3 1.5 Research Outlines ………………………………………………………..3
CHAPTER (2) DYNAMICS OF STRUCTURES AND EARTHQUAKE ENGINEERING …………………………………..……….…………4
2.1 Introduction …………………………….………………………...………...4 2.1.1 Deterministic analysis ………………………….…………….…….4
2.1.2 Nondeterministic analysis …………………………………………4 2.2 Types of Prescribed Loadings …………………………………………...4 2.3 Definitions ………………………………………………………………….6 2.4 Lateral Stiffness of Simple Structures …………………………………..7 2.5 Analysis of Vibration Frequencies for Undamped Systems …………..9 2.6 Earthquake Engineering …………………………………………………10 2.7 Faulting …………………………………………………………………….11 2.8 Causes of earthquakes …………………………………………………..12 2.9 Seismic Waves ……………………………………………………………12 2.9 Elastic Rebound Theory …………………………………………………15 2.10 Measures of Earthquake Size …………………………………………16 2.10.1 Magnitude ……………………………………………………….16 2.10.2 Earthquake intensity ……………………………………………17 2.10.3 Earthquake energy ……………………………………………...17 2.11 Structural Damage ………………………………………………………18 2.12 Damage as a Result of Soil Problems ………………………………..19 2.12.1 Liquifaction ………………………………………………………19 2.12.2 Landslides ……………………………………………………….19 2.12.3 Weak clay ………………………………………………………..20
2.13 Damage as a Result of Structural Problems … ……………… ……21 2.13.1 Foundation failure …………………………………………… …21 2.13.2 Foundation connections ………………………………………..21
2.13.3 The lack of a secure connection to foundation ………………21
2.13.4 Soft story …………………………………………………...……21 2.13.5 Torsional moment ………………………………………………22 2.13.6 Shear ……………………………………………………………..23 2.13.7 Flexural failure …………………………………………………..23 CHAPTER (3) SEISMIC ACTIVITIES IN JAZAN AREA ……….……………….25
3.1 Location of Jazan …………………………………………………………25 3.2 Jazan Region and its Importance ………………….. …….……...........25 3.3 Earthquakes Data Base of the Arabian Peninsula ……………………27 3.4 Samples of Earthquakes in Jazan Area ……………………………..…28 3.5 Seismic Ground Motion Values ……………………………………...….31 3.5.1 Mapped acceleration parameters ………………………………...31 3.5.2 Site coefficients and adjusted maximum considered earthquake spectral response acceleration parameters ………...................31 3.5.3 Design Response Acceleration Parameters …………...............32 3.5.4 Design Response Spectrum ……………………………………...32 3.6 Equivalent Lateral Force Procedure ……………………………………33 3.6.1 Calculation of Base Shear ………………………………………..33 3.6.2 Lateral distribution of seismic forces …………………………….35 3.6.3 Horizontal shear distribution ……………………………………...36 3.6.4 Overturning moment ………………………………………………36 3.6.5 Story drift determination …………………………………………..36
CHAPTER (4) SEISMIC ANALYSIS OF A MULTI-STORY
R. C. FRAME IN JAZAN CITY …..….…………………………….38
4.1 Introduction …………..………………………………….…...…………...38 4.2 Frame Details and Study Case …………………………………………38 4.3 Results of the Analysis …………………………………………………..41
4.3.1 Calculations of mapped and design spectral response accelerations for Jazan City ………………………………………41 4.4 Discussion of the Analysis ………………………………………………49 CHAPTER (5) CONCLUSION AND RECOMMENDATIONS .………………….51
5.1 Conclusions ..………………………….….............................................51 5.2 Recommendations ……………………………………………………….51
REFERENCES………………………………………………………………………...53
1.5”

LIST OF FIGURES
FIGURE NO DESCRIPTION PAGE
(2.1) Characteristics and sources of typical dynamic loadings. 5
(2.2) Free vibration of an idealized one-story undamped structure. 7
(2.3) Lateral stiffness of simple structures 8
(2.4) Lateral displacements and rotations of beam-column joints. 9
(2.5) Earthquake Terminology. 11
(2.6) Fundamental fault mechanisms (left), San Andreas fault in California
(right) 12
(2.7) Diagrams illustrating the forms of ground motion near the ground
surface in four types of earthquake waves. 13
(2.8) Massive tsunamis. 14
(2.9) Tsunami occurrence mechanism (left), tsunami causes (right) 15
(2.10) Elastic rebound theory of earthquake generation: (a) before straining;
(b) strained (before earthquake); (c) after earthquake. 15
(2.11) Accelerogram from El Centro earthquake, May 18, 1940 (N-S component). 16
(2.12) Common types of damage during large earthquakes. 19
(2.13) Liquefaction caused building failure in Niigata, Japan. 20
viii
(2.14) about 75% homes were damaged as a result of Turnagain heights slide. 20
(2.15) Broken piles under bridge (left), Piles penetrating bridge deck (right). 21
(2.16) House that fell from its foundation during the 1971 San Fernardino
earthquake (left), Failure of column to pile shaft connection. 22
(2.17) Soft story collapse in San Francisco during the 1989 Loma Prieta earthquake. 22
(2.18) Plan view of nine-story SRC building in Kobe (left),Nine-story SRC
. building immediately after the 1995 Kobeearthqake (right). 23
(2.19) Damage to north side of Mt. McKinley apartments,California (left),
Shear failure of Pier 150 on Kobe Route3 (right). 24
(2.20) Flexural damage to columns at lower level of Dakki subway during
the 1995 Kobe earthquake (left),Pier 585on Kobe Route 3 during the 1995
Kobe earthquake (right). 28
(3.1) Seismograph stations of the Saudi National Seismic Network. 28
(3.2) Seismicity up to 2013 including historical and instrumental earthquakes
above Ml 3 (Saudi geological survey database). 29
(3.3) Distributed of instrumental earthquakes in Jazan area and vicinity. 30
(3.4) Sabkha corrosion action on structures. 30
(3.5) Design Response Spectrum. 32
(3.6) Deflection of frame str. 37
(4.1)Plan and elevation joint numbers of the studied frame ucture. 39
(4.2) Dimensions and member numbering of the frame. 40
(4.3) Relation between horizontal reactions (Fx) due to L/C1 and L/C2. 43
(4.4) Relation between vertical reactions (Fy) due to L/C1 and L/C2. 44

(4.5) B.M. at supports of the frame due to L/C1 and L/C2. 44
(4.6) Relation between nodal resultant displacements due to L/C1 and L/C2. 46
(4.7) Axial forces of columns due to combinations L/C1 and L/C2. 48
(4.8) B.M. in beams due to combinations L/C1 and L/C2. 49
viii
LIST OF TABLES TABLE NO DESCRIPTION PAGE (3.1) Governorates and number of population of Jazan region 26
(4.1) Reactions at supports of the studied frame 43
(4.2) Nodal displacements of the studied frame in Jazan city 44
(4.3) Columns end forces of the studied frame 47
(4.4) Beam end forces of the studied frame 49
ix

�� ��زان� � ا���� ا����ا���
� ز��ا�� ���� ������ : ���� درا������ �!�
� ��زانا'& %ا� �$#"د ("� �
�:ط*ب �)& ا�#�
"��201120222 ا��" ط��, ا��" �
201122248 �3�42 ��12ن '�ھ� '/�ء ا�")- ���ن ا��" ���ن"��� 201120212
"��� ��%� "�� -!� 201020219 ��(� "��� ���( ,�%�/5 201021115
:����وعا���ف
2�� ا�$%م �!: هللا. د
�=%ل 2�, در�� ا����4%ر)%�ا��"��� , ا�/"�� س���)� ���وع ا�$?�ج ��"م �
2015 د)!���
1
Chapter One
INTRODUCTION
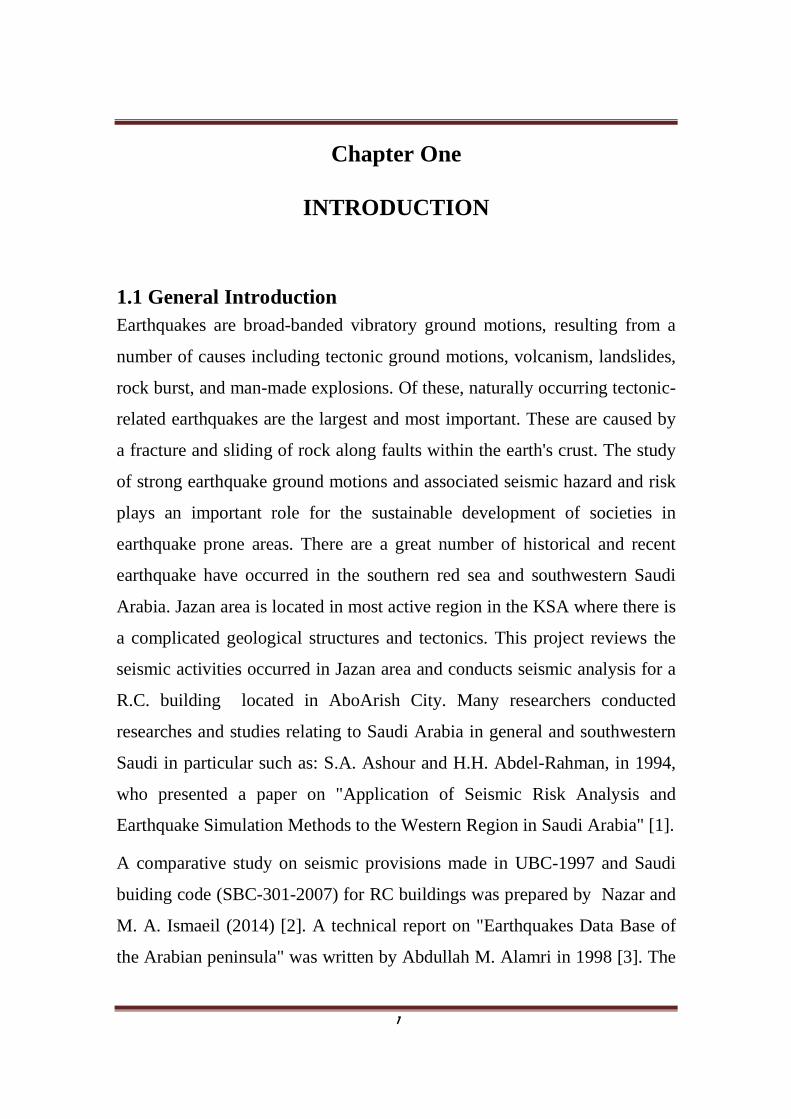
1.1 General Introduction Earthquakes are broad-banded vibratory ground motions, resulting from a
number of causes including tectonic ground motions, volcanism, landslides,
rock burst, and man-made explosions. Of these, naturally occurring tectonic-
related earthquakes are the largest and most important. These are caused by
a fracture and sliding of rock along faults within the earth's crust. The study
of strong earthquake ground motions and associated seismic hazard and risk
plays an important role for the sustainable development of societies in
earthquake prone areas. There are a great number of historical and recent
earthquake have occurred in the southern red sea and southwestern Saudi
Arabia. Jazan area is located in most active region in the KSA where there is
a complicated geological structures and tectonics. This project reviews the
seismic activities occurred in Jazan area and conducts seismic analysis for a
R.C. building located in AboArish City. Many researchers conducted
researches and studies relating to Saudi Arabia in general and southwestern
Saudi in particular such as: S.A. Ashour and H.H. Abdel-Rahman, in 1994,
who presented a paper on "Application of Seismic Risk Analysis and
Earthquake Simulation Methods to the Western Region in Saudi Arabia" [1].
A comparative study on seismic provisions made in UBC-1997 and Saudi
buiding code (SBC-301-2007) for RC buildings was prepared by Nazar and
M. A. Ismaeil (2014) [2]. A technical report on "Earthquakes Data Base of
the Arabian peninsula" was written by Abdullah M. Alamri in 1998 [3]. The
2
report describes the seismological problems associating with rifting in the
Red Sea and the geometry of the plate margins in the west and southwest.
Abdullah M. Al-Amri, Arthur J. Rodgers, Tariq A. Al-Khalifa, presented a
paper on "Improving the level of seismic hazard parameters in Saudi
Arabia using earthquake location", (2008)[4].
Awad Ali Al-Karni (2009) [5], studied the evaluation of the liquefaction
potential of the soil at the location of Jazan university in Jazan city which
lies on the east side of Red Sea. M.N. Fatani and A.M. Khan (1993)[6],
presented a conference paper on "Foundation on salt bearing soils of
Jizan",in order to present the geotechnical aspects of the area concentrating
on the foundation design and construction practice. Furthermore, the
geotechnical aspects of Jazan soil were studied by many authors as
(Dhowian et al., 1987 [7]; Erol, 1989 [8]; Dhowian, 1990 [9]; Al-Shamrani
and Dhowian, 1997) [10].
1.2 Statement of Research Problem
Jazan area is located in the most active seismic region in the KSA where
there is a complicated geological structures and tectonics. The area has a
new urban communities and big cities with heavy populations implementing
and promising with many strategic and developmental projects.
Furthermore, most of the buildings in this area do not follow the Saudi
seismic design considerations although it is affected by many earthquake
events. For all these reasons, it is necessary to perform studies and
researches related to southwestern part of KSA in general and Jazan area in
particular.
1.3 Objectives of Research
1. To study the seismic activities in Jazan area.
3
2. To analyze, in accordance with the Saudi Seismic Code, a
reinforced concrete building in Jazan city subjected to earthquake
loading.
3. Compare and discuss the results obtained and extract valuable
conclusion and recommendations concerning buildings constructed
in Jazan city.
1.4 Methodology of Research
The following steps will be followed to fulfill the objectives of the
project
1. Collection of data necessary for the project from different sources.
2. Analysis of a R.C. building under moderate earthquake loading in
Jazan City by the method of Equivalent Static Lateral Force
Procedure using STAAD-Pro program.
3. Computer programs were used to achieve the objectives of this
research such as STAAD PRO, ORIGIN and EXCEL.
1.5 Research Outlines
This research consists of six chapters that can be briefly resumed as follows
Chapter one: contains a general introduction, problem statement, objectives,
methodology and outlines of the research.
Chapter two: Chapter two: contains the dynamics of structures and
earthquake engineering.
Chapter three: reviews the seismic activities occurred in Jazan area and short
notes about the Saudi Seismic Code.
Chapter four: presents and discusses the seismic analysis of a R.C. building
in Jazan city.
Chapter five: covers the conclusions and proposes future recommendations.
4
Chapter Two
DYNAMICS OF STRUCTURES AND EARTHQUAKE ENGINEERING
Dynamics of Structures
2.1 Introduction:
The term dynamic may be defined simply as time-varying; thus a dynamic
load may be any load of which its magnitude, direction, and/ or position
varies with time. Similarly, the structural response to a dynamic load, i.e.,
the resulting stresses and deflections, is also time-varying, or dynamic.
Two basically different approaches are available for evaluating structural
response to dynamic loads: deterministic and nondeterministic.
2.1.1 Deterministic analysis:
If the time variation of loading is fully known, even though it may be highly
oscillatory or irregular in character, it will be referred to herein as a
prescribed dynamic loading; and the analysis of the response of any
specified structural system to a prescribed dynamic loading is defined as
deterministic analysis.
2.1.2 Nondeterministic analysis:
If the time variation is not completely known but can be defined in a
statistical sense, the loading is termed a random dynamic loading; and its
corresponding analysis of response is defined as a nondeterministic analysis.
2.2 Types of Prescribed Loadings
There are two basic categories:
5
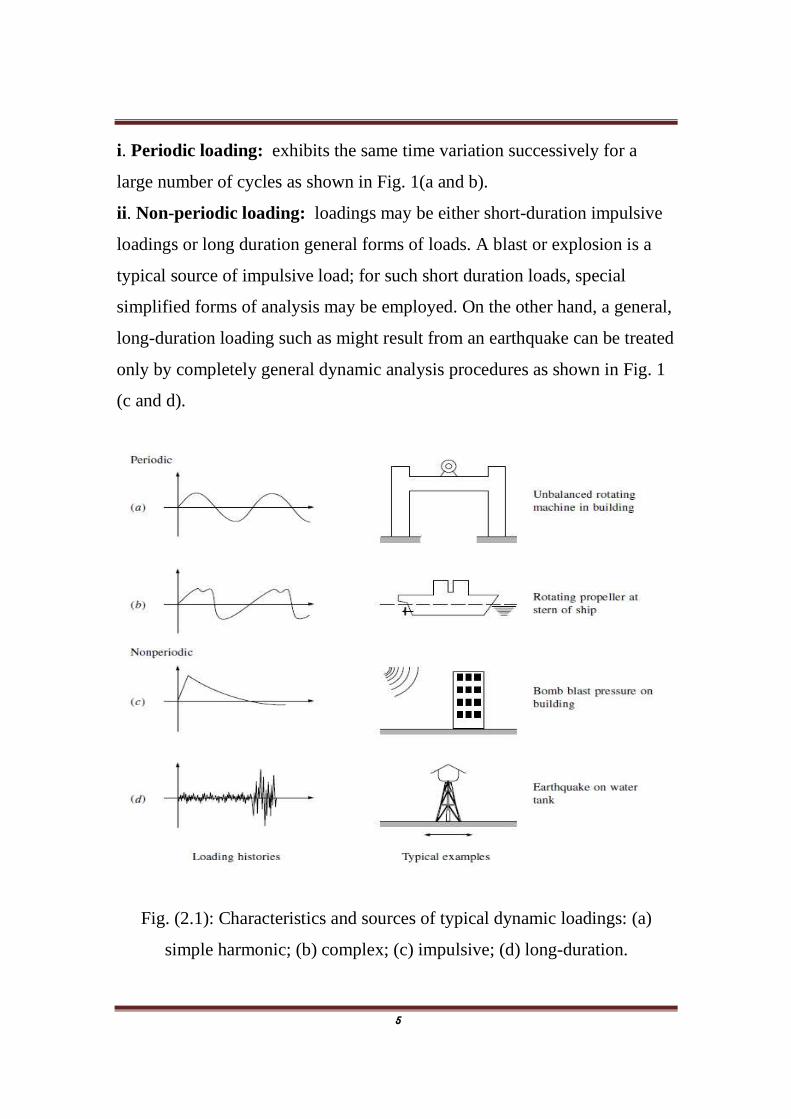
i. Periodic loading: exhibits the same time variation successively for a
large number of cycles as shown in Fig. 1(a and b).
ii. Non-periodic loading: loadings may be either short-duration impulsive
loadings or long duration general forms of loads. A blast or explosion is a
typical source of impulsive load; for such short duration loads, special
simplified forms of analysis may be employed. On the other hand, a general,
long-duration loading such as might result from an earthquake can be treated
only by completely general dynamic analysis procedures as shown in Fig. 1
(c and d).
Fig. (2.1): Characteristics and sources of typical dynamic loadings: (a)
simple harmonic; (b) complex; (c) impulsive; (d) long-duration.
6
A structural dynamic problem differs from its static loading in two important
respects:
1. The time varying nature of the dynamic problem because both loading
and response vary with time.
2. The effect of inertial forces which resist accelerations of the structure in
this way are the most important distinguishing characteristic of a structural
dynamics problem.
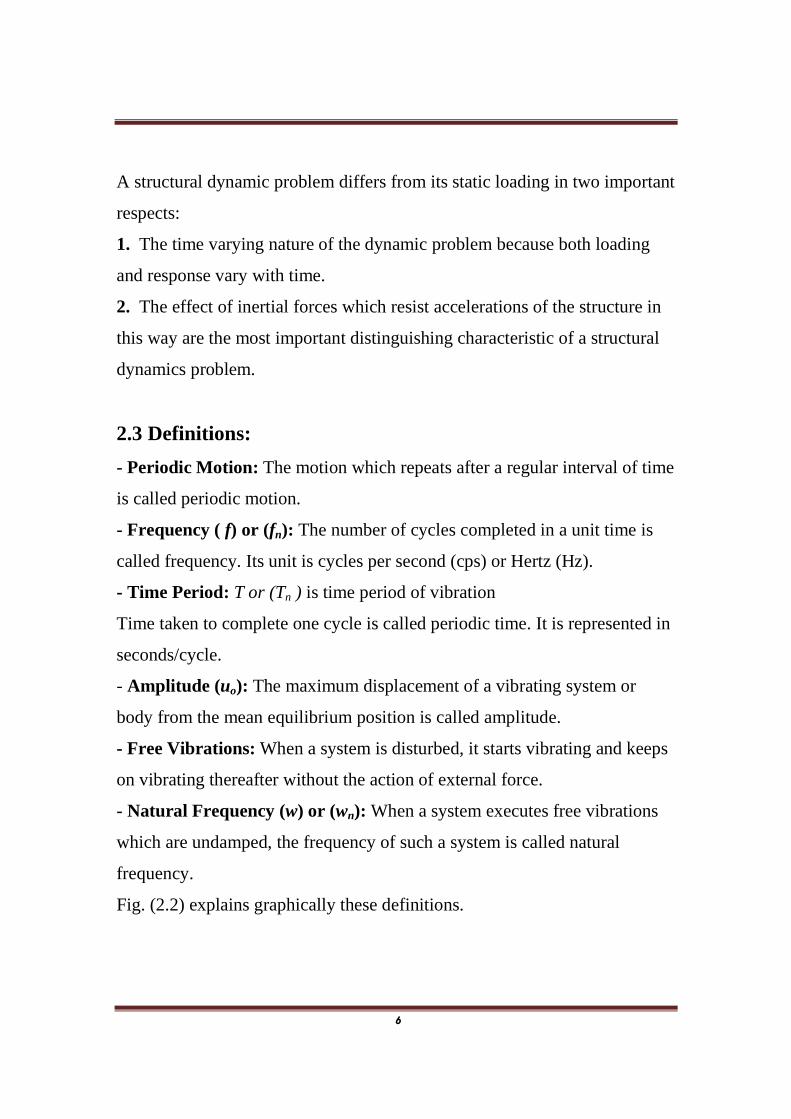
2.3 Definitions:
- Periodic Motion: The motion which repeats after a regular interval of time
is called periodic motion.
- Frequency ( f) or (fn): The number of cycles completed in a unit time is
called frequency. Its unit is cycles per second (cps) or Hertz (Hz).
- Time Period: T or (Tn ) is time period of vibration
Time taken to complete one cycle is called periodic time. It is represented in
seconds/cycle.
- Amplitude (uo): The maximum displacement of a vibrating system or
body from the mean equilibrium position is called amplitude.
- Free Vibrations: When a system is disturbed, it starts vibrating and keeps
on vibrating thereafter without the action of external force.
- Natural Frequency (w) or (wn): When a system executes free vibrations
which are undamped, the frequency of such a system is called natural
frequency.
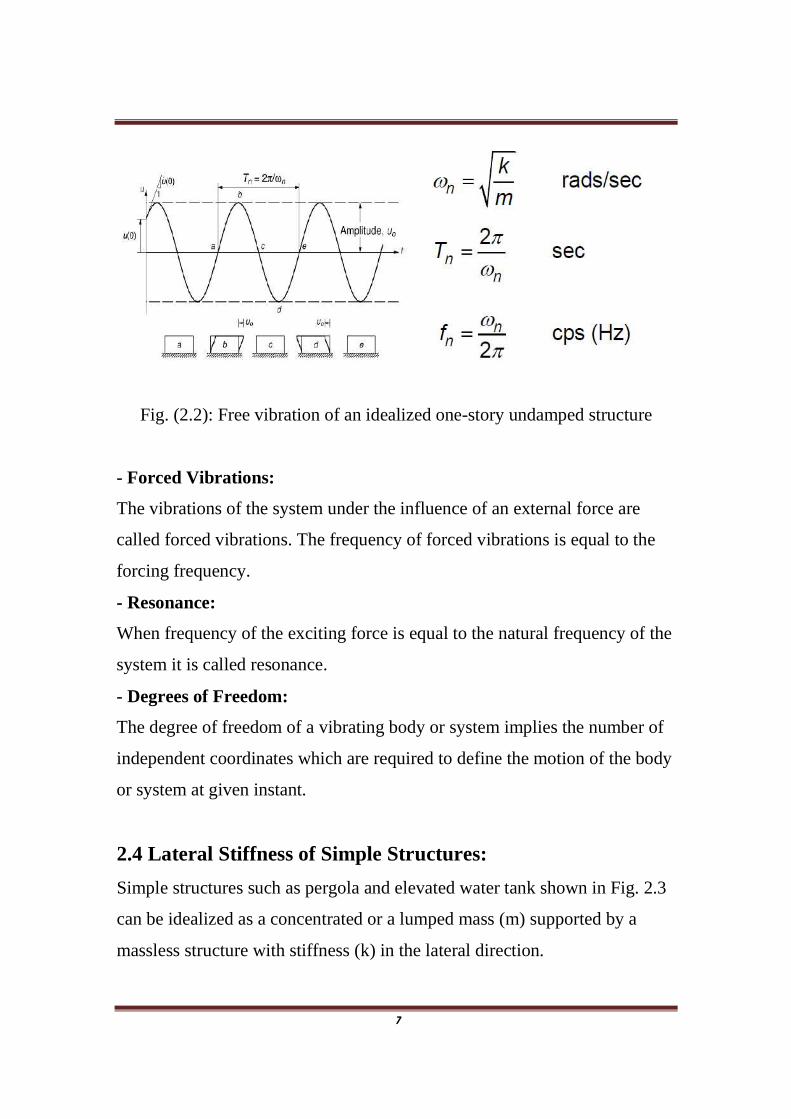
Fig. (2.2) explains graphically these definitions.
7
Fig. (2.2): Free vibration of an idealized one-story undamped structure
- Forced Vibrations:
The vibrations of the system under the influence of an external force are
called forced vibrations. The frequency of forced vibrations is equal to the
forcing frequency.
- Resonance:
When frequency of the exciting force is equal to the natural frequency of the
system it is called resonance.
- Degrees of Freedom:
The degree of freedom of a vibrating body or system implies the number of
independent coordinates which are required to define the motion of the body
or system at given instant.
2.4 Lateral Stiffness of Simple Structures:
Simple structures such as pergola and elevated water tank shown in Fig. 2.3
can be idealized as a concentrated or a lumped mass (m) supported by a
massless structure with stiffness (k) in the lateral direction.
8
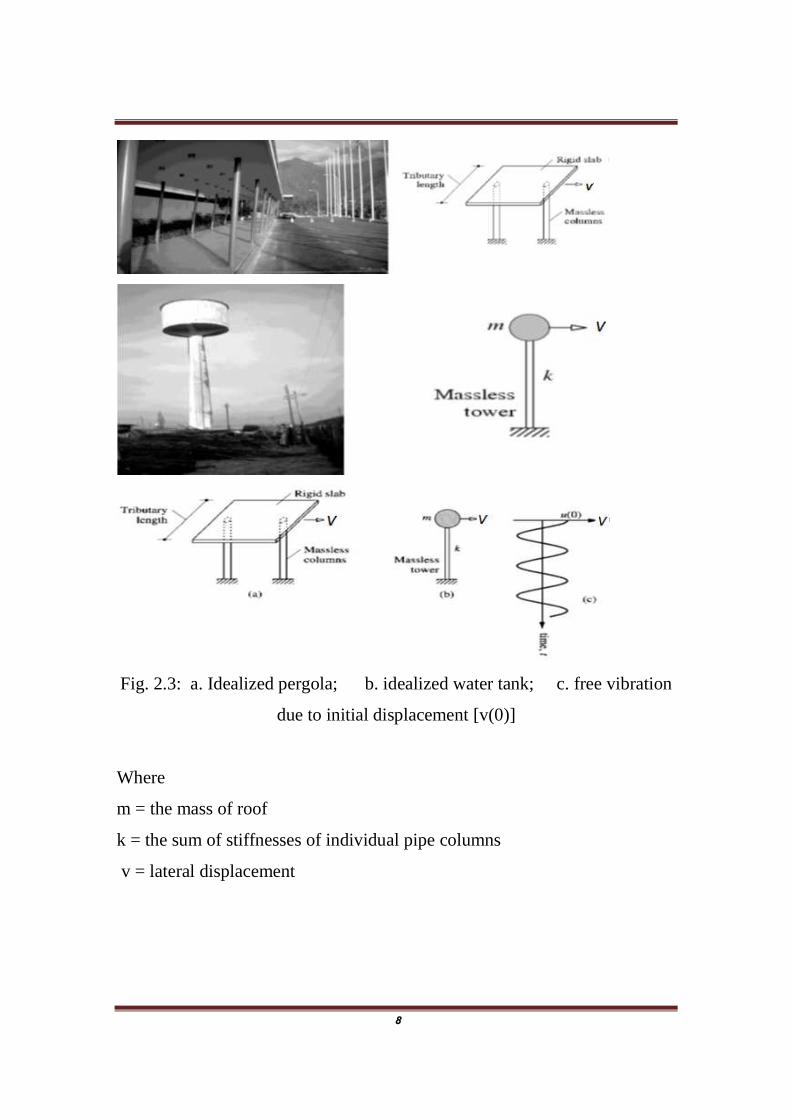
Fig. 2.3: a. Idealized pergola; b. idealized water tank; c. free vibration
due to initial displacement [v(0)]
Where
m = the mass of roof
k = the sum of stiffnesses of individual pipe columns
v = lateral displacement
9
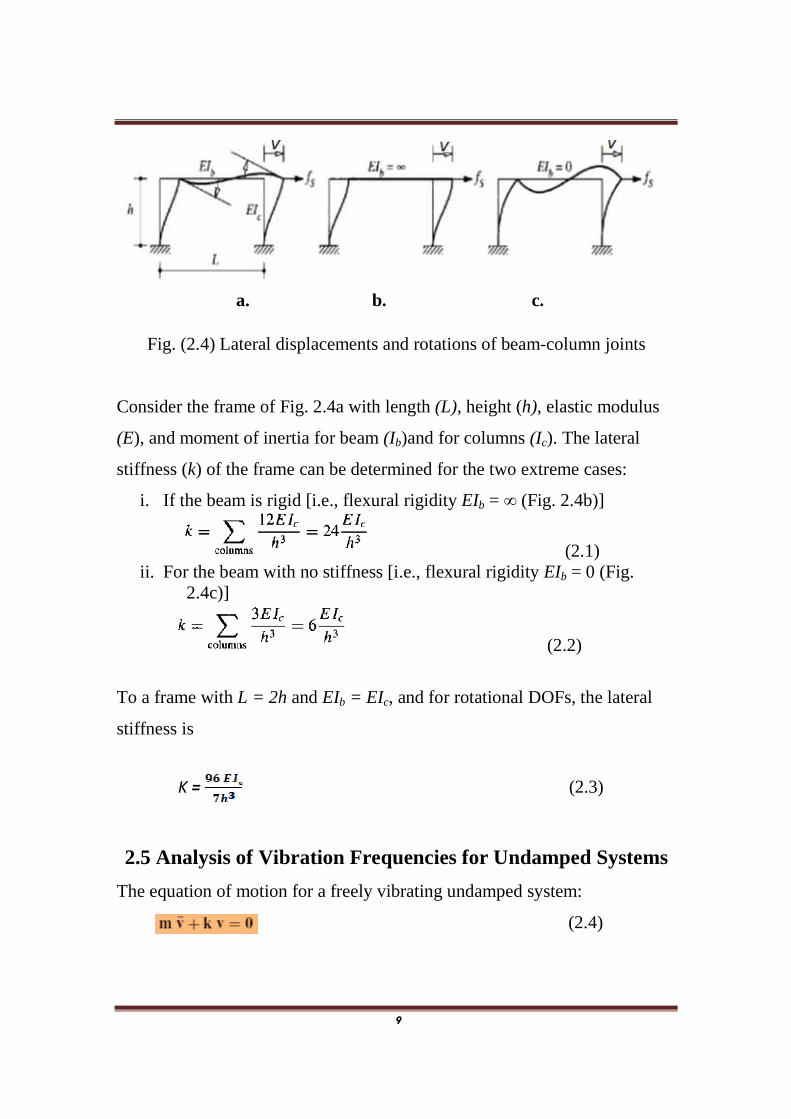
a. b. c.
Fig. (2.4) Lateral displacements and rotations of beam-column joints
Consider the frame of Fig. 2.4a with length (L), height (h), elastic modulus
(E), and moment of inertia for beam (Ib)and for columns (Ic). The lateral
stiffness (k) of the frame can be determined for the two extreme cases:
i. If the beam is rigid [i.e., flexural rigidity EIb = ∞ (Fig. 2.4b)]
(2.1) ii. For the beam with no stiffness [i.e., flexural rigidity EIb = 0 (Fig.
2.4c)]
(2.2)
To a frame with L = 2h and EIb = EIc, and for rotational DOFs, the lateral
stiffness is
K = (2.3)
2.5 Analysis of Vibration Frequencies for Undamped Systems
The equation of motion for a freely vibrating undamped system:
(2.4)
10
In which 0 is a zero vector. Since it is simple harmonic equation (2.4) may
be expressed for a MDOF system as
(2.5)
= shape of the system, = phase angle.
Taking the second time derivative for equation (2.5), the accelerations in
free vibrations are
(2.6)
Substituting equation (2.5) and (2.6) into equation (2.4) gives
Which (Since the sine term is arbitrary and may be omitted) may be written
(2.7)
By Cramer's rule the solution of this set of simultaneous equation is
(2.8)
Hence a nontrivial solution is possible only when the denominator
determinant vanishes. In other words, finite-amplitude free vibrations are
possible only when
(2.9)
Equation (2.9) is called the frequency equation of the system.
The vector made up of the entire set of modal frequencies, arranged in
sequence, is called frequency vector (w).
Earthquake Engineering
2.6 Definition:
An earthquake is manifested as ground shaking caused by the sudden release
of energy in earth's crust.
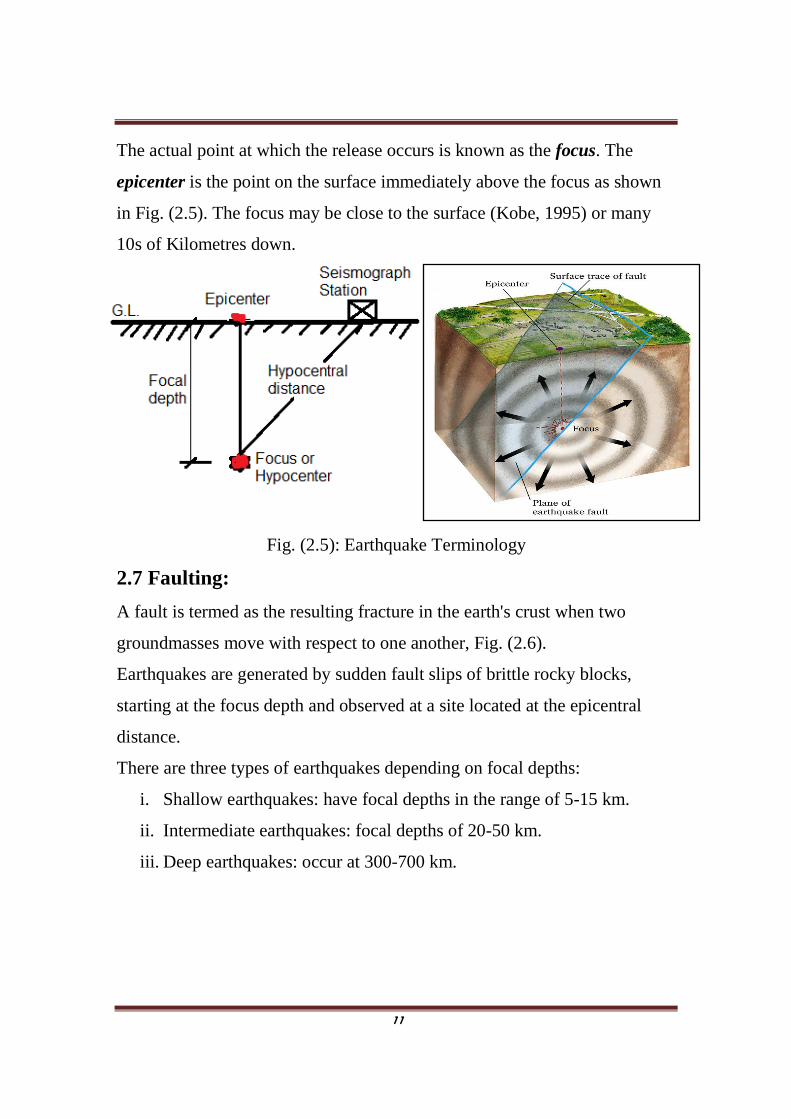
11
The actual point at which the release occurs is known as the focus. The
epicenter is the point on the surface immediately above the focus as shown
in Fig. (2.5). The focus may be close to the surface (Kobe, 1995) or many
10s of Kilometres down.
Fig. (2.5): Earthquake Terminology
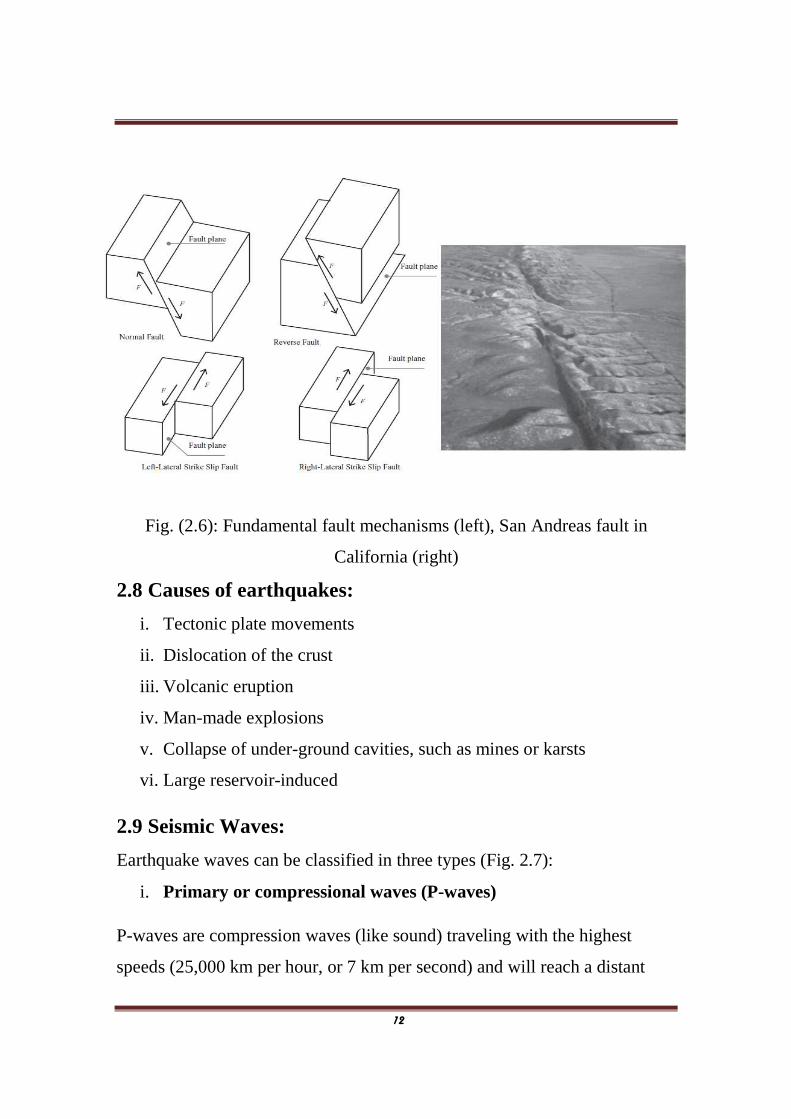
2.7 Faulting:
A fault is termed as the resulting fracture in the earth's crust when two
groundmasses move with respect to one another, Fig. (2.6).
Earthquakes are generated by sudden fault slips of brittle rocky blocks,
starting at the focus depth and observed at a site located at the epicentral
distance.
There are three types of earthquakes depending on focal depths:
i. Shallow earthquakes: have focal depths in the range of 5-15 km.
ii. Intermediate earthquakes: focal depths of 20-50 km.
iii. Deep earthquakes: occur at 300-700 km.
12
Fig. (2.6): Fundamental fault mechanisms (left), San Andreas fault in
California (right)
2.8 Causes of earthquakes:
i. Tectonic plate movements
ii. Dislocation of the crust
iii. Volcanic eruption
iv. Man-made explosions
v. Collapse of under-ground cavities, such as mines or karsts
vi. Large reservoir-induced
2.9 Seismic Waves:
Earthquake waves can be classified in three types (Fig. 2.7):
i. Primary or compressional waves (P-waves)
P-waves are compression waves (like sound) traveling with the highest
speeds (25,000 km per hour, or 7 km per second) and will reach a distant
13
observer first. They push rocks and vibrate backwards and forwards and can
travel through liquids.
ii. Shear or secondary waves (S-waves)
S-waves travel at about 13000 km per hour or 3.6 km per second reaching
after P-waves.S waves are characterized by a sideways movement. The rock
materials are moved from side to side as the wave passes, moving at right
angles to the direction of wave motion.
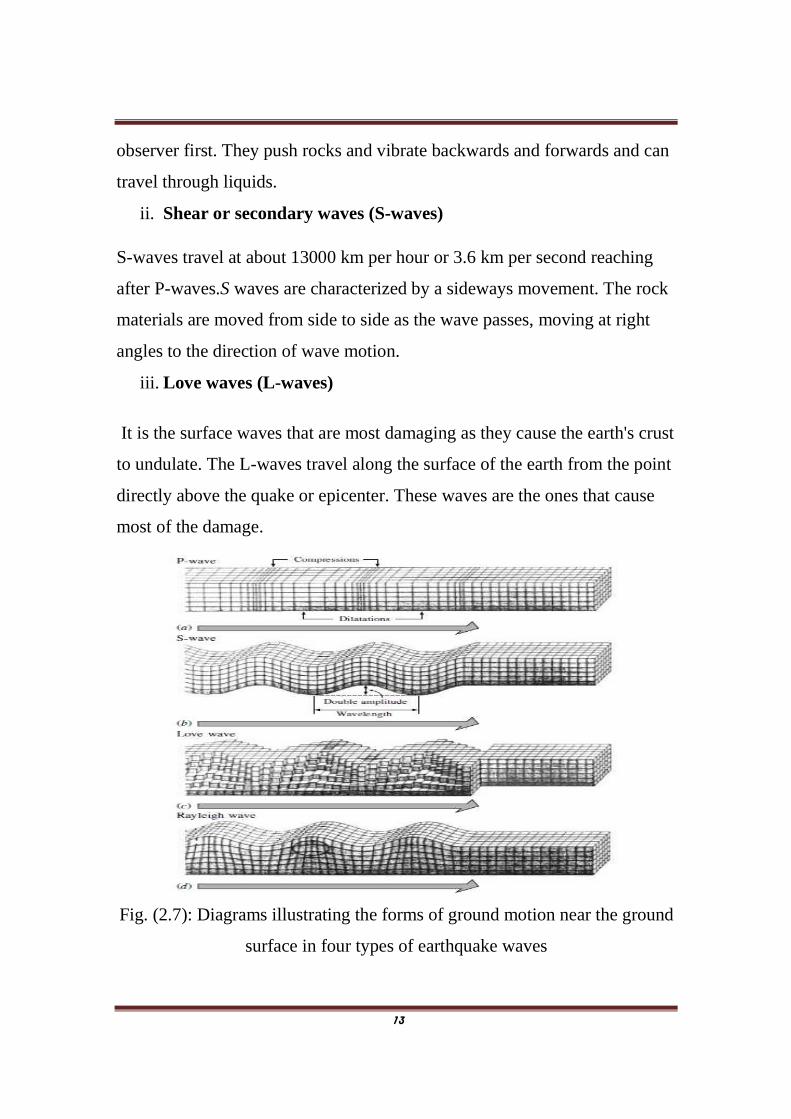
iii. Love waves (L-waves)
It is the surface waves that are most damaging as they cause the earth's crust
to undulate. The L-waves travel along the surface of the earth from the point
directly above the quake or epicenter. These waves are the ones that cause
most of the damage.
Fig. (2.7): Diagrams illustrating the forms of ground motion near the ground
surface in four types of earthquake waves
14
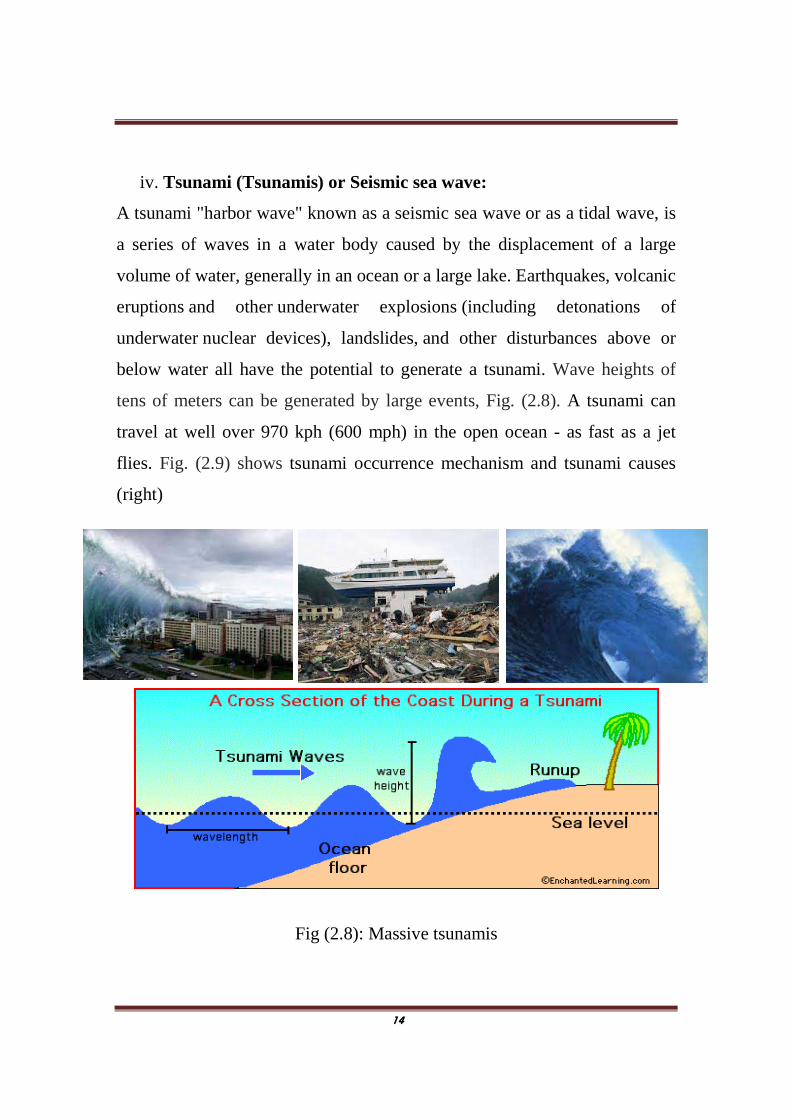
iv. Tsunami (Tsunamis) or Seismic sea wave:
A tsunami "harbor wave" known as a seismic sea wave or as a tidal wave, is
a series of waves in a water body caused by the displacement of a large
volume of water, generally in an ocean or a large lake. Earthquakes, volcanic
eruptions and other underwater explosions (including detonations of
underwater nuclear devices), landslides, and other disturbances above or
below water all have the potential to generate a tsunami. Wave heights of
tens of meters can be generated by large events, Fig. (2.8). A tsunami can
travel at well over 970 kph (600 mph) in the open ocean - as fast as a jet
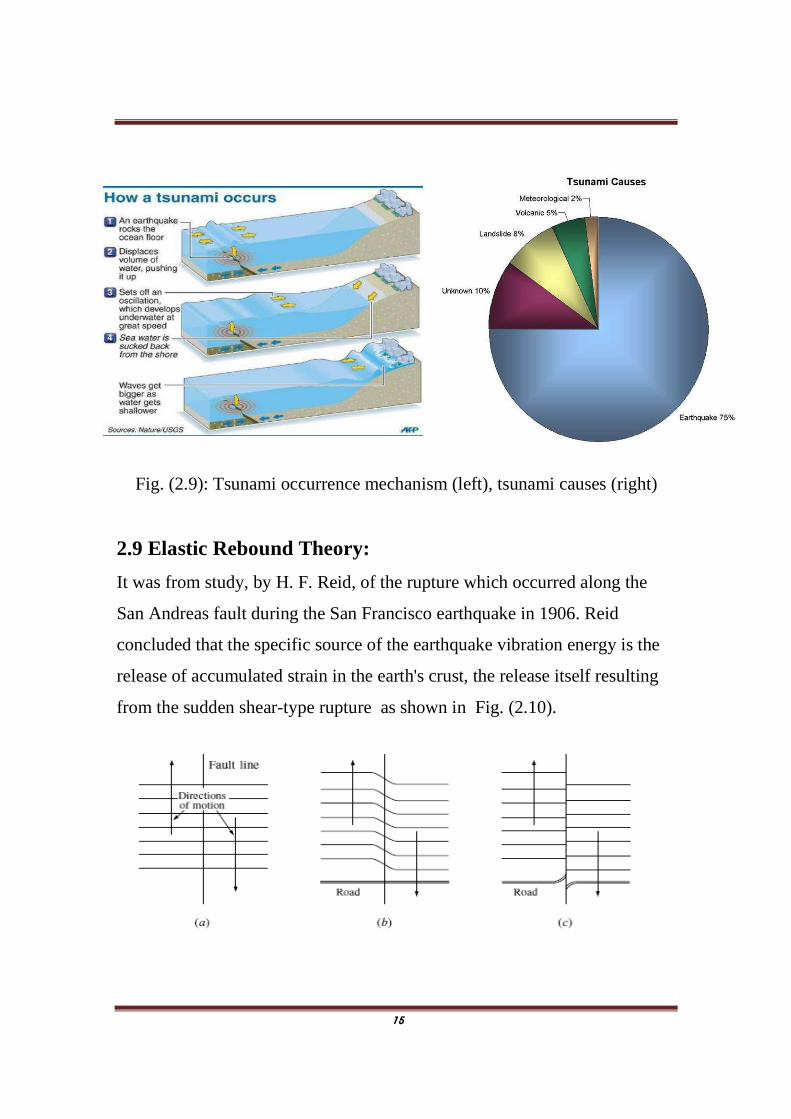
flies. Fig. (2.9) shows tsunami occurrence mechanism and tsunami causes
(right)
Fig (2.8): Massive tsunamis
15
Fig. (2.9): Tsunami occurrence mechanism (left), tsunami causes (right)
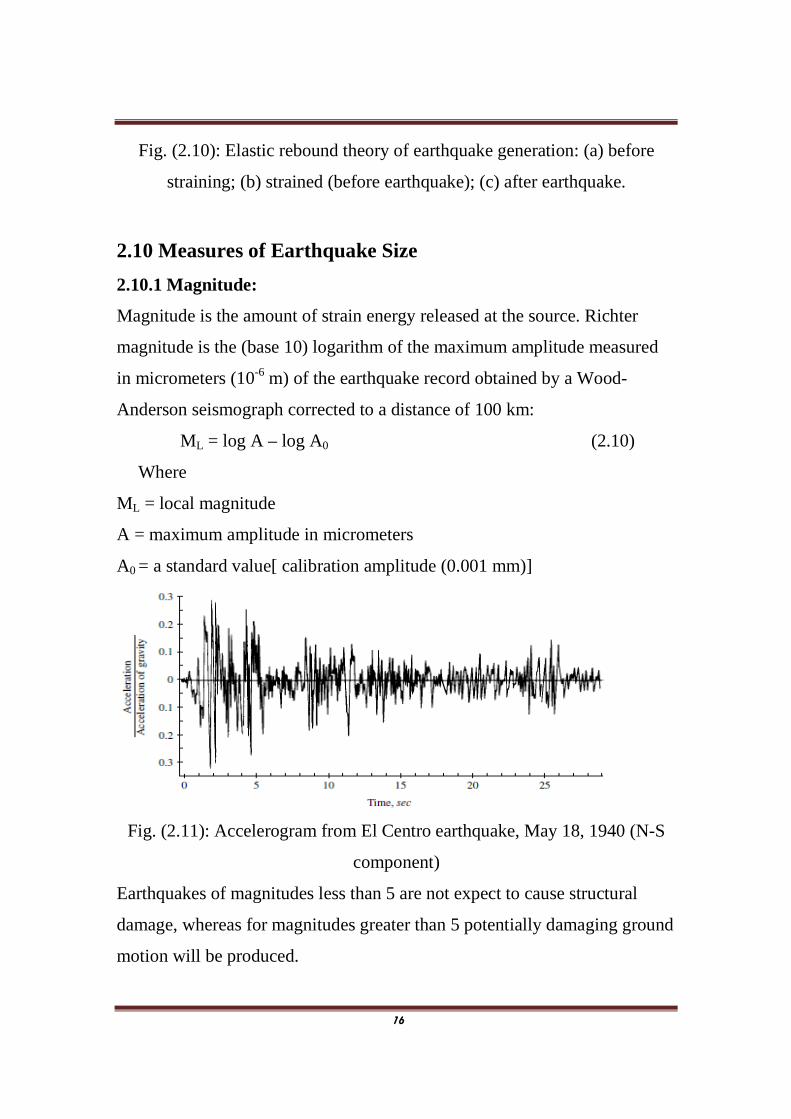
2.9 Elastic Rebound Theory:
It was from study, by H. F. Reid, of the rupture which occurred along the
San Andreas fault during the San Francisco earthquake in 1906. Reid
concluded that the specific source of the earthquake vibration energy is the
release of accumulated strain in the earth's crust, the release itself resulting
from the sudden shear-type rupture as shown in Fig. (2.10).
16
Fig. (2.10): Elastic rebound theory of earthquake generation: (a) before
straining; (b) strained (before earthquake); (c) after earthquake.
2.10 Measures of Earthquake Size
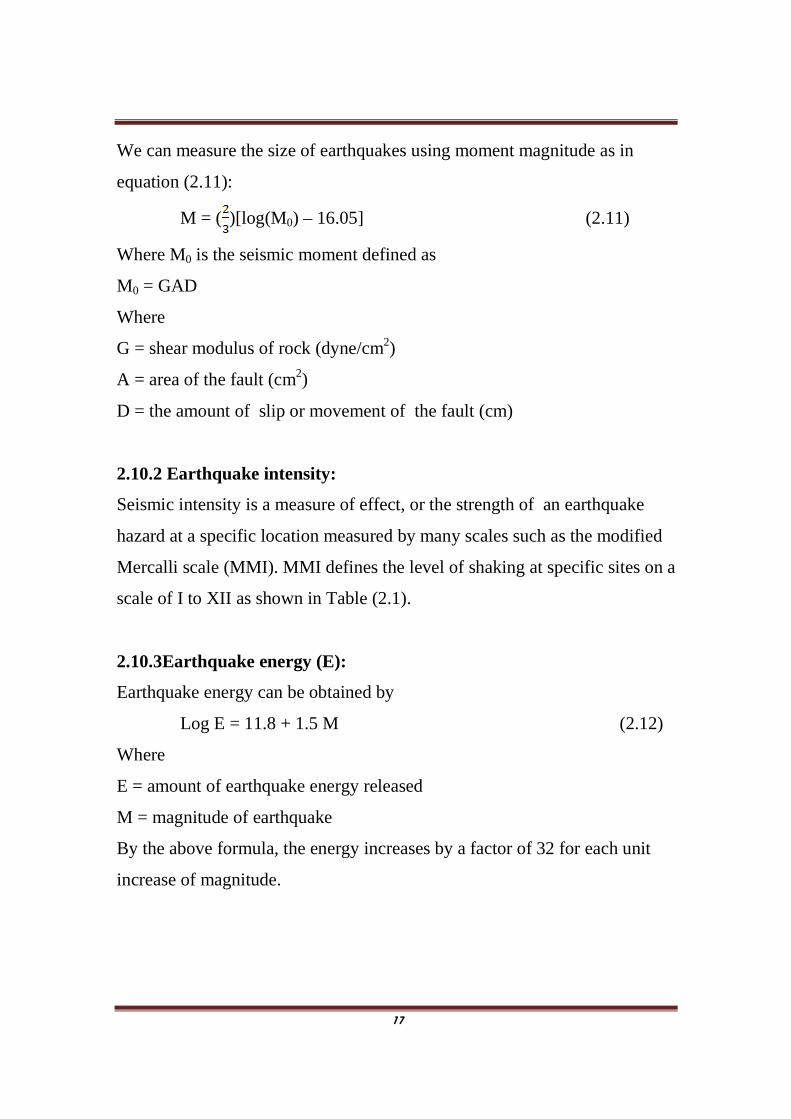
2.10.1 Magnitude:
Magnitude is the amount of strain energy released at the source. Richter
magnitude is the (base 10) logarithm of the maximum amplitude measured
in micrometers (10-6 m) of the earthquake record obtained by a Wood-
Anderson seismograph corrected to a distance of 100 km:
ML = log A – log A0 (2.10)
Where
ML = local magnitude
A = maximum amplitude in micrometers
A0 = a standard value[ calibration amplitude (0.001 mm)]
Fig. (2.11): Accelerogram from El Centro earthquake, May 18, 1940 (N-S
component)
Earthquakes of magnitudes less than 5 are not expect to cause structural
damage, whereas for magnitudes greater than 5 potentially damaging ground
motion will be produced.
17
We can measure the size of earthquakes using moment magnitude as in
equation (2.11):
M = ()[log(M0) – 16.05] (2.11)
Where M0 is the seismic moment defined as
M0 = GAD
Where
G = shear modulus of rock (dyne/cm2)
A = area of the fault (cm2)
D = the amount of slip or movement of the fault (cm)
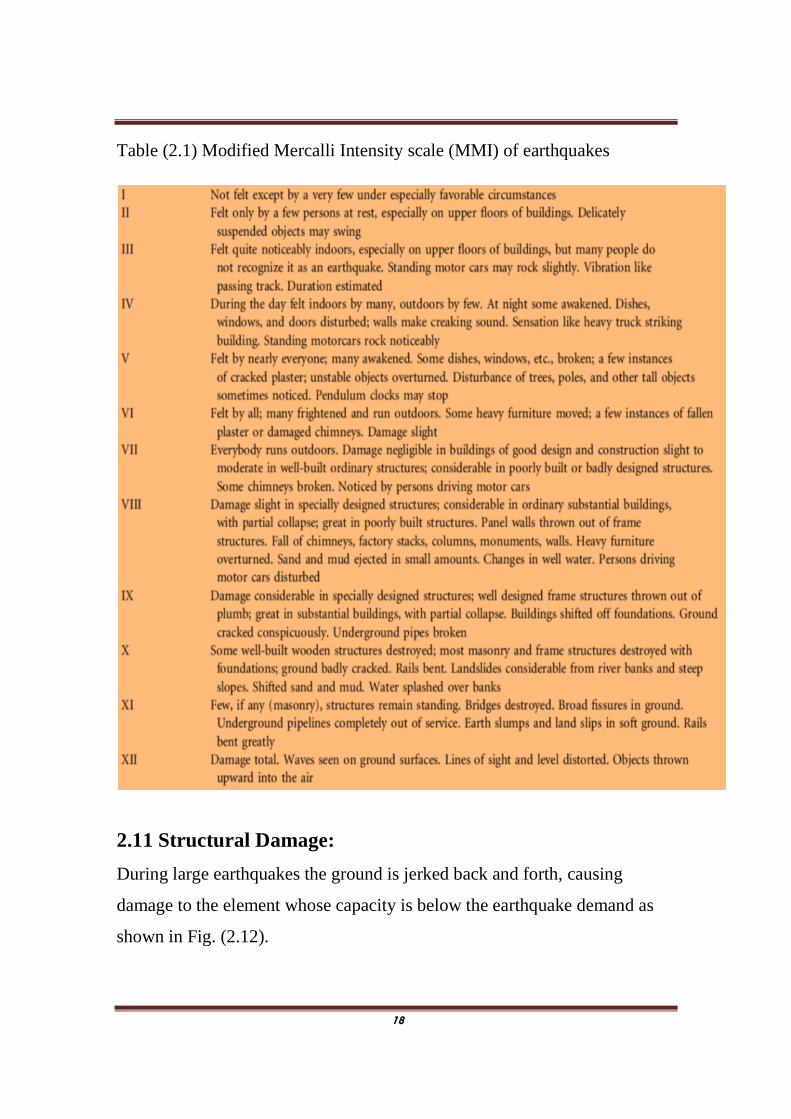
2.10.2 Earthquake intensity:
Seismic intensity is a measure of effect, or the strength of an earthquake
hazard at a specific location measured by many scales such as the modified
Mercalli scale (MMI). MMI defines the level of shaking at specific sites on a
scale of I to XII as shown in Table (2.1).
2.10.3Earthquake energy (E):
Earthquake energy can be obtained by
Log E = 11.8 + 1.5 M (2.12)
Where
E = amount of earthquake energy released
M = magnitude of earthquake
By the above formula, the energy increases by a factor of 32 for each unit
increase of magnitude.
18
Table (2.1) Modified Mercalli Intensity scale (MMI) of earthquakes
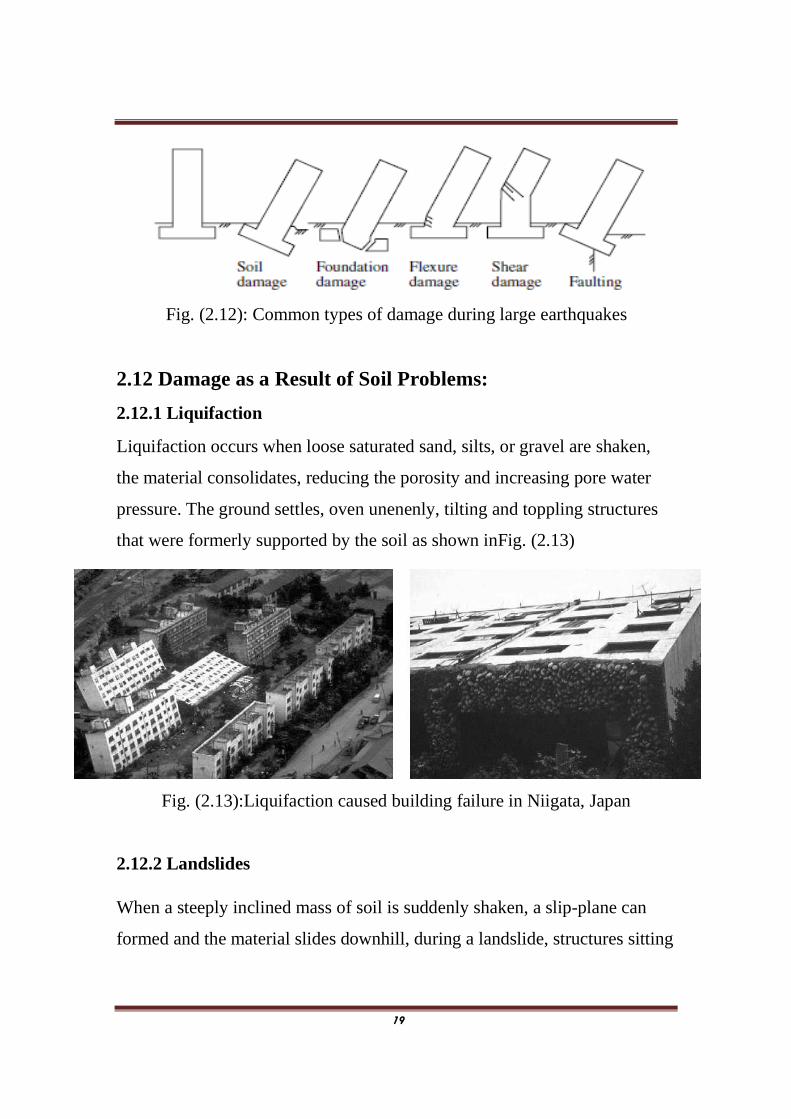
2.11 Structural Damage:
During large earthquakes the ground is jerked back and forth, causing
damage to the element whose capacity is below the earthquake demand as
shown in Fig. (2.12).
19
Fig. (2.12): Common types of damage during large earthquakes
2.12 Damage as a Result of Soil Problems:
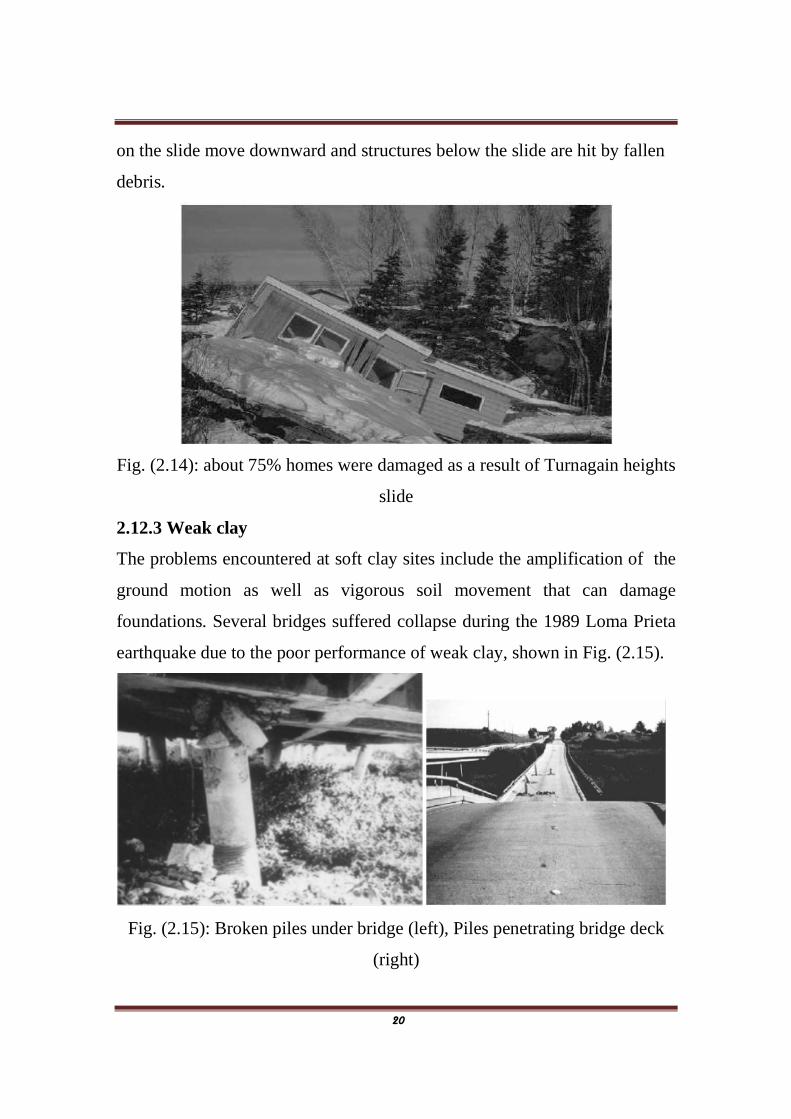
2.12.1 Liquifaction
Liquifaction occurs when loose saturated sand, silts, or gravel are shaken,
the material consolidates, reducing the porosity and increasing pore water
pressure. The ground settles, oven unenenly, tilting and toppling structures
that were formerly supported by the soil as shown inFig. (2.13)
Fig. (2.13):Liquifaction caused building failure in Niigata, Japan
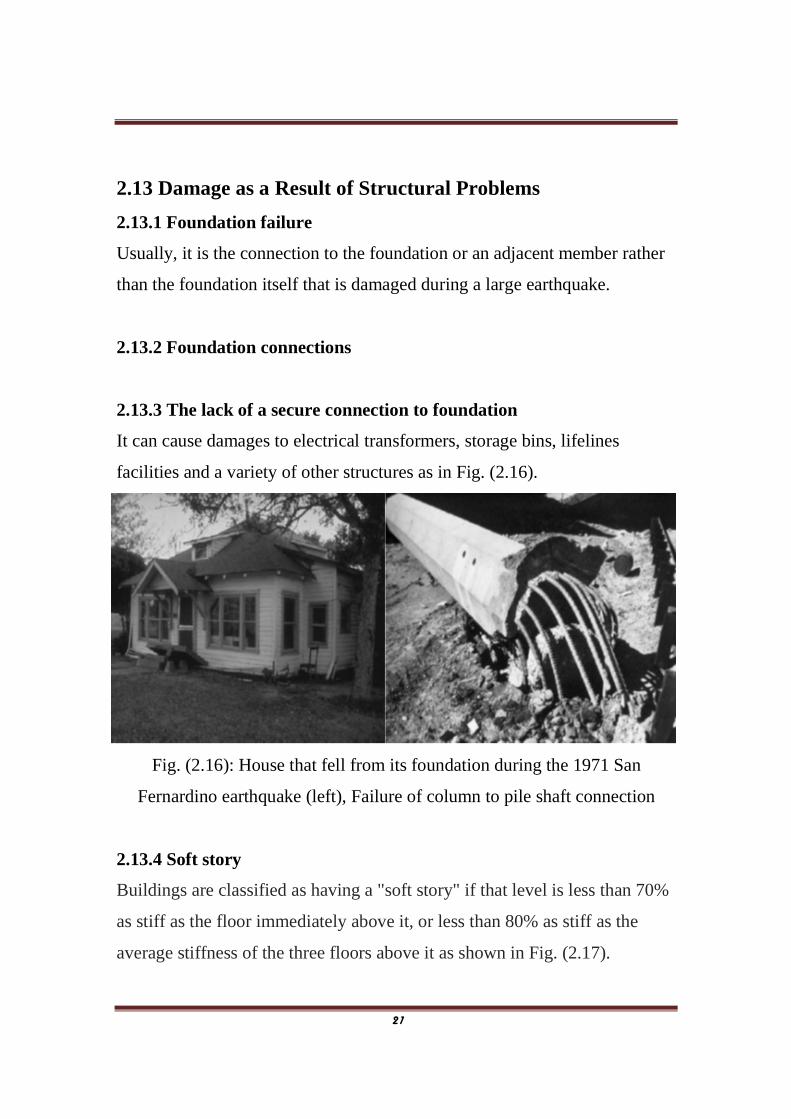
2.12.2 Landslides
When a steeply inclined mass of soil is suddenly shaken, a slip-plane can
formed and the material slides downhill, during a landslide, structures sitting
20
on the slide move downward and structures below the slide are hit by fallen
debris.
Fig. (2.14): about 75% homes were damaged as a result of Turnagain heights
slide
2.12.3 Weak clay
The problems encountered at soft clay sites include the amplification of the
ground motion as well as vigorous soil movement that can damage
foundations. Several bridges suffered collapse during the 1989 Loma Prieta
earthquake due to the poor performance of weak clay, shown in Fig. (2.15).
Fig. (2.15): Broken piles under bridge (left), Piles penetrating bridge deck
(right)
21
2.13 Damage as a Result of Structural Problems
2.13.1 Foundation failure
Usually, it is the connection to the foundation or an adjacent member rather
than the foundation itself that is damaged during a large earthquake.
2.13.2 Foundation connections
2.13.3 The lack of a secure connection to foundation
It can cause damages to electrical transformers, storage bins, lifelines
facilities and a variety of other structures as in Fig. (2.16).
Fig. (2.16): House that fell from its foundation during the 1971 San
Fernardino earthquake (left), Failure of column to pile shaft connection
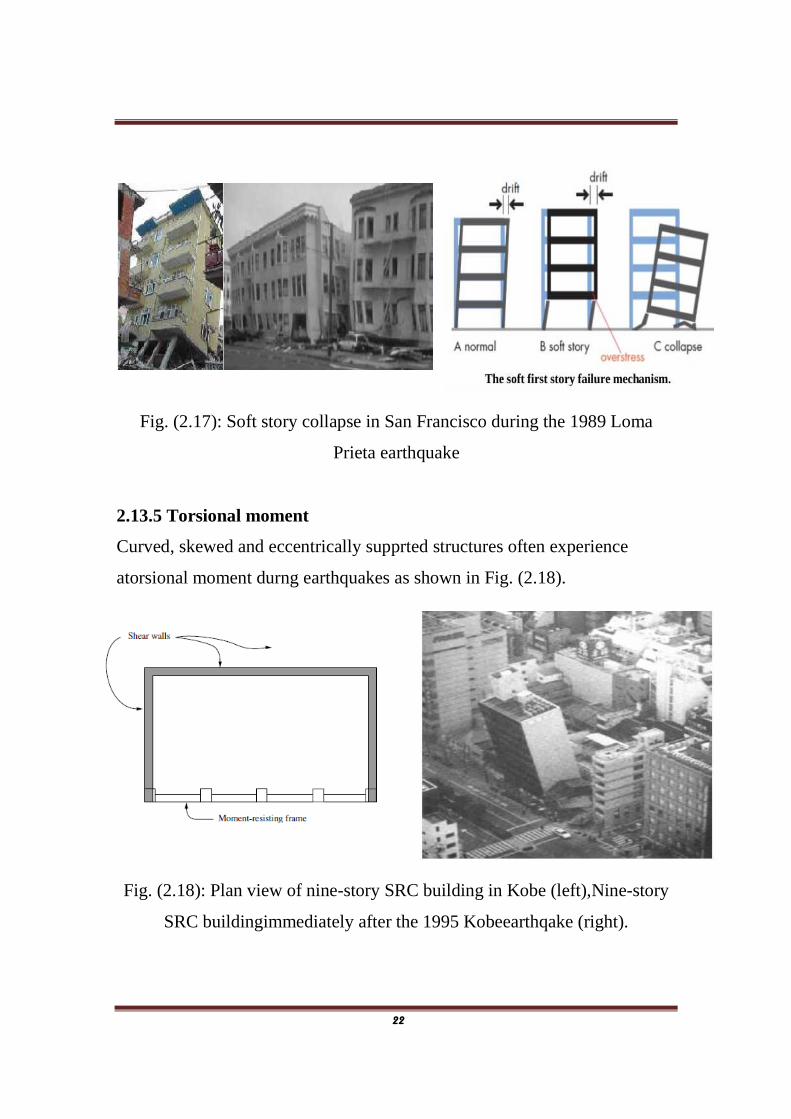
2.13.4 Soft story
Buildings are classified as having a "soft story" if that level is less than 70%
as stiff as the floor immediately above it, or less than 80% as stiff as the
average stiffness of the three floors above it as shown in Fig. (2.17).
22
Fig. (2.17): Soft story collapse in San Francisco during the 1989 Loma
Prieta earthquake
2.13.5 Torsional moment
Curved, skewed and eccentrically supprted structures often experience
atorsional moment durng earthquakes as shown in Fig. (2.18).
Fig. (2.18): Plan view of nine-story SRC building in Kobe (left),Nine-story
SRC buildingimmediately after the 1995 Kobeearthqake (right).
23
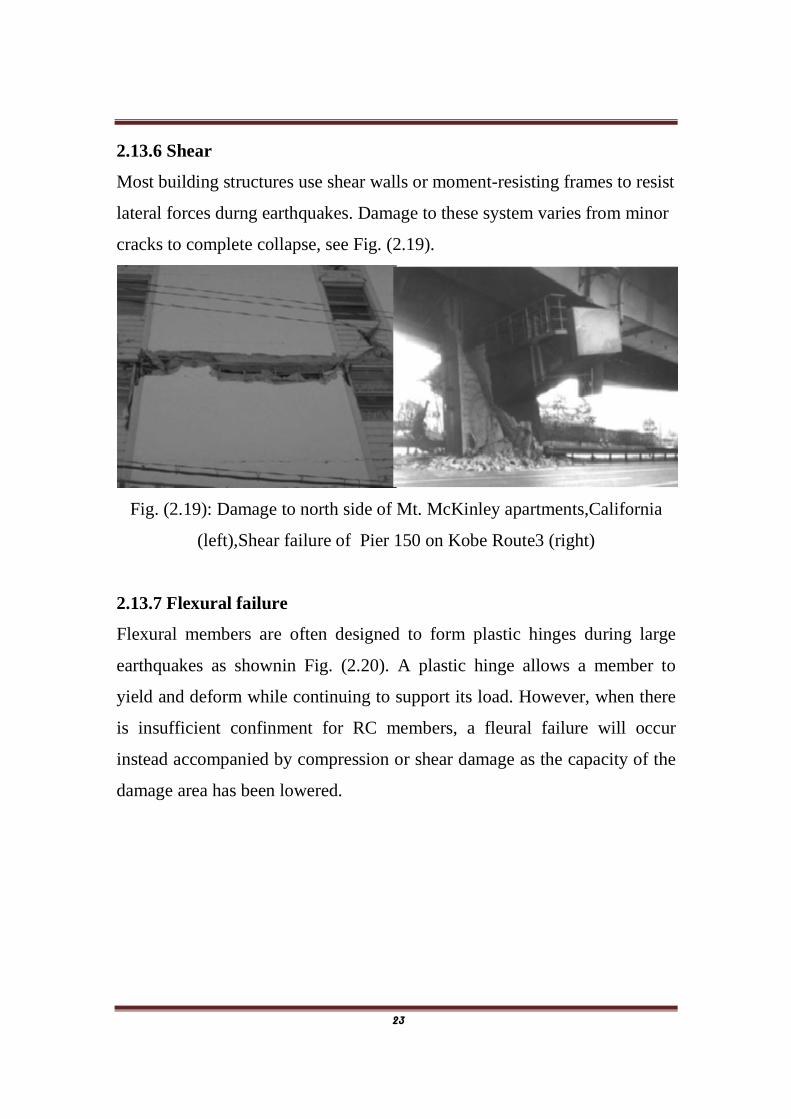
2.13.6 Shear
Most building structures use shear walls or moment-resisting frames to resist
lateral forces durng earthquakes. Damage to these system varies from minor
cracks to complete collapse, see Fig. (2.19).
Fig. (2.19): Damage to north side of Mt. McKinley apartments,California
(left),Shear failure of Pier 150 on Kobe Route3 (right)
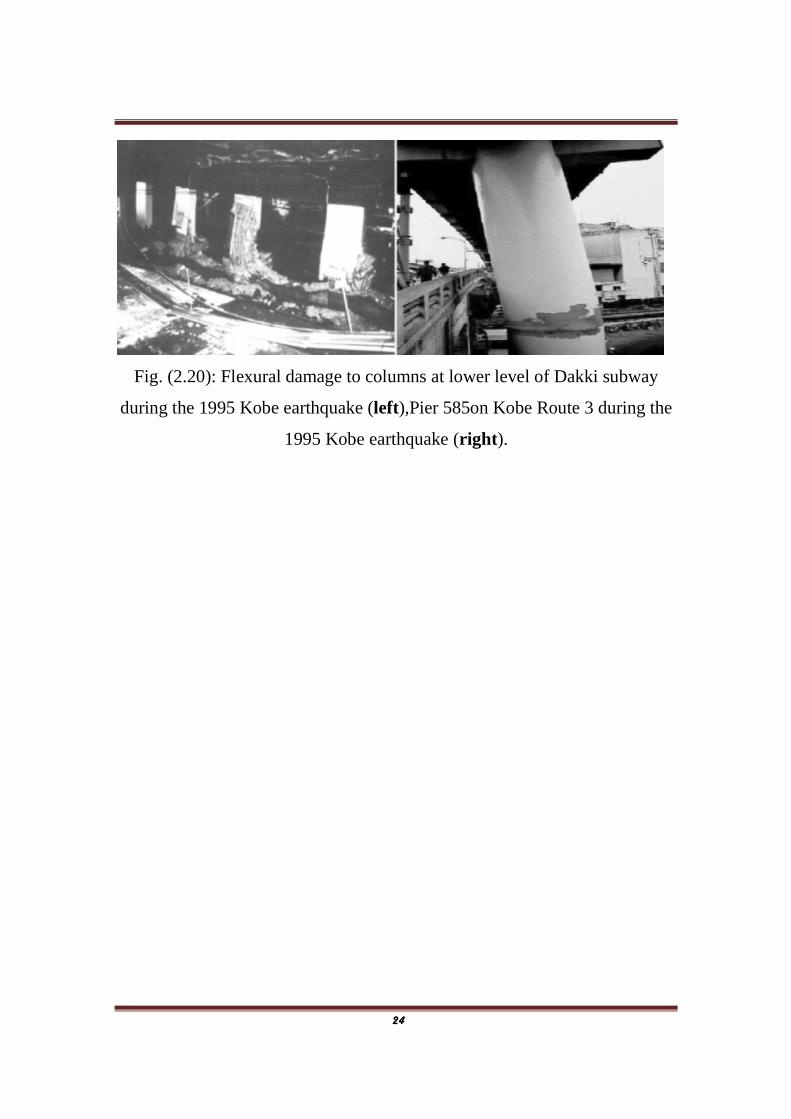
2.13.7 Flexural failure
Flexural members are often designed to form plastic hinges during large
earthquakes as shownin Fig. (2.20). A plastic hinge allows a member to
yield and deform while continuing to support its load. However, when there
is insufficient confinment for RC members, a fleural failure will occur
instead accompanied by compression or shear damage as the capacity of the
damage area has been lowered.
24
Fig. (2.20): Flexural damage to columns at lower level of Dakki subway
during the 1995 Kobe earthquake (left),Pier 585on Kobe Route 3 during the
1995 Kobe earthquake (right).
25
Chapter Three
Part One
SEISMIC ACTIVITIES IN JAZAN AREA
3.1 Location of Jazan
Jizan, or more properly Jazan, was known in ancient times as Almikhlaf
Alsulimani. Jazan is located on the southwest corner of Saudi Arabia on the
coast of the Red Sea and directly north of the border with Yemen. Jazan City
lies in an active zone of earthquakes classified as zone 2B with maximum
applied horizontal acceleration of 0.2g.Saudi Arabia is divided into 25
zones, each zone having its specific building code covering not only seismic
activity but other criteria as well.”
3.2 Jazan Region and its Importance
The Province of Jazan lies in the south west section of the Kingdom of Saudi
Arabia. It has a population of approximately 1,365,110 at the 2010 census
and covers an area of 40,000 km2 including some 5,000 villages and cities.
Jizan, is home to the Port of Jizan, Saudi Arabia’s third most important port
on the Red Sea. It stretches some 300 km along the southern Red Sea coast,
just north of Yemen. The region includes over 100 islands in the Red Sea.
The Farasan Islands, Saudi Arabia’s first protected wildlife area, is home to
the endangered Arabian gazelle and, in winter, receives migratory birds from
Europe.
The region is subdivided into 14 governorates as shown in Table (3.1)
26
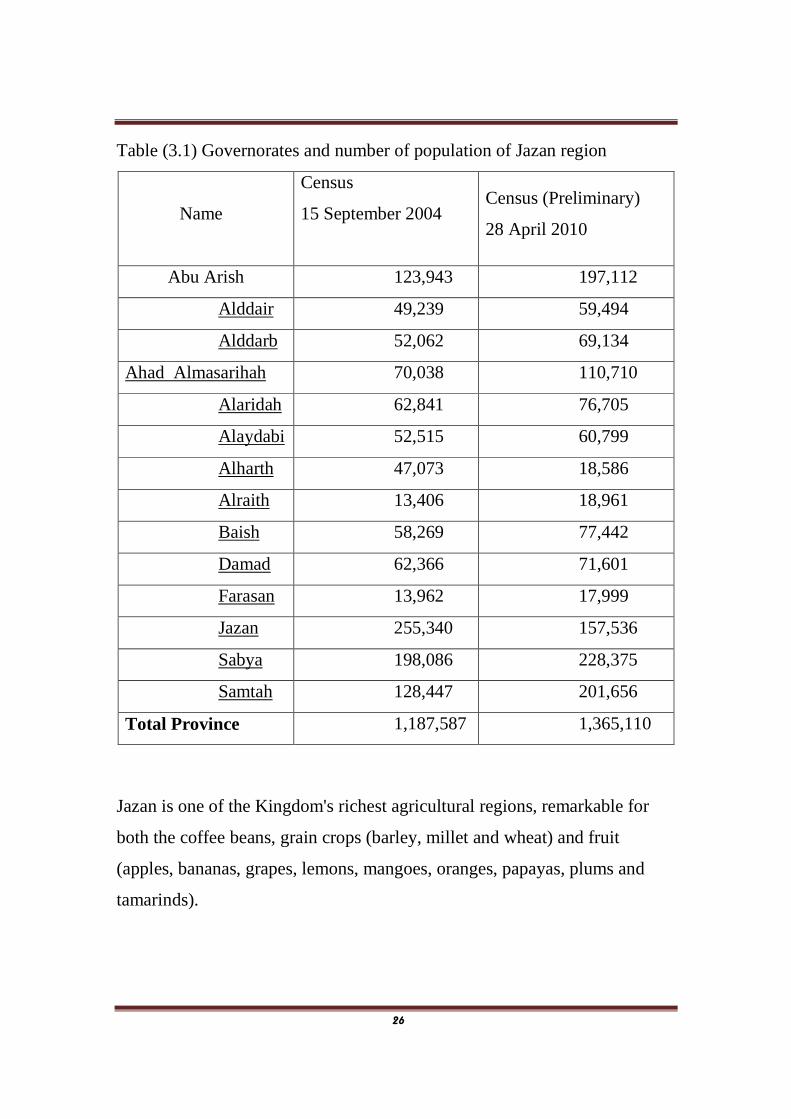
Table (3.1) Governorates and number of population of Jazan region
Name
Census
15 September 2004
Census (Preliminary)
28 April 2010
Abu Arish 123,943 197,112
Alddair 49,239 59,494
Alddarb 52,062 69,134
Ahad Almasarihah 70,038 110,710
Alaridah 62,841 76,705
Alaydabi 52,515 60,799
Alharth 47,073 18,586
Alraith 13,406 18,961
Baish 58,269 77,442
Damad 62,366 71,601
Farasan 13,962 17,999
Jazan 255,340 157,536
Sabya 198,086 228,375
Samtah 128,447 201,656
Total Province 1,187,587 1,365,110
Jazan is one of the Kingdom's richest agricultural regions, remarkable for
both the coffee beans, grain crops (barley, millet and wheat) and fruit
(apples, bananas, grapes, lemons, mangoes, oranges, papayas, plums and
tamarinds).

27
Jazan Economic City: is an economic city in the Jizan Province of the
Kingdom of Saudi Arabia, with a focus on the energy and manufacturing
industries. Arab News reported in January 2011 that when the city is
completed, an estimated 500,000 new jobs will be created. Jazan Economic
City focuses on four areas: heavy industries, secondary industries, human
capital and lifestyle. The proposed city will provide an environment for key
industries, technology exchanges, commerce and trade, employment
opportunities, education and training, housing and a broad spectrum of
socio-economic activities for a projected population of 300,000 people.
Jazan University is located at Jazan city with its campuses at Jazan, Sabya,
Abu Arish, Samtah, Addarb, Addair, Al Ardhah and Farasan Island. Arrayth
is one of the most beautiful mountains in the south of Saudi Arabia.
3.3 Earthquakes Data Base of the Arabian Peninsula
Recently, there are two independent analog seismic telemetry networks in
Saudi Arabia. The King Saud University (KSU) network was established in
1985 and consists of 30 stations with denser sub-networks in the Gulf of
Aqabah region (12 stations) and the southwestern part of Saudi Arabia (8
stations). A network run by King Abdulaziz City for Science and technology
(KACST) was established in 1993 with 11 short-period stations in the Gulf
of Aqabah and the southwestern part of Saudi Arabia adjacent to the Yemen
border. Saudi Arabia will set up an additional 50 advanced earthquake
monitoring stations. The Kingdom already has 150 earthquake monitoring
stations called the Saudi National Seismic Network (SNSN), and the new
ones will boost the capability by providing precise data collection [14]. Fig.
(3.2) shows the distribution of seismograph stations of Saudi Arabia.

28
Fig. (3.1) Seismograph stations of the Saudi National Seismic Network
3.4 Samples of Earthquakes in Jazan Area
In 2014, a magnitude-5.1 earthquake struck in the southwestern part of the
Kingdom, 50 km northeast of Jazan, at a depth of 10 km followed by 37
aftershocks of magnitudes ranging 0.94 - 5.1 in Richter scale [14].
Its impact was felt by inhabitants in the Asir and Najran regions. Generally,
there were many earthquakes struck Jazan area and north of Yemen in the
years 859, 1121, 1191, 1269, 1481, 1630,1710, 1941, 1947 (of magnitude 6,
killed 1200 of people), 1955, 1982, 1993 (of magnitude 4.8) as shown in
Fig. (1). Earthquakes of magnitude 6 are common along the spreading axis
of the Red Sea but generally they are not felt onshore and appear to pose
little risk to infrastructure.
29
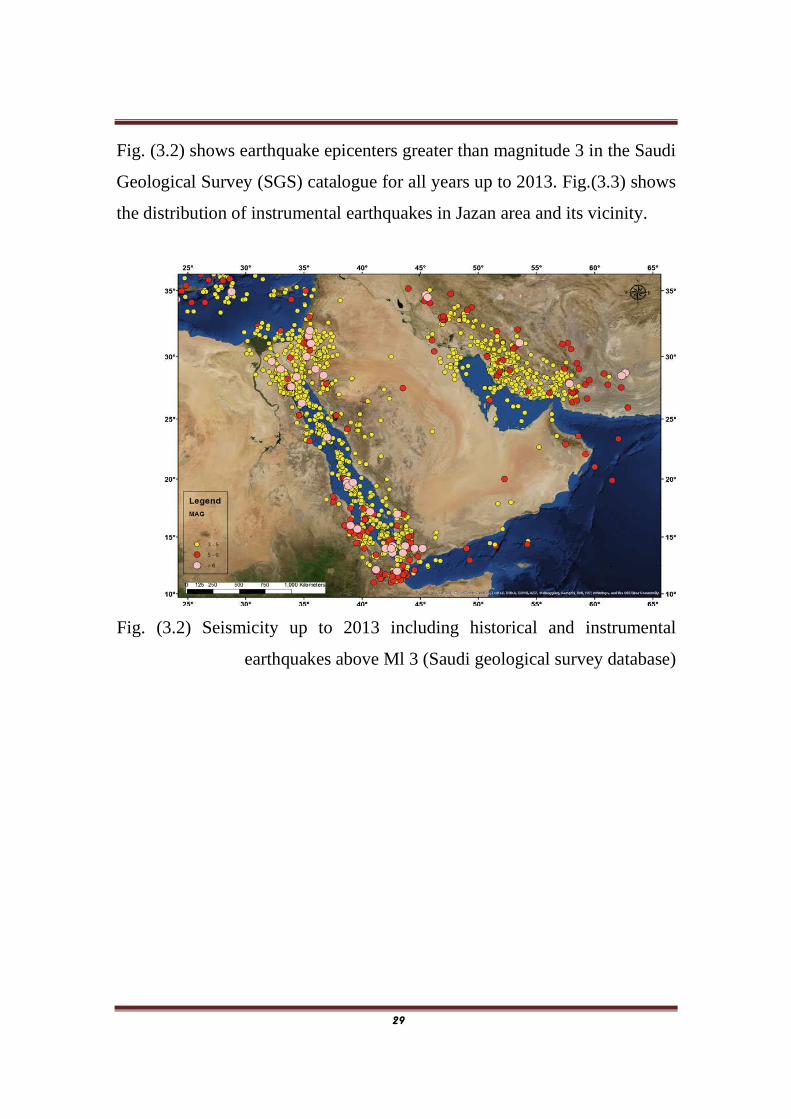
Fig. (3.2) shows earthquake epicenters greater than magnitude 3 in the Saudi
Geological Survey (SGS) catalogue for all years up to 2013. Fig.(3.3) shows
the distribution of instrumental earthquakes in Jazan area and its vicinity.
Fig. (3.2) Seismicity up to 2013 including historical and instrumental
earthquakes above Ml 3 (Saudi geological survey database)
30
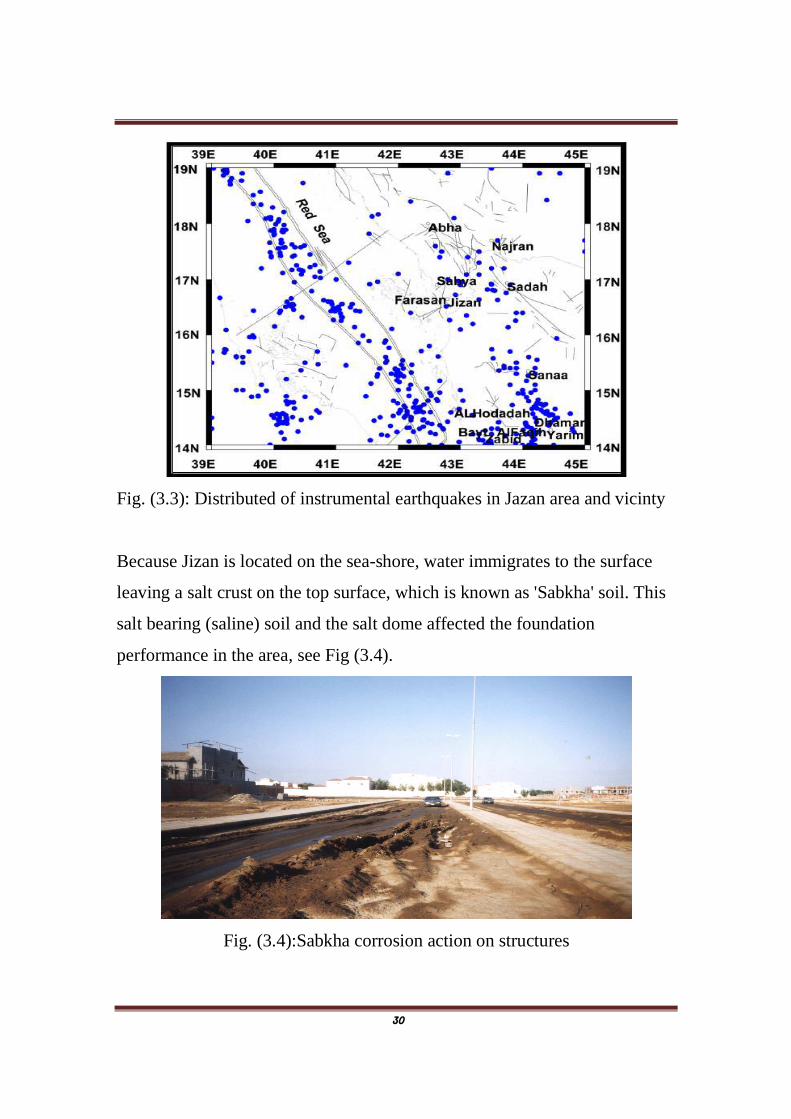
Fig. (3.3): Distributed of instrumental earthquakes in Jazan area and vicinty
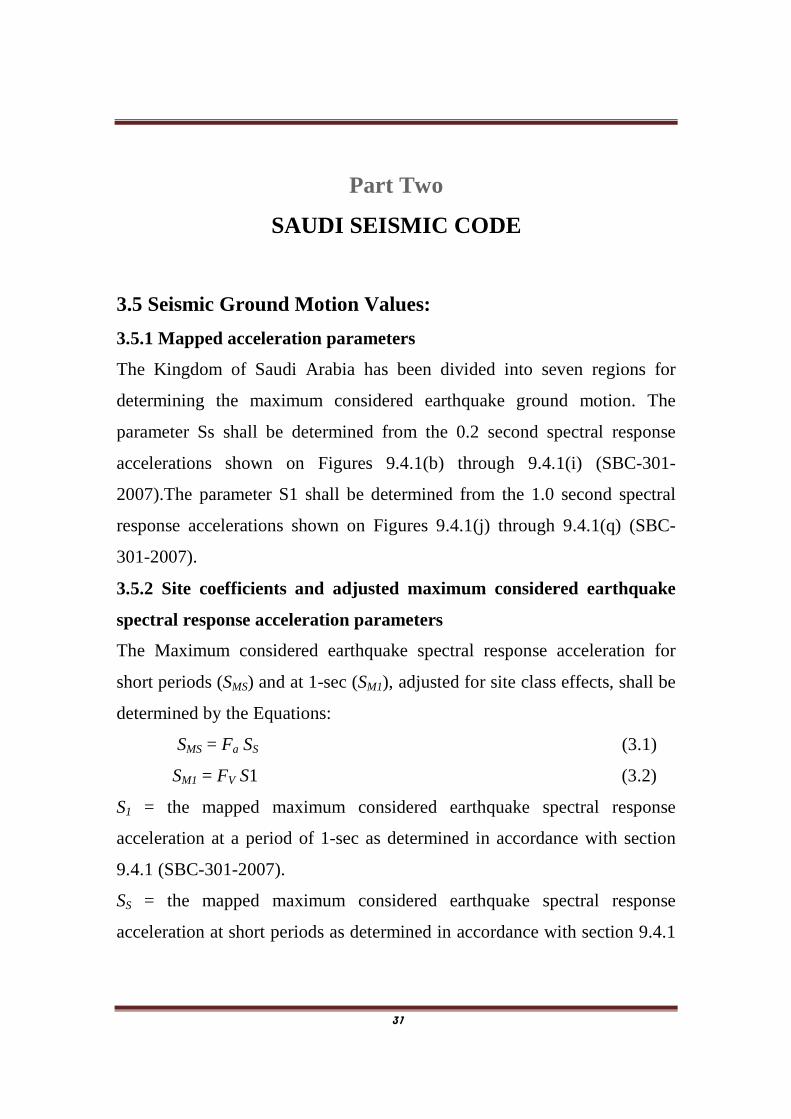
Because Jizan is located on the sea-shore, water immigrates to the surface
leaving a salt crust on the top surface, which is known as 'Sabkha' soil. This
salt bearing (saline) soil and the salt dome affected the foundation
performance in the area, see Fig (3.4).
Fig. (3.4):Sabkha corrosion action on structures
31
Part Two
SAUDI SEISMIC CODE
3.5 Seismic Ground Motion Values:
3.5.1 Mapped acceleration parameters
The Kingdom of Saudi Arabia has been divided into seven regions for
determining the maximum considered earthquake ground motion. The
parameter Ss shall be determined from the 0.2 second spectral response
accelerations shown on Figures 9.4.1(b) through 9.4.1(i) (SBC-301-
2007).The parameter S1 shall be determined from the 1.0 second spectral
response accelerations shown on Figures 9.4.1(j) through 9.4.1(q) (SBC-
301-2007).
3.5.2 Site coefficients and adjusted maximum considered earthquake
spectral response acceleration parameters
The Maximum considered earthquake spectral response acceleration for
short periods (SMS) and at 1-sec (SM1), adjusted for site class effects, shall be
determined by the Equations:
SMS = Fa SS (3.1)
SM1 = FV S1 (3.2)
S1 = the mapped maximum considered earthquake spectral response
acceleration at a period of 1-sec as determined in accordance with section
9.4.1 (SBC-301-2007).
SS = the mapped maximum considered earthquake spectral response
acceleration at short periods as determined in accordance with section 9.4.1
32
where site coefficients Fa and Fv are defined in Table 9.4.3a and Table
9.4.3b, respectively(SBC-301-2007).
3.5.3 Design Response Acceleration Parameters
Design earthquake spectral response acceleration at short periods, SDS, and at
1-sec period, SD1, shall be determined from the following Equations:
SDS = SMS (3.3)
SD1 = SM1 (3.4)
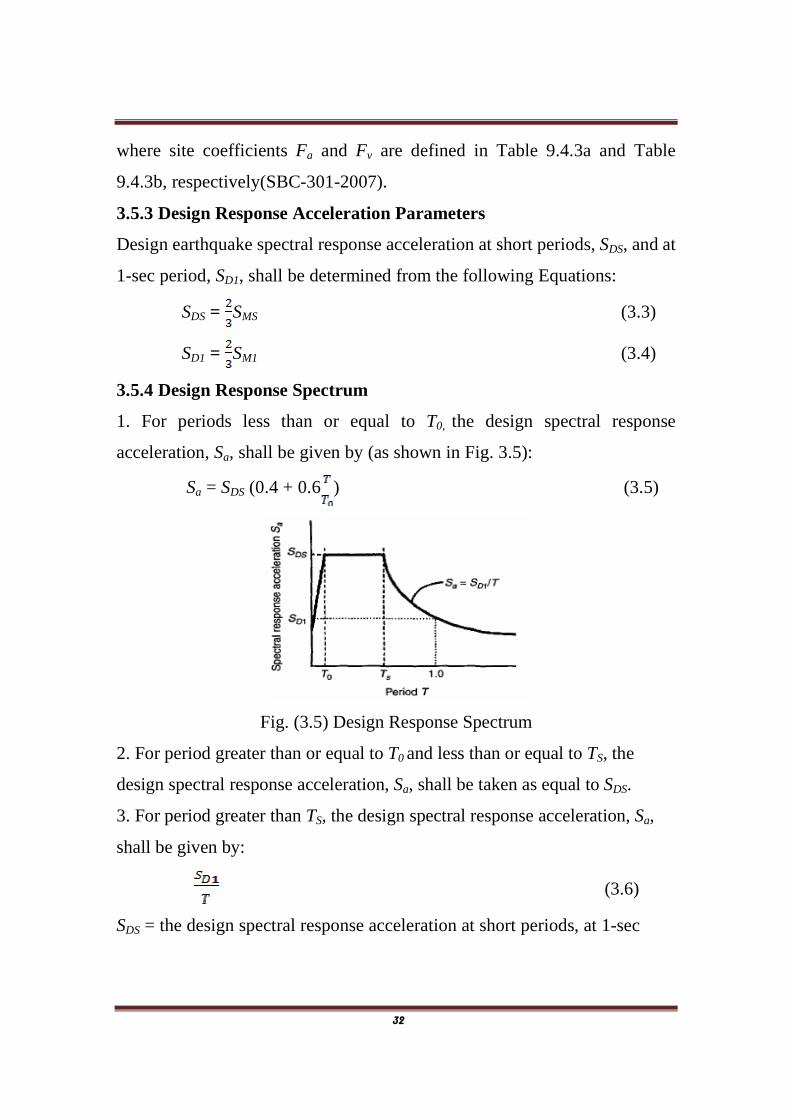
3.5.4 Design Response Spectrum
1. For periods less than or equal to T0, the design spectral response
acceleration, Sa, shall be given by (as shown in Fig. 3.5):
Sa = SDS (0.4 + 0.6 ) (3.5)
Fig. (3.5) Design Response Spectrum
2. For period greater than or equal to T0 and less than or equal to TS, the
design spectral response acceleration, Sa, shall be taken as equal to SDS.
3. For period greater than TS, the design spectral response acceleration, Sa,
shall be given by:
(3.6)
SDS = the design spectral response acceleration at short periods, at 1-sec
33
SD1 = the design spectral response acceleration at 1-sec periods, in units of g-
sec.
T = the fundamental period of the structure (sec):
T0 = 0.2SD1/SDS
TS =SD1/SDS
3.6 Equivalent Lateral Force Procedure:
3.6.1 Calculation of Base Shear (V)
According to "SBC-301-2007" the total base shear (V) can be calculated in
accordance with the following equation:
V = Cs W (3.7)
Where:
Cs = the seismic response coefficient determined in accordance with Section
10.9.2.1.
(3.8)
SDS = the design spectral response acceleration in the short
period range as determined from Section 9.4.4 (SBC-301-2007)
R = the response modification factor in Table II.
I = the occupancy importance factor determined in accordance with section
9.5
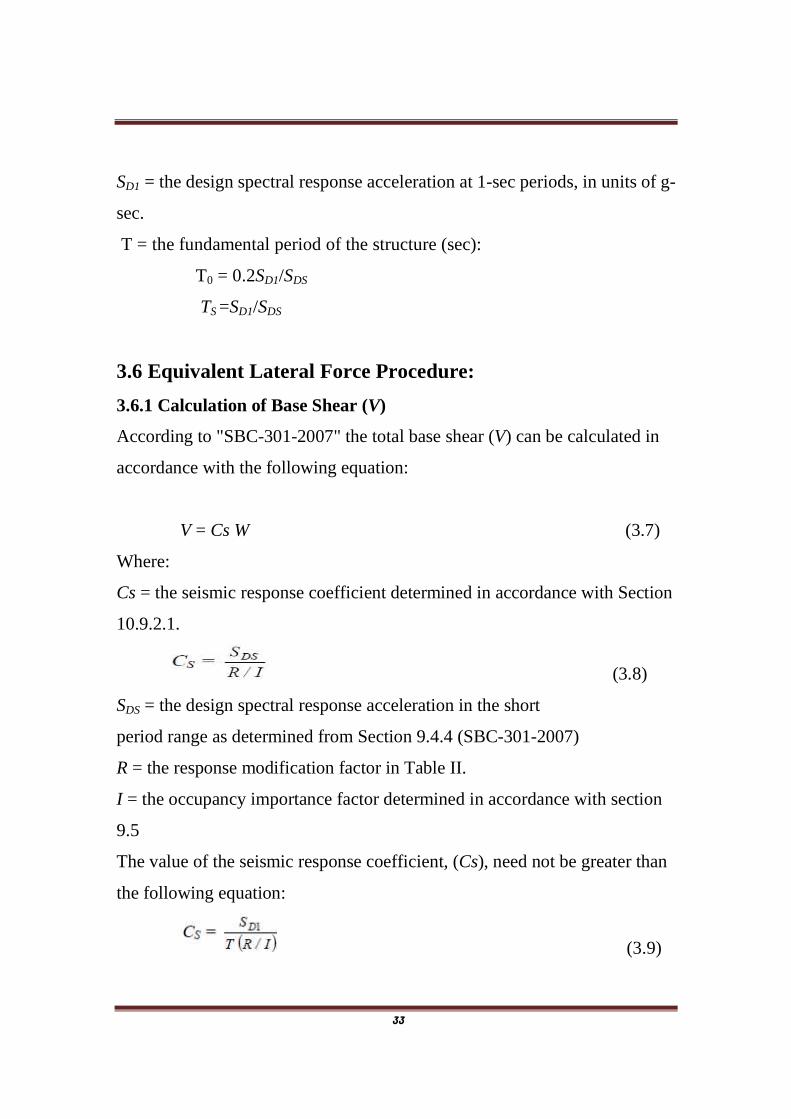
The value of the seismic response coefficient, (Cs), need not be greater than
the following equation:
(3.9)
34
But shall not be taken less than
(3.10)
SD1= the design spectral response acceleration at a period of 1.0 sec, in unit
of g-sec, as determined from section 9.4.4.
T = the fundamental period of the structure as determined in section 10.9.3.
The approximate fundamental period (Ta), in seconds, shall be determined
from the following equation
(3.11)
Where hnis the height in (m) of the base to the highest level of the structure,
and Ctand xare determined from Table 10.9.3.2.
Or Ta, for structures no exceeding 12 stories in height, can be determined
from the following equation Ta = 0.1 N (3.12)
Where N = number of stories
Ta for masonry or concrete shear wall structures shall be permitted to be
determined from
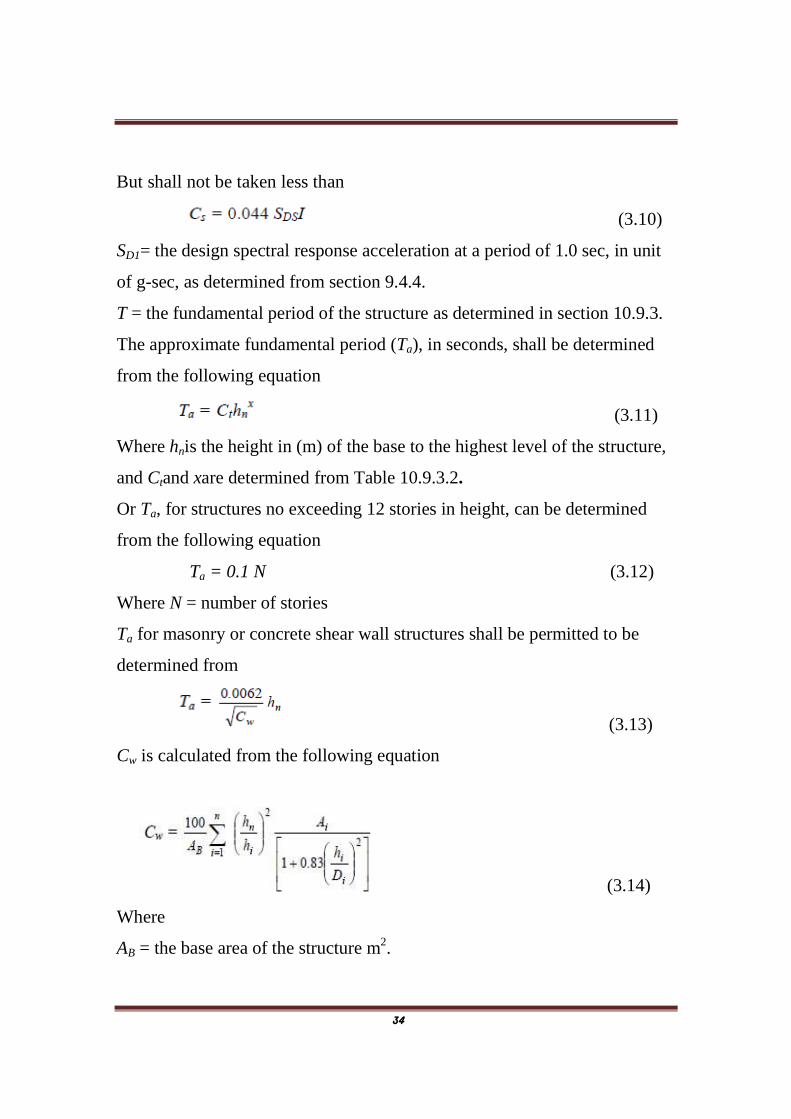
(3.13)
Cw is calculated from the following equation
(3.14)
Where
AB = the base area of the structure m2.
35
Ai = the area of shear wall "i" in m2.
Di = the length of shear wall "i" in m.
n = number of shear walls in the building.
3.6.2 Lateral distribution of seismic forces
The lateral seismic force (Fx) (kN) induced at any level shall be determined
by the following equations:
Fx = CvxV (3.15)
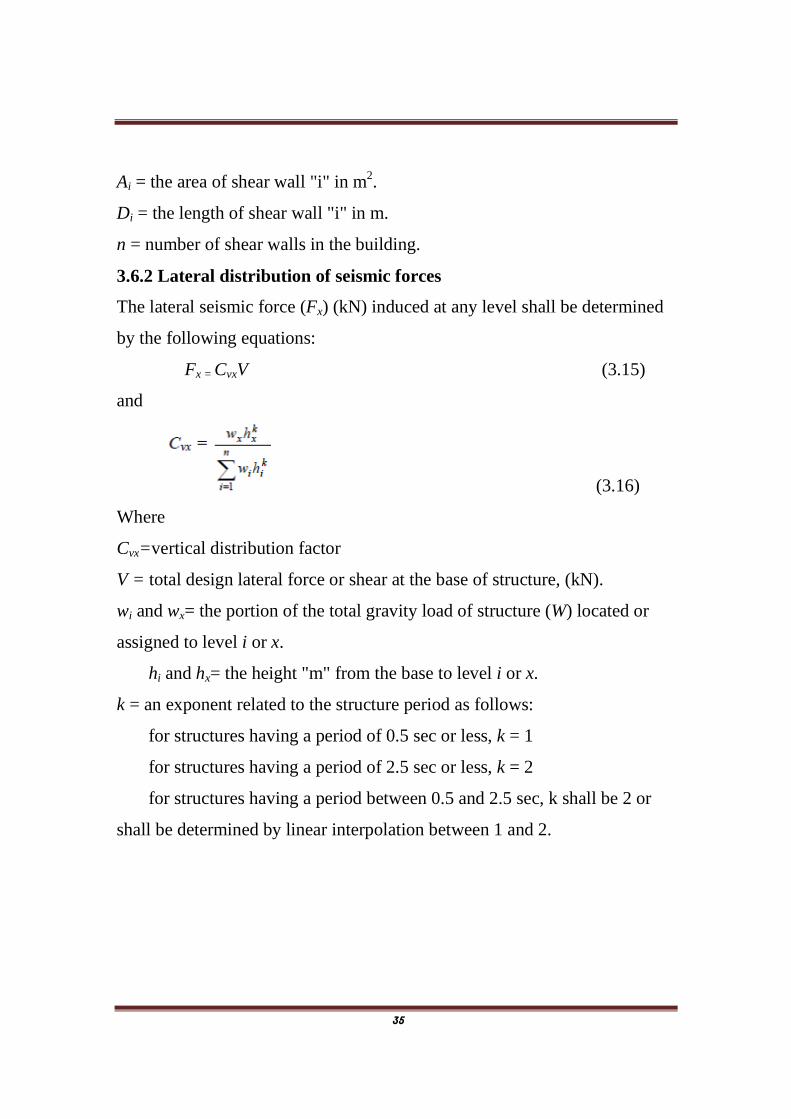
and
(3.16)
Where
Cvx=vertical distribution factor
V = total design lateral force or shear at the base of structure, (kN).
wi and wx= the portion of the total gravity load of structure (W) located or
assigned to level i or x.
hi and hx= the height "m" from the base to level i or x.
k = an exponent related to the structure period as follows:
for structures having a period of 0.5 sec or less, k = 1
for structures having a period of 2.5 sec or less, k = 2
for structures having a period between 0.5 and 2.5 sec, k shall be 2 or
shall be determined by linear interpolation between 1 and 2.
36
4.6.3 Horizontal shear distribution
The seismic design story shear in any story (Vx) (kN) shall be determined
from the following equation:
(3.17)
Where Fi = the portion of the seismic base shear (Vx) (kN) induced at level i.
4.6.4 Overturning moment
The overturning moments at level x (Mx) (kN.m) shall be determined from
the following equation
(3.18)
Where
Fi= the portion of the seismic base shear (V) induced at level i.
hi and hx= the height "m" from the base to level i or x.
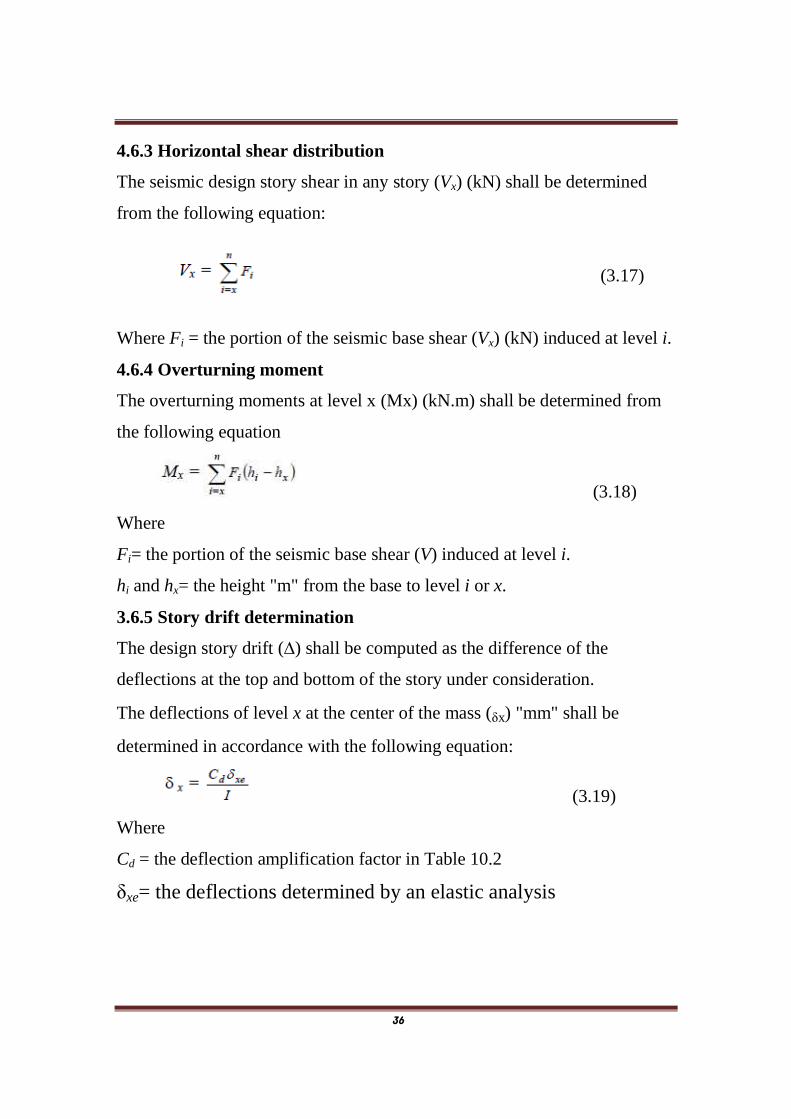
3.6.5 Story drift determination
The design story drift (∆) shall be computed as the difference of the
deflections at the top and bottom of the story under consideration.
The deflections of level x at the center of the mass (δx) "mm" shall be
determined in accordance with the following equation:
(3.19)
Where
Cd = the deflection amplification factor in Table 10.2
δxe= the deflections determined by an elastic analysis
37
I = the importance factor determined in accordance with section
9.5.
Story drift (∆x) =δx - δx-1, as shown in Fig. (3.6)
Fig. (3.6) Deflection of frame structure
38
Chapter Four
SEISMIC ANALYSIS OF A MULTI-STORY
R. C. FRAME IN JAZAN CITY
4.1 Introduction
In this project, an office 10-story R.C. frame, located in Jazan city, has been
seismically analyzed aiming to investigate the seismic performance of a
reinforced concrete moment resisting frame building under an earthquake
ground motion. The building was analyzed in accordance with the Saudi
Building Code (SBC-301-2007) using STAAD PRO software. Jazan city lies
in an active zone of earthquakes classified as zone 2B with maximum
applied horizontal acceleration of 0.2g
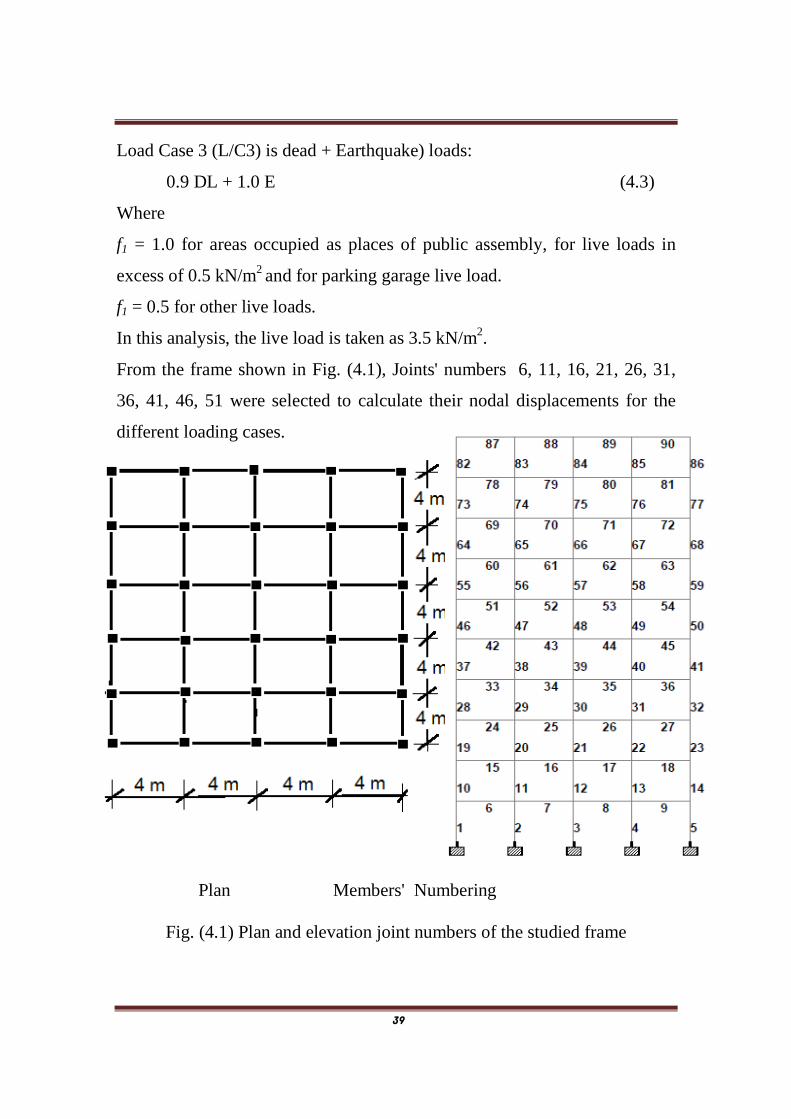
4.2 Frame Details and Study Case An office ten-story regular reinforced concrete frame building located in
Jazan City, with 16 m X 20 m plan as shown in Fig. (4.1), was analyzed to
investigate its seismic performance. The most important parameters
governing the analysis of this frame were dead load, live load and seismic
loads.
As per SBC-301-2007 the following selected load combinations were
selected for the analysis of the studied frame:
Load Case 1 (L/C1) is static load (dead and live):
1.4 (DL + LL) (4.1)
Load Case 2 (L/C2) is static load + Earthquake loads:
1.2 DL + + 1.0 E + f1 LL (4.2)
39
Load Case 3 (L/C3) is dead + Earthquake) loads:
0.9 DL + 1.0 E (4.3)
Where
f1 = 1.0 for areas occupied as places of public assembly, for live loads in
excess of 0.5 kN/m2 and for parking garage live load.
f1 = 0.5 for other live loads.
In this analysis, the live load is taken as 3.5 kN/m2.
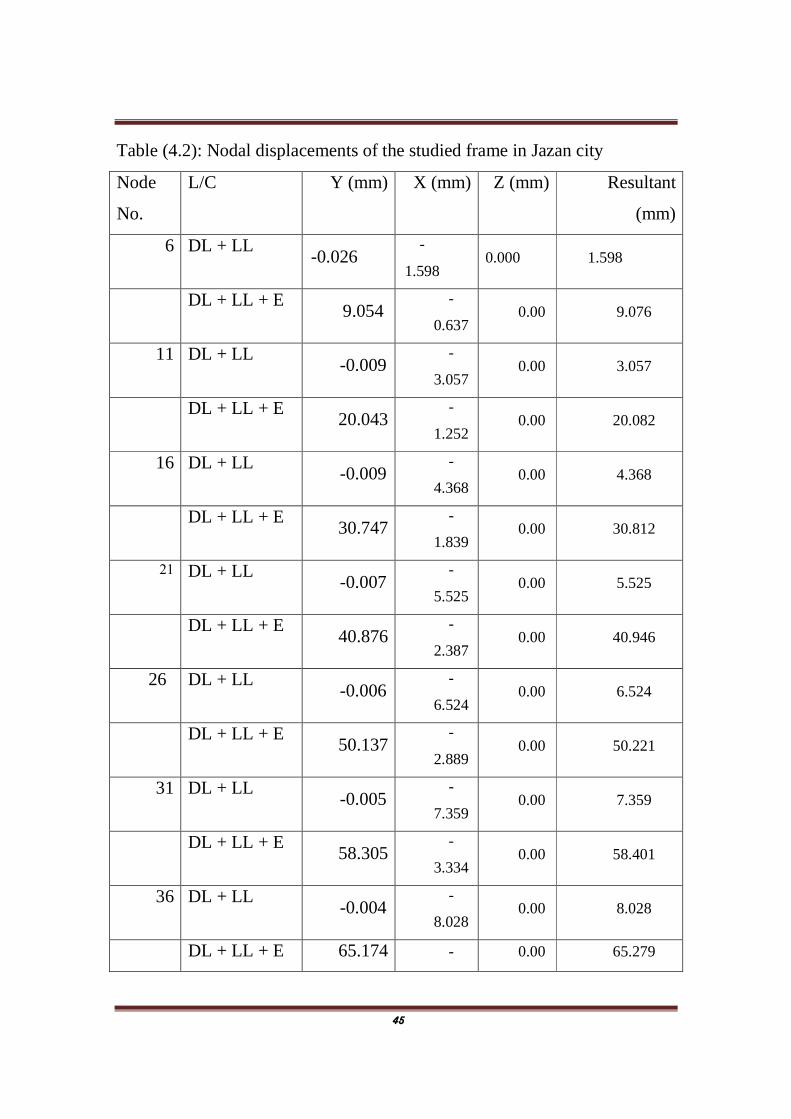
From the frame shown in Fig. (4.1), Joints' numbers 6, 11, 16, 21, 26, 31,
36, 41, 46, 51 were selected to calculate their nodal displacements for the
different loading cases.
Members' Numbering Plan
Fig. (4.1) Plan and elevation joint numbers of the studied frame
40
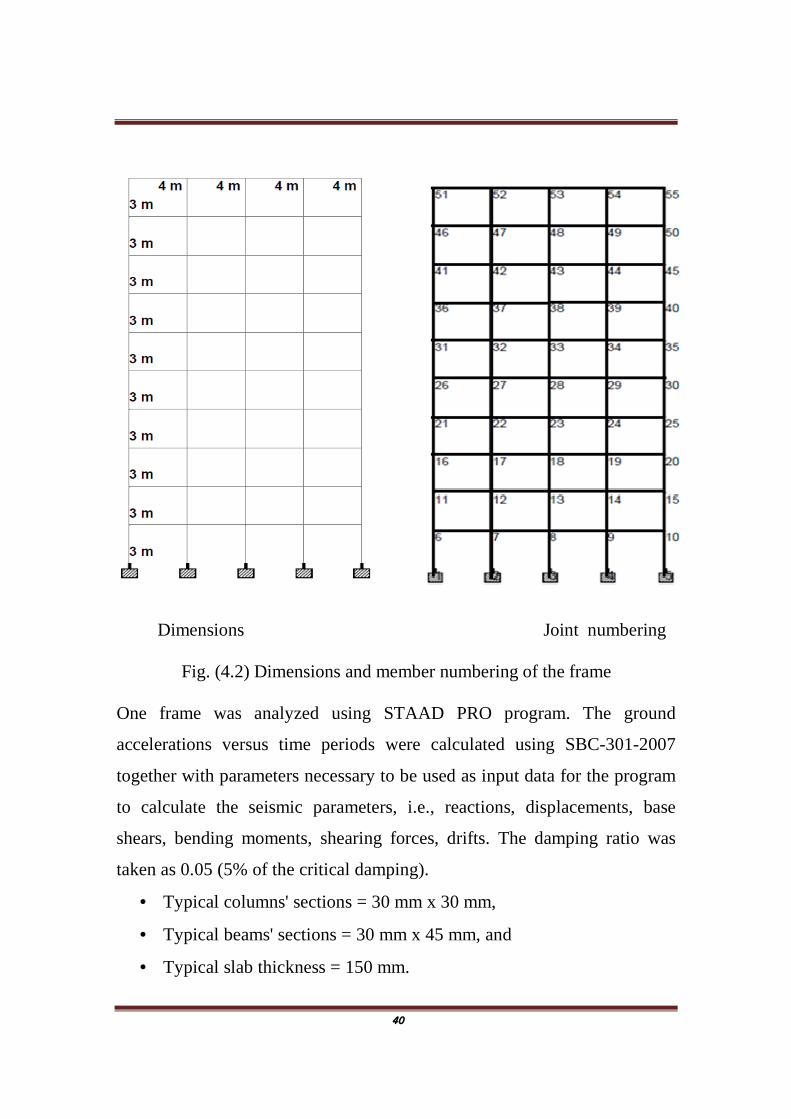
Dimensions Joint numbering
Fig. (4.2) Dimensions and member numbering of the frame
One frame was analyzed using STAAD PRO program. The ground
accelerations versus time periods were calculated using SBC-301-2007
together with parameters necessary to be used as input data for the program
to calculate the seismic parameters, i.e., reactions, displacements, base
shears, bending moments, shearing forces, drifts. The damping ratio was
taken as 0.05 (5% of the critical damping).
• Typical columns' sections = 30 mm x 30 mm,
• Typical beams' sections = 30 mm x 45 mm, and
• Typical slab thickness = 150 mm.
41
Some members of the frame building were selected for the purposes of the
analysis. The selected members, which are shown in Fig. (4.2) were:
Columns: 2, 11, 20, 29, 38, 47, 56, 65, 74, and 83.
Beams: 6, 7, 8, and 9.
4.3 Results of the Analysis
4.3.1 Calculations of mapped and design spectral response accelerations
for Jazan City:
Using the Saudi Building Code (SBC-301-2007) equations shown in
chapter three the following parameters have been calculated to be used as
input data for seismic analysis of the R.C. Building located in Jazan City
(Jazan City lies in region 6). The calculated results of these parameters are
as follows:
• SS = the mapped maximum considered earthquake spectral response
acceleration at short periods.
SS= 0.44 g = 0.44x 9.81 = 4.32
• S1 = the mapped maximum considered earthquake spectral response
acceleration at a period of 1-sec
S1= 0.124 g = 0.124x 9.81 = 1.22
• Fa and Fv = site coefficients
Fa = 1.908 (Table 9.4.3a) of (SBC-301-2007).
FV = 3.428 (Table 9.4.3 b) of (SBC-301-2007).
• SMS = The Maximum considered earthquake spectral response
acceleration for short periods , adjusted for site class effects
SMS = Fa SS = 1.908x 4.32 = 8.24
42
• SM1 = The Maximum earthquake spectral response acceleration for at
1-sec periods , adjusted for site class effects
SM1 = FV S1= 3.428x1.22 = 4.18
• SDS = the design spectral response acceleration at short periods.
SDS = SMS = x 8.24 = 5.49
• SD1 = the design spectral response acceleration at 1-sec periods.
SD1 = SM1 = x 4.18 = 2.79
• T = the fundamental period of the structure (sec):
T = 0.1 N = 0.1 x 10 = 10 sec
T0 = 0.2SD1/SDS = 0.2x2.79/5.49 = 0.102 sec
TS =SD1/SDS = 2.79/5.49 = 0.510 sec
• R = the response modification factor in Table II:
R = 2.5 (for ordinary R.C. resisting moment frame)
• I = the occupancy importance factor determined in accordance with
section 9.5 (SBC-301-2007):
I = 1 (for occupancy category I and II)
43
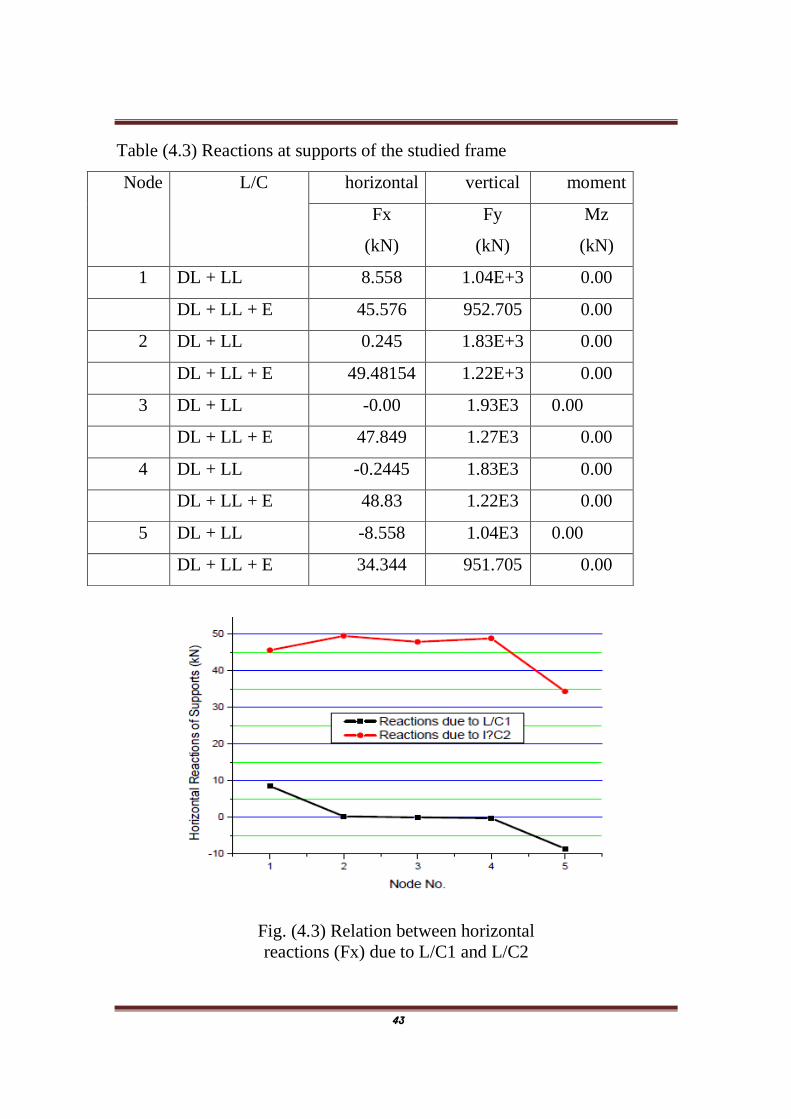
Table (4.3) Reactions at supports of the studied frame
Node L/C horizontal vertical moment
Fx
(kN)
Fy
(kN)
Mz
(kN)
1 DL + LL 8.558 1.04E+3 0.00
DL + LL + E 45.576 952.705 0.00
2 DL + LL 0.245 1.83E+3 0.00
DL + LL + E 49.48154 1.22E+3 0.00
3 DL + LL -0.00 1.93E3 0.00
DL + LL + E 47.849 1.27E3 0.00
4 DL + LL -0.2445 1.83E3 0.00
DL + LL + E 48.83 1.22E3 0.00
5 DL + LL -8.558 1.04E3 0.00
DL + LL + E 34.344 951.705 0.00
Fig. (4.3) Relation between horizontal reactions (Fx) due to L/C1 and L/C2
44
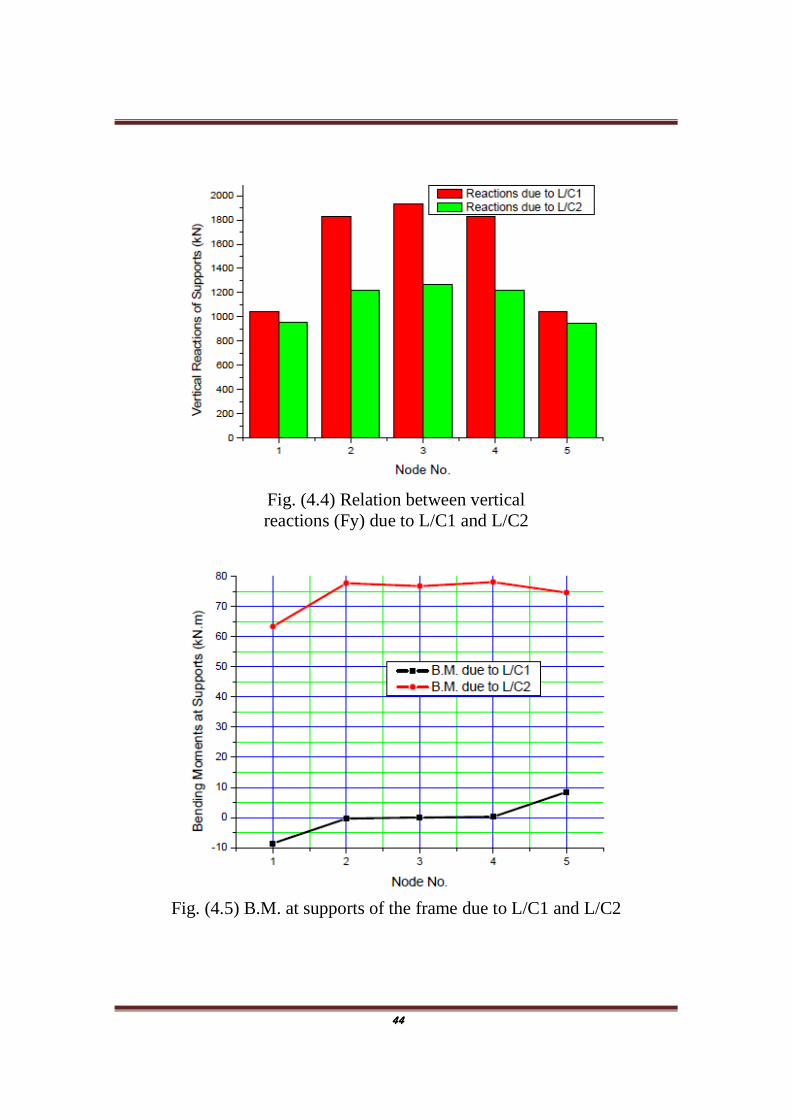
Fig. (4.4) Relation between vertical reactions (Fy) due to L/C1 and L/C2
Fig. (4.5) B.M. at supports of the frame due to L/C1 and L/C2
45
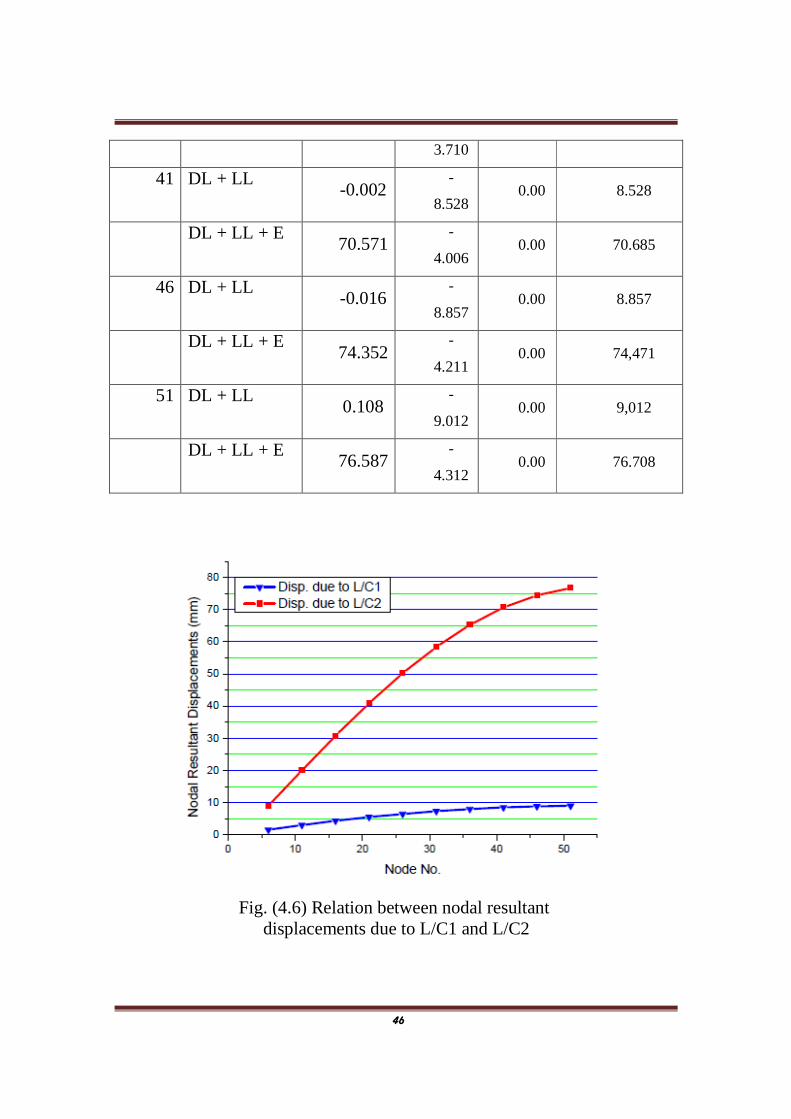
Table (4.2): Nodal displacements of the studied frame in Jazan city
Resultant
(mm)
Z (mm) X (mm) Y (mm) L/C Node
No.
1.598 0.000 -
1.598 -0.026
DL + LL 6
9.076 0.00 -
0.637 9.054
DL + LL + E
3.057 0.00 -
3.057 -0.009
DL + LL 11
20.082 0.00 -
1.252 20.043
DL + LL + E
4.368 0.00 -
4.368 -0.009
DL + LL 16
30.812 0.00 -
1.839 30.747
DL + LL + E
5.525 0.00 -
5.525 -0.007
DL + LL 21
40.946 0.00 -
2.387 40.876
DL + LL + E
6.524 0.00 -
6.524 -0.006
DL + LL 26
50.221 0.00 -
2.889 50.137
DL + LL + E
7.359 0.00 -
7.359 -0.005
DL + LL 31
58.401 0.00 -
3.334 58.305
DL + LL + E
8.028 0.00 -
8.028 -0.004
DL + LL 36
65.279 0.00 -65.174 DL + LL + E
46
3.710
8.528 0.00 -
8.528 -0.002
DL + LL 41
70.685 0.00 -
4.006 70.571
DL + LL + E
8.857 0.00 -
8.857 -0.016
DL + LL 46
74,471 0.00 -
4.211 74.352
DL + LL + E
9,012 0.00 -
9.012 0.108
DL + LL 51
76.708 0.00 -
4.312 76.587
DL + LL + E
Fig. (4.6) Relation between nodal resultant displacements due to L/C1 and L/C2
47
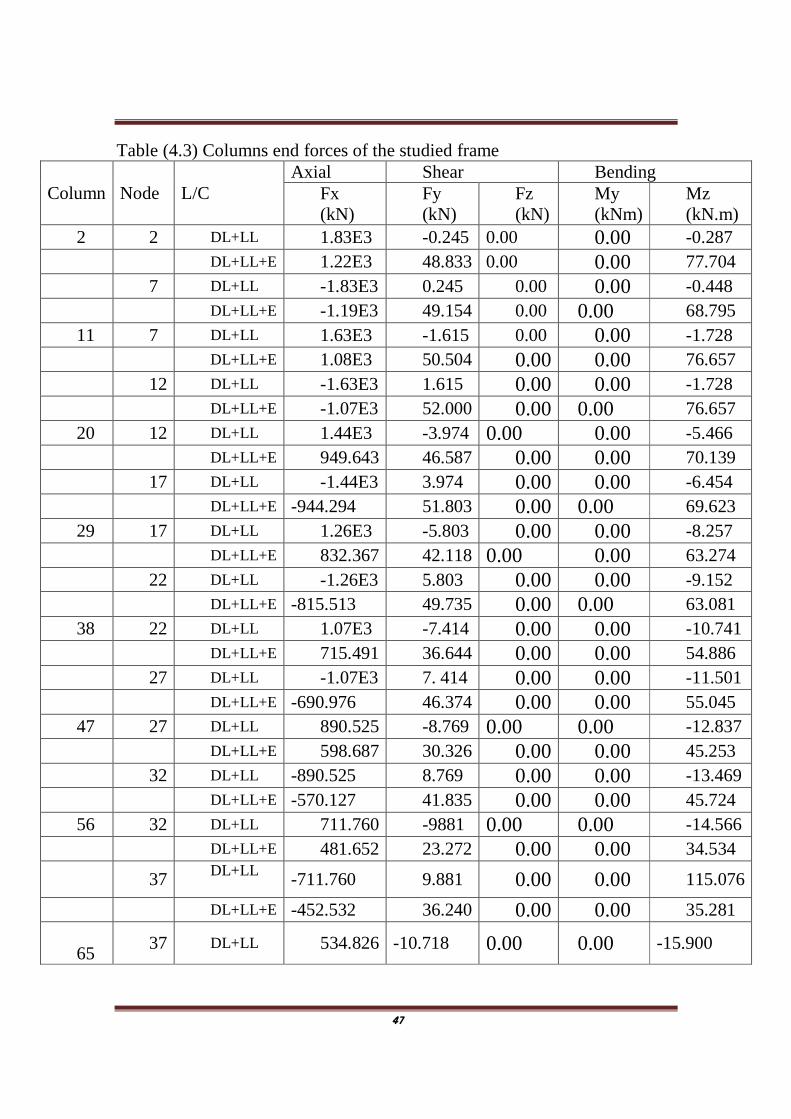
Table (4.3) Columns end forces of the studied frame
Column Node L/C Axial Shear Bending
Fx (kN)
Fy (kN)
Fz (kN)
My (kNm)
Mz (kN.m)
2 2 DL+LL 1.83E3 -0.245 0.00 0.00 -0.287 DL+LL+E 1.22E3 48.833 0.00 0.00 77.704 7 DL+LL -1.83E3 0.245 0.00 0.00 -0.448 DL+LL+E -1.19E3 49.154 0.00 0.00 68.795 11 7 DL+LL 1.63E3 -1.615 0.00 0.00 -1.728 DL+LL+E 1.08E3 50.504 0.00 0.00 76.657 12 DL+LL -1.63E3 1.615 0.00 0.00 -1.728 DL+LL+E -1.07E3 52.000 0.00 0.00 76.657 20 12 DL+LL 1.44E3 -3.974 0.00 0.00 -5.466 DL+LL+E 949.643 46.587 0.00 0.00 70.139 17 DL+LL -1.44E3 3.974 0.00 0.00 -6.454 DL+LL+E -944.294 51.803 0.00 0.00 69.623 29 17 DL+LL 1.26E3 -5.803 0.00 0.00 -8.257 DL+LL+E 832.367 42.118 0.00 0.00 63.274 22 DL+LL -1.26E3 5.803 0.00 0.00 -9.152 DL+LL+E -815.513 49.735 0.00 0.00 63.081 38 22 DL+LL 1.07E3 -7.414 0.00 0.00 -10.741 DL+LL+E 715.491 36.644 0.00 0.00 54.886 27 DL+LL -1.07E3 7. 414 0.00 0.00 -11.501 DL+LL+E -690.976 46.374 0.00 0.00 55.045 47 27 DL+LL 890.525 -8.769 0.00 0.00 -12.837 DL+LL+E 598.687 30.326 0.00 0.00 45.253 32 DL+LL -890.525 8.769 0.00 0.00 -13.469 DL+LL+E -570.127 41.835 0.00 0.00 45.724 56 32 DL+LL 711.760 -9881 0.00 0.00 -14.566 DL+LL+E 481.652 23.272 0.00 0.00 34.534
37 DL+LL -711.760 9.881 0.00 0.00 115.076
DL+LL+E -452.532 36.240 0.00 0.00 35.281 65
37 DL+LL 534.826 -10.718 0.00 0.00 -15.900
48
DL+LL+E 364.099 15.650 0.00 0.00 22.971 42 DL+LL -534.826 10.718 0.00 0.00 -16.253 DL+LL=E -337.861 29.717 0.00 0.00 23.980
74 42 DL+LL 359.162 -11.524 0.00 0.00 -17.075
DL+LL+E 245.654 7.432 0.00 0.00 10.629 47 DL+LL -359.162 11.524 0.00 0.00 -17.498 DL+LL+E -225.746 22.558 0.00 0.00 11.667 83 47 DL+LL 185.781 -11.670 0.00 0.00 -17.391 DL+LL+E 126.741 -0.506 0.00 0.00 -1.344 52 DL+LL -185.781 11.670 0.00 0.00 -17.619
DL+LL+E -117.097 14.810 0.00 0.00 -0.175
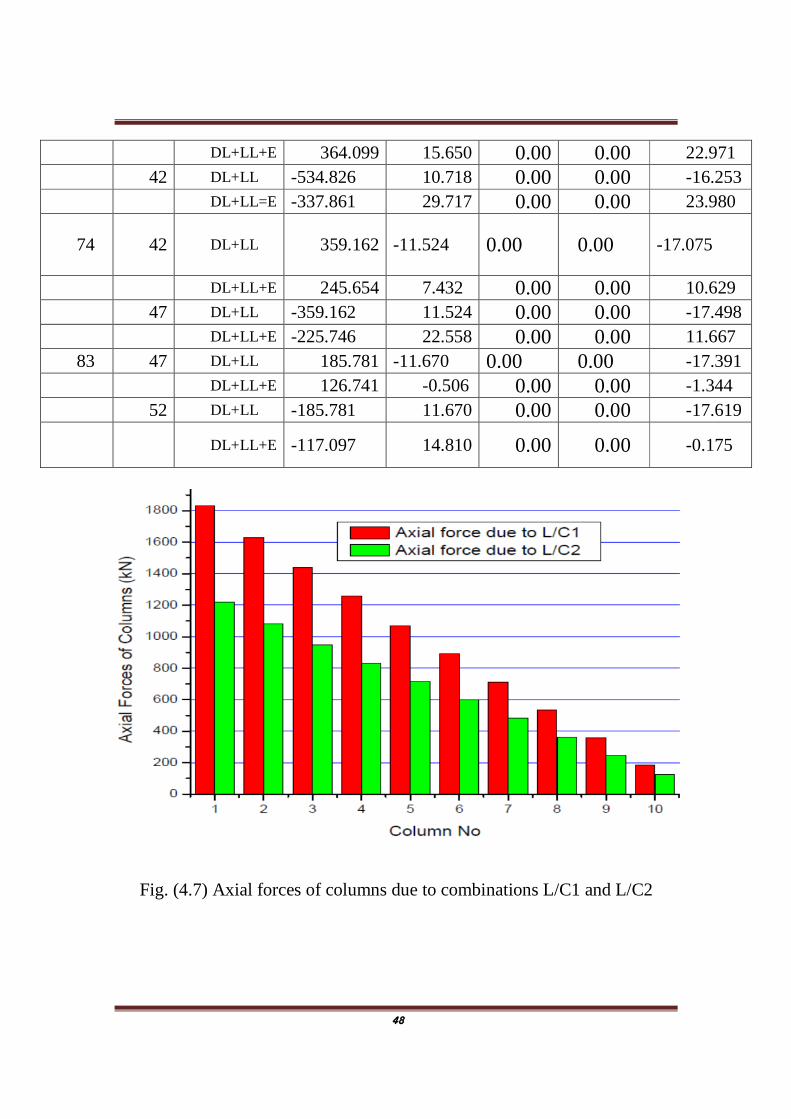
Fig. (4.7) Axial forces of columns due to combinations L/C1 and L/C2
49
Table (4.4)Beam end forces of the studied frame
Beam No.
Node L/C Fx
(kN) Fy
(kN) Mz
(kNm) 6 6 DL+LL -8.799 90.774 42.83 DL+LL+E -0667 104.909 130.479 7 DL+LL 8.799 101.226 -36.742 DL+LL+E 10.882 111.769 37.15 7 7 DL+LL -10.169 97.061 65.918 DL+LL+E -5.118 98.396 111.152 8 DL+LL 10.169 94.939 -61.674 DL+LL+E 8.229 97.004 30.432 8 8 DL+LL -10.169 94.939 61.674 DL+LL+E -5.118 97.004 111.379 9 DL+LL 10.169 97.061 -65.918 DL+LL+E 8.229 98.396 24.635 9 9 DL+LL -8.799 101.226 63.742 DL+LL+E -0.667 111.769 120.817 10 DL+LL 8.799 90.774 -42836 DL+LL+E 10.882 104.909 74.257
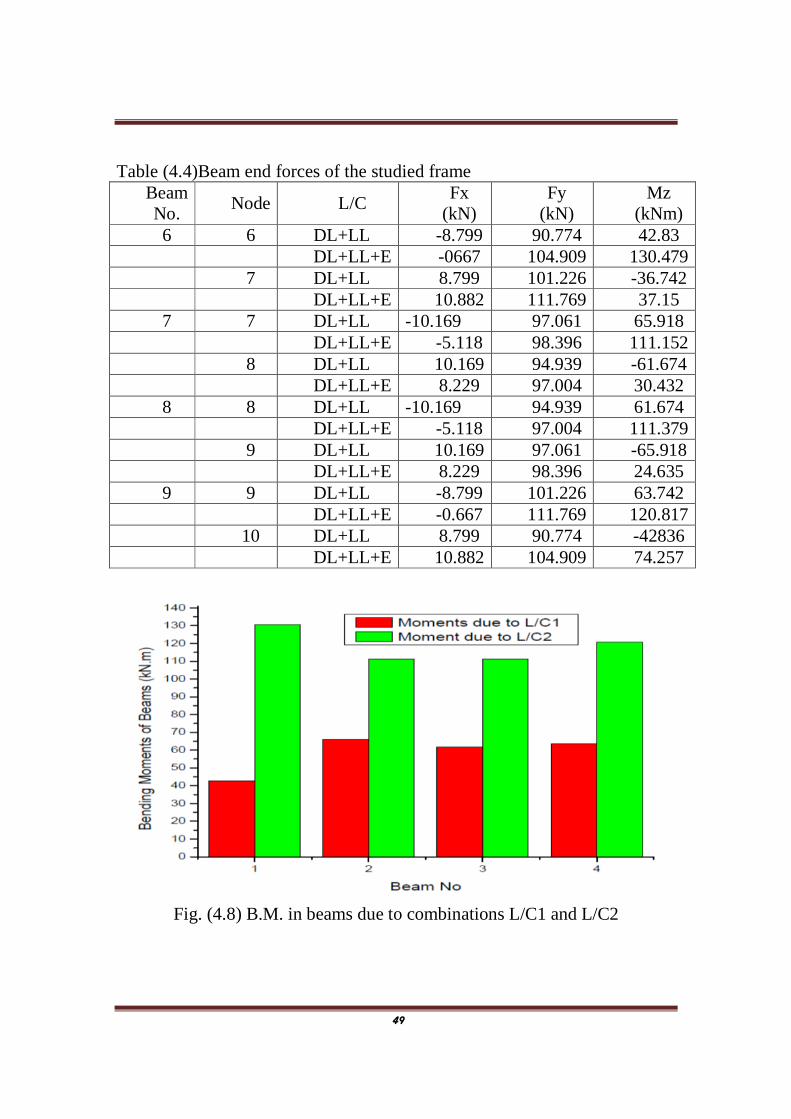
Fig. (4.8) B.M. in beams due to combinations L/C1 and L/C2
50
4.4 Discussion of the Analysis
The results of the analysis indicated that the horizontal reactions (Fx) of the
frame due to L/C2 show larger values, reaching up to 8 times that due to
L/C1 in the outer supports, and this difference increased so many times in
the inner supports as shown in Table (4.1) and Fig. (4.3). The vertical
reactions (Fy) due L/C1 is slightly greater than that due to L/C2 revealing
the effect of static load on reducing lateral movements (see Table 4.1 and
Fig. 4.4). This concept is also true for bending moments (Mz) at supports
that reflects the severe effects of horizontal excitation ground motion on this
building as shown in Fig. (4.5). Table (4.2) and Fig. (4.6) show the results of
the nodal displacements due to different load cases, from which it is clearly
observed that the calculated resultant of nodal displacements due to L/C 2
were about 6 to 8 times the nodal displacements due to L/C1. These values
indicated that the horizontal motions have great effects on the lateral
displacements of the studied frame.
For columns, axial forces due to L/C1is slightly greater than that due to
L/C2. However, the forces in upper floor columns showed lesser values.
There are large increases in the values of shearing forces and bending
moments at columns when earthquake effects were considered in the
analysis as shown in Table (4.3) and Fig. (4.7). The values of bending
moments due to L/C2 in beams 6, 7, 8, and 9 were found to be about 1.5 -2.0
times the values due to L/C1 as shown Table (4.4) and Fig. (4.8).
51
Chapter Five
CONCLUSION AND RECOMMENDATIONS
5.1 Conclusions
Based on the obtained results from the analysis of the reinforced concrete
frame building in Jazan city, it can be concluded that:
1. It is found that the values of horizontal support reactions generating
from L/C2 were about 8 times that due to L/C1 in the outer supports
and this rate increases much more in the inner supports.
2. it is clearly observed that the calculated resultant of nodal
displacements due to L/C2 were about 6 to 8 times the nodal
displacements due to L/C1.
3. Axial forces of columns due to L/C1is slightly greater than that due to
L/C2 and these forces decrease gradually in the upper floor columns
which showed lesser values.
4. Bending moments in beams and columns due to seismic excitation
(L/C2) showed much larger values compared to that due to static loads
(L/C1).
5.2 Recommendations
From this research and the results obtained, it can be recommended that:
1. Saudi seismic code should be taken into consideration when analyzing
and designing buildings and structures in the country.
2. Seismic risk analysis has to be conducted for major cities of Jazan
area.
52
3. Further studies and researches, in this field, are needed such as
analysis and design of various structures subjected to earthquake
loading in Fifa, soil dynamic investigation in Jazan area, earthquake
simulation using shake table for Jazan area, methods of rehabilitation
of ancient and historical buildings, Analysis and design of structure
subjected to wind and earthquakes loading in jazan city
53
References
1. S.A. Ashour and H.H. Abdel-Rahman, "Application of Seismic Risk
Analysis and Earthquake Simulation Methods to the Western Region in
Saudi Arabia", JKAU: Eng. Sci., vol. 6, pp. 3-23 (1414 A. H/ 1994 A. D)
2. Nazar and M. A. Ismaeil, " A comparative study on seismic provisions
made in UBC-1997 and Saudi buiding code for RC buildings", World
Academy of Science, Engineering and Technology. International Journal of
Civil, Architectural, Structural and Construction Engineering, Vol. 8, No. 4,
2014
3. Abdullah M. Alamri, "Earthquakes Data Base of the Arabian peninsula, "
Technical Report (1), Seismic Studies Center, King Saud University, 1998.
4. Abdullah M. Al-Amri, Arthur J. Rodgers, Tariq A. Al-Khalifa, "
Improving the level of seismic hazard parameters in Saudi Arabia using
earthquake location", Arabian Journal of Geosciences, Volume 1, Issue 1,
pp 1-15, july 2008.
5. Awad Ali Al-Karni,"A procedure in Engineering Analysis to Evaluate the
Liquefaction Potential of the soil at the University of Jazan City in the
Southwest of Saudi Arabia, University of Putra Malyasia, Alam Cipta 4(1),
ISSN 1823-7231, Dec. 2009.
6. M.N. Fatani, A.M. Khan, "Foundation on Salt Bearing Soils of Jizan",
Third International Conference on Case Histories in Geotechnical
Engineering, Missouri University of and Technology, 1993.
7. Dhowian, A. W., Erol, A. O., and Sultan, S., "Settlement prediction in
complex sabkha soil profiles", Bulletin of the the International Association
Engineering Geology, 36: 11-27, 1987.
54
8. Erol, A. O. "Engineering geological consideration in salt dome region
surrounded by sabkha sediments, Saudi Arabia. Engineering Geology, 26:
215-232, 1989.
9. Dhowian, A. W. "Compressibilty characteristics of sabkha complex", the
Arabian Journal for Science and Engineering", 15(1): 47-63, 1990.
10. Al-Shamrani, M. A., and Dhowian, A. W., "Preloading for reduction of
compressibility characteristics of sabkha soil profiles", Engineering
Geology, 48: 19-41, 1997.
11. Anil K. Chopra; “Dynamics of Structures”, Fourth Edition. Prentice
Hall, 2013.
12. Mario Paz and William Leigh, "Structural Dynamics",5th Edition., Mc
Graw Hill, 2006.
13. J. L. Humar, "Dynamics of Structures, Balkema, 2002.
13. Clough and Penzien, “Dynamics of Structures”, 2nd edition, McGraw-
Hill, 1993.
14. Saudi Geological Survey, www.sgs.org.sa