seeing china’s economy march 22, 2017 through electricity ... · seeing china’s economy through...
TRANSCRIPT
Seeing China’s Economy Through Electricity
Thomas G. Rawski
University of Pittsburgh
March 22, 2017
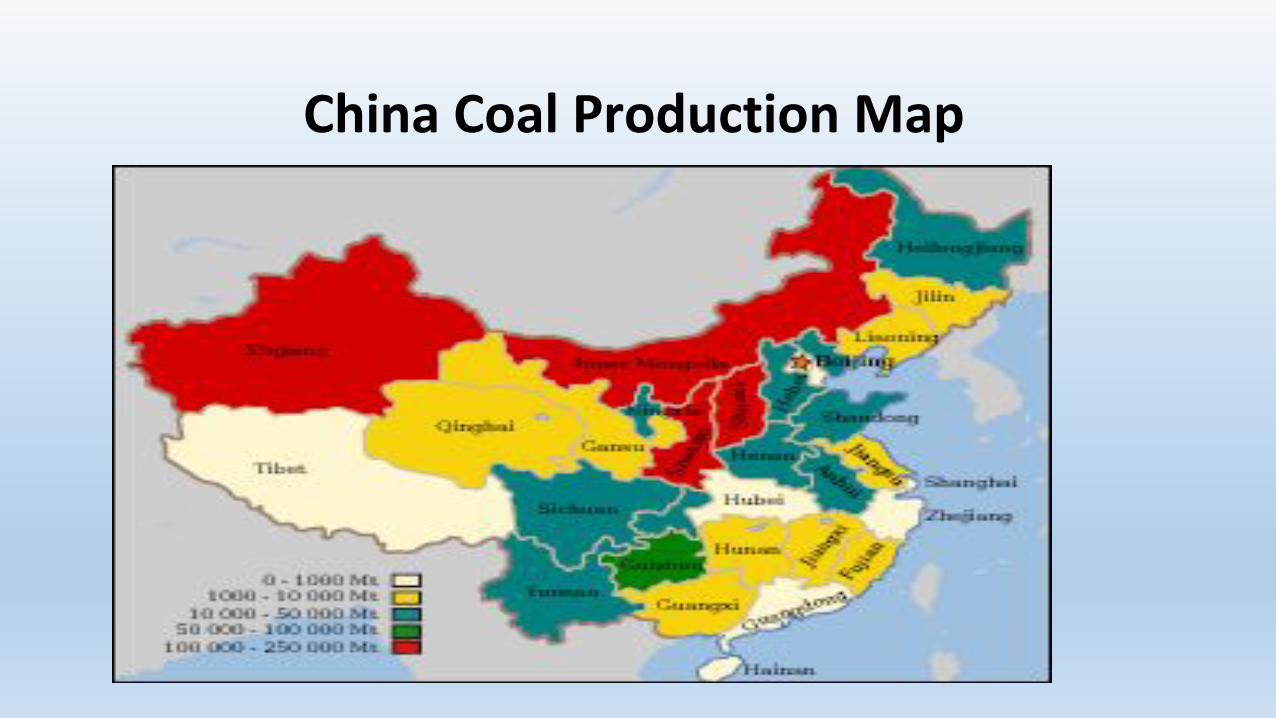
China Coal Production Map
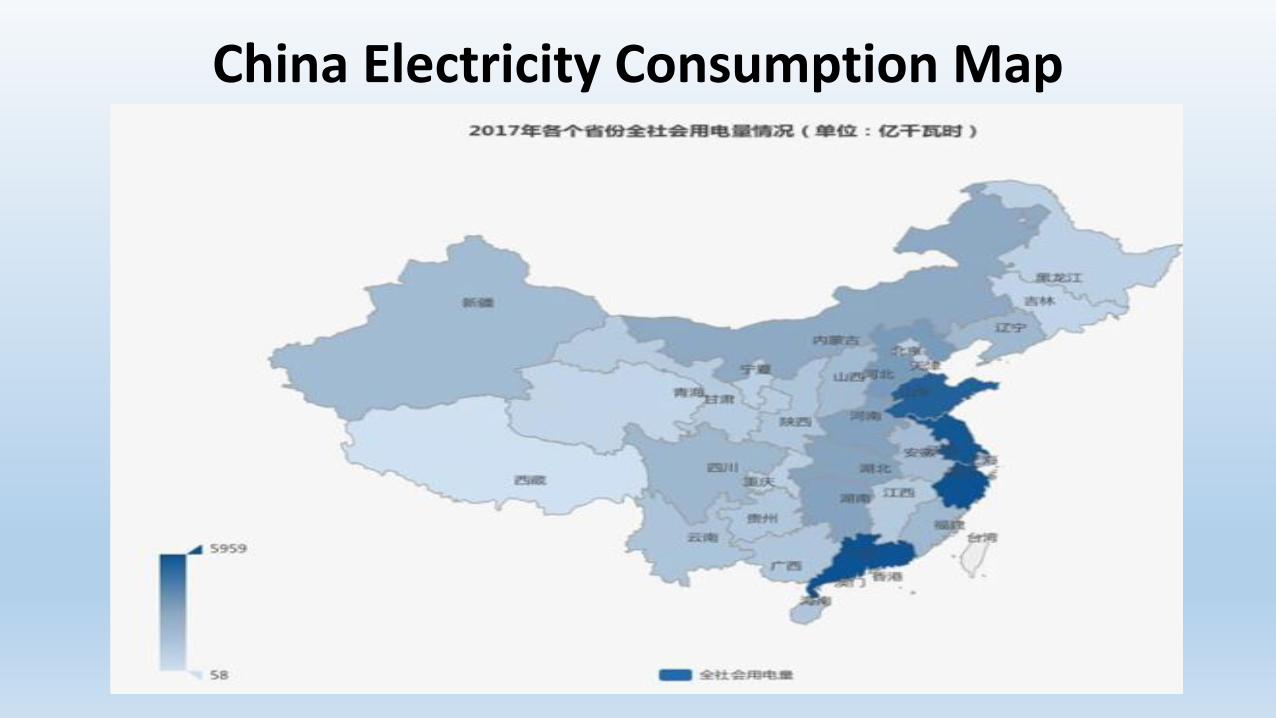
China Electricity Consumption Map


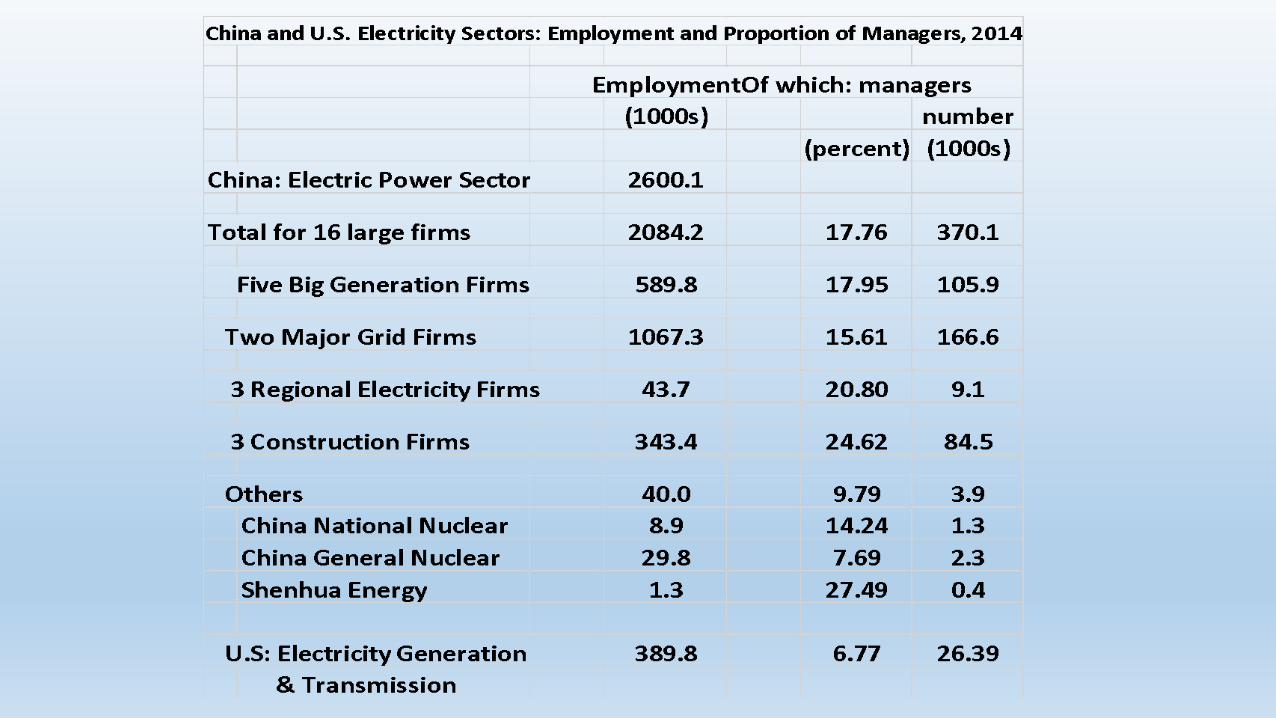
Profitability of Chinese and U.S. Electric Utilities 2005-2015
•Ratios: US to Chinese electric utility Average Median
•Profit Margin 1.43 1.02
•Pre-tax Profit Return on Assets 1.89 1.30
Photo: Euromoney.com

Chinese Electricity: A HIGH COST Industry
•Cost = Revenue – Profit
•China – Unit revenue > US (industry consumes 70% of Chinese power)
•China – profits < US
•Surprise conclusion: China cost of generating and delivering electricity HIGHER THAN IN U.S.!
•How much higher? 30% or more!!

Locus of Excess Costs? No Clear Answer, But…•Cost of railway shipment of coal – China ≈75% higher than US!!
•System costs??
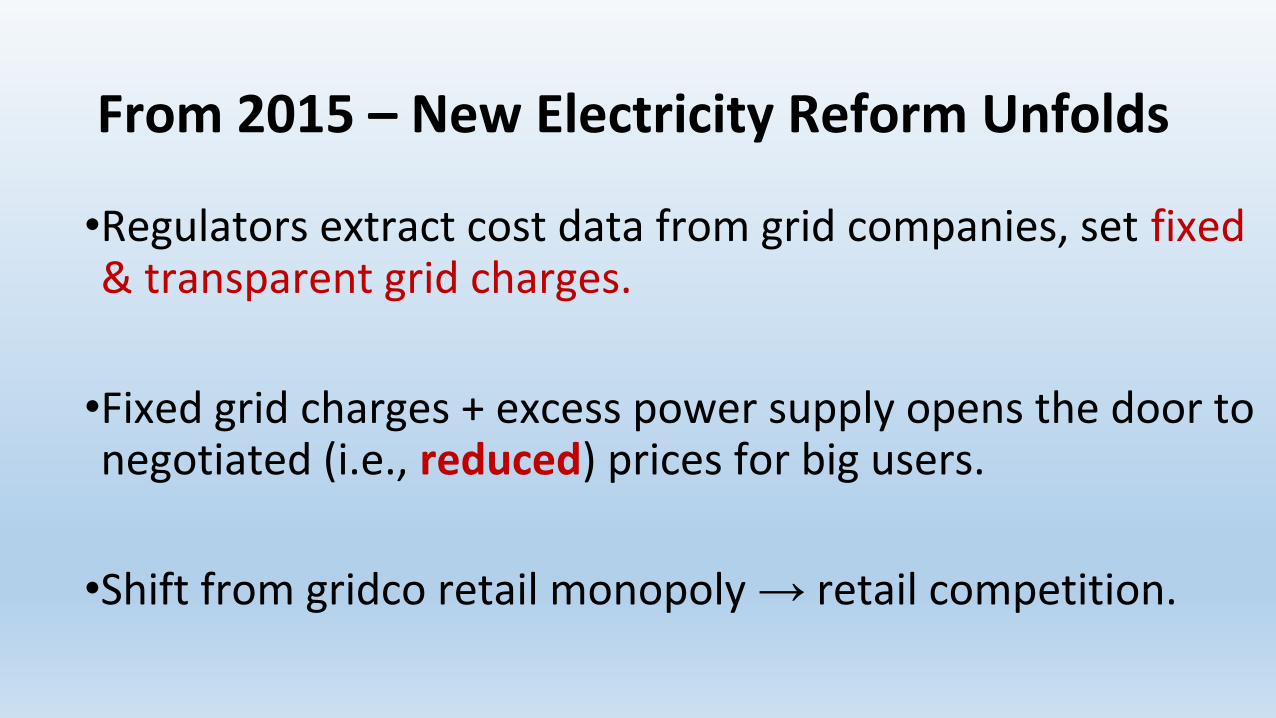
From 2015 – New Electricity Reform Unfolds
•Regulators extract cost data from grid companies, set fixed & transparent grid charges.
•Fixed grid charges + excess power supply opens the door to negotiated (i.e., reduced) prices for big users.
•Shift from gridco retail monopoly → retail competition.

From 2015 – New Electricity Reform Unfolds•Regulators extract cost data from grid companies, set fixed & transparent grid charges. Nationwide by 2017
•Fixed grid charges + excess power supply opens the door to negotiated (i.e. reduced) prices for big users. Share of market transactions 2014 10% 2015 22% now ≈ 30%
•Shift from gridco retail monopoly → retail competition. Early stages
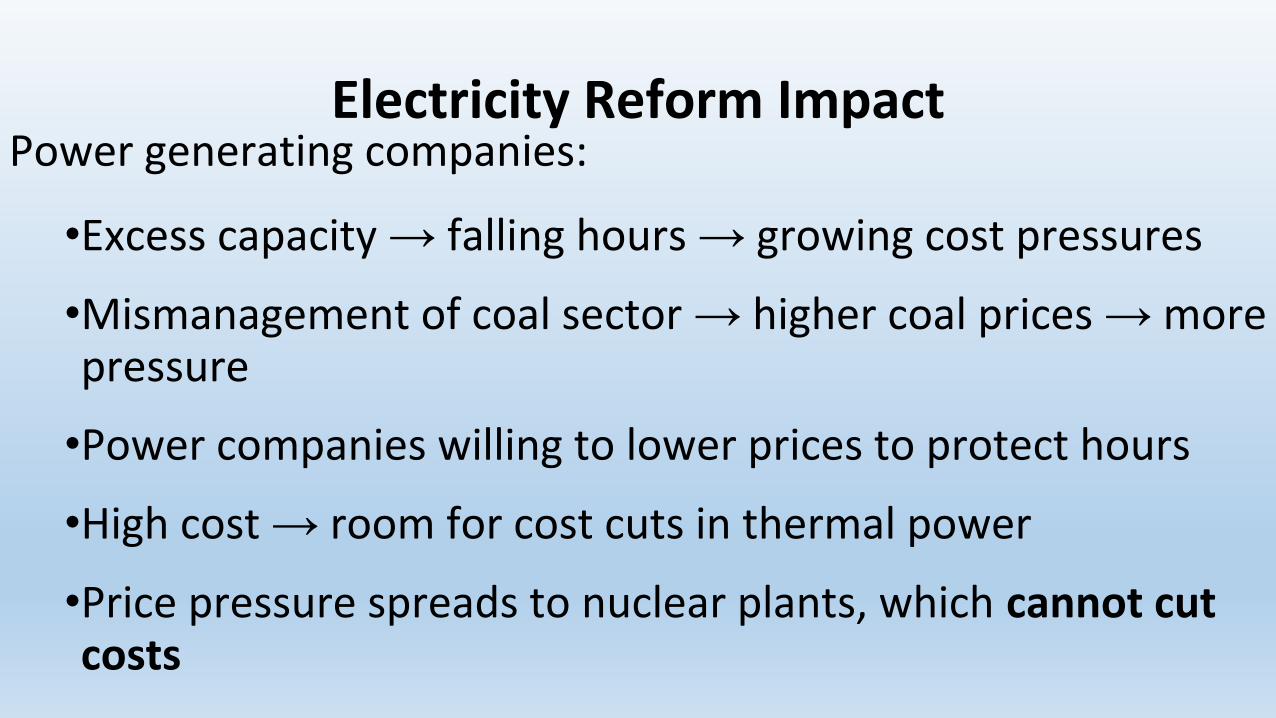
Electricity Reform ImpactPower generating companies:
•Excess capacity → falling hours → growing cost pressures
•Mismanagement of coal sector → higher coal prices → more pressure
•Power companies willing to lower prices to protect hours
•High cost → room for cost cuts in thermal power
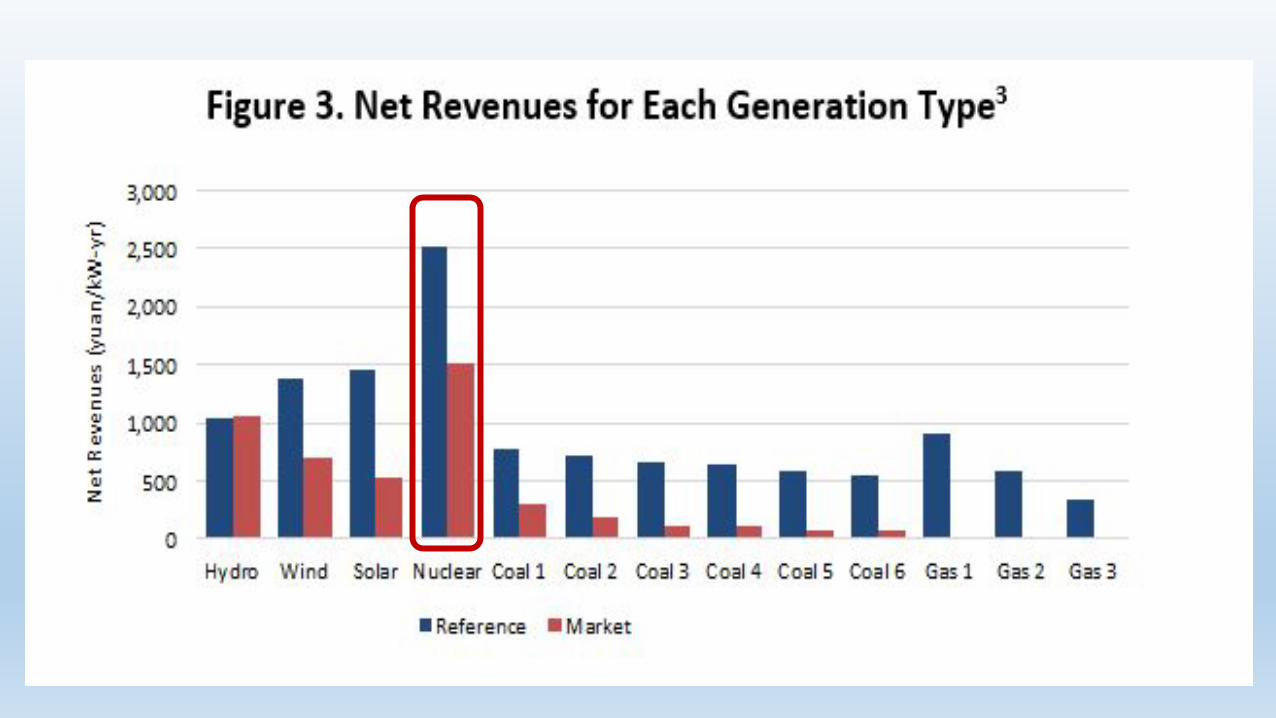
•Price pressure spreads to nuclear plants, which cannot cut costs

Guangdong: Estimated Cost Decline from Marketization
Generation cost -27%Production cost -13%

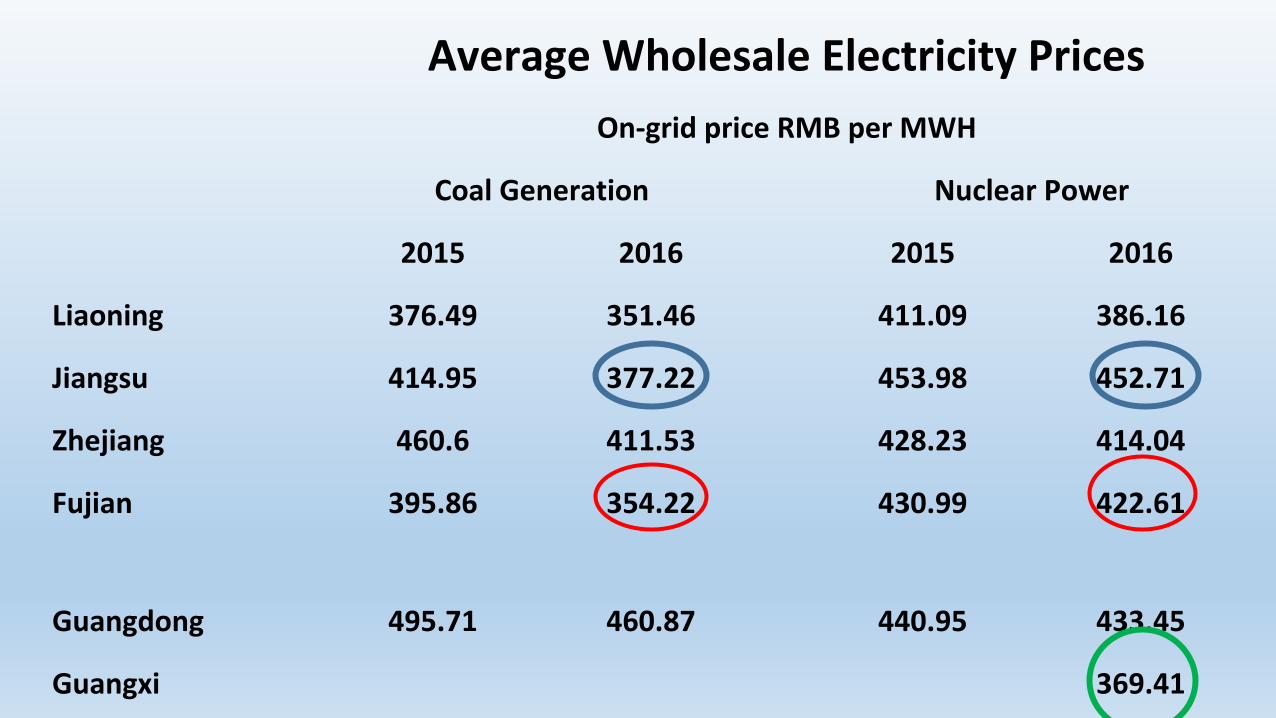
Average Wholesale Electricity Prices
On-grid price RMB per MWH
Coal Generation Nuclear Power
2015 2016 2015 2016
Liaoning 376.49 351.46 411.09 386.16
Jiangsu 414.95 377.22 453.98 452.71
Zhejiang 460.6 411.53 428.23 414.04
Fujian 395.86 354.22 430.99 422.61
Guangdong 495.71 460.87 440.95 433.45
Guangxi 369.41

Recent Contract Prices for Nuclear Power
•February 2018:•In the 2017-2018 heating season, Hongyanhe nuclear power
has an on-grid tariff of RMB 0.18/kWh
•March 2018: Jiangsu Purchases Fujian power•Nuclear power price 0.34 per KwH (14% below the 0.43 benchmark)

Nuclear Power Commercial Foundation At Risk
•Prices falling
•Hours flirting with 7000 break-even
•Market prospects frightening unless government steps in with
guaranteed purchase; carbon tax; subsidy; more effluent fees
•Absorption of nuclear power mainly depends on gov’t departments

One Country, Three Years, Two Strategies2013 – World Bank-DRC Report; CCP Central Committee Decision
• “deepen economic system reform by centering on the decisive role of the market in allocating resources” (Decision item 2)• Will “promote market-oriented reform in width and in depth [by] greatly reducing the
government’s role in the direct allocation of resources” (Item 3)
• welcome “all kinds of market players. . . on an equal basis. . . (item 9). • “increased competition in all sectors, including in strategic and pillar industries” (WB-DRC)
2015-now Xi Jinping Strategy – Made in China 2025• Expand planning, focus on state enterprises, push import substitution• Bifurcate economy into priority and remaining sectors• Priority sector: quotas and plan targets multiply

Response to Excess Energy Capacity Mirrors ChoiceElectricity expanding market forces, with mixed results
•Prices, costs down•But renewables feeling the pain; possible revival of coal•Unwanted investment boom in dual-use thermal plants
Coal Mining – state attempts to manage adjustment•Partial closure of modern, low cost, efficient mines•Shortages → price spikes and increased imports •Capacity reduction quotas parceled out to provinces •Reported coal output rose in 2017

Where is this Headed? Personal Guess
•Familiar story: a complex mix of growth drivers and blockages
•Looking backward: best results linked to openness and competition
•Current policy: is shrinking both openness and competition
•Plausible outcome: downward pressure on productivity growth (TFP)
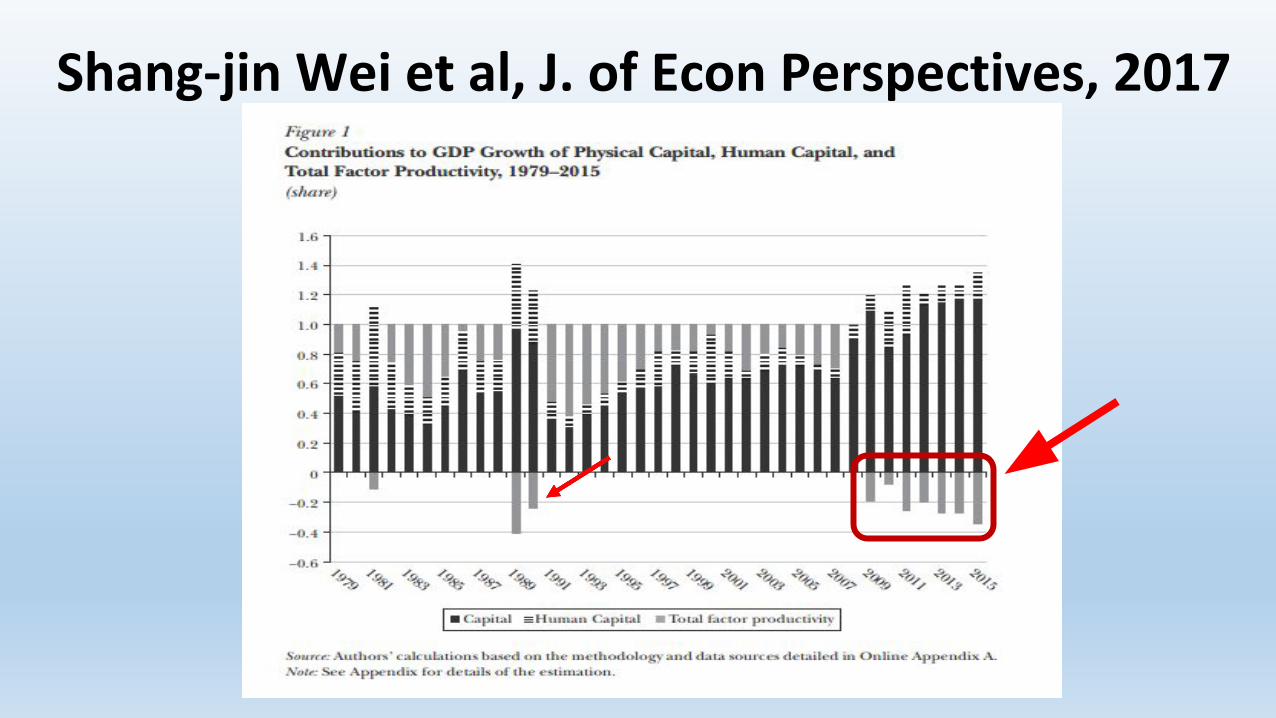
Shang-jin Wei et al, J. of Econ Perspectives, 2017

Equipment Supply Import replacement + Quality issues → RISK
Deputy Machinery Minister SHEN Liechu (2016):•Customer view: Chinese-made equipment•OK to use, but not too reliable•Why not? Small defects persist!
China Machine Industry Association head WANG Ruixiang (2018)•Industry is large but not strong•Quality and reliability are “not high”•Must shift from speed to quality improvement (sounds like 1950s!)

•Work in progress
•Comments welcomed
The End