sector analysis studies for the commercial agriculture...
TRANSCRIPT

Sector Analysis Studies for the Commercial
Agriculture for Smallholders and
Agribusiness Programme
Uganda: Country Value Chain and Market Analysis Report
Submitted to the IMC led EACDS Lot C framework (PO 7468) by LTS International Limited in
partnership with Cardno Emerging Markets UK Limited
20 November 2017

LTS International Limited
Pentlands Science Park, Bush Loan
Penicuik, EH26 0PL
United Kingdom
Tel. +44 (0)131 440 5500 Fax. +44 (0)131 440 5501 Email. [email protected]
Web. www.ltsi.co.uk Twitter. @LTS_Int
Registered in Scotland number 100833

Acronyms ASSP Agricultural Sector Strategic Plan
ACE Area Cooperative Enterprises
AfDB African Development Bank
CASA Commercial Agriculture for Smallholders and Agribusiness Programme
COCTU Coordinating Office for the Control of Trypanosomiasis in Uganda
CCFU Cross Cultural Foundation of Uganda
CDC Commonwealth Development Corporation
CDO Cotton Development Organisation
CEDO Community Enterprises Development Organization
DFID Department for International Development
DDA Dairy Development Authority
EAC East African Community
FAO Food and Agriculture Organisation of the United Nations
FEWS NET Famine Early Warning Systems Network
FSNWG Food Security and Nutrition Working Group
GDP Gross Domestic Product
HDR Human Development Report
IFAD International Fund for Agriculture and Development
IDA International Development Association of the World Bank
JICA Japanese International Cooperation Agency
MAAIF Ministry of Agriculture Animal Industry and Fisheries
MoFPED Ministry of Finance Planning and Economic Development
MWE Ministry of Water and Environment, Uganda
NAP National Agriculture Plan
NARO National Agriculture Research Organisation
NASECO Nalweyo Seed Company Ltd

NUAC Northern Uganda Agriculture Centre
NAADS National Agriculture Advisory Services
NGOs Non-Governmental Organisations
NAACRI National Crops Resources Research Institute
NRDS National Rice Development Strategy
ODA Official Development Assistance
OECD Organisation of Economic Cooperation and Development
PMA Plan for Modernisation of Agricultural Secretariat
RMCU Rice Millers Council of Uganda
SMEs Small and Medium Enterprises
SAME Smallholder Agriculture Marketing Enterprise
UBOS Uganda Bureau of Statistics
UCDA Uganda Coffee Development Authority
UEPB Uganda Export Promotion Board
UEAX Uganda East Africa Exchange
UGX Ugandan Shillings
UNADA Uganda National Agro-input Dealers Association
UNAS Uganda National Household Survey
USAID United States Agency for International Development
WRS Warehouse Receipts System

Contents EXECUTIVE SUMMARY ................................................................................................................................................. 1
1. INTRODUCTION .................................................................................................................................................. 6 1.1 STUDY OBJECTIVES ................................................................................................................................................................................ 6 1.2 METHODOLOGY ..................................................................................................................................................................................... 6
2. BACKGROUND ..................................................................................................................................................... 8 2.1 SOCIO-ECONOMIC SETTING .................................................................................................................................................................. 8 2.2 AGRICULTURE SECTOR PERFORMANCE ................................................................................................................................................ 8 2.3 DONOR LANDSCAPE ............................................................................................................................................................................ 10
3. PRODUCTION AND CONSUMPTION .............................................................................................................. 12 3.1 BEANS (PHASEOLUS VULGARIS) .......................................................................................................................................................... 12
3.1.1 Production .......................................................................................................................................................................... 12 3.1.2 Consumption ..................................................................................................................................................................... 13 3.1.3 Market Constraints .......................................................................................................................................................... 14
3.2 RICE ....................................................................................................................................................................................................... 14 3.2.1 Production .......................................................................................................................................................................... 14 3.2.2 Consumption ..................................................................................................................................................................... 15 3.2.3 Market Constraints .......................................................................................................................................................... 16
3.3 SESAME ................................................................................................................................................................................................. 16 3.3.1 Production .......................................................................................................................................................................... 16 3.3.2 Consumption ..................................................................................................................................................................... 18 3.3.3 Market constraints ........................................................................................................................................................... 20
4. DEVELOPMENT CHARACTERISTICS ................................................................................................................ 22 4.1 GENDER ................................................................................................................................................................................................ 22
4.1.1 Beans .................................................................................................................................................................................... 22 4.1.2 Rice ........................................................................................................................................................................................ 23 4.1.3 Sesame ................................................................................................................................................................................. 24
4.2 NUTRITION ........................................................................................................................................................................................... 25 4.2.1 Beans .................................................................................................................................................................................... 26 4.2.2 Rice ........................................................................................................................................................................................ 26 4.2.3 Sesame ................................................................................................................................................................................. 26
4.3 CLIMATE CHANGE ................................................................................................................................................................................ 27 4.3.1 Beans .................................................................................................................................................................................... 27 4.3.2 Rice ........................................................................................................................................................................................ 27 4.3.3 Sesame ................................................................................................................................................................................. 28
5. MARKET LINKAGES ........................................................................................................................................... 30 5.1 SPATIAL AND INSTITUTIONAL COMMODITY FLOWS ......................................................................................................................... 30
5.1.1 Beans .................................................................................................................................................................................... 30 5.1.2 Rice ........................................................................................................................................................................................ 31 5.1.3 Sesame ................................................................................................................................................................................. 32
5.2 STAKEHOLDER ANALYSIS ..................................................................................................................................................................... 33 5.2.1 Beans .................................................................................................................................................................................... 33 5.2.2 Rice ........................................................................................................................................................................................ 34 5.2.3 Sesame ................................................................................................................................................................................. 35
5.3 KEY BUSINESSES IN THE BEANS, RICE AND SESAME SUB-SECTORS ................................................................................................... 36 5.4 FINANCIAL PERFORMANCE ALONG THE MARKETING CHAIN .......................................................................................................... 38
5.4.1 Beans .................................................................................................................................................................................... 38 5.4.2 Rice ........................................................................................................................................................................................ 39 5.4.3 Sesame ................................................................................................................................................................................. 40
6. MARKET FUNCTIONS ....................................................................................................................................... 41 6.1 TRANSPORT .......................................................................................................................................................................................... 41

6.2 PROCESSING ......................................................................................................................................................................................... 41 6.2.1 Beans .................................................................................................................................................................................... 41 6.2.2 Rice ........................................................................................................................................................................................ 41 6.2.3 Sesame ................................................................................................................................................................................. 42
6.3 STORAGE ............................................................................................................................................................................................... 42 6.4 COMMODITY EXCHANGE ..................................................................................................................................................................... 42 6.5 INTRA-FIRM ORGANISATION .............................................................................................................................................................. 43
6.5.1 Horizontal and Vertical Linkages - Beans .............................................................................................................. 43 6.5.2 Horizontal and Vertical Linkages - Rice .................................................................................................................. 43 6.5.3 Horizontal and Vertical Linkages – Seasame........................................................................................................ 43
7. FINANCE AND INVESTMENT ........................................................................................................................... 44 7.1 FARMER FINANCE................................................................................................................................................................................. 44 7.2 SMAE FINANCE ................................................................................................................................................................................... 45 7.3 PRIVATE SECTOR INVESTMENT ............................................................................................................................................................ 45 7.4 GOVERNMENT AND DONOR INVESTMENT ........................................................................................................................................ 46
8. ENABLING ENVIRONMENT .............................................................................................................................. 48 8.1 GOVERNMENT INSTITUTIONS, POLICY, STRATEGY AND PROGRAMMES.......................................................................................... 48 8.2 NON-GOVERNMENTAL AND PRIVATE SECTOR ORGANISATIONS ...................................................................................................... 50
8.2.1 Market interventions....................................................................................................................................................... 51 8.3 REGULATORY FRAMEWORK ................................................................................................................................................................. 52 8.4 INFRASTRUCTURE AND UTILITIES ........................................................................................................................................................ 53
9. POTENTIAL INTERVENTIONS .......................................................................................................................... 54 9.1 SESAME ................................................................................................................................................................................................. 54
9.1.1 Linking Smallholders with Markets and Agribusinesses ................................................................................... 54 9.1.2 Supporting Agribusiness to Prepare for Investment ........................................................................................... 54 9.1.3 Enabling Environment ................................................................................................................................................... 54
9.2 RICE ....................................................................................................................................................................................................... 55 9.2.1 Linking Smallholders with Markets and Agribusinesses ................................................................................... 55 9.2.2 Supporting Agribusiness to Prepare for Investment ........................................................................................... 55 9.2.3 Enabling Environment ................................................................................................................................................... 55
9.3 BEANS ................................................................................................................................................................................................... 56 9.3.1 Linking Smallholders with Markets and Agribusinesses ................................................................................... 56 9.3.2 Supporting Agribusiness to Prepare for Investment ........................................................................................... 56 9.3.3 Enabling Environment ................................................................................................................................................... 56
10. RECOMMENDATIONS....................................................................................................................................... 57 10.1 INCREASING THE QUALITY AND QUANTITY OF SESAME SEED OFFERED FOR SALE ............................................................................ 57 10.2 INCREASING THE QUALITY AND QUANTITY OF RICE OFFERED FOR SALE ........................................................................................... 57 10.3 INCREASING THE QUALITY AND QUANTITY OF BEANS OFFERED FOR SALE ....................................................................................... 57 10.4 POTENTIAL SME PARTNERS ................................................................................................................................................................ 57
11. ANNEXES ............................................................................................................................................................ 59 ANNEX A: BIBLIOGRAPHY OF VALUE CHAIN RESOURCES .......................................................................................................................... 59 ANNEX B: STAKEHOLDERS CONSULTED, BEANS AND RICE ........................................................................................................................ 61 ANNEX C: STAKEHOLDERS CONSULSTED, SESAME ...................................................................................................................................... 67 ANNEX D: REVIEW WORKSHOP PARTICIPANTS AND SUMMARY ................................................................................................................ 68

Sector Analysis Studies for Commercial Agriculture for Smallholders and Agribusiness Programme P a g e | 1
Executive Summary This study commissioned by the Department for International Development (DFID) is focused on the
Commercial Agriculture for Smallholders and Agribusiness programme (CASA). The primary objective
of this study is to enable DFID to identify the value chains, sub-national regions and stakeholders to
form the basis for CASA’s country level interventions and use this information to develop the Terms
of Reference for the implementation of the CASA programme.
In Uganda, the study identified sesame, beans and rice value chains as the most relevant to design
short-term interventions to enhance pre-existing strengths within the value chains. The
recommendations of the study are as follows:
1. Value Chain 1: Sesame
1.1 Linking Smallholders with Markets and Agribusinesses
Investment 1: Promotion of improved sesame varieties
CASA could facilitate a smallholder-based improved sesame seed multiplication programme. Gulu
would be a suitable venue for a pilot programme, in partnership with NU-TEC. A firm such as the Gulu
Agricultural Development Company (GADC) would work with Gulu Farmers and Produce Dealers
Association (GFPDA), obtaining foundation seed from the National Agricultural Research Organisation
(NARO). The seed would be collectively multiplied by selected farmers’ groups for sale to other
producers, with the necessary technical knowledge disseminated by GADC. Cooperatives could be
facilitated to obtain credit on behalf of members for procurement of improved seeds and tractor hire
services.
Investment 2: Strengthened horizontal linkages for smallholder sesame producers
In order to facilitate collective input purchase and output marketing, CASA could support GFPDA to
strengthen and/or create farmers’ associations, or cooperative societies, in each of six districts in Gulu
as a pilot project. Ultimately, the model could be replicated in Lira and other sub-regions of Northern
Uganda. The associations or societies would engage in assembling, cleaning, grading and storage of
sesame for sale to buyers such as Olam, ETG, AgriExim, Shares! and Lira Resort. GADC could provide
farmer training in post-harvest handling and agribusiness.
1.2 Supporting Agribusiness to Prepare for Investment
Investment 1: Capacity building of sesame traders
Poor quality sesame outputs are often the result of poor handling and storage practices by traders. In
order to develop these trading businesses and make them a more attractive investment prospect,
CASA could facilitate training in good practices by GADC, while investigating potential sources of
small loans for upgrading of infrastructure such as storage and marketing premises, weighing scales,
tarpaulins, and so on.
1.3 Enabling Environment
Several buyers – including Shares! and AgriExim – would like to source organic sesame in Uganda.
This higher value product is not subject to the same price volatility as conventional sesame and
commands a premium. However, there are conflicts among organic food production and other
activities, notably the GoU’s malaria control programmes through the Ministry of Health, in which
large swathes of rural areas are treated with insecticides, notably DDT, contaminating crops and
rendering them in violation of organic production standards.

Sector Analysis Studies for Commercial Agriculture for Smallholders and Agribusiness Programme P a g e | 2
The National Organic Agricultural Movement of Uganda (NOGAMU) and Uganda Oil Seed Producers
and Processors Association (UOSPPA) are two examples of stakeholder organisations that could
engage in dialogue among their member organisations and local and national Government to
examine instances where development and land use priorities are conflicted.
In 2016, Trademark Africa worked with the Southern and Eastern Africa Trade Information and
Negotiations Institute (SEATINI) to develop a standard for sesame. There may be an opportunity for
CASA to support the implementation of this standard.
1.4 Impact
With inputs of facilitation and technical assistance from CASA, a pilot could initially target 30,000
farmers in six districts of Gulu. Given that sesame seed is planted at rates of 1-2 kg/acre (around 2.5-
5kg/ha), and assuming that each 2kg planted yields at least 200kg to be distributed to farmers, the
output would be 4,000MT at the end of year two.
By using improved seed with the correct agricultural practices, smallholders’ yields could increase
from 100MT/acre (247MT/ha) to 300MT/acre (741MT/ha). Marketable surpluses might increase from
63% to 75%. In addition, post-harvest losses could be reduced by 10% along the value chain. We
estimate that these changes could result in 30% income increases to sesame producing households,
equivalent to around USD24/smallholder/year, through increased sales as the result of greater
productivity and lower loss levels, all else being equal (sesame global market prices are somewhat
volatile).
2. Value Chain 2: Rice
2.1 Linking Smallholders with Markets and Agribusinesses
Investment 1: Promotion of use of improved rice inputs to enhance productivity
CASA could promote use of improved rice varieties and fertilizer among project farmers in order to
increase rice productivity and production, working in partnership with JICA, rice buyers and NARO,
which could supply OPV foundation seed, and selected farmers’ groups. Seed could be distributed to
farmers by buyers under the “One Kilogramme” model, in which recipients of one kilogramme of
improved seed promise to provide the same quantity to group members upon harvest. Other
financing models for sustainable linkage to seed sources could also be investigated with
implementing partners during the project design phase. OPV seed could be recycled for two years.
For fertilisers, CASA could work to support the World Bank funded Agricultural Cluster Development
Project (ACDP) in Ministry of Agriculture Animal Industry and Fisheries (MAAIF), in which licensed
private companies deliver and sell it to farmers at their cooperatives under an e-voucher system. The
International Fertiliser Development Centre (IFDC) and MAAIF could provide technical support in best
practices for fertiliser use. Cooperatives could be facilitated to mobilize agricultural credit for
members.
Investment 2: Enhancement of rice post-harvest handling, value addition, and marketing
In partnership with MAAIF, the Ministry of Trade, Industry and Co-operatives (MTIC), and rice buyers,
CASA could facilitate capacity building of farmers’ groups and associations to become cooperative
societies that will engage in collective marketing of produce in each district. The societies would take
on the functions of assembly, cleaning, grading, and improved storage of rice. Three medium-sized
rice millers (Pearl, Divine Masters and Eastern Rice) are potential partners for piloting a forward
marketing contract system. Market information could be provided to farmers, traders, and millers
under a public private partnership between MAAIF), MTIC and private market information service
providers such FIT (U) Ltd.
Sector Analysis Studies for Commercial Agriculture for Smallholders and Agribusiness Programme P a g e | 3
2.2 Supporting Agribusiness to Prepare for Investment
Investment 1: Capacity building of traders and millers for enhanced rice quality
CASA could provide rice buyers and processors with technical assistance on attaining quality
standards, and linked to loan facilities to procure post-harvest handling equipment, such as moisture
meters, and more modern processing machinery, such as de-stoners.
2.3 Enabling Environment
Rice production requires large volumes of water and has been associated with wetland destruction.
There is also the potential for pollution (nutrient enrichment leading to ecosystem change) from
fertiliser run-off and, for upland rice, for further deforestation from “slash and burn” shifting
agriculture. There needs to be dialogue between the National Environmental Management Authority
(NEMA), farmers’ representative groups, MAAIF, JICA and other interested stakeholders on
eliminating or mitigating environmental damage, for example through standards in conservation
agriculture and zoning of rice production according to impact assessments.
Secondly, there is a need to form an apex association for rice farmers – a National Rice Farmers’
Association – in order to represent producers’ interests to Government. In addition, the Uganda Rice
Millers Council (URMC) could be strengthened. In the interim, the Rice Secretariat established with
support from JICA could assist in bringing all rice value chain stakeholders together for policy
dialogue, for example in land use planning conflicts and brown import policy.
2.4 Impact
CASA could potentially reach 15,000 farmers in three selected districts in eastern Uganda. Given that
the rice seed multiplication rate is 100 and seed rate is 50kg/acre (123kg/ha), assuming that 1kg of
planted seed yields at least 50kg output, 1 acre would output 2.5MT (6.2MT/ha) in one year (one
growing season). Farmer adoption of fertiliser might reach 25% and productivity could rise from
2.5MT/acre (6.2MT/ha) to 4MT/acre (9.9MT/ha), around 80% of potential yield. Post-harvest losses
might be expected to decline from 30% to 10% and a rice producing household could potentially
increase income from rice by 50%, equivalent to around USD60-110/smallholder/year (depending on
yield), based upon our assumptions of greater productivity, increased quality and better prices.
3. Value Chain 3: Common Beans
3.1 Linking Smallholders with Markets and Agribusinesses
Investment 1: Promotion of use of improved inputs to enhance productivity and
production
CASA could promote use of improved bean varieties and fertilizer among project farmers in order to
increase bean productivity and production, working in partnership with Volunteer Efforts for
Development Concerns (VEDCO), bean buyers and NARO, which could supply foundation seed, and
selected farmers’ groups. As with rice, seed could be distributed to farmers by buyers under the “one
kilogramme” model, or other financing models for sustainable linkage to seed sources developed
with implementing partners during the project design phase. A pilot would take place in the five
districts in which VEDCO is currently operating.
Again in parallel to the rice intervention, CASA could work with ACDP, with support from MAAIF and
cooperatives for credit supply and technical assistance.

Sector Analysis Studies for Commercial Agriculture for Smallholders and Agribusiness Programme P a g e | 4
Investment 2: Enhancement of beans post-harvest handling, value addition, and
marketing
In partnership with MAAIF, the Ministry of Trade, Industry and Co-operatives (MTIC), VEDCO and
bean buyers, CASA could facilitate capacity building of farmers’ groups and associations to become
cooperative societies that will engage in collective marketing of produce in each of five districts. The
societies would take on the functions of assembly, cleaning, grading, and improved storage of beans.
Buyers such as traders, Agroways, Upland Rice Millers and the UN WFP are potential partners, and
VEDCO is a potential implementing partner for producer training. Market information could be
provided to farmers, traders, and millers under a public private partnership between MAAIF), MTIC
and private market information service providers such FIT (U) Ltd.
3.2 Supporting Agribusiness to Prepare for Investment
Investment 1: Formalisation and structuring of beans trade
To promote structured trading, bean traders/aggregators could be trained on post-harvest handling
management and quality standards and linked with Agroways and Upland Rice Millers with modern
equipment and technologies, such as grain driers and cleaners, moisture meters and triple bags.
CASA could also facilitate strengthening of vertical relationships between traders at different levels so
that market information flows improve and the marketing system is more responsive to end user
preferences.
3.3 Enabling Environment
In order to foster policy dialogue, there is a need to form an apex association for bean farmers and
traders at the national level – National Beans Farmers Association and National Beans Traders
Association – in addition to strengthening the Beans Secretariat established with support from USAID.
3.4 Impact
We assume that the bean seed multiplication rate is 40 and seed rate is 40 kg/acre, 1 kg planted
yields at least 20 kg, and that on giving back 1kg, a farmer retains 20kg that will plant 0.5 acre with
total output of over 0.4 MT over two growing seasons. The proportion of project farmers using
improved seeds and fertilisers might reach 75% and 25%, respectively. This would result in
productivity increases from 500 MT/acre to 1,200 MT/acre (75% of potential yield) over two seasons,
a 20% decline in post-harvest losses and an increase in marketable surplus from 20% to 50% in
beneficiary farming households. This increased output (and, therefore assumed sales) and reduced
losses might translate into an income increase of 50%, equivalent to around USD21/smallholder/year,
all else being equal. Clearly, if there were large-scale increases in bean output, local prices may be
depressed, depending upon demand side dynamics.
4. Potential SME partners
The table below identifies SMEs that were identified by the study as having potential for further
engagement with the programme.
Table 1: Potential SME Partners in CASA Value Chains
Business Sector Comments
Agroways
Ltd.
Beans Operates in one of the major beans growing areas of Uganda (Busoga sub-
region). Bean surpluses could be aggregated at farmer group level and
delivered to Agroways for cleaning, drying, storage and sale, which has
eight satellite stores managed by farmer groups.

Sector Analysis Studies for Commercial Agriculture for Smallholders and Agribusiness Programme P a g e | 5
Upland Rice
Millers Ltd.
Rice,
beans
Also located in the Busoga sub-region, where both beans and rice are
produced and traded.
Divine
Masters Ltd
Rice Has stated plans to bring more smallholders into rice production.
Eastern Rice
Company
Ltd.
Rice Has stated readiness to engage with more smallholder farmers if
supported.
Pearl Rice Will receive an IDB loan, but only for construction of dams.
Gulu
Agricultural
Development
Company
(GADC)
Sesame Works with a large number of smallholders. Although it has received some
previous DFI support, CASA could facilitate expansion of its smallholder
engagement.
Lira Resort Sesame The only potential SME operating in the Lango sub-region, a major
producer of sesame.

Sector Analysis Studies for Commercial Agriculture for Smallholders and Agribusiness Programme P a g e | 6
1. Introduction 1.1 Study Objectives
The Department for International Development (DFID) is in the process of finalising the terms of
reference for the Commercial Agriculture for Smallholders and Agribusiness programme (CASA). It is
envisaged that the programme will have four components: i) Country-level interventions; ii) Global
knowledge and policy influencing activities; iii) Smallholder development facility; and iv) Community
engagement activities.
The primary objective of this study is to enable DFID to identify the value chains, sub-national regions
and stakeholders to form the basis for CASA’s country level interventions (Component 1) and to
enable DFID to use this information to develop the Terms of Reference for the implementation of this
component of the CASA programme. The objectives of the studies are to:
Identify two value chains in Sierra Leone, Mozambique, Uganda, Tanzania, Malawi, Myanmar and
Nepal which offer the best potential to increase economic opportunities for smallholder farmers.
Identify potential interventions within the recommended value chains to develop commercial
agriculture in line with the CASA objectives and approach. The studies will identify opportunities
to:
o Establish, support or expand smallholder aggregation and access to markets, particularly
for poorer farmers, women and those not currently engaged in commercial agriculture.
o Support SME agribusinesses with significant smallholder supply chains to prepare for and
attract early stage investment;
o Support organisations which bring together stakeholders to advocate for regulatory
reform and identify possible reforms which would boost growth in the value chain and
increase the ability of smallholders to participate in it.
In addition to conducting sector analysis studies, findings from the studies will be synthesised into an
overall recommended scope of activity for CASA in three countries, of which one must be defined as
a fragile or conflict affected state by DFID and one must be in Asia.1
The purpose of this Country Sector Analysis Report is to i) describe selected value chains and detailed
rationale for their selection; ii) provide examples of specific opportunities for intervention at the level
of smallholder aggregation, supporting agribusinesses to prepare for investment and advancing
enabling environment reforms; and iii), describe the existing donor landscape of activities within the
value chain.
1.2 Methodology
This Country Sector Analysis Report is largely the result of three weeks fieldwork carried out between
14th August and 1st September, 2017 (beans and rice), and two weeks in November 2017. The majority
of this work was carried out by the Study Country Lead, supported by the Core Consultant, who also
participated in fieldwork between 5th September and 10th September, and, in the case of sesame, by a
1 Terms of Reference: Sector Analysis Studies for the Commercial Agriculture for Smallholders and Agribusiness Programme

Sector Analysis Studies for Commercial Agriculture for Smallholders and Agribusiness Programme P a g e | 7
national consultant, who undertook additional fieldwork and provided inputs to a home-based
international consultant.
The subject of the fieldwork, rice, beans and sesame were selected through a desk-based short-listing
and scoring process. Firstly a long-list of value chains was prepared based on area grown and value
of production. The long-list was assessed using ‘Inclusion Criteria’ to create a short-list (Ref: Value
Chain Short-List Report) which was approved by DFID. The short-list was then assessed using a
weighted scoring matrix (Ref: Short-Listed Value Chain Scoring Report) with the top two ranked value
chains selected to undergo detailed fieldwork. The results of the ranking were shared and agreed
with DFID Senior Advisors and Country Offices before fieldwork proceeded.
A Research Framework, provided in Annex C, was prepared to guide semi-structured interviews and
focus group discussions with key value chain stakeholders. The Framework was reviewed by DFID
Senior Advisors and revised according to their feedback before use.
Consultations with stakeholders in the main production areas included:
Private sector investors, banks, private equity funds, impact investors, DFIs (e.g. CDC),
AgdevCo, multinational companies;
Agribusinesses;
Producer organisations, cooperatives and other organisations representing smallholders;
Key government officials from the Ministry of Agriculture, Ministry of Trade and other relevant
ministries;
NGOs and civil society organisations active in the value chain and in supporting smallholder
market access;
DFID country office advisers and staff from relevant commercial agriculture programmes, and;
Other donors active in commercial agriculture and the proposed value chains.
A bibliography of documents reviewed is provided in Annex A and the full list of interviewees is
presented in Annex B.
On 6 September 2017, during the latter part of the fieldwork period, a Review Workshop was held in
Kampala with key value chain stakeholders with the purpose of soliciting feedback on the proposed
interventions. A list of participants and summary of key points raised is included in Annex D.

Sector Analysis Studies for Commercial Agriculture for Smallholders and Agribusiness Programme P a g e | 8
2. Background 2.1 Socio-economic Setting
A land-locked country in East Africa, Uganda has a population of 38.3 million, with an estimated
growth rate of 3.22% (CIA 2016). Currently, 6.2 million (16.1%) live in urban areas, and this number is
growing at a rate of 5.43% annually (CIA 2015).
In 2016, Uganda had a GDP per capita of $2,100 in US dollars, and an annual GDP growth rate of
4.9% (CIA 2016). The agriculture sector contributed to 24.5% of GDP, industry 21%, and services
54.5%. The annual growth rate of industrial production was 5% (CIA 2016).
As is the case elsewhere in Africa, the Uganda Investment Authority (UIA 2016) identified SMEs as one
of the key drivers for economic growth, along with economic liberalisation. African small businesses
account for 80% of the continent’s employment.
The country’s poverty and nutritional status is poor, with 19.7% of the population below the poverty
line (CIA 2013), and an average life expectancy at birth of 55.4 years (CIA 2016). Adult obesity is
estimated at 3.9% (CIA 2014), and 14.1% of children under five years of age are underweight (CIA
2011).
2.2 Agriculture Sector Performance
In 2013, 71.9% of Uganda’s population (29.8m) worked in agriculture (CIA 2013). This, along with its
natural resource endowment, makes it highly suitable for agricultural production and processing. The
climate is mostly tropical; generally rainy with two dry seasons (December to February and June to
August) but the North-Eastern region has a semi-arid climate. In 2011, an estimated 71% of land was
used for agriculture, of which around 34% was arable, 11% was under permanent crops, and 26 %
was devoted to permanent pasture (CIA 2011). The most important crops by area planted, production
volume and value are presented in Table 2 below.
Table 2 Area, production and value of Uganda’s most important crops in 2014
Uganda
Value Chains
Area Planted
(‘000ha or ‘000 head)
Production
(‘000 MT)
Value
(‘000 $)
Maize
Banana
Cassava
Dry Beans
Sweet potato
Groundnut
Coffee
Sorghum
Soybean
Sesame
Fresh vegetables
Rice
1,105
140
852
674
454
422
401
373
46
207
140
95
2,763
586
2,812
n/a
1,863
296
220
299
23
124
856
237
347
165
293
506
140
121
236
41
6
82
161
63
Source: FAOSTAT 2014
In 2008, The Uganda Bureau of Statistics (UBOS) conducted an agricultural census (UBOS 2011) and
estimated that Uganda has around 3.95m agricultural households, of which around 20% were female-
headed and the sex ratio of occupants was 1.02 males:females. Around 80% of Ugandan women are
employed in the agricultural sector, contributing around 75% of agricultural production (Musimami
2012). However, they control less than 20% of outputs and female producers continue to experience

Sector Analysis Studies for Commercial Agriculture for Smallholders and Agribusiness Programme P a g e | 9
challenges in accessing the factors of production, with average productivity 17% less than that of
men or joint family production initiatives (MAAIF 2016).
Around 28% of these households were in the Western region, with 28% and 21% in the Eastern and
Central regions, respectively. Around 30% of agricultural households engaged in off-farm productive
activities such as manufacturing activities and the operation of hotels and restaurants. The average
farm size in Uganda is 1.1 ha. An estimated 91.7% of agricultural households used locally produced
seeds, and 31.1% used improved seeds.
Increasingly volatile weather patterns have begun to impact farmers, with prolonged droughts and
unpredictable rainfall. In 2010, major flooding near Mount Elgon destroyed 60,000 coffee trees. Rising
temperatures have also been causally linked to the spread of plant pests and diseases. In Eastern
Uganda, coffee leaf rust, usually found at lower altitudes, is increasingly occurring at higher altitudes
(Musimami 2012).
The distribution of agricultural inputs is a decentralized service that is mainly undertaken by MAAIF
and the semi-autonomous agencies through local government institutions to ensure product delivery
at market prices to intended beneficiaries. The MAAIF is a regulator of both importers and
distributors of inputs to farmers directly through local governments, service providers such as nursery
operators, agro-dealers and distributors, and cooperatives whose responsibility is to ensure timely
delivery of all inputs to farmers.
Inputs are procured in compliance with the Public Procurement and Public Asset Authority (PPDA) Act
of 2003, for distribution to farmers before the planting season based on the ecologies in the different
agricultural sectors.
The inputs are delivered to district stores or beneficiaries by suppliers under each project. For
instance with the National Agricultural Advisory Service (NAADS), the main programme through
which government provides inputs, communities work with private suppliers to source inputs and the
districts quality assure. Farmers at various district level are also empowered to oversee the supply and
distribution of agricultural inputs for some projects, and inputs sourced under the MAAIF are
distributed directly to beneficiaries by private suppliers.
Projects under PPPs, such as the Vegetable Oil Development Project (VODP) import all agricultural
inputs. The seeds are raised in private nurseries and later distributed to beneficiaries. Inputs sourced
under the National Agriculture Research Organization (NARO) are produced at research centres and
later distributed to farmers for multiplication. Projects that source inputs under the private sector,
such as the Cotton Development Organization, buy inputs from processors (in this case, ginners) and
distribute them to farmers at a subsidized price.
Failure of local governments to follow established criteria for distribution has resulted in wastage and
abuse of the practice, and inputs distributed are often of poor quality.
In acknowledgment of its central economic importance and cross-sectoral linkages, in 2016, the
Government increased the agriculture sector budget allocation by 65% to UGX 832.42bn (Deloitte
2016). In the financial year 2016/17, the Ugandan Government outlined the following priorities for the
agricultural sector, in accordance with the national budget strategy, and the National Development
Plan 2:
• Implement the refined Agriculture Single Spine Extension System;
• Control of pests, vectors and diseases in both crops and animals;
• Availability of quality inputs at farm level;

Sector Analysis Studies for Commercial Agriculture for Smallholders and Agribusiness Programme P a g e | 10
• To increase water for agricultural production at farm level through direct public project
support and subsidise the construction of small scale on-farm valley tanks and valley dams;
• Intensify its efforts to support value addition and primary processing of the national priority
and strategic commodities;
• Intensify regulation and enforcement activities in crop, livestock and capture fisheries.
2.3 Donor Landscape
Overall Official Development Assistance (ODA) disbursements to Uganda have remained relatively
unchanged, if one excludes the debt relief in 2006. By 2015, total disbursements amounted to $1.7bn
which represents a 28% increase.
Figure 1 Official Development Assistance Disbursements Uganda, 2005-2015
Roughly half of funding to Uganda comes from the thirty OECD-DAC donors, who -- when averaged
between 2005 and 2015 -- account for roughly 55% of funds. Using the latest CRS figures (2015) the
five largest donors are: the World Bank ($619m), the United States ($596m), the Global Fund ($376m),
Japan ($185m) and the United Kingdom ($136m).
Agricultural aid has remained relatively stable but grown at a much slower rate than overall aid to
Uganda. Between 2005 and 2015, agricultural ODA grew by 7% -- reaching $109m in 2015. This is
significantly slower than the overall growth in aid disbursements of 28%.
The role between bilateral DAC donors and multilaterals has seemingly reversed, with the bilateral
donors now responsible for over 90% of agricultural aid. One reason for this is the decline in funding
from the World Bank, who in 2005 disbursed $51.5m but by 2015 this had fallen to $8.2m.

Sector Analysis Studies for Commercial Agriculture for Smallholders and Agribusiness Programme P a g e | 11
Figure 2 Agricultural Disbursements to Uganda, 2005-2016
The five largest agricultural donors as of 2015 were: the United States ($44m), the United Kingdom
($15m), the Netherlands ($12.5), the World Bank ($8m) and Denmark ($5.5m). There are 827
agricultural projects on the International Aid Transparency Initiative (IATI), of which 179 are active.
The highest concentration of projects, and active projects, are within the sub-sectors: “agricultural
development”, “agricultural policy” and “agricultural research” (Figure 3).
Figure 3 Uganda Agricultural Projects on IAITI by Subsector
The World Bank has also taken a market-orientated approach, in that they are currently working with
the Uganda Ministry of Agriculture to intensify on-farm production of cassava and beans.
Additionally, they are investing to improve post-harvest handling, storage and the capacity of
farmers’ associations to improve their capacity for marketing produce. The United States are
investing more towards infrastructure projects, with particular benefit to smallholder farmers, to
improve the storage facilities of beans and maize. Additionally, USAID have been working to
strengthen bean and maize value-chain management, service delivery and overall institutional
knowledge. Heifer International have, however, sought to invest in increasing sesame and beans
productivity in the areas of Ruhiira and Keberamaindo so as to tackle food immediate insecurity.

Sector Analysis Studies for Commercial Agriculture for Smallholders and Agribusiness Programme P a g e | 12
3. Production and Consumption
3.1 Beans (Phaseolus vulgaris)
3.1.1 Production
Dry beans are becoming an increasingly important aspect of Uganda’s agricultural output. In 2014,
national production was at around 880,000 MT from an estimated area of 674,000 ha (FAO data),
dominated by the Western and Northern regions. It is estimated that 1.5 million smallholders
produce dry beans on an average farm size of 0.45 ha. There are two annual cropping seasons, March
to June and September to December (Larochelle et al. 2015). In 2010, it was estimated that around
32% of production was consumed directly by households, with 32% sold, 23.5% stored for later use,
and 12.5% used for other purposes such as seed for next season planting (UBOS data). However, dry
beans have since become more significant to smallholders as a cash crop.
FAO data for dry beans production in East and South Africa in 2014 is presented in the charts below.
Figure 4 Dry Beans Yield by Country (kg/ha)
Source: FAO 2014
Between 1999/2000 and 2005/06, there was a 151% expansion in average household land area
allocated to bean production, whilst output only grew by 34%, as yield declined by 64% during the
same period. FAO data suggests that Ugandan bean production dropped between 2005 and 2012
despite an expansion in production area of 28% (Larochelle et al. 2015). As is evident in the figures
above, Uganda is a regional leader in productivity and second only to Tanzania in total output.
Increased productivity can be achieved through high quality seed inputs such as Rhizobia, support for
improved pest and disease control, and strengthening mechanisation and extension services (MAAIF
2016).
At the time of writing, bean producers can earn gross margins in the range of UGX 170,000-400,000
per ha per season, depending on the production technology used. Improved bean varieties can
generate in excess of 30% greater profitability in comparison with local varieties (Kraybill & Kidoido
2009).
5853
8914
14713 13006
9825
0
2000
4000
6000
8000
10000
12000
14000
16000
Total
Yiel
d (
kg/h
a)
Country
Kenya
Rwanda
South Africa
Uganda
United Republic of Tanzania

Sector Analysis Studies for Commercial Agriculture for Smallholders and Agribusiness Programme P a g e | 13
Figure 5 Dry Beans Production by Country (tonnes/year)
Source: FAO 2014
3.1.2 Consumption
On average, beans are consumed on around three days per week and are important to Ugandan
household diets (Larochelle et al. 2015). Annual per capita bean consumption is around 9.8kg
(Larochelle et al. 2015). Bean plant products are consumed either fresh – green leaves, green
immature pods and/or fresh grains – or dry. The fresh form is consumed when the crop is immature
and is particularly popular in rural areas, where consumption peaks in the months of November and
June (Larochelle et al. 2015). Consumption of fresh beans also increases in urban areas during these
months but to a lesser extent.
The fresh grain is preferred to the dry bean because of its fresh flavour, improved taste, and reduced
cooking time. However, this preference renders it more expensive and it is thus less affordable to
low-income urban households (rural households can consume their own production). In addition,
fresh beans are more perishable and harvesting and primary processing can take up to three weeks.
Consequently, the demand for fresh beans is much lower than for dry beans in urban areas
(Larochelle et al. 2015).
In the months of February and March, fresh bean consumption is at its lowest in rural areas, with a
knock on effect to urban consumption, which is at its lowest rate in March and April at an average of
around 0.1 days per household per week. During these periods, only dry beans are available and
traded in most parts of the country. Monthly variability in trading is not as marked for dry beans as it
is for the fresh product. Between January and June, dry beans are marketed from rural to urban
households, generating cash income for smallholders but reducing the amount available to them for
consumption. Meanwhile, the quantity of dry beans available for urban consumption increases
(Larochelle et al. 2015).
Uganda is a net exporter of beans, and trades around 20% of production (UEPB 2005). Around 28,000
MT of dried beans were exported in each of the years 2011-16. A peak of 41,141 MT was recorded in
2009. Formal annual fresh bean exports are generally less than around 4,000 MT. The main markets
are Kenya, South Sudan, Democratic Republic of Congo, Tanzania, Burundi, UK and USA (Kilimo Trust
2012). Cross-border trade also includes informal and unregistered sales. At the time of writing, beans
sell for around UGX 2,800-3,500/kg, but prices fluctuate seasonally and according to quality – the
market prefers a clean, dry product of a single variety and free from weevil infestation.
615992
415259
82130
876576
1114500
0
200000
400000
600000
800000
1000000
1200000
Total
Pro
du
ctio
n (
ton
nes
/yr)
Country
Kenya
Rwanda
South Africa
Uganda
United Republic of Tanzania

Sector Analysis Studies for Commercial Agriculture for Smallholders and Agribusiness Programme P a g e | 14
3.1.3 Market Constraints
Key challenges identified through the stakeholder interviews and desk reviews undertaken in this study are
presented in the table below.
Table 3 Market System Constraints for the Bean Value Chain
Constraints Effects on the poor Systemic issues
Poor quality, mixed products
offered to market
Poor consumers receive poor
quality products
Prices, and therefore producer
incomes, are limited
Weak extension support systems for
producers; information failures
Low adoption rates of improved
seed varieties and fertiliser
Limited productivity and
incomes for smallholder farmers
Weak improved seed and fertiliser
markets with limited availability
Weak extension support systems for
producers; information failures
Underdeveloped agricultural micro-
finance markets
3.2 Rice
3.2.1 Production
In 2014, rice production was around 237,000 MT from an estimated area of 95,000 ha (FAO data).
Around 60% of production is of lowland varieties and 40% of upland varieties (JICA 2013). The
Eastern region accounts for around 67% of production, followed by the Northern region at around
23%. Production, particularly of upland varieties, is greatly increasing in the North, West, and East-far
regions (JICA 2013). Around 77,000-103,000 smallholders are engaged in rice production, with an
average farm size of 0.4 ha. Rice is produced from February to June and August to December
(Ricepedia 2014). According to UBOS (2011), around 24% of production was consumed in-household
and 54% sold for cash. The figures below present FAO productivity and production data for East and
South Africa in 2014.
Figure 6 Rice Yield by Country (kg/hectare)
Source: FAO (2014)
39543
30594 26512 24947
27382
0
5000
10000
15000
20000
25000
30000
35000
40000
45000
Total
Yiel
d (
hg/
ha)
Country
Kenya
Rwanda
South Africa
Uganda
United Republic of Tanzania

Sector Analysis Studies for Commercial Agriculture for Smallholders and Agribusiness Programme P a g e | 15
Figure 7 Rice Production by Country (tonnes/year)
Source: FAO (2014)
Indicative gross margins are in the range of UGX 1,250,000-2,250,000/ha/season, depending on the
production technology used and the resulting productivity (Kraybill and Kidoido 2009). The use of
improved seed varieties and best practices can triple profitability. The graphs in Figure 6 and 7
demonstrate that Uganda is the worst regional performer in terms of rice yields, but is the second
highest producer. Productivity can be increased through the multiplication and distribution of
improved foundation seed, mechanisation of rice production, efficient irrigation infrastructure and
provision of extension services.
Climate change forecasts suggest that by 2050, global rice prices will increase between 32-37% and
that productivity will fall by 15% in Sub-Saharan Africa (Nelson et al. 2009). Rice production is a
substantial source of greenhouse gasses although there are methods, such as growing rice in flooded
fields that can reduce this.
3.2.2 Consumption
According to FAO data for 2014, an estimated 70,000MT of the 237,000MT of rice produced were
exported. Estimates of exports as a proportion of national production range from 20-27%. With total
rice consumption for 2014 estimated at 174,186 MT (FAO data) – and per capita consumption at
around 6-8kg (MAAIF 2012) – there existed a deficit filled by imports, mainly from Kenya, Tanzania,
and Rwanda (JICA 2013). Uganda’s population growth and urbanisation means that rice consumption
is expected to continue to rise and the country will remain a net importer of rice in the medium term.
Kampala receives around 46% of the rice marketed, which is then distributed nationally. At the time
of writing, locally produced rice sells for around UGX 3,000–3,800/kg but previously in 2017 prices
reached UGX 4,000/kg. Upland rice prices have recently tended to be more stable than those of
lowland varieties, although this may change according to rainfall patterns.
112263 72723 3056 237000
2621034
0
500000
1000000
1500000
2000000
2500000
3000000
Total
Pro
du
ctio
n (
ton
nes
/yr)
Country
Kenya
Rwanda
South Africa
Uganda
United Republic of Tanzania

Sector Analysis Studies for Commercial Agriculture for Smallholders and Agribusiness Programme P a g e | 16
3.2.3 Market Constraints
Table 4 Market System Constraints for the Bean Value Chain
Constraints Effects on the poor Systemic issues
Low rates of improved seed and
fertiliser use
Limited yields and incomes from
rice
Weak input supply system with low
output and availability of trustworthy
improved seed
Weak extension channels and
information failures
Underdeveloped agricultural micro-
finance markets
Widespread presence of
counterfeit seed and fertiliser
Low productivity despite
investment, limiting profitability
and disincentivising input use,
further limiting output
Weak input systems with low output
and availability of trustworthy
improved seed and quality assured
chemical inputs
Weak regulatory and enforcement
frameworks/capacities
Limited investment in modern,
efficient processing machinery
Sub-optimal conversions rates
and output quality limit
profitability along the value
chain and, therefore, farmer
incomes
Price-quality disconnect, with no
reward for better quality outputs and,
therefore, a weak business case to
invest in modern machinery
Scattered production and lack of
collective input purchase and
output marketing
High transaction costs and low
bargaining power limit incomes
for smallholders
Weak horizontal coordination of
producers
Environment-agriculture conflicts
3.3 Sesame
3.3.1 Production
Sesame is a vigorously growing plant that requires little farming support and can perform well under
drought conditions, in high heat, with residual moisture in the soil. In 2014, Uganda was the seventh
largest producer of sesame seeds in Africa and the 12th largest in the world.2 Sesame ranks second to
groundnuts in Uganda’s major oil crops and is mainly produced by small-scale farmers in the North
of the country (93% of the 2008-09 production was derived from this area). The recently improved
security in the region after a long period of instability has enabled the development of its agriculture.
White and brown types are grown in Uganda, with the SERRA and Sesi-1 species dominating.
According to FAO statistics, sesame production peaked at around 216,000MT in 2012, but more
recently has settled at around 124,000MT. Production of seed material has similarly plateaued, in this
case at around 2,000MT.
2 FAOSTAT

Sector Analysis Studies for Commercial Agriculture for Smallholders and Agribusiness Programme P a g e | 17
Figure 8 Sesame for Marketing and for Seed Production in Uganda 2007-2014
Source: FAOSTAT
The area planted grew exponentially from less than 200ha until 2010 to over 200,000ha in 2012,
where it had remained until the last available data in 2015. Yield remains stable, and relatively low, at
around 0.60MT/ha – Uganda ranked 39th in the world for productivity in the 2014 FAOSTAT dataset,
behind Burkina Faso (0.63MT/ha) the Central African Republic (0.64MT/ha), Ethiopia (0.69MT/ha),
Cameroon (0.74MT/ha), Nigeria (0.78MT/ha), Benin (0.78MT/ha), and Tanzania (leading African
nations’ productivity at 1.23Mt/ha; Italy was by far the most productive sesame producer in the world
at 17.62MT/ha). It is clear that the inertia in national sesame production over the period of available
data was related to stagnation in both yield and planted area.
Figure 9 Area planted and yield of sesame in Uganda, 2007-15.
Source: FAOSTAT (yield) and Uganda Bureau of Statistics (area planted)
In the main northern Uganda production area, and also in the eastern region, where rainfall is
bimodal, there are two seasons – March-April to June-July and August-September to November-
December. In good years, the sesame crop is significantly larger in the second season than in the first
due to a larger production area and higher yields, although quality tends to be higher from the
second harvest because more time is available for drying. Farming methods employed in sesame
1600
1650
1700
1750
1800
1850
1900
1950
2000
2050
2100
0
50
100
150
200
250
2007 2008 2009 2010 2011 2012 2013 2014
Seedproduction,MT
Production,MT
Thousands
Year
Production,MT Seedproduction,MT
0
0.1
0.2
0.3
0.4
0.5
0.6
0.7
0.8
0.9
0
50
100
150
200
250
2007 2008 2009 2010 2011 2012 2013 2014 2015
Yield,M
T/ha
Areaplanted,ha
Thousands
Year
Areaplanted,ha Yield,MT/ha

Sector Analysis Studies for Commercial Agriculture for Smallholders and Agribusiness Programme P a g e | 18
production are simple and have not changed over many generations . Farmers use draught animals
for land preparation, plant by broadcasting and weed, harvest, dry and thresh manually. As such,
sesame farming is characterized by low resource use with little mechanization or use of inorganic
fertilizer and chemical pesticides.
The oil produced from the local sesame variety grown in Uganda is distinctive in that it is grown
organically and has a very high oil content. Referred to locally as simsim, almost every farmer in the
North Nile zone grows it in rotation with cotton.
The top exporters of sesame seeds by value were India (USD395m), Burma (USD 165m), Tanzania
(USD 129m), China (USD 48.9m) and Pakistan (USD 31.6m) with a global total value of USD976m3.
Uganda is a net exporter of the crop – the quantities and values of imports of the seed were trivially
small over the period of available data, whereas exports had grown from just over 900MT in 2003 to
over 22,000MT in 2013, closely tracked by value (USD28.4m in 2013).
Figure 10 Uganda Sesame Import Value and Volume, 2003-13
Source: FAOSTAT
3.3.2 Consumption
Sesame seed is one of the oldest oilseed crops known, domesticated well over 3,000 years ago. It has
one of the highest oil contents of any seed (typically around 50-55% edible oil and 25% protein,
although Ugandan varieties may have as much as 76% oil content). There are four main end markets:
home consumption, urban market grain trading, processed market sales and export grain. In Uganda,
commercial uses for sesame are expanding and include use in oil extraction, confectionery and animal
feeds.
It is sometimes sold with its seed coat removed (decorticated), and this variety is often present on top
of baked goods (breads, buns and bagels, in crackers and in cakes) in many countries. The ground
seeds are used in East African cuisine in soups and fish dishes. They are also used in sweets, including
a dish similar to peanut brittle. Ground seeds are also used as a condiment in some Asian and Indian
dishes.
3 UN COMTRADE data accessed through the MIT Observatory of Economic Complexity interface
0
0.5
1
1.5
2
2.5
3
3.5
0
1
2
3
4
5
6
7
8
2003 2004 2005 2006 2007 2008 2009 2010 2011 2012 2013
Importvolume,MT
Importvalue,USDx1,000
Year
Importvalue,USDx1,000 Importvolume,MT

Sector Analysis Studies for Commercial Agriculture for Smallholders and Agribusiness Programme P a g e | 19
Sesame oil keeps well and resists rancidity, giving it an outstanding shelf life due to the presence of
antioxidants including sesamolin and sesamol. This quality makes it applicable for use in the
manufacture of margarine in many parts of the world where there is inadequate refrigeration.
Figure 11 Uganda Sesame Import Value and Volume, 2003-13
Source: FAOSTAT
Commercially, the oil comes in two types – a pale yellow liquid with a pleasant grain-like odour and
somewhat nutty taste, and an amber-coloured and aromatic variant made from pressed and toasted
sesame seeds. The former is high in polyunsaturated fats, ranking fourth behind safflower, soybean
and corn oil. It is excellent for use as frying oil, in cosmetics and in food preparations. The latter is a
popular ingredient used as a flavouring agent in the final stages of cooking in ethnic cooking (and
not used as a cooking oil because the flavour is too intense and it burns quite easily). Sesame oil is
also used in paints, soaps, cosmetics, perfumes, bath oils, insecticides and pharmaceuticals (vehicle
for drug delivery). Poppy seed, cotton seed and rape oils are frequently added to sesame oil.
It is naturally antibacterial, antiviral and anti-inflammatory, effective against common skin pathogens
as well as common skin fungi. The oil for pharmaceutical use is extracted from high-quality seed and
is more refined than that intended for human consumption or other “food-grade” (cosmetic)
applications. Sesamolin and sesamol maintain fats and increase vitamin E activity dramatically. They
are also being researched as potential industrial antioxidants, as well as nutraceuticals and potential
templates for synthetic pharmaceutical compounds.
When the seeds from food-grade, high-oil sesame are extracted, the resulting sesame meal contains
34-50% protein. This meal is often blended with other flours for baking and other food uses. The
sesame meal remaining after the oil is pressed from less desirable food-grade or non-food-grade
seed is an excellent high-protein feed for poultry and livestock. Both sesame meal and flour can be
added to recipes to give a better nutritional balance to health food products. The antioxidants
naturally found in sesame increase the shelf life of other food products produced with the flour.
Tahini, a traditional Middle Eastern sesame paste, is made from hulled sesame seed. Dip and spread
manufacturers use tahini in conjunction with chickpeas to produce hummus and with egg plant to
produce baba ganouj. Halva production is a subset of this industry. Halva is a popular sweet made by
mixing approximately 50 percent tahini with boiled and whipped sugar and several other ingredients.

Sector Analysis Studies for Commercial Agriculture for Smallholders and Agribusiness Programme P a g e | 20
In 2016, the top importers by value were China (USD956m), Turkey (USD235m), Japan (USD205m),
South Korea (USD111m) and Israel (USD67.4m), with a global total value of USD2.13bn, 81% of which
was accounted for by Asia, 11% by Europe, 4.5% by North America and 3% by Africa.4 Sesame exports
sell across a wide price range. Quality perception, particularly how the seed looks, is a major pricing
factor. Most importers who supply ingredient distributors and oil processors only want to purchase
scientifically treated, properly cleaned, washed, dried, colour-sorted, size-graded, and impurity-free
seeds with a guaranteed minimum oil content (not less than 40%) packed according to international
standards. Seeds that do not meet these quality standards are considered unfit for export and are
consumed locally.
Drivers include growing awareness of food health issues, growing demand from baking,
confectionary and pharmaceutical industries and the niche, but growing, organic segment. Prices are
influenced by the sesame crop performance of the main importers and, therefore, their level of
demand. They have risen as high USD1,700/MT in poor global production years but in 2017 have
been around the USD800-900/MT level.
The distinctive nature of the Ugandan product, with its “organic by default” production and
exceptionally high (56-76%) oil content, has led to value addition attempts through branding but with
limited success.
3.3.3 Market constraints
Table 5 Market System Constraints for the Sesame Value Chain
Constraints Effects on the poor Systemic issues
High production cost variation;
poor farm management and
record keeping; investment in
poor inputs or use of
recycled/adulterated seed
Limited productivity, profitability
and incomes
Severely underdeveloped
commercial seed market
Weak extension and knowledge
flow to producers (information
failures)
Inconsistency in production and
supply of quality sesame; high
moisture content due to poor
crop handling by producers and
traders during harvest and
storage lack of moisture meters,
weighing scales etc.
Limited prices and, therefore,
incomes from sesame
Weak horizontal coordination;
lack of joint marketing activity
Weak technical transfer channels
in best practices to traders
Limited acreage with low
productivity, scattered producers
and lack of collective bulking to
promote single deliveries and
limited storage places.
High transaction costs and low
chain efficiency limiting prices
offered to producers and,
therefore, incomes from sesame
Weak extension and knowledge
flow to producers (information
failures)
Weak horizontal coordination;
lack of joint marketing activity
Low adoption of improved
sesame varieties
Limited productivity and income
for smallholders
Weak improved seed market and
lack of smallholder multiplication
Low output of organic sesame Limited market prices and,
therefore, incomes for chain
Weak extension and knowledge
flow to producers (information
4 UN COMTRADE data accessed through the MIT Observatory of Economic Complexity interface

Sector Analysis Studies for Commercial Agriculture for Smallholders and Agribusiness Programme P a g e | 21
actors failures)
Conflict between malaria control
programmes and organic
farming requirements

Sector Analysis Studies for Commercial Agriculture for Smallholders and Agribusiness Programme P a g e | 22
4. Development Characteristics 4.1 Gender
According to the UNDP Uganda Country Gender assessment 2015 the main issues are:
Law vs. practice. There is a disconnect between Uganda's very positive legal framework and the
lack of effective implementation or enforcement of gender-positive laws. This means that
women's legal status is precarious, their capacity as economic agents is limited, and their rights
are not effectively guaranteed.
Rapid population growth. Uganda's population is growing at a rapid rate, with high total
fertility, high dependency ratios, and a significant "youth bulge." This means that the country's
demographic dynamics will affect the ability of the country to meet the ambitious goals of
becoming a middle income country set out in its Vision 2040 statement.
Socio-cultural norms and patriarchal attitudes. Attitudes, beliefs and practices that serve to
exclude women are still deeply entrenched throughout the country. This means that unbalanced
power relations between men and women continue to have a negative impact on women's
agency, their human capital development, and their ability to contribute equitably to Uganda's
growth and prosperity.
Persistence of sexual and gender-based violence. The country suffers from a persistent high
level of sexual and gender-based violence. This means that Ugandan society pays a high price in
lost work days and lost economic capacity, over and above the severe detrimental effects on
families and the society at large.
The "overburden" of women persists. Women's active role in the economy is coupled with the
disproportionate burden they bear of unpaid "care" work in the household, including child and
elder care, and provisioning of food, fuel, and water. This means that women are more labour
constrained than men and face trade-offs among competing uses of time.
More specifically, all three crops are currently characterised by large female labour inputs and, when
grown at subsistence level, women also handle harvesting and processing functions.
4.1.1 Beans
Common beans (Phaseolus vulgaris) have historically been considered a women’s crop in Uganda,
partly due to their close identification with subsistence cropping and women's role in household
provisioning. However, women and men participate in all bean production activities, with women
predominating in planting, weeding and post-harvest processing (threshing, winnowing, sorting etc.),
and men predominating in site selection, spraying against pests and diseases, bush clearing, and
fertilizer application. No task is specifically a woman's, or a man's, for instance women also participate
strongly in clearing and preparing land. Participation rates vary by household as well with factors like
age, distance to bean plots, farming as a primary occupation, economic status, crop attributes, and
the number of times beans are consumed in the household. Beans are usually intercropped. This is
important in ensuring diversified diets, benefiting from nitrogen fixation, and contributing to climate
change adaptation.
Women typically sell in local markets. These markets are close to home, they can manage to transport
small volumes, capital requirements are low, and they sell direct to the final consumer. Men's
participation in marketing is increasing, particularly in bulking and trading large volumes. Women are
scarcely present at this level.
Marketability traits, particularly colour, are important to both women and men. Early maturing
varieties are also important, particularly to women, due to their household provisioning role and the

Sector Analysis Studies for Commercial Agriculture for Smallholders and Agribusiness Programme P a g e | 23
importance of beans in the diet (beans are rich in complex carbohydrates, protein, iron, and zinc).
Fresh beans (green leaves, immature pods) are preferred in rural households but can only be
consumed for a couple of months. Due to perishability beans destined for sale are dried and sold to
urban markets. This reduces the amount of beans available for household consumption between
January and June as insufficient quantities are set aside. Early maturing varieties would extend the
growing season (two crops are possible in one rainy season) and reduce the hungry season.
Interventions must ensure sufficient beans are set aside for family use, as well.
There is some evidence that women continue to believe beans are a women's crop, although women
and men participate across production and post-harvest processing. Another definition of a women's
crop would be that women dominate sales. This is no longer the case. Women and men together
participate in decision-making around the crop production cycle and marketing, but women have
lower decision-making power than men over monies made. Ensuring women are fully included in
value chain development is essential.
Figure 12 Women’s involvement in Uganda Bean Value Chain
4.1.2 Rice
Women and youth (aged 15 to 35) and also boys and girls participate alongside men in all production
activities, with actual percentages varying by task according to perceived difficulty and labour
intensity (with men and male youth taking on these tasks). Only one task - harvesting rice in swampy
land - is fully performed by men. This is because it is necessary to roll clothes above the knee so most
men wear shorts or roll up their trousers. For women to roll up their dresses so high is considered
indecent. This means that female-headed households (FHH) face particular constraints since they
have to hire men (if they do not have access to adult male youth or other male family labour) for this
task, and for other particularly labour-intensive work. Timeliness can be particularly difficult for FHH:
late harvesting contributes to significant post-harvest losses. It is estimated that losses are around
60% with late harvesting whereas losses during timely harvesting are only 3%.
These issues do not constrain upland rice where the introduction of improved upland rice varieties
has contributed to strongly expanded rice production in Uganda – reducing imports by a third.
However, one study shows strong increases in labour demands due to increased weeding and bird
scaring - the latter is particularly a child's job. This negatively affects women's and children's time for
other activities, and leads to increases in labour expenditure.
Men dominate post-harvest activities in the rice value chain because they are capital intensive and
women lack investment capital. All rice seed multipliers, 98% of rice millers, 96% of rice traders (and
87% of agro-input dealers) are men. Women are involved in preparing food for mill workers, cleaning

Sector Analysis Studies for Commercial Agriculture for Smallholders and Agribusiness Programme P a g e | 24
mill premises, and sorting and winnowing the milled rice. Women sell rice in local and roadside
markets, particularly in Amuru in Northern Uganda, an important producer of upland rice.
Men's strong participation in harvesting, and particularly milling and selling rice, means that youth
and women tend to receive minimal financial benefits from sales (dependent on intra-household
bargaining processes).
There are no cultural barriers to women participating in rice production. Promoting women's access,
and organising them into producer and marketing cooperatives will enable them to benefit from rice
markets.
Figure 13 Women’s involvement in Uganda Rice Value Chain
4.1.3 Sesame
Historically, in Uganda, sesame was regarded as a woman’s crop.5 It was grown on marginal lands or
in kitchen gardens, and grown for consumption at a local level. When commercialised sesame began
to take off in Uganda, sesame became considered a cash crop. It’s frequently noted in the literature
that cash crops and export crops are male crops, while subsistence crops are female crops. Typically,
evidence suggests, men may take over production and marketing, even of traditional women’s crops,
when it becomes financially lucrative to do so. 6
Additionally, the shift to commercialised sesame at a small holder level has meant that workload for
women has considerably increased. Sesame is a more labour intensive crop, from planting to
weeding, and especially post-harvest processing. One study looked at the gender dynamics of
commercialisation of sesame in another Sub-Saharan country, Malawi. 7 The shift to commercial
sesame production resulted in a significant increase of labour for women primarily due to the impact
5 Bedigian, Dorothea (2010) Sesame: The genus Sesamum.
6 Hill, Ruth Vargas and Marcella Vigneri (2011) Mainstreaming gender sensitivity in cash crop market supply chains. FAO ESA Working Paper
No. 11-08 7 Ussar, Maxi (2016) Rapid assessment of gender dynamics of cotton and sesame contract farming households. Malawi Oilseed Sector
Transformation Programme (MOST)

Sector Analysis Studies for Commercial Agriculture for Smallholders and Agribusiness Programme P a g e | 25
of higher yields on labour intensive post-harvest work. Also, hired labour, when used, was almost
exclusively utilized for pre-harvest work, which did not alleviate the post-harvest labour burden for
women. In Uganda, it is estimated that women do 85% of the planting, 85% of the weeding, 55% of
land preparation and 98% of all food processing. 8 When production of sesame is increased,
especially at a small holder level, it is estimated that women's workloads considerably exceed those of
men.
However, as production becomes more commercially focussed male appropriation may occur. The
case of sesame in Malawi is instructive9. Commercial sesame is considered a ‘man’s crop’ or a ‘family
crop’ but when it was regarded as a food crop it was mostly intercropped with cotton and indeed
perceived as a woman’s crop, with women mainly responsible for its production and processing.
When sesame became a cash crop many farm households allocated parts of their cotton field – a
crop mostly considered the domain of men – to sesame. The combination of a shift of usage of
sesame from food crop to mostly cash crop, coupled with the fact that most land for commercial
sesame production had previously been under the control of men, resulted in the shift of perception
– a significant increase of interest of men in the crop, resulting in increased oversight and control of
men over production. The division of labour remained the same; pre-harvest work is jointly done by
the husband and wife, and post-harvest work is exclusively carried out by women. Commercialisation
of sesame led to a significantly increased workload for women due to the impact of higher yields on
labour intensive post-harvest work. Control over allocation of income remained the same; final
decision making power rests mostly with men. In cases of contract sesame farming, the signatory has
much greater access to information and knowledge on markets, inputs, prices, etc.
4.2 Nutrition
Ugandans primarily consume plantains, starchy roots (cassava and sweet potatoes) and cereals such
as maize, millet, and sorghum, with some regional variation. Their diet also includes nuts and green
leafy vegetables. Rice is one of the most important food staples in the central and western regions
Uganda.10
Almost 70% of Uganda’s population is poor, with 38.2% in living “severe poverty.”11 The 2016 Global
Hunger Index scores Uganda at 26.4, which is considered “serious.”12 Key factors contributing to that
score include:
25.5% of the population is considered undernourished;
4.3% prevalence of wasting of children under 5 years;
34.2% prevalence of stunting among children under 5 years; and
5.5% mortality rate for children under 5 years.
There is a high incidence of infectious diseases, compounded by very limited access to improved
sanitation, low immunization rates, and limited access to essential health care.13 All of these factors
contribute to a high rate of child mortality.
8 FAO (2000) IFAD's Gender Strengthening Programme for East and Southern Africa – Uganda Field Diagnostic Study (Draft).
9 MOST (2016). Rapid Assessment of Gender Dynamics of Cotton and Sesame Contract Farming Households. MOST programme report.
10 FAO (2010) Nutrition Country Profile: Uganda, FAO.
11 Oxford Poverty and Human Development Initiative (2017) Mozambique Country Briefing: Multidimensional Poverty Index Data Bank, OPHI,
University of Oxford. 12
International Food Policy Research Institute (2016) Global Hunger Index, International Food Policy Research Institute. 13
FAO (2010) Nutrition Country Profile: Uganda, FAO.

Sector Analysis Studies for Commercial Agriculture for Smallholders and Agribusiness Programme P a g e | 26
The Ugandan diet is mainly composed of plantain, starchy roots (cassava, sweet potatoes) and cereals
(maize, millet, sorghum). Pulses, nuts and green leafy vegetables complement the diet. In urban areas,
which are undergoing a nutrition transition, food consumption patterns are changing and rice is
gaining importance. Overall, the diet remains poor in micronutrient-rich foods. Food insecurity
persists in some parts of the country, mainly due to poverty, adverse climatic conditions, low
agricultural productivity and prolonged civil insecurity in some regions.
4.2.1 Beans
Beans provide 25% of the total dietary calorie intake of Ugandans and 45% of their protein intake.
Beans also are a major source of complex carbohydrates, essential micronutrients, dietary fibre,
vitamin B and antioxidants.14 Despite these nutritional benefits, less than 15% of smallholders
farmland is under bean cultivation.15
The potential nutritional benefits are not being realized due to inadequate pre- and post-harvest
handling techniques. Late harvest can expose beans to fungus, damage and breakage during
threshing and there is a high incidence of insects infestation where farms store beans in their homes.
Also, beans require a lot of fuel for cooking.16
4.2.2 Rice
Although rice alone does not supply all of the nutrients necessary for adequate nutrition, rice is a
significant source of dietary energy as well as a good source of thiamine, riboflavin and niacin.17
Different rice varieties provide different nutritional value: black and brown rice providing the most
protein.18 Red rice contains the most iron. In addition, unmilled rice contains a significant amount of
dietary fibre.19
4.2.3 Sesame
Sesame seeds are a known source of fats (oil), protein, iron, zinc, and many other nutrients, and
sesame has been linked to benefits such as lowering cholesterol, reducing blood pressure, blood
sugar reduction, and antixoidants.20 Particularly in Northern Uganda, sesame is consumed
traditionally through a sesame paste, which can be added to greens or beans. Local extraction of
sesame oil in Uganda is mainly done traditionally using a mortar and pestle. The remaining seed cake
that is left behind from this process is normally used to prepare meals cooked with either smoked fish
or vegetables and in some cases used as animal feed.21 Despite all of this, unfortunately there is little
research available on whether the production of sesame as a cash crop has any effect on household
nutrition levels.
14 Kilimo Trust (2012) Development of Inclusive Markets in Agriculture and Trade (DIMAT): The Nature and Markets of Bean Value Chains in
Uganda, UNDP. 15
Mazur (2013) Integrating Nutrition in Value Chains and Smallholder Farming and Marketing Systems: Case Study from Uganda, Iowa State
University. 16
Hawkes & Ruel (2011) Value Chains for Nutrition, FAO. 17
FAO (2010) Rice and Human Nutrition, FAO. 18
FAO (2010) Rice and Human Nutrition, FAO. 19
FAO (2010) Rice and Human Nutrition, FAO. 20
Berkeley Wellness (2016) Sesame: Little Seeds, Big Benefits. 21
FIT Insights Agritrade Linkages + Knowledge (2017) Sesame oil production continues to waver

Sector Analysis Studies for Commercial Agriculture for Smallholders and Agribusiness Programme P a g e | 27
Sesame seeds have been marketed historically, by Catholic Relief Services and other NGOs, as an
additional source of protein.22 The FAO has published recommendations on the addition of sesame
paste to ugali as a way to increase the nutrition of the staple food of Uganda23 However, it remains to
be seen that as farmers commercialise their sesame production if that translates to increased
household consumption of sesame.
4.3 Climate Change
A warming trend is projected to continue in Uganda, with some projections suggesting an increase of
up to 1.5°C as early as 2030. Similarly, temperatures could rise between 0.9°C and 3.3°C by the 2060s.
Predicting regional rainfall changes in the tropics is a major challenge for climate scientists, and
projections are more uncertain. On average, the forecasts for Uganda show a slight increase in mean
rainfall. Most of this increase is projected for the western shores of Lake Victoria and the Mount Elgon
region in the central west, and for the zone extending from Mount Rwenzori to the southern parts of
Lake Kioga. According to Future Climate for Africa (November 2016) there could be a reduction in the
national production of food crops such as cassava, maize, millet and groundnuts by 2050. Overall
losses of food crops by that time could reach US$1.5 billion, with major export crops like coffee and
tea experiencing a reduction in yields leading to combined economic losses of an additional US$1.4
billion. Fishing provides a source of livelihood for up to 1.2 million people, and employs about 8% of
the total labour force. Climate change is likely to stress fisheries, resulting in disrupted livelihoods and
significant economic losses.
4.3.1 Beans
The International Food Policy Research Institute (IFPRI) modelled impacts of long-term rainfall and
temperature trends on bean yields, which indicated a 20% reduction.24 Recommended adaptation
strategies include:
Improving water availability;
Crop diversification;
Pasture for animals and support to livestock holdings.
Another recommendation is an early warning system to inform the sub-sector of adverse weather
conditions likely to affect bean productivity.25
4.3.2 Rice
Climate change is expected to have a negative overall effect on rice yields, with East Africa losing as
much as 16% of its current production by the end of the 21st century. Within that estimate, studies
differ. Optimum growing temperature for rice is 25°C. A rise in temperature will likely cause an
increase in yields, although at a 1°C increase in temperature above normal, there will be a 10%
decrease in rice yields. Another study found a 1° increase causing a 0.6% decrease in yields. That
22 Bedigian, Dorothea (2010) Sesame: The genus Sesamum
23 FAO (1997) Agriculture food and nutrition for Africa - A resource book for teachers of agriculture
24 Ministry of Water and Environment, Climate Change Department (2015) Economic Assessment of the Impacts of Climate Change in
Uganda, Government of Uganda. 25
Kilimo Trust (2012) Development of Inclusive Markets in Agriculture and Trade (DIMAT): The Nature and Markets of Bean Value Chains in
Uganda, UNDP.

Sector Analysis Studies for Commercial Agriculture for Smallholders and Agribusiness Programme P a g e | 28
being said, rice appears to be one of the more climate resilient food crops, particularly as compared
to maize or wheat.26
4.3.3 Sesame
The vast majority of sesame production, 93.7%, is found in northern Uganda.27 The reason for the
heavy prevalence of sesame in the north is due to the fact that Northern Uganda has hotter
temperatures and less rainfall, more suited to sesame production. Sesame is a crop that is generally
quick to mature, prefers warm soils and is considered drought tolerant.28 Northern Uganda is also
known as the region of Uganda most susceptible to the effects of climate change.
Sesame is a more suitable crop for areas that face drought or high temperatures. The optimum range
or growth, blossoms, and fruit ripeness is 26-30°C. Due to its tap root system, the plant is highly
resistant to drought and thrives in moderate rainfall of 300-600 mm, optimally spread throughout the
vegetation period. 29 The current USGS Climate Trend Analysis of Uganda demonstrates expectations
that rainfall will decrease across both the short and long periods of rain, and warm regions will
expand, especially in the North. 30 The ideal range for sesame may increase due to these trends.
Also to consider, sesame does have its setbacks that make it a challenging crop for areas affected by
climate change. Pollination and the formation of capsules is inhibited during heat-wave periods
above 40°C. In regions visited by strong, hot winds, the plants only form smaller seeds with a lower oil
content. During each of its development stages, the plant is highly susceptible to water-logging,
which presents an issue if floods were to occur. Additionally, since sesame does not compete well
with other plants, plots need to be weeded and any intercropping or co-planting techniques should
be avoided. Because of this, sesame plots are often particularly susceptible to erosion. 31
Despite its high value and potential, sesame has received less development attention with its
production characterized by low yields and low productivity. It has been proposed that this is a result
of the use of traditional varieties and management practices, poor pests and diseases control
practices, declining soil fertility, pre and post-harvest losses, as well as the impact of frequent extreme
weather events (droughts, unpredictable seasons, or too much rainfall).
There is current research being done by the Africa Innovations Institute (AFRII)32 looking at stabilising
sesame yields and production in the Lango region, Northern Uganda. This study estimates that about
80% of the population in this region depend on sesame for food and income security. Despite its
importance, yields and production of sesame in this region are low and unstable, causing frequent
food shortages in the region. As a part of this study, drought tolerant sesame varieties and
innovations in gall midge and webworm control have been evaluated.
26 Adhikari et al (2015) “Climate change and eastern Africa: a review of impact on major crops,” in Food and Energy Security, Global Center
for Food Systems Innovation, Michigan State University. 27
Africa Innovations Institute (2017) Crop scientists initiate climate smart innovations to improve simsim (sesame) 28
Naturland e.V. (2002) Organic Farming in the Tropics and Subtropics: Sesame 29
Naturland e.V. (2002) Organic Farming in the Tropics and Subtropics: Sesame 30
USGS (2012) A Climate Trend Analysis of Uganda. https://pubs.usgs.gov/fs/2012/3062/FS2012-3062.pdf 31
Naturland e.V. (2002) Organic Farming in the Tropics and Subtropics: Sesame 32
Stablizing sesame yields and production in the Lango region, Nothern Uganda https://www.nwo.nl/en/research-and-results/research-
projects/i/62/12562.html

Sector Analysis Studies for Commercial Agriculture for Smallholders and Agribusiness Programme P a g e | 29

Sector Analysis Studies for Commercial Agriculture for Smallholders and Agribusiness Programme P a g e | 30
5. Market Linkages 5.1 Spatial and Institutional Commodity Flows
5.1.1 Beans
Figure 14 Map of Ugandan trade flows in beans
Source: Famine Early Warning Systems (FEWS) Network (2016).
As with most domestic trade, Kampala is the main consumption and transit market. There are major
flows of beans from production areas to Busia (for their export to Kenya and South Sudan) and to
Gulu and Lira, from where they are further directed to Kampala and the Karamoja sub-region (FEWS
NET 2015).
The main export destinations are Kenya, South Sudan, DRC, Tanzania, Burundi, the United Kingdom,
and the United States. In 2014, beans were the third greatest export product in informal cross-border
trade after maize and fish.33 In the 2010–2013 period, beans accounted for about 12% of informal
agricultural exports (UBOS 2014b). The value of this trade was estimated at US$24.2M in the 2014
Informal Cross Border Trade (ICBT) survey (jointly conducted by Bank of Uganda (BOU) and UBOS).
Canned beans, fresh beans, and specific varieties not widely produced in the country are the main
products imported. Formal imports come from Rwanda, Egypt, Tanzania, Kenya, and the United Arab
Emirates (Kilimo Trust 2012). Depending on the season, there is a reverse flow of beans between
Uganda and its neighbours. For instance, in the first season beans flow from eastern DRC into
Uganda, and in the second season from Rwanda. In addition, reverse flows are observed for certain
bean varieties that are highly favoured within the region (FEWS Network 2015).
33 Beans have since been overtaken by rice – see section 5.1.2. below

Sector Analysis Studies for Commercial Agriculture for Smallholders and Agribusiness Programme P a g e | 31
5.1.2 Rice
Figure 15 Map of Ugandan trade flows in rice (Source: FEWSNET)
Most significant rice traders are based in
Kampala, where there are processing and
marketing facilities including warehouses,
processing mills, supermarkets, transport
facilities, in addition to a ready market of
income secure consumers. From Kampala,
rice is transported to different district towns
and also exported to countries like South
Sudan, Congo and Rwanda (see figure
opposite).
Informal trade in rice continues to rise, as
noted by the Market Analysis Sub-group of
the Food Security and Nutrition Working
Group (FSNWG), which monitors cross-
border trade in order to quantify its impact
on regional food supplies. In late 2016, rice
displaced dry beans as the second most
important informally traded good by volume,
accounted for an estimated 19% of the total
commodity trade in the region. This was
attributed to increased rice supplies from the
previous above average harvest in Tanzania,
high demand for maize during the 2016 Christmas period, and relatively high maize prices resulting in
some substitution. Data for this period are presented in the table below.
Table 6: Volumes of Rice Regional Rice Flows (MT)
Commodity Trade Flow Corridors (Source destination)
Trade Volumes in MT
% Change Historical Comparison
Last Quarter
Last Year
3 Year Average
Last Quarter
Last Year Average
Rice Uganda – South Sudan
6,662 -26% 32% -14%
Tanzania – Uganda 8,829 32% 419% 349%
Tanzania – Kenya 25,000 -5% -5% 33%
Tanzania – Rwanda 13,473 65% 18% 37%
Somalia – Kenya 3,174 9% 199% 113%
Somalia – Ethiopia 5,983 -41% -34% -21%
Tanzania – Burundi 759 292% -47% -46%
Source: Rice trade data from East Africa Cross Border Trade Bulletin, January 2017

Sector Analysis Studies for Commercial Agriculture for Smallholders and Agribusiness Programme P a g e | 32
5.1.3 Sesame
The figures overleaf outline the main product flows for Ugandan sesame. The bulk of seeds are sold to
rural assemblers and wholesalers, with around 42% of marketed production finding its way to international
exporters in Kampala, 25% sold and consumed in rural areas and the remainder sold in urban and
regional export markets.
Figure 16 Schematic of the Ugandan Sesame Marketing System
Figure 17 Schematic of sesame flows from Northern Uganda

Sector Analysis Studies for Commercial Agriculture for Smallholders and Agribusiness Programme P a g e | 33
5.2 Stakeholder Analysis
5.2.1 Beans
A schematic representation of bean market channels appears below. Individual producers usually sell
the produce at the farm gate to local, small-scale traders, who aggregate supplies and sell to
medium- and large-scale traders and to market vendors. Medium- and large-scale traders also
purchase beans from other traders, wholesale markets and farmer groups. These traders sell to
institutional buyers, (formal and informal) exporters, hotels, restaurants and retailers (Kilimo Trust
2012).
Figure 18 Bean Marketing in Uganda
Producer associations and groups support their members by promoting collective production,
facilitating training and, in some cases, engaging in seed production (Kilimo Trust 2012).
Beans and rice trading companies include Maganjo Grain Millers, Agrinet, Aponye, UNGA 2000 and
Agroways. These could trade over 20,000 MT each. There are also numerous other smaller
companies trading about 1,000 MT per annum.
In excess of 30 exporters participate in formal trade, although most trade is controlled by a small
number of enterprises (Kilimo Trust 2012). The UN World Food Programme is the largest single
exporter of Ugandan beans, which are directed to Rwanda, Burundi, DRC, Kenya and South Sudan
(Chemonics 2010). Informal trade is undertaken by large number of both domestic and foreign
traders who typically transport small volumes of produce across borders by foot or bicycle
(Chemonics 2010).
According to CIAT, 45% of cross-border bean traders are women. However, men dominate
transportation (70%) while women dominate retail activities (65%). More than 100 bean varieties are
traded in the region, but only 10 types account for 97% of the regional trade (Birachi/PABRA 2016).
Bean sector input suppliers include agro-input dealers, most of whom are members of UNADA,
Government programmes (NAADS), NGOs, producer organisations and large-scale bean buyers. The
latter, along with seed companies, supply producers with seed materials, mainly on credit, in a
strategy designed to manage the quality and quantity of outputs for retail or multiplication,
respectively.

Sector Analysis Studies for Commercial Agriculture for Smallholders and Agribusiness Programme P a g e | 34
Actors such as financial service providers, extension agents, research and development providers, and
market information providers supply ancillary services to the core value chain.
5.2.2 Rice
The flow of rice marketing is depicted in the diagram below. Farmers tend to favour rice milling
before sales because the processed product gains substantial value. However this is not always
practicable because some production areas do not have access to a milling machine that can process
large output quantities. Local traders travel to often remote areas to collect the product from on-farm
stores. It is then aggregated and transported to millers, which are usually located in marketing
centres such as Lira and Gulu but can also be found in a few trading centres such as Pabbo. Medium-
scale millers may provide producers with “embedded” services such as information and/or training on
farming practices and post-harvest handling, credit (often at high interest rates or in return for poor
output prices) and transportation of outputs to the mill.
Figure 19 Rice Marketing in Uganda
Source: Development of Inclusive Markets in Agriculture and Trade (DIMAT) UNDP 2016

Sector Analysis Studies for Commercial Agriculture for Smallholders and Agribusiness Programme P a g e | 35
The typical milling fee at the time of writing is Ush 150/kg of paddy rice, with a typical average
transformation ratio of paddy:milled rice of around 65-70%. However, process efficiency of up to 85%
may be achieved with the most modern machinery. With domestic markets readily accepting all
qualities of rice and capital constraints of millers, there is little incentive to invest in plant upgrading,
even though efficiency gains would produce better returns.
Milled rice is sold either to local wholesalers and retailers operating in rural markets and trading
centres, and then on to regional importers from South Sudan and Kenya or to wholesalers and,
ultimately, retailers in urban centres such as Gulu, Lira, and Kampala.
Beans and rice trading companies include Maganjo Grain Millers, Agrinet, Aponye, UNGA 2000 and
Agroways. These could trade over 20,000 MT each. There are also numerous other smaller
companies trading about 1,000 MT per annum.
Rice seed multipliers are key to the success of the sector in Uganda because improved planting
materials drive productivity gains. Counterfeit seeds and fertilisers are an increasing problem in the
sector. In addition, a lack of demand by an un-sensitised smallholder population poorly served by
extension agents means that major expansion of rice seed production is not perceived as an
attractive area for investment.
According to the Uganda Economic Policy Research Centre (2016), only around 48% of agro-input
dealers are registered, mostly with UNADA and the District Local Governments. Therefore, the
remaining 52% operate illegally outside of regulation and quality control by MAAIF. Therefore, there
is urgent need for Government (MAAIF) to strengthen the regulatory system, partly through
operationalisation of the Fertiliser Control Regulations (2012).
5.2.3 Sesame
5.2.3.1 Farmers
Sesame is predominantly produced by smallholder farmers using simple methods that have not
changed over many generations. Farmers use animal draught for land preparation, broadcasting for
planting, and weeding, harvesting, drying and threshing is performed manually. As such, sesame
farming is characterized by low resource use with little mechanization or use of inorganic fertilizer
and chemical pesticides.
5.2.3.2 Traders
Due to the fragmented and small-scale nature of production, considerable effort is required to
assemble sesame into economically viable volumes for trade. Sesame marketing is therefore
characterized by numerous transactions involving small volumes, and many traders with variable
capacity. These traders can be categorized based on their location, the volumes they handle and their
position in the hierarchy of the sesame marketing value chain.
5.2.3.3 Rural assemblers
Include traders on foot, bicycle traders, rural open-air market traders, rural wholesalers and rural
shopkeepers. Bicycle traders and traders on foot move among farms during the marketing season to
buy from farmers. These traders are mostly active on non-market days and sell the accumulated
stocks to rural open-air traders, who operate mainly on designated market days. They move among
markets in addition to buying directly from farmers and other smaller traders. Their activities are
seasonal, operating for a short period after sesame is harvested when volumes are high. During the
off-season they move to other commodities.
5.2.3.4 Rural wholesale and retail traders

Sector Analysis Studies for Commercial Agriculture for Smallholders and Agribusiness Programme P a g e | 36
Stationary traders operating from permanent premises such as shops and grain stores. They buy
sesame continuously throughout the marketing season from farmers, foot traders, bicycle traders and
open-air traders. The bulked sesame is then transported to larger market centres at sub-county,
county, district and regional levels and sold to urban wholesale produce dealers.
5.2.3.5 Regional urban wholesale traders
Found at regional market centres such as Lira and Gulu. They are commodity traders with well-
established businesses and the capacity to handle large volumes, also handling other grains
produced in the area. They are well capitalized and have investments in storage, and sometimes
transport, facilities in addition to adequate access to formal credit. They buy sesame mainly from rural
wholesalers and sell to processors and/or exporters in the regional buying centres or transport
bulked sesame to exporters based in Kampala.
5.2.3.6 Processors and/or Exporters
Most are found in Kampala, the capital city of Uganda but some have buying and processing facilities
in the production regions, mainly West Nile, Gulu and Lira. In Kampala, exporters screen, clean and
package and ship the seed.
5.3 Key businesses in the beans, rice and sesame sub-sectors
The study identified a number of trading and processing SMEs in the value chains which are outlined
in Table 7.
Table 7: Trading and processing companies
Business Sector Description
3R Rice Millers and importers of mainly imported rice. Located in
Jinja.
Agroven Rice Millers and importers of mainly imported rice. Located in
Jinja.
Divine Masters Ltd. Rice DML operates on 5,200 acres of farmland in Tororo and
Butaleja. Works with 6,500 farmers groups representing
more than 48,000 farmers. In order to maintain supply,
DML works closely with farmers, providing them with
agricultural and business training in addition to credit for
seeds, agricultural inputs and cash. Plans to modernize its
operations with the implementation of mechanized farming
technologies, storage, and processing facilities.
Eastern Rice Company
Ltd.
Rice An integrated miller sourcing rice from 1,200 smallholders
in 75 farmer groups scattered across 10 sub-counties in
Tororo region. Aims to increase this to 150 groups.
Capacity is 60MT/day. Has provided training to
smallholders in business skills, procured land for
smallholder production, created demonstration plots and
facilitated farmer access to extension support, inputs and
processing and storage facilities. Has a USh1.5bn grant
from the Agricultural Business Initiative Trust (aBi; also see
Government and Donor Investment) for the Eastern Rice
Project.
FOL Logistics (Kingdom
Rice)
Rice A US$40m production and milling company financed by
Uganda Development Bank (UDB) with headquarters at

Sector Analysis Studies for Commercial Agriculture for Smallholders and Agribusiness Programme P a g e | 37
Namanve Industrial Park, Kampala. Has acquired 14,000
acres of land in Nwoya District, northern Uganda, with
1,000 acres under pilot cultivation, supplemented by 17,000
outgrowers. Although it produces the Kingdom Rice brand
it is still importing brown rice from Pakistan to satisfy its
milling demands. Employs 600 people in Nwoya and 400 at
its Namanve rice milling plant.
Pe Yero Rice Began in 2004 as a cereal farming operation in Gulu and
later built a modern rice mill with capacity of 60MT/day
with a loan from the Chinese Government. Buys rice from
subsistence farmers in Amuru District, northern Uganda, for
milling and sale. Has a warehouse on site with a storage
capacity of over 100MT and rents other outlets in Gulu.
Pearl Rice Works with outgrowers in Iganga, Bugiri and Namutumba
Districts using Naigombwa wetland area of 9,000 ha. Deals
with organic rice production, milling, storage, importation
and retail business. Also imports brown rice to satisfy its 60
MT/day mill capacity. Under the $34 m Islamic
Development Bank (IDB) Rice Project, a Public-Private
Partnership involving Government of Uganda, smallholder
farmers and traders organized as Busowa Traders and
Farmers Cooperative Union, two dams and farmland are to
be created in the wetland.
Pioneer Foods (U) Ltd.
(Spekko Rice)
Rice Millers and importers of mainly imported rice. Located in
Jinja.
Royal Rice Rice Millers and importers of mainly imported rice. Located in
Kampala.
Sunad Rice Millers and importers of mainly imported rice. Located in
Kampala.
SWT Tanners Ltd. Rice Growers, traders and importers of rice. Located in Ntinda,
Kampala
Tilda (U) Ltd. Rice Large multinational producing its own rice (20-
25kMT/annum) and has a modern mill with an annual
capacity of 40kMT. Wholly owned subsidiary of Tilda
Limited, based in the UK with offices in Dubai and Delhi.
WindWood Millers Ltd. Rice Located in Lira, northern Uganda.
Agroways Ltd. Rice, beans Although licensed to handle beans, volume is insufficient to
be of commercial interest. Its main business is in maize but
it also trades rice. Sells to the UN WFP, local millers,
institutions and exporters.
Upland Rice Millers Ltd. Rice, beans Partner in Agro-Processing and Marketing Strategy in
Uganda (ASM) project (see also Government and Donor
Investment below), working with 6 farmer groups that
supply rice under and MoU. As part of the support package,
URM has received a US$300k modern milling machine and
will pay 50% of the cost over 7 years. Sells beans to the UN
WFP, which it cleans and dries. Performs a linkage function
between producers and buyers of processed outputs and
trains farmers in post-harvest handling.
Gulu Agricultural
Development Company
Sesame Also works in chilies, sunflower, maize and cotton. Has a
supplier base of around 80,000 smallholders in around 550

Sector Analysis Studies for Commercial Agriculture for Smallholders and Agribusiness Programme P a g e | 38
(GADC) farmer groups in Gulu and Kitgum, and is expanding to
West Nile. Provides inputs and training to producers and
processes their outputs for export (sesame) and domestic
markets. Holds organic and Fairtrade certificates. Works
with aBi on an initiative to improve quality and productivity
in sesame.
Lira Resort Sesame Buys selected varieties of conventional sesame using an
extensive network of agents in northern Uganda and sells
to exporters. States that it has plans to work with a large
number of smallholders but currently works on the basis of
spot market transactions.
Olam Sesame Multinational exporter of all sesame varieties, which are
sorted and processed in Kampala.
Shares! Sesame Used to finance, process and export organic sesame with a
smallholder production system, using a “natural
fumigation” process developed in the Netherlands to
achieve 99% and 99.9% purity seeds to EC/NOP and
Biosuisse certified standards. However, chemical spraying
for malarial control has stalled organic farming activities.
Export Trading Group
(ETG)
Sesame,
beans
Multinational agri-commodities supplier to international
aid organizations (WFP, ICRC and CFGB), millers and the
export market, based in Kampala. General wholesaler,
importer and exporter.
AgriExim – (Dubai) Sesame,
beans
(organic)
Based in Dubai with distribution centres in the US and EU.
Export organic commodities to international standards
using ECO2 treatment, steam sterilisation and HACCP
management systems.
5.4 Financial Performance Along the Marketing Chain
5.4.1 Beans
According to the estimates in a UNDP (2014) analysis presented in detail in the table below, the total
gross value added to beans was around UGX 649/kg. The majority of this (54%) is added by
producers, 35% by retailers, 8% by village collectors, and 4% by wholesalers. Shortening the value
chain has the potential for delivering more value back to producers, although those dependent upon
(sometimes exploitative) embedded services provided by intermediaries would need to find
alternative sources of inputs, technical support and credit, for example.
Table 8: Gross margin analysis: Bean Value Chain
Producers Village Collectors
(GVA/Bag)*
Wholesalers (GVA/Bag)* Retailers (GVA/Bag)*
REVENUES Yield (kg/acre) – 400
Selling Price/kg – 1,200
Total Revenue/acre –
480,000
Selling Price – 152,000***
Total Revenue – 152,000
Selling Price – 185,600
Total Revenue – 185,600
Selling Price – 216,000
Total Revenue – 216,000
COST 1st Ploughing – 87,500
2nd
Ploughing – 85,000
Seeds – 35,000
Planting – 40,000
Weeding – 43,500
Harvesting – 20,000
Winnowing – 5,000
Buying Price – 144,000
Packaging – 1,500
Transport** - 1,000
Buying Price – 168,000
Drying – 500
Sieving & Sorting – 3,000
Packaging – 1,500
Transport - 8,400
Loading & offloading –
1,000
Buying price – 185,000
Sorting – 2,500
Transport – 1,000

Sector Analysis Studies for Commercial Agriculture for Smallholders and Agribusiness Programme P a g e | 39
Drying – 5,000
Transporting – 2,500
Packaging – 7,500
Total Cost – 341,000
Total Cost – 146,500
Total Cost – 182,400
Total Cost – 189,100
GROSS
MARGINS
Acre/Season – 139,000
Kg/Season – 348
Per bag – 6,000
Per Kg – 50
Per bag – 3,200
Per Kg – 27
Per Bag – 26,900
Per Kg - 224
Source: Value Chain analysis of the dry bean sub sector UNDP 2014
5.4.2 Rice
A detailed analysis (UNDP 2013) of value addition along the rice chain appears in the table above.
Seed purchase accounted for 40% of production costs, with land preparation adding 24%. Producers’
gross margins were estimated at UGX 450,000-UGX 800,000/season. The very wide variation in these
estimates is accounted for mainly by differences in productivity. For example, improved seeds (grown
correctly) can almost double conventional yields, optimal use of fertiliser can add 30-40% to output
volumes, and upland varieties tend to yield more than lowland strains. In addition, rice is a labour
intensive crop, particularly in the weeding phase. Households struggle to optimally farm more than
0.5acres using their own labour only; expansion is contingent upon access to sufficient capital to hire
additional labour, which is problematic for most smallholders.
Table 9: Gross margin analysis: Bean Value Chain
Producers CM
(UCX/Acre)
Paddy Traders CM
(UCX/Kg)
Millers CM
(UCX/Kg)
Wholesalers CM
(UCX/Kg)
Retailers CM
(UCX/Kg)
Revenues Kg/acre = 1,000-
1,500
Selling Price/Kg =
700
Selling Price/Kg =
1,500–1,700
Selling Price/Kg =
1,450-1,500
Milled Rice
Revenue/100kg =
95,000-100,500
Bran & Broken =
20-23Kg
Bran & Broken
Price = 50-200
Revenue for Bran &
Broken = 1,000-
4,600
Mark-up = 16,000-
28,100
Selling Price/100Kg
= 80,000
Selling Price/100Kg
= 110,000
Total
Revenue/Acre =
700,000-
1,050,000
Total Revenue/Kg
= 1,500-1,700
Total Revenue =
96,000-105,000
Total
Revenue/100Kg =
80,000
Total
Revenue/100Kg =
110,000
Cost Land Preparation =
30,000
Seeds = 100,000
Planting = 30,000
Weeding = 30,000
Harvesting =
60,000
Total Cost/Acre =
250,000
Raw materials/Kg =
1,400-1,500
Transport &
commission =
50-70
Total Cost/Kg =
1,450-1,570
Raw
material/100Kg =
70,000
Milling = 7,000-
10,000
Conversional rate
= 65-67Kg
Total Cost/100Kg
= 77,000-80,000
Buying Price/100Kg
= 73,000
Transport = 1,500
Total Cost/100Kg
Buying Price/100Kg
= 75,000
Transport = 500
Total Cost/100Kg
= 75,500
Gross Margin Per acre per season
= 450,000-800,000
Kg/Season = 450-
533
Per Kg = 50-270 Per Kg = 160-281 Per 100Kg = 5,500
Per Kg = 55
Per 100Kg =
26,900
Per Kg = 345
Source: Value Chain analysis of the dry bean sub sector UNDP 2014

Sector Analysis Studies for Commercial Agriculture for Smallholders and Agribusiness Programme P a g e | 40
5.4.3 Sesame
The market is competitive at grassroots level, with a number of traders vying to purchase farmers’ outputs.
However, as aggregation takes place the number of actors is reduced, shifting market power to fewer
dominant players. The share of the price received by farmers falls from 90% of the ex-assembly price to
60% of the ex-regional wholesale price.
Our survey estimated average cost of production for sesame at UGX450,500/acre (UGX1.1m/ha), or
UGX2,253/kg, with family labour as the main source of farm labour. The average sesame yield was
200kg/acre (494kg/ha), while the average unit price was UGX3,000/kg. Assuming that all output was sold,
sesame production was generally profitable, with average margins of UGX149,500/acre (UGX369,000/ha),
or UGX747/kg.
Table 10: Gross margin analysis: Sesame Production
Total Revenue (UGX)
Yield (Kg/acre) Price (UGX/Kg) Value (UGX)
200kg 3,000 600,000
Variable Costs (UGX)
Land preparation 160,000
Seed 20,000
Planting / Sowing 40,000
Weeding and thinning 60,000
Harvesting and transporting to the rack 60,000
Rack construction and racking 40,000
Threshing and winnowing 40,000
Field-to-homestead transportation 20,000
Bagging and storage 4,500
Transportation to market 6,000
Total Variable Costs (UGX) 450,500
Gross Margin per acre (UGX) 149,500
Unit Cost of Production (UGX/Kg) 2,253
The gross margin accruing to rural traders was estimated at around UGX100/kg, and at UGX200/kg
for urban traders. The retail price for sesame in Kampala stood at UGX4,200/kg, translating into a
gross margin of UGX700/kg. Therefore, the total marketing margin or farm-retail spread, which is
usually taken as a measure of efficiency of a value chain, was UGX1,200 per kg. In other words,
sesame producers were able to capture 71.4% of the final retail price.
Table 11: Gross margin analysis: Sesame Trade
Producer Rural Trader Urban Trader Wholesalers Retailers
Prices (UGX)
UCOP = 2,253
SP = 3,000
BP = 3,000
SP = 3,100
BP = 3,100
SP = 3,300
BP = 3,300
SP = 3,500
BP = 3,500
SP = 4,200
Gross Margin (UGX/kg)
747 100 200 200 700 Note: BP and SP are buying and selling prices; UCOP is unit cost of production; UGX is Uganda Shilling; USD1 = UGX3,590 at the time of
survey

Sector Analysis Studies for Commercial Agriculture for Smallholders and Agribusiness Programme P a g e | 41
6. Market Functions
6.1 Transport
Infrastructure is being developed in Uganda, but currently does not meet the needs of the growing
economy. With limited rail and air transportation, roads carry 95% of passenger and freight traffic
(Obita 2015). Only 19% of the national road network is paved, increasing journey times and vehicle
operation and maintenance costs. Access to feeder roads is also inadequate in many rural areas,
affecting producers’ access to physical markets (MoFPED 2015). Uganda is landlocked and relies on
Kenya (Mombasa) and Tanzania (Dar es Salaam), which are 1,100 and 1,600 km from Kampala,
respectively, for accessing port infrastructure for international trade, making road transportation all
the more important. In addition, only 14% of rural households have access to electricity, further
constraining the production and marketing of goods (Coronel 2015). Thus, poor infrastructure raises
transaction costs, increasing consumer prices and limiting profitability for chain actors.
6.2 Processing
6.2.1 Beans
Bean processors are yet to upgrade their processing technology to modern, efficient machinery. This
is associated with a high capital coupled with a thin market for value added bean products. However,
there is some indication of a growing market for processed beans.34 With increasing urbanization
coupled with awareness on healthy eating, it is expected that bean preference will increase. The
implication of urbanization and a high number of working class is that, people will have less time to
boil beans which take long and would instead turn to processed beans and bean products. Market
development for bean and bean products is an opportunity for the sector. The processing stage of
the value is under-developed and cannot meet the changing consumer demands though more
processors are introducing proven technologies that have been used elsewhere. Rotational steaming
and precooking for canning and film packing are well-developed technologies.
6.2.2 Rice
At farm level, the processing of rice paddy through single-pass processes is well developed but not
ideal if the rice is to be upgraded to a premium product. The primary process can cause breakages
and loss of quality and is inferior to the multi-pass method (in which processing steps, such as pre-
cleaning, de-husking, de-hulling, and paddy separation are performed separately) used by the larger
commercial growers. In an ideal milling process the result is around 20% husk, 8−12% bran and
68−72% milled rice. Total milled rice contains whole grains or head rice, and ‘brokens’, which are
non-ideal. The by-products of rice milling, such as husk and bran layers, can also provide valuable
animal feed components, which are not recovered during single pass milling.
The most important aspects of upgrading processing to create a higher quality product are the
whitening or polishing, grading and separation of white rice. These processes are not accessible to
individual smallholders on-farm and, in their absence, output quality is limited.
34 http://wire.farmradio.fm/en/farmer-stories/2016/11/uganda-growing-beans-for-a-ready-market-15456

Sector Analysis Studies for Commercial Agriculture for Smallholders and Agribusiness Programme P a g e | 42
6.2.3 Sesame
Sesame seeds need to be cleaned and fumigated to a high standard before supply to edible product
markets. Some exporters have processing facilities in the production regions, mainly West Nile, Gulu
and Lira. In Kampala, exporters screen, clean and package sesame into 50kg bags, which are packed
into 20 and 40MT containers. Domestic processors are smaller in scale, handling limited volumes and
processing into snacks for confectionary industries and into sesame paste for distribution to retail
shops and supermarkets. Other small-scale processors operate in urban markets in lockups that mill
and blend sesame with groundnuts into paste for application on bread.
Shares!, a Kampala-based company that finances, processes and exports organic sesame with a
smallholder production system, uses a “natural fumigation” process developed in the Netherlands to
achieve 99% and 99.9% purity seeds to EC/NOP and Biosuisse certified standards.
The extraction of sesame oil in Uganda is mainly done on an artisanal level using a pestle and mortar.
After harvesting, seeds are washed, sieved and left to dry. They are then pounded until oil starts to
collect and this is repeated until most of the oil is exhausted. The remaining residue is normally used
to prepare local meals cooked with either smoked fish or vegetables, and in some cases used as
animal feed.
Modern extraction methods used in the few sesame oil industries in the country, such as
Kahangi Estate Organic Products, are the batch hydraulic press, where seeds are pressed to extract
the oil, and continuous mechanical pressing, where they are squeezed through a funnel-shaped
outlet and oil is expressed by increasing pressure. It is possible to further refine sesame oil through
solvent extraction, neutralization and bleaching in order to improve its cosmetic aspects. However,
sesame oil derived from quality seeds already possesses a pleasant taste and does not require further
purification before it can be consumed. Many consumers prefer unrefined sesame oil due to their
belief that the refining process removes important nutrients. Solvent extraction is common in China
and India.
The three main stages involved in oil extraction are:
Cold press; the oil obtained in this stage has a light colour and smell and is of very good quality.
Second stage pressing; residue is subjected to high pressure, which extracts a deep brown oil that
needs to be refined before consumption.
Third stage pressing; the residue left after the second stage is subjected to more pressure to
extract oil. This product is of very low quality used for non-edible purposes such as making
insecticides, paint and cosmetics.
6.3 Storage
Both rice and beans benefit from proper storage facilities to prevent loss of quality through moisture
ingress and rodent infestation. Commercial storage facilities are available in Kampala and in major
towns less so in remote towns and villages (Obita 2015). The government reportedly has plans to
spend US$11 billion on an extensive overhaul of transportation and electricity networks over the next
10 years (Coronel 2015).
6.4 Commodity exchange
Uganda East Africa Exchange (UEAX) is the national-level subsidiary linked to the greater EAX.
Through the establishment of the commodity exchange and its supporting infrastructure, UEAX aims
to promote the commercialization of the Uganda Agricultural sector and improve market access to
Uganda smallholder farmers, linking them to markets across the East Africa Community Country
regions. At this stage the UEAX support grain farmers but has not developed for rice and beans.

Sector Analysis Studies for Commercial Agriculture for Smallholders and Agribusiness Programme P a g e | 43
6.5 Intra-Firm Organisation
6.5.1 Horizontal and Vertical Linkages - Beans
The bean seed value chain is shorter than that for dry bean outputs and is mainly controlled by seed
multiplier companies institutions, such as Victoria Seeds, FICA Seeds, NASECO, Community
Enterprises Development Organisation (CEDO) and NACCRI. The companies procure samples from
research and development institutions and have an established vertical contractual relationship with
producers for seed multiplication. However, these linkages are weakened by side-selling of
contracted outputs to other companies and commercial bean traders.
Seed companies grade the seeds and sell them to stockists and support organisations such as World
Vision and government programs, such as NAADS. Onward linkages between input suppliers and the
producers are not fully developed as many producers use own saved seed.
Horizontal relationships among producers are weak – few producer groups have been established for
any agricultural commodities. However, local traders have established linkages with individual
producers and trust-based pre-financing arrangements exist. The same arrangement also exists
between village collectors and wholesalers during periods of high demand.
6.5.2 Horizontal and Vertical Linkages - Rice
Village assemblers buy paddy rice from smallholder producers and sell it to processors. Producer-
trader relationships are often strong, with inputs or credit advanced by the buyers on a trust basis.
Although producer organisations exist, they only perform aggregation functions for the purposes of
selling unprocessed paddy to millers and traders.
6.5.3 Horizontal and Vertical Linkages – Seasame
Public-Private-Producer Partnerships Project of The Vegetable Oil Development Programme worked
farmers in West Nile Region to develop and promote cooperatives to become involved in input
supply, knowledge dissemination and marketing of commodities. However, such relationships are still
weak.
Traders work independently and in most cases, transactions are carried out on cash basis. However,
Uganda Oilseeds Subsector Platform (OSSUP) has provided a space for strengthening
communication, information exchange and learning among the actors of the sub-sector at regional
and national levels for policy and regulatory level. It also promotes “Public Private Producers
Partnerships in Agricultural Value Chains” on operational and financing matters.
Trader-producer relationships are trust-based and often include pre-finance. Sesame wholesalers
generally do not have contracts with their suppliers; those that do exist are seasonal. Price
fluctuations, poor quality of produce, side selling and suppliers’ preference for advance payments or
pre-financing hinder such formal arrangements.

Sector Analysis Studies for Commercial Agriculture for Smallholders and Agribusiness Programme P a g e | 44
7. Finance and Investment Agricultural financing has enjoyed an upward trend since 2010, now comprising 10% of bank lending,
which has increased for both production and processing activities. Around 93% of agricultural lending
is done by commercial banks, the remainder made up of credit institutions and microfinance deposit-
taking institutions (Bank of Uganda 2015).
7.1 Farmer Finance
Anderson et al. (2016) reported that nearly all Uganda’s smallholder households generate income
from agriculture; 80% produce a saleable surplus and 35% rear livestock, poultry, fish, or bees. Only a
limited proportion of smallholders stated that they earned income through means other than farming
– 5% are also business or shop owners, around 12% have occasional waged employment, and 21%
receive money from friends and family. The figure below describes the results of a smallholder
income survey.
Figure 20: Income Generating Activities of Ugandan Farmers
Source: Anderson et al. (2016)
The same study found that some smallholders earn income from other activities in agricultural
markets, such as buying products from other farmers for processing (3%) or resale (4%), service
provision such as equipment rental equipment (2%), and rental of land (4%). Beyond agriculture, only
1% of smallholders received payments from the government, such as pension, disability, or welfare.
Of this, more than half collected the money in cash, whilst one-third receive it via direct deposit to a
bank account and 2% received them through mobile money.
Recently, there have been efforts by government, NGOs, processors, and traders to promote
community-based organizations and area co-operative enterprises (ACEs), with the objective of
linking farmers to markets, including large buyers such as Agrinet, Agroways, and Aponye.
Warehouse Receipts Systems (WRS) offer smallholders improved marketing through bulking of their
produce, access to better storage facilities, access to credit whilst waiting for prices to increase, the

Sector Analysis Studies for Commercial Agriculture for Smallholders and Agribusiness Programme P a g e | 45
potential for increased prices through deferral of sale, and risk mitigation against damage of property
(Bank of Uganda 2015).
There are also initiatives such as the One Acre Fund, a non-profit social enterprise that serves 280,000
farmers across Kenya, Rwanda, Burundi, Tanzania, Uganda, and Malawi (Bank of Uganda 2015). The
Fund service bundle includes financing in the form of farm inputs with a flexible repayment schedule,
distribution of improved seed and fertilizer, agricultural training, and post-harvest and marketing
support. Products offered to over 1,000 farmers in Uganda include seed, fertilizer, solar lights, harvest
drying sheets, and crop insurance. According to the Bank of Uganda (2015), this generated around
US$140 in incremental profit per farmer per acre, and achieved a loan repayment rate of 96%.
7.2 SMAE Finance
Ugandan loan interest rates average 23%, in comparison with 9% in Kenya and 12% in Tanzania. Only
around 30% of SMEs that are granted commercial loans pay them back in full (Farouk). Their low
asset base offers weak security for lenders and, along with poor accounting and financial recording
practices, makes them high-risk credit propositions (Farouk).
Consequently, 64% of SMEs rely on owner financing as the main or sole source of finance. Twenty per
cent access loan financing, and 11% use hire purchase financing (Farouk). Alternative forms of finance
include:
Micro-finance – from licensed institutions, NGOs, co-operatives and a range of associations
offering savings, payments and insurance services to SME clients. MFIs serve rural areas flexibly at
low costs. However, they often have weak operational and management systems, poor internal
controls, limited access to technical assistance, and have a high dependence on donor funding. To
address these issues, a capacity building centre has been set up at the Uganda Institute of
Bankers;
Lease Financing – only one leasing company current operates in Uganda;
Venture Capital Financing;
Equity Financing – the Uganda Stock Exchange was set up in 1998, but most SMEs are unable to
utilise it because of listing rules regarding disclosure requirements. Due to the lack of credible
financial reporting in SMEs, they are often unable to provide this information to investors. Some
SMEs such as Ugachick Ltd. and Commercial Microfinance Ltd. have received equity financing
from the Development Finance Company of Uganda (DFCU), East African Development Bank
(EADB), and the European Investment Bank (EIB) (Farouk), and;
Credit Purchase Financing – for this type of financing to be successful, trust and reputation of
SMEs need to be established with their suppliers. Exact figures are hard to come by, but SMEs in
the retail industry have certainly benefitted from delayed payment for stock (Farouk).
Major Banks with agricultural portfolios include: DFCU Bank, Stanbic Bank, Bank of Africa, Standard
Chartered, Centenary Rural Development Bank, Uganda Development Bank.
7.3 Private Sector Investment
Uganda’s ranking in the World Bank’s 2017 Ease of Doing Business report has risen to 115th out of
190 countries – compared to 122 in the previous year. Furthermore, it ranks 12th out of the 48
economies in Sub-Saharan Africa, and third behind Kenya and Rwanda in the EAC. These recent gains
have been achieved by on-going efforts to reduce construction permit acquisition requirements,
improve access to electricity, and increase access to credit (Africa Business Group 2015).
Uganda also provides the following incentives for private sector investment:
Uniform corporation tax of 30%, the lowest rate in the region

Sector Analysis Studies for Commercial Agriculture for Smallholders and Agribusiness Programme P a g e | 46
Import duty exemptions for plant and machinery
Duty draw-back facility for exporters
A fully liberalised foreign exchange regime with no restrictions on the movement of capital in and
out of the country
A freely convertible and stable currency
A special initial allowance (accelerated depreciation) of 50-75% on plant and machinery
100% initial allowance for training, scientific research and mineral exploration expenditures
Value Added Tax (VAT) deferral facilities for plant and machinery
First Arrival Privileges in the form of duty exemptions for motor vehicle and personal effects to all
investors and expatriates coming to Uganda.
7.4 Government and Donor Investment
The Government National Agriculture Policy states that the role of the public sector in lending to
agriculture will be to provide support in form of loan guarantees to encourage financial institutions to
increase their portfolios to the sector. It emphasises the importance of public sector investment in risk
management and mitigation measures in agriculture, including irrigation to reduce dependence on
rainfall and weather-based insurance to hedge against weather related agricultural failure. The
Government aims to utilise private capital for this, initially supported by the public sector through
guarantees and capacity building where necessary (MAAIF 2011).
The following donor-funded programmes are active in the beans, rice and sesame sub-sectors:
Table 12: Other Donor-Funded Programmes
Donor Project
International
Fund for
Agricultural
Development
(IFAD)
Ministry of Agriculture, Animal Industry and Fisheries, Vegetable Oil Development
Project (VODP) - Phase 2; IFAD loan of USD52m. Completion set for December
2018. Identified as a problem programme by IFAD, progress in the oilseeds
component has been limited and focused on sunflower and soybean.
European Union
(EU)
Stabilizing Sesame Yields and Production in the Lango Region, Northern Uganda;
EUR374,063 (EU contribution 80%). Aims at developing technologies and
innovations that will intensify sesame productivity and commercialization by
smallholders in the districts of Amolatar, Otuke and Lira districts as a way of
contributing to food security and inclusive economic growth of the poor to
mitigate the impact of increasing inequality and population growth
United Kingdom
Department for
International
Development (UK
DFID), TradeMark
East Africa
(TMEA)
Implementation of the East African Standard for Maize Grains and Development
of a Standard for Sesame Seed in Uganda. Southern and Eastern African Trade
Information and Negotiation Institute; USD300,000. The lack of a grain standard
for sesame at both Uganda and EAC levels posed a challenge to meeting the
market requirements of the targeted export destinations and affected market
access for sesame. This project seeks to fill this gap.
UK DFID Northern Uganda: Transforming the Economy Through Climate Smart
Agribusiness (NU-TEC). Support is targeted at agribusinesses under a market
systems development approach and expected impacts are:
197,500 households (300,000 adults and 600,000 children) with improved
incomes (household cash income derived from agriculture increased by 15%)
331,150 direct beneficiaries (1.76m when including indirect household
beneficiaries) with improved resilience to climate change, of whom at least 35%

Sector Analysis Studies for Commercial Agriculture for Smallholders and Agribusiness Programme P a g e | 47
are women
The key outcome is £81m additional turnover within businesses, attributed to
project interventions.
The NU-TEC project consists of three main components, as well as an M and E
component:
Market Systems Development (MSD): Market systems development services,
and technical assistance, to private agribusiness. Palladium is delivering this five
year £14 million contract, to end in May 2020.
Specialised Credit Fund (SCF): Delivery of medium term credit to agribusiness
through a Ugandan financial institution, awaiting formalisation of the contract
Long Term Investment and Capacity Building (AgDevCo): Long term equity and
credit to agribusiness through AgDevCo, a not-for-project investment vehicle.
£12 million has been committed to AgDevCo.
An £800,000 contract has been awarded to Oxford Policy Management for Annual
Reviews, Monitoring and Evaluation. An additional £10 million is available to be
allocated to areas of greatest emerging potential.
The programme is working in the following markets: aggregation and storage;
land preparation; seeds; sunflower; soybean; carbon markets; feed.
Embassy of the
Kingdom of the
Netherlands
(EKN)
Integrated Seed Sector Development (ISSD) Uganda; implemented by
Wageningen University and Research Centre - Centre for Development
Innovation (WUR-CDI). Aims to build upon the strengths of both the formal
(public and private) and informal (farmers and community-based) seed systems
and seeks to consolidate them. Guides specific interventions in identified seed
systems; linking food and seed security to private sector development
and aligning and harmonising seed policies, laws, regulations, interventions,
programmes and practices.
Upland Rice
Millers Ltd.
/Ministry of
Agriculture,
Animal Industry
and Fisheries
(MAAIF)/Korean
International
Agency (KOICA)
Agro-processing and Marketing Strategy in Uganda (APM) Project MoU signed
on 20th
Oct 2016 but started in June 2017; duration 7 years. Objective is to
develop agro-processing and marketing strategies of rice and maize in Uganda.
Six farmer groups have signed a MoU with Upland Rice Millers.
The World Bank Agricultural Cluster Development Project (ACDP), 2015-22. The project
development objective for the Agriculture Cluster Development Project for
Uganda is to raise on-farm productivity, production, and marketable volumes of
selected agricultural commodities in specified geographic clusters. The proposed
project will adopt a phased approach, starting in a small number of clusters with
one or two commodities, and then building toward broader geographic coverage
including all five selected commodities.
UK DFID, KfW,
SIDA, DANIDA,
USAID, Dutch
Development
Cooperation,
Crossroads
Agricultural Business Initiative Trust (aBi). Multi-donor trust providing financing
and technical support in selected agricultural value chains, including beans and
sesame. In beans, 48% of participating farmers have been GAP certified and been
supported to increase productivity (the Trust cites improvement of average
output from 250kg/acre

Sector Analysis Studies for Commercial Agriculture for Smallholders and Agribusiness Programme P a g e | 48
8. Enabling Environment 8.1 Government Institutions, Policy, Strategy and Programmes
There are eight semi-autonomous bodies that report to the MAAIF for policy guidance:
National Agricultural Research Organisation (NARO)
National Agricultural Advisory Services (NAADS) for delivery of advisory services;
National Animal Genetic Resource Centre and Data Bank (NAGRC&DB) for animal genetic
development;
Coordinating Office for the Control of Trypanosomiasis in Uganda (COCTU)
Dairy Development Authority (DDA)
Uganda Coffee Development Authority (UCDA)
Cotton Development Organisation (CDO)
Plan for Modernisation of Agriculture Secretariat (PMA)
In 2011, the MAAIF drafted Uganda’s National Agricultural Policy (NAP), which outlined low
productivity, limited value addition to agricultural produce, lack of access to markets, and weak
regulatory environment as the core challenges to Uganda’s agricultural development. It set out
guiding principles with a mission to “Transform subsistence farming to sustainable commercial
agriculture”.
The NAP states that the biggest gains will be obtained from using improved inputs including seed,
stocking and planting materials, in order to boost productivity. There is also emphasis on better
utilising technological and scientific advancements.
The Agriculture Sector Strategic Plan (ASSP) for 2015/16-2019/20 provides a guidance framework for
identifying sector investments that will target increased production and productivity in selected
priority commodities. It is inspired by, and aligned to, a series of international, regional, and national
objectives and policies, including the UN Sustainable Development Goals, the Comprehensive Africa
Agriculture Development Programme, Uganda Vision 2040, the National Development Plan 2,
Operation Wealth Creation, and the NAP. Under the ASSP, the overall goal of the agriculture sector is
to achieve an average growth rate of 6% per year over the next five years. It aims to achieve this
through four strategic priorities:
to increase production and productivity of agricultural commodities and enterprises;
to increase access to critical farm inputs;
to improve access to markets and value addition and strengthen the quality of agricultural
commodities, and;
to strengthen the agricultural services institutions and the enabling environment.
The key outcome targets of the ASSP are:
1. Increase productivity by farmers to at least 50% of the yields at research stations for the 12
priority commodities;
2. Transform subsistence farmers (growing for consumption) into enterprise farmers (growing for
consumption and responding to market needs) and transforming smallholders farmers into
commercial farmers;
3. Increase food security and food availability in all parts of the country;
4. Increase agriculture exports to at least $4bn per year, and;
5. Reform and strengthen agricultural service institutions such as research, extension and regulatory
bodies to make them effective and efficient.

Sector Analysis Studies for Commercial Agriculture for Smallholders and Agribusiness Programme P a g e | 49
ASSP prioritises 12 commodities and four strategic commodities based on their contribution to
household income and food security. For beans, the ASSP targets production of 10m MT by 2020,
with annual exports projected to increase to US$63m. In order to achieve these targets, the sector
intends to increase production and productivity through increasing access to high quality seed inputs
like Rhizobia, support pest and disease control, and strengthen mechanisation and extension services.
Sesame is not mentioned specifically but the targets for oilseeds production is to double 2014 levels
to 2,027,800MT by 2020, and exports from vegetable oils to increase from US$102m to US$281m
through:
1. Increasing productivity and production through improved distribution and access to improved
quality seed, fertilisers, mechanisation and extension services;
2. Strengthening and increasing access to extension services by farmers;
3. Building and strengthening farmer organisations to sustainably provide services to their members;
4. Increasing access to credit by farmers and processors through the provision of agricultural finance;
5. Reducing post-harvest losses by promotion, capacity building and distribution of appropriate
technologies;
6. Promotion of collective marketing of high quality oilseeds;
7. Strengthening the oilseeds sub-sector platform to oversee and coordinate relevant policies.
The National Agricultural Research Organization (NARO) conducts research through its National Seri
Arid Resources Resource Institute (NaSARRI) on higher yielding, higher oil content varieties, of which
it has released two (Sesim I and II).
For rice, the ASSP targets production of 680,000 MT by 2020, generating at least US$73m worth of
exports. To achieve this, the sector aims to increase the production and productivity of rice farming
through the multiplication and distribution of improved foundation seed, mechanisation, investment
in irrigation infrastructure starting with Eastern Uganda, and provision of extension services.
Moreover, to reduce post-harvest losses the sector intends to promote and distribute appropriate
post-harvest technologies, increase access to credit by rice farmers, traders and processors and
promote marketing of rice by promotion of collective marketing for high quality rice.
The MAAIF has also drafted the National Rice Development Strategy (NRDS). Its stated goal is to
increase household food security and reduce household poverty in Uganda through increased
production of high quality rice. Specifically, the NRDS aims at rice self-sufficiency in Uganda by 2018
through:
strengthening the institutions for production;
improving the production, multiplication and dissemination of certified seeds;
minimizing post-harvest losses through improved post-harvest handling and processing
technologies;
improving research, technology dissemination and capacity building;
increasing sustainable utilization of fertilizers, other agro-inputs and farm resources for maximum
yield;
improving and increasing sustainable water use and management;
enhancing mechanization of the rice sub-sector in order to minimise cost of farm labour, and;
increasing agricultural finance.

Sector Analysis Studies for Commercial Agriculture for Smallholders and Agribusiness Programme P a g e | 50
8.2 Non-governmental and private sector organisations
In addition to national private sector organisations, several NGOs operate in northern and eastern
Uganda, working with clusters of farmers to promote improved livelihoods through promotion of
improved technologies, linking farmers to markets through formation of groups and dissemination of
market information, promotion of organic agricultural practices through farmer training and
facilitation of certification of organic produce. Such organizations include:
Table 13: Relevant NGO and Private Sector Organisations
Organisation Description
National Organic Agricultural
Movement of Uganda
(NOGAMU)
Umbrella organization that represents producers, processors,
exporters, NGOs and other institutions and organizations involved in
the promotion and development of the organic sector in Uganda.
Has six main areas of work: advocacy and strategic relations;
marketing and value chain development; training, research and
extension; standards and certification; consultancy and focus group
services. Has market information services and promotes organic
produce.
Uganda Oil Seed Producers
and Processors Association
(UOSPA)
Umbrella association of oil-seed crop producers (farming
communities), oil-seed crop processors and other oil-seed crop
stakeholders, including policy makers, traders, researchers and
consumers of oil-seed products. Current membership includes 65
small- and medium-scale milling industries 947 farmer groups
comprising 47,350 farmers. Work areas are: business development
support; institutional and skill development (production, post-harvest
handling, processing, organizational development); marketing and
input supply; support with credit sourcing; sector coordination.
Rice Millers Council of
Uganda (RMCU)
Founded in 2015 by the Ministry of Trade, Industry, and
Cooperatives. Currently comprised of 16 medium- and large-scale
millers and an associate member (IFDC). Conducts policy
advocacy and interfaces with Government, development partners
and other stakeholders, and provides representation for all those
engaged in the sector. Estimates that there are around 20
medium- and large-scale millers and 850 small-scale processors in
Uganda, sourcing from 400k smallholders under two main models
– trade-based, where rice is purchased, and milling service
provision, where it is milled for a fee without a change in
ownership.
Grain Council of Uganda
(TGCU)
A non-profit membership organization registered in 2012. Brings
together key stakeholders along the grain value chains. Strives for
greater efficiency and effectiveness for increased competitiveness.
A platform for collaboration and coordination of activities in
grains markets.
Private Sector Foundation
(PSFU)
Uganda’s apex body for the private sector composed of over 200
business associations, corporate bodies and the major public
sector agencies that support private sector growth. Serves as a

Sector Analysis Studies for Commercial Agriculture for Smallholders and Agribusiness Programme P a g e | 51
focal point for private sector advocacy, capacity building and
policy dialogue with Government.
Uganda Manufacturers
Association (UMA)
Represents the interests of industrialists to Government
Uganda National Farmers
Federation (UNFFE)
The largest private sector, farmer-based, umbrella membership
Non-governmental Organization (NGO) in Uganda (and one of
the largest in East and Central Africa). Advocates for, lobbies and
articulates farmers’ developmental issues and programmes. Its
membership is composed of over 90 independent associations of
farmers, agro-industrialists and agro-commodity dealers whose
individual membership is over 1,000,000, of whom about 40% are
women. The greatest membership segment is comprised of 70
District Farmers Associations (DFAs), which are spread across the
Northern, Eastern, Central and Western regions of the country.
Volunteer Efforts for
Development Concern
(VEDCO)
NGO with an agricultural development workstream covering the
areas of strengthening producer organisations, agribusiness and
value chain development training, market linkage and access to
finance. Works in over 22 districts. Also performs policy advocacy
work.
8.2.1 Market interventions
Under the Government’s Plan for Modernisation of Agriculture, several key priority areas have been
highlighted for intervention and action by the public sector:
Research and Technology Development – The Uganda National Council of Science and
Technology (UNCST) is the apex organisation for Uganda’s research system. The mandate for
agricultural research is delegated to the National Agriculture Research Organisation (NARO), but
75% of NARO institutes are located within a 30km radius of Kampala, implying the need for a
decentralisation process. Priority research areas include technology development and
multiplication, socio-economic research, strategic research; farm-power and post-harvest
technologies; and land and water resources management.
National Agricultural Advisory Service – The delivery of technical messages to farmers has
previously been done by Government agricultural extensionists who have also administered the
delivery of various inputs and/or support and service programmes. These services were effective
until the political turmoil that occurred in the 1980s, and efforts to revive it since have failed. The
Government plans to address this, with a vision of “decentralised, farmer owned and private
sector serviced advisory services, contributing to the realisation of the agricultural sector
objectives”.
Agricultural Education – Poor farmers have identified low education levels, ignorance, lack of
information and lack of skills as factors influencing their inability to access and benefit from
livelihood opportunities. The Government proposes to develop an engendered Agriculture
Education Policy that encompasses the promotion of agriculture as a business, treatment of
agriculture as a branch of applied science focusing on experiential learning, discouraging the use
of agriculture as punishment in schools, application of multi-disciplinary approaches,
encouragement of participation, recognition of indigenous knowledge and the incorporation of

Sector Analysis Studies for Commercial Agriculture for Smallholders and Agribusiness Programme P a g e | 52
the community and the decentralised system of local government in the implementation of
agricultural education.
Improving Access to Rural Finance – in order to realise the vision of “an efficient nationally
integrated system of financial institutions and intermediaries capable of accomplishing financial
intermediation in rural sectors”, key priority areas will be developing an effective legal and
regulatory framework, capacity building for MFIs, privatisation of Government credit programs,
Government transfer of UCB branches promotion of other MFI initiatives, and promotion of
formal banking system involvement in rural finance;
Agro-processing and Marketing – strategies for improving market access include improving and
expanding the road network, growing the means of transport, improving market infrastructure,
providing access to market information, providing access to the international market, investing in
storage facilities and agro-processing activities, and improving access and quality to agricultural
inputs;
Sustainable Natural Resource Utilisation and Management – this includes improved policies on
land utilisation, water for production, forestry, and climate change issues, and;
Physical Infrastructure – including roads, electricity, water, and communication.
8.3 Regulatory Framework
The policies and objectives set out by the NAP and ASSP will be implemented by the Government of
Uganda, through the MAAIF and associated stakeholders. The below table sets out the Ugandan
agricultural sector players and their roles according to the ASSP (MAAIF 2016).
Table 14: Roles of Relevant Government Bodies
Institutions Responsibilities
MAAIF a) Act as the lead agency in the implementation of the ASSP.
b) Policy formulation, regulation and quality control;
c) Establish the structure for coordinating, monitoring and evaluating ASSP;
d) Develop and disseminate guidelines to operationalise the ASSP;
e) Build the capacity and collaborate with other stakeholders to ensure
mainstreaming of ASSP interventions in their respective programmes and plans;
f) Strengthen collaboration and networking with the stakeholders to promote
mutual appreciation/ understanding, guidance, involvement and community
support for ASSP interventions;
g) Develop the ASSP operational plans;
h) Reviewing and strengthening linkages between MAAIF HQ, Agencies, ATIs and
DLG production departments; ASSP 2015/16 to 2019/20 Draft 68 Institutions
i) Periodically review and restructure MAAIF to ensure adequate alignment with the
implementation requirements of the ASSP
j) Provide for the establishment of requisite approved structures and employment
of personnel and ensure their effectiveness by equipping them as required
Sector
Agencies
a) Strengthen the structures of the sector Agencies to enable them carry out their
mandate to extend to services in line with increasing agricultural production and
commercialisation.
Sector
Ministries
a) Translate the ASSP into sector-specific strategies and activities;
b) Collaborate with the MAAIF on matters of mainstreaming ASSP priority concerns
in their respective sector interventions.
Local
Governments
a) Ensure that the local government development programmes are in line with
objectives of increasing production and commercialisation of agriculture;

Sector Analysis Studies for Commercial Agriculture for Smallholders and Agribusiness Programme P a g e | 53
(Production
Departments)
b) Strengthen the structures of the LGs to enable them to effectively execute
country-wide mandate to extend quality service delivery in the agricultural sector;
c) Delivery of field-level agricultural services to the population.
d) Monitor mainstreaming of ASSP interventions in local governments to ensure
services benefit them;
e) Collaborate with MAAIF on matters of increasing production and
commercialisation of agriculture;
Development
Partners
a) Support the implementation of the ASSP;
b) Ensure consideration and alignment of ASSP priorities in development of
cooperation partnerships;
c) Establish appropriate institutional/ donor coordination mechanisms for ensuring
responsiveness of development cooperation towards the achievement of the ASSP
objectives;
Civil Society
and Private
Sector
a) Participate in Sector Working Groups and local government planning and
budgeting processes to advance farm productivity
b) Develop and implement programmes that address key ASSP intervention areas;
c) Farm production, agro-processing and marketing of agricultural output;
d) Collaborate with MAAIF and other appropriate institutions on matters of
mainstreaming of increasing production and commercialisation of agriculture;
e) Complement Government in delivering of agricultural services to farmers;
f) Strengthen good agricultural practices (GAPs), agribusiness and market
development services and governance
g) Establish PPP initiatives aimed at increasing production and commercialisation
of agriculture;
Academia a) Establish collaborative partnerships with MAAIF, agencies and LGs
b) Contribute to agricultural research
c) Review curricula to respond to labour market needs
d) Provide high quality relevant practical training
Private
Sector
a) Jointly form PPPs
b) Provide complimentary interventions for ASSP implementation
Farmers a) Form farmer groups and other institutions
b) Implement production and productivity enhancing interventions
c) Define and articulate needs
8.4 Infrastructure and Utilities
The specific challenges to the beans, rice and sesame value chains provided by Uganda’s
infrastructure are as follows (USAID 2014):
There is a lack of rural drying and storage facilities;
Rice is not part of a warehouse receipt system;
Rural rice hullers exist but are of poor quality. They generally produce a high proportion of
broken rice;
Distribution of rice processing capacity is limited by the electricity grid;
Diesel-operated mills are smaller and more expensive to run;
Vehicle wear and tear, high running costs and delays all reduce profits for farmers and margins
for traders;
Costs of inputs increased because of transport and transaction costs;
These high costs encourage counterfeiting and sale of fake inputs, especially agro-chemicals.
Sector Analysis Studies for Commercial Agriculture for Smallholders and Agribusiness Programme P a g e | 54
9. Potential interventions 9.1 Sesame
9.1.1 Linking Smallholders with Markets and Agribusinesses
Investment 1: Promotion of improved sesame varieties
CASA could facilitate a smallholder-based improved sesame seed multiplication programme for
varieties such as Sesame 2. Gulu would be a suitable venue for a pilot programme, in partnership with
NU-TEC. A firm such as the Gulu Agricultural Development Company (GADC) would work with Gulu
Farmers and Produce Dealers Association (GFPDA), obtaining foundation seed from the National
Agricultural Research Organisation (NARO). The seed would be collectively multiplied by selected
farmers’ groups for sale to other producers, with the necessary technical knowledge disseminated by
GADC. Cooperatives could be facilitated to obtain credit on behalf of members for procurement of
improved seeds and tractor hire services.
Investment 2: Strengthened horizontal linkages for smallholder sesame producers
In order to facilitate collective input purchase and output marketing, CASA could support GFPDA to
strengthen and/or create farmers’ associations, or cooperative societies, in each of six districts in Gulu
as a pilot project. Ultimately, the model could be replicated in Lira and other sub-regions of Northern
Uganda. The associations or societies would engage in assembling, cleaning, grading and storage of
sesame for sale to buyers such as Olam, ETG, AgriExim, Shares! and Lira Resort. GADC could provide
farmer training in post-harvest handling and agribusiness.
9.1.2 Supporting Agribusiness to Prepare for Investment
Investment 1: Capacity building of sesame traders
Poor quality sesame seed outputs are often the result of poor handling and storage practices by
traders. In order to develop these trading businesses and make them a more attractive investment
prospect, CASA could facilitate training in good practices by GADC, while investigating potential
sources of small loans for upgrading of infrastructure such as storage and marketing premises,
weighing scales, tarpaulins, and so on.
9.1.3 Enabling Environment
Several buyers – including Shares! and AgriExim – would like to source organic sesame in Uganda.
This higher value product is not subject to the same price volatility as conventional sesame and
commands a premium. However, there are conflicts among organic food production and other
activities, notably the GoU’s malaria control programmes through the Ministry of Health, in which
large swathes of rural areas are treated with insecticides, notably DDT, contaminating crops and
rendering them in violation of organic production standards.
The National Organic Agricultural Movement of Uganda (NOGAMU) and Uganda Oil Seed Producers
and Processors Association (UOSPPA) are two examples of stakeholder organisations that could
engage in dialogue among their member organisations and local and national Government to
examine instances where development and land use priorities are conflicted.

Sector Analysis Studies for Commercial Agriculture for Smallholders and Agribusiness Programme P a g e | 55
In 2016, Trademark Africa worked with the Southern and Eastern Africa Trade Information and
Negotiations Institute (SEATINI) to develop a standard for sesame. There may be an opportunity for
CASA to support the implementation of this standard.
9.2 Rice
9.2.1 Linking Smallholders with Markets and Agribusinesses
Investment 1: Promotion of use of improved rice inputs to enhance productivity
CASA could promote use of improved rice varieties and fertilizer among project farmers in order to
increase rice productivity and production, working in partnership with JICA, rice buyers and NARO,
which could supply OPV foundation seed, and selected farmers’ groups. Seed could be distributed to
farmers by buyers under the “One Kilogramme” model, in which recipients of one kilogramme of
improved seed promise to provide the same quantity to group members upon harvest. Other
financing models for sustainable linkage to seed sources could also be investigated with
implementing partners during the project design phase. OPV seed could be recycled for two years.
For fertilisers, CASA could work to support the World Bank funded Agricultural Cluster Development
Project (ACDP) in MAAIF, in which licensed private companies deliver and sell it to farmers at their
cooperatives under an e-voucher system. IFDC and MAAIF could provide technical support in best
practices for fertiliser use. Cooperatives could be facilitated to mobilize agricultural credit for
members.
Investment 2: Enhancement of rice post-harvest handling, value addition, and marketing
In partnership with MAAIF, the Ministry of Trade, Industry and Co-operatives (MTIC), and rice buyers,
CASA could facilitate capacity building of farmers’ groups and associations to become cooperative
societies that will engage in collective marketing of produce in each district. The societies would take
on the functions of assembly, cleaning, grading, and improved storage of rice. Three medium-sized
rice millers (Pearl, Divine Masters and Eastern Rice) are potential partners for piloting a forward
marketing contract system. Market information could be provided to farmers, traders, and millers
under a public private partnership between MAAIF), MTIC and private market information service
providers such FIT (U) Ltd.
9.2.2 Supporting Agribusiness to Prepare for Investment
Investment 1: Capacity building of traders and millers for enhanced rice quality
CASA could provide rice buyers and processors with technical assistance on attaining quality
standards, and linked to loan facilities to procure post-harvest handling equipment, such as moisture
meters, and more modern processing machinery, such as de-stoners.
9.2.3 Enabling Environment
Rice production requires large volumes of water and has been associated with wetland destruction.
There is also the potential for pollution (nutrient enrichment leading to ecosystem change) from
fertiliser run-off and, for upland rice, for further deforestation from “slash and burn” shifting
agriculture. There needs to be dialogue between the National Environmental Management Authority
(NEMA), farmers’ representative groups, MAAIF, JICA and other interested stakeholders on
eliminating or mitigating environmental damage, for example through standards in conservation
agriculture and zoning of rice production according to impact assessments.
Secondly, there is a need to form an apex association for rice farmers – a National Rice Farmers’
Association – in order to represent producers’ interests to Government. In addition, the Uganda Rice

Sector Analysis Studies for Commercial Agriculture for Smallholders and Agribusiness Programme P a g e | 56
Millers Council (URMC) could be strengthened. In the interim, the Rice Secretariat established with
support from JICA could assist in bringing all rice value chain stakeholders together for policy
dialogue, for example in land use planning conflicts and brown import policy.
9.3 Beans
9.3.1 Linking Smallholders with Markets and Agribusinesses
Investment 1: Promotion of use of improved inputs to enhance productivity and
production
CASA could promote use of improved bean varieties and fertilizer among project farmers in order to
increase bean productivity and production, working in partnership with VEDCO, bean buyers and
NARO, which could supply foundation seed, and selected farmers’ groups. As with rice, seed could be
distributed to farmers by buyers under the “One Kilogramme” model, or other financing models for
sustainable linkage to seed sources developed with implementing partners during the project design
phase. A pilot would take place in the five districts in which VEDCO is currently operating.
Again in parallel to the rice intervention, CASA could work with ACDP, with support from MAAIF and
cooperatives for credit supply and technical assistance.
Investment 2: Enhancement of beans post-harvest handling, value addition, and
marketing
In partnership with MAAIF, the Ministry of Trade, Industry and Co-operatives (MTIC), VEDCO and
bean buyers, CASA could facilitate capacity building of farmers’ groups and associations to become
cooperative societies that will engage in collective marketing of produce in each of five districts. The
societies would take on the functions of assembly, cleaning, grading, and improved storage of beans.
Buyers such as traders, Agroways, Upland Rice Millers and the UN WFP are potential partners, and
VEDCO is a potential implementing partner for producer training. Market information could be
provided to farmers, traders, and millers under a public private partnership between MAAIF), MTIC
and private market information service providers such FIT (U) Ltd.
9.3.2 Supporting Agribusiness to Prepare for Investment
Investment 1: Formalisation and structuring of beans trade
To promote structured trading, bean traders/aggregators could be trained on post-harvest handling
management and quality standards and linked with Agroways and Upland Rice Millers with modern
equipment and technologies, such as grain driers and cleaners, moisture meters and triple bags.
CASA could also facilitate strengthening of vertical relationships between traders at different levels so
that market information flows improve and the marketing system is more responsive to end user
preferences.
9.3.3 Enabling Environment
In order to foster policy dialogue, there is a need to form an apex association for bean farmers and
traders at the national level – National Beans Farmers Association and National Beans Traders
Association – in addition to strengthening the Beans Secretariat established with support from USAID.

Sector Analysis Studies for Commercial Agriculture for Smallholders and Agribusiness Programme P a g e | 57
10. Recommendations
10.1 Increasing the quality and quantity of sesame seed offered for sale
With inputs of facilitation and technical assistance from CASA, a pilot could initially target 30,000
farmers in six districts of Gulu. Given that sesame seed multiplication rate is very high, with the seed
rate being 1-2 kg/acre (around 2.5-5kg/ha), and assuming that each 2kg planted yields at least 200kg
to be distributed to farmers, the output would be 4,000MT at the end of year two.
By using improved seed with the correct agricultural practices, smallholders’ yields could increase
from 100MT/acre (247MT/ha) to 300MT/acre (741MT/ha) through adoption of improved varieties and
good agricultural practices. Marketable surpluses might increase from 63% to 75%. In addition, post-
harvest losses could be reduced by 10% along the value chain. We estimate that these changes could
result in 30% income increases, equivalent to around USD24/smallholder/year, to sesame producing
households, through increased sales as the result of greater productivity and lower loss levels, all else
being equal (sesame global market prices are somewhat volatile).
10.2 Increasing the quality and quantity of rice offered for sale
CASA could potentially reach 15,000 farmers in three selected districts in eastern Uganda. Given that
the rice seed multiplication rate is 100 and seed rate is 50kg/acre (123kg/ha), assuming that 1kg of
planted seed yields at least 50kg output, 1 acre would output 2.5MT (6.2MT/ha) in one year (one
growing season). Farmer adoption of fertiliser might reach 25% and productivity could rise from
2.5MT/acre (6.2MT/ha) to 4MT/acre (9.9MT/ha), around 80% of potential yield. Post-harvest losses
might be expected to decline from 30% to 10% and a rice-producing household could potentially
increase income from rice by 50%, equivalent to around USD60-110/smallholder/year (depending on
yield) based upon our assumptions of greater productivity, increased quality and better prices.
10.3 Increasing the quality and quantity of beans offered for sale
We assume that the bean seed multiplication rate is 40 and seed rate is 40 kg/acre, 1 kg planted
yields at least 20 kg, and that on giving back 1kg, a farmer retains 20kg that will plant 0.5 acre with
total output of over 0.4 MT over two growing seasons. The proportion of project farmers using
improved seeds and fertilisers might reach 75% and 25%, respectively. This would result in
productivity increases from 500 MT/acre to 1,200 MT/acre (75% of potential yield) over two seasons,
a 20% decline in post-harvest losses and an increase in marketable surplus from 20% to 50% in
beneficiary farming households. This increased output (and, therefore assumed sales) and reduced
losses might translate into an income increase of 50%, equivalent to around USD21/smallholder
/year, all else being equal. Clearly, if there were large-scale increases in bean output, local prices may
be depressed, depending upon demand side dynamics.
10.4 Potential SME partners
Table 15: Potential SME partners
Business Sector Comments
Agroways Ltd. Beans Operates in one of the major beans growing areas of Uganda (Busoga sub-
region). Bean surpluses could be aggregated at farmer group level and
delivered to Agroways for cleaning, drying, storage and sale, which has
eight satellite stores managed by farmer groups.
Upland Rice Rice, Also located in the Busoga sub-region, where both beans and rice are

Sector Analysis Studies for Commercial Agriculture for Smallholders and Agribusiness Programme P a g e | 58
Millers Ltd. beans produced and traded.
Divine Masters
Ltd
Rice Has stated plans to bring more smallholders into rice production.
Eastern Rice
Company Ltd.
Rice Has stated readiness to engage with more smallholder farmers if supported.
Pearl Rice Will receive an IDB loan, but only for construction of dams.
Gulu
Agricultural
Development
Company
(GADC)
Sesame Works with a large number of smallholders. Although it has received some
support, CASA could facilitate expansion of its smallholder engagement.
Lira Resort Sesame The only potential SME operating in the Lango sub-region, a major
producer of sesame.

Sector Analysis Studies for Commercial Agriculture for Smallholders and Agribusiness Programme P a g e | 59
11. Annexes Annex A: Bibliography of Value Chain Resources
Action against Hunger (2014), “Agricultural Value Chain Analysis in Northern Uganda: Maize, Rice,
Groundnuts, Sunflower, and Sesame. Available at:
http://bdsknowledge.org/dyn/bds/docs/882/Agricultural_value_chain_in_Northern_Uganda_Maiz.pdf
AfDB (2013) “Uganda: Community Agricultural Infrastructure Improvement Programme, Project-1
(CAIIP-1)”. Available at: https://www.afdb.org/fileadmin/uploads/afdb/Documents/Generic-
Documents/Uganda%20-
%20Community%20Agricultural%20Infrastructure%20Improvement%20Programme%20Project%20-
1%20(CAIIP-1).pdf
Africa Business Group (2015) “Uganda Agriculture Investment Opportunities Brief”, CAADP Investment
Facilitation Programme, available at:
http://www.abghq.com/downloads/Uganda_Agriculture_Investment_Opportunities_Brief.pdf
Anderson, J., Learch, C.E., & Gardner, S.T. (2016) “National Survey and Segmentation of Smallholder
Households in Uganda: Understanding their Demand for Financial, Agricultural, and Digital Solutions”,
CGAP, The World Bank.
Bank of Uganda (2015) “Agricultural Finance Yearbook 2015”, Available at:
https://www.giz.de/de/downloads/giz2016-en-agricultural-finance-yearbook.pdf
CIA (2016) “Uganda”, The World Factbook
Deloitte (2016) “Uganda Economic Outlook 2016” Available at:
https://www2.deloitte.com/content/dam/Deloitte/ug/Documents/tax/Economic%20Outlook%202016
%20UG.pdf
FAO (2014) “FAOSTAT”, Crops.
Farouk, S. () “Financing Small and Medium Enterprises: A Major Hindrance to Eradication of Extreme
Poverty in Uganda”, AfDB
GIEWS - Global Information and Early Warning System Uganda country brief - Reference Date: 14-
November-2016
Government of Uganda (2016) “Plan for Modernisation of Agriculture: Eradicating Poverty in Uganda”,
Available at: http://www.inclusivebusinesshub.org/wp-
content/uploads/2016/05/PMAMaindocument.pdf
JICA (2013) “Rice In Uganda: Viewed from Various Market Channels – A Survey Report”, Promotion of
Rice Development Project
Kilimo Trust (2012) “Development of Inclusive Markets in Agriculture and Trade (DIMAT): The Nature
and Markets of Bean Value Chains in Uganda” Available at:
http://www.undp.org/content/dam/uganda/docs/UNDP%20Uganda_PovRed%20-
%20Beans%20Value%20Chain%20Report%202013.pdf
Kraybill, D. & Kidoido, M. (2009) “Analysis of relative profitability of key Ugandan agricultural
enterprises by agricultural production zone”, International Food Policy Research Institute (USSP
Background Paper 04)
Sector Analysis Studies for Commercial Agriculture for Smallholders and Agribusiness Programme P a g e | 60
Larochelle, C., Katungi, E., Beebe, S. (2015) “Disaggregated Analysis of Bean Consumption Demand and
Contribution to Household Food Security In Uganda”, Virginia Tech & International Center for Tropical
Agriculture, 10.13140/RG.2.1.1279.6002.
MAAIF (2011) “National Agriculture Policy”. Available at: http://tasai.org/wp-
content/themes/tasai2016/info_portal/Uganda/Uganda%20National%20Agriculture%20Policy%20201
5.pdf
MAAIF (2012) “Uganda National Rice Development Strategy (NRDS): 2008-2018”
MAAIF (2016) “Agriculture Sector Strategic Plan 2015/16-2019/20”. Available at: http://npa.ug/wp-
content/uploads/2016/08/ASSP-Final-Draft.pdf
MFPED (2014) “Distribution of Agricultural Inputs in Uganda: what are the key challenges?”, BMAU
Briefing Paper 8/14
MTIC (2017) “Launch of Rice Millers Council of Uganda”, Available at:
http://mtic.go.ug/index.php?option=com_content&view=article&id=221:launch-of-rice-millers-
council-of-uganda&catid=10:current-news&Itemid=118
Munyua, B., Orr, A., & Okwadi, J. (2013) “Open Sesame: A Value Chain Analysis of Sesame Marketing in
Northern Uganda”, ICRISAT. Available at: http://oar.icrisat.org/7095/1/SDPS-
6_OpenSeasame_Munyua_2013.pdf
Musimami, G. (2012) “Country Profile – Uganda”, New Agriculturalist, Available at: http://www.new-
ag.info/en/country/profile.php?a=2414
MWE (2015) “Economic Assessment of the Impacts of Climate Change in Uganda”, Climate Change
Department, Available at: https://cdkn.org/wp-content/uploads/2015/12/Uganda_CC-
economics_Final-Report2.pdf
Nelson, G., Rosegrant, M., Koo, J., Robertson, R., Sulser, T., Zhu, T., Ringler, C., Msangi, S., Palazzo, A,
Batka, M., Magalhaes, M., Valmonte-Santos, R., Ewing, M., & Lee, D. (2009) “Climate Change: Impact on
Agriculture and Costs of Adaptation”, International Food Policy Research Institute: Washington DC.
PSFU (2016) “Who we are”, Available at:
http://www.psfuganda.org/new/index.php?option=com_content&view=article&id=72&Itemid=30
Ricepedia (2014) “Uganda”, available at: http://ricepedia.org/uganda
UBOS (2011) “Uganda Census of Agriculture 2008/09”, UBOS in Collaboration with MAAIF, Available at:
http://www.ubos.org/onlinefiles/uploads/ubos/pdf%20documents/UCAGlance.pdf
UEPB (2005) “Dry Beans: Product Profile No.12”, Available at:
http://s3.amazonaws.com/zanran_storage/www.ugandaexportsonline.com/ContentPages/247069331
2.pdf
Ugen, M. (2009) “Value Chain Prioritization for USAID-funded Livelihoods and Enterprises for
Agricultural Development (LEAD) Uganda Project” USAID. Available at:
http://pdf.usaid.gov/pdf_docs/PA00J795.pdf
UIA (2016) “SMEs Driving the Economy”, Available at: https://www.ugandainvest.go.ug/smes-driving-
economy/
USAID (2010) “Market Assessment and Baseline Study of Staple Foods. Country report – Uganda”.
Available at: http://pdf.usaid.gov/pdf_docs/Pnadw642.pdf
USAID (2014) “An Overview of Climate Change and Agricultural Infrastructure in Uganda”, African and
Latin American Resilience to Climate Change Project.

Sector Analysis Studies for Commercial Agriculture for Smallholders and Agribusiness Programme P a g e | 61
Annex B: Stakeholders Consulted, Beans and Rice
Name & Address Overview Current Activities in the Sector
Ms. Grace Nanyonjo
Uganda Legumes Research
Programme
National Crops Resources Research
Institute, NARO, +256(0)771 471
984
The programme is
mandated to generate
and disseminate
technologies for
enhanced production
of dry beans and
soybeans. It generates
materials for
improved yields,
tolerance to pests and
diseases, climate
change, etc.
The bean research programme has
just ended a 33-months’ project for
promotion of pre-cooked bean
products innovations in the beans
value chain i.e. value addition to
increase trade. The farmers were
linked to specialized output markets.
Bean varieties suitable for pre-
cooked beans processing have been
identified and available for
multiplication
Mr. David WozembaWetaka
Senior Technical Manager
NU-TEC Market Development
Palladium Group (U) Limited
+ 256 (0) 786 986 065
david.wozemba@thepalladiumgrou
p.com
Transforming the
Economy through
Climate Smart Agri-
Business Market
Development
programme aims to
increase the incomes
and climate resilience
of poor men and
women in Northern
Uganda.
David was interviewed as a beans
expert although NU-TEC does not
support the beans value chain.
Mr. Boniface, B. Mugisa
Team Leader
Legume Seeds Pilot
AgResults, Lutheran World Relief
+ 256 (0) 784 769 837 / 757 964 606
Project employs a pull
mechanism to
incentivize seed
companies to produce
and sell quality
verified bean and
soybean seed varieties
to smallholder
farmers across
Uganda.
The pull mechanism consists of two
parts (1) an annualized prize that
provides a premium on seed sales
growth; and (2) access to cold
storage to allow companies to carry
over unsold seed from one season to
the next.
Prizes are distributed after an
independent verifier confirms the
amount of seed sales reported.
Mr. DidasKumwesiga
Trade and Policy
FtF EEA Activity
+ 256 (0) 776 281 163
dkumwesiga2ugandaeea.com
The Activity works
with the public and
private partners to
create a better
regulatory framework
for farmers and
agribusinesses
Improving policy, legal and
regulatory frameworks that
affect agricultural production
and trade.
Help policymakers and the
private sector adapt to the
effects of climate change on
agriculture.

Sector Analysis Studies for Commercial Agriculture for Smallholders and Agribusiness Programme P a g e | 62
Name & Address Preamble Current Activities in the Sector
Mr. Robert Anyang
Chief of Party (USAID)
FtF CPM Activity
+ 256 (0) 776 666 018
The activity focuses
on strengthening the
maize, bean and
coffee value chains.
The target
beneficiaries are the
farmers and
agribusiness including
traders, processors
and exporters
Enhancement of crop
productivity and production
Making support services for
farmers more accessible and
more effective
Improving economic output
Strengthening inter-actor
relationships for more effective
movement of products and
information between buyers and
sellers and promoting access to
competitive markets
Dr. Joseph Oryokot
World Bank,
Agriculture Cluster Development
Project,
+ 256 (0) 772 288 806
Technical Assistance
to MAAIF by World
Bank facilitated
ministerial task teams
and systematic
consultative
workshops that came
up with an Action
Plan forming the basis
for the proposed
Agriculture Cluster
Development Project
(ACDP).
Beneficiaries are
farmers and other
value chain actors i.e.
farmers’
Associations and
private sector actors.
The project will work
with approximately
450,000 farming
households producing
maize, beans, rice,
Robusta and Arabica
coffee and cassava.
Support for Intensification of
On-Farm Production.
Participating farm households
will benefit from greater
efficiency, larger volumes of on-
farm production and more
favourable prices for inputs as
well as for marketed produce.
Market Linkages, Post-Harvest
Handling, Storage and Value
Addition. The involvement of
wholesale buyers, input dealers,
rural banks and commercial
farmers is crucial in establishing
linkages to ensure effective
access to productive assets,
capital, services, technical know-
how, and markets.
Project Management, Policy,
Regulatory, and ICT functions of
MAAIF. The development of
agricultural input supply chains
as well as the development of
the marketing and distribution
system for both domestic sales
and exports of the commodities
will be done with particular
focus on the policy and
regulatory issues affecting
agricultural value chains.
Mr. Henry Nakeletopolot
Assistant Commissioner
Development of agricultural
Infrastructure and Water for
Agricultural Production
Ministry of Agriculture, Animal
Industry and Fisheries
+ 256 (0) 772 585 140

Sector Analysis Studies for Commercial Agriculture for Smallholders and Agribusiness Programme P a g e | 63
Name & Address Overview Current Activities in the Sector
Dr. Jimmy Lamo
Principal Research officer / Rice
Breeder
National Crops Resources Research
Institute, NARO
+ 256 (0) 772 342 757
The programme is
mandate to generate
and disseminate
technologies for
enhanced production
of rice. Materials are
generated for
improved yields,
tolerance to pests and
diseases, climate
change, etc.
Several rice breeding programs
with focus on breeding for
drought tolerance and other
stresses. The new genotypes
called the ‘New Rice for Africa’
(NERICA) were resistant to
major biological constraints but
showed differential sensitivity to
drought stress and new diseases,
and had a non-aromatic
characteristic which are the
major concerns of the Uganda
farmers. Thus, upland rice
farmers realize low yield mainly
due to frequent drought stress.
Dissemination of good
agricultural practices amongst
the trainers and farmers
Mr. Robert Anyang
Chief of Party (USAID)
FtF CPM Activity
+ 256 (0) 776 666 018
The activity focuses
on strengthening the
maize, bean and
coffee value chains.
The target
beneficiaries are the
farmers and
agribusiness including
traders, processors
and exporters
Robert was interviewed as a rice
expert
Jeremiah Nyambinya
Grainpulse Ltd, + 256 (0) 702 020
003
Fertilizer blending
company
Blend fertilizers specific to crops
such as bean blended fertilizer
Mr. M. Balikowa,
Nakisenhe Adult Literacy Group,
IgangaDistrict
+ 256 (0) 782 455 783
Membership
organization with
1,000 smallholder
farmers located in
Iganga district.
Deal in beans, rice
and maize production
and trade. Supply to
UNWFP among other
buyers
Owns a warehouse
o Advisory services on good
agricultural practices
o The group provides market
linkages to large buyers
including UNWFP

Sector Analysis Studies for Commercial Agriculture for Smallholders and Agribusiness Programme P a g e | 64
Name & Address Overview Current Activities in the Sector
Eng. Geowillis Mugoya, Busowa
Farmers and Traders Cooperative
Society, Bugiri District
+ 256 (0) 772579 513
Received support from
IDB for development
of an irrigation
schemer for rice
production (not yet
operational) and
stretches through
Bugiri and Iganga
districts.
Currently, farmers find their own
means of irrigating rice fields
because the irrigation system is
not constructed.
The association links members
to service providers for training
on good agricultural practices
and product quality
Mr. W. Ojiambo,
+ 256 (0) 772 539 046
Wakulima Growers’ Association,
Bugiri District
Membership
organization with
approximately 800
rice smallholder
farmers located in
Bugiri, Busia,
Namayingo and
Iganga districts
o Advisory services through
linkage to service providers
o Financial services: operates a
loan scheme amongst the
members and recovery is done
at the time of commodity sale.
The association is able to get a
lump sum loan from
Opportunity Bank, which it uses
to lend to individual farmers.
o Agro inputs on credit: the
association links with seed
companies and other dealers to
avail inputs on credit and
payment is done later in the
season
o The association has a small
fund, which is used for
purchasing un-milled rice from
farmers. This is transported to
Upland rice Millers in Jinja for
milling and sold eventually.
Lero Industries, Lira Municipality,
Lira District
Rice Miller As a mill, provides a milling
service at approximately UGX
100 / kg of milled
The mill also buys un-milled rice
from farmers;
The miller advances credit to
farmers during crop production
as a way of strengthening
farmer – miller / buyer
relationship
Milled rice is purchased by
traders who usually keep at the
mill

Sector Analysis Studies for Commercial Agriculture for Smallholders and Agribusiness Programme P a g e | 65
Name & Address Overview Current Activities in the Sector
Ms. Betty Acan, Lira ItekOkile
Cooperative Society, Barr Sub
County, Lira District
+ 256 (0) 784 268 465
ItekOkile Irrigation
Scheme with support
from GoU to set-up
an irrigation system
(not yet operational)
approximately 700
acres.
Management of irrigation
scheme; association allocates
land to members at a fee of UGX
40,000 / acre. Currently, farmers
find their own means of
irrigating rice fields because the
irrigation system is still under
construction.
The association operates a rice
mill with drying grounds,
moisture meter, threshers,
warehouse, etc.
Rice farmers have received
training on good agricultural
practices and product quality
Abor Amos, Abor and Sons
Enterprises
+ 256 (0) 775 818 628
Lira Municipality, Lira District
Rice Trader The enterprise buys rice from Lango
and Teso depending on the seasons
/ harvest periods. Whenever there is
no rice in Lango he goes to Teso to
ensure that he sells rice throughout
the year. He usually stocks 2 – 5 MT.
Yusuf Njalira
+ 256 (0) 772 676 671
Lwoba Holdings Ltd / Manafwa
Basin Rice Farmers’ Cooperative
Society Ltd,
Himutu Sub County, Butaleja
District
Irrigation Scheme
with support from
GoU/ UDET / JICA /
Netherlands
Government on
approximately 1,500
acres and over 3,000
smallholder farmers
Management of irrigation
scheme by Water Users’
Association; allocates land to
members at a fee of UGX
450,000 / acre / season.
UDET has supported with a
500MT capacity store and seed
funds for the society to buy rice
from the farmers within the
scheme and others
NARO uses the farm as a
research base for new varieties
The association operates a rice
mill with drying grounds,
moisture meter, threshers,
warehouse, etc.
Aceng Flora
+ 256 (0) 784 210 808
Lira Municipality, Lira District
Rice Trader During the peak of harvest season,
Flora usually acquires a loan and
stock up to 2mt but this reduces
drastically when the season is
almost done. Flora trades in rice
milled in Lira only and switches to
other commodities during off-
season.

Sector Analysis Studies for Commercial Agriculture for Smallholders and Agribusiness Programme P a g e | 66
Name & Address Overview Current Activities in the Sector
Owot Santa,
+ 256 (0) 779 749 489 RibeBer Rice
Millers, Layibi Division,
Gulu District
Rice Miller As a mill, provides a milling
service to farmers and traders.
Buy rice from farmers on credit,
provide milling service and sell
to traders to be able to recover
the milling service fee. The
farmers are then paid for milled
rice.
The mill buys un-milled rice
from farmers;
The miller provides training to
farmers in good agricultural
practices; provides packaging
material and transport for rice
to the mill as way of
strengthening farmer – miller /
buyer relationship.
Milled rice is purchased by
traders from Gulu and other
districts who usually keep at the
mill or are informed of
availability of rice at the mill
Ali Kidega,
+ 256 (0) 791 161 103 Pa AngaLacor
Rice Millers, Bardege Division,
Gulu District
Rice Miller As a mill, provides a milling
service to farmers and traders.
Buy rice from farmers on credit,
provide milling service and sell
to traders to be able to recover
the milling service fee. The
farmers are then paid for milled
rice.
The mill buys un-milled rice
from farmers;
The miller provides training to
farmers in good agricultural
practices; provides packaging
material and transport for rice
to the mill as way of
strengthening farmer – miller /
buyer relationship.
Milled rice is purchased by
traders from Gulu and other
districts who usually keep at the
mill or are informed of
availability of rice at the mill

Sector Analysis Studies for Commercial Agriculture for Smallholders and Agribusiness Programme P a g e | 67
Annex C: Stakeholders consulsted, sesame
Name Designation Organization Contacts
Mr. Collins Apuoyo Director, Market
Development
Palladium-NUTEC Tel: 0751820845; E-mail:
Mr. David Obiro Production
Supervisor
Upland Rice Millers Tel: 0776869644; Email: [email protected]
Mr Gelenga Ben
Moi
Operations
Manager
Upland Rice Millers Tel: 0782596208; Email: [email protected]
Amb. Phillip Idro Chairperson RMCU Tel: 0788052803; Email [email protected]
Mr. Richard Ibengo Manager Agroways Tel: 0782391354; [email protected]
Mr. Job Okello
Auma
CEO Eastern Rice Tel: 0772719570; [email protected]
Mr. Venugopal
Pookat
CEO & Director Tilda Tel: 0772255444
Mr. Jackson Lakor DAO Gulu District Tel: 0700404138; [email protected]
Mr. Charles Oboth Chair Gulu Agricultural
Development Company
Tel: 0782/0752 458615;
Ms. Joyce Trader Gulu Tel: 0772947718
Mr. Ocen O. Trader Gulu Tel: 0711975656
Ms. P. Cakamayo Trader Gulu Tel: 0779026091
Mr. Ngomkuru K. Chair KOFDA Tel: 0752318641
Mr. Opira J. Store keeper KOFDA Tel: 0785540767
Mr. Okeny A. Chair PJFA Tel: 0788734155
Mr. Okeny G. Store keeper PJFA Tel: 0788924770
Mr. Robert Opio Agricultural
Officer
Lira District Tel: 0772331800
Mr. Geoffrey Eriau Proprietor/Trader Lira Resort Tel: 0772/0701/0752-786497
Mr. Ambrose Oluge Extension Officer Shares Tel: 0782867949
Mr. Patrick Trader Lira Tel: 0779036867
Mr. Paul Lubega Head of DPs JICA Tel: 0774724120/0773253894; Email:
Mr. Peter Abong Coordinator, IDB
Rice Project
MAAIF Tel: 0772484071
Mr. Okaasai-Opolot Director MAAIF Tel: 0772589642
Dr. Simon
Byabagambi
Agronomist USAID Tel: 0706339317/0706339317

Sector Analysis Studies for Commercial Agriculture for Smallholders and Agribusiness Programme P a g e | 68
Annex D: Review Workshop participants and summary
NAME ORGANISATION TEL.NO E-MAIL
GRACE NANYONJO NARO/NACRRI 0771471984 [email protected]
BONIFACE MUGISA AGRESULTSKWR 0784769837 [email protected]
CHARLES NTALE CARDNO 0772426153 [email protected]
ROBERT OCAYA GIZ 0772308992 [email protected]
LUSEESA DAVID UGANDA GRAIN COUNCIL 0772601711 [email protected]
MARTIN FOWLER USAID 0712859402 [email protected]
JULIAN KIWUWA GIZ 0772220165 [email protected]
PETER ABONG MAAIF 0772484071 [email protected]
COLLINS APUOYO PALLADIUM GROUP (U)LTD O751820845 Collins.apuoyo@thepalladiu
mgroup.com
STEVE HOUCK CARDNO +447740637535 [email protected]
OJOK SAMSON NARO 0775062862 [email protected]
JOSEPH MUDIOPE KILIMO TRUST 0752878715 [email protected]
RADIO SAVE DFID 0771002181 [email protected]
VUZZI AZZA DANIDA 0772979709 [email protected]
DAVID SLANE IFDC 0757288385 [email protected]
MR. MUCUNGUZI
CLEOPAS
MAAIF 0772366581
Fieldwork and Stakeholder meeting insights – Beans
Fieldwork
There is an inadequate quantity of breeder and foundation seed for bean varieties that serve a wide
variety of consumer preference classes and the seed companies are reluctant to multiply and
distribute premium bean seed without clear market demand. Breeders have an awareness of varieties
that will serve a wide variety of consumer preference classes but the farmers are generally unaware.
There is a low awareness on the part of the farmers on the bean varieties available and therefore the
low demand for bean seed which is purchased on an opportunity basis often price driven. There is a
high availability of counterfeit bean seed on the market which is often branded as improved or
certified but is either home produced or old which leads to poor viability and yields. Governance in
the certification and validation of all agricultural inputs including seeds, fertiliser and protection
chemicals is weak. Evidence from several studies show that the local traders of agrochemical inputs
are unskilled or untrained and give advice based on sales potential rather than technical knowledge.
There is inadequate enforcement of the agro-input regulations to enhance trade in improved quality
and varietal selections.
Weak farmers’ organizations are not able to provide services to members for improved commodity
production and marketing. There is little evidence of the seed companies working with farmer groups
to establish demand and then plan the production of certified seed to meet that demand.

Sector Analysis Studies for Commercial Agriculture for Smallholders and Agribusiness Programme P a g e | 69
Private sector actors such as pre-cooked beans processors have a low ability to provide off-take for
farmers’ produce immediately after harvest. The lack of credit to buy the product and the adequate
storage mean that farmers will sell to the first trader rather than the better or preferred trader.
Stakeholder Meeting
A series of discussion points were posed to the meeting with the aim of identifying and validating the
CASA objectives in the Bean Value chain. Upstream discussions about farmer abilities, agro-inputs
and other agronomy based subjects were recorded as important limitations but were not included in
the main scope of the discussions.
• Develop market segmentation and differentiation using red and yellow beans as the lead
products received a positive feedback. Beans (white/red) are being exported to Dubai and other
middle east regions which confirm that premium quality van be produced.
• Take the market to the buyers in regional markets instead of the buyers coming upstream in the
VC was discussed but it was felt that this should be a three to five year agenda due to the poor
organisational status of the farmer groups. The discussion centred on establishing the market,
establishing farmer groups that would become specialist quality producers and then looking at
which actors emerged as the local and regional specialists. Afro Kai Limited, Aponye (U) Limited,
Tonga (U) Limited and KAM Supplies and Contractors were mentioned as entities that could be
incentivized to be early adopters.
• Increasing urbanisation and modern market requires a different product mix but the group were
divided on product selection. The feedback was that the precooked products must look and taste
like traditionally prepared beans to gain widespread acceptance. The advantages of less fuel and
cheaper cost of preparation for rural families was broadly agreed as theoretically correct but
many felt that as other products such as Maize and vegetables are cooked a long time and all day
it is unlikely that the lower cooking time would be a significant driver of change in rural areas.
• Does technology have a role to inform buyers of volumes, quality, availability? The discussion
group felt that farmers trust their own networks of information and attempts to inform them of
pricing through radio broadcasts or SMS messages were of minimal value.
• Immediate payment to buy essential goods and in some cases more seed to plant often overrides
the final price negotiated. If farmers are to be made aware of market prices and use this in
negotiations then the farmer must have the ability to refuse to sell. This requires storage, credit
and more reliable alternative markets that the farmer can trust.

Sector Analysis Studies for Commercial Agriculture for Smallholders and Agribusiness Programme P a g e | 70
Suitability of beans for an SME intervention program. SWOT analysis feedback from the group
STRENGTHS
Farmers are familiar with growing the
crop without new technologies
Strong and mature public crop research
program already in place
Identified “bean corridors” emerging as
focus of activity
WEAKNESS
Fragmented market with low
opportunities for farmers to easily enter
formal upstream markets
Weak institutional control of all parts of
the chain from inputs to quality of
products
Land availability particularly to woman
farmers to enter the bean value chain
OPPORTUNITIES
Growing market demand over a 3 – 5
year horizon as a minimum with
regional and international export
potential
Adaptation to new markets for pre-
cooked or branded better quality for
consumers
Opportunity for limited contract
farming of bean seeds and some sort
of certification of authenticity.
THREATS
Low promotion of better technologies,
varieties and a growing methodologies
due to low market demand from
farmers
Competing crops such as Maize and
Cassava where gross margins can be
higher
Endemic pests such as bean weevil can
wipe out crops and drive farmers out of
the value chain
Fieldwork and Stakeholder meeting insights - Rice
Fieldwork
Inadequate quantity of rice seed on the market was frequently cited by farmers and if rice seed is
available, this is low yielding and does not meet the preferences of some consumers. For example, if
the rice is non-aromatic. This has perception that local rice is poor quality has favoured increased
importation of rice.
From the agronomy perspective inadequate varieties that are drought, pest and disease tolerant have
been bred and released for production, multiplication and dissemination but there is a lack of
quantity of certified seed on the market. Agro chemicals including herbicides, insecticides and
fertilisers are not readily available and are often counterfeit. Low awareness about good agricultural
practices by farmers often leads to low yields and can lead then to buy cheaper but counterfeit inputs
that dissuade them from investing again.
Climate change has affected rice production. There have been prolonged dry spells and some
available rice varieties available cannot tolerate this phenomenon. Some farmers cited extensive crop
loss due to lack of rainfall. Irrigation schemes are still under construction in many areas or are
inadequate to support further expansion of crops. Therefore, watering rice fields is still a challenge for
many rural farmers.

Sector Analysis Studies for Commercial Agriculture for Smallholders and Agribusiness Programme P a g e | 71
Weak farmers’ organizations are not able to provide services to members such as credit and financial
guidance needs. Traders provide credit to farmers during production and the agreement is that for
UGX 80,000 a farmer should pay back 100kg of milled rice. This makes farmers harvest pre-mature
rice and are not able to follow the quality requirements to gain a premium product. With limited
bulking facilities within the farming community there are added pressures linking to the need to pay
off the trader loan. Trading in rice is not regulated and therefore farmers and traders deal in poor
quality rice often in informal markets and suboptimal agreements ensue.
Poor milling technology which further reduces the quality of milled rice leads to a lack of market
linkages for well milled rice. Most of the traders wish to buy un-milled rice and although buying un-
milled rice is a risk, due to the eventual quality of rice being unknown, the downgrading due to poor
postharvest handling is lessened. Traders factor in these risk associated costs into farmer purchase
price. Some traders give loans to farmers during rice production and agree to pay back in form of
rice. However, farmers cite that they are generally dissatisfied with the goods for loan repayment
option and opt to sell to traders who are paying cash for the un-milled rice. Traders suggested that,
as much as it is good to establish relationships with farmers especially aiding them to finance rice
production, it becomes difficult to recover the loans extended.
Large traders from “Kampala” usually would want to buy in large quantities but are not able to buy
stock for cash on collection due to limited finance. Thus, finance is a limiting factor in trade
enhancement even for the larger companies.
Transport costs tend to be quite high especially when picking rice from the areas far from the urban
centres. Lack of consolidation and uncertainty of supply prevents planning of larger collections and
economies of scale emerging.
Stakeholder Meeting
Rice as an import substitution (circa 65,000 MT opportunity) was discussed. The rice imports are
quality rice and is well marketed as a premium grade aromatic product. Much of the import from
Pakistan is recorded but it was reported at the meeting that there are large volumes of informally
imported rice from Tanzania that is medium quality and often unrecorded. So there is an opportunity
for farmers to access both the high quality and mid quality markets of import substitution.
Growing for quality was discussed at length and it was agreed that farmers could begin with growing
for volume as yields are currently less than 30% of what could be produced in Tanzania. Farmers
could be incentivised by growing bigger volumes and then would be more willing to try the
differentiated high quality varieties as they would not be so desperate to be paid.
Raw materials and inputs are key to production of quality products and the weakness of the
institutions in respect of verification is a severe limitation. Lack of capacity is more a problem than
lack of regulations.
Milling agents, particularly those operating single pass mills at village level are service providers. The
millers are not invested in the VC as they do not make a profit from trading only milling. The impact
of poor milling equipment is severe. How can the millers become value added actors and encouraged
to invest in better equipment and services is unclear.
What skills would be required to reduce the number of micro-aggregators and upskill the remaining
middlemen to add value as skilled intermediaries was discussed. The stakeholder group recognised
the need to reduce the number of actors in the chain that take value from inefficiencies but felt that
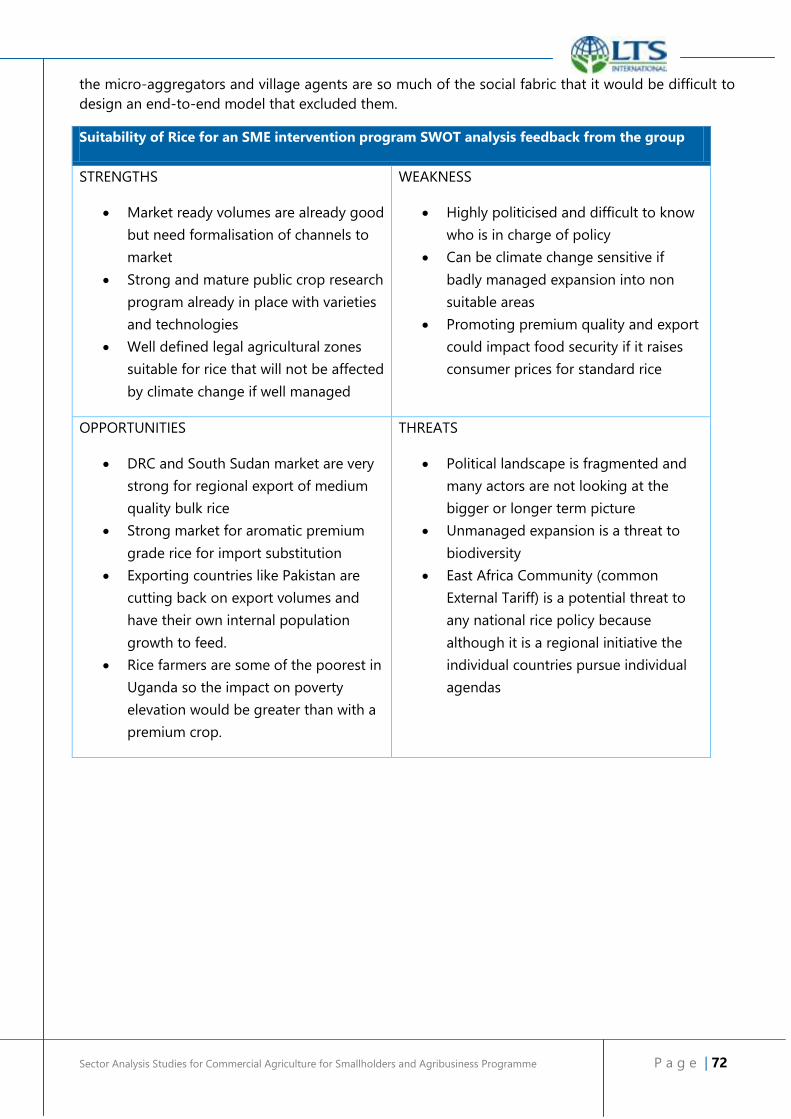
Sector Analysis Studies for Commercial Agriculture for Smallholders and Agribusiness Programme P a g e | 72
the micro-aggregators and village agents are so much of the social fabric that it would be difficult to
design an end-to-end model that excluded them.
Suitability of Rice for an SME intervention program SWOT analysis feedback from the group
STRENGTHS
Market ready volumes are already good
but need formalisation of channels to
market
Strong and mature public crop research
program already in place with varieties
and technologies
Well defined legal agricultural zones
suitable for rice that will not be affected
by climate change if well managed
WEAKNESS
Highly politicised and difficult to know
who is in charge of policy
Can be climate change sensitive if
badly managed expansion into non
suitable areas
Promoting premium quality and export
could impact food security if it raises
consumer prices for standard rice
OPPORTUNITIES
DRC and South Sudan market are very
strong for regional export of medium
quality bulk rice
Strong market for aromatic premium
grade rice for import substitution
Exporting countries like Pakistan are
cutting back on export volumes and
have their own internal population
growth to feed.
Rice farmers are some of the poorest in
Uganda so the impact on poverty
elevation would be greater than with a
premium crop.
THREATS
Political landscape is fragmented and
many actors are not looking at the
bigger or longer term picture
Unmanaged expansion is a threat to
biodiversity
East Africa Community (common
External Tariff) is a potential threat to
any national rice policy because
although it is a regional initiative the
individual countries pursue individual
agendas