section overview - nps.gov homepage (u.s. national park
TRANSCRIPT

National Park Service 6-1Zion Canyon Transportation System Technical Analysis
Section OverviewThis section of the report presents the analysis of the existing shuttle system and recommendations. The park’s highly successful shuttle program is in its tenth year of operation, and the system continues to operate very effectively. This analysis helped to identify the need for potential adjustments to service and operations in order to “fine tune” the system as the park prepares to release the next service contract in 2010.
Objective of AnalysisIn order to conduct an assessment of the shuttle operations, the team needed to first understand if there were any significant on-going issues with:
1. On-time performance
2. Peak period load and maximum loads
3. Stop-by-stop boarding activity and time of day loading
To gain an understanding of these aspects of the shuttle operation, the team conducted a full system ridecheck and timecheck in early August, 2008. This time period was chosen for data collection because it is within the typical peak visitation period at the park.
The ridecheck and timecheck, and in-the-field analysis of the shuttle system operations enabled the team to:
• Gain an understanding of the operation of the shuttle and associated transportation system both inside the park and within Springdale;
• Clearly understand activity levels at each shuttle stop, as well as loading patterns and maximum load points during peak periods; and
• Confirm as much as possible, the differing needs and usage patterns related to the transportation system of those who live in the immediate area versus those who visit the area.
Analysis ApproachPrior to the data collection efforts in the field, the team verified available and outstanding data and compiled documents from the NPS. The team then performed field work (including the ridecheck/timecheck activities) on both the park and town loops to collect the data needed to determine stop activity by route, time of day and stop, plus load factors by route and trip and on-time performance. The team conducted a manual 100 percent boarding and alighting count and timecheck assessment on each bus during a two-day period in the peak season (August 7 and 8, 2008). The data collection was split over the two-day period, covering the morning trips on both shuttle routes (5:00 am to 2:00 pm) surveyed on Friday, August 7 and the afternoon trips (2:00 pm to 10:30 pm) surveyed
Shuttle SyStem AnAlySiS And RecommendAtionS
Visitors boarding the park shuttle on a busy summer day
6

6-2 Shuttle System Analysis and Recommendations September 2009
on Saturday, August 8. The two days were combined to create one full day sample.
Temporary staff was assigned to ride each trip of both routes. Surveyors noted passenger boardings and alightings at every stop and compared scheduled departure times with actual times. There were no anomalies reported by operating staff on either day, nor did field supervisors observe anything that would call into question the validity of the data.
All of the boarding/alighting data and timecheck data was entered into spreadsheets. Time of day and maximum load graphs, as well as stop-by-stop boarding charts and boardings maps, were created for both routes.1
Tables 6-1 and 6-2 present the stop-by-stop shuttle boardings for the park and town shuttle routes. Figures 6-1 and 6-2 illustrate the park and town routes.1 The electronic files for all boarding/ridecheck/timecheck data have
been provided to the park’s contract operator.
Observations and Findings As a result of the ridecheck and field analysis, the following observations and findings are offered.
Park Route – The park route carried over 19,000 people and had a productivity rate of 114 passengers per hour for the entire route. This rate surpasses most light rail lines in the US and is comparable to some of the nation’s highest ridership bus lines like San Francisco Muni’s 38-Geary. Productivity on a passengers per hour basis ranged from 8 (7:15 am trip) to 230 (1:42 pm trip). The most significant boarding activity for the day begins around 7:30 am (39 passengers/hour) and carries through until 8:45 pm (27 passengers/trip). The peak of daily activity actually occurs between 12:30 pm and 6:30 pm.
On a stop-by-stop basis the busiest stops were the visitor center and the Temple of Sinawava (between 4,500 and 5,500 boardings per stop). The two stops
Table 6-1. Park Route Stop-by-Stop Boardings and Maximum Loads
Stop ID Stop Name Total Ons% Riders Boarding
Average Max Load
Inbound (up-canyon)
1 Visitor Center (Ons only) 5,468 28.2% 75
2 History Museum 629 3.2% 85
3 Canyon Junction 342 1.8% 86
4 Court of the Patriarchs 411 2.1% 85
5 Zion Lodge 1,183 6.1% 82
6 The Grotto 370 1.9% 81
7 Weeping Rock 784 4.1% 79
8 Big Bend 259 1.3% 76
9 and 10 Temple of Sinawava 4,692 24.2% 88
Outbound (down-canyon)
11 Big Bend 376 1.9% 93
12 Weeping Rock 1,151 5.9% 100
13 The Grotto 773 4.0% 103
14 Zion Lodge 2,343 12.1% 109
15 Court of the Patriarchs 184 1.0% 107
16 Canyon Junction 56 0.3% 106
17 History Museum 336 1.7% 101
18 Visitor Center (Offs only) 0 0.0% 37
Total 19,357

National Park Service 6-3Zion Canyon Transportation System Technical Analysis
with the least activity were Canyon Junction and the Court of the Patriarchs, although both of those stops still had 300 to 400 boardings each.
Running time wasn’t much of an issue. Even with the crush loads that typically hit the system in the peak of the afternoon, the drivers and supervisors were able to do a good job of maintaining round trip cycle times.
Town (Springdale) Route – This route carried almost 3,500 people and had a productivity rate of 72 passengers per hour. While this route had only two thirds of the productivity of the park route, its 72 passengers per hour rate is still almost 50 percent better than the typical transit route in dense urban areas like New York, Chicago and San Francisco.
Productivity on a passengers-per-hour basis ranged from a low of “0” (7:15 am trip) to 178 (5:10 pm trip). The busiest part of the day was between 2:15 pm and 7:30 pm.
On a stop-by-stop basis the busiest stops were the visitor center (1600+ boardings) and Zion Canyon Clothing (500+ boardings). The stop with the least amount of activity (less than 10 boardings) was the Silver Bear.
As with the park route, running time problems weren’t much of an issue on the town route. Drivers and supervisors did an excellent job of maintaining headways even during the crush load period towards the end of the afternoon.
For the specific data spreadsheet from the ridechecks, refer to Appendix B.
Table 6-2. Town (Springdale) Shuttle Stop-by-Stop Boardings and Maximum Loads
Stop ID Stop Name Total Ons% Riders Boarding
Average Max Load
Outbound (out of park)
1 Visitor Center 1,651 47.3% 46.5
2 Cliffrose/Café Soileil 28 0.8% 48.0
3 Flanigans 77 2.2% 33.5
4 Desert Pearl 19 0.5% 30.5
5 Pizza & Noodle 100 2.9% 25.0
6 Bit & Spur 11 0.3% 23.5
7 Driftwood 10 0.3% 19.5
8 Silver Bear 0 0.0% 19.5
9 and 10 Majestic View 145 4.2% 22.5
Inbound (to the park)
11 Silver Bear 1 0.0% 22.5
12 Driftwood 144 4.1% 26.0
13 Zion Park Inn 202 5.8% 28.0
14 Zions Bank 261 7.5% 29.5
15 Desert Pearl/Post Office 270 7.7% 37.0
16 Zion Canyon Clothing 542 15.5% 48.0
17 Cliffrose/Café Soieil 31 0.9% 50.5
18 Visitor Center 0 0.0% 4.5
Total 3,492

6-4 Shuttle System Analysis and Recommendations September 2009
9
Zion
Can
yon
Scen
ic Dr
ive
9
Big Bend
The Grotto
Zion Lodge
Weeping Rock
History Museum
Canyon Junction
Temple of Sinawava
Court of the Patriarchs
Visitor Center
South EntranceSouth Campground
Zion Nature Center
Zion HumanHistory Museum
GIS Data Source: ESRI, Utah State Geographic Information Database
0 0.5 1Miles
ZION NATIONAL PARK
ZION NATIONAL
PARK
Area of Detail
Washington County
Kan
e C
ount
y
Iron County
Zion National Park Boundary
Less than 250
251 - 1,000
1,001 - 2,500
2,501 - 5,468
(Data collected by Nelson\Nygaard, 2008)Daily Boarding Counts
Park Shuttle
Inbound (up-Canyon)
Outbound (down-Canyon)
Shuttle Route
Figure 6-1. Park Shuttle Boardings Map

National Park Service 6-5Zion Canyon Transportation System Technical Analysis
9
Zion
Par
k
LionParadise
Canyon Springs
Driftwood
Silver Bear
Zion Park Inn
Visitor Center
Zion CanyonCampground
Cliffrose / Café Soileil
Flanigans
Bit & Spur
Desert Pearl
Majestic View
Pizza & Noodle
Zions Bank
Desert Pearl /Post Office
9
9ZION NATIONAL PARK
Figure x Springdale Shuttle Boarding Counts
Zion National Park Boundary
GIS Data Source: ESRI, Utah State Geographic Information Database
0 0.25 0.5Miles
SPRINGDALE
Less than 50
51 - 100
101 - 500
501 - 1,651
Daily Boarding Counts
Town Shuttle
Inbound (to the park)
Outbound (out of park)
Park-and-Ride
Shuttle Route
(Data collected by Nelson\Nygaard, 2008)
Figure 6-2. Town (Springdale) Shuttle Boardings Map

6-6 Shuttle System Analysis and Recommendations September 2009
Recommendations
Day-to-Day Operations – This is one of the best run shuttle systems that the consultant team has ever observed. There is excellent coordination occurring between drivers, dispatchers and supervisors. The buses are well maintained (especially considering the age of the vehicles and the heavy loads). Everyone seems to have the attitude of “just get the job done…whatever it takes,” and that’s an important attribute in the public transit business. There are no recommendations at this time regarding the day-to-day management or oversight of the system.
Service Adjustments – Both routes appear to be well utilized (in terms of passengers/hour) throughout the entire day. If some service reduction was needed to free up resources for other uses, then the NPS could consider eliminating the first four morning trips on the park route (6:30 am to 7:15 am) plus the last four trips (9:00 pm to 10:30 pm). The impact on ridership would be minimal and perhaps, given the lack of alternative modes, there might even be no drop in ridership. This reduction in service on the park route would save about ten service hours per day. Reductions, if desired, could also be made by eliminating the last three trips on the town route. These cuts would also have little to no impact on ridership, but would save only 1.5 service hours.
If these service adjustments were to occur, it is anticipated that there would not be reductions in shuttle ridership. Since the policy of no driving in the park would be maintained during the summer season, it is likely that visitors would adjust to another departure time in the new shuttle schedule. Visitors would adjust their shuttle travel according to the schedule provided since there would be no alternative.
However, ridership throughout the year on early morning and late day trips can vary greatly so this service reduction recommendation would need to be more fully evaluated before being implemented.
Eliminating/Adding Bus Stops – Elimination of stops within the park is not recommended. In fact, the NPS might want to consider adding a stop near the South Campground. Many people staying at the campground must walk about 1/3 mile to reach the visitor center to board a shuttle bus. Adding a stop would probably have little to no impact on the round trip cycle times. However, this may at times add more passengers to already full vehicles departing the visitor center, so should be further evaluated.
Reconfigure the Stop at the Zion Lodge – The current bus stop layout (and signage) at the lodge creates confusion for riders and contributes to longer than expected dwell times during the peak periods. The current layout forces bus drivers to swing the coaches a bit wider than expected in order to get the front door on the cab close to the curb. This leads to the trailer sitting at an angle that blocks the view of the cab unit as passengers approach the bus from the rear. When there’s a crowd waiting for the bus, the passengers tend to move towards the visible unit (the trailer) as opposed to spreading themselves out between the two units. This leads to slower boarding times. It should be possible to reconfigure the bus bay layout and the adjacent signage in a manner that improves sightlines and makes it easier for people to see they can board two units instead of just one.
Better Signage at Stops – Given the nature of this system (very linear with a limited number of stops) it would be beneficial to everyone if it were signed and marketed more like a rail Shuttle stop signs should display the stop name
and number.

National Park Service 6-7Zion Canyon Transportation System Technical Analysis
line. Each opposing pair of stops should have a distinctive name and number (e.g., Downtown Stop 5 on the stops near Zions Bank). The name and number should be clearly marked on the sign, and the signs should be very visible. In addition, each stop should have a map that clearly displays both shuttle routes AND the path that someone would take to transfer between the two routes.
Convert Flag Stops – The NPS should consider eliminating the use of flag stops and converting these to regular stops. All of the current flag stops had enough boarding activity to justify conversion to a regular stop (with the exception of Silver Bear). Each of these conversions should receive the signage noted above. A general policy to allow informal passenger pick ups could still be maintained. Shuttle drivers could continue to make spontaneous stops at their discretion, especially during times when the shuttle is not busy or full.
Relocate Downtown Stops – Ideally, bus stops in opposing directions of travel should be across the street from each other. Sometimes this isn’t possible, but as a practice this idea should be followed as often as possible. The NPS should consider moving the current Zions Bank stop a little closer to the park, perhaps across the street from Zion Pizza & Noodle next to the Zion Park Motel. Refer to Section 4 for more discussion on this.
Shuttle Vehicle Rehabilitation/Replacement Recommendations – The shuttle fleet is in its tenth year of operation. The vehicles have been well maintained and are in excellent condition. However, with ongoing operation and pressures on the system for increased service, the fleet will need to be replaced. Some of the considerations and questions that need to be addressed in considering various vehicle options include the following:
• Should the system continue to use propane engines even though propane is being phased out? Have there been any complaints about the propane exhaust levels? What about alternatives like electric or hybrid powered vehicles?
• How likely is it that medium duty buses can be rebuilt cost effectively, and provide another 7-10 years of service?
• What are the funding/financial possibilities related to fleet replacement?
• What about low-floor buses and trailers? Only the lead bus has a lift. Trailers are not ADA accessible. This impacts not just wheelchairs, but also the people with mobility impairments, older people, people with gear (hikers and climbers), and parents with strollers and young children. Would going to low-floor buses require the park
The Zion Canyon shuttle fleet has been well maintained and is in excellent condition.

6-8 Shuttle System Analysis and Recommendations September 2009
to install raised islands/loading platforms at some/all bus stops? (It appears so, but this needs to be evaluated more closely.)
• If existing vehicles are rehabilitated, could the ceilings of the vehicles be retrofitted with linear windows for views upward in the canyon?
• Should the vehicles be equipped with an air conditioning system?
• Analysis of fleet replacement options should consider:
- the scale of the vehicles in the park and context sensitive design (as is now accomplished by the color of the vehicles and the decorative decals affixed to the sides of shuttles and trailers),
- fuel/propulsion options,
- capacities,
- and other amenities for visitors such as bicycle racks, air conditioning, scenic viewing opportunities, etc.
Zion Vehicle Replacement Assumptions – The shuttle fleet consists of:
• 30 – Model Year 2000 to 2002, 31-pax medium duty El Dorado Transmark Buses (propane)
• 21 – Model Year 2000 to 2002, 37-pax medium duty El Dorado Transmark Trailers
The medium duty buses and trailers have a life expectancy of 10 years. The average age of the fleet is eight years, and even though everything has been well maintained, it is unreasonable to expect that the buses will last more than another two to three years before they start experiencing some type of group wide critical failure. This is important because the buses are all the same age, and the NPS runs the risk of losing a large number of vehicles at once should a critical system failure occur (e.g., wiring harnesses, transmissions, etc.).
So this Raises an Important Question: Should the NPS try to immediately replace buses with an all new fleet or should it begin a fleet-wide rebuilding program, which could extend the life expectancy by another six to seven years?
The purchase price for each power unit in 2000/2001 was $200,000. The cost for each trailer was $132,000. Assuming an annual inflation cost for each unit of three percent, the cost to replace the fleet in 2009 with similar Transmark units would be $290,000 per power unit and $175,000 per trailer. The actual cost is likely to be five percent higher if propane engines are used to power the new buses, simply because it is almost impossible to find an engine manufacturer that is willing to build propane engines for medium size buses. Detroit Diesel, Caterpillar and Cummins have all indicated that they will most likely exit this market sometime next year. There might still be a few manufacturers building propane engines, but it’s unclear at this time whether they will be suitable for a medium duty bus. For example, Blue Bird Corporation unveiled a new full size school bus powered by a GM 8.1 Liter propane powered engine.2
Rebuild or Replace? There are advantages and disadvantages to both of these tracks. There are several scenarios under “Replace and Rebuild” that should be further analyzed and considered.
Option A - Rebuild/rehab the existing fleet using propane engines (either rebuilt engines or new engines).2 http://www.cleanfuelusa.com/index.php?/cleanfuel/vehicle/blue_
bird_propane_powered_visionPeople boarding the shuttle in Springdale

National Park Service 6-9Zion Canyon Transportation System Technical Analysis
Option B - Rebuild/rehab the existing fleet using some other type of engine.
Option C - Replace existing/purchase new vehicles using propane engines.
Option D - Replace existing/purchase new vehicles using some other type of engine.
Each of these options are described in more detail below.
Option A - Rebuild/Rehab the Existing Fleet Using Propane Engines – this scenario is likely to be the least expensive (at least in the near term) and easiest to implement. The existing fleet has been maintained in good condition. Given the operating terrain and low average mileage/bus, this fleet as a whole is an excellent candidate for a rebuild/rehab program.
At a minimum, each bus will likely need a $150,000 rebuild that would include:
• New suspension
• New transmission
• Upgrade electrical
• New seats
• New floors
• New paint and decals
• New engine ($20,000 for new medium duty engine)
If the contractor decided to rebuild the existing propane engines (it has already rebuilt three of them), then the engine cost can probably be reduced to $7,500, reducing the power unit total rebuild cost from $150,000 to $137,500.
At a minimum, each trailer will likely need a $75,000 rebuild, which would include:
• New suspension
• New seats
• New floors
• New paint and decals
• Upgraded electrical
If we assume that the NPS buys new propane engines for each rebuilt bus, then the total estimated cost to rebuild all 30 power units in 2008
dollars would be 30 x $150,000 = $4.5 million. If the contractor rebuilds the existing engines then the cost drops to 30 x $137,500 = $4.1 million.
The cost to rebuild the trailers would be 21 x $75,000 = $1.58 million (in 2008 dollars).
The total fleet rebuild program using new engines would cost $6 million.
Before a fleet-wide rebuild program is initiated, it is recommended that one power unit and trailer be sent to a rebuild facility like Complete Coachworks (www.completecoach.com) to determine if a fleet-wide rebuild program is really feasible. If it is, then the NPS should proceed with a program that rebuilds the entire fleet over a period of three years. Ten buses and seven trailers can be sent to the rebuild facility each year during the offseason until the entire fleet is upgraded in three years.
Option B - Rebuild Existing Fleet With Some Other Type of Engine – If new propane engines are not available in the near future, the NPS may have no option but to rebuild the existing engines. Or…it could elect to “repower” the buses using standard diesel powered medium duty engines in place of the propane engines. Diesel fuel, though not cheap, is certainly plentiful and unlike propane engines, there will be no shortage of medium duty diesel engines on the market for the next decade. The emissions from current generation diesel engines are almost as low as what we would
Zion National Park shuttle carrying kayaks

6-10 Shuttle System Analysis and Recommendations September 2009
expect from propane and compressed natural gas (CNG) engines. In addition, the noise profile from a new diesel engine is about the same or in some cases quieter than current generation propane and CNG engines. New diesel engines would likely cost about ten percent less than a comparable propane engine.
For programming purposes this analysis assumes $150,000/bus and $75,000/trailer for a full rehab including new propane engines. The analysis also assumed that the entire fleet would be rehabilitated within two to three years.
Option C - Replace Existing/Purchase New Vehicles with Propane Engines – or –
Option D - Replace Existing/Purchase New Vehicles Using Some Other Type of Engine – If, for whatever reason, the NPS decides to replace the existing buses and trailers with new buses, then it would need to work through a much more detailed and complicated decision process that answers the following questions.
• What type of fuel should be used to power the vehicles? Propane, diesel, natural gas or gasoline? Should foregoing internal combustion engines be considered, and instead purchasing a fleet of battery powered buses be pursued? What about delaying the decision five to seven years until fuel cells
become at least a remote possibility?
• Should the NPS/park buy more medium duty 30-foot buses with trailer or standard 60-foot articulated buses? What about using 40-foot double-decker buses? What about going to smaller 20- to 25-foot buses and simply increasing the service frequency to every two minutes all day?3
• What kinds of amenities should be included on the next generation of vehicles? Air conditioning? High-back seats? Video screens?
No matter what it decides, if the NPS chooses to follow a path of vehicle replacement instead of rebuilding, it can almost certainly expect to spend significantly more money than it would on a rebuild program. For example, if the NPS contracts with El Dorado to build a second generation of Transmark buses and trailers equipped with propane engines (if they are available), the NPS/park can expect to spend at least $8.7 million for buses (30 x $290,000) and $3.68 million for trailers (21 x $175,000) for a total fleet replacement cost of (in 2008 dollars) $12.38 million. This is slightly more than double the cost of the rebuild program. A 60-foot articulated bus would have less capacity than one of the current bus/trailer combined units, and it would cost at least $600,000/bus. That is about 30 percent more than the cost to replace the current bus/trailer combined units. A double decker bus would provide about the same capacity as one of the current bus/trailer combined units, but the cost per bus is almost $900,000.
Replacement Options The current shuttle fleet consists of propane-fueled El Dorado Transmark buses and trailers. A bus-trailer unit operating inside the park can carry over 120 passengers, which during some peak periods is just barely enough to keep up with the loads on three to six minute headways.
3 The existing system has a tremendous amount of capacity that has to be replaced. The park shuttle route uses buses with trailers. The capacity per combined “unit” is 68 seated and just over 100 if you include standees. The town shuttle route uses only buses, and thus the capacity per unit is 31 seated and 51 with standees.
The current shuttle fleet consists of El Dorado Transmark buses and trailers.
National Park Service 6-11Zion Canyon Transportation System Technical Analysis
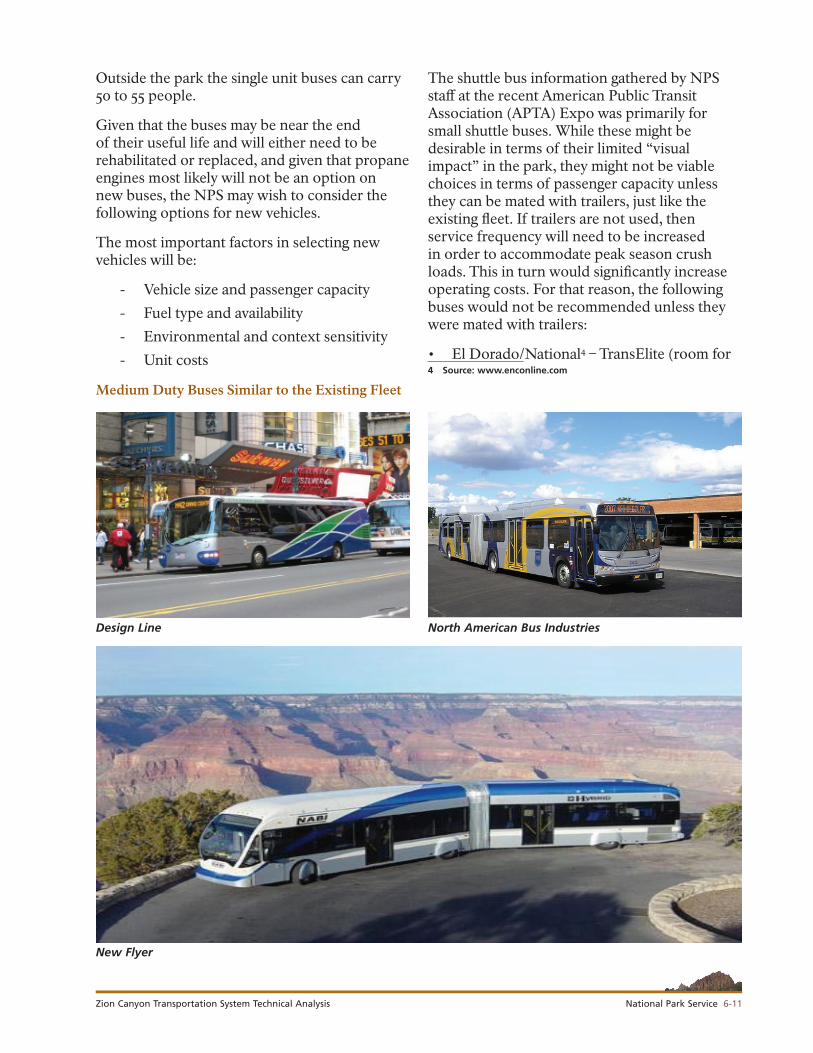
Outside the park the single unit buses can carry 50 to 55 people.
Given that the buses may be near the end of their useful life and will either need to be rehabilitated or replaced, and given that propane engines most likely will not be an option on new buses, the NPS may wish to consider the following options for new vehicles.
The most important factors in selecting new vehicles will be:
- Vehicle size and passenger capacity
- Fuel type and availability
- Environmental and context sensitivity
- Unit costs
Medium Duty Buses Similar to the Existing Fleet
The shuttle bus information gathered by NPS staff at the recent American Public Transit Association (APTA) Expo was primarily for small shuttle buses. While these might be desirable in terms of their limited “visual impact” in the park, they might not be viable choices in terms of passenger capacity unless they can be mated with trailers, just like the existing fleet. If trailers are not used, then service frequency will need to be increased in order to accommodate peak season crush loads. This in turn would significantly increase operating costs. For that reason, the following buses would not be recommended unless they were mated with trailers:
• El Dorado/National4 – TransElite (room for 4 Source: www.enconline.com
Design Line North American Bus Industries
New Flyer

6-12 Shuttle System Analysis and Recommendations September 2009
55 seated/standing combined)
• El Dorado/National - EZ Rider (room for 40 seated/standing combined)
• El Dorado//National - Passport (room for 35 seated/standing combined)
On the other hand, if it would be possible to purchase new buses with propane engines, vehicle selection would almost certainly be limited to light and medium duty buses. There are no viable options for propane engines in the heavy duty bus market.
Transteq Ecomark
The approximate cost for each vehicle ranges from $190,000 to $300,000. Trailers will cost up to $175,000 per unit.
Larger Buses• Eco-Saver IV Hybrid Electric – Design Line5
These diesel-electric hybrid vehicles utilize a state-of-the-art micro-turbine system. They come in 35-foot and 42-foot lengths. The 42-foot bus can hold up to 60 passengers. However, these buses are not designed to pull trailers, and thus service frequency would have to be increased to accommodate peak loads (i.e., Zion National Park would need a larger fleet). The cost for these buses is expected to run in the $650,000 to $750,000 range per unit.
• 60-foot Hybrid Articulated Bus – NABI & New Flyer6
Transit fleets throughout the country with high ridership routes are investing in 60-foot articulated hybrid buses, which produce 90 percent fewer emissions than current 60-foot diesel buses, and which have the ability to carry more than 100 passengers. These low-floor buses are easily accessible for passengers with disabilities, have multiple doors for boarding and alighting, and are becoming increasingly popular as a way to address heavy passenger loads. The cost for a diesel-electric 60-foot hybrid electric ranges from $850,000 to $1,000,000.
• 45-foot CNG/Electric – Transteq Ecomark7
In, 1999 Transteq and Denver RTD developed a new type of bus to operate on the high frequency and high ridership downtown Denver Pedestrian Corridor. This bus is 45-foot long, with multiple doors and no seats. Each bus is capable of accommodating up to 120 passengers. The buses are powered by CNG generators, which provide power electric motors at each wheel. The buses cost $500,000 each when they went into service in 2000. Current cost estimates could not be obtained.
• Wide Buses – COBUS 30008
5 Source: www.designlineinternational.com6 Sources: www.nabiusa.com and www.newflyer.com7 Source: www.transteq.com8 Source: www.cobus.com

National Park Service 6-13Zion Canyon Transportation System Technical Analysis
The COBUS 3000 is a 45-foot bus that can carry over 100 people as a result of the wide body and limited seating. The buses can be powered with diesel or CNG engines. The bus is 118 inches wide, roughly 24 inches more than a standard 40-foot heavy-duty transit bus. It is marketed primarily towards airport and ski resorts where fitting within the geometry of an existing roadway is not so much of an issue. The bus can safely operate within a 12-foot lane, but it’s unclear at this time if the width can be accommodated during turning movements at the Lodge, The Temple of Sinawava and the visitor center. Cost information could not be obtained, but it is believed that the current unit cost is in the range of $650,000 to $750,000.
Summary/Recommendation: Clearly there are some alternative buses that could work in the park and town operating environment that might lend themselves to maintaining and supporting a positive image to passengers and non-riders. However, given the respective unit cost for each type of vehicle, and the park’s desire to retain propane fuel engines for the foreseeable future, the best course of action likely would be to rehabilitate the existing buses and trailers and rebuild the existing propane engines. A new, larger bus, with the capacity to replace a bus/trailer unit in the park, would cost at least $650,000 per unit. Replacing the fleet with new medium duty buses mated to trailers would cost $475,000. The cost to rehabilitate each of the existing bus/trailer units should not exceed $225,000 per mated pair. The entire fleet could likely be rebuilt within two to three years during the off-season periods.
It should be noted that many of the newer buses and shuttle vehicles available on the market are larger sized vehicles with modern designs that do not necessarily fit the park context. The bus and shuttle vehicle market is more geared toward the demand in urban areas/settings, and the vehicle sizes and designs available are more suited to that context. The current shuttle vehicles and trailer buses were custom built and are of a size, scale, and character that fit well to the park’s setting. It would be challenging to find new vehicles that fit the park context as well as the custom built vehicles currently operating
at Zion National Park. Town of Springdale representatives have expressed a strong interest in maintaining the current size and “look and feel” of the shuttle vehicles, which are more compatible with the village setting of Springdale than larger urban style buses would be.
The park should also consider purchasing any new propane engines it can find that match the make and model of the existing engines so that it can have a stockpile in case of short term emergencies following the completion of the engine rebuild program.
Please note: Since the initial completion of this technical analysis, the NPS has proceeded with a more detailed vehicle procurement study. The vehicle procurement study recommendations and related value analysis report are available as separate documents from the NPS.
Expanding Bicycle Capacity on Shuttles If shuttle vehicles could carry more bicycles, this might encourage more bicycle transportation between stops in the canyon and in Springdale. The provision of more bicycle parking facilities in the town and park (including some located at shuttle stops) may also encourage more
Bicycles parked near park interpretive display

6-14 Shuttle System Analysis and Recommendations September 2009
bicycling. This in turn may help to alleviate some congestion on the shuttle during peak periods. It may also help to reduce general traffic congestion on the road, as well as congestion in parking areas and at the park entrance gate. There are a variety of equipment options for expanding bicycle capacity, which can either be retrofitted to existing vehicles, or ordered as part of the package with new vehicles. A detailed technical memorandum of bicycle carrying options for the shuttle system, is included as Appendix C to this report.
During the peak season there is often not enough bicycle capacity on the shuttle buses. This may discourage some people from using their bicycles. The following options for expanding bicycle carrying capacity should be further reviewed and considered.
• Option 1 - Switch the two slot front mounted bike racks on all buses to three slot racks. This increases capacity by 50 percent at a cost of $1,500 per bus (not an option for trailers). Total cost is $45,000.
• Option 2 - Instead of, or in addition to Option 1, implement a Bus/Bike Shuttle Program. Three buses, pulling 20 slot bicycle trailers instead of passenger trailers, could be used to provide “bike service” every 30 minutes. The total cost for three trailers would be between $10,000 and $20,000. The net change in operating costs might be negligible if the bus/bike shuttles can be incorporated in the existing schedule and thus replace three bus/passenger trailer
combinations. Additional capacity analysis is needed.
It should be noted that the park could take an incremental approach to adding bike capacity – starting with Option 1 above, and then shifting to Option 2 in the future, which could coincide with any development of multi-use paths (Pa’rus Trail extension) that may occur in the canyon. With implementation of Option 2, a bike trailer would replace the passenger trailer on three vehicles as suggested. This would require some shifting of scheduling and service planning to ensure that adequate service would still be available for passengers in the canyon.
To encourage a higher level of bicycling for transportation and recreation, the town and park could also consider partnering with local bicycle rental businesses to provide a free or moderate-fee bicycling program, with a few bicycles made available throughout town for visitor use. This would be similar to the community bicycle and Smart Bike programs implemented in Fort Collins, Colorado; Portland, Oregon; and various other cities. This must be done with consideration of maintaining the current business/economic opportunities related to bicycle rentals for the private sector.