section ii: man made fibres -...
TRANSCRIPT
SECTION II: MAN MADE FIBRES

110
TABLE OF CONTENTS
SUMMARY – MAN MADE FIBRES ..................................................................................................... 112
2.1. INDIAN SCENARIO ...................................................................................................................... 120
IMPORTANT MMF PLAYER IN THE WORLD .............................................................................. 120
CHANGING FIBRE COMPOSITION ............................................................................................. 120
POLYESTER ACCOUNTS FOR LARGEST SHARE IN MMF ...................................................... 122
EXCESS CAPACITIES .................................................................................................................. 122
LIMITED NUMBER OF PLAYERS ................................................................................................. 123
RAW MATERIALS AVAILABILITY ................................................................................................. 123
PRICE MOVEMENT OF MMF ....................................................................................................... 125
EXPORTS OF MAN-MADE FIBRES RISE SUBSTANTIALLY IN POST QUOTA PERIOD BUT
SLOW DOWN IN FY09 .................................................................................................................. 125
POLYESTER STAPLE FIBRE ....................................................................................................... 127
VISCOSE STAPLE FIBRE ............................................................................................................. 127
ACRYLIC STAPLE FIBRE ............................................................................................................. 128
POLYPROPYLENE STAPLE FIBRE ............................................................................................. 129
POLYESTER FILAMENT YARN .................................................................................................... 129
VISCOSE FILAMENT YARN ......................................................................................................... 130
NYLON FILAMENT YARN ............................................................................................................. 131
POLYPROPYLENE FILAMENT YARN .......................................................................................... 131
DYNAMICS OF VALUE ADDED MMF TEXTILES ........................................................................ 132
FUTURE DEMAND FOR MMF ...................................................................................................... 133
2.2. GLOBAL SCENARIO ................................................................................................................... 136
COMPOSITION OF MAN-MADE FIBRES ..................................................................................... 137
REGIONAL COMPOSITION .......................................................................................................... 138
2.3. ISSUES AND CONCERNS ........................................................................................................... 141
EXCISE DUTY ANOMALIES ......................................................................................................... 141
CUSTOMS DUTY ANOMALIES .................................................................................................... 142
DELAY IN GETTING DRAWBACK /EXCISE REBATE CLAIMS ................................................... 143
111
CONCERNS ABOUT ANTI DUMPING DUTIES............................................................................ 144
LOWER EXPORT BENEFITS FOR STANDALONE GARMENT MANUFACTURERS ................ 144
CONCERNS ABOUT GST ............................................................................................................. 145
NIL INDIGENOUS PRODUCTION OF SPECIALISED MMF ........................................................ 145
LIMITED NUMBER OF MMF PLAYERS ....................................................................................... 145
LACK OF COMPETITIVENESS IN EXPORTS ............................................................................. 147
EXPORTS DISADVANTAGE AGAINST COTTON TEXTILES ..................................................... 148
HIGHER EXPORT PRICES OF INDIAN EXPORTERS ................................................................ 150
LACK OF INCENTIVES FOR EXPANSION .................................................................................. 151
RAW MATERIAL AVAILABILITY ................................................................................................... 152
COST RELATED ISSUES ............................................................................................................. 153
HIGH TRANSACTION COSTS ...................................................................................................... 154
SUMMARY ..................................................................................................................................... 156
2.4. RECOMMENDATIONS ................................................................................................................. 157
FISCAL MEASURES ..................................................................................................................... 157
NON-FISCAL MEASURES ............................................................................................................ 161
2.A. ANNEXURE .................................................................................................................................. 164
TEXTILE OVERVIEW AND POLICIES IN MAJOR COUNTRIES ................................................. 164
DEMAND PROJECTIONS ............................................................................................................. 172
DEMAND PROJECTIONS FOR MAN-MADE FIBRES ................................................................. 174
FUTURE DEMAND PROJECTIONS VIS-À-VIS EXISTING CAPACITIES ................................... 177
ALTERNATIVE SCENARIOS ........................................................................................................ 178
INVESTMENT REQUIREMENT .................................................................................................... 179
STATISTICAL APPENDICES ........................................................................................................ 181
CONSTITUTION OF SUB-GROUP ON MAN-MADE FIBRES ...................................................... 194
112
SUMMARY – MAN MADE FIBRES
I. Ministry of Textiles, Government of India constituted a working group to formulate a Comprehensive
Fibre Policy for Textiles and Garments sector of India with a view to render Indian textiles and
garments sector competitive in the global market in the near, medium as well as long-term. One of the
sub-groups formulated under the working group was on synthetic fibres. The scope of the sub-group
was extended to “man-made fibres” as synthetic fibres would exclude cellulosic fibres like viscose.
Further, “Man-made fibre” was understood to include “filament yarn” along with staple fibres.
Speciality fibres for technical textiles have been excluded from consideration as a separate sub-group
is looking into the same.
II. The key objectives of the study done for the sub-group on Man-made fibres were:
i. To assess the reasons for consumption pattern of man-made fibres (MMF) in India being
different than the world trend
ii. To study the reasons for low consumption of MMF in domestic and export market
iii. To assess the demand-supply and projections for MMF for year 2015 and 2020
iv. Formulating policy interventions and recommendations
INTRODUCTION
III. India is the second largest producer of man-made fibres in the world (World Fibre Report 2008) with
presence of large plants having state-of-the art technology. MMF textiles constitute almost two-third of
the domestic textile market. However, India’s share in global exports of value-added textiles of man-
made fibres is miniscule at around 2.25% in 2008 (India’s MMF exports were US$ 3.3 billion as
against global exports of US$ 146.7 billion). Further, while textiles made of man-made fibres
constitute around 63% of the world trade, it is mere 16.4% (FY09) in case of India as Indian textiles
exports are predominantly cotton based.
IV. The domestic fibre consumption ratio in India at present is 41:59 (FY09) between man-made fibres
and cotton, while it is almost 60:40 globally. The global fibre consumption trend in future is likely to
further tilt in favour of man-made fibres as there is a limitation to growth of cotton on account of limited
availability of land for cotton cultivation. Moreover, the land available for cotton is gradually declining
on account of rise in cultivation of food crops. Given the future demand is expected to be largely in
favour of man-made fibre based textiles, special attention is required to boost the consumption and
production of man-made fibres in India.
113
V. Further, Indian textile industry is an export intensive industry, with almost one-third of domestic
production being exported. Thus, in order to maintain high growth of exports in future, India’s textiles
exports portfolio needs to have a balanced fibre mix in line with the global consumption pattern.
PRESENT SCENARIO
VI. India’s capacities for man-made fibres currently stand at 3.4 billion kg, which is around 6.6% of global
MMF capacities. India’s total production of man-made fibres stood at 2.5 billion kg in FY09, of which
exports constituted 10.3% at 0.25 billion kg. Domestic consumption for man-made fibres during FY09
stood at 2.4 billion kg, of which imports constituted roughly 5% at 0.12 billion kg. Indian man-made
fibre industry is largely polyester dominated, which constitutes over 83% of total man-made fibre
production. Further, production of man-made fibres in India is characterised by limited number of
players having a dominant share in the production of most of the man-made fibres and filament yarns.
VII. Although Indian players manufacture most of the man-made fibres (PSF, VSF, ASF, PPSF, PFY,
VFY, NFY, PPFY), the specialised man-made fibres like acetate fibre/ filament yarn, tri-acetate fibre/
filament yarn, cuprammonium filament yarn, nylon 66, nylon 11, spandex, PVA fibre and filament yarn,
PBT yarn, modacrylic staple fibres and PTET are not being manufactured in India.
VIII. While man-made fibre production is highly concentrated, with limited players engaged in
manufacturing of MMF, the value added MMF textiles are primarily being manufactured in the
decentralised sector, with presence of large number of small and medium enterprises. Production of
MMF fabrics has grown from 21 billion square meters in FY05 to 23.9 billion square meters in FY09.
While in the domestic market, MMF textiles and garments are dominant, cotton textiles are
predominant in the export markets; MMF garments are predominant to the extent of 65% (estimated)
in the domestic market, while in the export market cotton garments are predominant with over 80%
share.
FUTURE PROJECTIONS
IX. A top down approach has been followed to determine the future demand for man-made fibres in FY15
and FY20. Considering future GDP growth of 8%, the domestic demand for man-made fibres/ filament
yarns is estimated at 3.9 billion kg in FY15 and about 6 billion kg in FY20. Adjusting to this the likely
exports and imports of MMF, the overall MMF requirement is estimated at 4.2 billion kg for FY15 and
6.48 billion kg for FY20. This implies capacity additions of about 1.8 billion kg (FY15) and 4.6 billion kg
(FY20), which would require an investment of over Rs 90 billion (approximately US$ 2 billion) by FY15
and Rs 230 billion (approximately US$ 5.1 billion) by FY20.
114
ISSUES AND CONCERNS
A. Exclusively affecting MMF and MMF textiles
X. Excise duty discrimination: A major concern area has been the historical discrimination of man-
made fibres and textiles against cotton and cotton textiles in the form of higher excise duties. Although
there has been substantial reduction in excise duties on man-made fibres and textiles during the last
10 years, the current duties on MMF and MMF textiles are still high; while cotton is exempt from
excise duty, MMF attracts excise duty of 8%. Further, while MMF textiles attract a mandatory
CENVAT of 8%, cotton textiles have an optional CENVAT of 4%. Any reduction in excise duties on
MMF and MMF textiles will have a highly positive impact on the growth of MMF consumption.
XI. Lack of global competitiveness: Indian man-made fibres textile industry has not been able to create
a mark in the global textiles market post dismantling of textile quotas even though cotton textiles
industry has witnessed a substantial growth. Since dismantling of quotas (2005 onwards), Indian
cotton apparel exports to the world have grown at about 10.7% CAGR, while MMF apparel exports
have witnessed a decline.
XII. Limited number of players: There are only a few big players manufacturing man-made fibres in
India. The industry follows a pricing policy on import parity basis at landed cost. User industry has
submitted that MMF producers export man-made fibres at lower prices than in the domestic market.
This submission is supported by SRTEPC exports data analysed by FIASWI in respect of polyester
fibre and yarn.
115
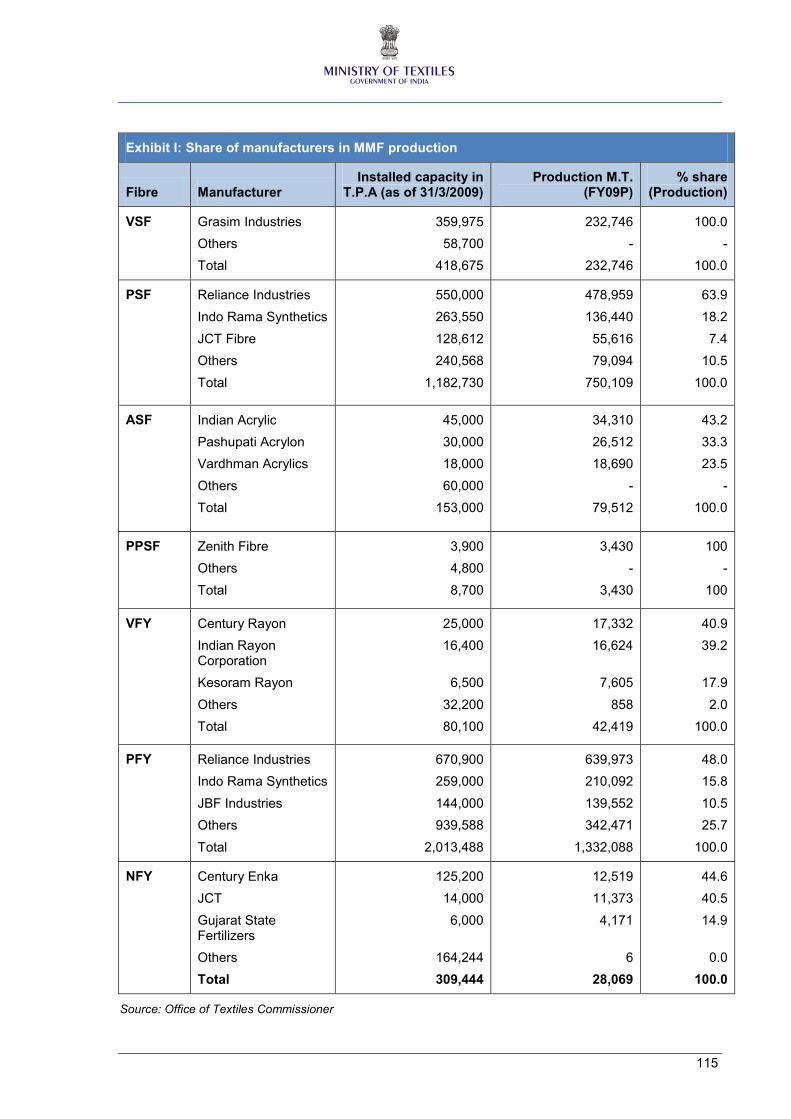
Exhibit I: Share of manufacturers in MMF production
Fibre Manufacturer Installed capacity in
T.P.A (as of 31/3/2009) Production M.T.
(FY09P) % share
(Production)
VSF
Grasim Industries
Others
Total
359,975
58,700
418,675
232,746
-
232,746
100.0
-
100.0
PSF
Reliance Industries
Indo Rama Synthetics
JCT Fibre
Others
Total
550,000
263,550
128,612
240,568
1,182,730
478,959
136,440
55,616
79,094
750,109
63.9
18.2
7.4
10.5
100.0
ASF
Indian Acrylic
Pashupati Acrylon
Vardhman Acrylics
Others
Total
45,000
30,000
18,000
60,000
153,000
34,310
26,512
18,690
-
79,512
43.2
33.3
23.5
-
100.0
PPSF
Zenith Fibre
Others
Total
3,900
4,800
8,700
3,430
-
3,430
100
-
100
VFY
Century Rayon
Indian Rayon Corporation
Kesoram Rayon
Others
Total
25,000
16,400
6,500
32,200
80,100
17,332
16,624
7,605
858
42,419
40.9
39.2
17.9
2.0
100.0
PFY
Reliance Industries
Indo Rama Synthetics
JBF Industries
Others
Total
670,900
259,000
144,000
939,588
2,013,488
639,973
210,092
139,552
342,471
1,332,088
48.0
15.8
10.5
25.7
100.0
NFY
Century Enka
JCT
Gujarat State Fertilizers
Others
Total
125,200
14,000
6,000
164,244
309,444
12,519
11,373
4,171
6
28,069
44.6
40.5
14.9
0.0
100.0
Source: Office of Textiles Commissioner
116
XIII. Levy of anti-dumping duties: Indian MMF textile manufacturers are also faced with higher fibre
prices as against their global counterparts on account of levy of anti-dumping duties on imports of
majority of man-made fibres. This in turn affects the availability of fibres to MMF textile manufacturers
at competitive prices.
XIV. Lack of indigenous production of specialized MMF: Various specialised man-made fibres (like
acetate/ tri-acetate, cuprammonium filament yarn, nylon 66, nylon 11, spandex, etc) are not being
manufactured in India despite having huge potential and thus have to be imported by the weavers.
XV. High customs duty: Another factor that has contributed to higher costs of man-made fibre
manufacturers and thus for man-made fibre textile manufacturers is the high customs duty on certain
raw materials required for man-made fibre industry. Certain raw materials and additives used in the
production of man-made fibres are necessarily imported on account of limited domestic production/
lack of requisite quality. Some of these raw materials and additives like rayon grade wood pulp (used
for manufacture of viscose fibre), titanium di-oxide and spin finish oil (used as additives for
manufacturing polyester) attract high customs duty, while the same are either exempted or have lower
customs duty in major competing countries. To enable a level-playing field with the global
counterparts in the international export markets and to reduce the key input costs of man-made fibre
manufacturers, it is desired that customs duty on such inputs are exempted. Since these items are
largely imported due to shortage in domestic market, reduction in import duties on same is not likely to
hurt the domestic manufacturers of these items.
XVI. High debt servicing cost: Another reason for relatively higher costs of man-made fibre/ filament yarn
manufacturers vis-à-vis the cotton textile manufacturers and global counterparts is the high debt
servicing costs of the former. The lending rates in India are in the range of 11% - 13.5% (IBA Website)
and are significantly higher in comparison to competing countries like China (5.04 – 6.12% ; Source :
Bank of Communication, China) and South Korea (5.72 – 6.33%), which contributes to much higher
interest costs for Indian MMF manufacturers vis-à-vis counterparts in competing countries. Further,
concessional schemes like TUFS is not applicable for manufacturing synthetic fibres, which puts this
capital intensive MMF industry at a great disadvantage vis-à-vis the cotton textile industry.
XVII. GST issues for textile industry: Major tax reforms are expected in the form of Goods and Services
Tax (GST), which is likely to be introduced next year. However, textile industry has a major concern
with respect to GST. The textiles industry involves a lot of inter-state transfers especially at the fabric
stage. Due to long supply chain in the textile industry involving traders in various cities, towns, etc, the
inter state transactions are likely to take place among the organised players who are above the
threshold limit for GST exemption and small decentralised traders who are exempted from payment of
GST. Consequently, the regular payee (one above threshold limit) would not get any credit for
purchases from small decentralised trader but shall have to pay full duty on the sale price. Thus, the
117
tax will multiply and the purpose of VAT principle would be broken. This would have serious cost
implications to the Indian textile industry, which is predominantly in the decentralised sector.
B. Industry neutral issues
XVIII. There are various other factors contributing to higher costs of Indian MMF and MMF textile
manufacturers vis-à-vis global counterparts, including high power costs and high transaction costs.
Indian industries (including textile industry) face a major disadvantage against countries like China
and countries in South East Asia in terms of power costs and availability. Moreover, Indian exporters
are faced with huge transaction cost burden in comparison with exporters in competing countries. For
instance, transaction costs for exports in India stands at US$ 945 per container as compared to US$
500 per container for China. The un-neutralised state taxes such as CST, VAT, Octroi, etc contribute
to higher transaction costs for Indian exporters. To mitigate the cost burden of Indian textile players, a
long term solution is required with respect to strengthening of physical infrastructure and introduction
of tax reforms.
RECOMMENDATIONS
XIX. To meet the objectives of attaining high growth and increasing the competitiveness of Indian textile
industry (including MMF textiles), the national fibre policy needs to lay a special emphasis on
improving the competitiveness of Indian man-made fibres and textiles industry as it can drive the
growth of the Indian textile industry in the future, both in domestic as well as export markets. This
requires addressing of issues and constraints faced by the industry at present and make suitable
provisions to avoid any foreseeable hurdles in the future.
XX. The key recommendations arrived from this study for incorporation in the National Fibre Policy are:
1. Have a fibre neutral excise policy; i.e. all textiles and fibres should attract the same excise
duty i.e. 4% optional
2. Excise duty and customs duty exemption for specialised MMF which are not produced
indigenously. Such specialised fibres are listed below:
a. Acetate fibre (HS code – 55049010)
b. Acetate filament yarn (HS code – 540342)
c. Tri-acetate fibre (HS code proposed - 55049011)
d. Tri-acetate filament yarn (HS code proposed - 54033310)
e. Cuprammonium filament yarn (HS code – 54033910)
f. Cuprammonium fibre (HS code proposed – 55049040)
g. Nylon 66 (HS code proposed – 55031110, 54025110)
h. Nylon 11 (HS code proposed – 55031120, 54025120)
118
i. Spandex fibre (HS code proposed- 55039030)
j. Spandex filament yarn (HS code – 54024400)
k. PVA fiber (HS code proposed – 55039030)
l. PVA filament yarn (HS code proposed - 54026960)
m. PBT yarn (HS code proposed– 54026970, 55039040)
n. Modacrylic staple fibres (HS code proposed - 55033010)
o. Modacrylic filament yarn (HS code proposed – 54026940)
p. PTET (HS code proposed – 54026980, 55039050)
3. Removal of 4% Special Additional Duty (SAD) on imports of man-made fibres to make the
same available to domestic consumers at competitive prices.
4. Customs duty exemption on certain raw materials and additives that are primarily imported
a. Customs duty on rayon grade wood pulp (HS Code 47020000) to be exempted (from
current 5%)
b. Customs duty on titanium di-oxide (Anatase grade) with HS code 283230030 to be
reduced to nil from current 11%.
c. Customs duty on Spin finish oil to be reduced to nil from current 8%. Specific HS
codes for Spin finish oil have already been proposed by the industry (HS code
34031200) and endorsed by the Department of Chemicals and Petrochemicals for
this purpose.
5. Export oriented incentives should be provided to manufacturers of MMF textiles and garments
for a limited period to neutralize the impact of cost-disadvantage vis-à-vis exporters in
competing countries. This could include higher drawback rates and inclusion of processed
fabrics, madeups and garments made of man-made fibres under the Focus Product Scheme.
(Currently, MMF garments and certain types of woven fabrics of MMF falling under HS Code
5512, 5513, 5514, 5515 and 5516 are covered under Market Linked Focus Product Scheme
for limited number of countries.). The proposed scheme is as follows:
a. A graduation scheme for three years can be introduced under the Focus product
scheme with benefits of 10% in first year, 7% in second year and 3% in third year.
b. This scheme may cover man-made textiles and garments. In case financial
implications do not permit coverage of textiles and garments then at least garments
sector should be incentivised as exports of these are currently very low in value
terms.
6. Textile industry should be kept out of GST for at least two years
7. Synthetic fibres should be covered under TUFS with fund support from their administrative
Ministry i.e. Department of Chemicals and Petrochemicals.
119
a. The machinery for manufacture of synthetic fibres post polymerisation may be
covered under TUFS. Since the processes upto polymerisation are primarily chemical
in nature polymerisation machineries may not be covered.
b. The post polymerisation machinery may be benchmarked by TAMC in consultation
with proposed advisory council on MMF.
c. To encourage setting up of small size units, particularly from chips the restriction on
term loan and also on capital cost may be fixed by IMSC in consultation with TAMC
and proposed advisory council.
8. Introduction of anti-dumping proceedings on man-made fibres should involve consultation
with the Ministry of Textiles
9. Introduction of an institutional mechanism wherein government support (financial and
otherwise) is made available to industry associations/ players to initiate and defend anti-
dumping proceedings, where necessary
10. A MMF advisory council with all the stakeholders may be set up to monitor that the excise
duty and other concessions have been passed on by the MMF manufacturers and also to
take on integrated approach to solving the problems of MMF producers and users of MMF
and to accelerate their growth
11. MMF manufacturing and processing units should be given a priority under the gas allocation
policy, at par with the power sector.
XXI. If the above recommendations are implemented, it would result in high growth of man-made fibres
and textiles industry, thereby contributing to higher revenues, increase in employment generation, and
higher foreign exchange earnings. Financial implications of these recommendations would be
balanced by the intangible benefits and cascading effect in the economy.
120
2.1. INDIAN SCENARIO
IMPORTANT MMF PLAYER IN THE WORLD
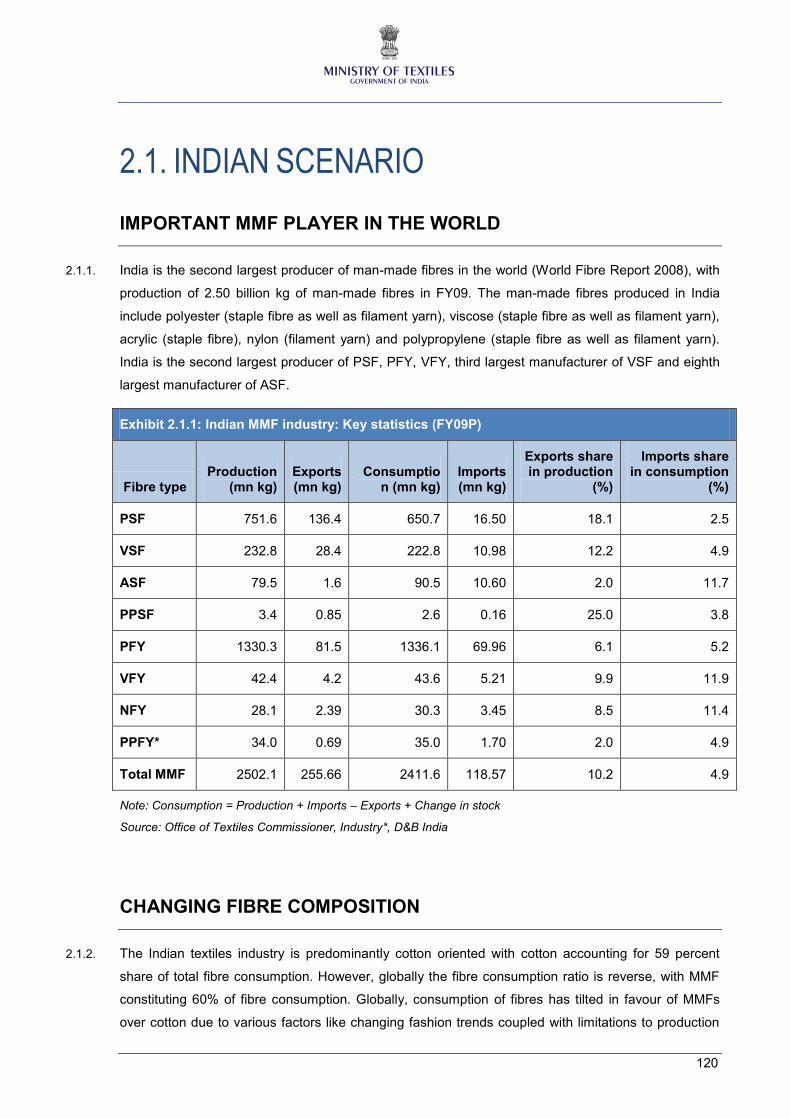
2.1.1. India is the second largest producer of man-made fibres in the world (World Fibre Report 2008), with
production of 2.50 billion kg of man-made fibres in FY09. The man-made fibres produced in India
include polyester (staple fibre as well as filament yarn), viscose (staple fibre as well as filament yarn),
acrylic (staple fibre), nylon (filament yarn) and polypropylene (staple fibre as well as filament yarn).
India is the second largest producer of PSF, PFY, VFY, third largest manufacturer of VSF and eighth
largest manufacturer of ASF.
Exhibit 2.1.1: Indian MMF industry: Key statistics (FY09P)
Fibre type Production
(mn kg) Exports (mn kg)
Consumption (mn kg)
Imports (mn kg)
Exports share in production
(%)
Imports share in consumption
(%)
PSF 751.6 136.4 650.7 16.50 18.1 2.5
VSF 232.8 28.4 222.8 10.98 12.2 4.9
ASF 79.5 1.6 90.5 10.60 2.0 11.7
PPSF 3.4 0.85 2.6 0.16 25.0 3.8
PFY 1330.3 81.5 1336.1 69.96 6.1 5.2
VFY 42.4 4.2 43.6 5.21 9.9 11.9
NFY 28.1 2.39 30.3 3.45 8.5 11.4
PPFY* 34.0 0.69 35.0 1.70 2.0 4.9
Total MMF 2502.1 255.66 2411.6 118.57 10.2 4.9
Note: Consumption = Production + Imports – Exports + Change in stock
Source: Office of Textiles Commissioner, Industry*, D&B India
CHANGING FIBRE COMPOSITION
2.1.2. The Indian textiles industry is predominantly cotton oriented with cotton accounting for 59 percent
share of total fibre consumption. However, globally the fibre consumption ratio is reverse, with MMF
constituting 60% of fibre consumption. Globally, consumption of fibres has tilted in favour of MMFs
over cotton due to various factors like changing fashion trends coupled with limitations to production
121
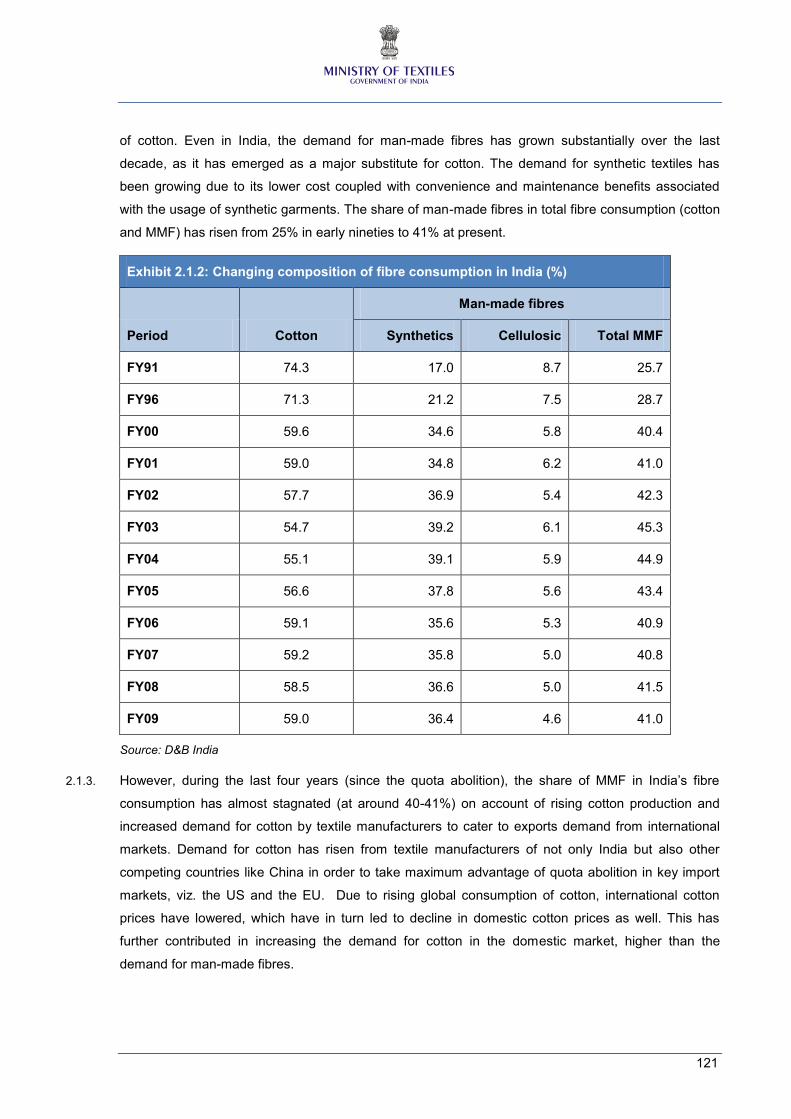
of cotton. Even in India, the demand for man-made fibres has grown substantially over the last
decade, as it has emerged as a major substitute for cotton. The demand for synthetic textiles has
been growing due to its lower cost coupled with convenience and maintenance benefits associated
with the usage of synthetic garments. The share of man-made fibres in total fibre consumption (cotton
and MMF) has risen from 25% in early nineties to 41% at present.
Exhibit 2.1.2: Changing composition of fibre consumption in India (%)
Period Cotton
Man-made fibres
Synthetics Cellulosic Total MMF
FY91 74.3 17.0 8.7 25.7
FY96 71.3 21.2 7.5 28.7
FY00 59.6 34.6 5.8 40.4
FY01 59.0 34.8 6.2 41.0
FY02 57.7 36.9 5.4 42.3
FY03 54.7 39.2 6.1 45.3
FY04 55.1 39.1 5.9 44.9
FY05 56.6 37.8 5.6 43.4
FY06 59.1 35.6 5.3 40.9
FY07 59.2 35.8 5.0 40.8
FY08 58.5 36.6 5.0 41.5
FY09 59.0 36.4 4.6 41.0
Source: D&B India
2.1.3. However, during the last four years (since the quota abolition), the share of MMF in India’s fibre
consumption has almost stagnated (at around 40-41%) on account of rising cotton production and
increased demand for cotton by textile manufacturers to cater to exports demand from international
markets. Demand for cotton has risen from textile manufacturers of not only India but also other
competing countries like China in order to take maximum advantage of quota abolition in key import
markets, viz. the US and the EU. Due to rising global consumption of cotton, international cotton
prices have lowered, which have in turn led to decline in domestic cotton prices as well. This has
further contributed in increasing the demand for cotton in the domestic market, higher than the
demand for man-made fibres.
122
POLYESTER ACCOUNTS FOR LARGEST SHARE IN MMF
2.1.4. Polyester is the most dominant man-made fibre in India, constituting over 83% of total man-made fibre
production and consumption in India; polyester filament yarn (PFY) constitutes over 53% of total MMF
production and polyester staple fibre (PSF) constitutes another 30%. The other major man-made fibre
produced and consumed in India is viscose (VSF constitutes 9.4% of total MMF production and VFY
constitutes another 1.7%). Remaining share is occupied by other fibres like acrylic, nylon and
polypropylene. Although India is producing most of the MMF as detailed above, specialized MMF
like acetate / tri-acetate fibre / yarn, cuprammonium filament yarn, nylon 66, nylon 11, Spandex, PVA
fibre and filament yarn, PBT yarn, modacrylic staple fibre, PTET (Poly-tri-methylene Teryphthalate)
are not being manufactured.
2.1.5. During the last ten years, demand for man-made fibres has grown at a CAGR of around 3% from 1.6
million kg (FY99) to 2.4 million kg (FY09). Amongst all fibres, polyester filament yarn has recorded the
highest growth of over 6% per annum. Steadily declining prices of PFY have been one of the major
factors pushing its demand in the domestic market. Huge capacity additions during the post quota
period have also helped in increasing the supply of PFY in the market, thereby pushing down the
prices and hence increasing the demand. Also,rising cotton prices coupled with increasing exports of
cotton and cotton based textiles helped polyester industry to capture some of the domestic market
share from cotton.
EXCESS CAPACITIES
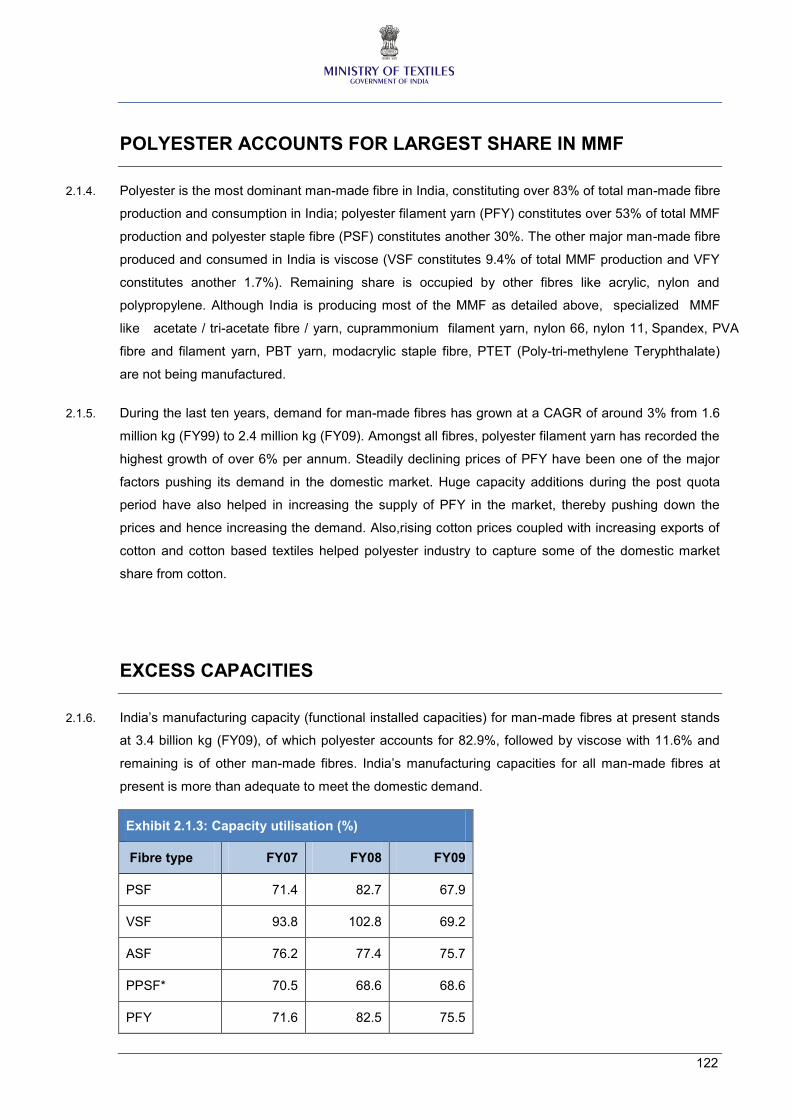
2.1.6. India’s manufacturing capacity (functional installed capacities) for man-made fibres at present stands
at 3.4 billion kg (FY09), of which polyester accounts for 82.9%, followed by viscose with 11.6% and
remaining is of other man-made fibres. India’s manufacturing capacities for all man-made fibres at
present is more than adequate to meet the domestic demand.
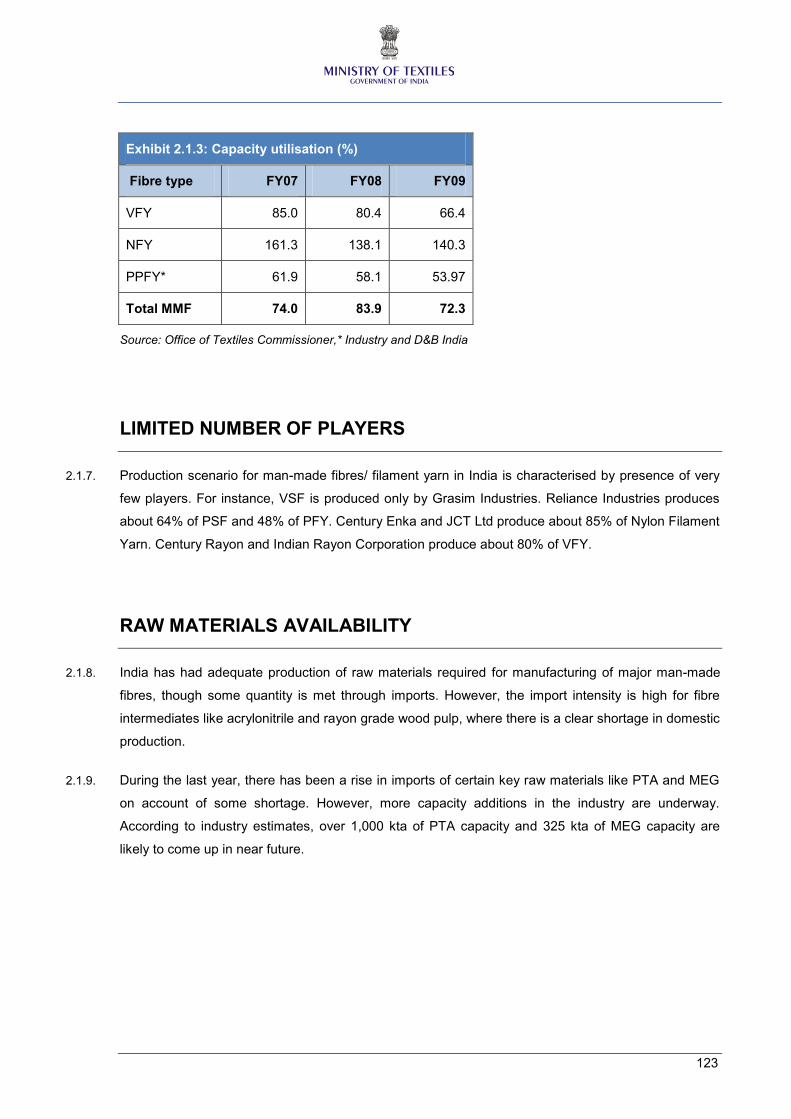
Exhibit 2.1.3: Capacity utilisation (%)
Fibre type FY07 FY08 FY09
PSF 71.4 82.7 67.9
VSF 93.8 102.8 69.2
ASF 76.2 77.4 75.7
PPSF* 70.5 68.6 68.6
PFY 71.6 82.5 75.5
123
Exhibit 2.1.3: Capacity utilisation (%)
Fibre type FY07 FY08 FY09
VFY 85.0 80.4 66.4
NFY 161.3 138.1 140.3
PPFY* 61.9 58.1 53.97
Total MMF 74.0 83.9 72.3
Source: Office of Textiles Commissioner,* Industry and D&B India
LIMITED NUMBER OF PLAYERS
2.1.7. Production scenario for man-made fibres/ filament yarn in India is characterised by presence of very
few players. For instance, VSF is produced only by Grasim Industries. Reliance Industries produces
about 64% of PSF and 48% of PFY. Century Enka and JCT Ltd produce about 85% of Nylon Filament
Yarn. Century Rayon and Indian Rayon Corporation produce about 80% of VFY.
RAW MATERIALS AVAILABILITY
2.1.8. India has had adequate production of raw materials required for manufacturing of major man-made
fibres, though some quantity is met through imports. However, the import intensity is high for fibre
intermediates like acrylonitrile and rayon grade wood pulp, where there is a clear shortage in domestic
production.
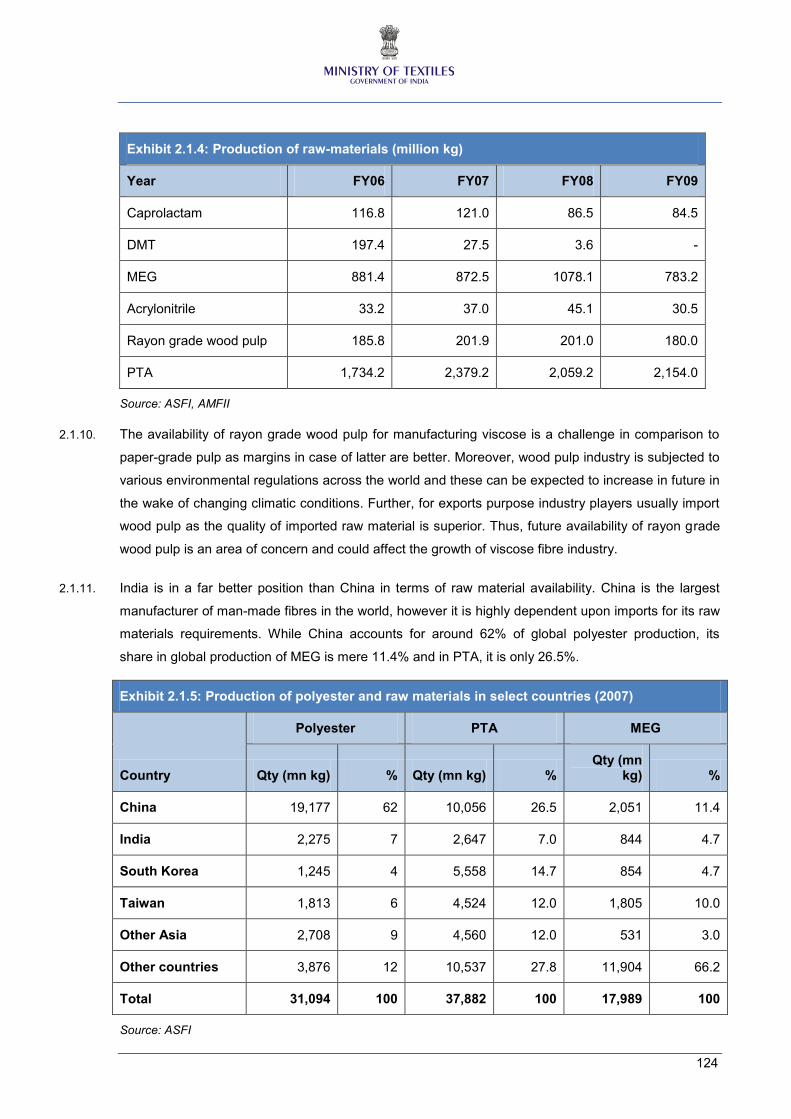
2.1.9. During the last year, there has been a rise in imports of certain key raw materials like PTA and MEG
on account of some shortage. However, more capacity additions in the industry are underway.
According to industry estimates, over 1,000 kta of PTA capacity and 325 kta of MEG capacity are
likely to come up in near future.
124
Exhibit 2.1.4: Production of raw-materials (million kg)
Year FY06 FY07 FY08 FY09
Caprolactam 116.8 121.0 86.5 84.5
DMT 197.4 27.5 3.6 -
MEG 881.4 872.5 1078.1 783.2
Acrylonitrile 33.2 37.0 45.1 30.5
Rayon grade wood pulp 185.8 201.9 201.0 180.0
PTA 1,734.2 2,379.2 2,059.2 2,154.0
Source: ASFI, AMFII
2.1.10. The availability of rayon grade wood pulp for manufacturing viscose is a challenge in comparison to
paper-grade pulp as margins in case of latter are better. Moreover, wood pulp industry is subjected to
various environmental regulations across the world and these can be expected to increase in future in
the wake of changing climatic conditions. Further, for exports purpose industry players usually import
wood pulp as the quality of imported raw material is superior. Thus, future availability of rayon grade
wood pulp is an area of concern and could affect the growth of viscose fibre industry.
2.1.11. India is in a far better position than China in terms of raw material availability. China is the largest
manufacturer of man-made fibres in the world, however it is highly dependent upon imports for its raw
materials requirements. While China accounts for around 62% of global polyester production, its
share in global production of MEG is mere 11.4% and in PTA, it is only 26.5%.
Exhibit 2.1.5: Production of polyester and raw materials in select countries (2007)
Country
Polyester PTA MEG
Qty (mn kg) % Qty (mn kg) % Qty (mn
kg) %
China 19,177 62 10,056 26.5 2,051 11.4
India 2,275 7 2,647 7.0 844 4.7
South Korea 1,245 4 5,558 14.7 854 4.7
Taiwan 1,813 6 4,524 12.0 1,805 10.0
Other Asia 2,708 9 4,560 12.0 531 3.0
Other countries 3,876 12 10,537 27.8 11,904 66.2
Total 31,094 100 37,882 100 17,989 100
Source: ASFI
125
PRICE MOVEMENT OF MMF
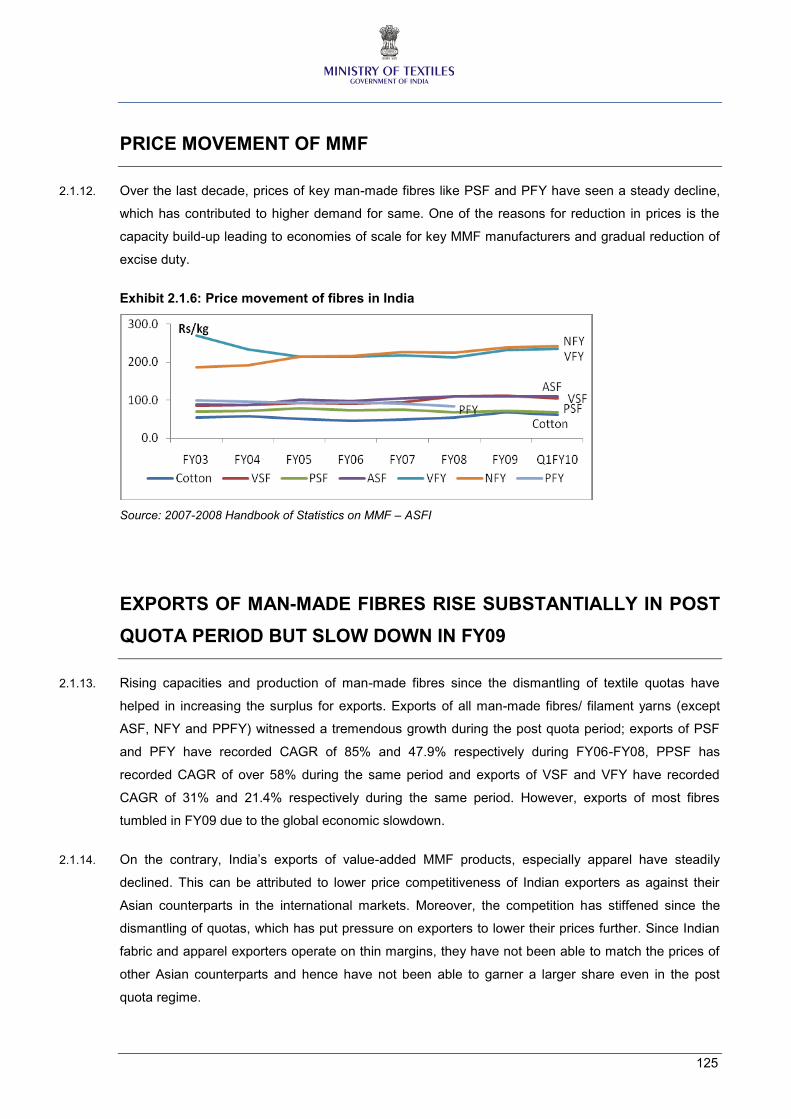
2.1.12. Over the last decade, prices of key man-made fibres like PSF and PFY have seen a steady decline,
which has contributed to higher demand for same. One of the reasons for reduction in prices is the
capacity build-up leading to economies of scale for key MMF manufacturers and gradual reduction of
excise duty.
Exhibit 2.1.6: Price movement of fibres in India
Source: 2007-2008 Handbook of Statistics on MMF – ASFI
EXPORTS OF MAN-MADE FIBRES RISE SUBSTANTIALLY IN POST
QUOTA PERIOD BUT SLOW DOWN IN FY09
2.1.13. Rising capacities and production of man-made fibres since the dismantling of textile quotas have
helped in increasing the surplus for exports. Exports of all man-made fibres/ filament yarns (except
ASF, NFY and PPFY) witnessed a tremendous growth during the post quota period; exports of PSF
and PFY have recorded CAGR of 85% and 47.9% respectively during FY06-FY08, PPSF has
recorded CAGR of over 58% during the same period and exports of VSF and VFY have recorded
CAGR of 31% and 21.4% respectively during the same period. However, exports of most fibres
tumbled in FY09 due to the global economic slowdown.
2.1.14. On the contrary, India’s exports of value-added MMF products, especially apparel have steadily
declined. This can be attributed to lower price competitiveness of Indian exporters as against their
Asian counterparts in the international markets. Moreover, the competition has stiffened since the
dismantling of quotas, which has put pressure on exporters to lower their prices further. Since Indian
fabric and apparel exporters operate on thin margins, they have not been able to match the prices of
other Asian counterparts and hence have not been able to garner a larger share even in the post
quota regime.
126
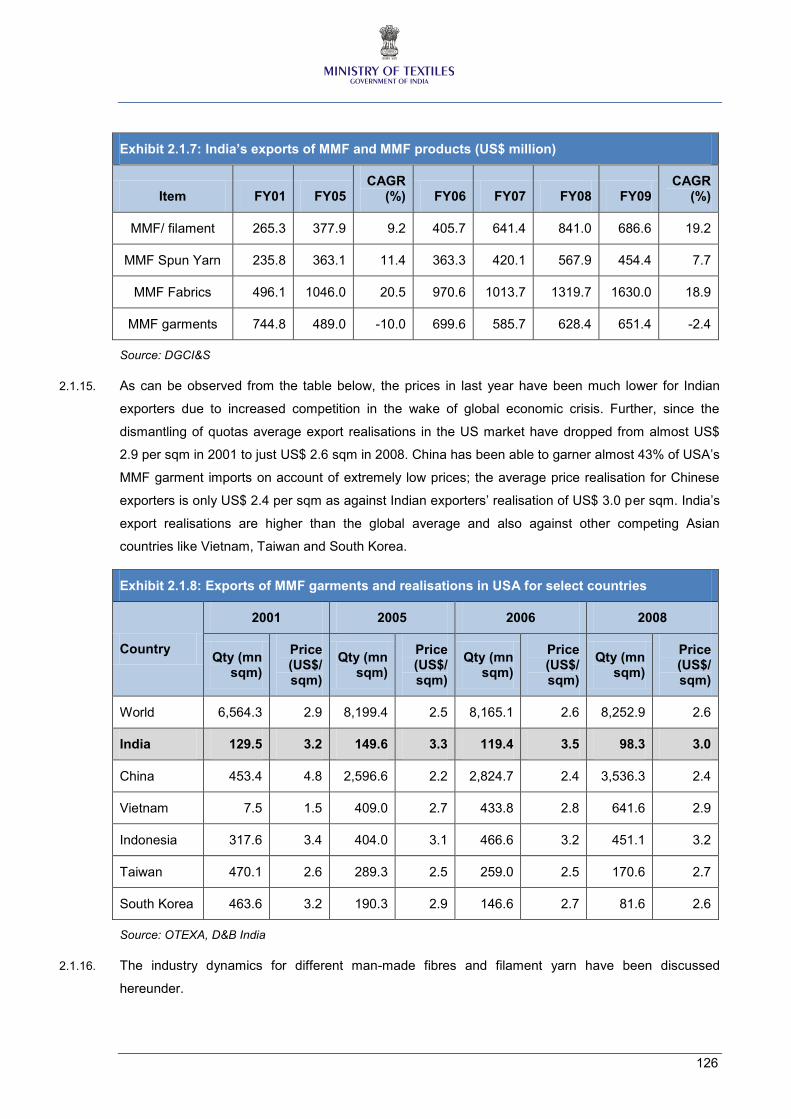
Exhibit 2.1.7: India’s exports of MMF and MMF products (US$ million)
Item FY01 FY05 CAGR
(%) FY06 FY07 FY08 FY09 CAGR
(%)
MMF/ filament 265.3 377.9 9.2 405.7 641.4 841.0 686.6 19.2
MMF Spun Yarn 235.8 363.1 11.4 363.3 420.1 567.9 454.4 7.7
MMF Fabrics 496.1 1046.0 20.5 970.6 1013.7 1319.7 1630.0 18.9
MMF garments 744.8 489.0 -10.0 699.6 585.7 628.4 651.4 -2.4
Source: DGCI&S
2.1.15. As can be observed from the table below, the prices in last year have been much lower for Indian
exporters due to increased competition in the wake of global economic crisis. Further, since the
dismantling of quotas average export realisations in the US market have dropped from almost US$
2.9 per sqm in 2001 to just US$ 2.6 sqm in 2008. China has been able to garner almost 43% of USA’s
MMF garment imports on account of extremely low prices; the average price realisation for Chinese
exporters is only US$ 2.4 per sqm as against Indian exporters’ realisation of US$ 3.0 per sqm. India’s
export realisations are higher than the global average and also against other competing Asian
countries like Vietnam, Taiwan and South Korea.
Exhibit 2.1.8: Exports of MMF garments and realisations in USA for select countries
Country
2001 2005 2006 2008
Qty (mn sqm)
Price (US$/ sqm)
Qty (mn sqm)
Price (US$/ sqm)
Qty (mn sqm)
Price (US$/ sqm)
Qty (mn sqm)
Price (US$/ sqm)
World 6,564.3 2.9 8,199.4 2.5 8,165.1 2.6 8,252.9 2.6
India 129.5 3.2 149.6 3.3 119.4 3.5 98.3 3.0
China 453.4 4.8 2,596.6 2.2 2,824.7 2.4 3,536.3 2.4
Vietnam 7.5 1.5 409.0 2.7 433.8 2.8 641.6 2.9
Indonesia 317.6 3.4 404.0 3.1 466.6 3.2 451.1 3.2
Taiwan 470.1 2.6 289.3 2.5 259.0 2.5 170.6 2.7
South Korea 463.6 3.2 190.3 2.9 146.6 2.7 81.6 2.6
Source: OTEXA, D&B India
2.1.16. The industry dynamics for different man-made fibres and filament yarn have been discussed
hereunder.
127
POLYESTER STAPLE FIBRE
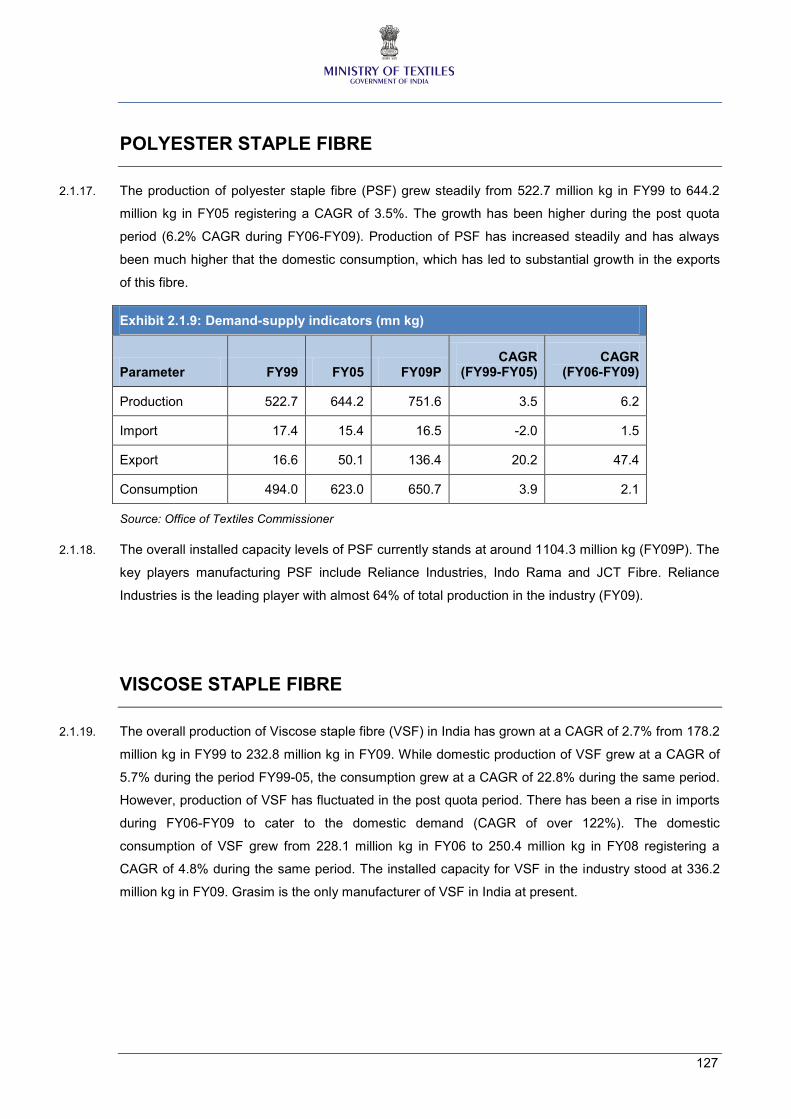
2.1.17. The production of polyester staple fibre (PSF) grew steadily from 522.7 million kg in FY99 to 644.2
million kg in FY05 registering a CAGR of 3.5%. The growth has been higher during the post quota
period (6.2% CAGR during FY06-FY09). Production of PSF has increased steadily and has always
been much higher that the domestic consumption, which has led to substantial growth in the exports
of this fibre.
Exhibit 2.1.9: Demand-supply indicators (mn kg)
Parameter FY99 FY05 FY09P CAGR
(FY99-FY05) CAGR
(FY06-FY09)
Production 522.7 644.2 751.6 3.5 6.2
Import 17.4 15.4 16.5 -2.0 1.5
Export 16.6 50.1 136.4 20.2 47.4
Consumption 494.0 623.0 650.7 3.9 2.1
Source: Office of Textiles Commissioner
2.1.18. The overall installed capacity levels of PSF currently stands at around 1104.3 million kg (FY09P). The
key players manufacturing PSF include Reliance Industries, Indo Rama and JCT Fibre. Reliance
Industries is the leading player with almost 64% of total production in the industry (FY09).
VISCOSE STAPLE FIBRE
2.1.19. The overall production of Viscose staple fibre (VSF) in India has grown at a CAGR of 2.7% from 178.2
million kg in FY99 to 232.8 million kg in FY09. While domestic production of VSF grew at a CAGR of
5.7% during the period FY99-05, the consumption grew at a CAGR of 22.8% during the same period.
However, production of VSF has fluctuated in the post quota period. There has been a rise in imports
during FY06-FY09 to cater to the domestic demand (CAGR of over 122%). The domestic
consumption of VSF grew from 228.1 million kg in FY06 to 250.4 million kg in FY08 registering a
CAGR of 4.8% during the same period. The installed capacity for VSF in the industry stood at 336.2
million kg in FY09. Grasim is the only manufacturer of VSF in India at present.
128
Exhibit 2.1.10: Demand-supply indicators (mn kg)
Parameter FY99 FY05 FY09P CAGR
(FY99-FY05) CAGR
(FY06-FY09)
Production 178.2 248.0 232.8 5.7 0.5
Import 2.3 1.0 10.98 -12.96 122.3
Export 0.9 7.5 28.4 42.39 22.6
Consumption 182.0 225.0 222.8 22.76 -0.8
Source: Office of Textiles Commissioner
ACRYLIC STAPLE FIBRE
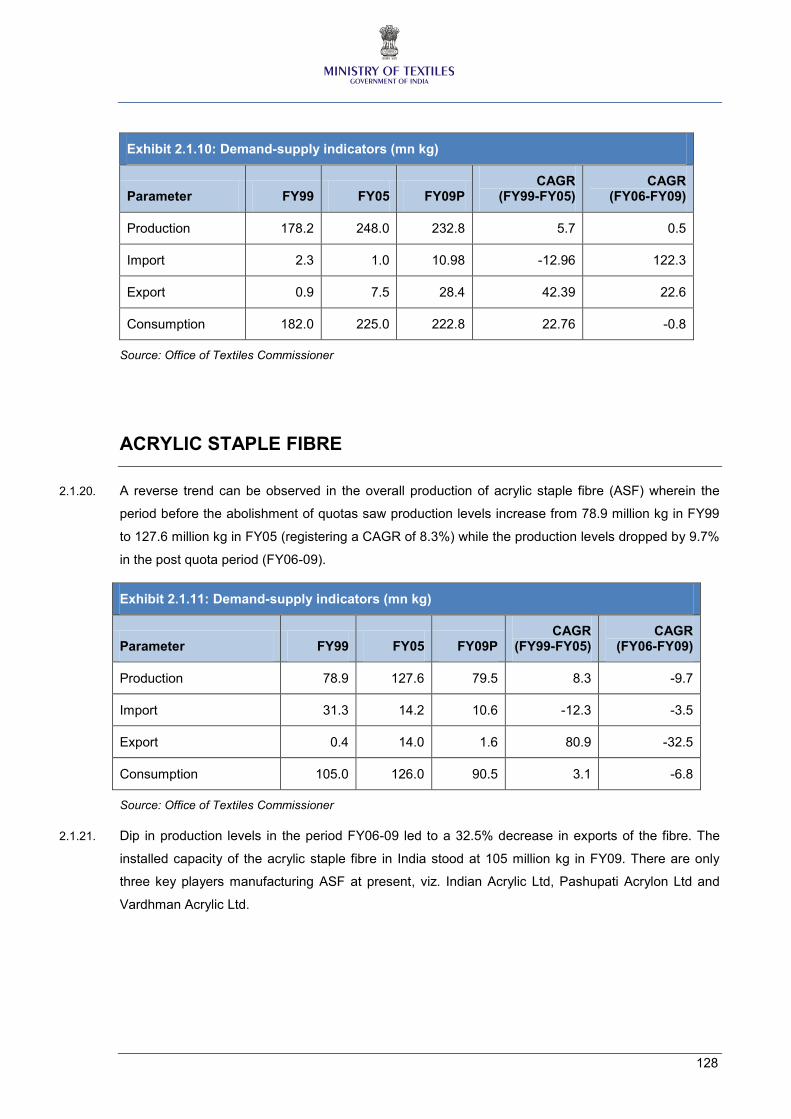
2.1.20. A reverse trend can be observed in the overall production of acrylic staple fibre (ASF) wherein the
period before the abolishment of quotas saw production levels increase from 78.9 million kg in FY99
to 127.6 million kg in FY05 (registering a CAGR of 8.3%) while the production levels dropped by 9.7%
in the post quota period (FY06-09).
Exhibit 2.1.11: Demand-supply indicators (mn kg)
Parameter FY99 FY05 FY09P CAGR
(FY99-FY05) CAGR
(FY06-FY09)
Production 78.9 127.6 79.5 8.3 -9.7
Import 31.3 14.2 10.6 -12.3 -3.5
Export 0.4 14.0 1.6 80.9 -32.5
Consumption 105.0 126.0 90.5 3.1 -6.8
Source: Office of Textiles Commissioner
2.1.21. Dip in production levels in the period FY06-09 led to a 32.5% decrease in exports of the fibre. The
installed capacity of the acrylic staple fibre in India stood at 105 million kg in FY09. There are only
three key players manufacturing ASF at present, viz. Indian Acrylic Ltd, Pashupati Acrylon Ltd and
Vardhman Acrylic Ltd.
129
POLYPROPYLENE STAPLE FIBRE
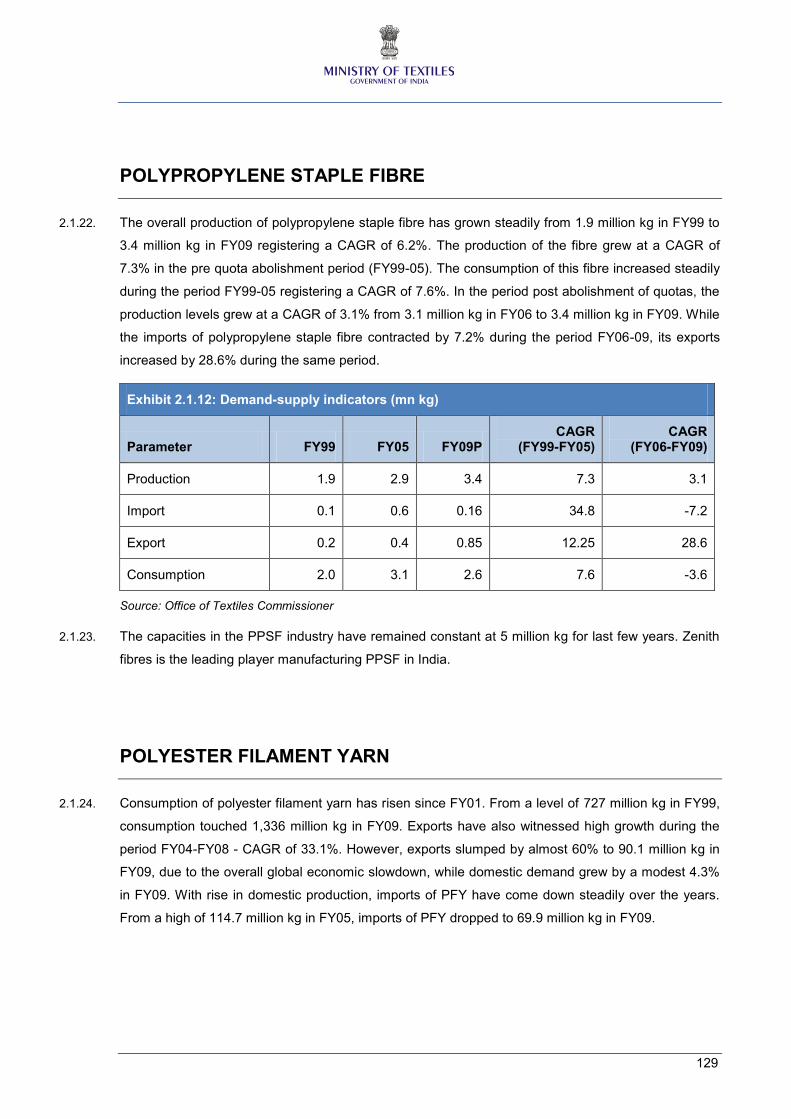
2.1.22. The overall production of polypropylene staple fibre has grown steadily from 1.9 million kg in FY99 to
3.4 million kg in FY09 registering a CAGR of 6.2%. The production of the fibre grew at a CAGR of
7.3% in the pre quota abolishment period (FY99-05). The consumption of this fibre increased steadily
during the period FY99-05 registering a CAGR of 7.6%. In the period post abolishment of quotas, the
production levels grew at a CAGR of 3.1% from 3.1 million kg in FY06 to 3.4 million kg in FY09. While
the imports of polypropylene staple fibre contracted by 7.2% during the period FY06-09, its exports
increased by 28.6% during the same period.
Exhibit 2.1.12: Demand-supply indicators (mn kg)
Parameter FY99 FY05 FY09P CAGR
(FY99-FY05) CAGR
(FY06-FY09)
Production 1.9 2.9 3.4 7.3 3.1
Import 0.1 0.6 0.16 34.8 -7.2
Export 0.2 0.4 0.85 12.25 28.6
Consumption 2.0 3.1 2.6 7.6 -3.6
Source: Office of Textiles Commissioner
2.1.23. The capacities in the PPSF industry have remained constant at 5 million kg for last few years. Zenith
fibres is the leading player manufacturing PPSF in India.
POLYESTER FILAMENT YARN
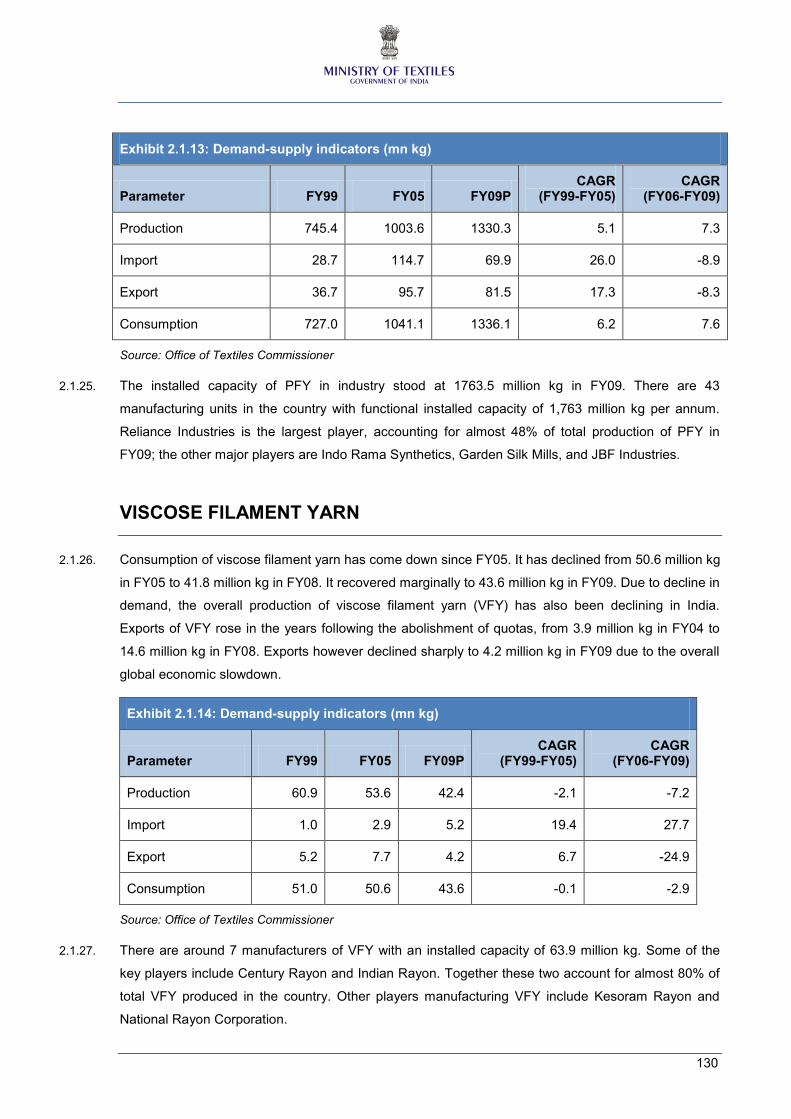
2.1.24. Consumption of polyester filament yarn has risen since FY01. From a level of 727 million kg in FY99,
consumption touched 1,336 million kg in FY09. Exports have also witnessed high growth during the
period FY04-FY08 - CAGR of 33.1%. However, exports slumped by almost 60% to 90.1 million kg in
FY09, due to the overall global economic slowdown, while domestic demand grew by a modest 4.3%
in FY09. With rise in domestic production, imports of PFY have come down steadily over the years.
From a high of 114.7 million kg in FY05, imports of PFY dropped to 69.9 million kg in FY09.
130
Exhibit 2.1.13: Demand-supply indicators (mn kg)
Parameter FY99 FY05 FY09P CAGR
(FY99-FY05) CAGR
(FY06-FY09)
Production 745.4 1003.6 1330.3 5.1 7.3
Import 28.7 114.7 69.9 26.0 -8.9
Export 36.7 95.7 81.5 17.3 -8.3
Consumption 727.0 1041.1 1336.1 6.2 7.6
Source: Office of Textiles Commissioner
2.1.25. The installed capacity of PFY in industry stood at 1763.5 million kg in FY09. There are 43
manufacturing units in the country with functional installed capacity of 1,763 million kg per annum.
Reliance Industries is the largest player, accounting for almost 48% of total production of PFY in
FY09; the other major players are Indo Rama Synthetics, Garden Silk Mills, and JBF Industries.
VISCOSE FILAMENT YARN
2.1.26. Consumption of viscose filament yarn has come down since FY05. It has declined from 50.6 million kg
in FY05 to 41.8 million kg in FY08. It recovered marginally to 43.6 million kg in FY09. Due to decline in
demand, the overall production of viscose filament yarn (VFY) has also been declining in India.
Exports of VFY rose in the years following the abolishment of quotas, from 3.9 million kg in FY04 to
14.6 million kg in FY08. Exports however declined sharply to 4.2 million kg in FY09 due to the overall
global economic slowdown.
Exhibit 2.1.14: Demand-supply indicators (mn kg)
Parameter FY99 FY05 FY09P CAGR
(FY99-FY05) CAGR
(FY06-FY09)
Production 60.9 53.6 42.4 -2.1 -7.2
Import 1.0 2.9 5.2 19.4 27.7
Export 5.2 7.7 4.2 6.7 -24.9
Consumption 51.0 50.6 43.6 -0.1 -2.9
Source: Office of Textiles Commissioner
2.1.27. There are around 7 manufacturers of VFY with an installed capacity of 63.9 million kg. Some of the
key players include Century Rayon and Indian Rayon. Together these two account for almost 80% of
total VFY produced in the country. Other players manufacturing VFY include Kesoram Rayon and
National Rayon Corporation.
131
NYLON FILAMENT YARN
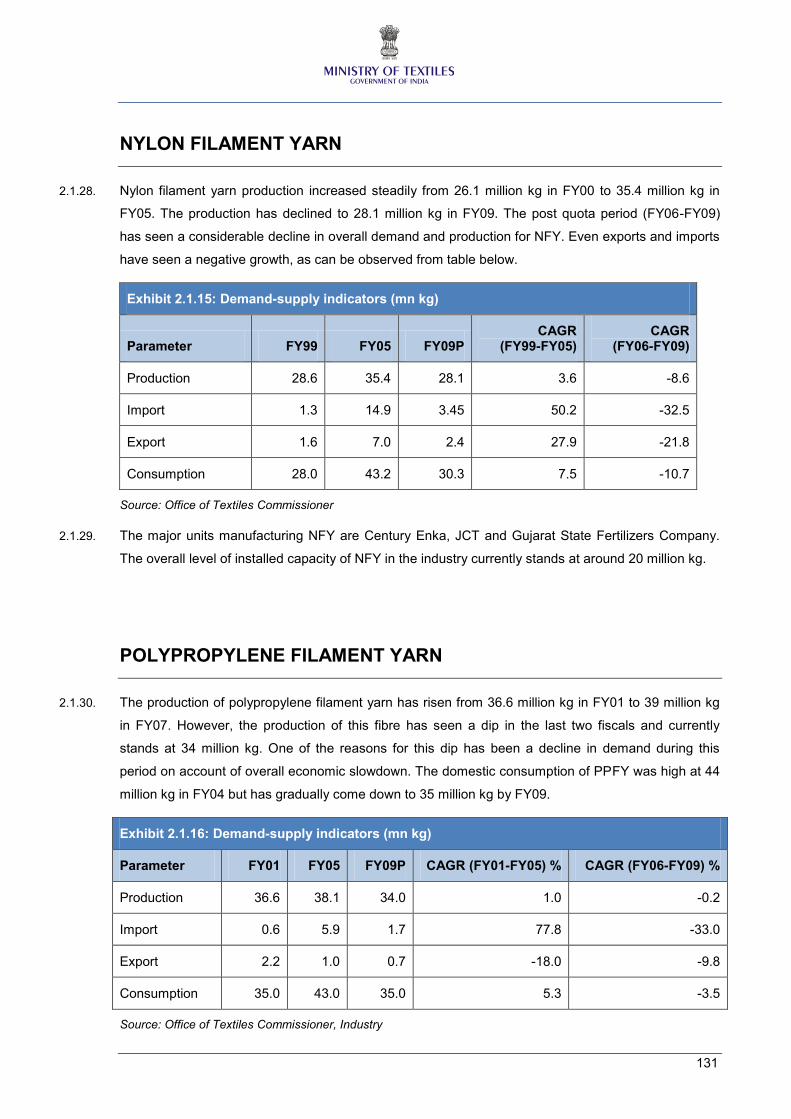
2.1.28. Nylon filament yarn production increased steadily from 26.1 million kg in FY00 to 35.4 million kg in
FY05. The production has declined to 28.1 million kg in FY09. The post quota period (FY06-FY09)
has seen a considerable decline in overall demand and production for NFY. Even exports and imports
have seen a negative growth, as can be observed from table below.
Exhibit 2.1.15: Demand-supply indicators (mn kg)
Parameter FY99 FY05 FY09P CAGR
(FY99-FY05) CAGR
(FY06-FY09)
Production 28.6 35.4 28.1 3.6 -8.6
Import 1.3 14.9 3.45 50.2 -32.5
Export 1.6 7.0 2.4 27.9 -21.8
Consumption 28.0 43.2 30.3 7.5 -10.7
Source: Office of Textiles Commissioner
2.1.29. The major units manufacturing NFY are Century Enka, JCT and Gujarat State Fertilizers Company.
The overall level of installed capacity of NFY in the industry currently stands at around 20 million kg.
POLYPROPYLENE FILAMENT YARN
2.1.30. The production of polypropylene filament yarn has risen from 36.6 million kg in FY01 to 39 million kg
in FY07. However, the production of this fibre has seen a dip in the last two fiscals and currently
stands at 34 million kg. One of the reasons for this dip has been a decline in demand during this
period on account of overall economic slowdown. The domestic consumption of PPFY was high at 44
million kg in FY04 but has gradually come down to 35 million kg by FY09.
Exhibit 2.1.16: Demand-supply indicators (mn kg)
Parameter FY01 FY05 FY09P CAGR (FY01-FY05) % CAGR (FY06-FY09) %
Production 36.6 38.1 34.0 1.0 -0.2
Import 0.6 5.9 1.7 77.8 -33.0
Export 2.2 1.0 0.7 -18.0 -9.8
Consumption 35.0 43.0 35.0 5.3 -3.5
Source: Office of Textiles Commissioner, Industry
132
2.1.31. In the periods when production has been lower than the overall domestic demand, there has been a
rise in imports of this fibre. During the last ten years, imports were highest in FY05 at 5.9 million kg,
when production was only 38.1 million kg as against the demand of 43.0 million kg. Exports of PPFY
have been very low, throughout the last ten year period and have seen a steady decline.
2.1.32. The capacity levels for PPFY currently stand at around 63 million kg. There are currently three main
players manufacturing PPFY, viz. Sumeet Synthetics, Filatax India and Shree Shyam Filament.
DYNAMICS OF VALUE ADDED MMF TEXTILES
2.1.33. MMF fabrics are produced primarily in the decentralized power loom sectors. The composite/big Mills
are not producing MMF fabrics. In fact, 75% of the polyester filament yarn fabrics are produced in the
Surat. Similarly, 65% of the MMF spun yarn fabrics are produced in Bhilwara. Bhiwandi and
Ichalkaranji are also major centres for MMF spun and mixed fabrics.
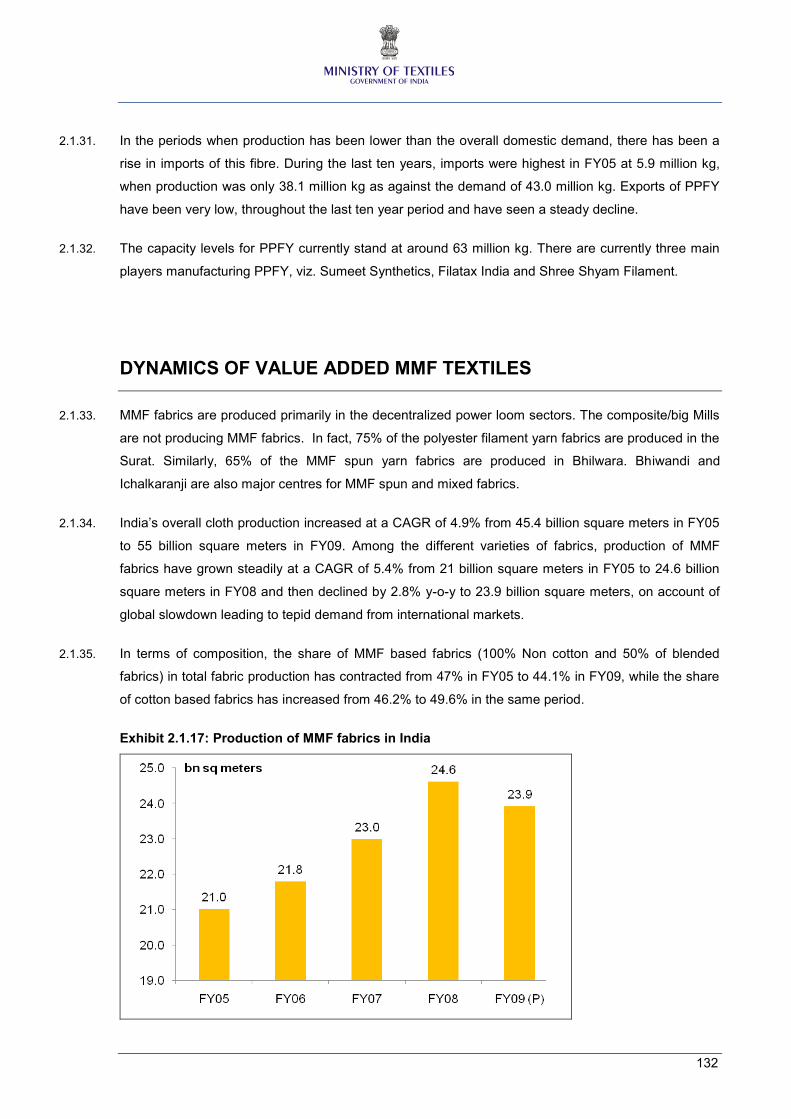
2.1.34. India’s overall cloth production increased at a CAGR of 4.9% from 45.4 billion square meters in FY05
to 55 billion square meters in FY09. Among the different varieties of fabrics, production of MMF
fabrics have grown steadily at a CAGR of 5.4% from 21 billion square meters in FY05 to 24.6 billion
square meters in FY08 and then declined by 2.8% y-o-y to 23.9 billion square meters, on account of
global slowdown leading to tepid demand from international markets.
2.1.35. In terms of composition, the share of MMF based fabrics (100% Non cotton and 50% of blended
fabrics) in total fabric production has contracted from 47% in FY05 to 44.1% in FY09, while the share
of cotton based fabrics has increased from 46.2% to 49.6% in the same period.
Exhibit 2.1.17: Production of MMF fabrics in India
133
2.1.36. Major items of MMF produced in the country are sarees, dress materials, shirting, suitings, home
textiles etc. In fact, 90% of the total sarees are now made of MMF. Cotton sarees are pre-dominantly
made in Handloom sector.
2.1.37. MMF textiles are cheaper vis a vis cotton and easy to maintain. Therefore, MMF fabrics and garments
are consumed mostly in rural, semi-urban and lower income segments in urban areas. There are
some local brands famous in the semi-urban, rural areas like Kumar, Cambridge etc. which enjoy
huge market share. In India, tailored garments have a huge market share and these are pre-
dominantly MMF fabrics based. The major MMF garment producing centres in the country are
Kolkata, Delhi and Indore.
2.1.38. There is a perception that in the domestic market cotton garments are predominant, but this not the
case. MMF products are predominantly consumed in the domestic market. MMF garments are
predominant to the extent of 65% in the domestic market, while in the export market cotton garments
are predominant to with over 80% share. The issues and concerns emanating out of imbalanced fibre
based T&G portfolio in India’s exports basket are discussed in detail in Chapter 3.
FUTURE DEMAND FOR MMF
2.1.39. Currently, India has excess capacities for many man-made fibres/ filament yarns and these are
adequate to meet the current and near future demand for man-made fibres. However, given the
changing consumer pattern in favour of man-made fibre based textiles, there is a need to assess the
medium term and long-term demand for man-made fibres in India. The demand for man-made fibres
depends upon the demand for yarns and fabrics, which in turn depends upon the consumption of
finished textiles viz. apparel and made-ups. Thus, in order to determine the future requirements for
man-made fibres/ filament yarns, we first need to assess demand for fabrics and finished textiles
made from man-made fibres, both for the domestic market as well as exports.
2.1.40. A top-down approach has been followed to determine the demand for man-made fibres in FY15 and
FY20. We have considered three scenarios, namely GDP growing at 7%, 8% and 9% respectively for
the next ten years. The share of private final consumption expenditure is taken as 67%, in line with
the average share over the past five years. The Eleventh five year plan report of the planning
commission for Textiles and Garments considers the share of textiles and clothing in PFCE to be
around 5.5% for FY08. It has been observed that over the past few years, the relative share of textiles
and clothing in total PFCE has come down due to increased private expenditure on transport and
communication, education, recreation, etc. Thus, we have considered the share of textiles and
clothing in the PFCE to be 5.3% for FY15 and 5.1% for FY20.
134
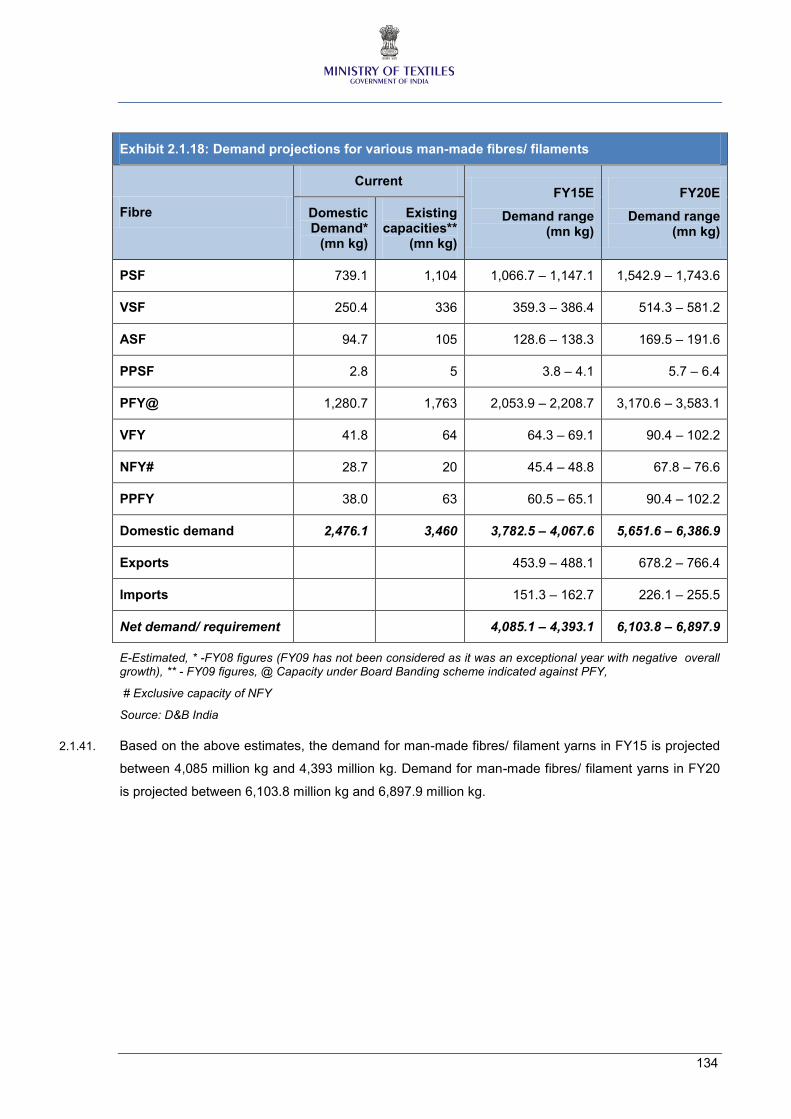
Exhibit 2.1.18: Demand projections for various man-made fibres/ filaments
Fibre
Current FY15E
Demand range (mn kg)
FY20E
Demand range (mn kg)
Domestic Demand*
(mn kg)
Existing capacities**
(mn kg)
PSF 739.1 1,104 1,066.7 – 1,147.1 1,542.9 – 1,743.6
VSF 250.4 336 359.3 – 386.4 514.3 – 581.2
ASF 94.7 105 128.6 – 138.3 169.5 – 191.6
PPSF 2.8 5 3.8 – 4.1 5.7 – 6.4
PFY@ 1,280.7 1,763 2,053.9 – 2,208.7 3,170.6 – 3,583.1
VFY 41.8 64 64.3 – 69.1 90.4 – 102.2
NFY# 28.7 20 45.4 – 48.8 67.8 – 76.6
PPFY 38.0 63 60.5 – 65.1 90.4 – 102.2
Domestic demand 2,476.1 3,460 3,782.5 – 4,067.6 5,651.6 – 6,386.9
Exports 453.9 – 488.1 678.2 – 766.4
Imports 151.3 – 162.7 226.1 – 255.5
Net demand/ requirement 4,085.1 – 4,393.1 6,103.8 – 6,897.9
E-Estimated, * -FY08 figures (FY09 has not been considered as it was an exceptional year with negative overall growth), ** - FY09 figures, @ Capacity under Board Banding scheme indicated against PFY,
# Exclusive capacity of NFY
Source: D&B India
2.1.41. Based on the above estimates, the demand for man-made fibres/ filament yarns in FY15 is projected
between 4,085 million kg and 4,393 million kg. Demand for man-made fibres/ filament yarns in FY20
is projected between 6,103.8 million kg and 6,897.9 million kg.
135
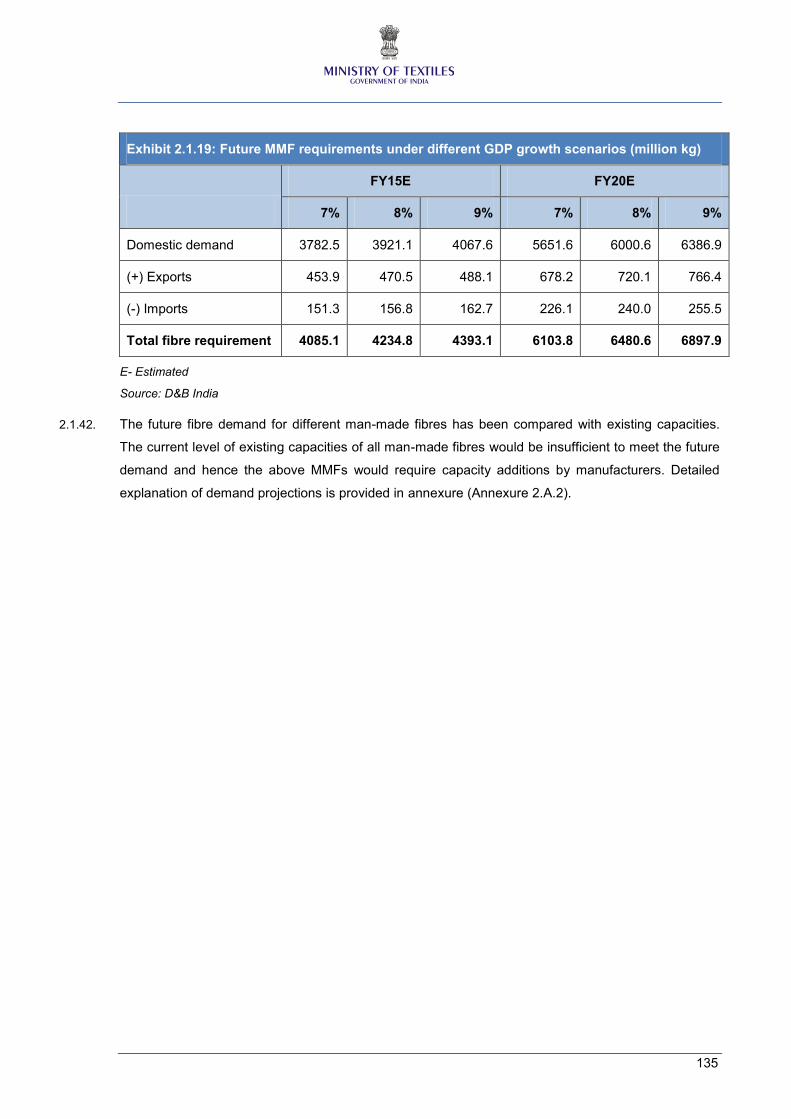
Exhibit 2.1.19: Future MMF requirements under different GDP growth scenarios (million kg)
FY15E FY20E
7% 8% 9% 7% 8% 9%
Domestic demand 3782.5 3921.1 4067.6 5651.6 6000.6 6386.9
(+) Exports 453.9 470.5 488.1 678.2 720.1 766.4
(-) Imports 151.3 156.8 162.7 226.1 240.0 255.5
Total fibre requirement 4085.1 4234.8 4393.1 6103.8 6480.6 6897.9
E- Estimated
Source: D&B India
2.1.42. The future fibre demand for different man-made fibres has been compared with existing capacities.
The current level of existing capacities of all man-made fibres would be insufficient to meet the future
demand and hence the above MMFs would require capacity additions by manufacturers. Detailed
explanation of demand projections is provided in annexure (Annexure 2.A.2).
136
2.2. GLOBAL SCENARIO
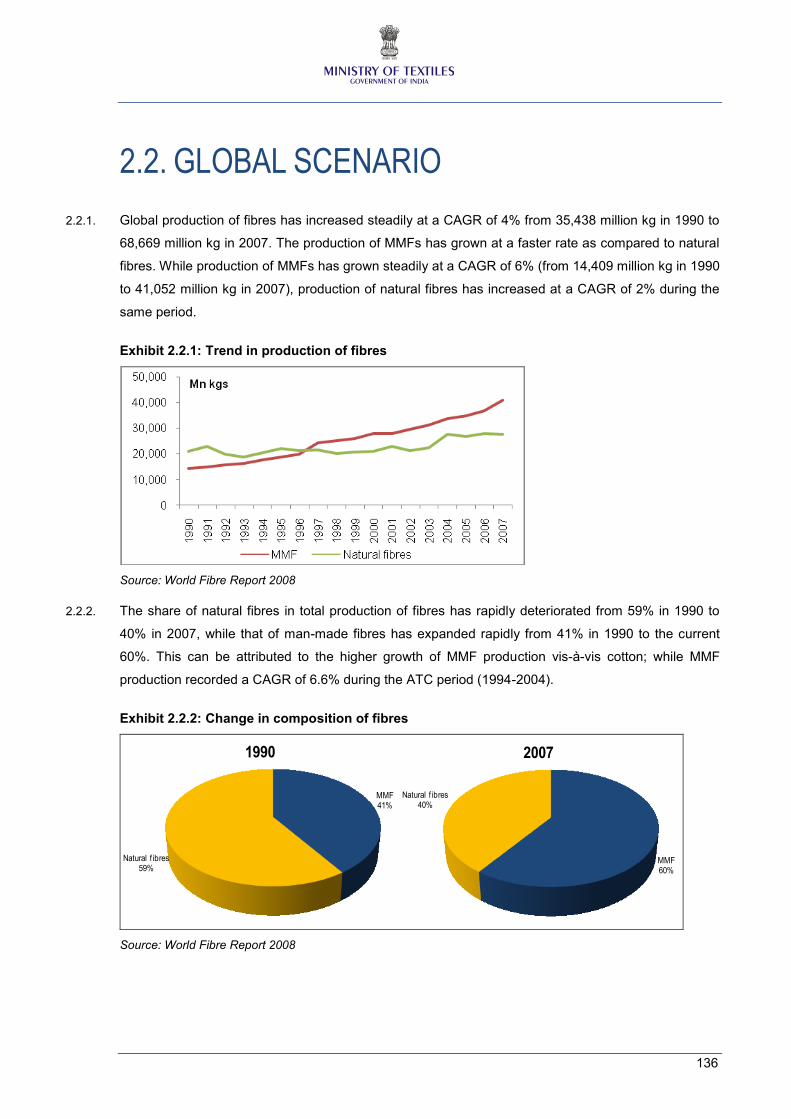
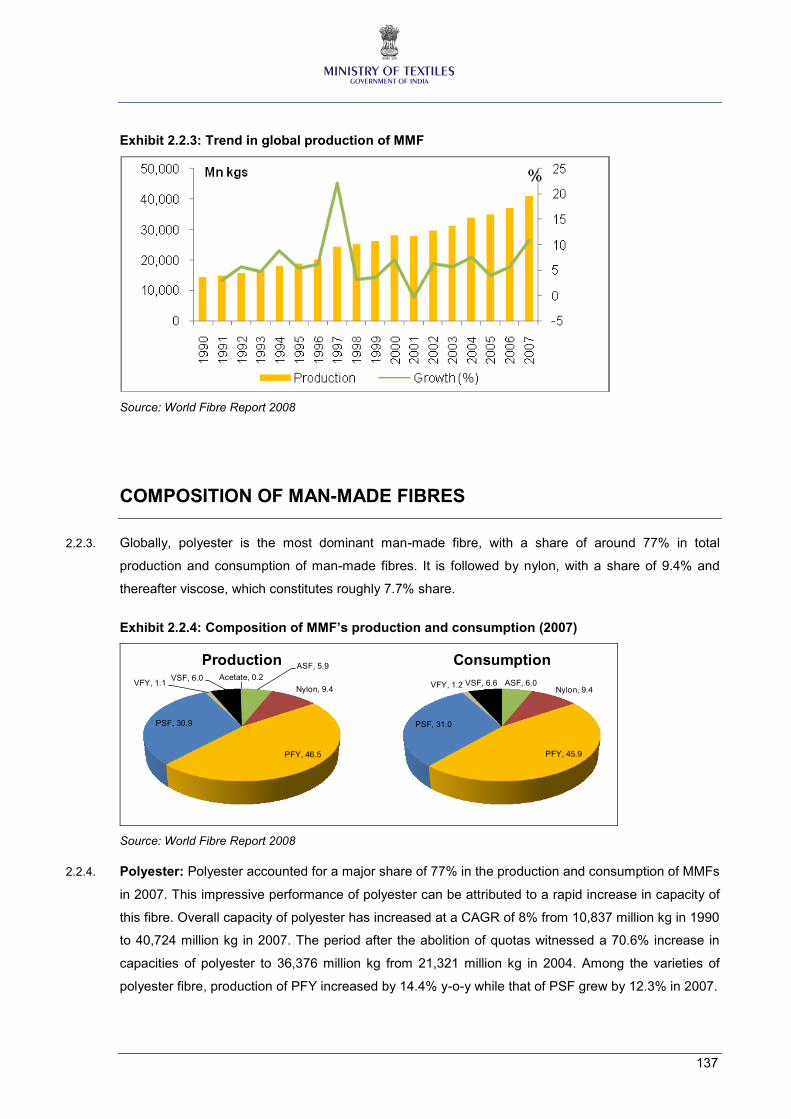
2.2.1. Global production of fibres has increased steadily at a CAGR of 4% from 35,438 million kg in 1990 to
68,669 million kg in 2007. The production of MMFs has grown at a faster rate as compared to natural
fibres. While production of MMFs has grown steadily at a CAGR of 6% (from 14,409 million kg in 1990
to 41,052 million kg in 2007), production of natural fibres has increased at a CAGR of 2% during the
same period.
Exhibit 2.2.1: Trend in production of fibres
Source: World Fibre Report 2008
2.2.2. The share of natural fibres in total production of fibres has rapidly deteriorated from 59% in 1990 to
40% in 2007, while that of man-made fibres has expanded rapidly from 41% in 1990 to the current
60%. This can be attributed to the higher growth of MMF production vis-à-vis cotton; while MMF
production recorded a CAGR of 6.6% during the ATC period (1994-2004).
Exhibit 2.2.2: Change in composition of fibres
MMF41%
Natural f ibres59%
1990
MMF60%
Natural f ibres40%
2007
Source: World Fibre Report 2008
137
Exhibit 2.2.3: Trend in global production of MMF
Source: World Fibre Report 2008
COMPOSITION OF MAN-MADE FIBRES
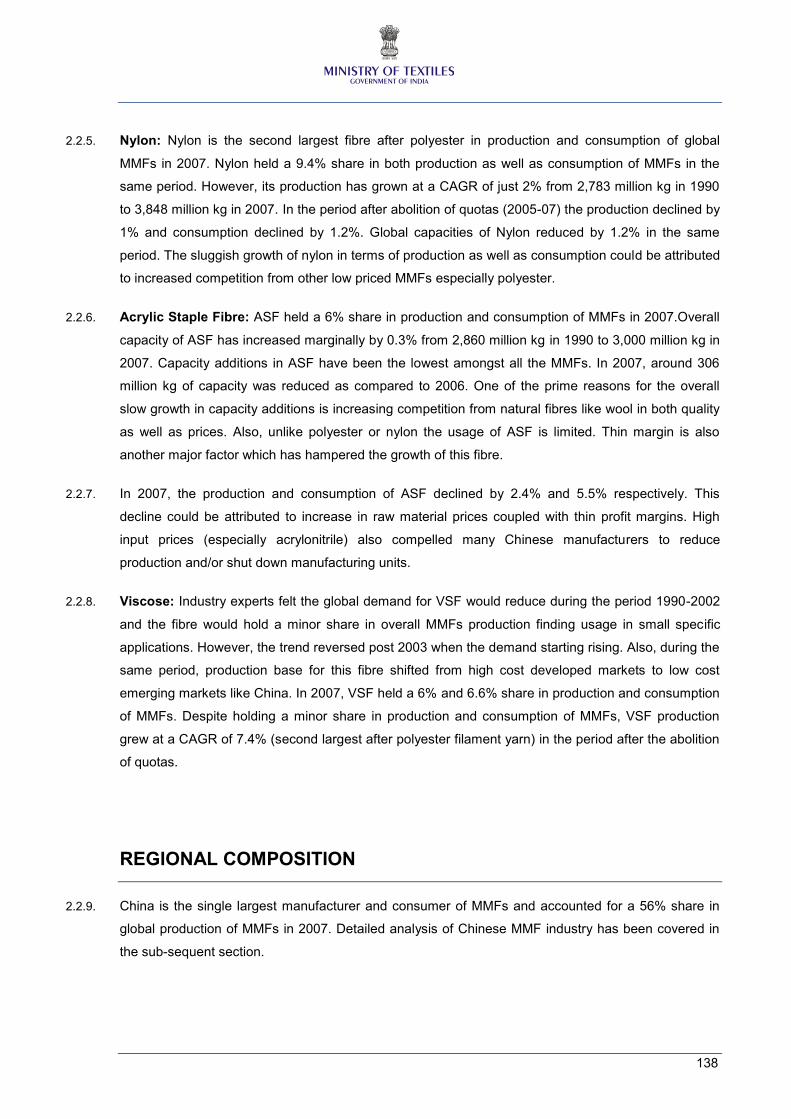
2.2.3. Globally, polyester is the most dominant man-made fibre, with a share of around 77% in total
production and consumption of man-made fibres. It is followed by nylon, with a share of 9.4% and
thereafter viscose, which constitutes roughly 7.7% share.
Exhibit 2.2.4: Composition of MMF’s production and consumption (2007)
ASF, 5.9
Nylon, 9.4
PFY, 46.5
PSF, 30.9
VFY, 1.1VSF, 6.0 Acetate, 0.2
Production
ASF, 6.0Nylon, 9.4
PFY, 45.9
PSF, 31.0
VFY, 1.2 VSF, 6.6
Consumption
Source: World Fibre Report 2008
2.2.4. Polyester: Polyester accounted for a major share of 77% in the production and consumption of MMFs
in 2007. This impressive performance of polyester can be attributed to a rapid increase in capacity of
this fibre. Overall capacity of polyester has increased at a CAGR of 8% from 10,837 million kg in 1990
to 40,724 million kg in 2007. The period after the abolition of quotas witnessed a 70.6% increase in
capacities of polyester to 36,376 million kg from 21,321 million kg in 2004. Among the varieties of
polyester fibre, production of PFY increased by 14.4% y-o-y while that of PSF grew by 12.3% in 2007.
138
2.2.5. Nylon: Nylon is the second largest fibre after polyester in production and consumption of global
MMFs in 2007. Nylon held a 9.4% share in both production as well as consumption of MMFs in the
same period. However, its production has grown at a CAGR of just 2% from 2,783 million kg in 1990
to 3,848 million kg in 2007. In the period after abolition of quotas (2005-07) the production declined by
1% and consumption declined by 1.2%. Global capacities of Nylon reduced by 1.2% in the same
period. The sluggish growth of nylon in terms of production as well as consumption could be attributed
to increased competition from other low priced MMFs especially polyester.
2.2.6. Acrylic Staple Fibre: ASF held a 6% share in production and consumption of MMFs in 2007.Overall
capacity of ASF has increased marginally by 0.3% from 2,860 million kg in 1990 to 3,000 million kg in
2007. Capacity additions in ASF have been the lowest amongst all the MMFs. In 2007, around 306
million kg of capacity was reduced as compared to 2006. One of the prime reasons for the overall
slow growth in capacity additions is increasing competition from natural fibres like wool in both quality
as well as prices. Also, unlike polyester or nylon the usage of ASF is limited. Thin margin is also
another major factor which has hampered the growth of this fibre.
2.2.7. In 2007, the production and consumption of ASF declined by 2.4% and 5.5% respectively. This
decline could be attributed to increase in raw material prices coupled with thin profit margins. High
input prices (especially acrylonitrile) also compelled many Chinese manufacturers to reduce
production and/or shut down manufacturing units.
2.2.8. Viscose: Industry experts felt the global demand for VSF would reduce during the period 1990-2002
and the fibre would hold a minor share in overall MMFs production finding usage in small specific
applications. However, the trend reversed post 2003 when the demand starting rising. Also, during the
same period, production base for this fibre shifted from high cost developed markets to low cost
emerging markets like China. In 2007, VSF held a 6% and 6.6% share in production and consumption
of MMFs. Despite holding a minor share in production and consumption of MMFs, VSF production
grew at a CAGR of 7.4% (second largest after polyester filament yarn) in the period after the abolition
of quotas.
REGIONAL COMPOSITION
2.2.9. China is the single largest manufacturer and consumer of MMFs and accounted for a 56% share in
global production of MMFs in 2007. Detailed analysis of Chinese MMF industry has been covered in
the sub-sequent section.
139
Exhibit 2.2.5: Major producer countries of MMF (2007)
Fibre Country
PFY China, India, Taiwan, South Korea, Indonesia
PSF China, India, USA, Pakistan, South Korea
Nylon China, USA, Taiwan, South Korea, Germany
VSF China, Indonesia, India, Taiwan, Thailand
ASF China, Turkey, Japan, Germany, Taiwan
VFY China, India, Japan, USA, Czech Republic
Acetate USA, Japan, Spain
Source: World Fibre Report 2008
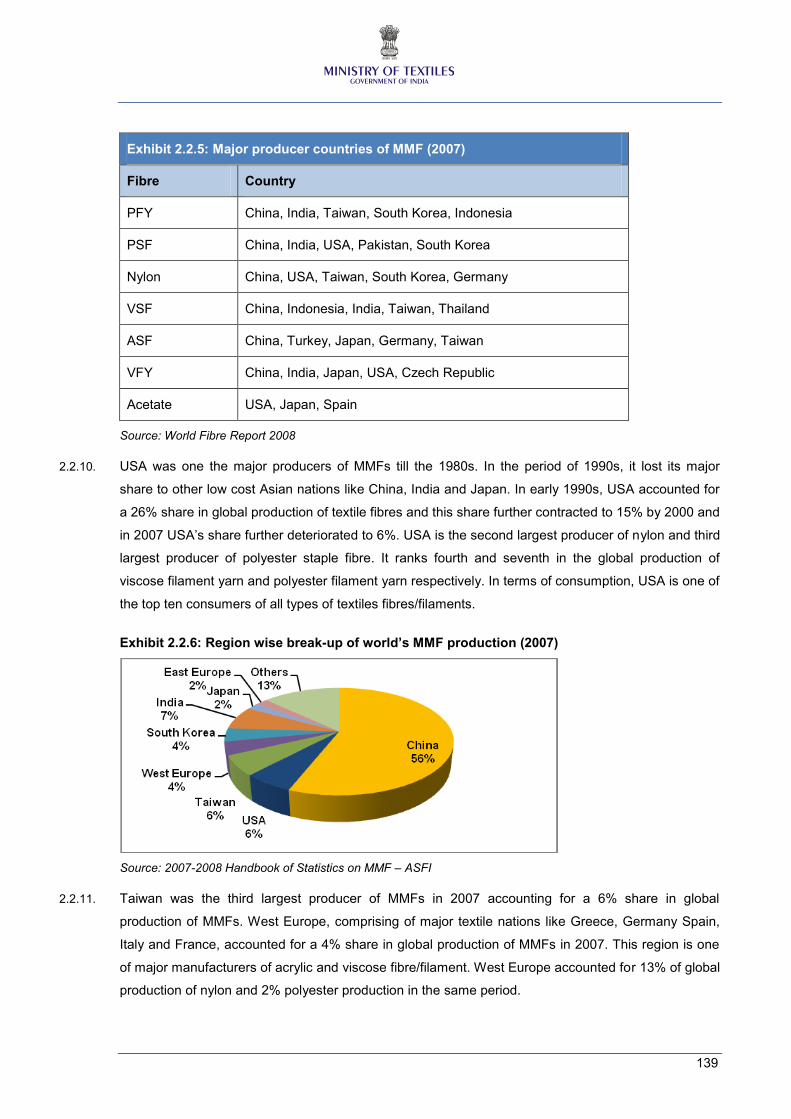
2.2.10. USA was one the major producers of MMFs till the 1980s. In the period of 1990s, it lost its major
share to other low cost Asian nations like China, India and Japan. In early 1990s, USA accounted for
a 26% share in global production of textile fibres and this share further contracted to 15% by 2000 and
in 2007 USA’s share further deteriorated to 6%. USA is the second largest producer of nylon and third
largest producer of polyester staple fibre. It ranks fourth and seventh in the global production of
viscose filament yarn and polyester filament yarn respectively. In terms of consumption, USA is one of
the top ten consumers of all types of textiles fibres/filaments.
Exhibit 2.2.6: Region wise break-up of world’s MMF production (2007)
Source: 2007-2008 Handbook of Statistics on MMF – ASFI
2.2.11. Taiwan was the third largest producer of MMFs in 2007 accounting for a 6% share in global
production of MMFs. West Europe, comprising of major textile nations like Greece, Germany Spain,
Italy and France, accounted for a 4% share in global production of MMFs in 2007. This region is one
of major manufacturers of acrylic and viscose fibre/filament. West Europe accounted for 13% of global
production of nylon and 2% polyester production in the same period.
140
2.2.12. South Korea is the fourth largest producer of nylon and polyester filament yarn, fifth largest
manufacturer of polyester staple fibre and sixth largest producer of viscose filament yarn. The region
accounted for a 4% share in global production of MMFs in 2007.
2.2.13. Japan, as per industry experts, is phasing out its production of MMFs. In early 1990, Japan accounted
for 12% share in global production of MMFs and this share contracted to 5% by 2000. Japan relies on
imports for its demand for MMFs. Despite Japan’s share fast contracting in supply of MMFs, the
regions remains one of the top ten suppliers and consumer of many MMFs. The region is third largest
producer of acrylic staple fibre and viscose filament yarn, sixth largest producer of viscose staple
fibre, eight largest in nylon, ninth largest producer of polyester staple fibre and tenth largest
manufacturer of polyester filament yarn.
2.2.14. The dynamics of man-made fibre industry for major countries and their policies are discussed in detail
in the annexure (Annexure 2.A.1).
141
2.3. ISSUES AND CONCERNS
EXCISE DUTY ANOMALIES
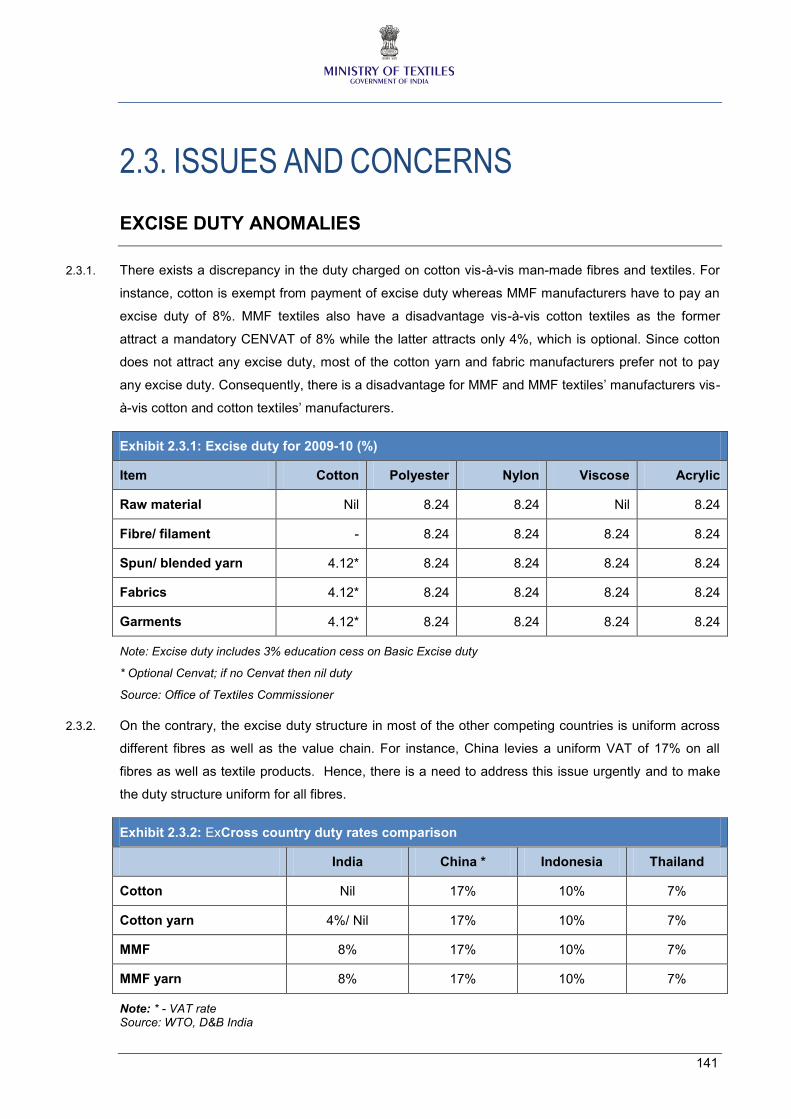
2.3.1. There exists a discrepancy in the duty charged on cotton vis-à-vis man-made fibres and textiles. For
instance, cotton is exempt from payment of excise duty whereas MMF manufacturers have to pay an
excise duty of 8%. MMF textiles also have a disadvantage vis-à-vis cotton textiles as the former
attract a mandatory CENVAT of 8% while the latter attracts only 4%, which is optional. Since cotton
does not attract any excise duty, most of the cotton yarn and fabric manufacturers prefer not to pay
any excise duty. Consequently, there is a disadvantage for MMF and MMF textiles’ manufacturers vis-
à-vis cotton and cotton textiles’ manufacturers.
Exhibit 2.3.1: Excise duty for 2009-10 (%)
Item Cotton Polyester Nylon Viscose Acrylic
Raw material Nil 8.24 8.24 Nil 8.24
Fibre/ filament - 8.24 8.24 8.24 8.24
Spun/ blended yarn 4.12* 8.24 8.24 8.24 8.24
Fabrics 4.12* 8.24 8.24 8.24 8.24
Garments 4.12* 8.24 8.24 8.24 8.24
Note: Excise duty includes 3% education cess on Basic Excise duty
* Optional Cenvat; if no Cenvat then nil duty
Source: Office of Textiles Commissioner
2.3.2. On the contrary, the excise duty structure in most of the other competing countries is uniform across
different fibres as well as the value chain. For instance, China levies a uniform VAT of 17% on all
fibres as well as textile products. Hence, there is a need to address this issue urgently and to make
the duty structure uniform for all fibres. 20
Exhibit 2.3.2: ExCross country duty rates comparison
India China * Indonesia Thailand
Cotton Nil 17% 10% 7%
Cotton yarn 4%/ Nil 17% 10% 7%
MMF 8% 17% 10% 7%
MMF yarn 8% 17% 10% 7%
Note: * - VAT rate Source: WTO, D&B India
142
CUSTOMS DUTY ANOMALIES
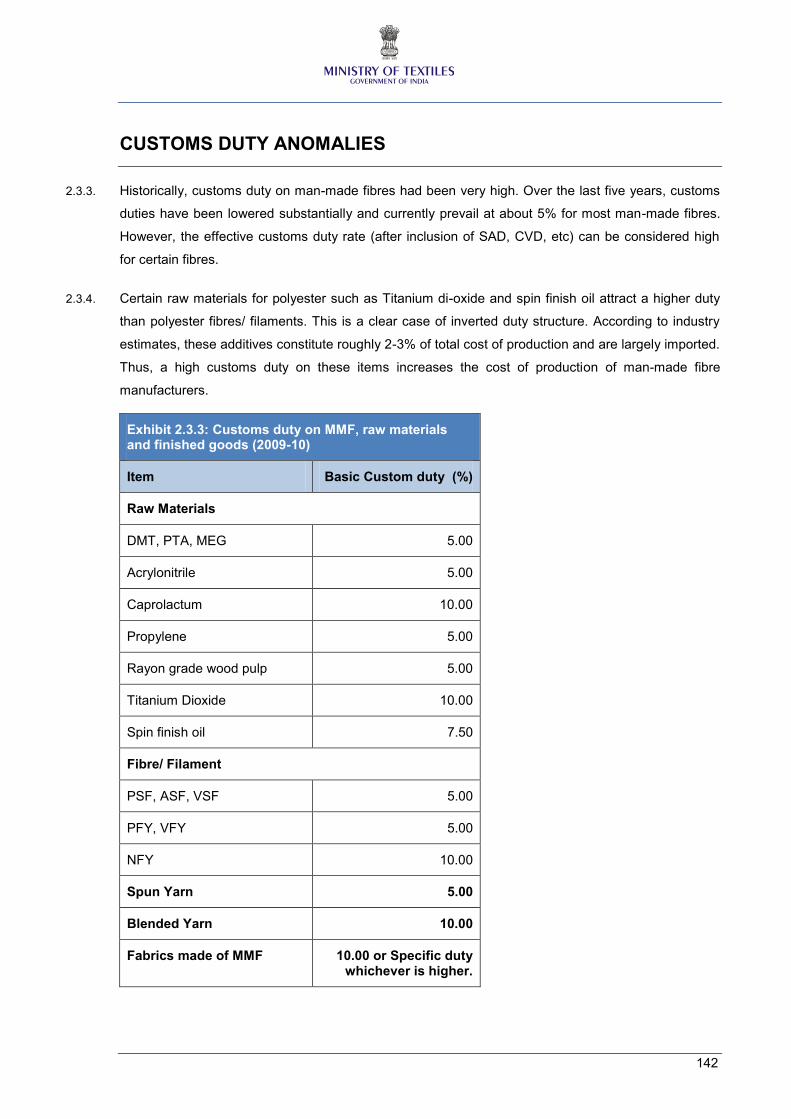
2.3.3. Historically, customs duty on man-made fibres had been very high. Over the last five years, customs
duties have been lowered substantially and currently prevail at about 5% for most man-made fibres.
However, the effective customs duty rate (after inclusion of SAD, CVD, etc) can be considered high
for certain fibres.
2.3.4. Certain raw materials for polyester such as Titanium di-oxide and spin finish oil attract a higher duty
than polyester fibres/ filaments. This is a clear case of inverted duty structure. According to industry
estimates, these additives constitute roughly 2-3% of total cost of production and are largely imported.
Thus, a high customs duty on these items increases the cost of production of man-made fibre
manufacturers.
Exhibit 2.3.3: Customs duty on MMF, raw materials and finished goods (2009-10)
Item Basic Custom duty (%)
Raw Materials
DMT, PTA, MEG 5.00
Acrylonitrile 5.00
Caprolactum 10.00
Propylene 5.00
Rayon grade wood pulp 5.00
Titanium Dioxide 10.00
Spin finish oil 7.50
Fibre/ Filament
PSF, ASF, VSF 5.00
PFY, VFY 5.00
NFY 10.00
Spun Yarn 5.00
Blended Yarn 10.00
Fabrics made of MMF 10.00 or Specific duty whichever is higher.
143
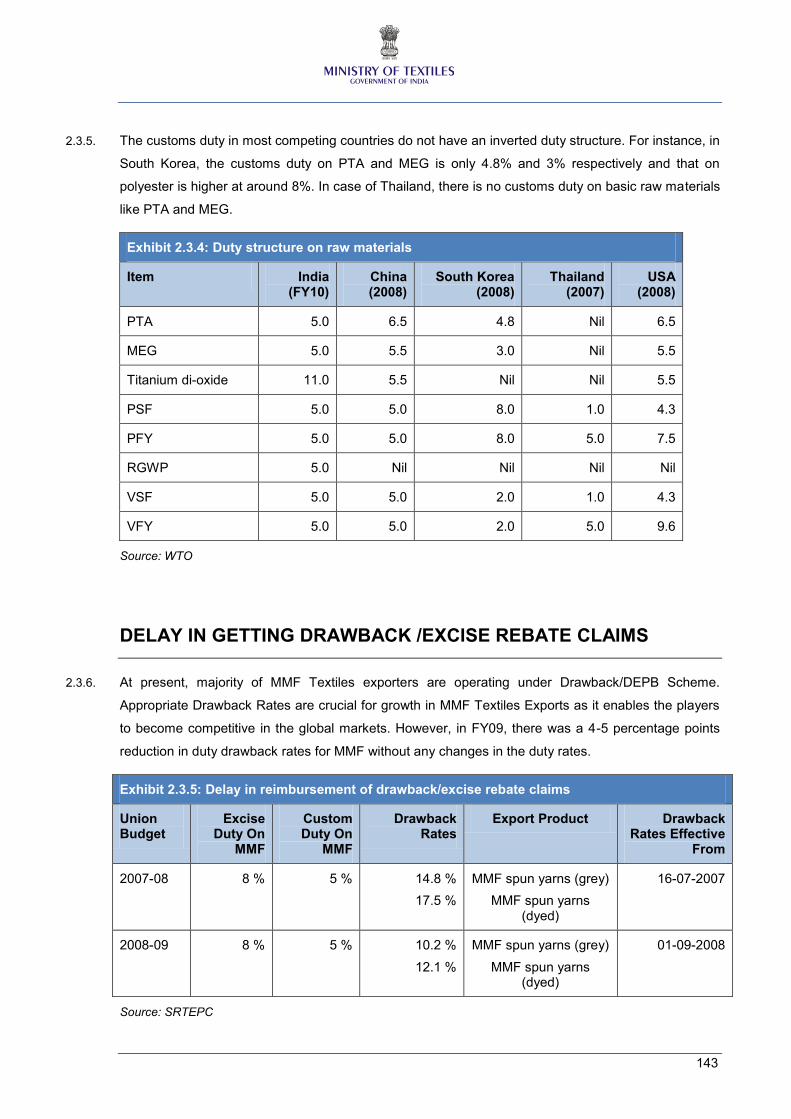
2.3.5. The customs duty in most competing countries do not have an inverted duty structure. For instance, in
South Korea, the customs duty on PTA and MEG is only 4.8% and 3% respectively and that on
polyester is higher at around 8%. In case of Thailand, there is no customs duty on basic raw materials
like PTA and MEG.
Exhibit 2.3.4: Duty structure on raw materials
Item India (FY10)
China (2008)
South Korea (2008)
Thailand (2007)
USA (2008)
PTA 5.0 6.5 4.8 Nil 6.5
MEG 5.0 5.5 3.0 Nil 5.5
Titanium di-oxide 11.0 5.5 Nil Nil 5.5
PSF 5.0 5.0 8.0 1.0 4.3
PFY 5.0 5.0 8.0 5.0 7.5
RGWP 5.0 Nil Nil Nil Nil
VSF 5.0 5.0 2.0 1.0 4.3
VFY 5.0 5.0 2.0 5.0 9.6
Source: WTO
DELAY IN GETTING DRAWBACK /EXCISE REBATE CLAIMS
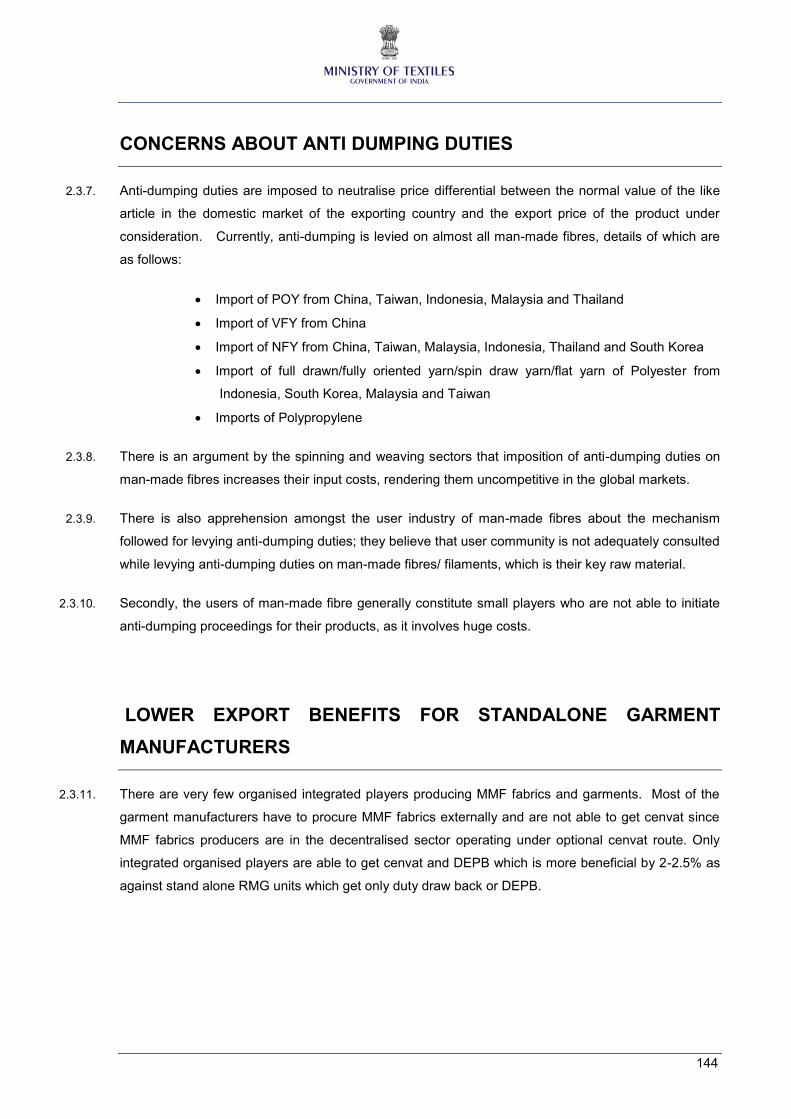
2.3.6. At present, majority of MMF Textiles exporters are operating under Drawback/DEPB Scheme.
Appropriate Drawback Rates are crucial for growth in MMF Textiles Exports as it enables the players
to become competitive in the global markets. However, in FY09, there was a 4-5 percentage points
reduction in duty drawback rates for MMF without any changes in the duty rates.
Exhibit 2.3.5: Delay in reimbursement of drawback/excise rebate claims
Union Budget
Excise Duty On
MMF
Custom Duty On
MMF
Drawback Rates
Export Product Drawback Rates Effective
From
2007-08 8 % 5 % 14.8 %
17.5 %
MMF spun yarns (grey)
MMF spun yarns (dyed)
16-07-2007
2008-09 8 % 5 % 10.2 %
12.1 %
MMF spun yarns (grey)
MMF spun yarns (dyed)
01-09-2008
Source: SRTEPC
144
CONCERNS ABOUT ANTI DUMPING DUTIES
2.3.7. Anti-dumping duties are imposed to neutralise price differential between the normal value of the like
article in the domestic market of the exporting country and the export price of the product under
consideration. Currently, anti-dumping is levied on almost all man-made fibres, details of which are
as follows:
Import of POY from China, Taiwan, Indonesia, Malaysia and Thailand
Import of VFY from China
Import of NFY from China, Taiwan, Malaysia, Indonesia, Thailand and South Korea
Import of full drawn/fully oriented yarn/spin draw yarn/flat yarn of Polyester from
Indonesia, South Korea, Malaysia and Taiwan
Imports of Polypropylene
2.3.8. There is an argument by the spinning and weaving sectors that imposition of anti-dumping duties on
man-made fibres increases their input costs, rendering them uncompetitive in the global markets.
2.3.9. There is also apprehension amongst the user industry of man-made fibres about the mechanism
followed for levying anti-dumping duties; they believe that user community is not adequately consulted
while levying anti-dumping duties on man-made fibres/ filaments, which is their key raw material.
2.3.10. Secondly, the users of man-made fibre generally constitute small players who are not able to initiate
anti-dumping proceedings for their products, as it involves huge costs.
LOWER EXPORT BENEFITS FOR STANDALONE GARMENT
MANUFACTURERS
2.3.11. There are very few organised integrated players producing MMF fabrics and garments. Most of the
garment manufacturers have to procure MMF fabrics externally and are not able to get cenvat since
MMF fabrics producers are in the decentralised sector operating under optional cenvat route. Only
integrated organised players are able to get cenvat and DEPB which is more beneficial by 2-2.5% as
against stand alone RMG units which get only duty draw back or DEPB.
145
CONCERNS ABOUT GST
2.3.12. The Goods and Services Tax (GST) is to be introduced in the country from April 2010. It would be of
similar nature of VAT but would include other indirect taxes such as Cenvat, service tax. It would be
dual GST comprising of Central GST and State GST. GST would be destination based, while sales
tax and VAT for inter-state transactions are origin-based. On inter-state transactions of goods &
services, IGST (Integrated GST) would be applicable which would be equal to C-GST and S-
CST. The inter-state transactions would include sales of goods and services and inter-state depot
transfer of goods.
2.3.13. The textiles industry involves a lot of inter-state transfers especially at the fabric stage. Due to long
supply chain in the textile industry involving traders in various cities, towns, etc, the inter state
transactions are likely to take place among the organised players who are above the threshold limit for
GST exemption and small decentralised traders who are exempted from payment of GST.
Consequently, the regular payee (one above threshold limit) would not get any credit for purchases
from small decentralised trader but shall have to pay full duty on the sale price. Thus, the tax will
multiply and the purpose of VAT principle would be broken. This would have serious cost implications
on the exporters.
NIL INDIGENOUS PRODUCTION OF SPECIALISED MMF
2.3.14. MMF like acetate, cuprammonium filament yarn, nylon 66, nylon 11, spandex, PVA fiber and filament
yarn, which are required for manufacture of high end fashion garments, lingerie, swimming costumes,
Stockings, high end ladies garments are not produced indigenously and have to be imported by the
weavers. Thus, there is a need to have policy incentives in place to encourage domestic production of
such fibres in India.
LIMITED NUMBER OF MMF PLAYERS
2.3.15. There are only a few big players manufacturing man-made fibres in India. The industry follows a
pricing policy on import parity basis at landed cost. User industry has submitted that MMF producers
export man-made fibres at lower prices than in the domestic market. This submission is supported by
SRTEPC exports data analysed by FIASWI in respect of polyester fibre and yarn.
146
Exhibit 2.3.6: Share of manufacturers in MMF production
Fibre Manufacturer Installed capacity in
T.P.A (as of 31/3/2009) Production M.T.
(FY09P) % share
(Production)
VSF
Grasim Industries
Others
Total
359,975
58,700
418,675
232,746
-
232,746
100.0
-
100.0
PSF
Reliance Industries
Indo Rama Synthetics
JCT Fibre
Others
Total
550,000
263,550
128,612
240,568
1,182,730
478,959
136,440
55,616
79,094
750,109
63.9
18.2
7.4
10.5
100.0
ASF
Indian Acrylic
Pashupati Acrylon
Vardhman Acrylics
Others
Total
45,000
30,000
18,000
60,000
153,000
34,310
26,512
18,690
-
79,512
43.2
33.3
23.5
-
100.0
PPSF
Zenith Fibre
Others
Total
3,900
4,800
8,700
3,430
-
3,430
100
-
100
VFY
Century Rayon
Indian Rayon Corporation
Kesoram Rayon
Others
Total
25,000
16,400
6,500
32,200
80,100
17,332
16,624
7,605
858
42,419
40.9
39.2
17.9
2.0
100.0
PFY
Reliance Industries
Indo Rama Synthetics
JBF Industries
Others
Total
670,900
259,000
144,000
939,588
2,013,488
639,973
210,092
139,552
342,471
1,332,088
48.0
15.8
10.5
25.7
100.0
NFY
Century Enka
JCT
Gujarat State Fertilizers
Others
Total
125,200
14,000
6,000
164,244
309,444
12,519
11,373
4,171
6
28,069
44.6
40.5
14.9
0.0
100.0
Source: Office of Textiles Commissioner
147
LACK OF COMPETITIVENESS IN EXPORTS
2.3.16. India is the second largest producer of man-made fibres in the world (World Fibre Report 2008) with
presence of large plants having state-of-the art technology. MMF textiles constitute almost two-third of
the domestic textile market. However, India’s share in global exports of value-added textiles of man-
made fibres is miniscule at around 2.25% in 2008 (India’s MMF exports were US$ 3.3 billion as
against global exports of US$ 146.7 billion). Further, while textiles made of man-made fibres
constitute around 63% of the world trade, it is mere 16.4% (FY09) in case of India as Indian textiles
exports are predominantly cotton based.
2.3.17. India’s total MMF textiles exports have risen at a CAGR of 15.6% during FY05 to FY09; however, the
growth has slowed down during the last fiscal, primarily due to slowdown in the global demand.
Exhibit 2.3.7: India’s MMF textile exports
Source: SRTEPC
2.3.18. During FY09, there has been a decline in exports of several MMF textiles, including majority of MMF
yarns, spun fabrics, viscose filament fabrics and blended fabrics like polyester viscose and polyester
cotton, MMF based furnishing articles, and also dress materials.
148
EXPORTS DISADVANTAGE AGAINST COTTON TEXTILES
2.3.19. Post dismantling of textile quotas in 2005, India has been able to increase its cotton textiles and
garments exports at a higher rate as against MMF textiles and garments. In case of value-added
textiles, India’s performance in cotton apparel has been better than that of MMF apparel.
Exhibit 2.3.8: Major suppliers of cotton apparels
World imports (US$ mn) 2005 2008 CAGR (%)
Cotton apparel Total imports 147,951.9 185,092.9 7.8
China 39,736.7 62,776.4 16.5
India 9,132.3 12,373.6 10.7
Bangladesh 8,323.7 14,470.1 20.2
Pakistan 2,495.5 3,129.0 7.8
Sri Lanka 2,116.3 2,846.0 10.4
Source: UN Comtrade
2.3.20. During 2005-2008, India has registered a CAGR of 10.7% in case of cotton apparel exports to the
world, higher than the average global growth of 7.8%. On the other hand, India’s exports of MMF
apparel have witnessed a decline from US$ 1.12 billion in 2005 to 1.08 billion in 2008, while average
annual global growth in MMF imports has been 6.9% during the same period.
Exhibit 2.3.9: Major suppliers of MMF apparels
World imports (US$ mn) 2005 2008 CAGR (%)
MMF apparel Total imports 45,883.7 56,093.4 6.9
China 20,289.2 27,853.9 11.1
India 1,123.3 1,076.5 -1.4
Taiwan 312.5 214.3 -11.8
Pakistan 127.2 127.4 0.0
Vietnam 1,643.3 2,678.5 17.7
Indonesia 1,375.8 1,483.8 2.6
Source: UN Comtrade
149
2.3.21. Indian MMF textiles have witnessed dismal performance in both US and EU markets. In the EU
market for MMF apparel, Vietnamese exporters have given serious competition to Indian exporters; in
2005, Vietnam’s MMF apparel exports to the EU were 12% lower than India’s exports, however by
2008, Vietnam’s exports have reached US$ 538 million, which is almost 40% higher than India’s MMF
apparel exports in that year. Chinese exports too have increased at over 13% CAGR in this market
during 2005-2008, while India has recorded a CAGR of only 3.9%. Consequently, India’s share in
MMF apparel imports of EU has declined from 3.9% in 2005 to 3.2% in 2008.
2.3.22. Similarly, in the US market too, India’s performance has been dismal due to which its share in MMF
apparel imports of the country has declined from 2.2% in 2005 to mere 1.7% in 2008. On the contrary,
China has seen a considerable jump in its share in the USA’s MMF apparel imports, from 32% in
2005 to almost 43% in 2008.
Exhibit 2.3.10: Major suppliers of cotton apparel to EU markets
EU imports (US$ mn) 2005 2008 CAGR (%)
Cotton apparel Total imports 29,193.5 42,955.2 13.7
China 7,475.5 15,016.5 26.2
India 2,789.8 4,151.6 14.2
Bangladesh 2,963.6 5,198.5 20.6
Pakistan 646.4 863.4 10.1
Sri Lanka 490.8 833.4 19.3
Source: UN Comtrade
Exhibit 2.3.11: Major suppliers of MMF apparel to EU markets
EU imports (US$ mn) 2005 2008 CAGR (%)
MMF apparel Total imports 8,950.1 11,892.9 9.9
China 4,496.3 6,502.4 13.1
India 342.6 384.5 3.9
Taiwan 32.9 23.4 -10.8
Pakistan 40.7 42.5 1.4
Vietnam 302.1 538.2 21.2
Indonesia 273.9 269.7 -0.5
Source: UN Comtrade
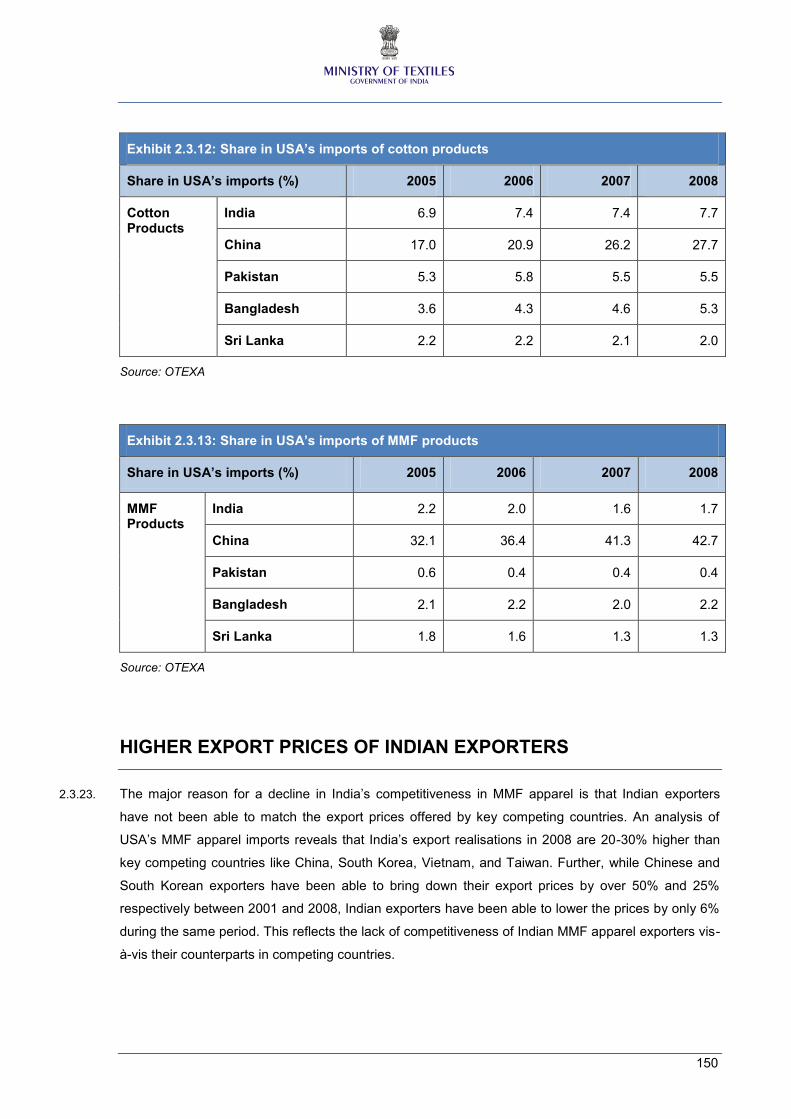
150
Exhibit 2.3.12: Share in USA’s imports of cotton products
Share in USA’s imports (%) 2005 2006 2007 2008
Cotton Products
India 6.9 7.4 7.4 7.7
China 17.0 20.9 26.2 27.7
Pakistan 5.3 5.8 5.5 5.5
Bangladesh 3.6 4.3 4.6 5.3
Sri Lanka 2.2 2.2 2.1 2.0
Source: OTEXA
Exhibit 2.3.13: Share in USA’s imports of MMF products
Share in USA’s imports (%) 2005 2006 2007 2008
MMF Products
India 2.2 2.0 1.6 1.7
China 32.1 36.4 41.3 42.7
Pakistan 0.6 0.4 0.4 0.4
Bangladesh 2.1 2.2 2.0 2.2
Sri Lanka 1.8 1.6 1.3 1.3
Source: OTEXA
HIGHER EXPORT PRICES OF INDIAN EXPORTERS
2.3.23. The major reason for a decline in India’s competitiveness in MMF apparel is that Indian exporters
have not been able to match the export prices offered by key competing countries. An analysis of
USA’s MMF apparel imports reveals that India’s export realisations in 2008 are 20-30% higher than
key competing countries like China, South Korea, Vietnam, and Taiwan. Further, while Chinese and
South Korean exporters have been able to bring down their export prices by over 50% and 25%
respectively between 2001 and 2008, Indian exporters have been able to lower the prices by only 6%
during the same period. This reflects the lack of competitiveness of Indian MMF apparel exporters vis-
à-vis their counterparts in competing countries.
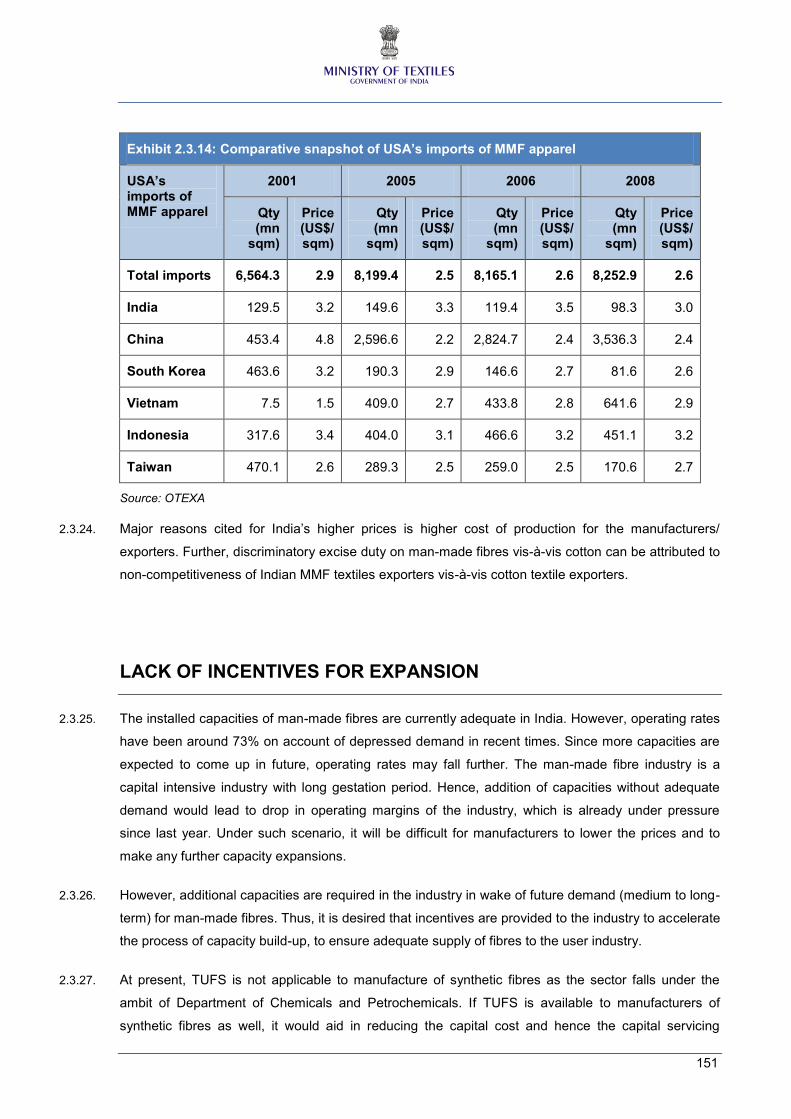
151
Exhibit 2.3.14: Comparative snapshot of USA’s imports of MMF apparel
USA’s imports of MMF apparel
2001 2005 2006 2008
Qty (mn
sqm)
Price (US$/ sqm)
Qty (mn
sqm)
Price (US$/ sqm)
Qty (mn
sqm)
Price (US$/ sqm)
Qty (mn
sqm)
Price (US$/ sqm)
Total imports 6,564.3 2.9 8,199.4 2.5 8,165.1 2.6 8,252.9 2.6
India 129.5 3.2 149.6 3.3 119.4 3.5 98.3 3.0
China 453.4 4.8 2,596.6 2.2 2,824.7 2.4 3,536.3 2.4
South Korea 463.6 3.2 190.3 2.9 146.6 2.7 81.6 2.6
Vietnam 7.5 1.5 409.0 2.7 433.8 2.8 641.6 2.9
Indonesia 317.6 3.4 404.0 3.1 466.6 3.2 451.1 3.2
Taiwan 470.1 2.6 289.3 2.5 259.0 2.5 170.6 2.7
Source: OTEXA
2.3.24. Major reasons cited for India’s higher prices is higher cost of production for the manufacturers/
exporters. Further, discriminatory excise duty on man-made fibres vis-à-vis cotton can be attributed to
non-competitiveness of Indian MMF textiles exporters vis-à-vis cotton textile exporters.
LACK OF INCENTIVES FOR EXPANSION
2.3.25. The installed capacities of man-made fibres are currently adequate in India. However, operating rates
have been around 73% on account of depressed demand in recent times. Since more capacities are
expected to come up in future, operating rates may fall further. The man-made fibre industry is a
capital intensive industry with long gestation period. Hence, addition of capacities without adequate
demand would lead to drop in operating margins of the industry, which is already under pressure
since last year. Under such scenario, it will be difficult for manufacturers to lower the prices and to
make any further capacity expansions.
2.3.26. However, additional capacities are required in the industry in wake of future demand (medium to long-
term) for man-made fibres. Thus, it is desired that incentives are provided to the industry to accelerate
the process of capacity build-up, to ensure adequate supply of fibres to the user industry.
2.3.27. At present, TUFS is not applicable to manufacture of synthetic fibres as the sector falls under the
ambit of Department of Chemicals and Petrochemicals. If TUFS is available to manufacturers of
synthetic fibres as well, it would aid in reducing the capital cost and hence the capital servicing
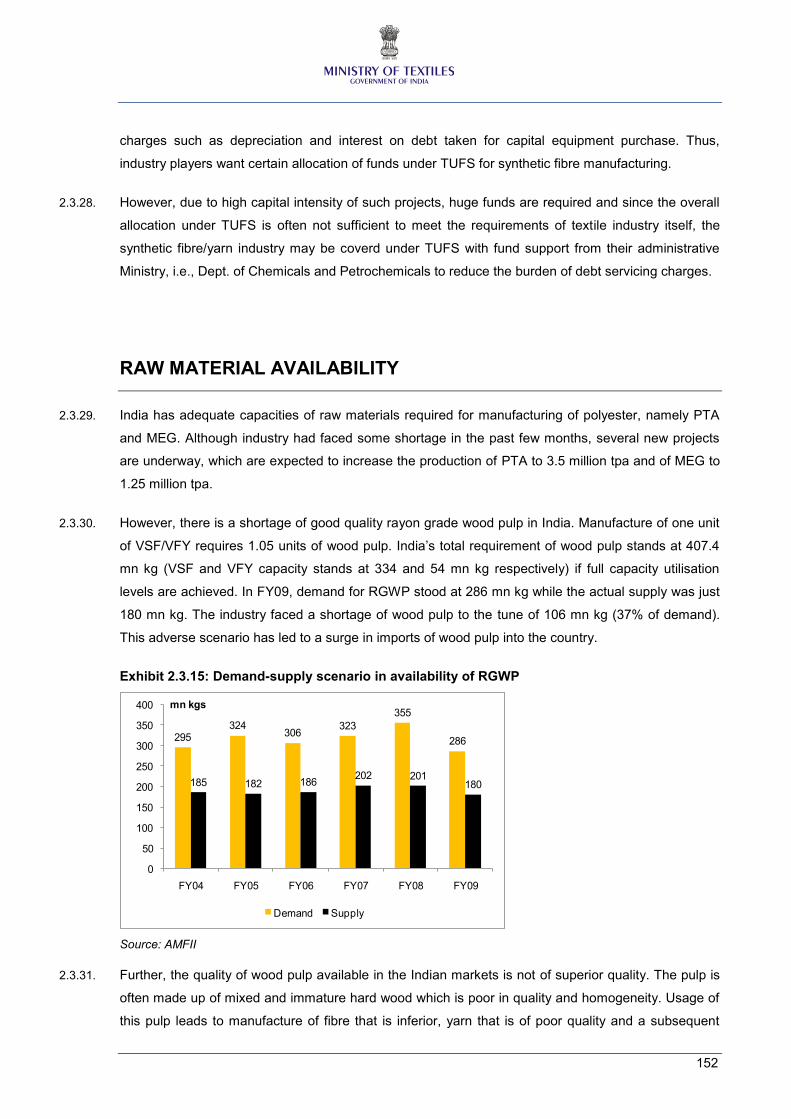
152
charges such as depreciation and interest on debt taken for capital equipment purchase. Thus,
industry players want certain allocation of funds under TUFS for synthetic fibre manufacturing.
2.3.28. However, due to high capital intensity of such projects, huge funds are required and since the overall
allocation under TUFS is often not sufficient to meet the requirements of textile industry itself, the
synthetic fibre/yarn industry may be coverd under TUFS with fund support from their administrative
Ministry, i.e., Dept. of Chemicals and Petrochemicals to reduce the burden of debt servicing charges.
RAW MATERIAL AVAILABILITY
2.3.29. India has adequate capacities of raw materials required for manufacturing of polyester, namely PTA
and MEG. Although industry had faced some shortage in the past few months, several new projects
are underway, which are expected to increase the production of PTA to 3.5 million tpa and of MEG to
1.25 million tpa.
2.3.30. However, there is a shortage of good quality rayon grade wood pulp in India. Manufacture of one unit
of VSF/VFY requires 1.05 units of wood pulp. India’s total requirement of wood pulp stands at 407.4
mn kg (VSF and VFY capacity stands at 334 and 54 mn kg respectively) if full capacity utilisation
levels are achieved. In FY09, demand for RGWP stood at 286 mn kg while the actual supply was just
180 mn kg. The industry faced a shortage of wood pulp to the tune of 106 mn kg (37% of demand).
This adverse scenario has led to a surge in imports of wood pulp into the country.
Exhibit 2.3.15: Demand-supply scenario in availability of RGWP
295324
306323
355
286
185 182 186202 201
180
0
50
100
150
200
250
300
350
400
FY04 FY05 FY06 FY07 FY08 FY09
mn kgs
Demand Supply
Source: AMFII
2.3.31. Further, the quality of wood pulp available in the Indian markets is not of superior quality. The pulp is
often made up of mixed and immature hard wood which is poor in quality and homogeneity. Usage of
this pulp leads to manufacture of fibre that is inferior, yarn that is of poor quality and a subsequent
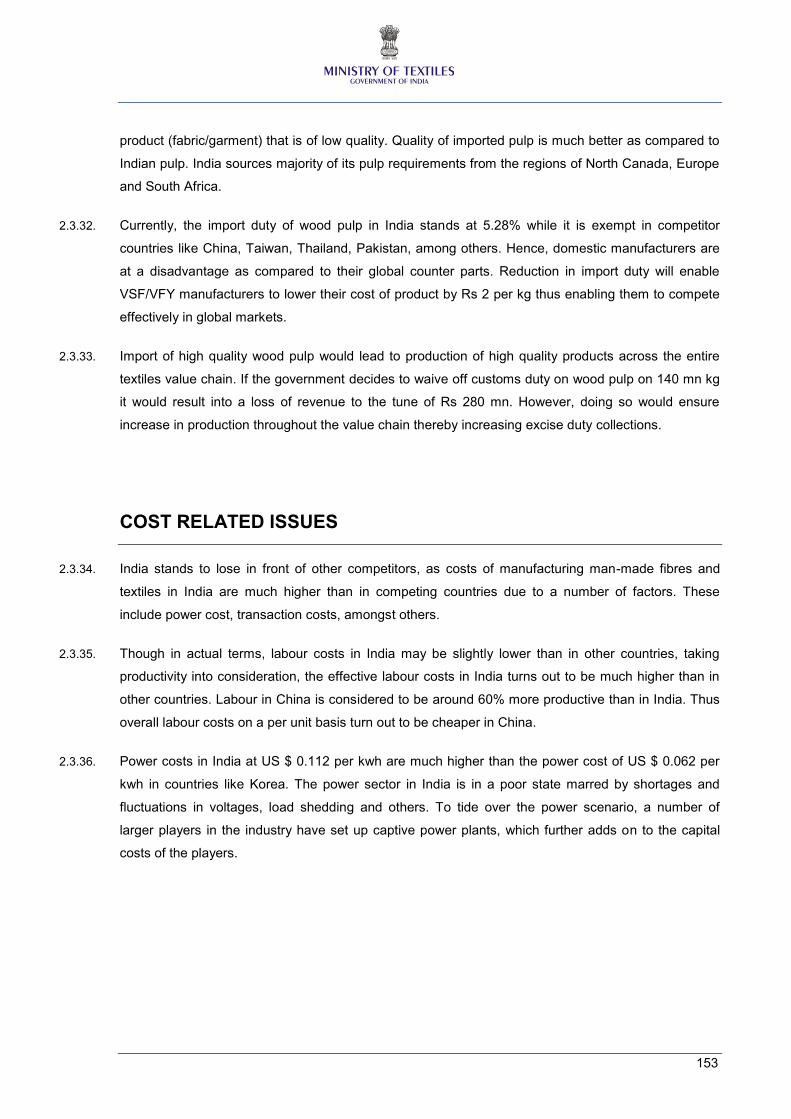
153
product (fabric/garment) that is of low quality. Quality of imported pulp is much better as compared to
Indian pulp. India sources majority of its pulp requirements from the regions of North Canada, Europe
and South Africa.
2.3.32. Currently, the import duty of wood pulp in India stands at 5.28% while it is exempt in competitor
countries like China, Taiwan, Thailand, Pakistan, among others. Hence, domestic manufacturers are
at a disadvantage as compared to their global counter parts. Reduction in import duty will enable
VSF/VFY manufacturers to lower their cost of product by Rs 2 per kg thus enabling them to compete
effectively in global markets.
2.3.33. Import of high quality wood pulp would lead to production of high quality products across the entire
textiles value chain. If the government decides to waive off customs duty on wood pulp on 140 mn kg
it would result into a loss of revenue to the tune of Rs 280 mn. However, doing so would ensure
increase in production throughout the value chain thereby increasing excise duty collections.
COST RELATED ISSUES
2.3.34. India stands to lose in front of other competitors, as costs of manufacturing man-made fibres and
textiles in India are much higher than in competing countries due to a number of factors. These
include power cost, transaction costs, amongst others.
2.3.35. Though in actual terms, labour costs in India may be slightly lower than in other countries, taking
productivity into consideration, the effective labour costs in India turns out to be much higher than in
other countries. Labour in China is considered to be around 60% more productive than in India. Thus
overall labour costs on a per unit basis turn out to be cheaper in China.
2.3.36. Power costs in India at US $ 0.112 per kwh are much higher than the power cost of US $ 0.062 per
kwh in countries like Korea. The power sector in India is in a poor state marred by shortages and
fluctuations in voltages, load shedding and others. To tide over the power scenario, a number of
larger players in the industry have set up captive power plants, which further adds on to the capital
costs of the players.
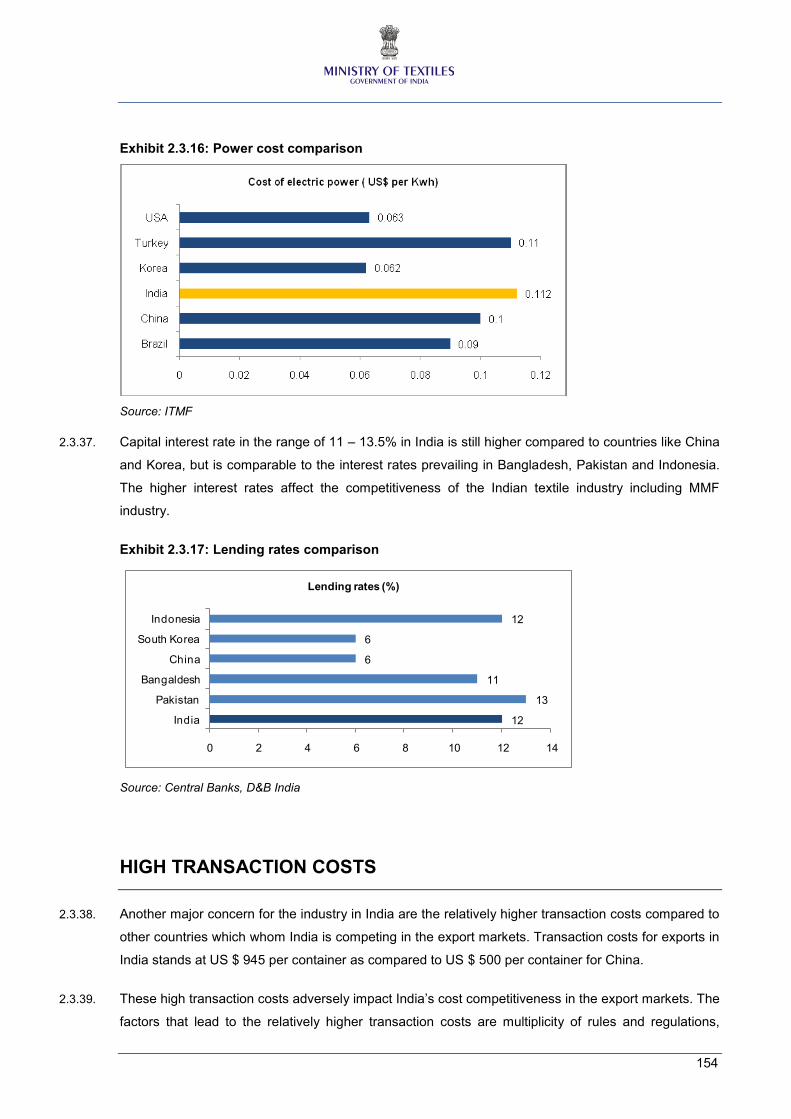
154
Exhibit 2.3.16: Power cost comparison
Source: ITMF
2.3.37. Capital interest rate in the range of 11 – 13.5% in India is still higher compared to countries like China
and Korea, but is comparable to the interest rates prevailing in Bangladesh, Pakistan and Indonesia.
The higher interest rates affect the competitiveness of the Indian textile industry including MMF
industry.
Exhibit 2.3.17: Lending rates comparison
12
13
11
6
6
12
0 2 4 6 8 10 12 14
India
Pakistan
Bangaldesh
China
South Korea
Indonesia
Lending rates (%)
Source: Central Banks, D&B India
HIGH TRANSACTION COSTS
2.3.38. Another major concern for the industry in India are the relatively higher transaction costs compared to
other countries which whom India is competing in the export markets. Transaction costs for exports in
India stands at US $ 945 per container as compared to US $ 500 per container for China.
2.3.39. These high transaction costs adversely impact India’s cost competitiveness in the export markets. The
factors that lead to the relatively higher transaction costs are multiplicity of rules and regulations,

155
inadequate infrastructural facilities and thus higher inland transportation costs and higher port and
terminal charges, rule-bound administrative procedures, practices, amongst others. Hence in addition
to addressing the various other trade policy issues, reduction of transaction costs is another priority
area that needs to be addressed.
Exhibit 2.3.18: Transaction cost comparison
Source: World Bank
2.3.40. Inadequate infrastructural facilities are one of the major factors for higher transaction costs. Inland
transportation & handling costs and ports & terminal handling costs account for almost 50% of the
total transaction costs reflecting the poor state of infrastructural facilities in the country. Again
depending on the location within the country, transportation costs tend to vary drastically. This is
captured in the exhibit below, which clearly states that the cost to export from Kochi, a port city is US$
432 per container, while the cost from an inland location, Jaipur in Rajasthan, is almost thrice at US $
1,289 per container.
Exhibit 2.3.19: Inter country cost comparison
Source: World Bank
156
2.3.41. The un-neutralised state level taxes such as CST, VAT, Octroi and Entry Tax also contribute to the
higher transaction costs. Though there are drawback schemes and excise rebates available for
exports, it generally takes a long time for the exporters in getting their drawbacks and excise rebate
claims, thus leading to higher transaction costs.
SUMMARY
2.3.42. From the above analysis, it is clearly evident that MMF and MMF textile industry face several
problems that require immediate policy attention if the sector has to be made globally competitive.
The next chapter details various policy recommendations that can provide solutions to the issues
highlighted in this chapter.
157
2.4. RECOMMENDATIONS
2.4.1. The policy recommendations made by the sub-group on man-made fibres for the national fibre policy
can be categorised into two types, namely:
Fiscal measures, and
Non fiscal measures
2.4.2. Fiscal measures mainly include rationalisation of the current duty structure, both excise and customs,
and removal of anomalies, if any. The objective of these measures is to attain fibre neutral duty
regime and do not put any segment of the value chain at any disadvantage. These measures are of
utmost importance to boost production and consumption of MMF and MMF textiles in India and also
improve competitiveness of players in the global exports markets.
2.4.3. Non-fiscal measures are also required to provide boost to the production and consumption of man-
made fibres and textiles in India. These measures take the form of any institutional support and
incentives to encourage domestic production of fibres to ensure adequate supply of fibres to the
industry over the long term.
Various fiscal and non-fiscal recommendations are discussed below.
FISCAL MEASURES
Excise duty rationalisation
2.4.4. The sub-group members are of the opinion that there should be fibre neutral excise policy. Thus,
members have suggested a reduction in excise duty for man-made fibres and textiles made of man-
made fibres to the level of cotton textiles, i.e. 4% optional at present.
2.4.5. It has been observed that when the excise duty on most man-made fibres was reduced considerably
in FY07 from 16.32 % to 8.16% and the excise duty gap between cotton and MMF was narrowed to
8.16 percentage points from 16.32, there was a substantial growth in consumption as well as
production of man-made fibres.
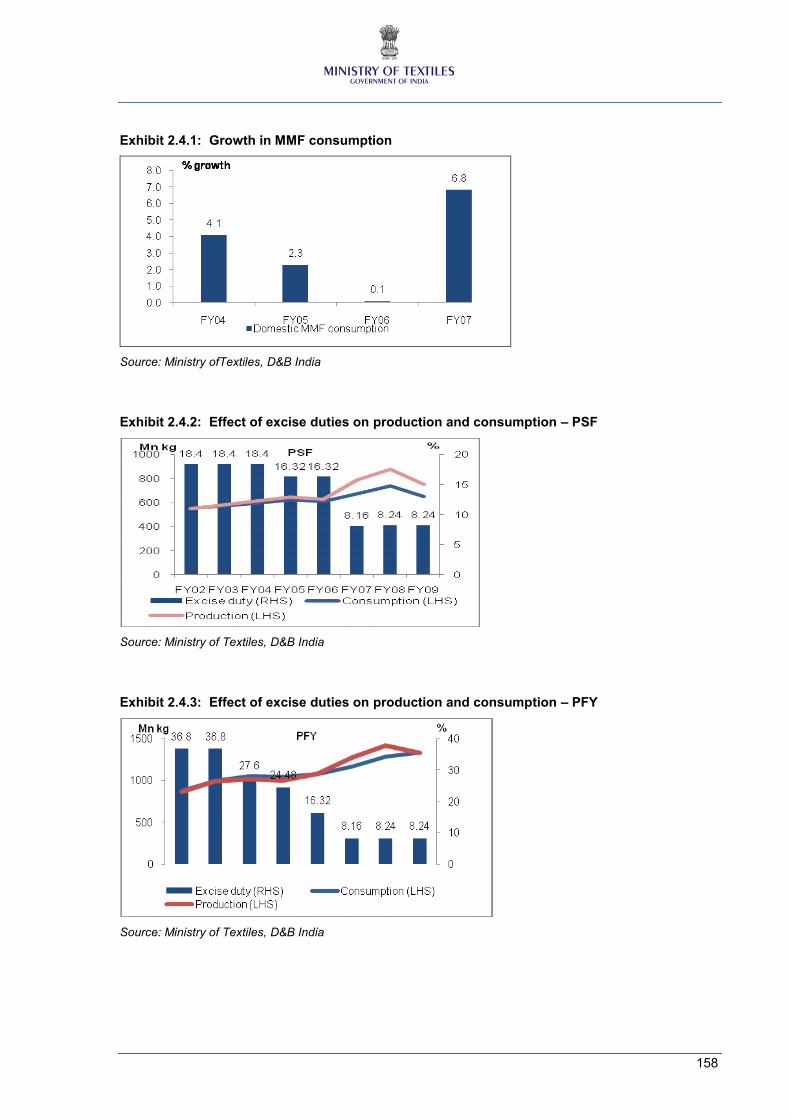
158
Exhibit 2.4.1: Growth in MMF consumption
Source: Ministry ofTextiles, D&B India
Exhibit 2.4.2: Effect of excise duties on production and consumption – PSF
Source: Ministry of Textiles, D&B India
Exhibit 2.4.3: Effect of excise duties on production and consumption – PFY
Source: Ministry of Textiles, D&B India
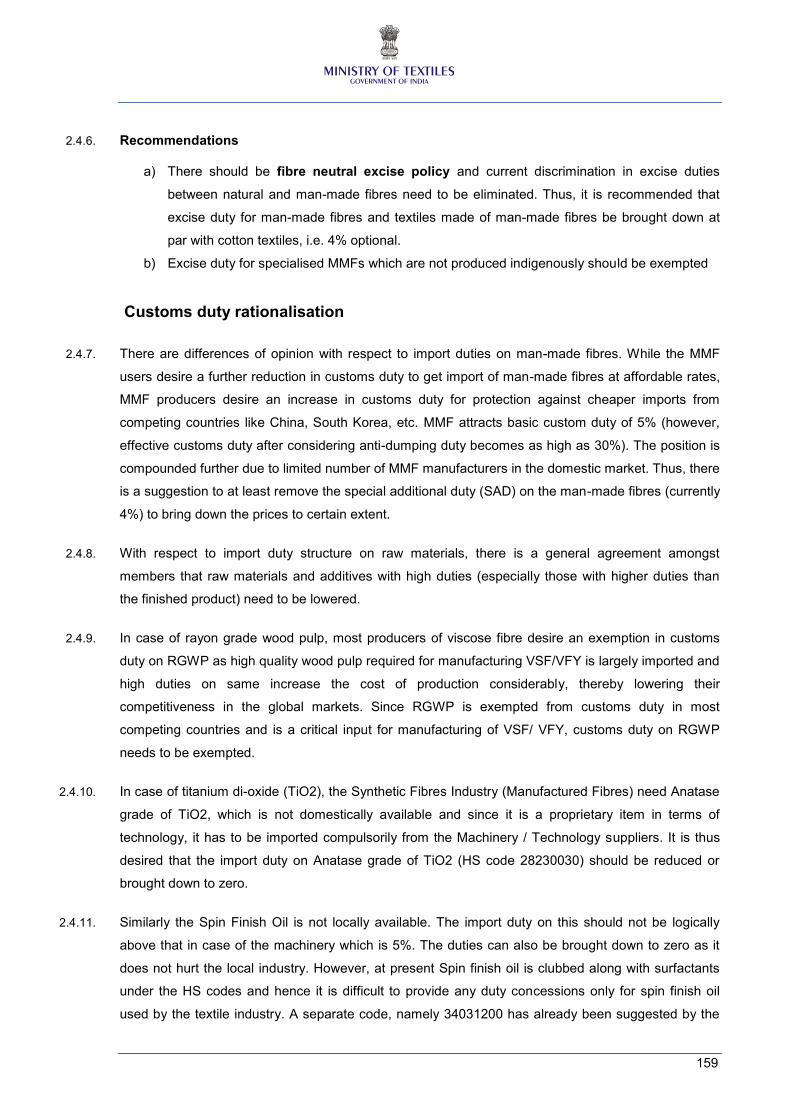
159
2.4.6. Recommendations
a) There should be fibre neutral excise policy and current discrimination in excise duties
between natural and man-made fibres need to be eliminated. Thus, it is recommended that
excise duty for man-made fibres and textiles made of man-made fibres be brought down at
par with cotton textiles, i.e. 4% optional.
b) Excise duty for specialised MMFs which are not produced indigenously should be exempted
Customs duty rationalisation
2.4.7. There are differences of opinion with respect to import duties on man-made fibres. While the MMF
users desire a further reduction in customs duty to get import of man-made fibres at affordable rates,
MMF producers desire an increase in customs duty for protection against cheaper imports from
competing countries like China, South Korea, etc. MMF attracts basic custom duty of 5% (however,
effective customs duty after considering anti-dumping duty becomes as high as 30%). The position is
compounded further due to limited number of MMF manufacturers in the domestic market. Thus, there
is a suggestion to at least remove the special additional duty (SAD) on the man-made fibres (currently
4%) to bring down the prices to certain extent.
2.4.8. With respect to import duty structure on raw materials, there is a general agreement amongst
members that raw materials and additives with high duties (especially those with higher duties than
the finished product) need to be lowered.
2.4.9. In case of rayon grade wood pulp, most producers of viscose fibre desire an exemption in customs
duty on RGWP as high quality wood pulp required for manufacturing VSF/VFY is largely imported and
high duties on same increase the cost of production considerably, thereby lowering their
competitiveness in the global markets. Since RGWP is exempted from customs duty in most
competing countries and is a critical input for manufacturing of VSF/ VFY, customs duty on RGWP
needs to be exempted.
2.4.10. In case of titanium di-oxide (TiO2), the Synthetic Fibres Industry (Manufactured Fibres) need Anatase
grade of TiO2, which is not domestically available and since it is a proprietary item in terms of
technology, it has to be imported compulsorily from the Machinery / Technology suppliers. It is thus
desired that the import duty on Anatase grade of TiO2 (HS code 28230030) should be reduced or
brought down to zero.
2.4.11. Similarly the Spin Finish Oil is not locally available. The import duty on this should not be logically
above that in case of the machinery which is 5%. The duties can also be brought down to zero as it
does not hurt the local industry. However, at present Spin finish oil is clubbed along with surfactants
under the HS codes and hence it is difficult to provide any duty concessions only for spin finish oil
used by the textile industry. A separate code, namely 34031200 has already been suggested by the
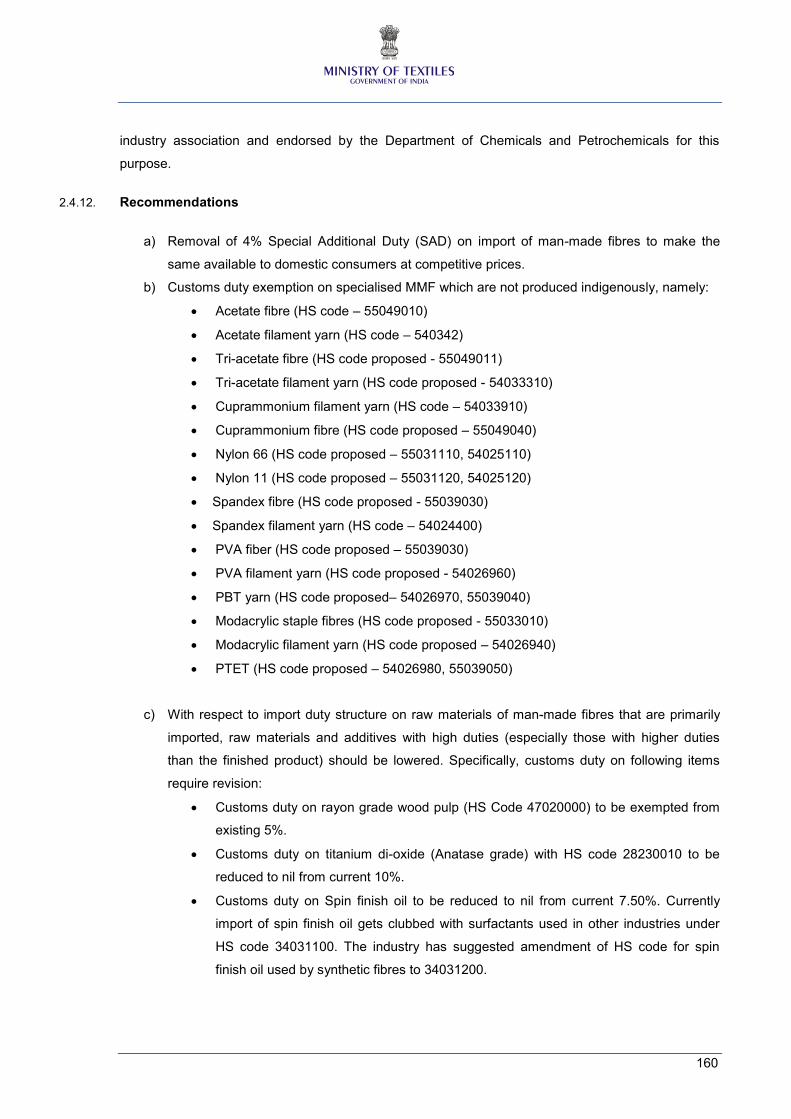
160
industry association and endorsed by the Department of Chemicals and Petrochemicals for this
purpose.
2.4.12. Recommendations
a) Removal of 4% Special Additional Duty (SAD) on import of man-made fibres to make the
same available to domestic consumers at competitive prices.
b) Customs duty exemption on specialised MMF which are not produced indigenously, namely:
Acetate fibre (HS code – 55049010)
Acetate filament yarn (HS code – 540342)
Tri-acetate fibre (HS code proposed - 55049011)
Tri-acetate filament yarn (HS code proposed - 54033310)
Cuprammonium filament yarn (HS code – 54033910)
Cuprammonium fibre (HS code proposed – 55049040)
Nylon 66 (HS code proposed – 55031110, 54025110)
Nylon 11 (HS code proposed – 55031120, 54025120)
Spandex fibre (HS code proposed - 55039030)
Spandex filament yarn (HS code – 54024400)
PVA fiber (HS code proposed – 55039030)
PVA filament yarn (HS code proposed - 54026960)
PBT yarn (HS code proposed– 54026970, 55039040)
Modacrylic staple fibres (HS code proposed - 55033010)
Modacrylic filament yarn (HS code proposed – 54026940)
PTET (HS code proposed – 54026980, 55039050)
c) With respect to import duty structure on raw materials of man-made fibres that are primarily
imported, raw materials and additives with high duties (especially those with higher duties
than the finished product) should be lowered. Specifically, customs duty on following items
require revision:
Customs duty on rayon grade wood pulp (HS Code 47020000) to be exempted from
existing 5%.
Customs duty on titanium di-oxide (Anatase grade) with HS code 28230010 to be
reduced to nil from current 10%.
Customs duty on Spin finish oil to be reduced to nil from current 7.50%. Currently
import of spin finish oil gets clubbed with surfactants used in other industries under
HS code 34031100. The industry has suggested amendment of HS code for spin
finish oil used by synthetic fibres to 34031200.
161
Textile industry to be kept out of GST
2.4.13. At present, Cenvat on textile industry is only optional and many manufacturers opt for non-payment of
Cenvat. Considering the pattern of manufacturing and trading in decentralised sectors of the industry
and finding out solution to avoid double taxation, it is recommended that GST should not be imposed
on textiles industry for at least two years.
Export incentives for MMF textiles and garments
2.4.14. Historically, MMF textiles have had a disadvantage against cotton textiles due to which
competitiveness of MMF textile players has been affected, especially against competing neighbouring
countries. Thus, it is recommended that various export incentives should be provided to man-made
fibre based textiles and garment exporters for a limited period to neutralize the impact of cost
disadvantage vis-à-vis exporters in competing countries. This could include higher drawback rates
and inclusion of value added MMF products, viz. processed fabrics, made-ups and garments under
the Focus Product Scheme.
a) A graduation scheme for three years can be introduced under the Focus product scheme with
benefits of 10% in first year, 7% in second year and 3% in third year.
b) This scheme may cover man-made textiles and garments. In case financial implications do
not permit coverage of textiles and garments then at least garments sector should be
incentivised as these currently constitute for low exports value.
NON-FISCAL MEASURES
Schemes for capacity expansion and up-gradation of machinery
2.4.15. At present, TUFS is available to the textile industry for up-gradation of machinery; however under
TUFS, all the segments of the textile industry including VSF and VFY are covered except
manufacturing of synthetic fibres and yarn (i.e., PSF, PFY, NFY, ASF, PPSF, PPFY etc.) as the latter
is administered by the Ministry of chemicals and petrochemicals. Given that man-made fibres are
used by the textiles industry, incentives provided to MMF industry for technological up-gradation will
ultimately benefit the user industry.
2.4.16. It is recommended that synthetic fibres should be covered under TUFS with fund support from their
administrative Ministry i.e. Department of Chemicals and Petrochemicals.
162
a) The machinery for manufacture of synthetic fibres post polymerisation may be covered under
TUFS. Since the processes upto polymerisation are primarily chemical in nature
polymerisation machineries may not be covered.
b) The post polymerisation machinery may be benchmarked by TAMC in consultation with
proposed advisory council on MMF.
c) To encourage setting up of small size units, particularly from chips the restriction on term loan
and also on capital cost may be fixed by IMSC in consultation with TAMC and proposed
advisory council.
The coverage under TUFS will result in attracting more investments, entry of more players, increasing
the availability of MMF at competitive prices.
Setting up of MMF advisory council
2.4.17. A MMF advisory council with all the stakeholders may be set up to monitor that the excise duty and
other concessions have been passed on by the MMF manufacturers and also to take on integrated
approach to solving the problems of MMF producers and users of MMF and to accelerate their
growth. The said Council may also impress upon MMF manufacturers to provide the MMF at
international prices to the domestic manufacturers.
Consultation with Ministry of Textiles for Anti dumping duties
2.4.18. At present, there are apprehensions amongst MMF textile players that often anti-dumping duties are
levied on man-made fibres without adequate consultation with the concerned user industry. In order to
redress the grievances of the user industry, it is recommended that introduction of anti-dumping duties
on man-made fibres must involve consultation with the Ministry of textiles to truly reflect the concerns
of the user industry. At present this is restricted to Department of Chemicals and Petrochemicals.
Institutional support for initiating anti-dumping proceedings
2.4.19. The users of man-made fibre generally constitute small players who are not able to initiate anti-
dumping proceedings for their products, as it involves huge costs. Thus, there is a need for
introduction of an institutional mechanism to provide support (financial and other) to industry
associations to initiate and defend the anti-dumping proceedings / safe guard duties.
163
Priority in gas allocation to processing units
2.4.20. MMF manufacturing and processing units are generally more energy intensive and thus to ensure
cleaner environment, it is recommended that these units should be given a priority under the gas
allocation policy, at par with the power sector. This would reduce their dependence on coal and thus
contribute towards greener environment.
164
2.A. ANNEXURE
2.A.1. TEXTILE OVERVIEW AND POLICIES IN MAJOR COUNTRIES
China
2.A.1. China is the single largest T&G producer and exporter in the world. It has the largest T&G production
capacity and leads in the production of cotton as well as synthetic textiles and garments. It is
endowed with a good raw materials base and enjoys the advantage of abundant availability of low-
cost labour. Chinese T&G suppliers are able to produce any type of textile and garment item at
competitive prices. The Chinese textile industry has also benefited from huge investments from the
government as well as from foreign companies, which have boosted its production capacity to
massive levels.
2.A.2. China is the single largest exporter of PFY, VFY and VSF. It is the second largest exporter of PSF
and third largest of nylon. In terms of consumption, China consumed around 50% of global textile
fibres in 2007.
2.A.3. China has a greater advantage against other low-cost countries as labour productivity is very high.
Further, the entire textile value chain is well integrated in China, which ensures a highly efficient
supply chain in the industry. China’s infrastructure is also well developed in comparison with other
competing countries. One of the key reasons for success of Chinese textile industry has been the
continuous government support for the industry. During the last decade, textile industry in China has
seen huge investments in capacities and technology up-gradation. Currently, China boasts of more
than half of world’s MMF capacities.
2.A.4. On the cost front, Chinese are competitive on most factors. Chinese labour cost is low at around US$
125 per month; power cost is US$ 0.2 per kwh (Y 0.485 per kwh in 2005), water cost is 0.625 US$ per
ton cubic mtr; diesel/ petrol costs around 4 yuan per litre; freight charges are about US$ 2000 for 20 ft
container from China to USA; and interest cost is almost half that of India (around 6%).
2.A.5. Government policies for Chinese textile and MMF industry
a) Promotion of MMF: Chinese government recognised that cotton production was not sufficient
to meet the textile demand in the long run and thus they actively promoted the MMF industry.
b) Cheaper finance: The industry can avail finance at interest rates as low as 5-6%
c) Subsidies: Chinese textile industry receives capital subsidies in the form of land grants;
wherein the land is provided to industries at cheap rates or free of cost. Textiles sector also
gets fuel subsidies (for coal and oil)
165
d) Tax exemptions: Chinese government provides tax holidays upto two years for the industry.
e) Export incentives: The VAT on Chinese textiles is 17%. But exporting units are eligible to get
refund up to 16% (as per the latest revision under the stimulus package of 2009).
f) Duty free imports: On certain textile machinery, no customs duty is levied.
g) Flexible labour policy: In China, labour can be employed on contractual basis
h) Infrastructure support: Chinese government has made huge investments to create world-class
infrastructure for its industries in the form of ports, roads, highways, special economic zones,
etc.
i) Financial support: The Chinese government allocated Y 1.36 billion to the T&G industry in
2006 to improve productivity of which Y 560 million were to promote innovation and the
remaining amount to support enterprises to invest in developing and least developing nations.
2.A.6. On the back of favourable conditions, the exports from Chinese T&G companies have proliferated in
the post-quota period. According to a study by the WTO, China has the potential to garner 50% of the
US market for garments and 29% share of the EU market for garments.
Taiwan
2.A.7. Taiwan accounted for 6% of the world’s manmade fibres output with a production of 2.45 million
tonnes of manmade fibre in 2007. It is the third largest producer of nylon and polyester filament yarn,
fourth largest manufacturer of viscose staple fibre and holds the fifth and sixth position in the
production of acrylic staple fibre and polyester staple fibre. Taiwan’s share in world market has
steadily come down since 1990 when China started ramping up its capacity. It accounted for almost
14% of the world fibre production in 1995, however low growth (around 2%) during the ATC period
(1995-2004) and decline in production post –WTO, led to decline in share of Taiwan in world fibre
production.
2.A.8. Taiwan is a net exporter of fibres, with exports accounting for almost 55% of its total production during
2007. Nearly 78% of ASF production and 71% of PSF production and around 45-50% of its production
of nylon and PFY were exported during 2007. However, Taiwan reported a decline in exports of fibres
to 1.3 million tonnes in 2007 from 1.5 million tonnes in 2006.
2.A.9. In terms of consumption, Taiwan ranks as the third largest consumer of nylon and polyester filament
and sixth largest consumer of viscose staple fibre.
166
2.A.10. With a total production capacity of around 8,670 tonnes per day, Taiwan ranks third largest in terms of
capacity. 21
It ranks second in terms of capacity for polyester fibre.
2.A.11. Over the years, the industry witnessed many problems in the second half of 1980s, such as labour
shortages, rising overhead costs, increasing land prices, amongst others. As a consequence a
number of companies relocated/shifted their production capacities to South East Asia and China in
order to stay competitive. The companies that did not shift their production capacities undertook a
number of cost-effective measures and new management practice to improve quality and productivity.
Taiwan has emerged as a leading producer of high-quality textiles and as a sourcing centre in Asia.
The textile industry in the country has focused on manmade fabrics as the country does not produce
natural raw materials such as cotton, wool, silk, linen and others.
2.A.12. Taiwan had build up production capacities in man-made fibres and China was one of its major
markets. However, with number of MMF units increasing in China, demand for MMF from China
reduced, impacting demand from Taiwan. The Asian economic crisis of 1997 hit the industry very
badly. MMF production in Taiwan fell in 1998 and a number of firms were hit badly.
2.A.13. Liberalisation of textiles and clothing trade (on account of expiry of the WTO Agreement on Textiles
and Clothing) led to increased competition in export markets as a result of which Taiwan’s exports of
textiles and clothing declined. To help the T&G industry overcome this challenge, the Taiwanese
government set up a co-ordination centre to eliminate investment barriers and provide support for
technological development.
Indonesia
2.A.14. Indonesia’s textile industry is vertically integrated with presence across the entire value chain – from
production of MMFs, yarn spinning, waving and knitting, dyeing, printing, finishing to garment
manufacturing. Out of the 2,661 textile companies in 2004, 28 were involved in manufacture of MMFs,
204 in spinning, 1,044 in weaving, knitting and finishing and 861 in garment manufacturing. The
industry provided employment to over 1.8 million workers directly and 3.7 million workers indirectly.
Workers in the textiles industry accounted for 1.9% of total employment in the region. The textiles
industry is second largest net exporter industry (after mining) in Indonesia. However, a large part of
textile products produced in the region is consumed domestically. Around 51% of yarn produced was
consumed domestically; in case of weaving and knitting sector the local consumption is around 63%
of total production, and for garments – 37%.
21
As per Taiwan Man-Made Fiber Industries Association - http://www.e-ruby.com.tw/tmmfa/english/1-brief05.asp#1
167
2.A.15. Indonesia’s strategic location of being situated between two oceans (Indian Ocean and Pacific Ocean)
and continents (Asia and Australia/Oceania) has enabled it to engage in trade with various nations.
Indonesia is the fourth largest populated nation in the world. The government, in a bid to increase
competitiveness of the textiles industry, has made significant efforts so as to provide requisite
infrastructure and facilities. Indonesia was one of the largest exporters of MMF in 2007 .The region
was third largest exporter of PFY, fifth largest of VFY and tenth largest of NFY.
2.A.16. Indonesia’s domestic industry began to develop only in the late 1960’s and since then industry has
made progress in terms of overall structure, market orientation and diversification. The initial industrial
policies in the rehabilitation and stabilisation period (1967-72) and oil boom period (1973-81), stressed
on growth of import substitution industries like textiles and garments. With fall in oil prices during the
period 1982-96, Indonesia’s policy focussed on development of export oriented industries which
would be supported by strengthening the overall industry structure.
2.A.17. The Indonesian government, in a bid to improve foreign investments in the textiles industry,
announced an investment policy package. This policy package consisting of 19 policies and 85 action
programs, defines the shortening and transparency of investment permits procedures as well as
establishment of mechanisms for disputes. The government is also trying to amend its existing labour
law. Indonesia economy suffered a major setback in 2008 in form of falling exports (due to tepid
demand for textile products in international markets). However, the region depends more on
household consumption for growth as compared to exports. Indonesia is developing textiles cluster in
the regions of West Java and Yogyakarta wherein focus will be on increasing competitiveness by
concentrating on development of value added products and fashion wear products manufactured from
indigenously available raw materials.
2.A.18. As per industry experts, around 70% of PFY manufactured in Indonesia is used for georgette crepe,
as a result of which, demand for PFY for weaving remains stagnant. Demand for filament yarn is
better relatively better from knitted fabrics as compared to woven fabrics. Indonesia’s textiles industry
contributed around 2.1% to its GDP in 2008.
2.A.19. Comparison of cost of production of India vis-à-vis Indonesia reveals – hourly labour cost is cheaper
by US$ 0.1, cost of power is cheaper by US$ 0.019 per KW and the cost of shipping is also cheaper.
The transaction cost for yarn and fabrics in Indonesia account for 1.5-2% and 1.25-1.5% respectively
of their selling price.
2.A.20. Indonesia accounted for 4% of global production of MMFs and 3% in global consumption of MMFs in
2007. The region was the second largest consumer of VSF, fifth largest of PSF and seventh largest
consumer of ASF and PFY in 2007. Indonesia produced around 1.6 million tonnes of MMFs in 2007 of
which 0.7 million tonnes was PFY, 0.5 million tonnes was PSF and 0.3 million tonnes was viscose
staple. Despite this impressive growth adverse factors like outdated technology and machinery
168
continue to hamper the growth of textiles industry in Indonesia. Few of these factors have been listed
down as follows:
a) Entry of illegal textiles products into Indonesian markets
b) Emergence of new competitors like Vietnam, Bangladesh and Pakistan
c) Limited development of natural fibre raw material
d) No development of textile-chemicals industry (dyestuff)
e) Limited availability of human resources especially in the field of designing, marketing and
research and development
f) Amendments in Act of Manpower especially with respect to separation pay, creating
unnecessary burden to the industry
g) Limited development of supporting industries like accessories, interlining, spare parts and
suppliers (like paper cone, bobbin, etc)
2.A.21. In a bid, to enhance the competitiveness of its domestic textiles industry with other nations and
increase employment opportunities, Indonesia strengthened its production capacity across the entire
value chain in 2007. Highest growth was witnessed in fibre (6.8% y-o-y growth), followed by yarn
(4.3%), garments (3.3%) and fabrics (1.3%).
2.A.22. Government policies/initiatives for Indonesian textile industry:
a) Drawback of import duty paid on import of raw materials required to manufacture finished
textiles products
b) Domestic manufacturers are exempt from value added tax and sales tax payable on
procurement of indigenous raw materials for manufacture of products supposed to be
exported
c) Restricting imports of textile products to protect domestic manufacturers from cheap imports
d) The government is supporting the industry in upgrading machineries used. The government is
urging players to replace excitant machineries with new and modern machineries which are
more efficient
e) The Indonesian government sought help of the Chinese government to restructure its textile
policy. The government also proposed to the Chinese government for the provision of export
credit licences to textile machinery
f) Amend laws and regulations hampering development of textiles industry
g) Implement restructuring program for textile products and machinery used
h) Increase availability of domestic raw materials
i) Develop high quality natural and synthetic fibre industry
j) Focus on improving design, technology and product diversification so as to manufacture value
added products
k) Obtain intellectual property
169
South Korea
2.A.23. South Korea’s textile industry ranks fourth globally in terms of production. Textiles output accounted
for around 6% of the regions total output in 2003. Various products manufactured in the South Korean
textiles industry include wovens, fabric manufacturing, MMFs, dyeing and processing and garments.
Manufacture of value added products account for 6.5% of total textiles production in the region. The
industry provides employment to over 3 million people accounting for 12% of overall employment in
the region.
2.A.24. As per the country statements provided by ITMF, number of spindles in South Korea stood at 12
million in 2006 and 731 looms in the same period. Exports of textiles products have played a major
role in boosting the regions economy. The region ranked seventh for exports of textiles machinery
with exports exceeding US$ 1 billion.
2.A.25. South Korea was the fourth largest manufacturer of nylon and PFY in 2007, fifth largest of PSF and
sixth largest of VFY. The region accounted for 3.5% of global supply of MMFs. In terms of
consumption, South Korea was the fourth largest consumer of PFY, fifth largest of VFY and seventh
largest of nylon. South Korea was a leading exporter of VSF in 2007. The region was sixth largest
exporter of PFY, eight largest of nylon and ninth largest of ASF in the same period. On the cost front,
power cost (US$ 0.05 per KW) is almost 48% cheaper as compared to India and shipping costs are
25% lower.
2.A.26. South Korea’s MMF production has lately been declining. The region reduced its capacity for
manufacture of MMFs by 12.7% in 2007. While capacities of ASF and PSF remained unchanged in
2007, that of NFY reduced by 1.2% in the same period. In the period of early 1990s, the region’s MMF
production grew by 7% p.a. with production of PFY and PSF growing by 13% and 4% respectively.
However, the pace of growth reduced in the ATC period with MMF production growing at 2.5% p.a.
and PFY and PSF growing by 5% and 2.5% respectively. In the period of post abolition of quotas,
production of all MMFs except VFY declined. Production of ASF declined by 30%, followed by PFY
(16.2%), nylon (12.2%) and PSF (1.6%). Production of VFY grew marginally by 0.8% during the same
period.
2.A.27. The South Korean government is now focussing on production of value added products like
nanofibres, industrial textiles and smart textiles for growth. The region is also acquiring new
technology like digital dyeing and printing processes to enhance its competitiveness in global markets.
Government policies for South Korean textile and MMF industry:
a) South Korea, in a bid to support various regional industries like textiles and to support the
growth of SMEs (small and medium size enterprises), set up a regional industrial promotion
project (RIPP). This project encourages development of regional SME focussed industry by
170
identifying an industry having attractive growth potentials in regions and thereby assisting in
formation of a cluster. The first stage of this programme supported textiles industry in four
regions for a period of five years (1999-2003) with an investment of US$ 1.89 million.
Vietnam
2.A.28. The textiles industry in Vietnam has received a major boost since the regions recent entry into the
World Trade Organization. The region which initially restricted itself to cut and sew operations is now
investing in areas of spinning and weaving. With its entry into WTO, Vietnam is now in a position to
enhance value of its textiles exports. Also, the United States would be removing quotas on imports
from Vietnam leading to increased demand from the US for Vietnamese textile products. By the end of
2008, Vietnam became tenth largest exporter of garments valued at US$ 9.05 billion (a 16.3% y-o-y
growth over 2007).
2.A.29. The region has set an export target of US$ 10 billion for 2010 (Vietnam’s textile exports were US$ 4.8
billion in 2005). Vietnam plans to achieve the set targets by streamlining production and reduce per
unit cost and thereby increase its competitiveness in the international arena. Vietnam has made
substantial investments in the textiles industry to achieve this target. In 2006, Vietnam added 1.7
million new spindles and 5,840 open-ended rotors. Around 8.4 spindles and 19,784 open-ended
rotors were added in the period 1997-2006. In weaving segment, the region added 1,357 shutleless
looms in 2006.
2.A.30. In 2008, textiles industry emerged as Vietnam’s largest industry comprising of over 2,000 textile
manufacturers (of which 50% were state owned, 25% private firms and remaining foreign invested)
providing employment to over two million workers.
2.A.31. Government policies/initiatives for Vietnamese textile and MMF industry:
a) The government has announced plans of setting up of textiles and dyeing industrial zones
having standard watershed treatment systems, to attract more investments (both domestic
and foreign), to invest in the areas of fabric printing and dyeing so as to meet the target set by
the government of manufacturing one billion meters of fabric.
b) The government has announced plans for setting up of a laboratory at the Textile and
Garment Institute which would certify products manufactured and sold/exported were safe.
171
Pakistan
2.A.32. Pakistan’s T&G industry is vertically integrated with presence across the entire value chain – from
ginning, spinning, weaving, finishing to garment manufacturing. The industry provides employment to
ten million people. The T&G industry accounts for 11 percent of the country’s GDP.
2.A.33. Pakistan’s textiles and garments industry is primarily cotton based as this region is one of the leading
cotton manufacturers in the world. The country is fourth largest producer and third largest consumer
of cotton in the world. Lately, Pakistan’s T&G industry has diversified its product basket to include
MMF based textiles and apparels in order to align themselves with changing global consumption
pattern. Abolition of quotas in 2005 was one of the main reasons behind Pakistan’s shift towards
MMFs in order to remain competitive in international markets.
2.A.34. Pakistan’s production of MMFs posted an impressive growth in the ATC period especially polyester
staple fibre. Capacity of polyester staple fibre grew at a CAGR of 4.1% from 392 mn kg in 1995 to 565
mn kg in 2004. Pakistan started the indigenous manufacture of viscose staple fibre only in 2002 by
setting up of a manufacturing unit of 25 mn kg.
2.A.35. Government policies/initiatives for Pakistani textile and MMF industry as announced in the textiles
policy of 2009-14:
a) A Textile Investment Support Fund (TISF) will be setup for providing incentives for
investments in areas like modernization of technology and machinery, enhancing skill sets of
labourers, removal of bottlenecks in infrastructure, effective marketing and usage of
information and communication technologies.
b) Government, for capital intensive projects, will bear 50 percent of interest costs of
investments in plant and machinery with maximum of five percent. For other smaller projects,
government will contribute an amount upto 20 percent of capital cost as a grant. Government
has earmarked an amount of Rs 1.6 billion for this scheme and the amount will further
increase to Rs 17 billion by 2014.
c) Development of clusters to enable small investors set up their manufacturing units. Provision
of facilities like laboratories, product development centres, research centres, etc to these
clusters.
d) Assistance in setting up of effluent treatment plants to existing manufacturing units.
e) Provision of support for branding , grading, labelling, etc to add vale to the entire T&G
industry’s value chain
f) Government will launch specific schemes, mainly on public-private partnership basis, to
upgrade and improve segments like ginning, weaving, knitting, processing, technical textiles,
carpets, handloom and handicrafts, fashion designs, etc.
g) Provision of incentives for production of contamination free cotton.
172
h) Development of skills and research through SFDAC (Synthetic Fibre Development and
Application Centre) for manufacture of finer filaments for production of value added products.
i) Encouraging investments in rotor technology and specialized attachments like spandex, compact
spinning, etc so as to attain economies of scale.
j) Incentivizing power generation by mills so as to overcome problems of power shortage
k) In areas of weaving and knitting, government would provide financial assistance for
increasing capacities and upgradation of technologies. To encourage investments in shuttle
less looms, knitting and power looms sector, government would provide not only financial but
also technical assistance.
l) In order to boost production of value added products (especially non-wovens) government
would develop training modules to impart knowledge and skills.
m) Export refinance to be available at 5 percent
n) Long term loans to be converted on same price as applicable to LTTF scheme so as to
mitigate the burden of financing cost on existing units. An amount of Rs 5 billion has been
earmarked for this scheme.
o) Provision of duty drawback to offset costs imposed on exporters of value added textiles for a
period of two years. Drawback scheme proposed is as follows:
1 percent of FOB value of exports of processed fabric
2 percent of FOB value of exports of home textiles
3 percent of FOB value of exports of garments
p) Provision of additional 1 percent duty drawback to exports who have registered a growth in
exports over 15 percent
q) Government has earmarked an amount of Rs 5.4 billion to clear previous dues under R&D
scheme
r) Government is considering monetization of customs duty of PTA so as to increase usage of
MMFs and thereby diversify export offerings
2.A.2. DEMAND PROJECTIONS
2.A.36. The demand for man-made fibres depends upon the demand for yarns and fabrics, which in turn
depends upon the consumption of finished textiles viz. apparel and made-ups. Thus, in order to
determine the future requirements for man-made fibres/ filament yarns, we first need to assess
demand for fabrics and finished textiles made from man-made fibres, both for the domestic market as
well as exports.
2.A.37. The future projection for demand for man-made fibre/ filament yarn is arrived by assessing the
demand for future textile consumption by the Indian households and non-households and the export
173
demand for fabrics/ garments made of man-made fibres. Demand for domestic household
consumption of textiles and garments is derived from the projected private final consumption
expenditure based on growth of GDP at about 8% per annum.
2.A.38. India’s GDP factor cost at constant prices for FY08 stood at Rs31,297.2 billion. Considering the GDP
growth of 8% per annum, the GDP is expected to rise to Rs 53,637.8 billion in FY15 and to
Rs 78,811.6 billion in FY20. The average share of Private Final Consumption Expenditure (PFCE) in
the GDP during the last five years has been 67%. Considering the same share of PFCE in FY15 as
well as FY20, the overall private final consumption expenditure would be worth Rs 35,937.3 billion in
FY15 and Rs 52,803.8 billion in FY20.
2.A.39. The Eleventh five year plan report of the planning commission for Textiles and Garments considers
the share of textiles and clothing in PFCE to be around 5.5% for FY08. It has been observed that over
the past few years, the relative share of textiles and clothing in total PFCE has come down due to
increased private expenditure on transport and communication, education, recreation, etc. Thus, we
have considered the share of textiles and clothing in the PFCE to be 5.3% for FY15 and 5.1% for
FY20. Accordingly, the consumption of textiles and clothing by domestic households in FY15 and
FY20 is projected to be Rs 1,904.7 billion and Rs 2,693 billion, respectively. This is equivalent to
fabric consumption of 60,466 million sq. mtrs in FY15 and 85,492 million sq. mtrs in FY20.
2.A.40. Non-household consumption of fabrics (in form of fabrics, garments and made-ups) has been
estimated in the eleventh five year plan at 13,158 million sq. mtrs in FY07 and projected to rise at 5%
per annum. Considering the same growth estimates for next 5-10 years, the demand for fabrics from
non-household is expected to reach 19,440 million sq mtrs in FY15 and 24,811 million sq mtrs in
FY20.
2.A.41. The domestic demand for fabrics (in form of fabric, garments and made-ups) for exports was
estimated in the Eleventh Five Year Plan at 12,740 million sq mtrs for FY07. The exports of fabrics
and finished textiles have grown at average annual growth of around 9% till FY09. We have
considered the demand for fabrics for exports to grow at around 10% per annum for next 5-10 years.
On the basis of these growth estimates, the demand for fabrics for exports would be 27,930 million sq.
mtrs in FY15 and 44,982 million sq. mtrs in FY20.
2.A.42. The total demand for fabrics would thus be 107,836 million sq mtrs in FY15 and 155,285 million sq.
mtrs in FY20.
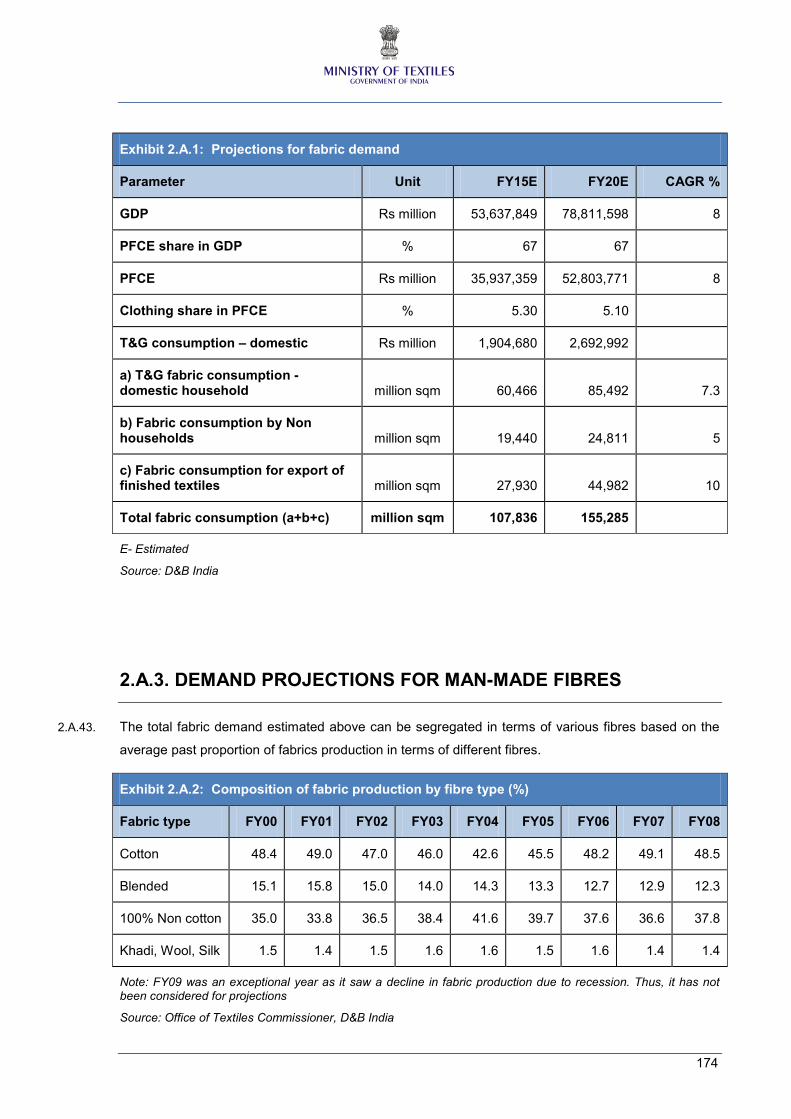
174
Exhibit 2.A.1: Projections for fabric demand
Parameter Unit FY15E FY20E CAGR %
GDP Rs million 53,637,849 78,811,598 8
PFCE share in GDP % 67 67
PFCE Rs million 35,937,359 52,803,771 8
Clothing share in PFCE % 5.30 5.10
T&G consumption – domestic Rs million 1,904,680 2,692,992
a) T&G fabric consumption -domestic household million sqm 60,466 85,492 7.3
b) Fabric consumption by Non households million sqm 19,440 24,811 5
c) Fabric consumption for export of finished textiles million sqm 27,930 44,982 10
Total fabric consumption (a+b+c) million sqm 107,836 155,285
E- Estimated
Source: D&B India
2.A.3. DEMAND PROJECTIONS FOR MAN-MADE FIBRES
2.A.43. The total fabric demand estimated above can be segregated in terms of various fibres based on the
average past proportion of fabrics production in terms of different fibres.
Exhibit 2.A.2: Composition of fabric production by fibre type (%)
Fabric type FY00 FY01 FY02 FY03 FY04 FY05 FY06 FY07 FY08
Cotton 48.4 49.0 47.0 46.0 42.6 45.5 48.2 49.1 48.5
Blended 15.1 15.8 15.0 14.0 14.3 13.3 12.7 12.9 12.3
100% Non cotton 35.0 33.8 36.5 38.4 41.6 39.7 37.6 36.6 37.8
Khadi, Wool, Silk 1.5 1.4 1.5 1.6 1.6 1.5 1.6 1.4 1.4
Note: FY09 was an exceptional year as it saw a decline in fabric production due to recession. Thus, it has not been considered for projections
Source: Office of Textiles Commissioner, D&B India
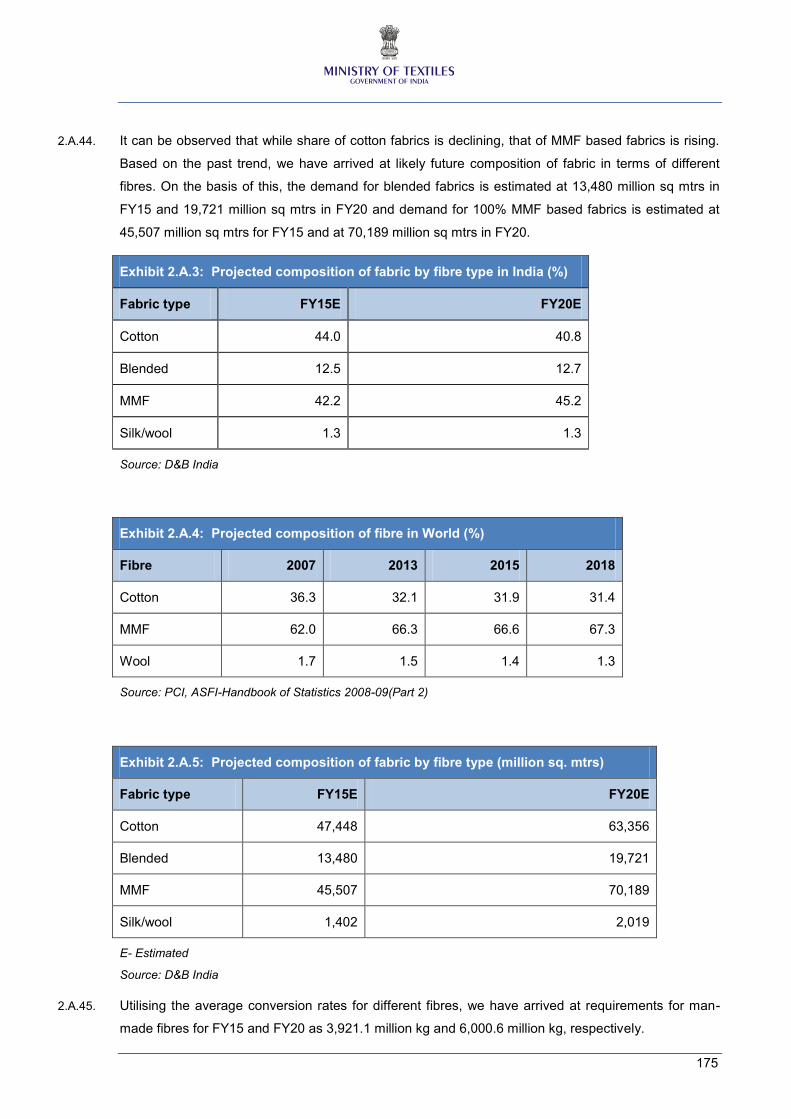
175
2.A.44. It can be observed that while share of cotton fabrics is declining, that of MMF based fabrics is rising.
Based on the past trend, we have arrived at likely future composition of fabric in terms of different
fibres. On the basis of this, the demand for blended fabrics is estimated at 13,480 million sq mtrs in
FY15 and 19,721 million sq mtrs in FY20 and demand for 100% MMF based fabrics is estimated at
45,507 million sq mtrs for FY15 and at 70,189 million sq mtrs in FY20.
Exhibit 2.A.3: Projected composition of fabric by fibre type in India (%)
Fabric type FY15E FY20E
Cotton 44.0 40.8
Blended 12.5 12.7
MMF 42.2 45.2
Silk/wool 1.3 1.3
Source: D&B India
Exhibit 2.A.4: Projected composition of fibre in World (%)
Fibre 2007 2013 2015 2018
Cotton 36.3 32.1 31.9 31.4
MMF 62.0 66.3 66.6 67.3
Wool 1.7 1.5 1.4 1.3
Source: PCI, ASFI-Handbook of Statistics 2008-09(Part 2)
Exhibit 2.A.5: Projected composition of fabric by fibre type (million sq. mtrs)
Fabric type FY15E FY20E
Cotton 47,448 63,356
Blended 13,480 19,721
MMF 45,507 70,189
Silk/wool 1,402 2,019
E- Estimated
Source: D&B India
2.A.45. Utilising the average conversion rates for different fibres, we have arrived at requirements for man-
made fibres for FY15 and FY20 as 3,921.1 million kg and 6,000.6 million kg, respectively.
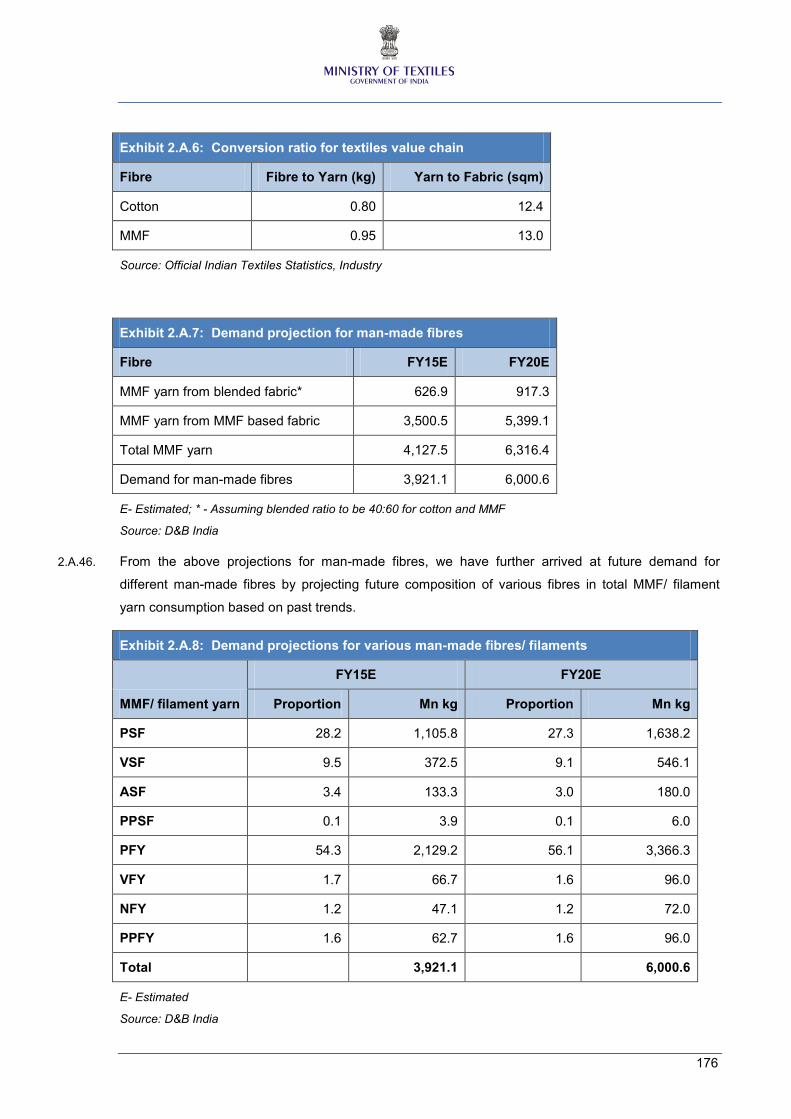
176
Exhibit 2.A.6: Conversion ratio for textiles value chain
Fibre Fibre to Yarn (kg) Yarn to Fabric (sqm)
Cotton 0.80 12.4
MMF 0.95 13.0
Source: Official Indian Textiles Statistics, Industry
Exhibit 2.A.7: Demand projection for man-made fibres
Fibre FY15E FY20E
MMF yarn from blended fabric* 626.9 917.3
MMF yarn from MMF based fabric 3,500.5 5,399.1
Total MMF yarn 4,127.5 6,316.4
Demand for man-made fibres 3,921.1 6,000.6
E- Estimated; * - Assuming blended ratio to be 40:60 for cotton and MMF
Source: D&B India
2.A.46. From the above projections for man-made fibres, we have further arrived at future demand for
different man-made fibres by projecting future composition of various fibres in total MMF/ filament
yarn consumption based on past trends.
Exhibit 2.A.8: Demand projections for various man-made fibres/ filaments
MMF/ filament yarn
FY15E FY20E
Proportion Mn kg Proportion Mn kg
PSF 28.2 1,105.8 27.3 1,638.2
VSF 9.5 372.5 9.1 546.1
ASF 3.4 133.3 3.0 180.0
PPSF 0.1 3.9 0.1 6.0
PFY 54.3 2,129.2 56.1 3,366.3
VFY 1.7 66.7 1.6 96.0
NFY 1.2 47.1 1.2 72.0
PPFY 1.6 62.7 1.6 96.0
Total 3,921.1 6,000.6
E- Estimated
Source: D&B India
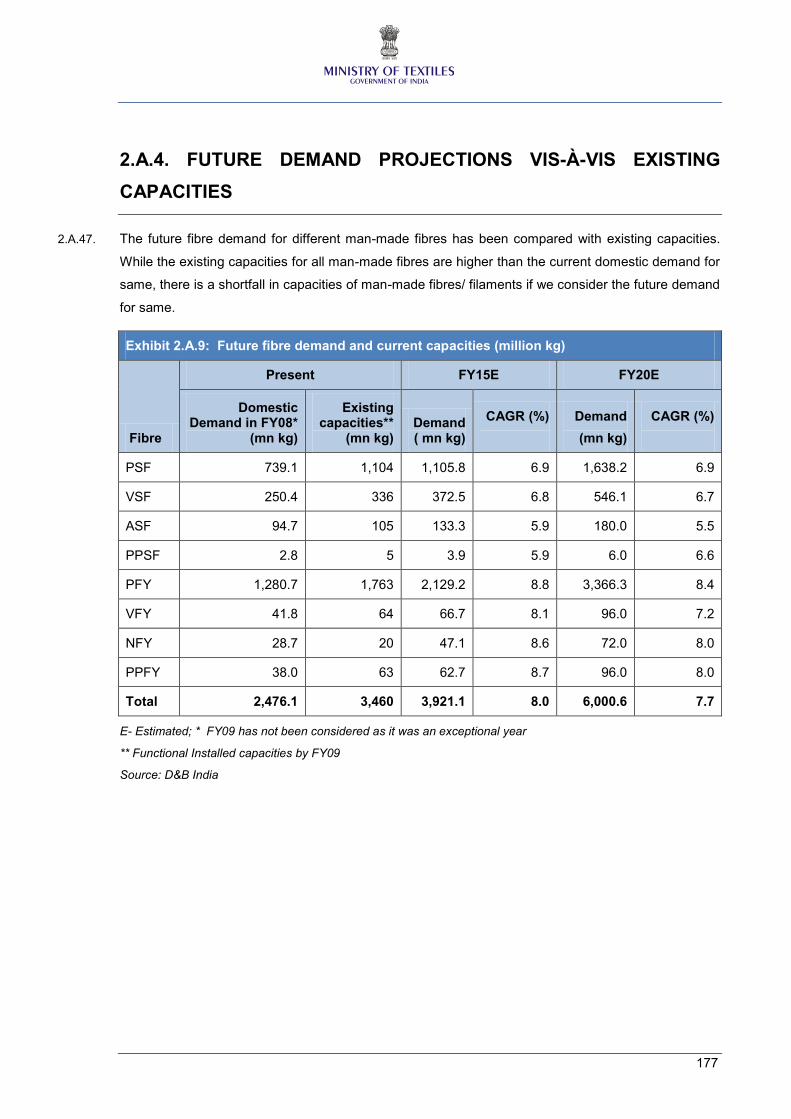
177
2.A.4. FUTURE DEMAND PROJECTIONS VIS-À-VIS EXISTING
CAPACITIES
2.A.47. The future fibre demand for different man-made fibres has been compared with existing capacities.
While the existing capacities for all man-made fibres are higher than the current domestic demand for
same, there is a shortfall in capacities of man-made fibres/ filaments if we consider the future demand
for same.
Exhibit 2.A.9: Future fibre demand and current capacities (million kg)
Fibre
Present FY15E FY20E
Domestic Demand in FY08*
(mn kg)
Existing capacities**
(mn kg) Demand ( mn kg)
CAGR (%)
Demand
(mn kg)
CAGR (%)
PSF 739.1 1,104 1,105.8 6.9 1,638.2 6.9
VSF 250.4 336 372.5 6.8 546.1 6.7
ASF 94.7 105 133.3 5.9 180.0 5.5
PPSF 2.8 5 3.9 5.9 6.0 6.6
PFY 1,280.7 1,763 2,129.2 8.8 3,366.3 8.4
VFY 41.8 64 66.7 8.1 96.0 7.2
NFY 28.7 20 47.1 8.6 72.0 8.0
PPFY 38.0 63 62.7 8.7 96.0 8.0
Total 2,476.1 3,460 3,921.1 8.0 6,000.6 7.7
E- Estimated; * FY09 has not been considered as it was an exceptional year
** Functional Installed capacities by FY09
Source: D&B India
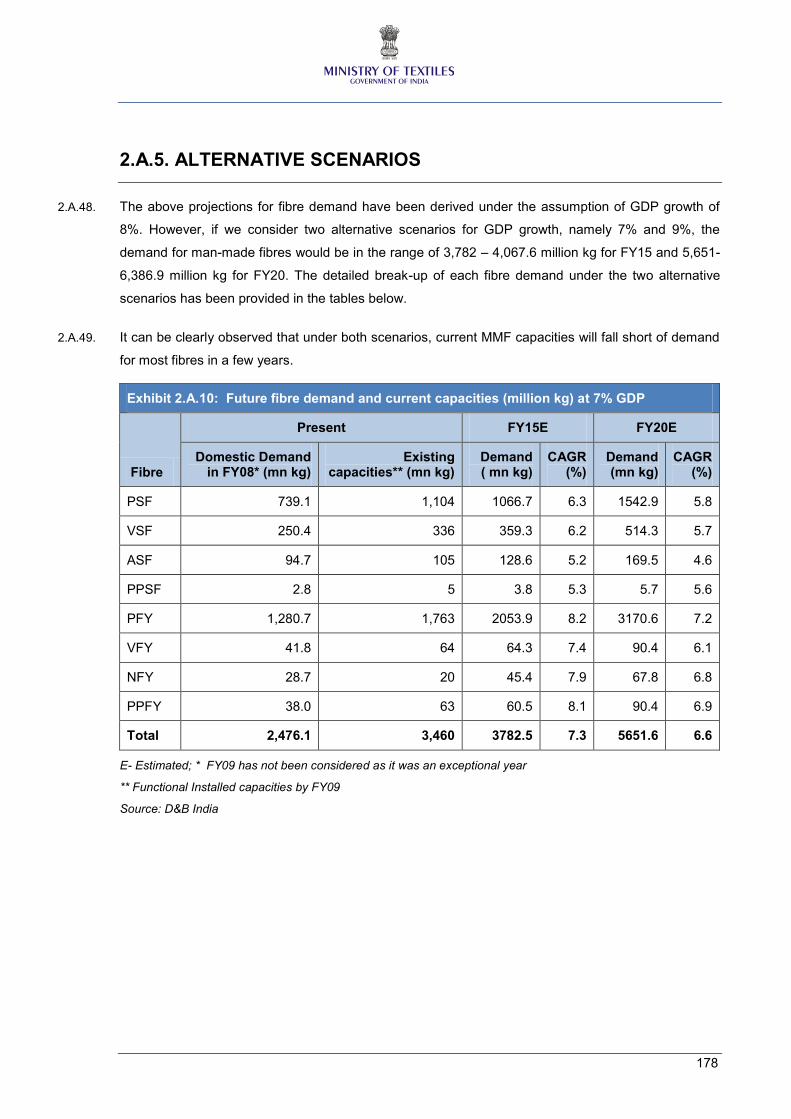
178
2.A.5. ALTERNATIVE SCENARIOS
2.A.48. The above projections for fibre demand have been derived under the assumption of GDP growth of
8%. However, if we consider two alternative scenarios for GDP growth, namely 7% and 9%, the
demand for man-made fibres would be in the range of 3,782 – 4,067.6 million kg for FY15 and 5,651-
6,386.9 million kg for FY20. The detailed break-up of each fibre demand under the two alternative
scenarios has been provided in the tables below.
2.A.49. It can be clearly observed that under both scenarios, current MMF capacities will fall short of demand
for most fibres in a few years.
Exhibit 2.A.10: Future fibre demand and current capacities (million kg) at 7% GDP
Fibre
Present FY15E FY20E
Domestic Demand in FY08* (mn kg)
Existing capacities** (mn kg)
Demand ( mn kg)
CAGR (%)
Demand (mn kg)
CAGR (%)
PSF 739.1 1,104 1066.7 6.3 1542.9 5.8
VSF 250.4 336 359.3 6.2 514.3 5.7
ASF 94.7 105 128.6 5.2 169.5 4.6
PPSF 2.8 5 3.8 5.3 5.7 5.6
PFY 1,280.7 1,763 2053.9 8.2 3170.6 7.2
VFY 41.8 64 64.3 7.4 90.4 6.1
NFY 28.7 20 45.4 7.9 67.8 6.8
PPFY 38.0 63 60.5 8.1 90.4 6.9
Total 2,476.1 3,460 3782.5 7.3 5651.6 6.6
E- Estimated; * FY09 has not been considered as it was an exceptional year
** Functional Installed capacities by FY09
Source: D&B India
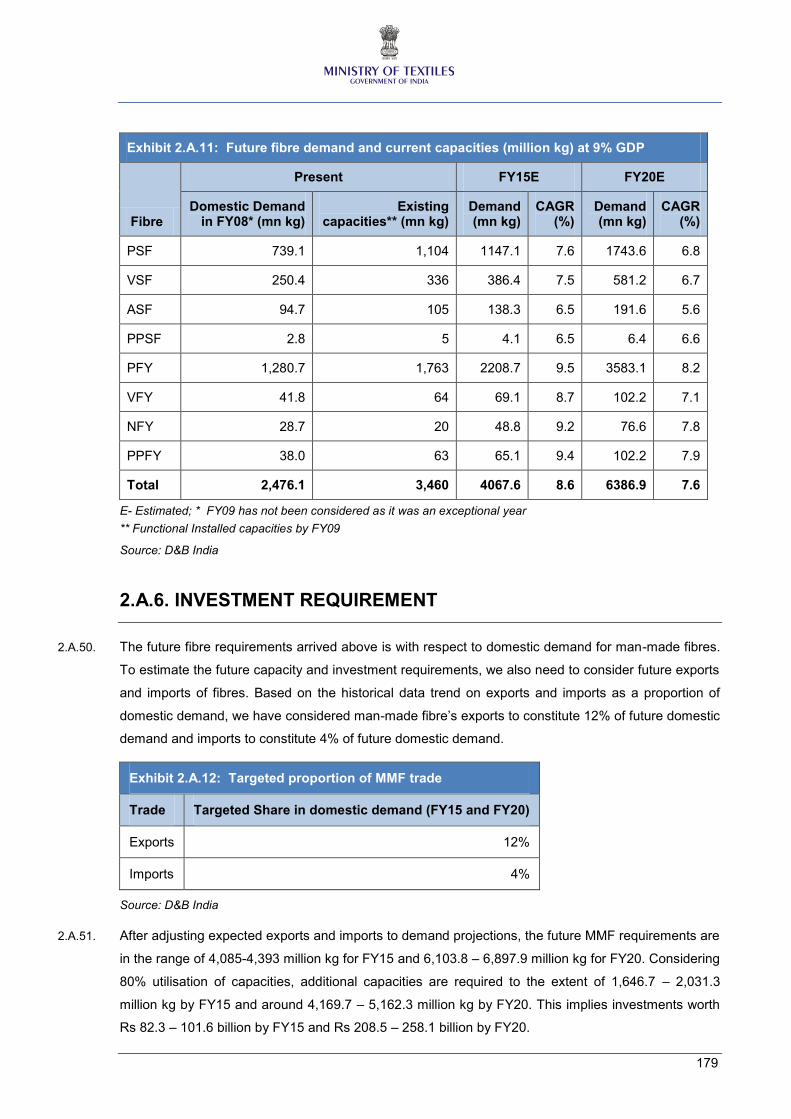
179
Exhibit 2.A.11: Future fibre demand and current capacities (million kg) at 9% GDP
Fibre
Present FY15E FY20E
Domestic Demand in FY08* (mn kg)
Existing capacities** (mn kg)
Demand (mn kg)
CAGR (%)
Demand (mn kg)
CAGR (%)
PSF 739.1 1,104 1147.1 7.6 1743.6 6.8
VSF 250.4 336 386.4 7.5 581.2 6.7
ASF 94.7 105 138.3 6.5 191.6 5.6
PPSF 2.8 5 4.1 6.5 6.4 6.6
PFY 1,280.7 1,763 2208.7 9.5 3583.1 8.2
VFY 41.8 64 69.1 8.7 102.2 7.1
NFY 28.7 20 48.8 9.2 76.6 7.8
PPFY 38.0 63 65.1 9.4 102.2 7.9
Total 2,476.1 3,460 4067.6 8.6 6386.9 7.6
E- Estimated; * FY09 has not been considered as it was an exceptional year
** Functional Installed capacities by FY09
Source: D&B India
2.A.6. INVESTMENT REQUIREMENT
2.A.50. The future fibre requirements arrived above is with respect to domestic demand for man-made fibres.
To estimate the future capacity and investment requirements, we also need to consider future exports
and imports of fibres. Based on the historical data trend on exports and imports as a proportion of
domestic demand, we have considered man-made fibre’s exports to constitute 12% of future domestic
demand and imports to constitute 4% of future domestic demand.
Exhibit 2.A.12: Targeted proportion of MMF trade
Trade Targeted Share in domestic demand (FY15 and FY20)
Exports 12%
Imports 4%
Source: D&B India
2.A.51. After adjusting expected exports and imports to demand projections, the future MMF requirements are
in the range of 4,085-4,393 million kg for FY15 and 6,103.8 – 6,897.9 million kg for FY20. Considering
80% utilisation of capacities, additional capacities are required to the extent of 1,646.7 – 2,031.3
million kg by FY15 and around 4,169.7 – 5,162.3 million kg by FY20. This implies investments worth
Rs 82.3 – 101.6 billion by FY15 and Rs 208.5 – 258.1 billion by FY20.
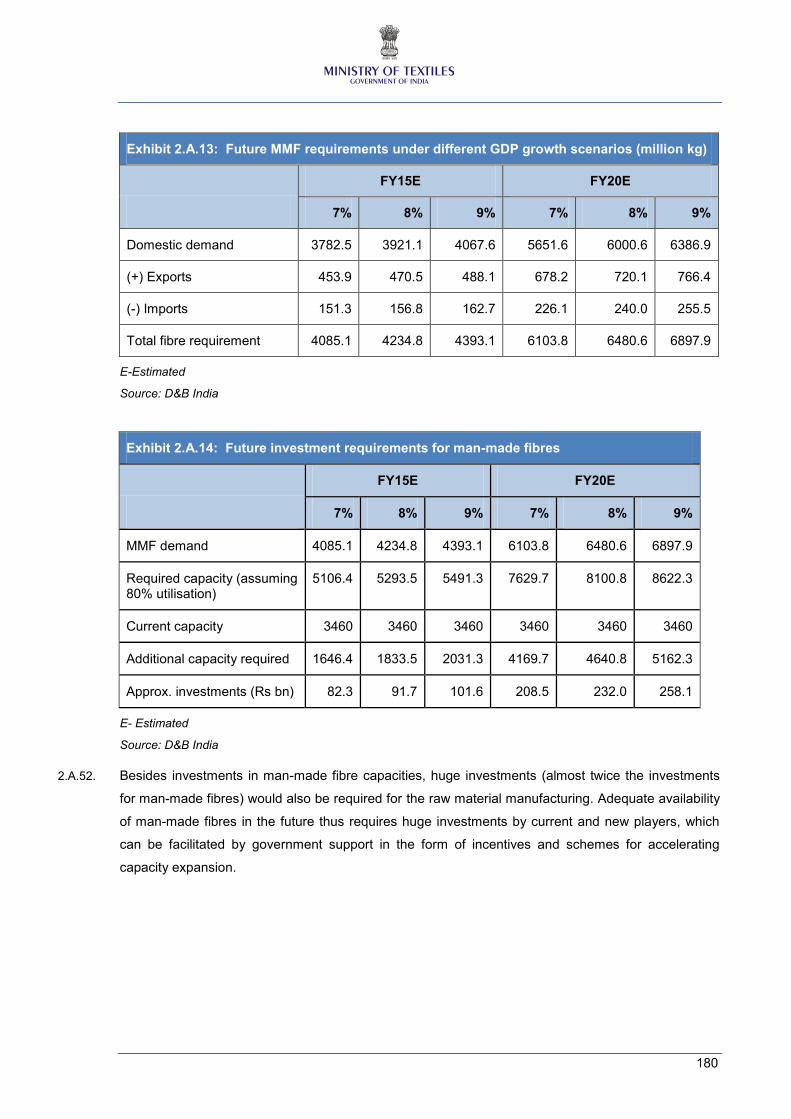
180
Exhibit 2.A.13: Future MMF requirements under different GDP growth scenarios (million kg)
FY15E FY20E
7% 8% 9% 7% 8% 9%
Domestic demand 3782.5 3921.1 4067.6 5651.6 6000.6 6386.9
(+) Exports 453.9 470.5 488.1 678.2 720.1 766.4
(-) Imports 151.3 156.8 162.7 226.1 240.0 255.5
Total fibre requirement 4085.1 4234.8 4393.1 6103.8 6480.6 6897.9
E-Estimated
Source: D&B India
Exhibit 2.A.14: Future investment requirements for man-made fibres
FY15E FY20E
7% 8% 9% 7% 8% 9%
MMF demand 4085.1 4234.8 4393.1 6103.8 6480.6 6897.9
Required capacity (assuming 80% utilisation)
5106.4 5293.5 5491.3 7629.7 8100.8 8622.3
Current capacity 3460 3460 3460 3460 3460 3460
Additional capacity required 1646.4 1833.5 2031.3 4169.7 4640.8 5162.3
Approx. investments (Rs bn) 82.3 91.7 101.6 208.5 232.0 258.1
E- Estimated
Source: D&B India
2.A.52. Besides investments in man-made fibre capacities, huge investments (almost twice the investments
for man-made fibres) would also be required for the raw material manufacturing. Adequate availability
of man-made fibres in the future thus requires huge investments by current and new players, which
can be facilitated by government support in the form of incentives and schemes for accelerating
capacity expansion.
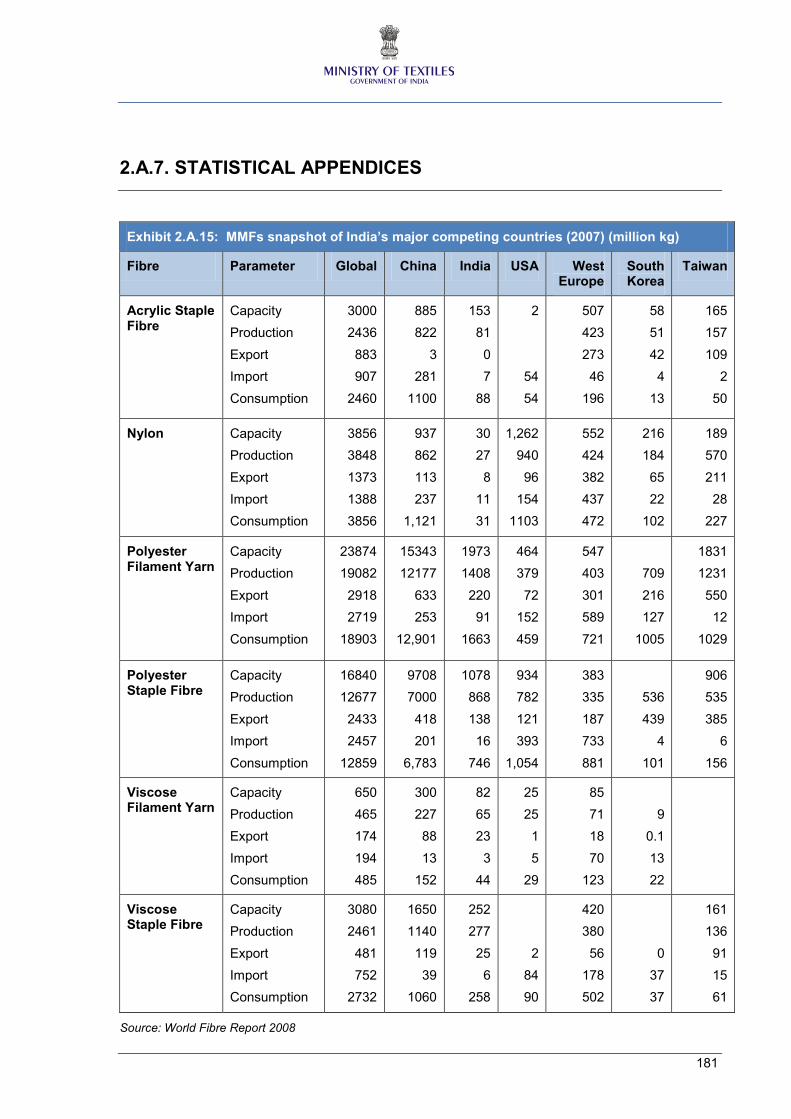
181
2.A.7. STATISTICAL APPENDICES
Exhibit 2.A.15: MMFs snapshot of India’s major competing countries (2007) (million kg)
Fibre Parameter Global China India USA West Europe
South Korea
Taiwan
Acrylic Staple Fibre
Capacity
Production
Export
Import
Consumption
3000
2436
883
907
2460
885
822
3
281
1100
153
81
0
7
88
2
54
54
507
423
273
46
196
58
51
42
4
13
165
157
109
2
50
Nylon Capacity
Production
Export
Import
Consumption
3856
3848
1373
1388
3856
937
862
113
237
1,121
30
27
8
11
31
1,262
940
96
154
1103
552
424
382
437
472
216
184
65
22
102
189
570
211
28
227
Polyester Filament Yarn
Capacity
Production
Export
Import
Consumption
23874
19082
2918
2719
18903
15343
12177
633
253
12,901
1973
1408
220
91
1663
464
379
72
152
459
547
403
301
589
721
709
216
127
1005
1831
1231
550
12
1029
Polyester Staple Fibre
Capacity
Production
Export
Import
Consumption
16840
12677
2433
2457
12859
9708
7000
418
201
6,783
1078
868
138
16
746
934
782
121
393
1,054
383
335
187
733
881
536
439
4
101
906
535
385
6
156
Viscose Filament Yarn
Capacity
Production
Export
Import
Consumption
650
465
174
194
485
300
227
88
13
152
82
65
23
3
44
25
25
1
5
29
85
71
18
70
123
9
0.1
13
22
Viscose Staple Fibre
Capacity
Production
Export
Import
Consumption
3080
2461
481
752
2732
1650
1140
119
39
1060
252
277
25
6
258
2
84
90
420
380
56
178
502
0
37
37
161
136
91
15
61
Source: World Fibre Report 2008
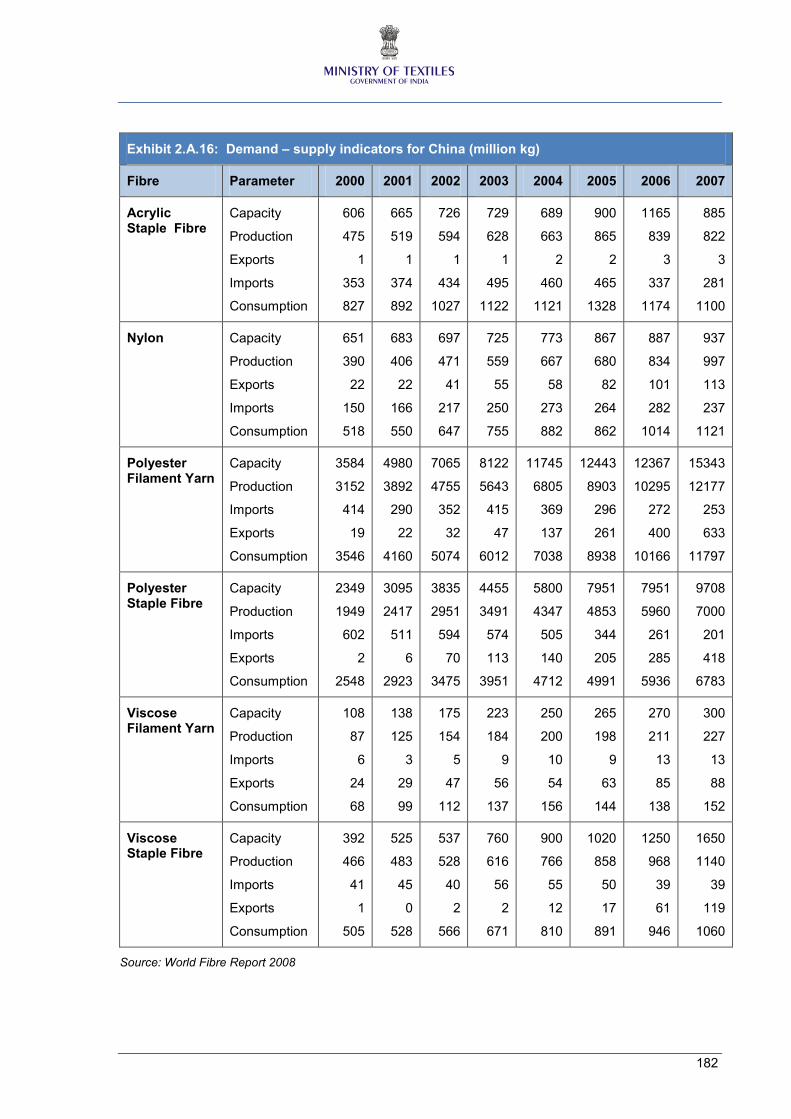
182
Exhibit 2.A.16: Demand – supply indicators for China (million kg)
Fibre Parameter 2000 2001 2002 2003 2004 2005 2006 2007
Acrylic Staple Fibre
Capacity
Production
Exports
Imports
Consumption
606
475
1
353
827
665
519
1
374
892
726
594
1
434
1027
729
628
1
495
1122
689
663
2
460
1121
900
865
2
465
1328
1165
839
3
337
1174
885
822
3
281
1100
Nylon Capacity
Production
Exports
Imports
Consumption
651
390
22
150
518
683
406
22
166
550
697
471
41
217
647
725
559
55
250
755
773
667
58
273
882
867
680
82
264
862
887
834
101
282
1014
937
997
113
237
1121
Polyester Filament Yarn
Capacity
Production
Imports
Exports
Consumption
3584
3152
414
19
3546
4980
3892
290
22
4160
7065
4755
352
32
5074
8122
5643
415
47
6012
11745
6805
369
137
7038
12443
8903
296
261
8938
12367
10295
272
400
10166
15343
12177
253
633
11797
Polyester Staple Fibre
Capacity
Production
Imports
Exports
Consumption
2349
1949
602
2
2548
3095
2417
511
6
2923
3835
2951
594
70
3475
4455
3491
574
113
3951
5800
4347
505
140
4712
7951
4853
344
205
4991
7951
5960
261
285
5936
9708
7000
201
418
6783
Viscose Filament Yarn
Capacity
Production
Imports
Exports
Consumption
108
87
6
24
68
138
125
3
29
99
175
154
5
47
112
223
184
9
56
137
250
200
10
54
156
265
198
9
63
144
270
211
13
85
138
300
227
13
88
152
Viscose Staple Fibre
Capacity
Production
Imports
Exports
Consumption
392
466
41
1
505
525
483
45
0
528
537
528
40
2
566
760
616
56
2
671
900
766
55
12
810
1020
858
50
17
891
1250
968
39
61
946
1650
1140
39
119
1060
Source: World Fibre Report 2008
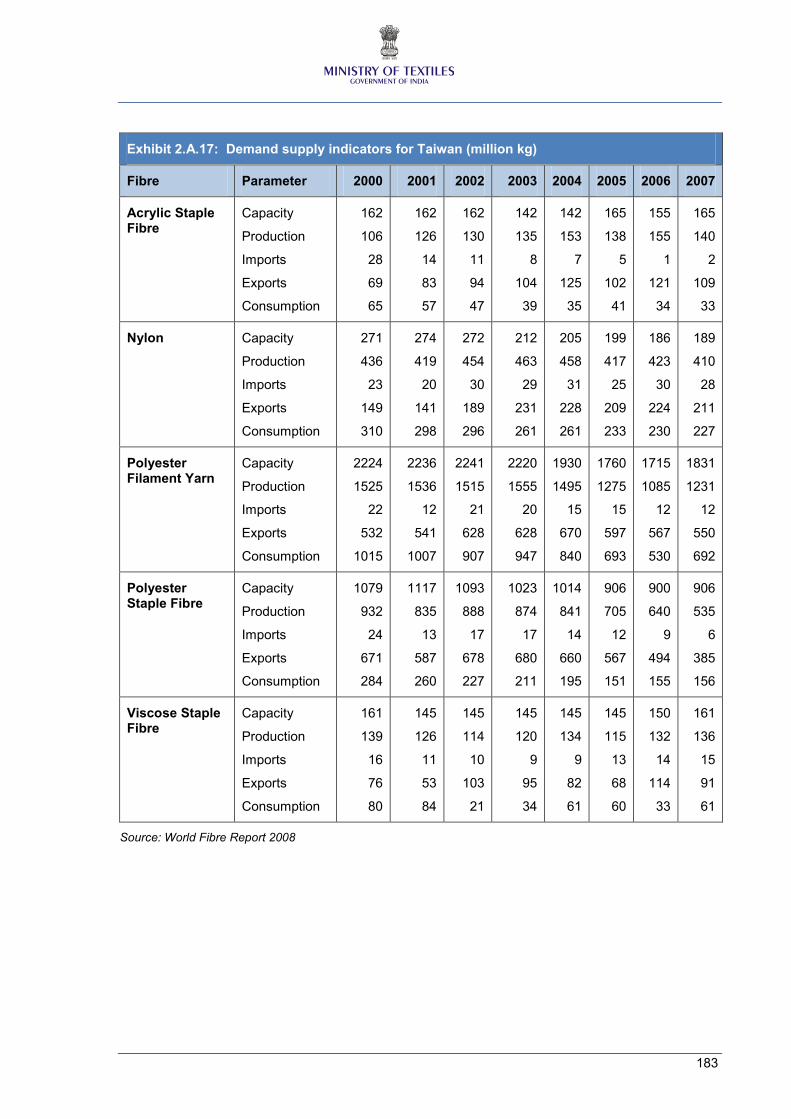
183
Exhibit 2.A.17: Demand supply indicators for Taiwan (million kg)
Fibre Parameter 2000 2001 2002 2003 2004 2005 2006 2007
Acrylic Staple Fibre
Capacity
Production
Imports
Exports
Consumption
162
106
28
69
65
162
126
14
83
57
162
130
11
94
47
142
135
8
104
39
142
153
7
125
35
165
138
5
102
41
155
155
1
121
34
165
140
2
109
33
Nylon Capacity
Production
Imports
Exports
Consumption
271
436
23
149
310
274
419
20
141
298
272
454
30
189
296
212
463
29
231
261
205
458
31
228
261
199
417
25
209
233
186
423
30
224
230
189
410
28
211
227
Polyester Filament Yarn
Capacity
Production
Imports
Exports
Consumption
2224
1525
22
532
1015
2236
1536
12
541
1007
2241
1515
21
628
907
2220
1555
20
628
947
1930
1495
15
670
840
1760
1275
15
597
693
1715
1085
12
567
530
1831
1231
12
550
692
Polyester Staple Fibre
Capacity
Production
Imports
Exports
Consumption
1079
932
24
671
284
1117
835
13
587
260
1093
888
17
678
227
1023
874
17
680
211
1014
841
14
660
195
906
705
12
567
151
900
640
9
494
155
906
535
6
385
156
Viscose Staple Fibre
Capacity
Production
Imports
Exports
Consumption
161
139
16
76
80
145
126
11
53
84
145
114
10
103
21
145
120
9
95
34
145
134
9
82
61
145
115
13
68
60
150
132
14
114
33
161
136
15
91
61
Source: World Fibre Report 2008
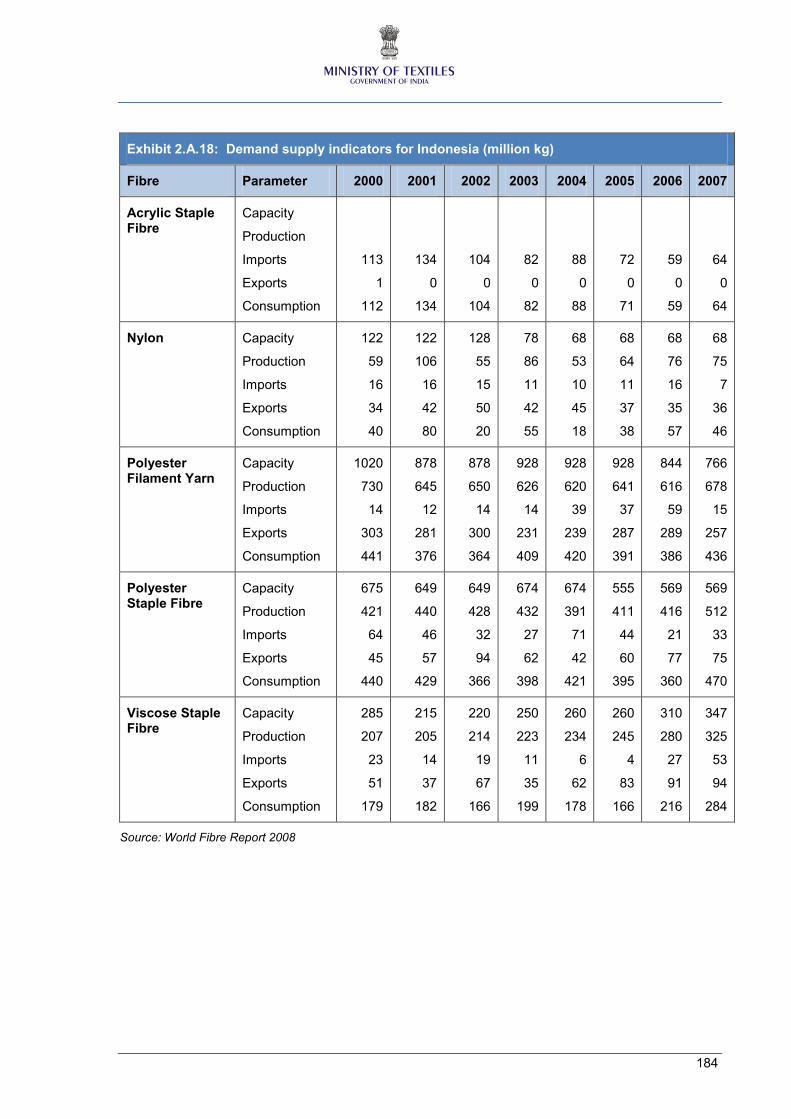
184
Exhibit 2.A.18: Demand supply indicators for Indonesia (million kg)
Fibre Parameter 2000 2001 2002 2003 2004 2005 2006 2007
Acrylic Staple Fibre
Capacity
Production
Imports
Exports
Consumption
113
1
112
134
0
134
104
0
104
82
0
82
88
0
88
72
0
71
59
0
59
64
0
64
Nylon Capacity
Production
Imports
Exports
Consumption
122
59
16
34
40
122
106
16
42
80
128
55
15
50
20
78
86
11
42
55
68
53
10
45
18
68
64
11
37
38
68
76
16
35
57
68
75
7
36
46
Polyester Filament Yarn
Capacity
Production
Imports
Exports
Consumption
1020
730
14
303
441
878
645
12
281
376
878
650
14
300
364
928
626
14
231
409
928
620
39
239
420
928
641
37
287
391
844
616
59
289
386
766
678
15
257
436
Polyester Staple Fibre
Capacity
Production
Imports
Exports
Consumption
675
421
64
45
440
649
440
46
57
429
649
428
32
94
366
674
432
27
62
398
674
391
71
42
421
555
411
44
60
395
569
416
21
77
360
569
512
33
75
470
Viscose Staple Fibre
Capacity
Production
Imports
Exports
Consumption
285
207
23
51
179
215
205
14
37
182
220
214
19
67
166
250
223
11
35
199
260
234
6
62
178
260
245
4
83
166
310
280
27
91
216
347
325
53
94
284
Source: World Fibre Report 2008
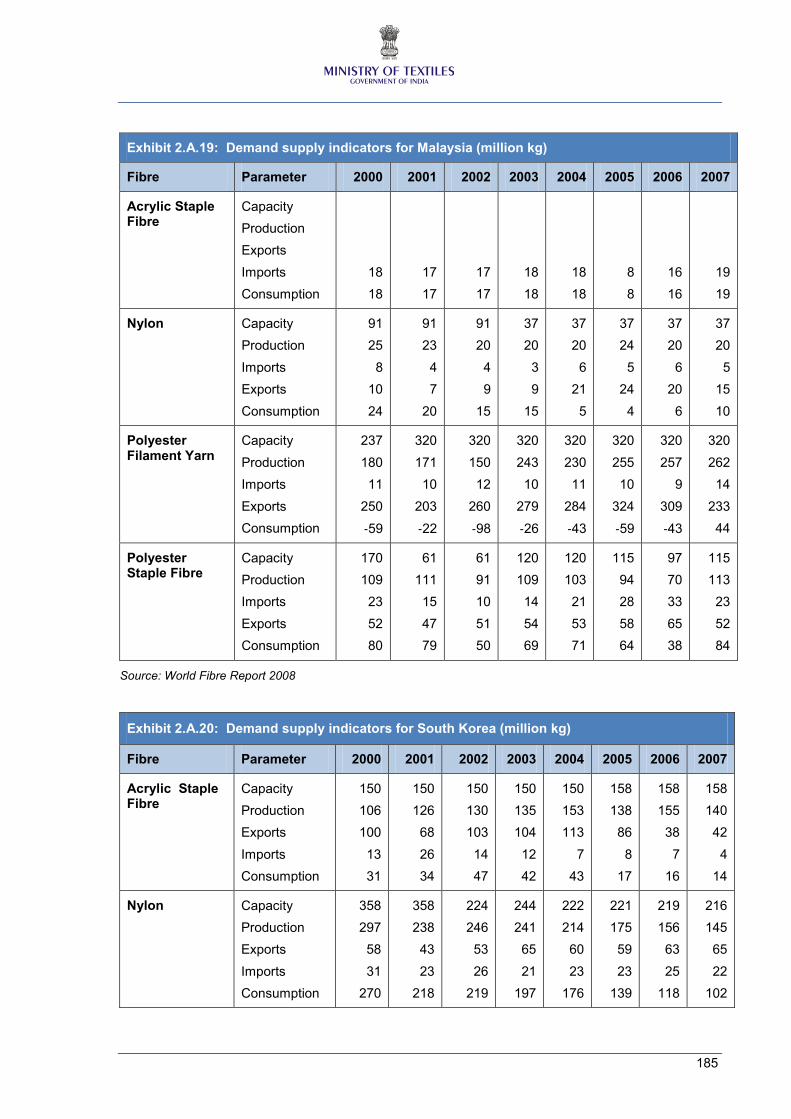
185
Exhibit 2.A.19: Demand supply indicators for Malaysia (million kg)
Fibre Parameter 2000 2001 2002 2003 2004 2005 2006 2007
Acrylic Staple Fibre
Capacity
Production
Exports
Imports
Consumption
18
18
17
17
17
17
18
18
18
18
8
8
16
16
19
19
Nylon Capacity
Production
Imports
Exports
Consumption
91
25
8
10
24
91
23
4
7
20
91
20
4
9
15
37
20
3
9
15
37
20
6
21
5
37
24
5
24
4
37
20
6
20
6
37
20
5
15
10
Polyester Filament Yarn
Capacity
Production
Imports
Exports
Consumption
237
180
11
250
‐59
320
171
10
203
‐22
320
150
12
260
‐98
320
243
10
279
‐26
320
230
11
284
‐43
320
255
10
324
‐59
320
257
9
309
‐43
320
262
14
233
44
Polyester Staple Fibre
Capacity
Production
Imports
Exports
Consumption
170
109
23
52
80
61
111
15
47
79
61
91
10
51
50
120
109
14
54
69
120
103
21
53
71
115
94
28
58
64
97
70
33
65
38
115
113
23
52
84
Source: World Fibre Report 2008
Exhibit 2.A.20: Demand supply indicators for South Korea (million kg)
Fibre Parameter 2000 2001 2002 2003 2004 2005 2006 2007
Acrylic Staple Fibre
Capacity
Production
Exports
Imports
Consumption
150
106
100
13
31
150
126
68
26
34
150
130
103
14
47
150
135
104
12
42
150
153
113
7
43
158
138
86
8
17
158
155
38
7
16
158
140
42
4
14
Nylon Capacity
Production
Exports
Imports
Consumption
358
297
58
31
270
358
238
43
23
218
224
246
53
26
219
244
241
65
21
197
222
214
60
23
176
221
175
59
23
139
219
156
63
25
118
216
145
65
22
102
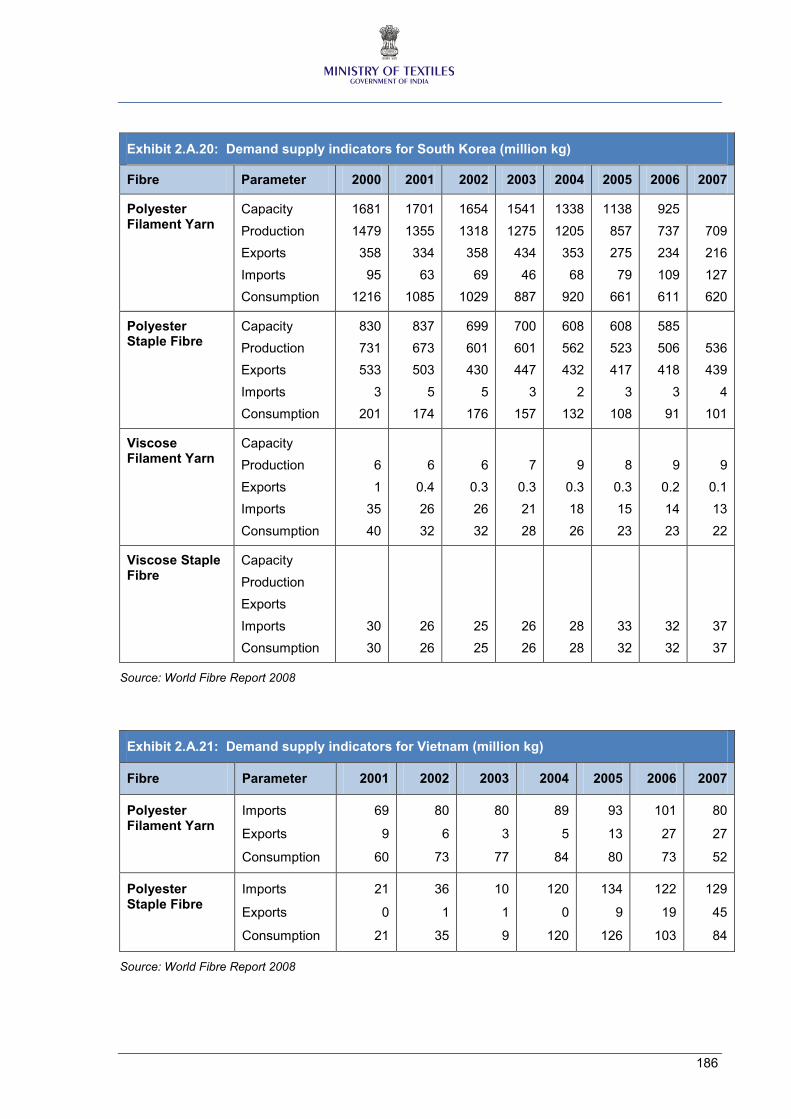
186
Exhibit 2.A.20: Demand supply indicators for South Korea (million kg)
Fibre Parameter 2000 2001 2002 2003 2004 2005 2006 2007
Polyester Filament Yarn
Capacity
Production
Exports
Imports
Consumption
1681
1479
358
95
1216
1701
1355
334
63
1085
1654
1318
358
69
1029
1541
1275
434
46
887
1338
1205
353
68
920
1138
857
275
79
661
925
737
234
109
611
709
216
127
620
Polyester Staple Fibre
Capacity
Production
Exports
Imports
Consumption
830
731
533
3
201
837
673
503
5
174
699
601
430
5
176
700
601
447
3
157
608
562
432
2
132
608
523
417
3
108
585
506
418
3
91
536
439
4
101
Viscose Filament Yarn
Capacity
Production
Exports
Imports
Consumption
6
1
35
40
6
0.4
26
32
6
0.3
26
32
7
0.3
21
28
9
0.3
18
26
8
0.3
15
23
9
0.2
14
23
9
0.1
13
22
Viscose Staple Fibre
Capacity
Production
Exports
Imports
Consumption
30
30
26
26
25
25
26
26
28
28
33
32
32
32
37
37
Source: World Fibre Report 2008
Exhibit 2.A.21: Demand supply indicators for Vietnam (million kg)
Fibre Parameter 2001 2002 2003 2004 2005 2006 2007
Polyester Filament Yarn
Imports
Exports
Consumption
69
9
60
80
6
73
80
3
77
89
5
84
93
13
80
101
27
73
80
27
52
Polyester Staple Fibre
Imports
Exports
Consumption
21
0
21
36
1
35
10
1
9
120
0
120
134
9
126
122
19
103
129
45
84
Source: World Fibre Report 2008
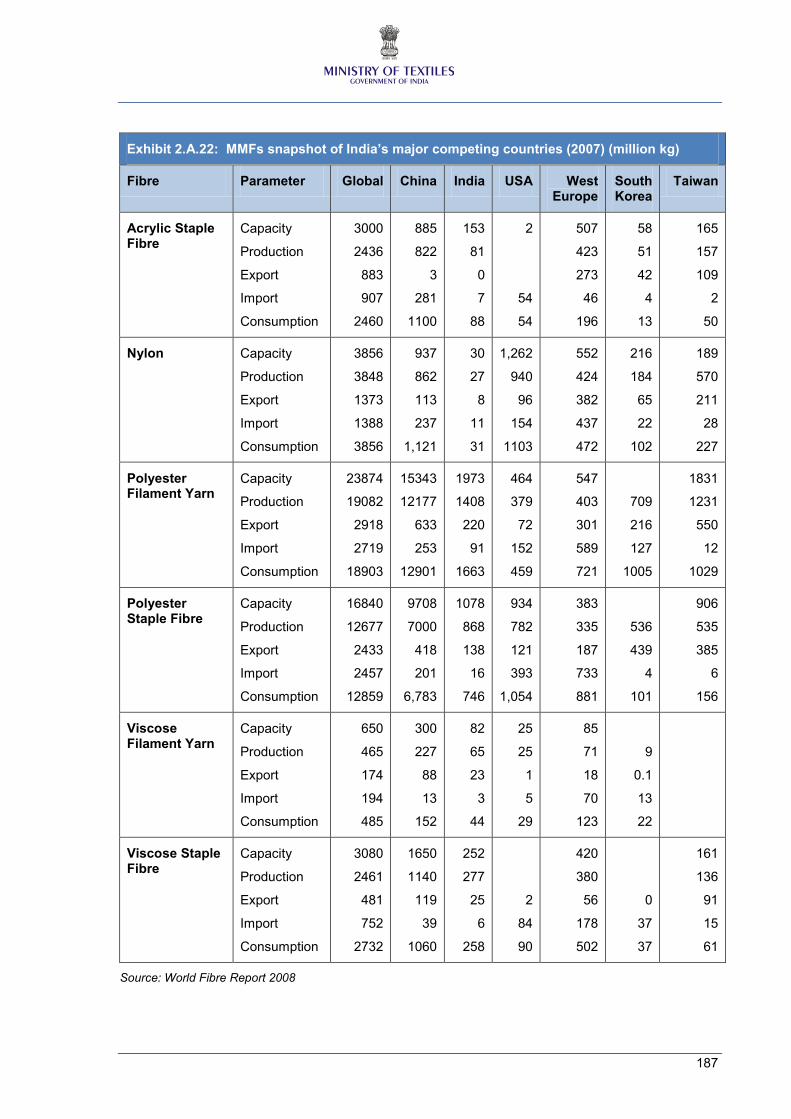
187
Exhibit 2.A.22: MMFs snapshot of India’s major competing countries (2007) (million kg)
Fibre Parameter Global China India USA West Europe
South Korea
Taiwan
Acrylic Staple Fibre
Capacity
Production
Export
Import
Consumption
3000
2436
883
907
2460
885
822
3
281
1100
153
81
0
7
88
2
54
54
507
423
273
46
196
58
51
42
4
13
165
157
109
2
50
Nylon Capacity
Production
Export
Import
Consumption
3856
3848
1373
1388
3856
937
862
113
237
1,121
30
27
8
11
31
1,262
940
96
154
1103
552
424
382
437
472
216
184
65
22
102
189
570
211
28
227
Polyester Filament Yarn
Capacity
Production
Export
Import
Consumption
23874
19082
2918
2719
18903
15343
12177
633
253
12901
1973
1408
220
91
1663
464
379
72
152
459
547
403
301
589
721
709
216
127
1005
1831
1231
550
12
1029
Polyester Staple Fibre
Capacity
Production
Export
Import
Consumption
16840
12677
2433
2457
12859
9708
7000
418
201
6,783
1078
868
138
16
746
934
782
121
393
1,054
383
335
187
733
881
536
439
4
101
906
535
385
6
156
Viscose Filament Yarn
Capacity
Production
Export
Import
Consumption
650
465
174
194
485
300
227
88
13
152
82
65
23
3
44
25
25
1
5
29
85
71
18
70
123
9
0.1
13
22
Viscose Staple Fibre
Capacity
Production
Export
Import
Consumption
3080
2461
481
752
2732
1650
1140
119
39
1060
252
277
25
6
258
2
84
90
420
380
56
178
502
0
37
37
161
136
91
15
61
Source: World Fibre Report 2008
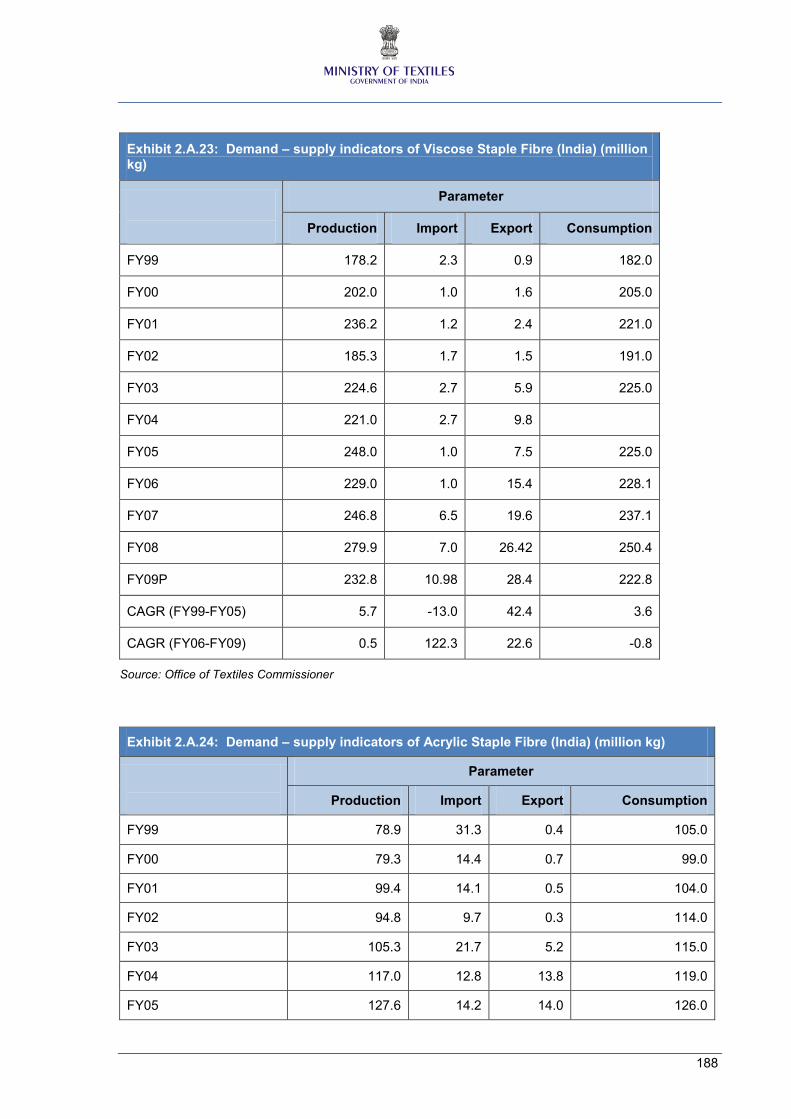
188
Exhibit 2.A.23: Demand – supply indicators of Viscose Staple Fibre (India) (million kg)
Parameter
Production Import Export Consumption
FY99 178.2 2.3 0.9 182.0
FY00 202.0 1.0 1.6 205.0
FY01 236.2 1.2 2.4 221.0
FY02 185.3 1.7 1.5 191.0
FY03 224.6 2.7 5.9 225.0
FY04 221.0 2.7 9.8 221.0
FY05 248.0 1.0 7.5 225.0
FY06 229.0 1.0 15.4 228.1
FY07 246.8 6.5 19.6 237.1
FY08 279.9 7.0 26.42 250.4
FY09P 232.8 10.98 28.4 222.8
CAGR (FY99-FY05) 5.7 -13.0 42.4 3.6
CAGR (FY06-FY09) 0.5 122.3 22.6 -0.8
Source: Office of Textiles Commissioner
Exhibit 2.A.24: Demand – supply indicators of Acrylic Staple Fibre (India) (million kg)
Parameter
Production Import Export Consumption
FY99 78.9 31.3 0.4 105.0
FY00 79.3 14.4 0.7 99.0
FY01 99.4 14.1 0.5 104.0
FY02 94.8 9.7 0.3 114.0
FY03 105.3 21.7 5.2 115.0
FY04 117.0 12.8 13.8 119.0
FY05 127.6 14.2 14.0 126.0
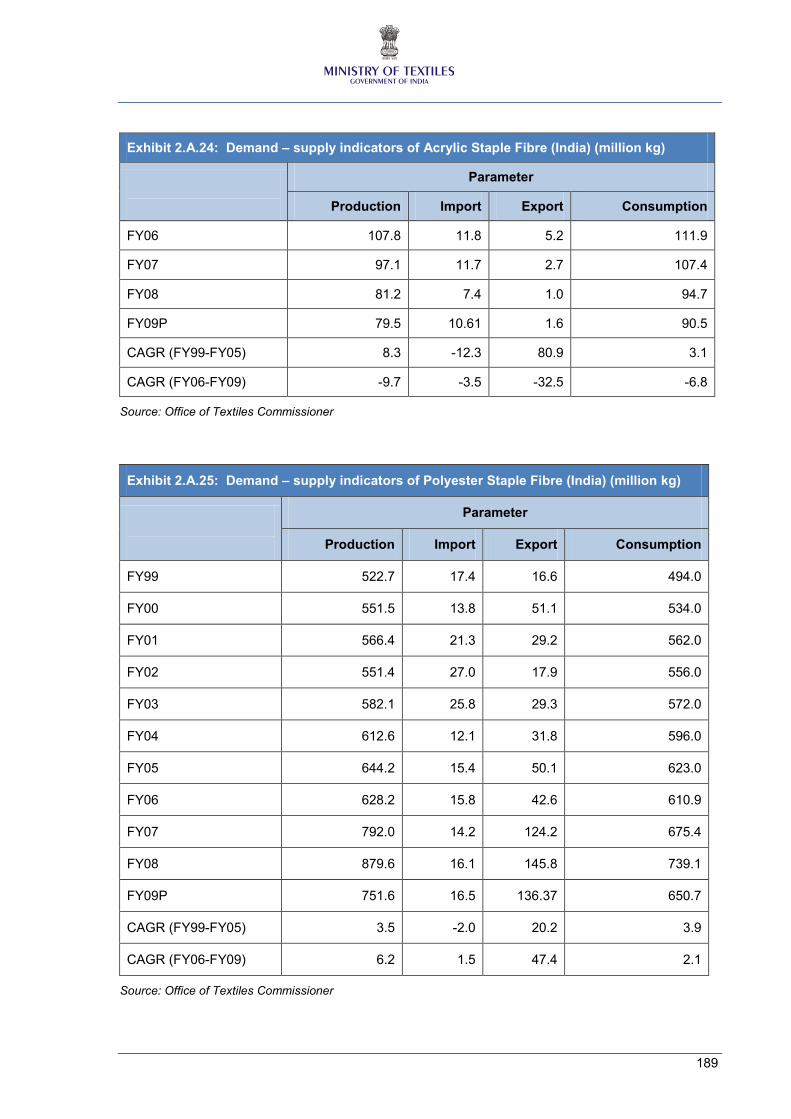
189
Exhibit 2.A.24: Demand – supply indicators of Acrylic Staple Fibre (India) (million kg)
Parameter
Production Import Export Consumption
FY06 107.8 11.8 5.2 111.9
FY07 97.1 11.7 2.7 107.4
FY08 81.2 7.4 1.0 94.7
FY09P 79.5 10.61 1.6 90.5
CAGR (FY99-FY05) 8.3 -12.3 80.9 3.1
CAGR (FY06-FY09) -9.7 -3.5 -32.5 -6.8
Source: Office of Textiles Commissioner
Exhibit 2.A.25: Demand – supply indicators of Polyester Staple Fibre (India) (million kg)
Parameter
Production Import Export Consumption
FY99 522.7 17.4 16.6 494.0
FY00 551.5 13.8 51.1 534.0
FY01 566.4 21.3 29.2 562.0
FY02 551.4 27.0 17.9 556.0
FY03 582.1 25.8 29.3 572.0
FY04 612.6 12.1 31.8 596.0
FY05 644.2 15.4 50.1 623.0
FY06 628.2 15.8 42.6 610.9
FY07 792.0 14.2 124.2 675.4
FY08 879.6 16.1 145.8 739.1
FY09P 751.6 16.5 136.37 650.7
CAGR (FY99-FY05) 3.5 -2.0 20.2 3.9
CAGR (FY06-FY09) 6.2 1.5 47.4 2.1
Source: Office of Textiles Commissioner
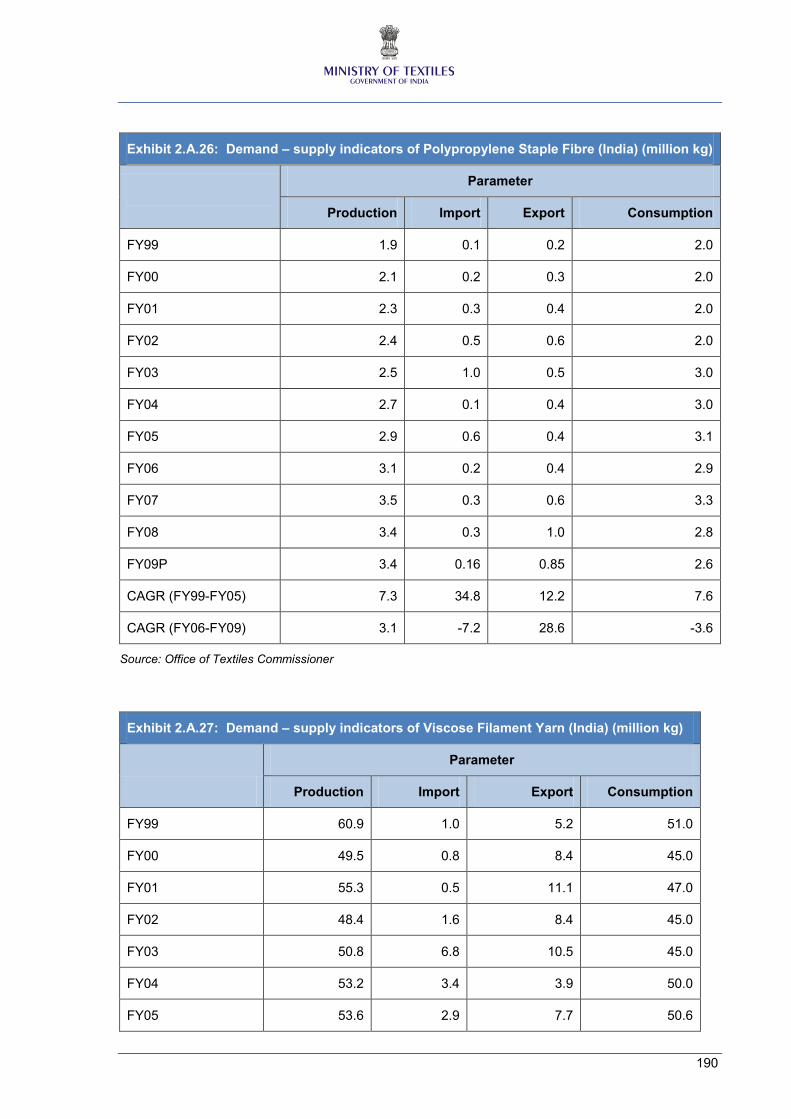
190
Exhibit 2.A.26: Demand – supply indicators of Polypropylene Staple Fibre (India) (million kg)
Parameter
Production Import Export Consumption
FY99 1.9 0.1 0.2 2.0
FY00 2.1 0.2 0.3 2.0
FY01 2.3 0.3 0.4 2.0
FY02 2.4 0.5 0.6 2.0
FY03 2.5 1.0 0.5 3.0
FY04 2.7 0.1 0.4 3.0
FY05 2.9 0.6 0.4 3.1
FY06 3.1 0.2 0.4 2.9
FY07 3.5 0.3 0.6 3.3
FY08 3.4 0.3 1.0 2.8
FY09P 3.4 0.16 0.85 2.6
CAGR (FY99-FY05) 7.3 34.8 12.2 7.6
CAGR (FY06-FY09) 3.1 -7.2 28.6 -3.6
Source: Office of Textiles Commissioner
Exhibit 2.A.27: Demand – supply indicators of Viscose Filament Yarn (India) (million kg)
Parameter
Production Import Export Consumption
FY99 60.9 1.0 5.2 51.0
FY00 49.5 0.8 8.4 45.0
FY01 55.3 0.5 11.1 47.0
FY02 48.4 1.6 8.4 45.0
FY03 50.8 6.8 10.5 45.0
FY04 53.2 3.4 3.9 50.0
FY05 53.6 2.9 7.7 50.6
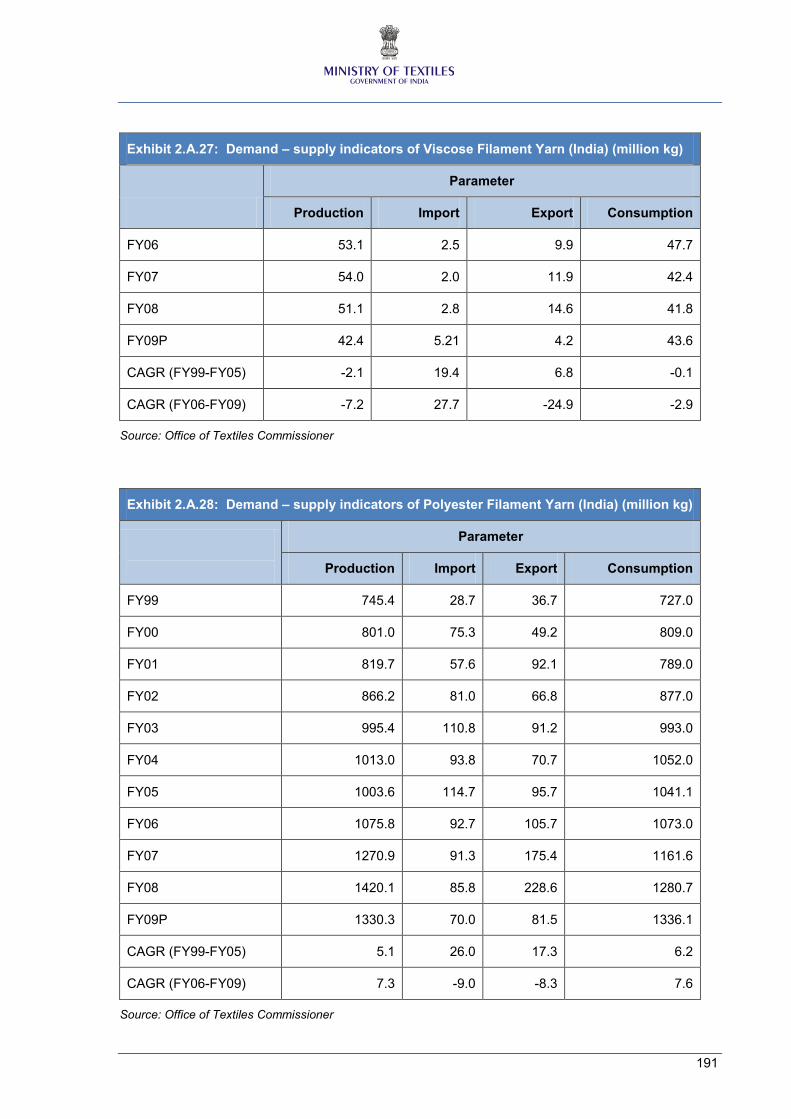
191
Exhibit 2.A.27: Demand – supply indicators of Viscose Filament Yarn (India) (million kg)
Parameter
Production Import Export Consumption
FY06 53.1 2.5 9.9 47.7
FY07 54.0 2.0 11.9 42.4
FY08 51.1 2.8 14.6 41.8
FY09P 42.4 5.21 4.2 43.6
CAGR (FY99-FY05) -2.1 19.4 6.8 -0.1
CAGR (FY06-FY09) -7.2 27.7 -24.9 -2.9
Source: Office of Textiles Commissioner
Exhibit 2.A.28: Demand – supply indicators of Polyester Filament Yarn (India) (million kg)
Parameter
Production Import Export Consumption
FY99 745.4 28.7 36.7 727.0
FY00 801.0 75.3 49.2 809.0
FY01 819.7 57.6 92.1 789.0
FY02 866.2 81.0 66.8 877.0
FY03 995.4 110.8 91.2 993.0
FY04 1013.0 93.8 70.7 1052.0
FY05 1003.6 114.7 95.7 1041.1
FY06 1075.8 92.7 105.7 1073.0
FY07 1270.9 91.3 175.4 1161.6
FY08 1420.1 85.8 228.6 1280.7
FY09P 1330.3 70.0 81.5 1336.1
CAGR (FY99-FY05) 5.1 26.0 17.3 6.2
CAGR (FY06-FY09) 7.3 -9.0 -8.3 7.6
Source: Office of Textiles Commissioner
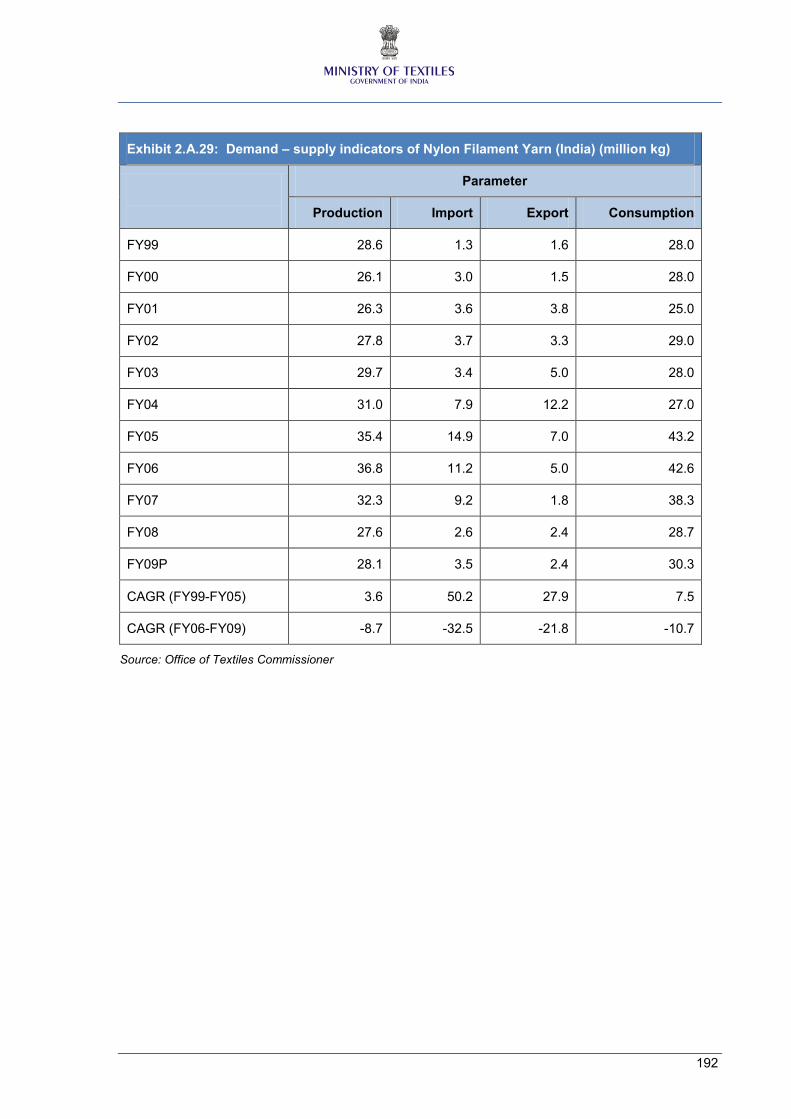
192
Exhibit 2.A.29: Demand – supply indicators of Nylon Filament Yarn (India) (million kg)
Parameter
Production Import Export Consumption
FY99 28.6 1.3 1.6 28.0
FY00 26.1 3.0 1.5 28.0
FY01 26.3 3.6 3.8 25.0
FY02 27.8 3.7 3.3 29.0
FY03 29.7 3.4 5.0 28.0
FY04 31.0 7.9 12.2 27.0
FY05 35.4 14.9 7.0 43.2
FY06 36.8 11.2 5.0 42.6
FY07 32.3 9.2 1.8 38.3
FY08 27.6 2.6 2.4 28.7
FY09P 28.1 3.5 2.4 30.3
CAGR (FY99-FY05) 3.6 50.2 27.9 7.5
CAGR (FY06-FY09) -8.7 -32.5 -21.8 -10.7
Source: Office of Textiles Commissioner
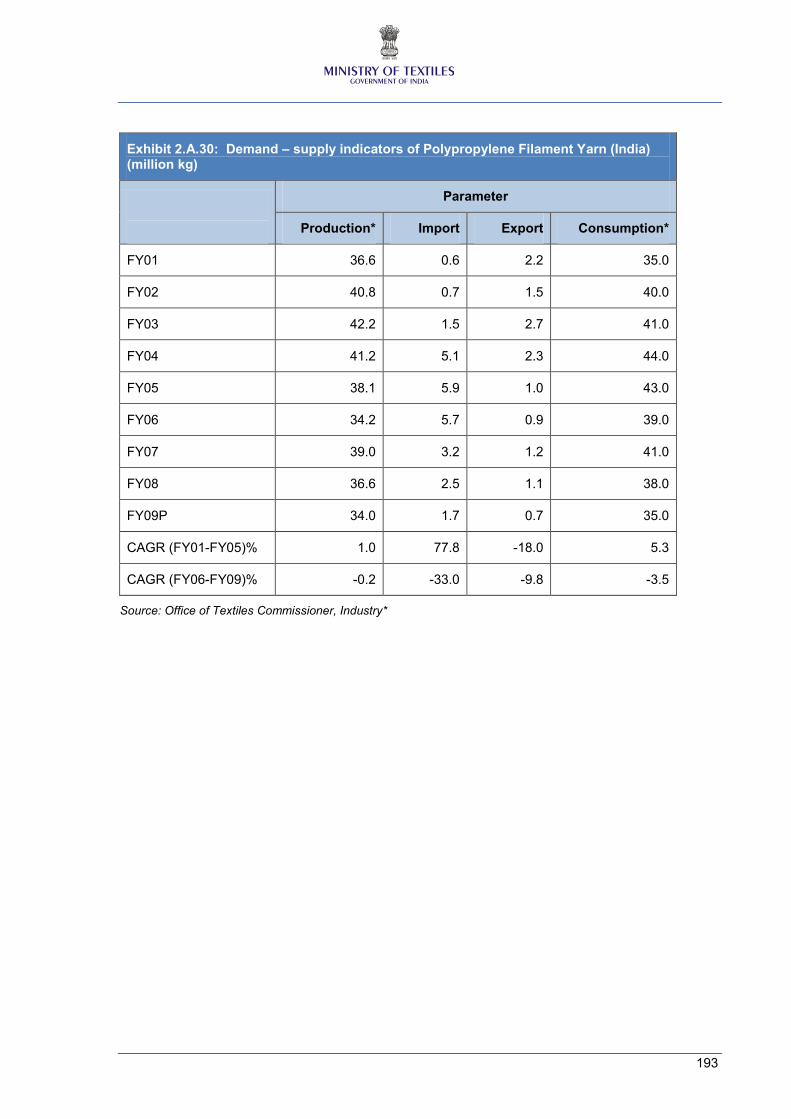
193
Exhibit 2.A.30: Demand – supply indicators of Polypropylene Filament Yarn (India) (million kg)
Parameter
Production* Import Export Consumption*
FY01 36.6 0.6 2.2 35.0
FY02 40.8 0.7 1.5 40.0
FY03 42.2 1.5 2.7 41.0
FY04 41.2 5.1 2.3 44.0
FY05 38.1 5.9 1.0 43.0
FY06 34.2 5.7 0.9 39.0
FY07 39.0 3.2 1.2 41.0
FY08 36.6 2.5 1.1 38.0
FY09P 34.0 1.7 0.7 35.0
CAGR (FY01-FY05)% 1.0 77.8 -18.0 5.3
CAGR (FY06-FY09)% -0.2 -33.0 -9.8 -3.5
Source: Office of Textiles Commissioner, Industry*
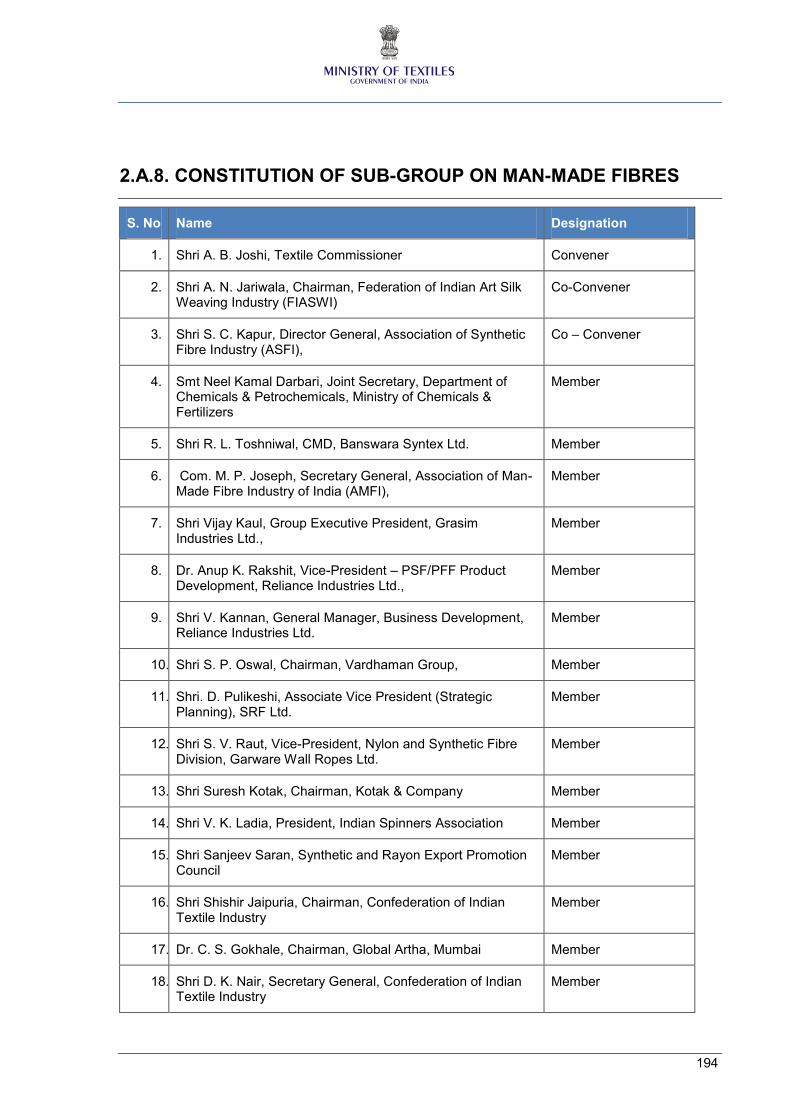
194
2.A.8. CONSTITUTION OF SUB-GROUP ON MAN-MADE FIBRES
S. No Name Designation
1. Shri A. B. Joshi, Textile Commissioner Convener
2. Shri A. N. Jariwala, Chairman, Federation of Indian Art Silk Weaving Industry (FIASWI)
Co-Convener
3. Shri S. C. Kapur, Director General, Association of Synthetic Fibre Industry (ASFI),
Co – Convener
4. Smt Neel Kamal Darbari, Joint Secretary, Department of Chemicals & Petrochemicals, Ministry of Chemicals & Fertilizers
Member
5. Shri R. L. Toshniwal, CMD, Banswara Syntex Ltd. Member
6. Com. M. P. Joseph, Secretary General, Association of Man-Made Fibre Industry of India (AMFI),
Member
7. Shri Vijay Kaul, Group Executive President, Grasim Industries Ltd.,
Member
8. Dr. Anup K. Rakshit, Vice-President – PSF/PFF Product Development, Reliance Industries Ltd.,
Member
9. Shri V. Kannan, General Manager, Business Development, Reliance Industries Ltd.
Member
10. Shri S. P. Oswal, Chairman, Vardhaman Group, Member
11. Shri. D. Pulikeshi, Associate Vice President (Strategic Planning), SRF Ltd.
Member
12. Shri S. V. Raut, Vice-President, Nylon and Synthetic Fibre Division, Garware Wall Ropes Ltd.
Member
13. Shri Suresh Kotak, Chairman, Kotak & Company Member
14. Shri V. K. Ladia, President, Indian Spinners Association Member
15. Shri Sanjeev Saran, Synthetic and Rayon Export Promotion Council
Member
16. Shri Shishir Jaipuria, Chairman, Confederation of Indian Textile Industry
Member
17. Dr. C. S. Gokhale, Chairman, Global Artha, Mumbai Member
18. Shri D. K. Nair, Secretary General, Confederation of Indian Textile Industry
Member
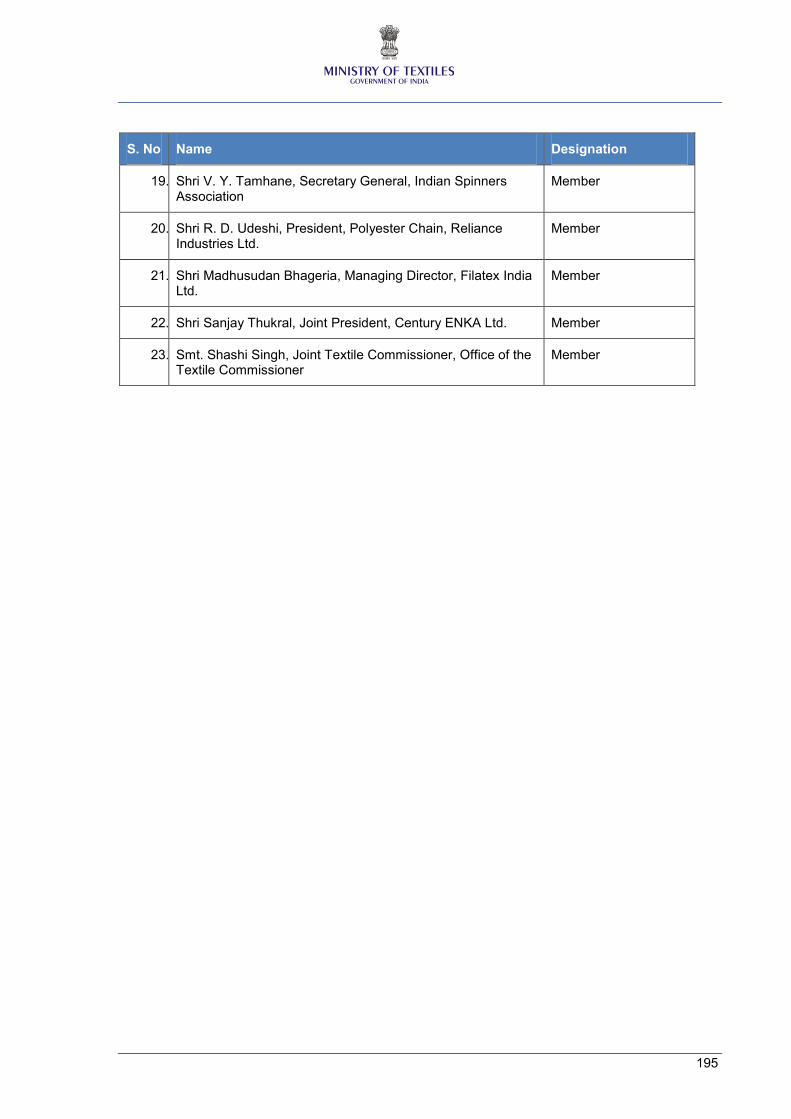
195
S. No Name Designation
19. Shri V. Y. Tamhane, Secretary General, Indian Spinners Association
Member
20. Shri R. D. Udeshi, President, Polyester Chain, Reliance Industries Ltd.
Member
21. Shri Madhusudan Bhageria, Managing Director, Filatex India Ltd.
Member
22. Shri Sanjay Thukral, Joint President, Century ENKA Ltd. Member
23. Smt. Shashi Singh, Joint Textile Commissioner, Office of the Textile Commissioner
Member