second quarter report 2018 - ericsson.com · 3 ericsson | second quarter report 2018 financial...
TRANSCRIPT
Ericsson | Second Quarter Report 2018 1
Second quarter report 2018Stockholm, July 18, 2018
Second quarter highlights
– Sales as reported and sales adjusted for comparable units and currency both decreased by -1% YoY. Segment Networks showed a sales growth of 2% YoY, both in reported sales and sales adjusted for comparable units and currency, with strong sales growth in North Amer-ica.
– Gross margin was 34.8% (29.1%). Gross margin excluding restructuring charges improved to 36.7% (30.9%), driven mainly by cost reductions and the continued ramp-up of Ericsson Radio System (ERS).
– Operating expenses were SEK 17.2 (15.4) b. Operating expenses excluding restructuring charges increased to SEK 16.3 (14.8) b. Cost reductions in SG&A were offset by increased investments in R&D, higher provision for variable compensation and an increase in provision for overdue trade receivables.
– Operating income was SEK 0.2 (-0.5) b. Operating income excluding restructuring charges was SEK 2.0 (1.0) b.
– Networks operating margin excluding restructuring charges was 13.3% (13.4%), with an improved gross margin offset by increased investments in R&D.
– Digital Services operating income (loss) excluding restructuring charges improved to SEK -1.5 (-1.8) b. due to improved gross margin to 42.6% (35.7%), mainly driven by cost reductions.
– Managed Services operating margin excluding restructuring charges improved to 6.5% (-2.1%) as a result of cost reductions and cus-tomer contract reviews.
– Cash flow from operating activities was SEK 1.4 (0.0) b. and free cash flow was SEK -0.6 (-1.3) b. Net cash increased to SEK 33.1 (24.0) b.
SEK b.
Q2 2018
Q2 2017
YoY change
Q1 2018
QoQ change
6 months 2018
6 months 2017
Net sales 49.8 50.3 -1% 43.4 15% 93.2 98.1
Sales growth adj. for comparable units and currency - - -1% - 9% - -
Gross margin 34.8% 29.1% - 34.2% - 34.5% 22.6%
Operating income (loss) 0.2 -0.5 - -0.3 - -0.1 -11.8
Operating margin 0.3% -1.1% - -0.7% - -0.2% -12.0%
Net income (loss) -1.8 -0.5 - -0.7 - -2.5 -10.5
EPS diluted, SEK -0.58 -0.14 - -0.25 - -0.83 -3.22
EPS (non-IFRS), SEK 1) -0.09 0.33 - 0.11 - 0.02 -1.86
Cash flow from operating activities 1.4 0.0 - 1.6 -8% 3.0 -1.5
Free cash flow 2) -0.6 -1.3 -54% 0.3 - -0.3 -4.6
Net cash, end of period 33.1 24.0 38% 35.6 -7% 33.1 24.0
Gross margin excluding restructuring charges 36.7% 30.9% - 35.9% - 36.3% 25.0%
Operating income (loss) excluding restructuring charges 2.0 1.0 109% 0.9 138% 2.9 -8.6
Operating margin excluding restructuring charges 4.1% 1.9% - 2.0% - 3.1% -8.7%
1) EPS diluted, excl. amortizations and write-downs of acquired intangible assets, and excluding restructuring charges. When a company reports a loss, the number of shares used for calculating earnings diluted per share shall be the same as for basic calculation.
2) Free cash flow: Cash flow from operating activities less net capital expenditures and other investments, see Alternative Performance Measures (APM) at the end of the report.
Non-IFRS financial measures are reconciled to the most directly reconcilable line items in the financial statements at the end of this report.
ericsson.com
Ericsson | Second Quarter Report 2018 CEO comments2
CEO comments
“We continue to execute on our focused business strategy and are tracking well towards our 2020 tar-get of an operating margin1) of at least 10%. The investments in technology leadership have resulted in increased gross margin1) to 37% (31%) and growth in segment Networks.
Customers turn to new technology in order to manage growing demand for data with sustained quality and without increasing costs. This, together with fixed wireless access, represent the first business cases for 5G. We will continue to invest in securing leader-ship in 5G. This includes further investments in R&D, to solidify our complete 5G portfolio, and investments in field trials. We also intend to selectively capture new business opportunities, through our 5G-ready 4G portfolio, to extend our footprint as operators prepare for 5G. We provide solutions for all frequency bands for 5G, which strengthens our global competitiveness.
We have good market traction in Networks, with a sales growth of 2%, particularly in North America where all major operators are preparing for 5G. Networks gross margin1) improved to 40% (36%). Digital Services is tracking towards a turnaround and gross margin1) improved to 43% (36%) YoY, and was stable QoQ. However, while losses decreased both YoY and QoQ, we still have a lot of work to do. The top priority is to turn around performance in the segment, but we are in parallel accelerating investments to make the portfolio 5G ready and cloud native. In Managed Services, gross margin1) improved to 14% (2%) supported by continued efficiency gains and customer contract reviews, resulting in a positive operating income. We have also on-boarded several new contracts in the quarter.
In segment Emerging Business and Other, we invest in strategic future growth areas such as Internet of Things (IoT). We see increasing momentum with several important customer wins with our connectivity platform in the quarter. However, sales are still low. Our media business generated a loss of SEK -0.4 b. in the quarter. We expect to close the announced divestment of Media Solutions, recently renamed MediaKind, by the end of the third quarter.
The SEK 10 b. cost reduction program, launched in Q2 2017, has been successfully completed. We reduced the total workforce by more than 2,000 in the quarter and by 20,500 in total as part of the program. These are tough but necessary actions to ensure competi-tiveness. Run-rate savings to date amount to more than SEK 10 b., and the effect is gradually becoming visible in the earnings, mainly through lower service delivery costs and common costs. Even though the cost reduction program is completed, our estimate for restructuring charges of SEK 5-7 b. for the full year remains, as we will continue our efficiency activities throughout the year.
Free cash flow improved to SEK -0.6 (-1.3) b. and our cash position remains strong. Our work to further strengthen the balance sheet continues.
We see strengthened momentum for 5G in the quarter and it is clear that our 5G-ready portfolio is attractive and competitive in the market. We have gradually improved the cost position and will continue to have a strict cost focus in order to further increase com-petitiveness and efficiency. We are confident in reaching our long-term target of at least 12% operating margin1) beyond 2020.”
Börje EkholmPresident and CEO
1) Excluding restructuring charges
Planning assumptions going forward
Market related – The Radio Access Network (RAN) equipment market is esti-
mated to decline by -2% for full-year 2018 with 2% CAGR for 2017-2022. In 2018, the Chinese market is expected to decline due to reduced LTE investments, while there is positive momentum in North America.
Currency exposure – Rule of thumb: A weakening by 10% of USD to SEK would have
a negative impact of approximately -5% on net sales and approximately -1 percentage point on operating margin (based on 2017 full-year currency exposure). For historical rates, see www.ericsson.com/en/investors
Ericsson related, 2018 – Sales: Seasonality (5-year average sales) is -2% between Q2
and Q3 and 23% between Q3 and Q4. – The current annual revenue baseline of the IPR licensing con-
tract portfolio is approximately SEK 7 b.
– Restructuring charges for full-year 2018 are estimated to be SEK 5-7 b.
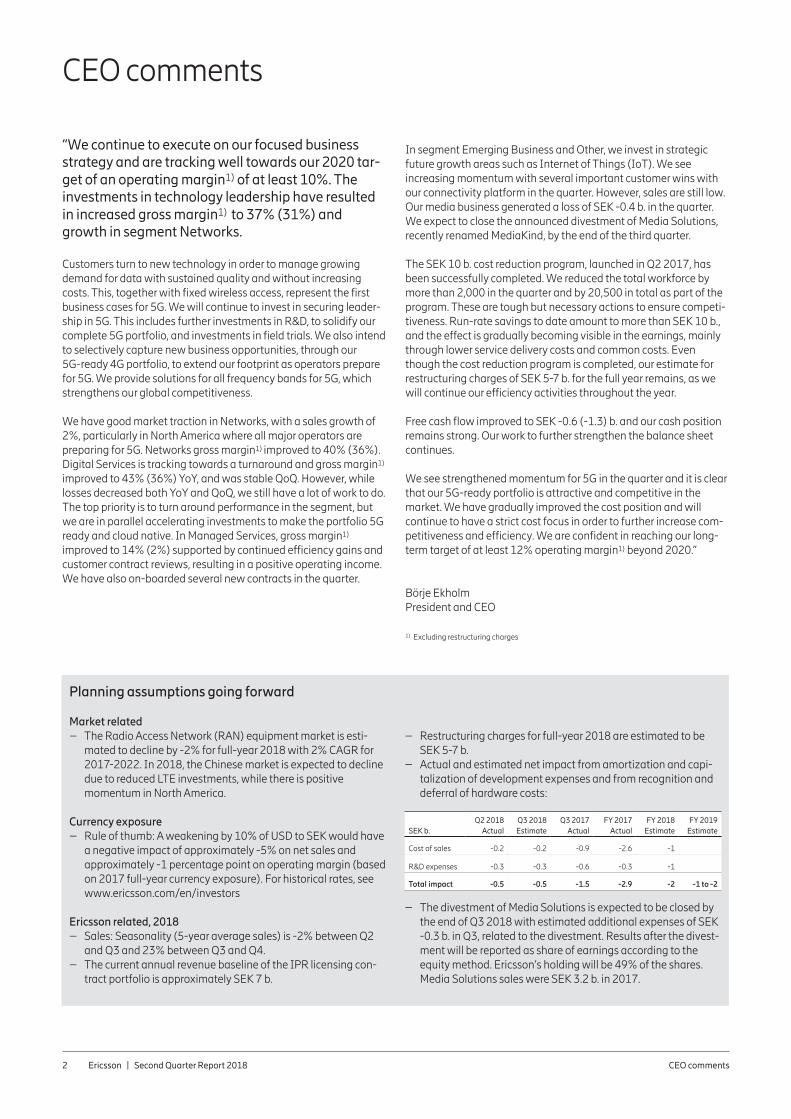
– Actual and estimated net impact from amortization and capi-talization of development expenses and from recognition and deferral of hardware costs:
SEK b.Q2 2018
ActualQ3 2018Estimate
Q3 2017Actual
FY 2017Actual
FY 2018Estimate
FY 2019 Estimate
Cost of sales -0.2 -0.2 -0.9 -2.6 -1
R&D expenses -0.3 -0.3 -0.6 -0.3 -1
Total impact -0.5 -0.5 -1.5 -2.9 -2 -1 to -2
– The divestment of Media Solutions is expected to be closed by the end of Q3 2018 with estimated additional expenses of SEK -0.3 b. in Q3, related to the divestment. Results after the divest-ment will be reported as share of earnings according to the equity method. Ericsson’s holding will be 49% of the shares. Media Solutions sales were SEK 3.2 b. in 2017.
Ericsson | Second Quarter Report 2018 Financial highlights3
Financial highlights SEK b.
Q2 2018
Q2 2017
YoY change
Q1 2018
QoQ change
6 months2018
6 months2017
Net sales 49.8 50.3 -1% 43.4 15% 93.2 98.1
Sales growth adj. for comparable units and currency - - -1% - 9% - -
Gross income 17.3 14.6 18% 14.9 17% 32.2 22.1
Gross margin (%) 34.8% 29.1% - 34.2% - 34.5% 22.6%
Research and development expenses -9.8 -8.4 17% -9.1 8% -18.9 -17.4
Selling and administrative expenses -7.1 -6.8 3% -6.2 15% -13.2 -15.0
Impairment losses on trade receivables -0.4 -0.2 57% 0.0 - -0.4 -1.9
Other operating income and expenses 0.0 0.2 -95% 0.1 -87% 0.1 0.4
Operating income (loss) 0.2 -0.5 - -0.3 - -0.1 -11.8
Operating margin (%) 0.3% -1.1% - -0.7% - -0.2% -12.0%
Financial net -0.8 0.1 - -0.5 50% -1.4 -0.4
Taxes -1.2 0.0 - 0.1 - -1.0 1.7
Net income (loss) -1.8 -0.5 - -0.7 - -2.5 -10.5
Restructuring charges -1.9 -1.5 24% -1.2 60% -3.1 -3.3
Gross income excluding restructuring charges 18.3 15.6 17% 15.6 17% 33.9 24.5
Gross margin excluding restructuring charges 36.7% 30.9% - 35.9% - 36.3% 25.0%
Net sales Sales as reported decreased by -1 %YoY. Sales adjusted for compa-rable units and currency decreased by -1% YoY. Sales as reported in Networks increased by 2% YoY, driven by strong sales growth in North America. Digital Services sales declined by -11% YoY, mainly due to continued decline in legacy product sales and lower telecom core sales in North East Asia. Managed Services sales declined by -2% YoY, mainly as a result of customer contract reviews. Sales in Emerging Business and Other increased by 2% YoY, mainly driven by growth in iconectiv and IoT partly offset by lower sales in the media solutions business.
Sequential sales increased by 15%. Sales adjusted for comparable units and currency increased by 9% QoQ.
IPR licensing revenuesIPR licensing revenues declined to SEK 1.8 (2.0) b. YoY and decreased sequentially from SEK 1.9 b.
Gross marginGross margin improved to 34.8% (29.1%). Gross margin excluding restructuring charges increased to 36.7% (30.9%) with significant improvements in all segments. Key drivers of the improvement were cost reductions, ramp-up of Ericsson Radio System (ERS) product platform, market mix and good progress in addressing non-strategic contracts in Managed Services. Completion in 2017 of the amorti-zation of software release development expenses had a positive effect on gross margin YoY.
Sequentially, gross margin increased to 34.8% from 34.2%. Gross margin excluding restructuring charges improved sequentially to 36.7% from 35.9%.
Operating expensesOperating expenses increased to SEK 17.2 (15.4) b. Operating expenses excluding restructuring charges increased to SEK 16.3 (14.8) b., mainly due to increased R&D expenses while selling and administrative expenses (SG&A) were stable YoY.
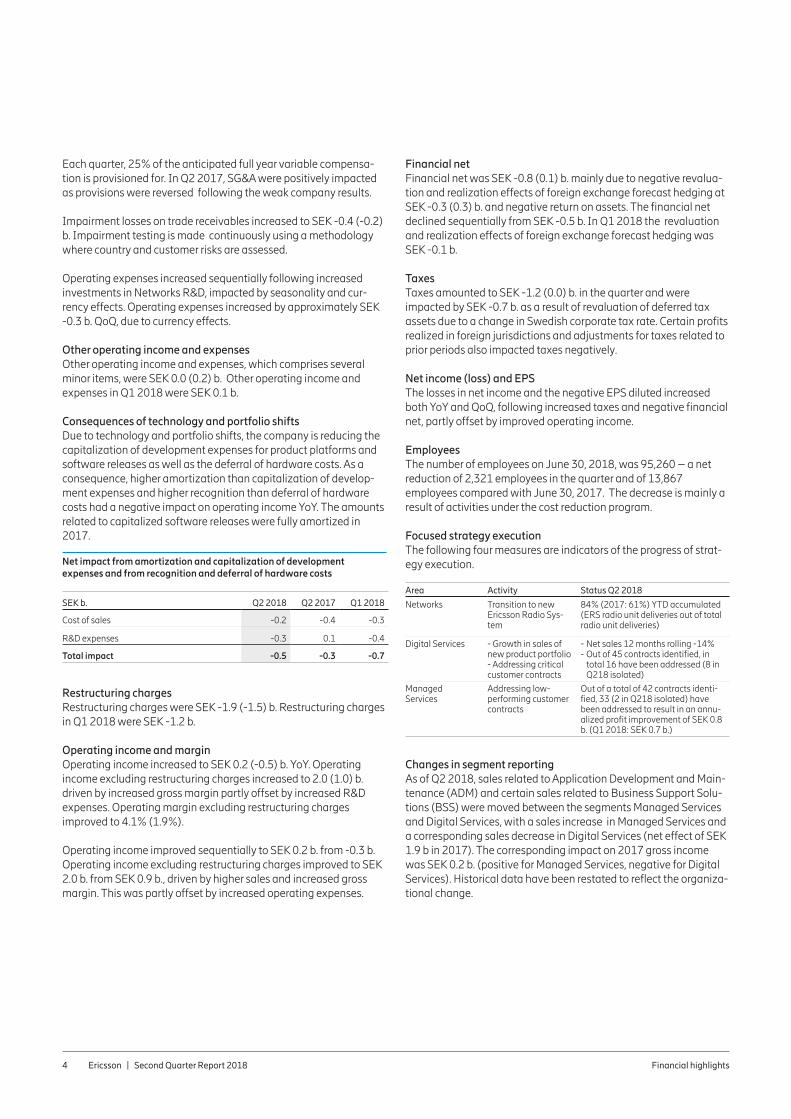
Selling & administrative expenses excluding restructuring charges, SEK b.
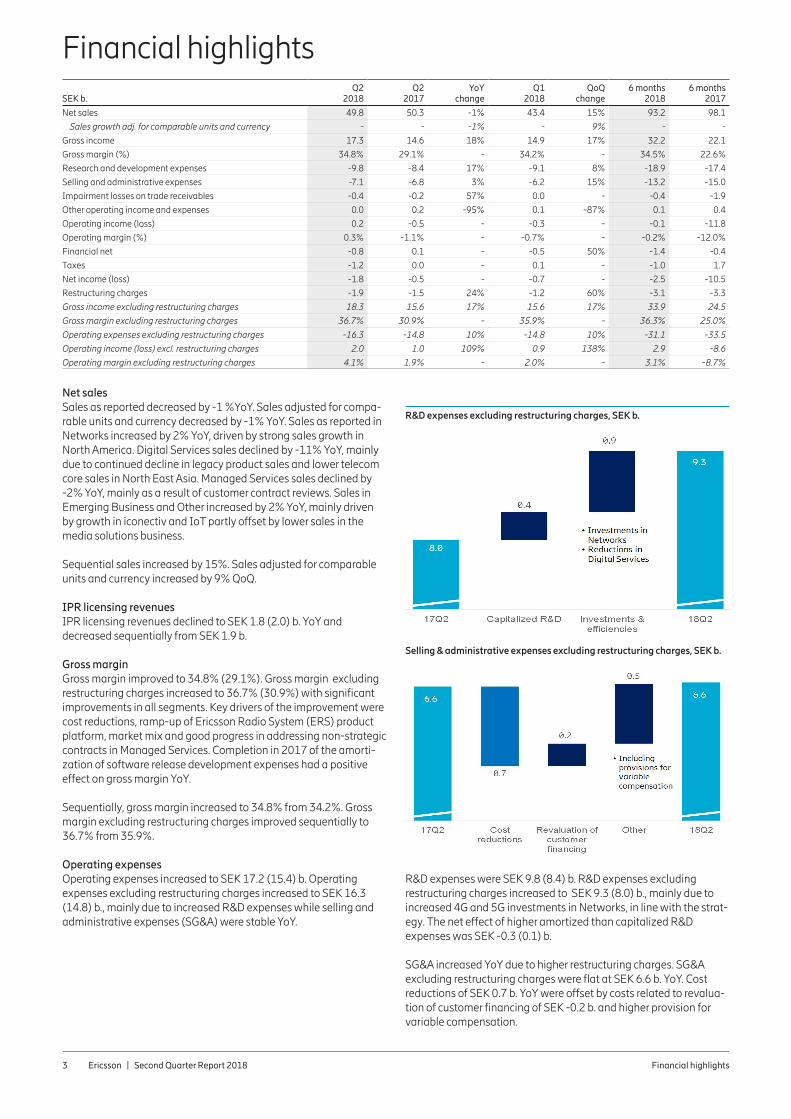
R&D expenses were SEK 9.8 (8.4) b. R&D expenses excluding restructuring charges increased to SEK 9.3 (8.0) b., mainly due to increased 4G and 5G investments in Networks, in line with the strat-egy. The net effect of higher amortized than capitalized R&D expenses was SEK -0.3 (0.1) b.
SG&A increased YoY due to higher restructuring charges. SG&A excluding restructuring charges were flat at SEK 6.6 b. YoY. Cost reductions of SEK 0.7 b. YoY were offset by costs related to revalua-tion of customer financing of SEK -0.2 b. and higher provision for variable compensation.
Operating expenses excluding restructuring charges -16.3 -14.8 10% -14.8 10% -31.1 -33.5
Operating income (loss) excl. restructuring charges 2.0 1.0 109% 0.9 138% 2.9 -8.6
Operating margin excluding restructuring charges 4.1% 1.9% - 2.0% - 3.1% -8.7%
R&D expenses excluding restructuring charges, SEK b.
Ericsson | Second Quarter Report 2018 Financial highlights4
Each quarter, 25% of the anticipated full year variable compensa-tion is provisioned for. In Q2 2017, SG&A were positively impacted as provisions were reversed following the weak company results.
Impairment losses on trade receivables increased to SEK -0.4 (-0.2) b. Impairment testing is made continuously using a methodology where country and customer risks are assessed.
Operating expenses increased sequentially following increased investments in Networks R&D, impacted by seasonality and cur-rency effects. Operating expenses increased by approximately SEK -0.3 b. QoQ, due to currency effects.
Other operating income and expensesOther operating income and expenses, which comprises several minor items, were SEK 0.0 (0.2) b. Other operating income and expenses in Q1 2018 were SEK 0.1 b.
Consequences of technology and portfolio shiftsDue to technology and portfolio shifts, the company is reducing the capitalization of development expenses for product platforms and software releases as well as the deferral of hardware costs. As a consequence, higher amortization than capitalization of develop-ment expenses and higher recognition than deferral of hardware costs had a negative impact on operating income YoY. The amounts related to capitalized software releases were fully amortized in 2017.
Net impact from amortization and capitalization of development expenses and from recognition and deferral of hardware costs
SEK b. Q2 2018 Q2 2017 Q1 2018
Cost of sales -0.2 -0.4 -0.3
R&D expenses -0.3 0.1 -0.4
Total impact -0.5 -0.3 -0.7
Restructuring chargesRestructuring charges were SEK -1.9 (-1.5) b. Restructuring charges in Q1 2018 were SEK -1.2 b.
Operating income and marginOperating income increased to SEK 0.2 (-0.5) b. YoY. Operating income excluding restructuring charges increased to 2.0 (1.0) b. driven by increased gross margin partly offset by increased R&D expenses. Operating margin excluding restructuring charges improved to 4.1% (1.9%).
Operating income improved sequentially to SEK 0.2 b. from -0.3 b. Operating income excluding restructuring charges improved to SEK 2.0 b. from SEK 0.9 b., driven by higher sales and increased gross margin. This was partly offset by increased operating expenses.
Financial netFinancial net was SEK -0.8 (0.1) b. mainly due to negative revalua-tion and realization effects of foreign exchange forecast hedging at SEK -0.3 (0.3) b. and negative return on assets. The financial net declined sequentially from SEK -0.5 b. In Q1 2018 the revaluation and realization effects of foreign exchange forecast hedging was SEK -0.1 b.
TaxesTaxes amounted to SEK -1.2 (0.0) b. in the quarter and were impacted by SEK -0.7 b. as a result of revaluation of deferred tax assets due to a change in Swedish corporate tax rate. Certain profits realized in foreign jurisdictions and adjustments for taxes related to prior periods also impacted taxes negatively.
Net income (loss) and EPS The losses in net income and the negative EPS diluted increased both YoY and QoQ, following increased taxes and negative financial net, partly offset by improved operating income.
Employees The number of employees on June 30, 2018, was 95,260 – a net reduction of 2,321 employees in the quarter and of 13,867 employees compared with June 30, 2017. The decrease is mainly a result of activities under the cost reduction program.
Focused strategy execution The following four measures are indicators of the progress of strat-egy execution.
Area Activity Status Q2 2018
Networks Transition to new Ericsson Radio Sys-tem
84% (2017: 61%) YTD accumulated (ERS radio unit deliveries out of total radio unit deliveries)
Digital Services - Growth in sales of new product portfolio- Addressing critical customer contracts
- Net sales 12 months rolling -14%- Out of 45 contracts identified, in
total 16 have been addressed (8 in Q218 isolated)
Managed Services
Addressing low- performing customer contracts
Out of a total of 42 contracts identi-fied, 33 (2 in Q218 isolated) have been addressed to result in an annu-alized profit improvement of SEK 0.8 b. (Q1 2018: SEK 0.7 b.)
Changes in segment reportingAs of Q2 2018, sales related to Application Development and Main-tenance (ADM) and certain sales related to Business Support Solu-tions (BSS) were moved between the segments Managed Services and Digital Services, with a sales increase in Managed Services and a corresponding sales decrease in Digital Services (net effect of SEK 1.9 b in 2017). The corresponding impact on 2017 gross income was SEK 0.2 b. (positive for Managed Services, negative for Digital Services). Historical data have been restated to reflect the organiza-tional change.
Ericsson | Second Quarter Report 2018 Market area sales5
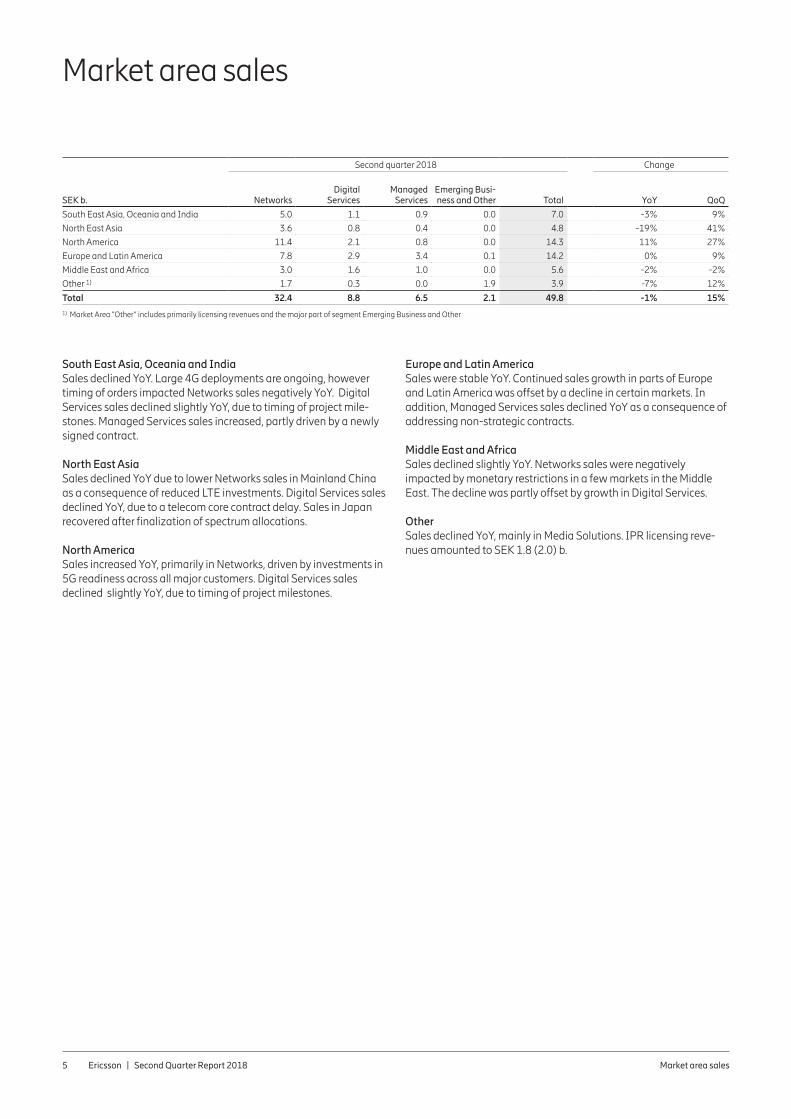
Market area sales
South East Asia, Oceania and IndiaSales declined YoY. Large 4G deployments are ongoing, however timing of orders impacted Networks sales negatively YoY. Digital Services sales declined slightly YoY, due to timing of project mile-stones. Managed Services sales increased, partly driven by a newly signed contract.
North East AsiaSales declined YoY due to lower Networks sales in Mainland China as a consequence of reduced LTE investments. Digital Services sales declined YoY, due to a telecom core contract delay. Sales in Japan recovered after finalization of spectrum allocations.
North AmericaSales increased YoY, primarily in Networks, driven by investments in 5G readiness across all major customers. Digital Services sales declined slightly YoY, due to timing of project milestones.
Europe and Latin AmericaSales were stable YoY. Continued sales growth in parts of Europe and Latin America was offset by a decline in certain markets. In addition, Managed Services sales declined YoY as a consequence of addressing non-strategic contracts.
Middle East and AfricaSales declined slightly YoY. Networks sales were negatively impacted by monetary restrictions in a few markets in the Middle East. The decline was partly offset by growth in Digital Services.
OtherSales declined YoY, mainly in Media Solutions. IPR licensing reve-nues amounted to SEK 1.8 (2.0) b.
Second quarter 2018 Change
SEK b. NetworksDigital
ServicesManaged
Services Emerging Busi-ness and Other Total YoY QoQ
South East Asia, Oceania and India 5.0 1.1 0.9 0.0 7.0 -3% 9%
North East Asia 3.6 0.8 0.4 0.0 4.8 -19% 41%
North America 11.4 2.1 0.8 0.0 14.3 11% 27%
Europe and Latin America 7.8 2.9 3.4 0.1 14.2 0% 9%
Middle East and Africa 3.0 1.6 1.0 0.0 5.6 -2% -2%
Other 1) 1.7 0.3 0.0 1.9 3.9 -7% 12%
Total 32.4 8.8 6.5 2.1 49.8 -1% 15%
1) Market Area “Other” includes primarily licensing revenues and the major part of segment Emerging Business and Other
Ericsson | Second Quarter Report 2018 Segment results | Networks6
Segment results
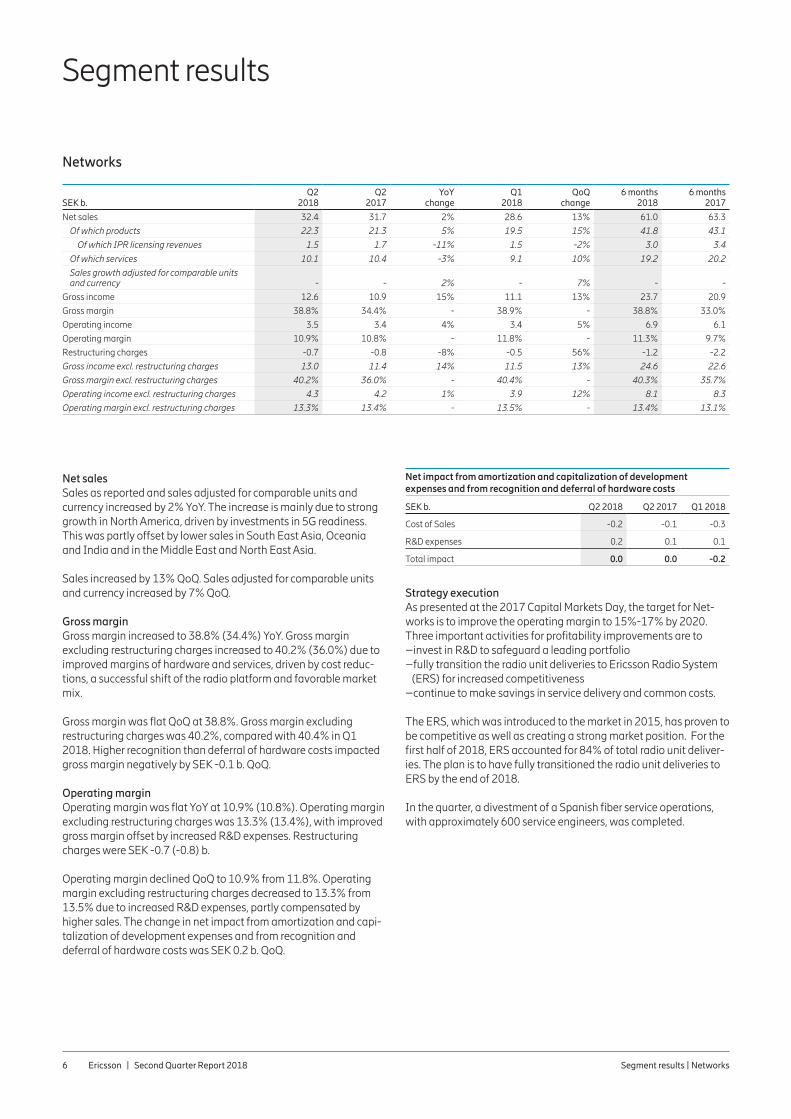
Networks
SEK b.
Q2 2018
Q2 2017
YoY change
Q1 2018
QoQ change
6 months 2018
6 months 2017
Net sales 32.4 31.7 2% 28.6 13% 61.0 63.3
Of which products 22.3 21.3 5% 19.5 15% 41.8 43.1
Of which IPR licensing revenues 1.5 1.7 -11% 1.5 -2% 3.0 3.4
Of which services 10.1 10.4 -3% 9.1 10% 19.2 20.2
Sales growth adjusted for comparable units and currency - - 2% - 7% - -
Gross income 12.6 10.9 15% 11.1 13% 23.7 20.9
Gross margin 38.8% 34.4% - 38.9% - 38.8% 33.0%
Operating income 3.5 3.4 4% 3.4 5% 6.9 6.1
Operating margin 10.9% 10.8% - 11.8% - 11.3% 9.7%
Restructuring charges -0.7 -0.8 -8% -0.5 56% -1.2 -2.2
Gross income excl. restructuring charges 13.0 11.4 14% 11.5 13% 24.6 22.6
Gross margin excl. restructuring charges 40.2% 36.0% - 40.4% - 40.3% 35.7%
Operating income excl. restructuring charges 4.3 4.2 1% 3.9 12% 8.1 8.3
Operating margin excl. restructuring charges 13.3% 13.4% - 13.5% - 13.4% 13.1%
Net salesSales as reported and sales adjusted for comparable units and currency increased by 2% YoY. The increase is mainly due to strong growth in North America, driven by investments in 5G readiness. This was partly offset by lower sales in South East Asia, Oceania and India and in the Middle East and North East Asia.
Sales increased by 13% QoQ. Sales adjusted for comparable units and currency increased by 7% QoQ.
Gross marginGross margin increased to 38.8% (34.4%) YoY. Gross margin excluding restructuring charges increased to 40.2% (36.0%) due to improved margins of hardware and services, driven by cost reduc-tions, a successful shift of the radio platform and favorable market mix.
Gross margin was flat QoQ at 38.8%. Gross margin excluding restructuring charges was 40.2%, compared with 40.4% in Q1 2018. Higher recognition than deferral of hardware costs impacted gross margin negatively by SEK -0.1 b. QoQ.
Operating marginOperating margin was flat YoY at 10.9% (10.8%). Operating margin excluding restructuring charges was 13.3% (13.4%), with improved gross margin offset by increased R&D expenses. Restructuring charges were SEK -0.7 (-0.8) b.
Operating margin declined QoQ to 10.9% from 11.8%. Operating margin excluding restructuring charges decreased to 13.3% from 13.5% due to increased R&D expenses, partly compensated by higher sales. The change in net impact from amortization and capi-talization of development expenses and from recognition and deferral of hardware costs was SEK 0.2 b. QoQ.
Net impact from amortization and capitalization of development expenses and from recognition and deferral of hardware costs
SEK b. Q2 2018 Q2 2017 Q1 2018
Cost of Sales -0.2 -0.1 -0.3
R&D expenses 0.2 0.1 0.1
Total impact 0.0 0.0 -0.2
Strategy executionAs presented at the 2017 Capital Markets Day, the target for Net-works is to improve the operating margin to 15%-17% by 2020. Three important activities for profitability improvements are to–invest in R&D to safeguard a leading portfolio–fully transition the radio unit deliveries to Ericsson Radio System (ERS) for increased competitiveness –continue to make savings in service delivery and common costs.
The ERS, which was introduced to the market in 2015, has proven to be competitive as well as creating a strong market position. For the first half of 2018, ERS accounted for 84% of total radio unit deliver-ies. The plan is to have fully transitioned the radio unit deliveries to ERS by the end of 2018.
In the quarter, a divestment of a Spanish fiber service operations, with approximately 600 service engineers, was completed.
Ericsson | Second Quarter Report 2018 Segment results | Digital Services7
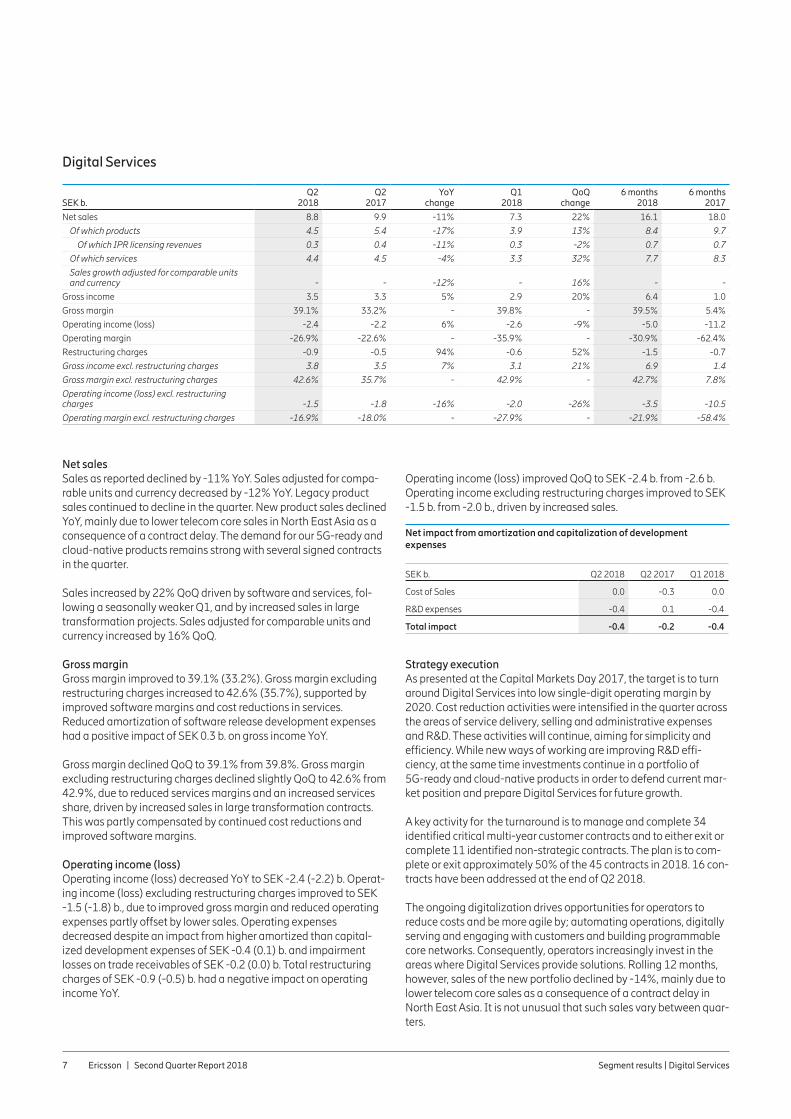
Net sales Sales as reported declined by -11% YoY. Sales adjusted for compa-rable units and currency decreased by -12% YoY. Legacy product sales continued to decline in the quarter. New product sales declined YoY, mainly due to lower telecom core sales in North East Asia as a consequence of a contract delay. The demand for our 5G-ready and cloud-native products remains strong with several signed contracts in the quarter.
Sales increased by 22% QoQ driven by software and services, fol-lowing a seasonally weaker Q1, and by increased sales in large transformation projects. Sales adjusted for comparable units and currency increased by 16% QoQ.
Gross marginGross margin improved to 39.1% (33.2%). Gross margin excluding restructuring charges increased to 42.6% (35.7%), supported by improved software margins and cost reductions in services. Reduced amortization of software release development expenses had a positive impact of SEK 0.3 b. on gross income YoY.
Gross margin declined QoQ to 39.1% from 39.8%. Gross margin excluding restructuring charges declined slightly QoQ to 42.6% from 42.9%, due to reduced services margins and an increased services share, driven by increased sales in large transformation contracts. This was partly compensated by continued cost reductions and improved software margins.
Operating income (loss)Operating income (loss) decreased YoY to SEK -2.4 (-2.2) b. Operat-ing income (loss) excluding restructuring charges improved to SEK -1.5 (-1.8) b., due to improved gross margin and reduced operating expenses partly offset by lower sales. Operating expenses decreased despite an impact from higher amortized than capital-ized development expenses of SEK -0.4 (0.1) b. and impairment losses on trade receivables of SEK -0.2 (0.0) b. Total restructuring charges of SEK -0.9 (-0.5) b. had a negative impact on operating income YoY.
Operating income (loss) improved QoQ to SEK -2.4 b. from -2.6 b. Operating income excluding restructuring charges improved to SEK -1.5 b. from -2.0 b., driven by increased sales.
Net impact from amortization and capitalization of development expenses
SEK b. Q2 2018 Q2 2017 Q1 2018
Cost of Sales 0.0 -0.3 0.0
R&D expenses -0.4 0.1 -0.4
Total impact -0.4 -0.2 -0.4
Strategy execution As presented at the Capital Markets Day 2017, the target is to turn around Digital Services into low single-digit operating margin by 2020. Cost reduction activities were intensified in the quarter across the areas of service delivery, selling and administrative expenses and R&D. These activities will continue, aiming for simplicity and efficiency. While new ways of working are improving R&D effi-ciency, at the same time investments continue in a portfolio of 5G-ready and cloud-native products in order to defend current mar-ket position and prepare Digital Services for future growth.
A key activity for the turnaround is to manage and complete 34 identified critical multi-year customer contracts and to either exit or complete 11 identified non-strategic contracts. The plan is to com-plete or exit approximately 50% of the 45 contracts in 2018. 16 con-tracts have been addressed at the end of Q2 2018.
The ongoing digitalization drives opportunities for operators to reduce costs and be more agile by; automating operations, digitally serving and engaging with customers and building programmable core networks. Consequently, operators increasingly invest in the areas where Digital Services provide solutions. Rolling 12 months, however, sales of the new portfolio declined by -14%, mainly due to lower telecom core sales as a consequence of a contract delay in North East Asia. It is not unusual that such sales vary between quar-ters.
Digital Services
SEK b.
Q2 2018
Q2 2017
YoY change
Q1 2018
QoQ change
6 months 2018
6 months 2017
Net sales 8.8 9.9 -11% 7.3 22% 16.1 18.0
Of which products 4.5 5.4 -17% 3.9 13% 8.4 9.7
Of which IPR licensing revenues 0.3 0.4 -11% 0.3 -2% 0.7 0.7
Of which services 4.4 4.5 -4% 3.3 32% 7.7 8.3
Sales growth adjusted for comparable units and currency - - -12% - 16% - -
Gross income 3.5 3.3 5% 2.9 20% 6.4 1.0
Gross margin 39.1% 33.2% - 39.8% - 39.5% 5.4%
Operating income (loss) -2.4 -2.2 6% -2.6 -9% -5.0 -11.2
Operating margin -26.9% -22.6% - -35.9% - -30.9% -62.4%
Restructuring charges -0.9 -0.5 94% -0.6 52% -1.5 -0.7
Gross income excl. restructuring charges 3.8 3.5 7% 3.1 21% 6.9 1.4
Gross margin excl. restructuring charges 42.6% 35.7% - 42.9% - 42.7% 7.8%
Operating income (loss) excl. restructuring charges -1.5 -1.8 -16% -2.0 -26% -3.5 -10.5
Operating margin excl. restructuring charges -16.9% -18.0% - -27.9% - -21.9% -58.4%
Ericsson | Second Quarter Report 2018 Segment results | Managed Services8
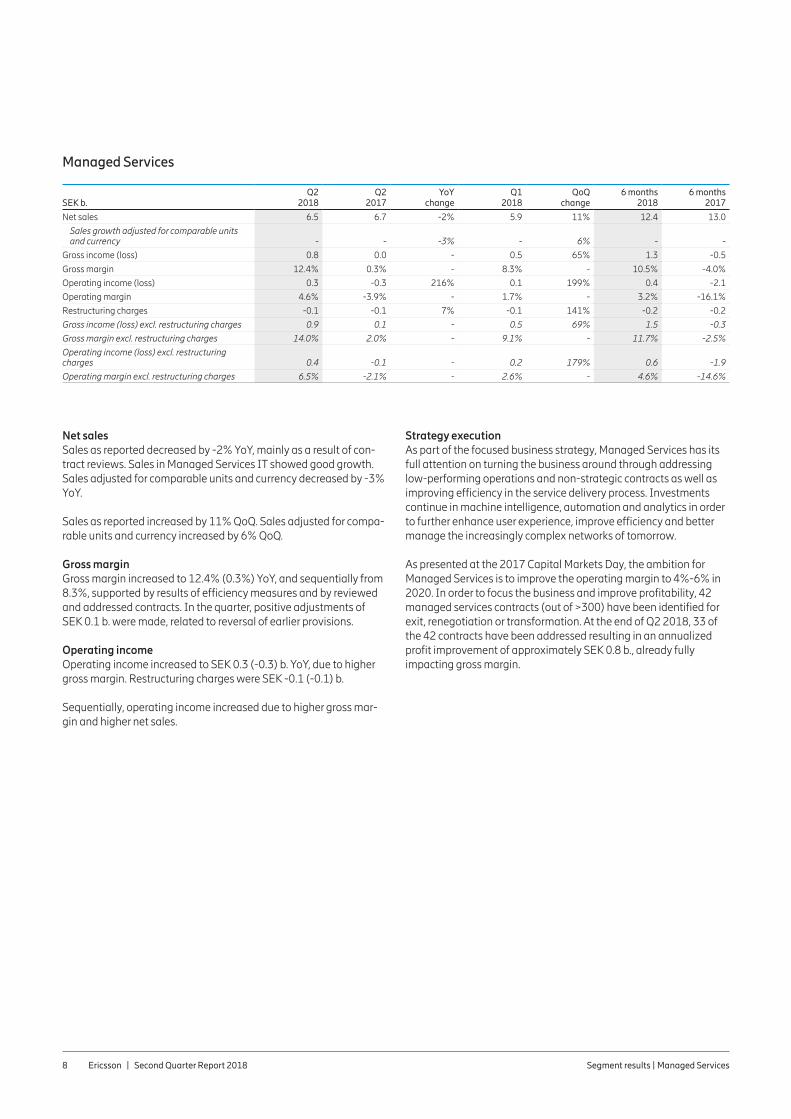
Net salesSales as reported decreased by -2% YoY, mainly as a result of con-tract reviews. Sales in Managed Services IT showed good growth. Sales adjusted for comparable units and currency decreased by -3% YoY.
Sales as reported increased by 11% QoQ. Sales adjusted for compa-rable units and currency increased by 6% QoQ.
Gross marginGross margin increased to 12.4% (0.3%) YoY, and sequentially from 8.3%, supported by results of efficiency measures and by reviewed and addressed contracts. In the quarter, positive adjustments of SEK 0.1 b. were made, related to reversal of earlier provisions.
Operating incomeOperating income increased to SEK 0.3 (-0.3) b. YoY, due to higher gross margin. Restructuring charges were SEK -0.1 (-0.1) b.
Sequentially, operating income increased due to higher gross mar-gin and higher net sales.
Strategy executionAs part of the focused business strategy, Managed Services has its full attention on turning the business around through addressing low-performing operations and non-strategic contracts as well as improving efficiency in the service delivery process. Investments continue in machine intelligence, automation and analytics in order to further enhance user experience, improve efficiency and better manage the increasingly complex networks of tomorrow.
As presented at the 2017 Capital Markets Day, the ambition for Managed Services is to improve the operating margin to 4%-6% in 2020. In order to focus the business and improve profitability, 42 managed services contracts (out of >300) have been identified for exit, renegotiation or transformation. At the end of Q2 2018, 33 of the 42 contracts have been addressed resulting in an annualized profit improvement of approximately SEK 0.8 b., already fully impacting gross margin.
Managed Services
SEK b.
Q2 2018
Q2 2017
YoY change
Q1 2018
QoQ change
6 months 2018
6 months 2017
Net sales 6.5 6.7 -2% 5.9 11% 12.4 13.0
Sales growth adjusted for comparable units and currency - - -3% - 6% - -
Gross income (loss) 0.8 0.0 - 0.5 65% 1.3 -0.5
Gross margin 12.4% 0.3% - 8.3% - 10.5% -4.0%
Operating income (loss) 0.3 -0.3 216% 0.1 199% 0.4 -2.1
Operating margin 4.6% -3.9% - 1.7% - 3.2% -16.1%
Restructuring charges -0.1 -0.1 7% -0.1 141% -0.2 -0.2
Gross income (loss) excl. restructuring charges 0.9 0.1 - 0.5 69% 1.5 -0.3
Gross margin excl. restructuring charges 14.0% 2.0% - 9.1% - 11.7% -2.5%
Operating income (loss) excl. restructuring charges 0.4 -0.1 - 0.2 179% 0.6 -1.9
Operating margin excl. restructuring charges 6.5% -2.1% - 2.6% - 4.6% -14.6%
Ericsson | Second Quarter Report 2018 Segment results | Emerging Business and Other9
Net sales Sales as reported increased by 2% YoY. Sales adjusted for compara-ble units and currency increased by 1%, driven by growth in the iconectiv business. Sales and deliveries started, in the quarter, on a multi-year number portability contract in United States. This con-tract was awarded to iconectiv in 2015. Sales in Emerging Business continued to grow, driven by IoT.
Sales in the media business (Media Solutions and Red Bee Media) were SEK 1.3 (1.5) b. Media Solutions sales declined YoY, mainly due to lower sales in the discontinued portfolio. Red Bee Media sales declined slightly, mainly due to scope changes in contracts.
Sales increased by 24% QoQ, mainly due to growth in iconectiv, Media Solutions and Red Bee Media. Sales adjusted for comparable units and currency increased by 18% QoQ.
Gross margin Gross margin increased YoY to 24.4% (21.3%). Gross margin excluding restructuring charges increased to 27.4% (24.3%), sup-ported by improvements in IoT, Media Solutions and Red Bee Media.
Gross margin increased QoQ to 24.4% from 21.1%. Gross margin excluding restructuring charges increased to 27.4% from 24.3%, with a positive impact from operational improvements in Red Bee Media.
Operating income (loss)Operating income improved YoY to SEK -1.3 (-1.5) b. Operating income excluding restructuring charges improved to SEK -1.2 (-1.3) b. driven by improved results in Media Solutions and iconectiv. Emerging Business operating income declined YoY, driven by increased investments in line with the strategy.
Media Solutions and Red Bee Media combined operating income excluding restructuring charges and corporate allocations was SEK -0.4 (-0.7) b. Results in Media Solutions improved YoY, driven by operational efficiencies, partly offset by costs related to the planned transaction for Media Solutions in Q3 2018.
Operating income declined QoQ to SEK -1.3 from -1.2 b. Operating income excluding restructuring charges declined to SEK -1.2 from -1.1 b. due to increased investments in Emerging Business in line with the strategy.
Net impact from amortization and capitalization of development expenses
SEK b. Q2 2018 Q2 2017 Q1 2018
Cost of Sales 0.0 0.0 0.0
R&D expenses -0.1 -0.1 -0.1
Total impact -0.1 -0.1 -0.1
Strategy executionAs outlined at the Capital Markets Day in 2017, the target for seg-ment Emerging Business and Other, including iconectiv, is a break-even result by 2020.
Selective investments will continue in Emerging Business to build a position and grow sales in new areas. Main investments are on IoT, UDN (Unified Delivery Network) and Emodo (mobile advertising and data monetization platform) business. Parts of the portfolio are still in an early phase, with focus on generating sales and scale the business, and do not yet cover the required investments, hence resulting in a negative bottom-line. The acquisition of Vidscale, a subcontractor to the Ericsson UDN business, was completed in the quarter and will lower the operational cost for the business.
For the media solutions business, Ericsson is partnering with One Equity Partners (OEP) and retaining a 49% ownership stake. This allows Ericsson to capture the upside of the business while at the same time taking an active part in the expected consolidation of the industry. Activities are accelerated to complete the transaction as planned during Q3 2018. Additional expenses related to the divest-ment of the media solutions business is estimated to be SEK -0.3 b. in Q3.
For Red Bee Media, the target is to achieve a sustainable profitable business, by continuing to develop and manage the business as an independent and focused media services entity within Ericsson. Operations and services propositions will be further developed, in line with the Red Bee Media tactical and transformational strategic execution plans.
Emerging Business and Other (includes Emerging Business, Media Solutions, Red Bee Media and iconectiv)
SEK b.
Q2 2018
Q2 2017
YoY change
Q1 2018
QoQ change
6 months 2018
6 months 2017
Net sales 2.1 2.0 2% 1.7 24% 3.7 3.8
Sales growth adjusted for comparable units and currency - - 1% - 18% - -
Gross income 0.5 0.4 17% 0.3 44% 0.8 0.8
Gross margin 24.4% 21.3% - 21.1% - 22.9% 20.1%
Operating income (loss) -1.3 -1.5 -11% -1.2 11% -2.5 -4.6
Operating margin -63.5% -73.0% - -71.2% - -66.9% -121.9%
Restructuring charges -0.1 -0.1 -2% -0.1 107% -0.2 -0.2
Gross income excl. restructuring charges 0.6 0.5 15% 0.4 40% 1.0 0.9
Gross margin excl. restructuring charges 27.4% 24.3% - 24.3% - 26.0% 22.5%
Operating income (loss) excl. restructuring charges -1.2 -1.3 -12% -1.1 6% -2.3 -4.4
Operating margin excl. restructuring charges -57.4% -66.6% - -67.5% - -61.9% -117.3%
Ericsson | Second Quarter Report 2018 Cash flow10
Cash flow
Operating activitiesCash flow from operating activities was SEK 1.4 (0.0) b., driven by SEK 1.7 b. of positive change in net operating assets. Trade receiv-ables were reduced, mainly due to good collection. Sales of trade receivables continued to trend downwards and were reduced both QoQ and YoY. Trade payables increased, mainly due to seasonal inventory build-up. Cash outlays related to restructuring charges were SEK -0.8 (-1.1) b. in the quarter.
Investing activitiesCash flow from investing activities excluding interest-bearing secu-rities was SEK -2.1 (-1.3) b. M&A activities were SEK -0.4 (0.0) b., related to an acquisition in Emerging Business. Cash flow from investments in property, plant and equipment was SEK -1.0 (-1.0) b. and capitalized development expenses were SEK -0.3 (-0.3) b. Cash flow from interest-bearing securities was SEK 3.7 (-0.7) b. Together, the above items generated a positive cash flow from investing activities of SEK 1.6 (-2.0) b.
Financing activitiesCash flow from financing activities was negative at SEK -3.7 (-8.9) b. Dividends of SEK 3.3 (3.3) b. were paid out. Net change in cash and cash equivalents was SEK 0.4 (-11.5) b.
Free cash flowFree cash flow improved to SEK -0.6 (-1.3) b. due to increased cash flow from operating activities partly offset by increased acquisitions.
Free cash flow decreased QoQ from SEK 0.3 b. to SEK -0.6 b. mainly due to negative effects of currency fluctuations and lower cash flow from operating activities.
SEK b.Q2
2018Q2
2017Q1
2018
Net income reconciled to cash -0.3 -0.1 -1.0
Changes in operating net assets 1.7 0.1 2.6
Cash flow from operating activities 1.4 0.0 1.6
Cash flow from investing activities 1.6 -2.0 -1.8
Cash flow from financing activities -3.7 -8.9 -0.1
Effect of exchange rate changes on cash 1.0 -0.6 1.1
Net change in cash and cash equivalents 0.4 -11.5 0.8
Free cash flow: Cash flow from operating activities less net capital expenditures and other investments -0.6 -1.3 0.3
Ericsson | Second Quarter Report 2018 Financial position11
Financial position
Gross cash decreased by SEK -2.4 b. and net cash decreased by SEK -2.5 b. in the quarter, due to payment of dividends of SEK 3.3 b. Gross cash was SEK 66.9 b. and net cash was SEK 33.1 b.
Post-employments benefits increased in the quarter, to SEK 27.3 b. from SEK 25.6 b., due to decreased interest rates in Sweden and normal service and interest costs partly offset by return on pension assets and higher interest rates in the UK.
The Swedish defined benefit obligation (DBO) has been calculated using a discount rate based on the yields of Swedish government bonds. If the discount rate had been based on Swedish covered mortgage bonds, the DBO would have been approximately SEK 8.5 b. lower as of June 30, 2018.
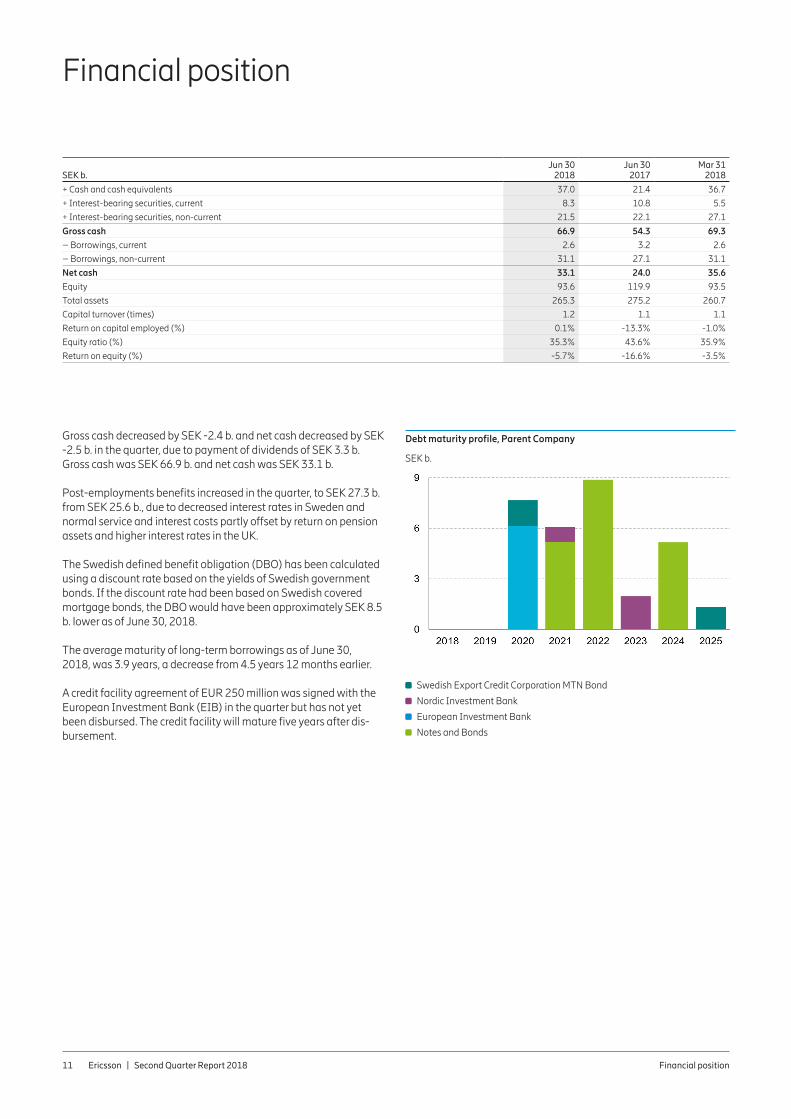
The average maturity of long-term borrowings as of June 30,2018, was 3.9 years, a decrease from 4.5 years 12 months earlier.
A credit facility agreement of EUR 250 million was signed with the European Investment Bank (EIB) in the quarter but has not yet been disbursed. The credit facility will mature five years after dis-bursement.
SEK b.Jun 30
2018Jun 30
2017Mar 31
2018
+ Cash and cash equivalents 37.0 21.4 36.7
+ Interest-bearing securities, current 8.3 10.8 5.5
+ Interest-bearing securities, non-current 21.5 22.1 27.1
Gross cash 66.9 54.3 69.3
– Borrowings, current 2.6 3.2 2.6
– Borrowings, non-current 31.1 27.1 31.1
Net cash 33.1 24.0 35.6
Equity 93.6 119.9 93.5
Total assets 265.3 275.2 260.7
Capital turnover (times) 1.2 1.1 1.1
Return on capital employed (%) 0.1% -13.3% -1.0%
Equity ratio (%) 35.3% 43.6% 35.9%
Return on equity (%) -5.7% -16.6% -3.5%
Debt maturity profile, Parent Company
SEK b.
Swedish Export Credit Corporation MTN Bond
Nordic Investment Bank
European Investment Bank
Notes and Bonds
Ericsson | Second Quarter Report 2018 Parent Company12
Parent Company
Income after financial items was SEK 1.7 (2.3) b. The decrease was mainly due to lower recognized dividends from subsidiaries. At the end of the quarter, gross cash (cash, cash equivalents, short-term investments and interest-bearing securities non-current)amounted to SEK 53.6 (41.1) b.
The dividend of SEK 3.3 b. was paid out in the first week of April after decision by the Annual General Meeting on the 28th of March.
There has been a decrease in intercompany lending of SEK 6.4 b. and a decrease in intercompany borrowing of SEK 4.6 b. in the second quarter.
In accordance with the conditions of the long-term variable com-pensation program (LTV) for Ericsson employees, 3,447,302 shares from treasury stock were sold or distributed to employees during the second quarter. The holding of treasury stock at June 30, 2018, was 43,381,932 Class B shares.
Ericsson | Second Quarter Report 2018 Other information13
Other information
Ericsson’s Nomination Committee appointedOn April 26, 2018, Ericsson announced that the Nomination Com-mittee for the Annual General Meeting 2019 had beenappointed in accordance with the Instruction for the NominationCommittee, resolved by the Annual General Meeting 2012. TheNomination Committee consists of: Johan Forssell, InvestorAB; Bengt Kjell, AB Industrivärden and Svenska Handelsbankens Pensionsstiftelse; Christer Gardell, Cevian Capital Partners Limited; Anders Oscarsson, AMF Försäkring och Fonder and Ronnie Leten, the Chairman of the Board of Directors. Johan Forssell is the Chair-man of the Nomination Committee.
Ericsson signs credit facility agreement with the European Invest-ment BankOn May 31, 2018, Ericsson announced that it has signed a credit facility of EUR 250 million with the European Investment Bank (EIB). The funding will support research and development activities for 5G and is in line with Ericsson’s focused business strategy. The credit facility will mature five years after disbursement.
POST-CLOSING EVENTS Ericsson to divest its field services business in Sweden to Transtema GroupOn July 11, 2018, Ericsson announced that it has signed an agree-ment with the Swedish company Transtema Group AB to divest Ericsson Local Services AB (LSS), a subsidiary of Ericsson supplying field service operations and maintenance of fixed and mobile net-works in Sweden. This divestment is in line with Ericsson’s business strategy. The transaction is expected to close in the third quarter of 2018 and is subject to customary closing conditions, including regulatory approvals.
Ericsson | Second Quarter Report 2018 Risk factors14
Risk factors
Ericsson’s operational and financial risk factors and uncertainties are described in our Annual Report 2017. Risk factors and uncer-tainties in focus short term for the Parent Company and the Ericsson Group include, but are not limited to:
– Potential negative effects on operators’ willingness to invest in network development due to uncertainty in the financial markets and a weak economic business environment, or reduced con-sumer telecom spending, or increased pressure on Ericsson to provide financing, or delayed auctions of spectrum
– Intense competition from existing competitors as well as new entrants, including IT companies entering the telecommunica-tions market, which could have a material adverse effect on the results
– Uncertainty regarding the financial stability of suppliers, for example due to lack of financing
– Effects on gross margins and/or working capital of the business mix in the Networks segment between capacity sales and new coverage build-outs
– Effects on gross margins of the business mix including new network build-outs and new managed services or digital trans-formation deals with initial transition costs
– Effects of the ongoing industry consolidation among our cus-tomers as well as between our largest competitors, e.g. with postponed investments and intensified price competition as a consequence
– New and ongoing partnerships which may not be successful and expose us to future costs
– Changes in foreign exchange rates, in particular USD – Political unrest and uncertainty in certain markets, as well as
escalating trade disputes and sanctions
– Effects on production and sales from restrictions with respect to timely and adequate supply of materials, components and pro-duction capacity and other vital services on competitive terms
– No guarantees that strategy execution, specific restructuring or cost-savings initiatives, profitability restoring efforts and/or organizational changes will be sufficient, successful or executed in time to deliver any improvements in earnings
– Cybersecurity incidents, which may have a material negative impact
– Rapidly changing technologies and the ways these are brought to the market, which could be disruptive to the business
– Ericsson is subject to risks associated with the development and implementation of new solutions or technologies under existing customer contracts. The company may not be successful or incur delays in developing or implementing such solutions or technolo-gies, which could result in damage claims and loss of customers which may have an adverse impact on liquidity and results of operations.
Ericsson stringently monitors the compliance with all relevant traderegulations and trade embargoes applicable to dealings with cus-tomers operating in countries where there are trade restrictions ortrade restrictions are discussed. Ericsson operates globally in accor-dance with Group policies and directives for business ethics andconduct and has a dedicated anti-corruption program. However, insome of the countries where the company operates, corruption riskscan be high and compliance failure could have a material adverseimpact on our business, financial condition and brand.
This report has not been reviewed by Telefonaktiebolaget LMEricsson’s auditors.
Date for next report: October 18, 2018

Ericsson | Second Quarter Report 2018 Board Assurance15
Board Assurance
The Board of Directors and the CEO certify that the financial report for the six months gives a fair view of the performance of the business, position and profit or loss of the Company and the Group, and describes the principal risks and uncertainties that the Company and the companies in the Group face.
Stockholm, July 18, 2018Telefonaktiebolaget LM Ericsson (publ)Org. Nr. 556016-0680
Helena Stjernholm Ronnie Leten Jacob Wallenberg Deputy Chairman Chairman Deputy Chairman
Jon Fredrik Baksaas Jan Carlson Nora Denzel Member of the Board Member of the Board Member of the Board
Eric A. Elzvik Kurt Jofs Kristin S. Rinne Member of the Board Member of the Board Member of the Board
Börje Ekholm President, CEO and member of the Board
Torbjörn Nyman Kjell-Åke Soting Roger Svensson Member of the Board Member of the Board Member of the Board
Ericsson | Second Quarter Report 2018 Editor’s note16
Editor’s note
Ericsson invites media, investors and analysts to conferencecalls on July 18, 2018; one starting at 09.00 (CET) and theother at 14.00 (CET).
Live audio webcasts of the conference calls as well as supportingslides will be available at:www.ericsson.com/press and www.ericsson.com/investorsReplay of the conference calls will be available approximatelyone hour after each call has ended and will remain available forseven days.
For further information, please contact:Carl Mellander Senior Vice President, Chief Financial OfficerPhone: +46 10 713 89 70E-mail: [email protected] or [email protected]
Helena Norrman, Senior Vice President, Chief Marketing and Communications OfficerPhone: +46 10 719 34 72E-mail: [email protected] or [email protected]
Telefonaktiebolaget LM EricssonOrg. number: 556016-0680Torshamnsgatan 21SE-164 83 StockholmPhone: +46 10 719 00 00www.ericsson.com
InvestorsPeter Nyquist, Vice President,Head of Investor RelationsPhone: +46 10 714 64 99, +46 70 575 29 06E-mail: [email protected]
Stefan Jelvin, Director,Investor RelationsPhone: +46 10 714 20 39, +46 70 986 02 27E-mail: [email protected]
Åsa Konnbjer, Director, Investor RelationsPhone: +46 10 713 39 28, +46 73 082 59 28E-mail: [email protected]
Rikard Tunedal, Director, Investor RelationsPhone: +46 10 714 54 00, +46 761 005 400E-mail: [email protected]
MediaOla Rembe, Vice President, Head of External CommunicationsPhone: +46 10 719 97 27, +46 73 024 48 73E-mail: [email protected]
Corporate CommunicationsPhone: +46 10 719 69 92E-mail: [email protected]
Ericsson | Second Quarter Report 2018 Forward-looking statements17
Forward-looking statements
This report includes forward-looking statements, including state-ments reflecting management’s current views relating to the growth of the market, future market conditions, future events, financial condition, and expected operational and financial performance, including, in particular the following:
– Our goals, strategies, planning assumptions and operational or financial performance expectations
– Industry trends, future characteristics and development of the markets in which we operate
– Our future liquidity, capital resources, capital expenditures, cost savings and profitability
– The expected demand for our existing and new products and services as well as plans to launch new products and services including research and development expenditures
– The ability to deliver on future plans and to realize potential for future growth
– The expected operational or financial performance of strategic cooperation activities and joint ventures
– The time until acquired entities and businesses will be integrated and accretive to income
– Technology and industry trends including the regulatory and standardization environment in which we operate, competition and our customer structure.
The words “believe,” “expect,” “foresee,” “anticipate,” “assume,” “intend,” “likely,” “projects,” “may,” “could,” “plan,” “estimate,” “fore-cast,” “will,” “should,” “would,” “predict,” “aim,” “ambition,” “seek,” “potential,” “target,” “might,” “continue,” or, in each case, their nega-tive or variations, and similar words or expressions are used to iden-tify forward-looking statements. Any statement that refers to expectations, projections or other characterizations of future events or circumstances, including any underlying assumptions, are for-ward-looking statements.
We caution investors that these statements are subject to risks and uncertainties many of which are difficult to predict and generally beyond our control that could cause actual results to differ materi-ally from those expressed in, or implied or projected by, the for-ward-looking information and statements.
Important factors that could affect whether and to what extent any of our forward-looking statements materialize include, but are not limited to, the factors described in the section “Risk Factors”, and in “Risk Factors” in the Annual Report 2017.
These forward-looking statements also represent our estimates and assumptions only as of the date that they were made. We expressly disclaim a duty to provide updates to these forward-looking statements, and the estimates and assumptions associated with them, after the date of this report, to reflect events or changes in circumstances or changes in expectations or the occurrence of anticipated events, whether as a result of new infor-mation, future events or otherwise, except as required by applicable law or stock exchange regulation.
Ericsson | Second Quarter Report 2018 Financial statements and other information18
Financial statements and other information
Contents
Financial statements 19 Consolidated income statement19 Statement of comprehensive income (loss)20 Consolidated balance sheet21 Consolidated statement of cash flows22 Consolidated statement of changes in equity22 Consolidated income statement – isolated quarters23 Consolidated statement of cash flows – isolated quarters24 Parent Company income statement24 Parent Company statement of comprehensive income (loss)25 Parent Company balance sheet
Additional information 26 Accounting policies28 Segment reporting 29 Net sales by segment by quarter30 Sales growth adjusted for comparable units and currency30 Gross income (loss) and gross margin by segment by quarter31 Operating income (loss) and operating margin by segment by quarter32 EBITA and EBITA margin by segment by quarter33 Net sales by market area by quarter34 Top 5 countries in sales34 Net sales by market area by segment35 IPR licensing revenues by segment by quarter35 Provisions36 Information on investments 37 Other information37 Number of employees
Items excluding restructuring charges 38 Restructuring charges by function38 Restructuring charges by segment39 Gross income (loss) and gross margin excluding restructuring
charges by segment40 Operating income (loss) and operating margin excluding
restructuring charges by segment
Alternative performance measures41 Sales growth adjusted for comparable units and currency42 Items excluding restructuring charges43 EBITA and EBITA margin43 Cash conversion43 Gross cash and net cash, end of period44 Capital employed44 Capital turnover45 Return on capital employed45 Equity ratio45 Return on equity46 Earnings (loss) per share (non-IFRS)46 Free cash flow
Ericsson | Second Quarter Report 2018 Financial statements19
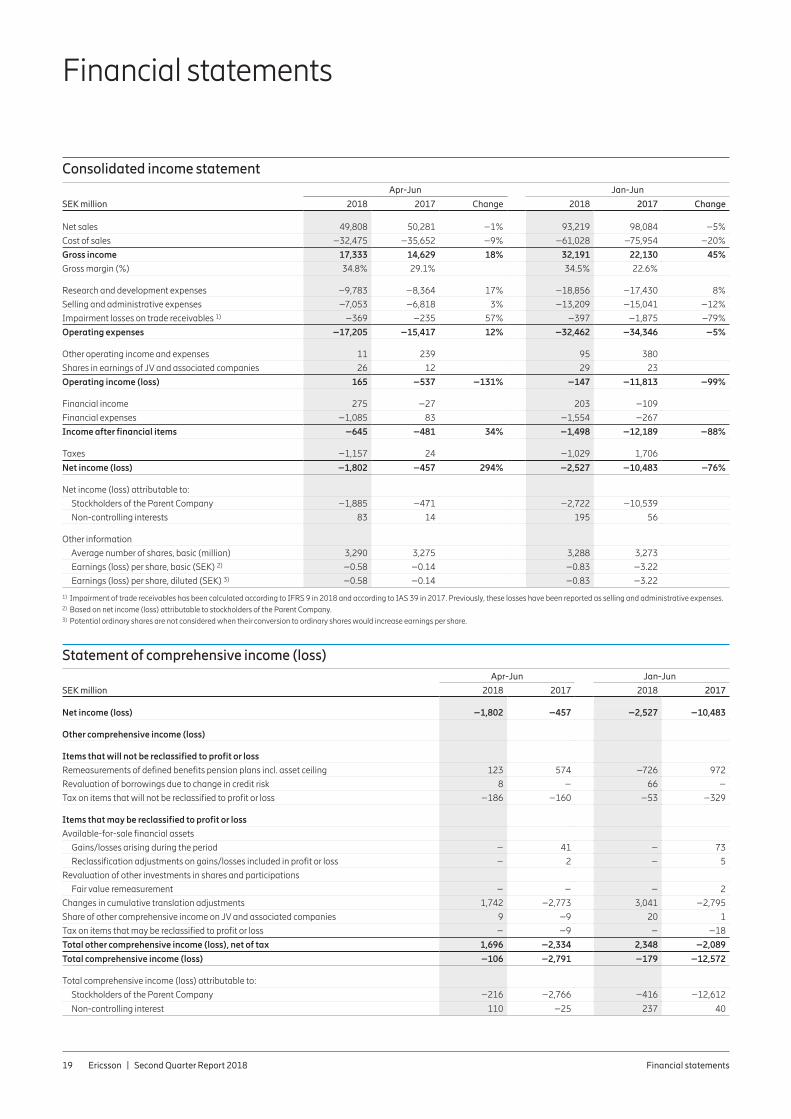
Consolidated income statementApr-Jun Jan-Jun
SEK million 2018 2017 Change 2018 2017 Change
Net sales 49,808 50,281 –1% 93,219 98,084 –5%
Cost of sales –32,475 –35,652 –9% –61,028 –75,954 –20%
Gross income 17,333 14,629 18% 32,191 22,130 45%
Gross margin (%) 34.8% 29.1% 34.5% 22.6%
Research and development expenses –9,783 –8,364 17% –18,856 –17,430 8%
Selling and administrative expenses –7,053 –6,818 3% –13,209 –15,041 –12%
Impairment losses on trade receivables 1) –369 –235 57% –397 –1,875 –79%
Operating expenses –17,205 –15,417 12% –32,462 –34,346 –5%
Other operating income and expenses 11 239 95 380
Shares in earnings of JV and associated companies 26 12 29 23
Operating income (loss) 165 –537 –131% –147 –11,813 –99%
Financial income 275 –27 203 –109
Financial expenses –1,085 83 –1,554 –267
Income after financial items –645 –481 34% –1,498 –12,189 –88%
Taxes –1,157 24 –1,029 1,706
Net income (loss) –1,802 –457 294% –2,527 –10,483 –76%
Net income (loss) attributable to:
Stockholders of the Parent Company –1,885 –471 –2,722 –10,539
Non-controlling interests 83 14 195 56
Other information
Average number of shares, basic (million) 3,290 3,275 3,288 3,273
Earnings (loss) per share, basic (S EK) 2) –0.58 –0.14 –0.83 –3.22
Earnings (loss) per share, diluted (SEK) 3) –0.58 –0.14 –0.83 –3.22
1) Impairment of trade receivables has been calculated according to IFRS 9 in 2018 and according to IAS 39 in 2017. Previously, these losses have been reported as selling and administrative expenses.2) Based on net income (loss) attributable to stockholders of the Parent Company.3) Potential ordinary shares are not considered when their conversion to ordinary shares would increase earnings per share.
Statement of comprehensive income (loss)Apr-Jun Jan-Jun
SEK million 2018 2017 2018 2017
Net income (loss) –1,802 –457 –2,527 –10,483
Other comprehensive income (loss)
Items that will not be reclassified to profit or loss
Remeasurements of defined benefits pension plans incl. asset ceiling 123 574 –726 972
Revaluation of borrowings due to change in credit risk 8 – 66 –
Tax on items that will not be reclassified to profit or loss –186 –160 –53 –329
Items that may be reclassified to profit or loss
Available-for-sale financial assets
Gains/losses arising during the period – 41 – 73
Reclassification adjustments on gains/losses included in profit or loss – 2 – 5
Revaluation of other investments in shares and participations
Fair value remeasurement – – – 2
Changes in cumulative translation adjustments 1,742 –2,773 3,041 –2,795
Share of other comprehensive income on JV and associated companies 9 –9 20 1
Tax on items that may be reclassified to profit or loss – –9 – –18
Total other comprehensive income (loss), net of tax 1,696 –2,334 2,348 –2,089
Total comprehensive income (loss) –106 –2,791 –179 –12,572
Total comprehensive income (loss) attributable to:
Stockholders of the Parent Company –216 –2,766 –416 –12,612
Non-controlling interest 110 –25 237 40
Financial statements
Ericsson | Second Quarter Report 2018 Financial statements20
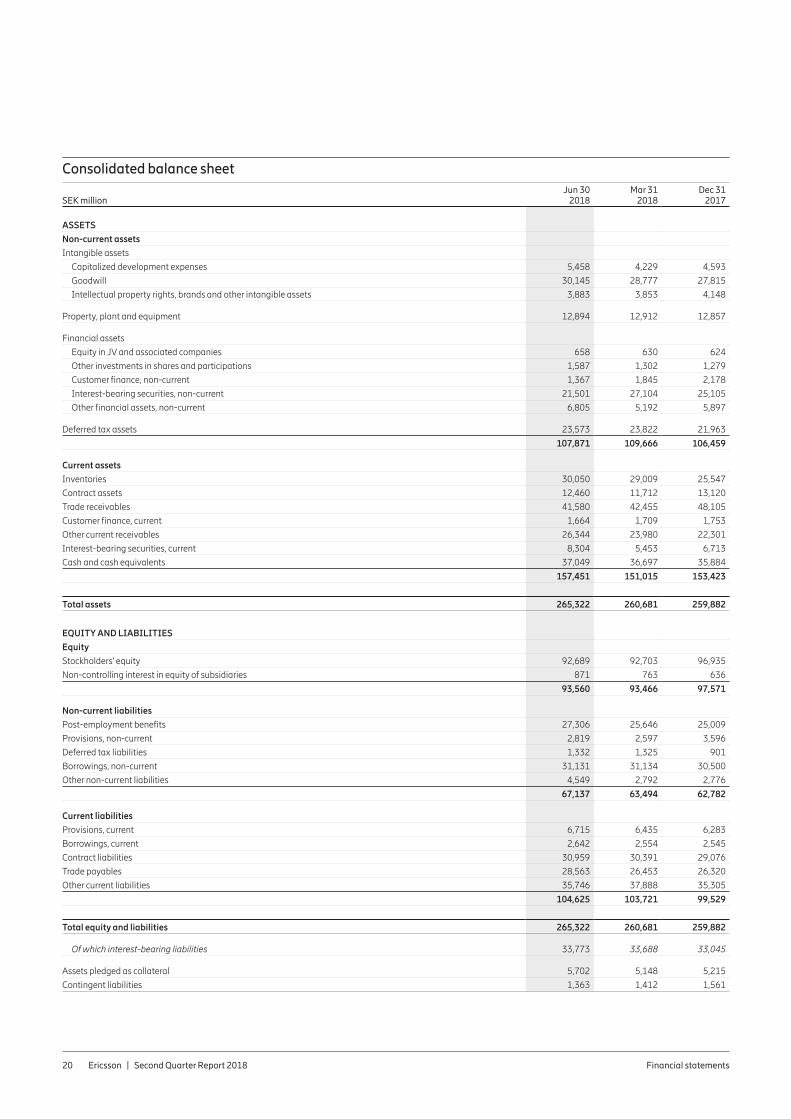
Consolidated balance sheet
SEK millionJun 30
2018Mar 31
2018Dec 31
2017
ASSETS
Non-current assets
Intangible assets
Capitalized development expenses 5,458 4,229 4,593
Goodwill 30,145 28,777 27,815
Intellectual property rights, brands and other intangible assets 3,883 3,853 4,148
Property, plant and equipment 12,894 12,912 12,857
Financial assets
Equity in JV and associated companies 658 630 624
Other investments in shares and participations 1,587 1,302 1,279
Customer finance, non-current 1,367 1,845 2,178
Interest-bearing securities, non-current 21,501 27,104 25,105
Other financial assets, non-current 6,805 5,192 5,897
Deferred tax assets 23,573 23,822 21,963
107,871 109,666 106,459
Current assets
Inventories 30,050 29,009 25,547
Contract assets 12,460 11,712 13,120
Trade receivables 41,580 42,455 48,105
Customer finance, current 1,664 1,709 1,753
Other current receivables 26,344 23,980 22,301
Interest-bearing securities, current 8,304 5,453 6,713
Cash and cash equivalents 37,049 36,697 35,884
157,451 151,015 153,423
Total assets 265,322 260,681 259,882
EQUITY AND LIABILITIES
Equity
Stockholders' equity 92,689 92,703 96,935
Non-controlling interest in equity of subsidiaries 871 763 636
93,560 93,466 97,571
Non-current liabilities
Post-employment benefits 27,306 25,646 25,009
Provisions, non-current 2,819 2,597 3,596
Deferred tax liabilities 1,332 1,325 901
Borrowings, non-current 31,131 31,134 30,500
Other non-current liabilities 4,549 2,792 2,776
67,137 63,494 62,782
Current liabilities
Provisions, current 6,715 6,435 6,283
Borrowings, current 2,642 2,554 2,545
Contract liabilities 30,959 30,391 29,076
Trade payables 28,563 26,453 26,320
Other current liabilities 35,746 37,888 35,305
104,625 103,721 99,529
Total equity and liabilities 265,322 260,681 259,882
Of which interest-bearing liabilities 33,773 33,688 33,045
Assets pledged as collateral 5,702 5,148 5,215
Contingent liabilities 1,363 1,412 1,561
Ericsson | Second Quarter Report 2018 Financial statements21
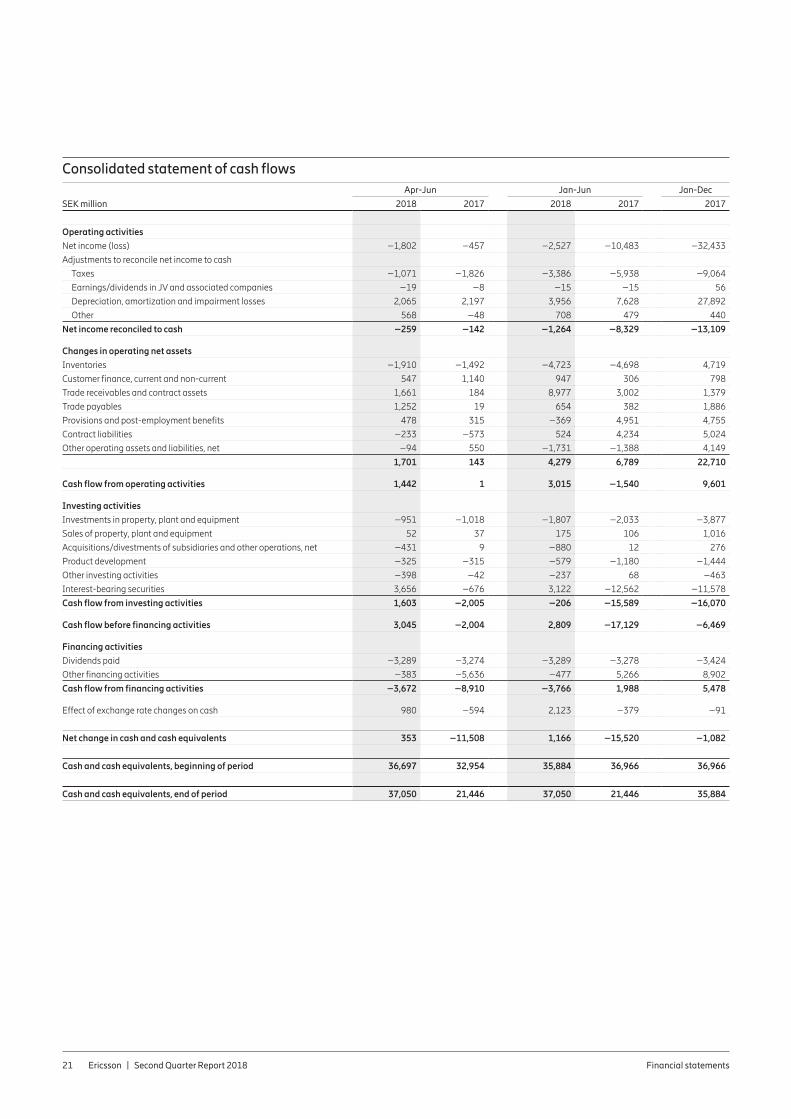
Consolidated statement of cash flowsApr-Jun Jan-Jun Jan-Dec
SEK million 2018 2017 2018 2017 2017
Operating activities
Net income (loss) –1,802 –457 –2,527 –10,483 –32,433
Adjustments to reconcile net income to cash
Taxes –1,071 –1,826 –3,386 –5,938 –9,064
Earnings/dividends in JV and associated companies –19 –8 –15 –15 56
Depreciation, amortization and impairment losses 2,065 2,197 3,956 7,628 27,892
Other 568 –48 708 479 440
Net income reconciled to cash –259 –142 –1,264 –8,329 –13,109
Changes in operating net assets
Inventories –1,910 –1,492 –4,723 –4,698 4,719
Customer finance, current and non-current 547 1,140 947 306 798
Trade receivables and contract assets 1,661 184 8,977 3,002 1,379
Trade payables 1,252 19 654 382 1,886
Provisions and post-employment benefits 478 315 –369 4,951 4,755
Contract liabilities –233 –573 524 4,234 5,024
Other operating assets and liabilities, net –94 550 –1,731 –1,388 4,149
1,701 143 4,279 6,789 22,710
Cash flow from operating activities 1,442 1 3,015 –1,540 9,601
Investing activities
Investments in property, plant and equipment –951 –1,018 –1,807 –2,033 –3,877
Sales of property, plant and equipment 52 37 175 106 1,016
Acquisitions/divestments of subsidiaries and other operations, net –431 9 –880 12 276
Product development –325 –315 –579 –1,180 –1,444
Other investing activities –398 –42 –237 68 –463
Interest-bearing securities 3,656 –676 3,122 –12,562 –11,578
Cash flow from investing activities 1,603 –2,005 –206 –15,589 –16,070
Cash flow before financing activities 3,045 –2,004 2,809 –17,129 –6,469
Financing activities
Dividends paid –3,289 –3,274 –3,289 –3,278 –3,424
Other financing activities –383 –5,636 –477 5,266 8,902
Cash flow from financing activities –3,672 –8,910 –3,766 1,988 5,478
Effect of exchange rate changes on cash 980 –594 2,123 –379 –91
Net change in cash and cash equivalents 353 –11,508 1,166 –15,520 –1,082
Cash and cash equivalents, beginning of period 36,697 32,954 35,884 36,966 36,966
Cash and cash equivalents, end of period 37,050 21,446 37,050 21,446 35,884
Ericsson | Second Quarter Report 2018 Financial statements22
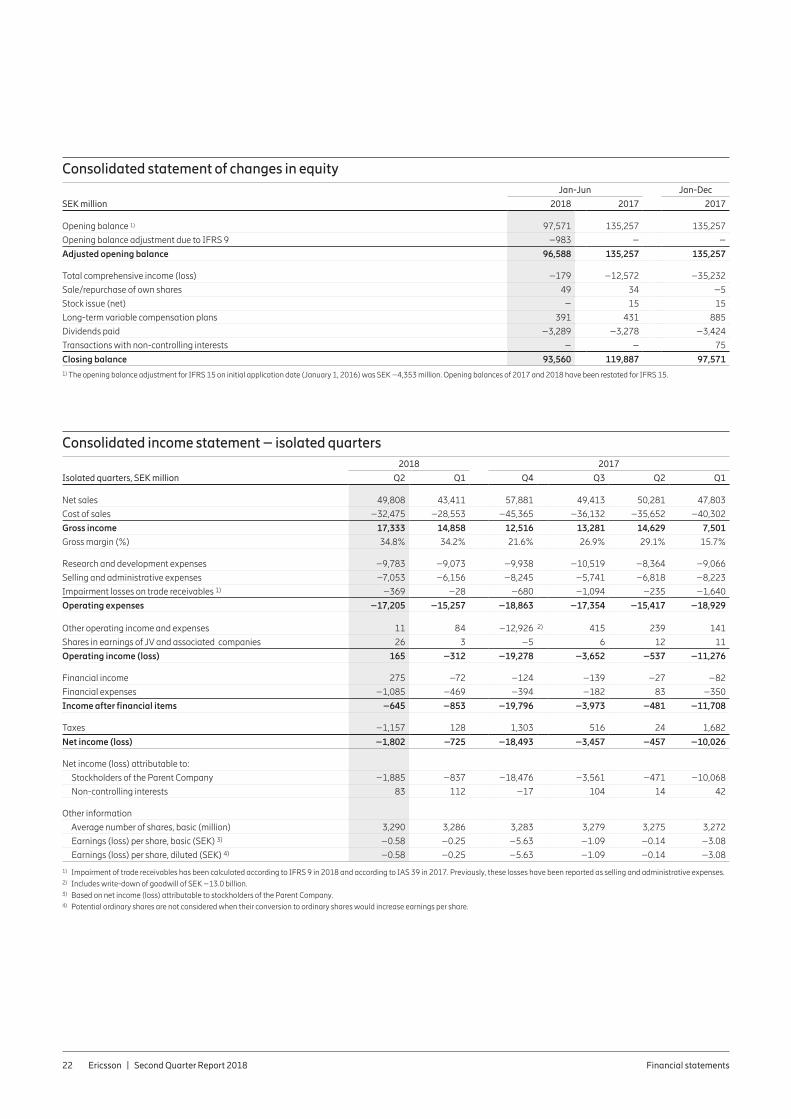
Consolidated statement of changes in equity
SEK million
Jan-Jun Jan-Dec
2018 2017 2017
Opening balance 1) 97,571 135,257 135,257
Opening balance adjustment due to IFRS 9 –983 – –
Adjusted opening balance 96,588 135,257 135,257
Total comprehensive income (loss) –179 –12,572 –35,232
Sale/repurchase of own shares 49 34 –5
Stock issue (net) – 15 15
Long-term variable compensation plans 391 431 885
Dividends paid –3,289 –3,278 –3,424
Transactions with non-controlling interests – – 75
Closing balance 93,560 119,887 97,5711) The opening balance adjustment for IFRS 15 on initial application date (January 1, 2016) was SEK –4,353 million. Opening balances of 2017 and 2018 have been restated for IFRS 15.
Consolidated income statement – isolated quarters2018 2017
Isolated quarters, SEK million Q2 Q1 Q4 Q3 Q2 Q1
Net sales 49,808 43,411 57,881 49,413 50,281 47,803
Cost of sales –32,475 –28,553 –45,365 –36,132 –35,652 –40,302
Gross income 17,333 14,858 12,516 13,281 14,629 7,501
Gross margin (%) 34.8% 34.2% 21.6% 26.9% 29.1% 15.7%
Research and development expenses –9,783 –9,073 –9,938 –10,519 –8,364 –9,066
Selling and administrative expenses –7,053 –6,156 –8,245 –5,741 –6,818 –8,223
Impairment losses on trade receivables 1) –369 –28 –680 –1,094 –235 –1,640
Operating expenses –17,205 –15,257 –18,863 –17,354 –15,417 –18,929
Other operating income and expenses 11 84 –12,926 2) 415 239 141
Shares in earnings of JV and associated companies 26 3 –5 6 12 11
Operating income (loss) 165 –312 –19,278 –3,652 –537 –11,276
Financial income 275 –72 –124 –139 –27 –82
Financial expenses –1,085 –469 –394 –182 83 –350
Income after financial items –645 –853 –19,796 –3,973 –481 –11,708
Taxes –1,157 128 1,303 516 24 1,682
Net income (loss) –1,802 –725 –18,493 –3,457 –457 –10,026
Net income (loss) attributable to:
Stockholders of the Parent Company –1,885 –837 –18,476 –3,561 –471 –10,068
Non-controlling interests 83 112 –17 104 14 42
Other information
Average number of shares, basic (million) 3,290 3,286 3,283 3,279 3,275 3,272
Earnings (loss) per share, basic (SEK) 3) –0.58 –0.25 –5.63 –1.09 –0.14 –3.08
Earnings (loss) per share, diluted (SEK) 4) –0.58 –0.25 –5.63 –1.09 –0.14 –3.08
1) Impairment of trade receivables has been calculated according to IFRS 9 in 2018 and according to IAS 39 in 2017. Previously, these losses have been reported as selling and administrative expenses. 2) Includes write-down of goodwill of SEK –13.0 billion. 3) Based on net income (loss) attributable to stockholders of the Parent Company.4) Potential ordinary shares are not considered when their conversion to ordinary shares would increase earnings per share.
Ericsson | Second Quarter Report 2018 Financial statements23
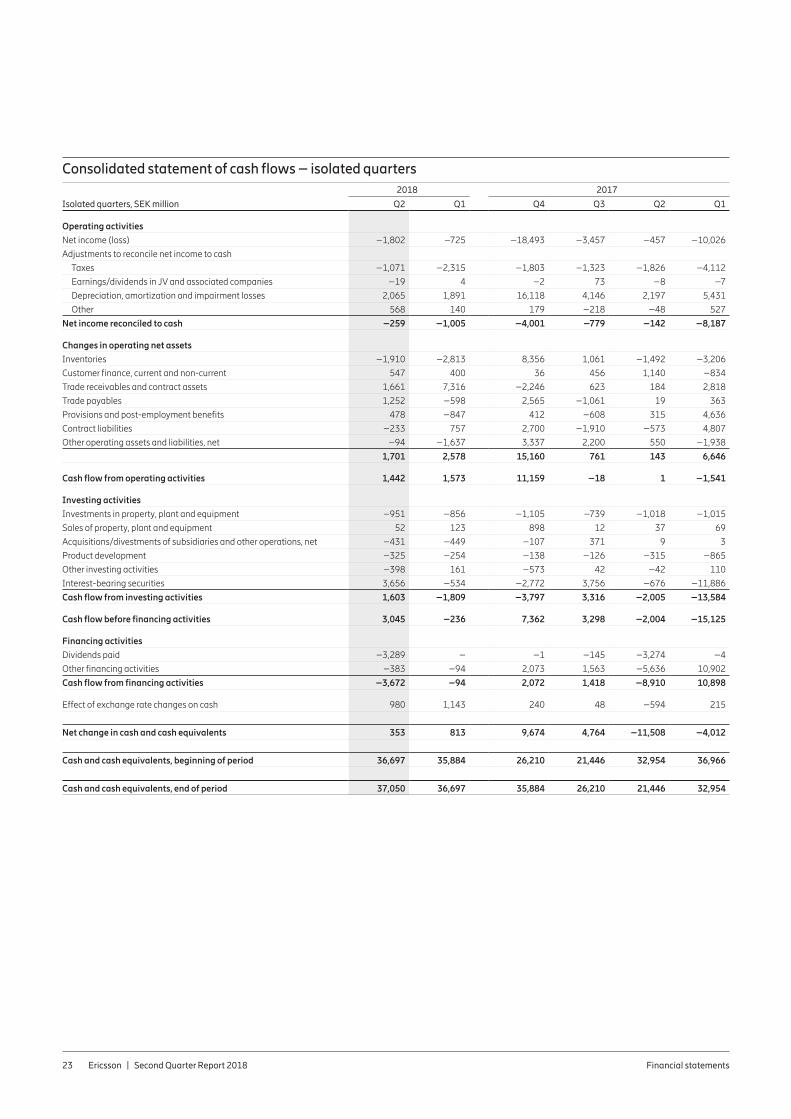
Consolidated statement of cash flows – isolated quarters2018 2017
Isolated quarters, SEK million Q2 Q1 Q4 Q3 Q2 Q1
Operating activities
Net income (loss) –1,802 –725 –18,493 –3,457 –457 –10,026
Adjustments to reconcile net income to cash
Taxes –1,071 –2,315 –1,803 –1,323 –1,826 –4,112
Earnings/dividends in JV and associated companies –19 4 –2 73 –8 –7
Depreciation, amortization and impairment losses 2,065 1,891 16,118 4,146 2,197 5,431
Other 568 140 179 –218 –48 527
Net income reconciled to cash –259 –1,005 –4,001 –779 –142 –8,187
Changes in operating net assets
Inventories –1,910 –2,813 8,356 1,061 –1,492 –3,206
Customer finance, current and non-current 547 400 36 456 1,140 –834
Trade receivables and contract assets 1,661 7,316 –2,246 623 184 2,818
Trade payables 1,252 –598 2,565 –1,061 19 363
Provisions and post-employment benefits 478 –847 412 –608 315 4,636
Contract liabilities –233 757 2,700 –1,910 –573 4,807
Other operating assets and liabilities, net –94 –1,637 3,337 2,200 550 –1,938
1,701 2,578 15,160 761 143 6,646
Cash flow from operating activities 1,442 1,573 11,159 –18 1 –1,541
Investing activities
Investments in property, plant and equipment –951 –856 –1,105 –739 –1,018 –1,015
Sales of property, plant and equipment 52 123 898 12 37 69
Acquisitions/divestments of subsidiaries and other operations, net –431 –449 –107 371 9 3
Product development –325 –254 –138 –126 –315 –865
Other investing activities –398 161 –573 42 –42 110
Interest-bearing securities 3,656 –534 –2,772 3,756 –676 –11,886
Cash flow from investing activities 1,603 –1,809 –3,797 3,316 –2,005 –13,584
Cash flow before financing activities 3,045 –236 7,362 3,298 –2,004 –15,125
Financing activities
Dividends paid –3,289 – –1 –145 –3,274 –4
Other financing activities –383 –94 2,073 1,563 –5,636 10,902
Cash flow from financing activities –3,672 –94 2,072 1,418 –8,910 10,898
Effect of exchange rate changes on cash 980 1,143 240 48 –594 215
Net change in cash and cash equivalents 353 813 9,674 4,764 –11,508 –4,012
Cash and cash equivalents, beginning of period 36,697 35,884 26,210 21,446 32,954 36,966
Cash and cash equivalents, end of period 37,050 36,697 35,884 26,210 21,446 32,954
Ericsson | Second Quarter Report 2018 Financial statements24
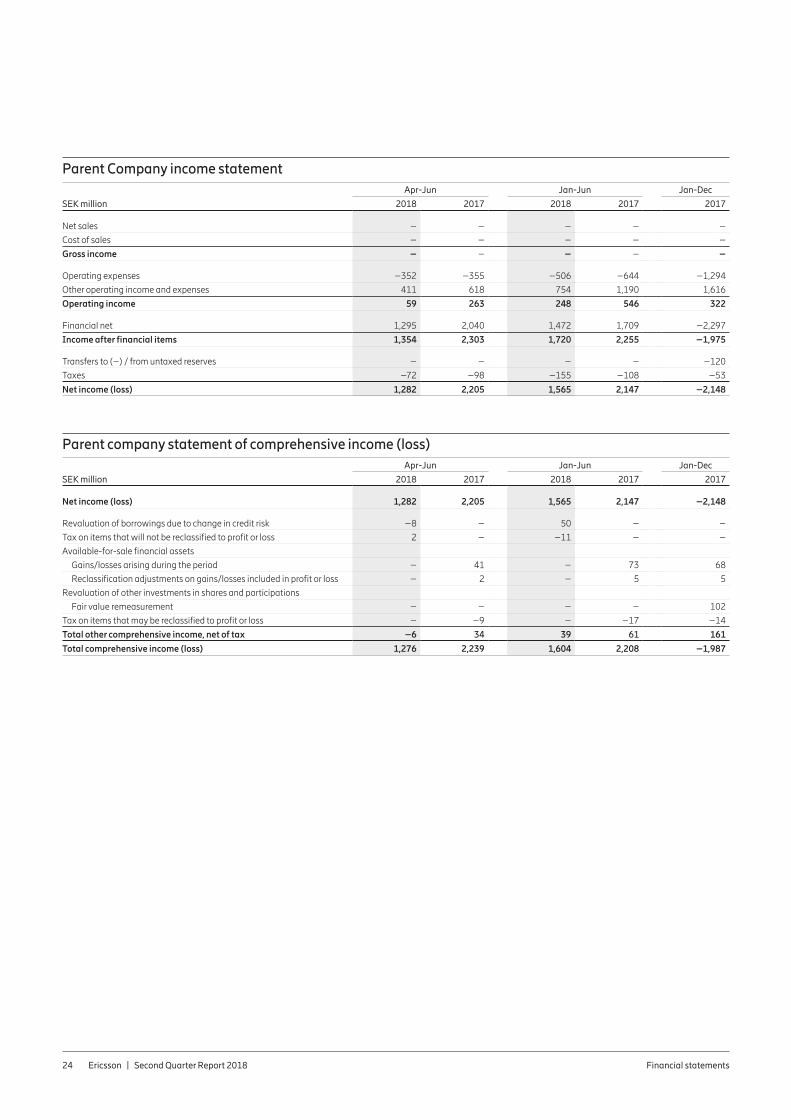
Parent Company income statementApr-Jun Jan-Jun Jan-Dec
SEK million 2018 2017 2018 2017 2017
Net sales – – – – –
Cost of sales – – – – –
Gross income – – – – –
Operating expenses –352 –355 –506 –644 –1,294
Other operating income and expenses 411 618 754 1,190 1,616
Operating income 59 263 248 546 322
Financial net 1,295 2,040 1,472 1,709 –2,297
Income after financial items 1,354 2,303 1,720 2,255 –1,975
Transfers to (–) / from untaxed reserves – – – – –120
Taxes –72 –98 –155 –108 –53
Net income (loss) 1,282 2,205 1,565 2,147 –2,148
Parent company statement of comprehensive income (loss)Apr-Jun Jan-Jun Jan-Dec
SEK million 2018 2017 2018 2017 2017
Net income (loss) 1,282 2,205 1,565 2,147 –2,148
Revaluation of borrowings due to change in credit risk –8 – 50 – –
Tax on items that will not be reclassified to profit or loss 2 – –11 – –
Available-for-sale financial assets
Gains/losses arising during the period – 41 – 73 68
Reclassification adjustments on gains/losses included in profit or loss – 2 – 5 5
Revaluation of other investments in shares and participations
Fair value remeasurement – – – – 102
Tax on items that may be reclassified to profit or loss – –9 – –17 –14
Total other comprehensive income, net of tax –6 34 39 61 161
Total comprehensive income (loss) 1,276 2,239 1,604 2,208 –1,987
Ericsson | Second Quarter Report 2018 Financial statements25
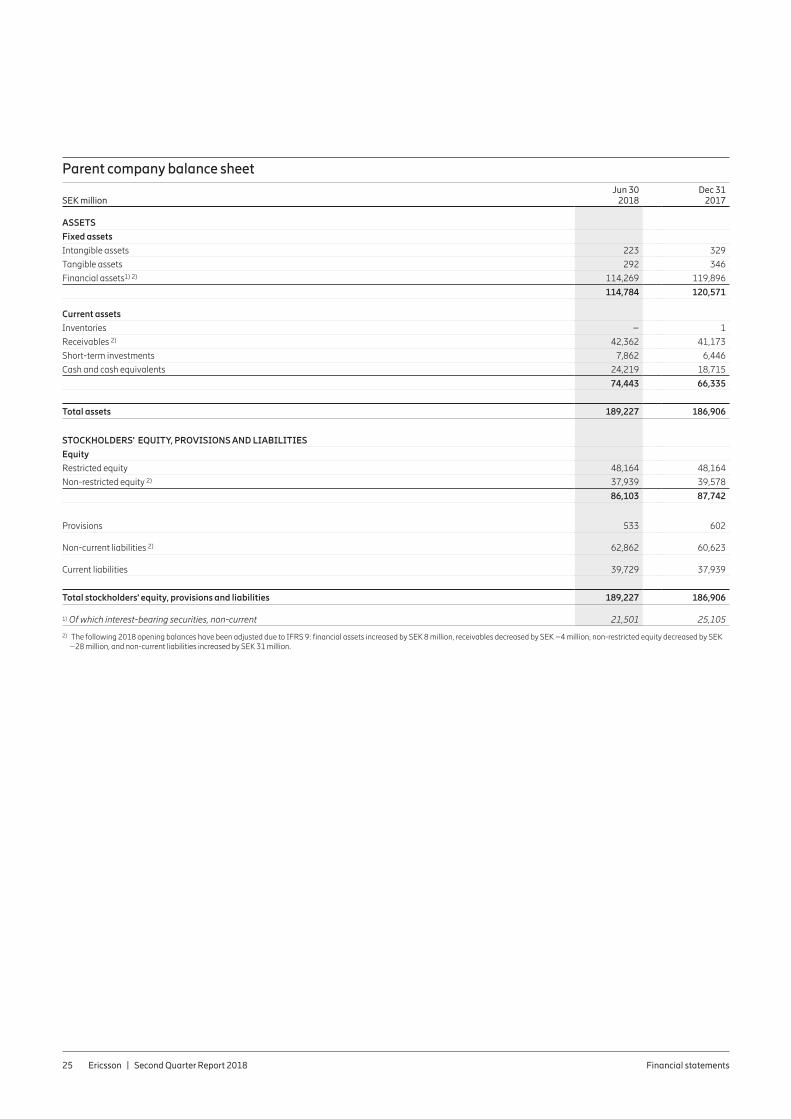
Parent company balance sheet
SEK millionJun 30
2018Dec 31
2017
ASSETS
Fixed assets
Intangible assets 223 329
Tangible assets 292 346
Financial assets1) 2) 114,269 119,896
114,784 120,571
Current assets
Inventories – 1
Receivables 2) 42,362 41,173
Short-term investments 7,862 6,446
Cash and cash equivalents 24,219 18,715
74,443 66,335
Total assets 189,227 186,906
STOCKHOLDERS' EQUITY, PROVISIONS AND LIABILITIES
Equity
Restricted equity 48,164 48,164
Non-restricted equity 2) 37,939 39,578
86,103 87,742
Provisions 533 602
Non-current liabilities 2) 62,862 60,623
Current liabilities 39,729 37,939
Total stockholders' equity, provisions and liabilities 189,227 186,906
1) Of which interest-bearing securities, non-current 21,501 25,105
2) The following 2018 opening balances have been adjusted due to IFRS 9: financial assets increased by SEK 8 million, receivables decreased by SEK –4 million, non-restricted equity decreased by SEK –28 million, and non-current liabilities increased by SEK 31 million.
Ericsson | Second Quarter Report 2018 Additional information26
Additional information
Accounting policies
The groupThis interim report is prepared in accordance with IAS 34. The term “IFRS” used in this document refers to the application of IAS and IFRS as well as interpretations of these standards as issued by IASB’s Standards Interpretation Committee (SIC) and IFRS Inter-pretations Committee (IFRIC). The accounting policies adopted are consistent with those of the annual report for the year ended December 31,2017 and should be read in conjunction with that annual report, with exception for the accounting policies described below.
New standards as from January 1, 2018Two new IFRS standards are effective as from January 1, 2018, IFRS 9 “Financial instruments” and IFRS 15 “Revenue from Cus-tomer Contracts”.
Presentation in the financial statementsFor IFRS 15 the Company has adopted the full retrospective method for transition, which mean that prior year comparatives have been restated and equity has been adjusted at the initial appli-cation date (January 1, 2016). The Company has applied IFRS 9 retrospectively on the required effective date, January 1, 2018. The 2018 opening balances have been adjusted, but the previous peri-ods have not been restated.
Based on the new requirements under IFRS 15, contract assets and contract liabilities have been added as new lines in the consoli-dated balance sheet and statement of cash flow. Previously, con-tract assets were reported as trade receivables and contract liabili-ties were reported as deferred revenue and as advances from cus-tomers within other current liabilities. Due to IFRS 9, impairment losses on trade receivables are reported on a separate line in the consolidated income statement. Previously, these losses have been reported as Selling and administrative expenses. In the statement of comprehensive income, a new line has been added for revalua-tion of borrowings due to changes in credit risk. A new line has been added to the consolidated statement of equity showing the adjust-ment to the opening balance.
The prior periods financial statements and key ratios presented in this quarterly report have been restated to reflect adoption of these new standards.
Accounting policy – IFRS 9 “Financial instruments”
Financial assetsThe Company classifies its financial assets in the following catego-ries: at amortized cost, at fair value through other comprehensive income (FVOCI), and at fair value through profit or loss (FVTPL). The classification depends on the characteristics of the asset and the business model in which it is held.
Financial assets at amortized costFinancial assets are classified as amortized cost if the contractual terms give rise to payments that are solely payments of principal and interest on the principal amount outstanding and the financial asset is held in a business model whose objective is to hold financial assets in order to collect contractual cash flows. These assets are subsequently measured at amortized cost using the effective inter-est method, minus impairment allowances.
Financial assets at fair value through other comprehensive income (FVOCI)Assets are classified as FVOCI if the contractual terms give rise to payments that are solely payments of principal and interest on the principal amount outstanding and the financial asset is held in a business model whose objective is achieved by both collecting contractual cash flows and selling financial assets. These assets are subsequently measured at fair value with changes in fair value recognized in other comprehensive income (OCI), except for effec-tive interest, impairment gains and losses and foreign exchange gains and losses recognized in the income statement. Upon derecognition, the cumulative gain or loss in OCI is reclassified to the income statement.
Financial assets at fair value through profit or loss (FVTPL)All financial assets that are not classified as either amortized cost or FVOCI are classified as FVTPL. A financial asset is classified as held for trading if it is acquired principally for the purpose of selling in the near term. Derivatives are classified as held for trading, unless they are designated as hedging instruments for the purpose of hedge accounting. Assets held for trading are classified as current assets. Debt instruments classified as FVTPL, but not held for trading, are classified on the balance sheet based on their maturity date (i.e. those with a maturity longer than one year are classified as non-cur-rent). Investments in shares and participations are classified as FVTPL and classified as non-current financial assets.
Gains or losses arising from changes in the fair values of the “Financial assets at fair value through profit or loss” category (excluding derivatives and customer financing) are presented in the income statement within Financial income in the period in which they arise. Gains and losses on derivatives are presented in the income statement either as Cost of sales, Other operating income, Financial income or Financial expense, depending on the intent with the transaction. Gains and losses on customer financing are presented in the income statement as Selling expenses.
Impairment in relation to financial assetsAt each balance sheet date, financial assets classified as either amortized cost or FVOCI and contract assets are assessed for impairment based on Expected Credit Losses (ECL). Allowances for trade receivables and contract assets are always equal to lifetime ECL. The loss is recognized in the income statement. When there is no reasonable expectation of collection, the asset is written off.
BorrowingsBorrowings by the Parent Company are designated FVTPL because they are managed and evaluated on a fair value basis. Changes in fair value are recognized in the income statement, except for changes in fair value due to change in credit risk which are recog-nized in Other comprehensive income.
Ericsson | Second Quarter Report 2018 Additional information27
Fair value hedging and fair value hedge accounting Fair value hedge accounting is no longer applied as of January 1, 2018.
Financial guaranteesFinancial guarantee contracts are initially recognized at fair value (i.e., usually the fee received). Subsequently, these contracts are measured at the higher of:– The expected credit losses.– The recognized contractual fee less cumulative amortization when amortized over the guarantee period, using the straight-line-method.
Accounting policy – IFRS 15 “Revenue from Contracts with Cus-tomers”IFRS 15, “Revenue from Contracts with Customers” establishes a new principle-based model of recognizing revenue from customer contracts. It introduces a five-step model that requires revenue to be recognized when control over goods and services are transferred to the customer.
The following paragraphs describes the types of contracts, when performance obligations are satisfied, and the timing of revenue recognition. They also describe the normal payment terms associ-ated with such contracts and the resulting impact on the balance sheet over the duration of the contracts. The vast majority of Ericsson’s business is for the sale of standard products and services.
Standard products and servicesProducts and services are classified as standard solutions if they do not require significant installation and integration services to be delivered. Installation and integration services are generally com-pleted within a short period of time, from the delivery of the related products. These products and services are viewed as separate dis-tinct performance obligations. This type of customer contract is usually signed as a frame agreement and the customer issues indi-vidual purchase orders to commit to purchases of products and services over the duration of the agreement.
Revenue for standard products shall be recognized when control over the equipment is transferred to the customer at a point in time. This assessment shall be viewed from a customer’s perspective considering indicators such as transfer of titles and risks, customer acceptance, physical possession, and billing rights. For hardware sales, transfer of control is usually deemed to occur when the equip-ment arrives at the customer site and for software sales, when the licenses are made available to the customer. Contractual terms may vary, therefore judgment will be applied when assessing the indica-tors of transfer of control. Revenue for installation and integration services is recognized upon completion of the service.
Transaction prices under these contracts are mostly billed upon delivery of the hardware or software, and completion of installation services, although a proportion may be billed upon formal accep-tance of the related installation services. This will result in a contract asset for the proportion of the transaction price that is not yet billed.
Revenue for recurring services such as customer support and managed services is recognized as the services are delivered, gener-ally pro-rata over time. Transaction prices under these contracts are billed over time, often on a quarterly basis. Contract liabilities or receivables may arise depending on whether the quarterly billing is in advance or in arrears.
Contract for standard products and services applies to business in all segments.
Customized solutionSome products and services are sold together as part of a custom-ized solution to the customer. This type of contract requires signifi-cant installation and integration services to be delivered within the solution, normally over a period of more than 1 year. These products and services are viewed together as a combined performance obli-gation. This type of contract is usually sold as a firm contract in which the scope of the solution and obligations of both parties are clearly defined for the duration of the contract.
Summary of changes to classification of financial assets and financial liabilities
Type of asset IAS 39 classification IFRS 9 classification Reason for IFRS 9 classification
Cash equivalents, interest-bearing securities, and derivatives (held for trading)
FVTPL FVTPL Held for trading portfolios are classified as FVTPL (no change).
Cash equivalents (not held for trading) Loans and receivables Amortized cost These assets are held to collect contrac-tual cash flows.
Interest-bearing securities (not held for trading)
Available-for-sale FVTPL These assets are not held for trading but are managed and evaluated on a fair value basis.
Trade receivables Loans and receivables FVOCI Trade receivables are managed in a business model whose objective is achieved through both collection of contractual cash flows and selling of assets.
Customer financing Loans and receivables FVTPL Customer finance assets are managed in a business model with the objective to realize cash flows through the sale of assets.
Investments in shares and participa-tions (equity instruments)
Available-for-sale FVTPL This is an accounting policy choice under IFRS 9.
Borrowings by parent company Amortized cost Designated FVTPL These borrowings are managed and evaluated on a fair value basis.
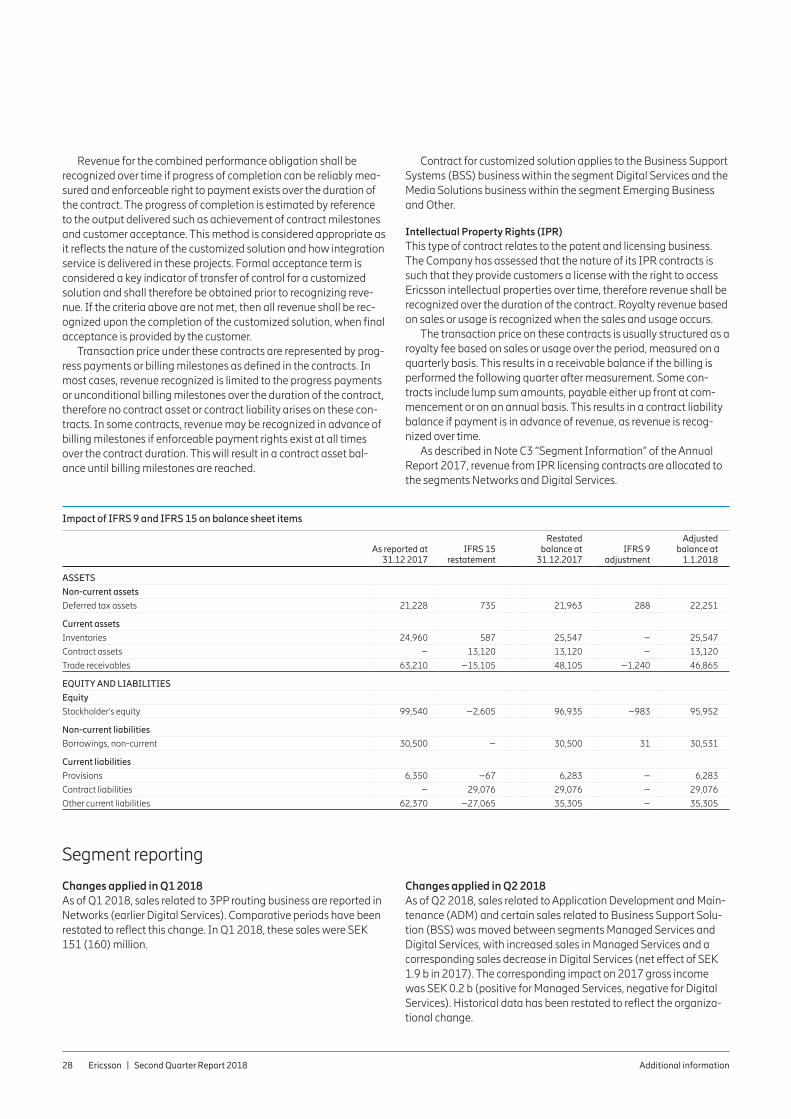
Ericsson | Second Quarter Report 2018 Additional information28
Revenue for the combined performance obligation shall be recognized over time if progress of completion can be reliably mea-sured and enforceable right to payment exists over the duration of the contract. The progress of completion is estimated by reference to the output delivered such as achievement of contract milestones and customer acceptance. This method is considered appropriate as it reflects the nature of the customized solution and how integration service is delivered in these projects. Formal acceptance term is considered a key indicator of transfer of control for a customized solution and shall therefore be obtained prior to recognizing reve-nue. If the criteria above are not met, then all revenue shall be rec-ognized upon the completion of the customized solution, when final acceptance is provided by the customer.
Transaction price under these contracts are represented by prog-ress payments or billing milestones as defined in the contracts. In most cases, revenue recognized is limited to the progress payments or unconditional billing milestones over the duration of the contract, therefore no contract asset or contract liability arises on these con-tracts. In some contracts, revenue may be recognized in advance of billing milestones if enforceable payment rights exist at all times over the contract duration. This will result in a contract asset bal-ance until billing milestones are reached.
Contract for customized solution applies to the Business Support Systems (BSS) business within the segment Digital Services and the Media Solutions business within the segment Emerging Business and Other.
Intellectual Property Rights (IPR)This type of contract relates to the patent and licensing business. The Company has assessed that the nature of its IPR contracts is such that they provide customers a license with the right to access Ericsson intellectual properties over time, therefore revenue shall be recognized over the duration of the contract. Royalty revenue based on sales or usage is recognized when the sales and usage occurs.
The transaction price on these contracts is usually structured as a royalty fee based on sales or usage over the period, measured on a quarterly basis. This results in a receivable balance if the billing is performed the following quarter after measurement. Some con-tracts include lump sum amounts, payable either up front at com-mencement or on an annual basis. This results in a contract liability balance if payment is in advance of revenue, as revenue is recog-nized over time.
As described in Note C3 “Segment Information” of the Annual Report 2017, revenue from IPR licensing contracts are allocated to the segments Networks and Digital Services.
Impact of IFRS 9 and IFRS 15 on balance sheet items
As reported at 31.12 2017
IFRS 15 restatement
Restated balance at
31.12.2017IFRS 9
adjustment
Adjusted balance at
1.1.2018
ASSETS
Non-current assets
Deferred tax assets 21,228 735 21,963 288 22,251
Current assets
Inventories 24,960 587 25,547 – 25,547
Contract assets – 13,120 13,120 – 13,120
Trade receivables 63,210 –15,105 48,105 –1,240 46,865
EQUITY AND LIABILITIES
Equity
Stockholder's equity 99,540 –2,605 96,935 –983 95,952
Non-current liabilities
Borrowings, non-current 30,500 – 30,500 31 30,531
Current liabilities
Provisions 6,350 –67 6,283 – 6,283
Contract liabilities – 29,076 29,076 – 29,076
Other current liabilities 62,370 –27,065 35,305 – 35,305
Segment reporting
Changes applied in Q1 2018As of Q1 2018, sales related to 3PP routing business are reported in Networks (earlier Digital Services). Comparative periods have been restated to reflect this change. In Q1 2018, these sales were SEK 151 (160) million.
Changes applied in Q2 2018As of Q2 2018, sales related to Application Development and Main-tenance (ADM) and certain sales related to Business Support Solu-tion (BSS) was moved between segments Managed Services and Digital Services, with increased sales in Managed Services and a corresponding sales decrease in Digital Services (net effect of SEK 1.9 b in 2017). The corresponding impact on 2017 gross income was SEK 0.2 b (positive for Managed Services, negative for Digital Services). Historical data has been restated to reflect the organiza-tional change.
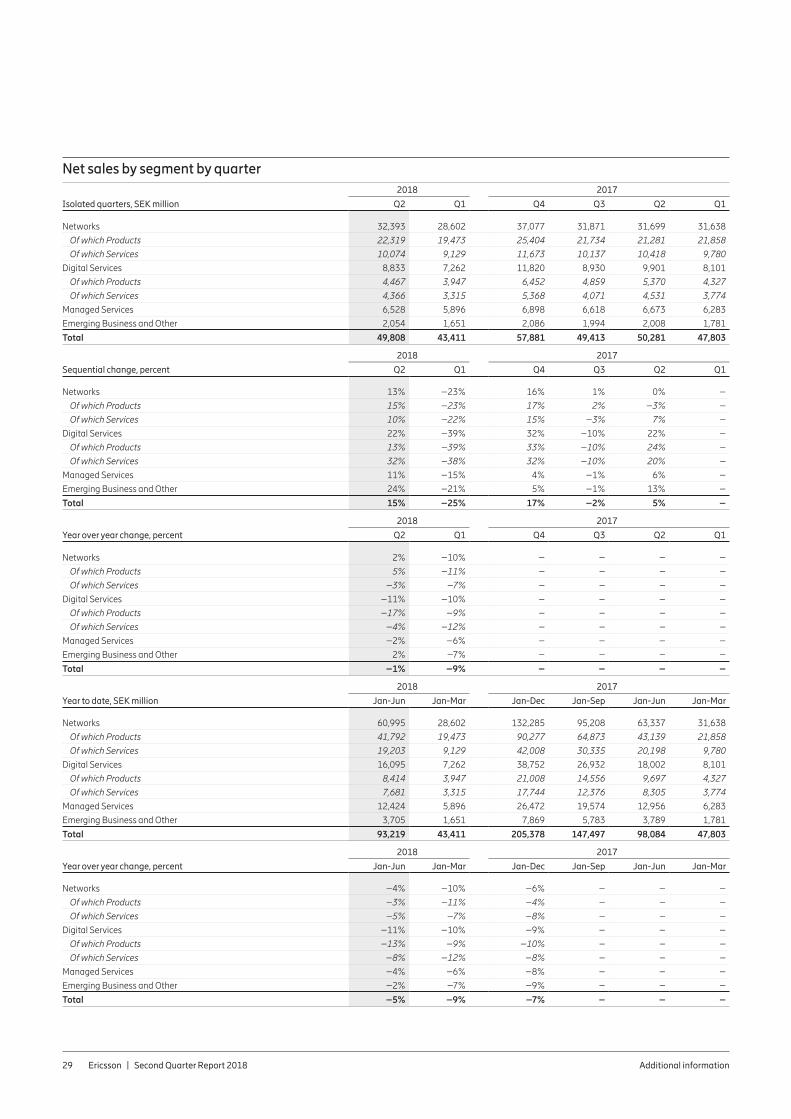
Ericsson | Second Quarter Report 2018 Additional information29
Net sales by segment by quarter2018 2017
Isolated quarters, SEK million Q2 Q1 Q4 Q3 Q2 Q1
Networks 32,393 28,602 37,077 31,871 31,699 31,638
Of which Products 22,319 19,473 25,404 21,734 21,281 21,858
Of which Services 10,074 9,129 11,673 10,137 10,418 9,780
Digital Services 8,833 7,262 11,820 8,930 9,901 8,101
Of which Products 4,467 3,947 6,452 4,859 5,370 4,327
Of which Services 4,366 3,315 5,368 4,071 4,531 3,774
Managed Services 6,528 5,896 6,898 6,618 6,673 6,283
Emerging Business and Other 2,054 1,651 2,086 1,994 2,008 1,781
Total 49,808 43,411 57,881 49,413 50,281 47,803
2018 2017
Sequential change, percent Q2 Q1 Q4 Q3 Q2 Q1
Networks 13% –23% 16% 1% 0% –
Of which Products 15% –23% 17% 2% –3% –
Of which Services 10% –22% 15% –3% 7% –
Digital Services 22% –39% 32% –10% 22% –
Of which Products 13% –39% 33% –10% 24% –
Of which Services 32% –38% 32% –10% 20% –
Managed Services 11% –15% 4% –1% 6% –
Emerging Business and Other 24% –21% 5% –1% 13% –
Total 15% –25% 17% –2% 5% –
2018 2017
Year over year change, percent Q2 Q1 Q4 Q3 Q2 Q1
Networks 2% –10% – – – –
Of which Products 5% –11% – – – –
Of which Services –3% –7% – – – –
Digital Services –11% –10% – – – –
Of which Products –17% –9% – – – –
Of which Services –4% –12% – – – –
Managed Services –2% –6% – – – –
Emerging Business and Other 2% –7% – – – –
Total –1% –9% – – – –
2018 2017
Year to date, SEK million Jan-Jun Jan-Mar Jan-Dec Jan-Sep Jan-Jun Jan-Mar
Networks 60,995 28,602 132,285 95,208 63,337 31,638
Of which Products 41,792 19,473 90,277 64,873 43,139 21,858
Of which Services 19,203 9,129 42,008 30,335 20,198 9,780
Digital Services 16,095 7,262 38,752 26,932 18,002 8,101
Of which Products 8,414 3,947 21,008 14,556 9,697 4,327
Of which Services 7,681 3,315 17,744 12,376 8,305 3,774
Managed Services 12,424 5,896 26,472 19,574 12,956 6,283
Emerging Business and Other 3,705 1,651 7,869 5,783 3,789 1,781
Total 93,219 43,411 205,378 147,497 98,084 47,803
2018 2017
Year over year change, percent Jan-Jun Jan-Mar Jan-Dec Jan-Sep Jan-Jun Jan-Mar
Networks –4% –10% –6% – – –
Of which Products –3% –11% –4% – – –
Of which Services –5% –7% –8% – – –
Digital Services –11% –10% –9% – – –
Of which Products –13% –9% –10% – – –
Of which Services –8% –12% –8% – – –
Managed Services –4% –6% –8% – – –
Emerging Business and Other –2% –7% –9% – – –
Total –5% –9% –7% – – –
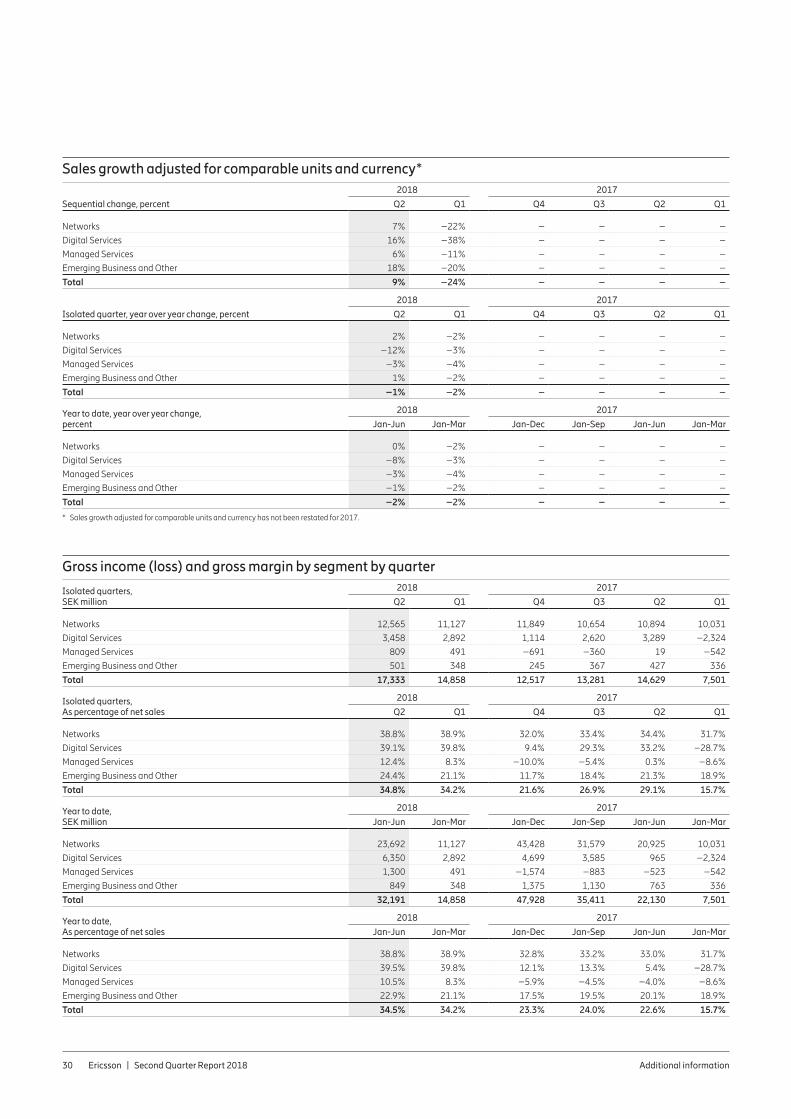
Ericsson | Second Quarter Report 2018 Additional information30
Sales growth adjusted for comparable units and currency*2018 2017
Sequential change, percent Q2 Q1 Q4 Q3 Q2 Q1
Networks 7% –22% – – – –
Digital Services 16% –38% – – – –
Managed Services 6% –11% – – – –
Emerging Business and Other 18% –20% – – – –
Total 9% –24% – – – –
Isolated quarter, year over year change, percent
2018 2017
Q2 Q1 Q4 Q3 Q2 Q1
Networks 2% –2% – – – –
Digital Services –12% –3% – – – –
Managed Services –3% –4% – – – –
Emerging Business and Other 1% –2% – – – –
Total –1% –2% – – – –
Year to date, year over year change, percent
2018 2017
Jan-Jun Jan-Mar Jan-Dec Jan-Sep Jan-Jun Jan-Mar
Networks 0% –2% – – – –
Digital Services –8% –3% – – – –
Managed Services –3% –4% – – – –
Emerging Business and Other –1% –2% – – – –
Total –2% –2% – – – –
* Sales growth adjusted for comparable units and currency has not been restated for 2017.
Gross income (loss) and gross margin by segment by quarter
Isolated quarters, SEK million
2018 2017
Q2 Q1 Q4 Q3 Q2 Q1
Networks 12,565 11,127 11,849 10,654 10,894 10,031
Digital Services 3,458 2,892 1,114 2,620 3,289 –2,324
Managed Services 809 491 –691 –360 19 –542
Emerging Business and Other 501 348 245 367 427 336
Total 17,333 14,858 12,517 13,281 14,629 7,501
Isolated quarters, As percentage of net sales
2018 2017
Q2 Q1 Q4 Q3 Q2 Q1
Networks 38.8% 38.9% 32.0% 33.4% 34.4% 31.7%
Digital Services 39.1% 39.8% 9.4% 29.3% 33.2% –28.7%
Managed Services 12.4% 8.3% –10.0% –5.4% 0.3% –8.6%
Emerging Business and Other 24.4% 21.1% 11.7% 18.4% 21.3% 18.9%
Total 34.8% 34.2% 21.6% 26.9% 29.1% 15.7%
Year to date, SEK million
2018 2017
Jan-Jun Jan-Mar Jan-Dec Jan-Sep Jan-Jun Jan-Mar
Networks 23,692 11,127 43,428 31,579 20,925 10,031
Digital Services 6,350 2,892 4,699 3,585 965 –2,324
Managed Services 1,300 491 –1,574 –883 –523 –542
Emerging Business and Other 849 348 1,375 1,130 763 336
Total 32,191 14,858 47,928 35,411 22,130 7,501
Year to date, As percentage of net sales
2018 2017
Jan-Jun Jan-Mar Jan-Dec Jan-Sep Jan-Jun Jan-Mar
Networks 38.8% 38.9% 32.8% 33.2% 33.0% 31.7%
Digital Services 39.5% 39.8% 12.1% 13.3% 5.4% –28.7%
Managed Services 10.5% 8.3% –5.9% –4.5% –4.0% –8.6%
Emerging Business and Other 22.9% 21.1% 17.5% 19.5% 20.1% 18.9%
Total 34.5% 34.2% 23.3% 24.0% 22.6% 15.7%
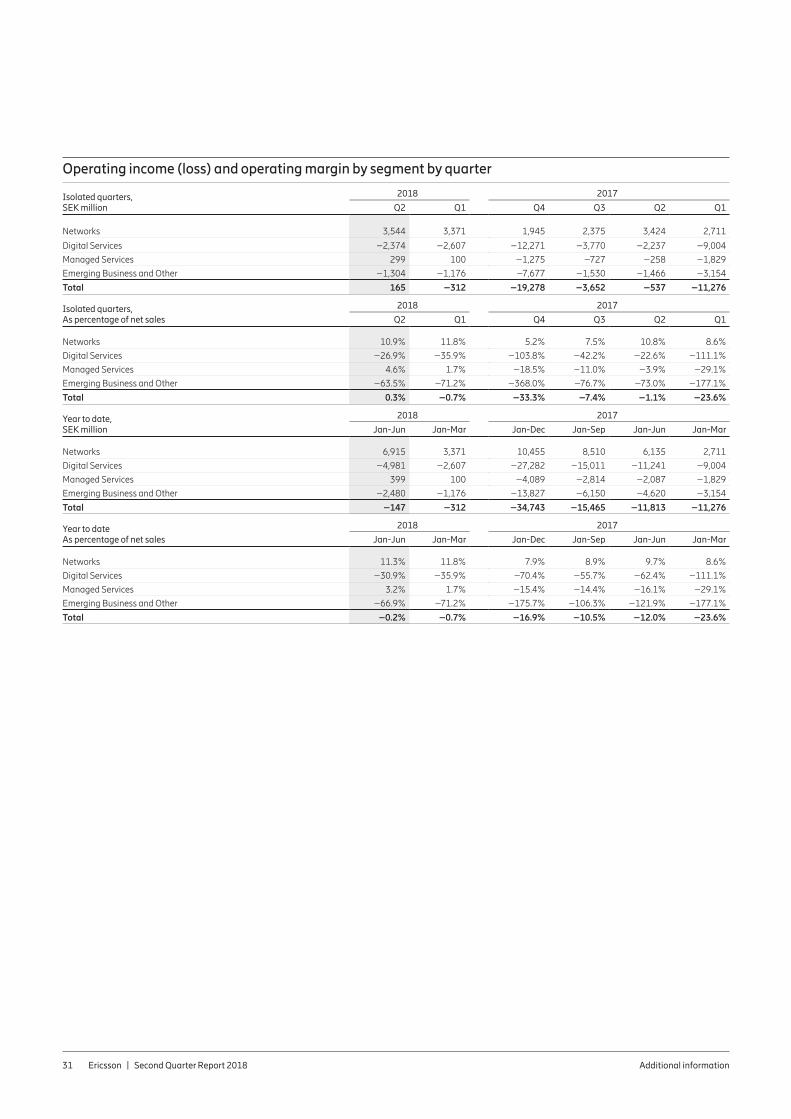
Ericsson | Second Quarter Report 2018 Additional information31
Operating income (loss) and operating margin by segment by quarter
Isolated quarters, SEK million
2018 2017
Q2 Q1 Q4 Q3 Q2 Q1
Networks 3,544 3,371 1,945 2,375 3,424 2,711
Digital Services –2,374 –2,607 –12,271 –3,770 –2,237 –9,004
Managed Services 299 100 –1,275 –727 –258 –1,829
Emerging Business and Other –1,304 –1,176 –7,677 –1,530 –1,466 –3,154
Total 165 –312 –19,278 –3,652 –537 –11,276
Isolated quarters, As percentage of net sales
2018 2017
Q2 Q1 Q4 Q3 Q2 Q1
Networks 10.9% 11.8% 5.2% 7.5% 10.8% 8.6%
Digital Services –26.9% –35.9% –103.8% –42.2% –22.6% –111.1%
Managed Services 4.6% 1.7% –18.5% –11.0% –3.9% –29.1%
Emerging Business and Other –63.5% –71.2% –368.0% –76.7% –73.0% –177.1%
Total 0.3% –0.7% –33.3% –7.4% –1.1% –23.6%
Year to date, SEK million
2018 2017
Jan-Jun Jan-Mar Jan-Dec Jan-Sep Jan-Jun Jan-Mar
Networks 6,915 3,371 10,455 8,510 6,135 2,711
Digital Services –4,981 –2,607 –27,282 –15,011 –11,241 –9,004
Managed Services 399 100 –4,089 –2,814 –2,087 –1,829
Emerging Business and Other –2,480 –1,176 –13,827 –6,150 –4,620 –3,154
Total –147 –312 –34,743 –15,465 –11,813 –11,276
Year to date As percentage of net sales
2018 2017
Jan-Jun Jan-Mar Jan-Dec Jan-Sep Jan-Jun Jan-Mar
Networks 11.3% 11.8% 7.9% 8.9% 9.7% 8.6%
Digital Services –30.9% –35.9% –70.4% –55.7% –62.4% –111.1%
Managed Services 3.2% 1.7% –15.4% –14.4% –16.1% –29.1%
Emerging Business and Other –66.9% –71.2% –175.7% –106.3% –121.9% –177.1%
Total –0.2% –0.7% –16.9% –10.5% –12.0% –23.6%
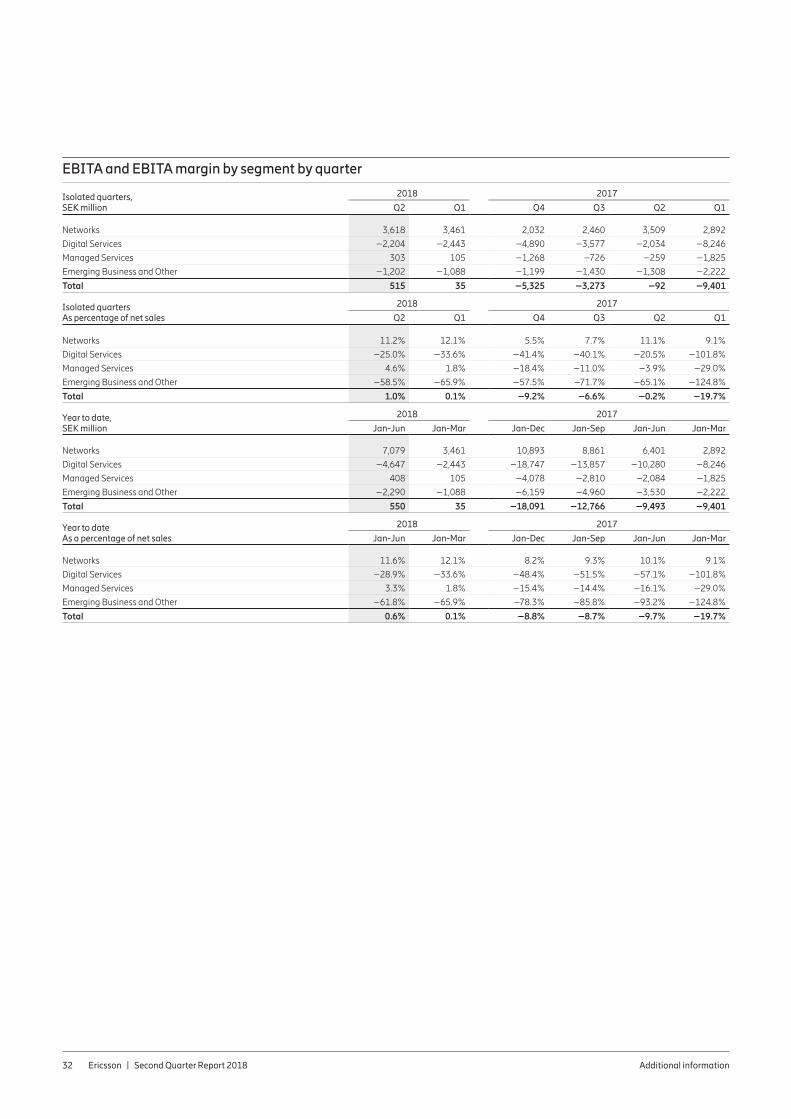
Ericsson | Second Quarter Report 2018 Additional information32
EBITA and EBITA margin by segment by quarter
Isolated quarters, SEK million
2018 2017
Q2 Q1 Q4 Q3 Q2 Q1
Networks 3,618 3,461 2,032 2,460 3,509 2,892
Digital Services –2,204 –2,443 –4,890 –3,577 –2,034 –8,246
Managed Services 303 105 –1,268 –726 –259 –1,825
Emerging Business and Other –1,202 –1,088 –1,199 –1,430 –1,308 –2,222
Total 515 35 –5,325 –3,273 –92 –9,401
Isolated quarters As percentage of net sales
2018 2017
Q2 Q1 Q4 Q3 Q2 Q1
Networks 11.2% 12.1% 5.5% 7.7% 11.1% 9.1%
Digital Services –25.0% –33.6% –41.4% –40.1% –20.5% –101.8%
Managed Services 4.6% 1.8% –18.4% –11.0% –3.9% –29.0%
Emerging Business and Other –58.5% –65.9% –57.5% –71.7% –65.1% –124.8%
Total 1.0% 0.1% –9.2% –6.6% –0.2% –19.7%
Year to date, SEK million
2018 2017
Jan-Jun Jan-Mar Jan-Dec Jan-Sep Jan-Jun Jan-Mar
Networks 7,079 3,461 10,893 8,861 6,401 2,892
Digital Services –4,647 –2,443 –18,747 –13,857 –10,280 –8,246
Managed Services 408 105 –4,078 –2,810 –2,084 –1,825
Emerging Business and Other –2,290 –1,088 –6,159 –4,960 –3,530 –2,222
Total 550 35 –18,091 –12,766 –9,493 –9,401
Year to date As a percentage of net sales
2018 2017
Jan-Jun Jan-Mar Jan-Dec Jan-Sep Jan-Jun Jan-Mar
Networks 11.6% 12.1% 8.2% 9.3% 10.1% 9.1%
Digital Services –28.9% –33.6% –48.4% –51.5% –57.1% –101.8%
Managed Services 3.3% 1.8% –15.4% –14.4% –16.1% –29.0%
Emerging Business and Other –61.8% –65.9% –78.3% –85.8% –93.2% –124.8%
Total 0.6% 0.1% –8.8% –8.7% –9.7% –19.7%
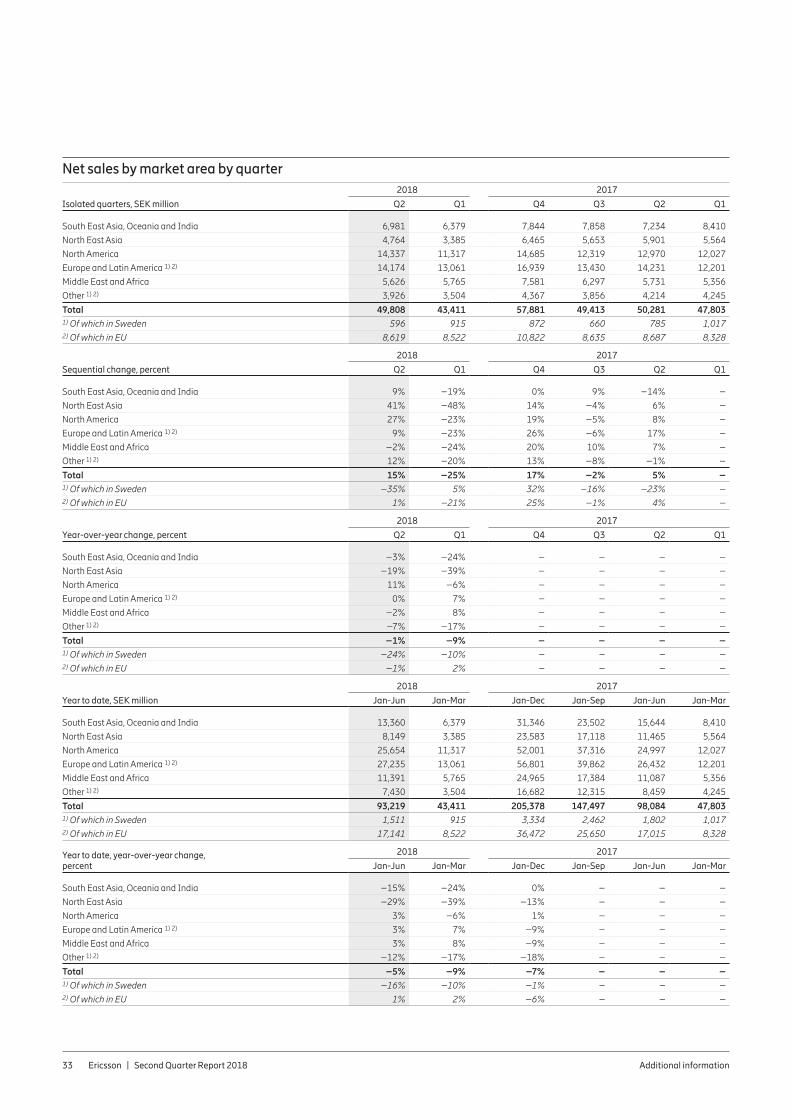
Ericsson | Second Quarter Report 2018 Additional information33
Net sales by market area by quarter2018 2017
Isolated quarters, SEK million Q2 Q1 Q4 Q3 Q2 Q1
South East Asia, Oceania and India 6,981 6,379 7,844 7,858 7,234 8,410
North East Asia 4,764 3,385 6,465 5,653 5,901 5,564
North America 14,337 11,317 14,685 12,319 12,970 12,027
Europe and Latin America 1) 2) 14,174 13,061 16,939 13,430 14,231 12,201
Middle East and Africa 5,626 5,765 7,581 6,297 5,731 5,356
Other 1) 2) 3,926 3,504 4,367 3,856 4,214 4,245
Total 49,808 43,411 57,881 49,413 50,281 47,8031) Of which in Sweden 596 915 872 660 785 1,0172) Of which in EU 8,619 8,522 10,822 8,635 8,687 8,328
2018 2017
Sequential change, percent Q2 Q1 Q4 Q3 Q2 Q1
South East Asia, Oceania and India 9% –19% 0% 9% –14% –
North East Asia 41% –48% 14% –4% 6% –
North America 27% –23% 19% –5% 8% –
Europe and Latin America 1) 2) 9% –23% 26% –6% 17% –
Middle East and Africa –2% –24% 20% 10% 7% –
Other 1) 2) 12% –20% 13% –8% –1% –
Total 15% –25% 17% –2% 5% –1) Of which in Sweden –35% 5% 32% –16% –23% –2) Of which in EU 1% –21% 25% –1% 4% –
2018 2017
Year-over-year change, percent Q2 Q1 Q4 Q3 Q2 Q1
South East Asia, Oceania and India –3% –24% – – – –
North East Asia –19% –39% – – – –
North America 11% –6% – – – –
Europe and Latin America 1) 2) 0% 7% – – – –
Middle East and Africa –2% 8% – – – –
Other 1) 2) –7% –17% – – – –
Total –1% –9% – – – –1) Of which in Sweden –24% –10% – – – –2) Of which in EU –1% 2% – – – –
2018 2017
Year to date, SEK million Jan-Jun Jan-Mar Jan-Dec Jan-Sep Jan-Jun Jan-Mar
South East Asia, Oceania and India 13,360 6,379 31,346 23,502 15,644 8,410
North East Asia 8,149 3,385 23,583 17,118 11,465 5,564
North America 25,654 11,317 52,001 37,316 24,997 12,027
Europe and Latin America 1) 2) 27,235 13,061 56,801 39,862 26,432 12,201
Middle East and Africa 11,391 5,765 24,965 17,384 11,087 5,356
Other 1) 2) 7,430 3,504 16,682 12,315 8,459 4,245
Total 93,219 43,411 205,378 147,497 98,084 47,8031) Of which in Sweden 1,511 915 3,334 2,462 1,802 1,0172) Of which in EU 17,141 8,522 36,472 25,650 17,015 8,328
Year to date, year-over-year change, percent
2018 2017
Jan-Jun Jan-Mar Jan-Dec Jan-Sep Jan-Jun Jan-Mar
South East Asia, Oceania and India –15% –24% 0% – – –
North East Asia –29% –39% –13% – – –
North America 3% –6% 1% – – –
Europe and Latin America 1) 2) 3% 7% –9% – – –
Middle East and Africa 3% 8% –9% – – –
Other 1) 2) –12% –17% –18% – – –
Total –5% –9% –7% – – –1) Of which in Sweden –16% –10% –1% – – –2) Of which in EU 1% 2% –6% – – –
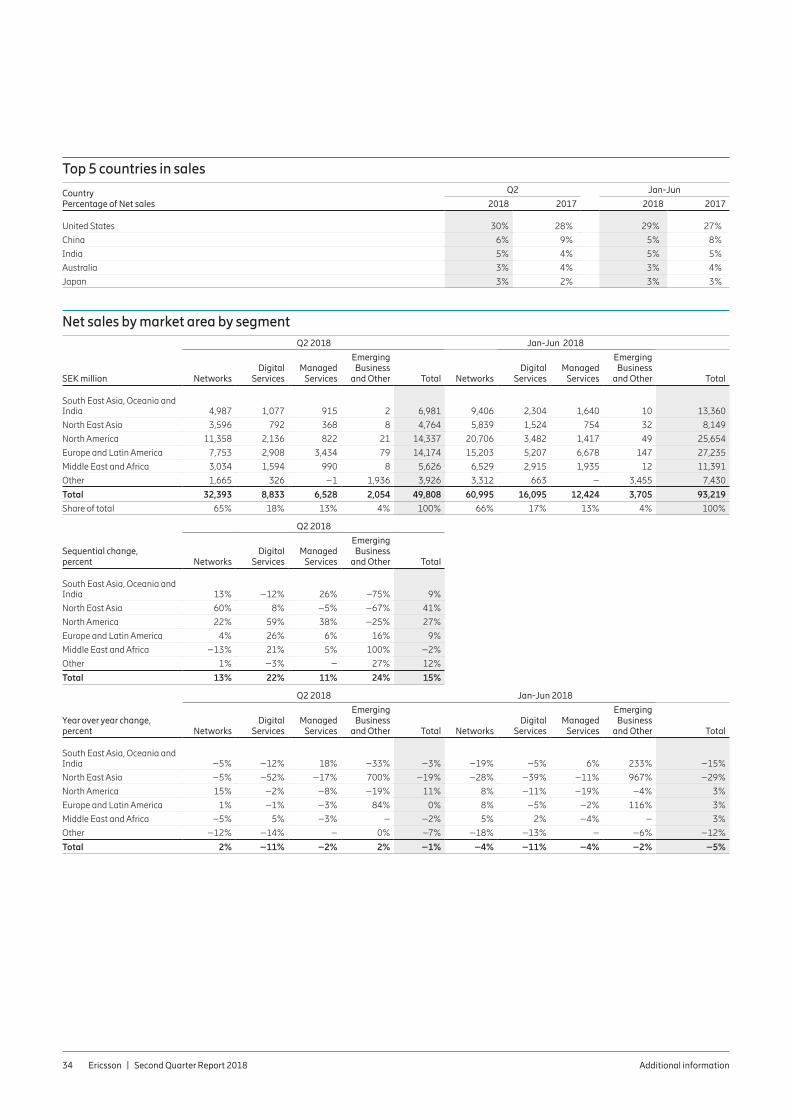
Ericsson | Second Quarter Report 2018 Additional information34
Top 5 countries in sales
Country Percentage of Net sales
Q2 Jan-Jun
2018 2017 2018 2017
United States 30% 28% 29% 27%
China 6% 9% 5% 8%
India 5% 4% 5% 5%
Australia 3% 4% 3% 4%
Japan 3% 2% 3% 3%
Net sales by market area by segmentQ2 2018 Jan-Jun 2018
SEK million NetworksDigital
ServicesManaged
Services
Emerging Business
and Other Total NetworksDigital
ServicesManaged
Services
Emerging Business
and Other Total
South East Asia, Oceania and India 4,987 1,077 915 2 6,981 9,406 2,304 1,640 10 13,360
North East Asia 3,596 792 368 8 4,764 5,839 1,524 754 32 8,149
North America 11,358 2,136 822 21 14,337 20,706 3,482 1,417 49 25,654
Europe and Latin America 7,753 2,908 3,434 79 14,174 15,203 5,207 6,678 147 27,235
Middle East and Africa 3,034 1,594 990 8 5,626 6,529 2,915 1,935 12 11,391
Other 1,665 326 –1 1,936 3,926 3,312 663 – 3,455 7,430
Total 32,393 8,833 6,528 2,054 49,808 60,995 16,095 12,424 3,705 93,219
Share of total 65% 18% 13% 4% 100% 66% 17% 13% 4% 100%
Sequential change, percent
Q2 2018
NetworksDigital
ServicesManaged
Services
Emerging Business
and Other Total
South East Asia, Oceania and India 13% –12% 26% –75% 9%
North East Asia 60% 8% –5% –67% 41%
North America 22% 59% 38% –25% 27%
Europe and Latin America 4% 26% 6% 16% 9%
Middle East and Africa –13% 21% 5% 100% –2%
Other 1% –3% – 27% 12%
Total 13% 22% 11% 24% 15%
Q2 2018 Jan-Jun 2018
Year over year change, percent Networks
Digital Services
Managed Services
Emerging Business
and Other Total NetworksDigital
ServicesManaged
Services
Emerging Business
and Other Total
South East Asia, Oceania and India –5% –12% 18% –33% –3% –19% –5% 6% 233% –15%
North East Asia –5% –52% –17% 700% –19% –28% –39% –11% 967% –29%
North America 15% –2% –8% –19% 11% 8% –11% –19% –4% 3%
Europe and Latin America 1% –1% –3% 84% 0% 8% –5% –2% 116% 3%
Middle East and Africa –5% 5% –3% – –2% 5% 2% –4% – 3%
Other –12% –14% – 0% –7% –18% –13% – –6% –12%
Total 2% –11% –2% 2% –1% –4% –11% –4% –2% –5%
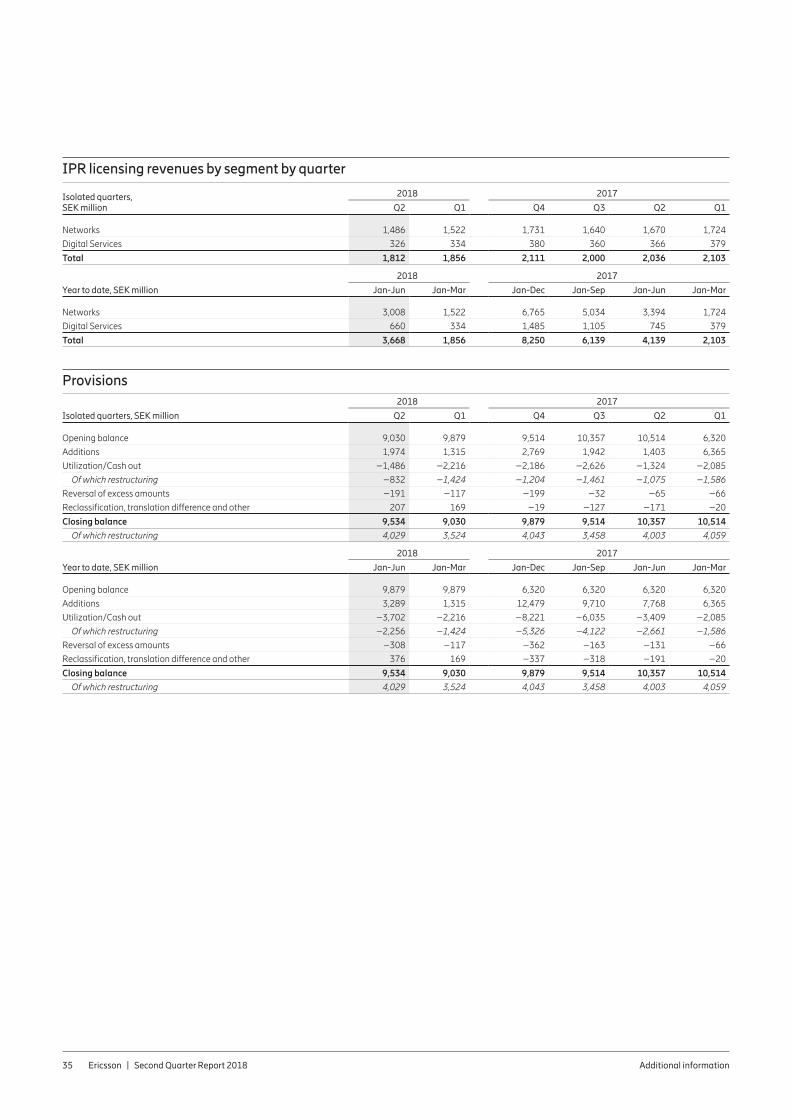
Ericsson | Second Quarter Report 2018 Additional information35
IPR licensing revenues by segment by quarter
Isolated quarters, SEK million
2018 2017
Q2 Q1 Q4 Q3 Q2 Q1
Networks 1,486 1,522 1,731 1,640 1,670 1,724
Digital Services 326 334 380 360 366 379
Total 1,812 1,856 2,111 2,000 2,036 2,103
Year to date, SEK million
2018 2017
Jan-Jun Jan-Mar Jan-Dec Jan-Sep Jan-Jun Jan-Mar
Networks 3,008 1,522 6,765 5,034 3,394 1,724
Digital Services 660 334 1,485 1,105 745 379
Total 3,668 1,856 8,250 6,139 4,139 2,103
Provisions2018 2017
Isolated quarters, SEK million Q2 Q1 Q4 Q3 Q2 Q1
Opening balance 9,030 9,879 9,514 10,357 10,514 6,320
Additions 1,974 1,315 2,769 1,942 1,403 6,365
Utilization/Cash out –1,486 –2,216 –2,186 –2,626 –1,324 –2,085
Of which restructuring –832 –1,424 –1,204 –1,461 –1,075 –1,586
Reversal of excess amounts –191 –117 –199 –32 –65 –66
Reclassification, translation difference and other 207 169 –19 –127 –171 –20
Closing balance 9,534 9,030 9,879 9,514 10,357 10,514
Of which restructuring 4,029 3,524 4,043 3,458 4,003 4,059
2018 2017
Year to date, SEK million Jan-Jun Jan-Mar Jan-Dec Jan-Sep Jan-Jun Jan-Mar
Opening balance 9,879 9,879 6,320 6,320 6,320 6,320
Additions 3,289 1,315 12,479 9,710 7,768 6,365
Utilization/Cash out –3,702 –2,216 –8,221 –6,035 –3,409 –2,085
Of which restructuring –2,256 –1,424 –5,326 –4,122 –2,661 –1,586
Reversal of excess amounts –308 –117 –362 –163 –131 –66
Reclassification, translation difference and other 376 169 –337 –318 –191 –20
Closing balance 9,534 9,030 9,879 9,514 10,357 10,514
Of which restructuring 4,029 3,524 4,043 3,458 4,003 4,059
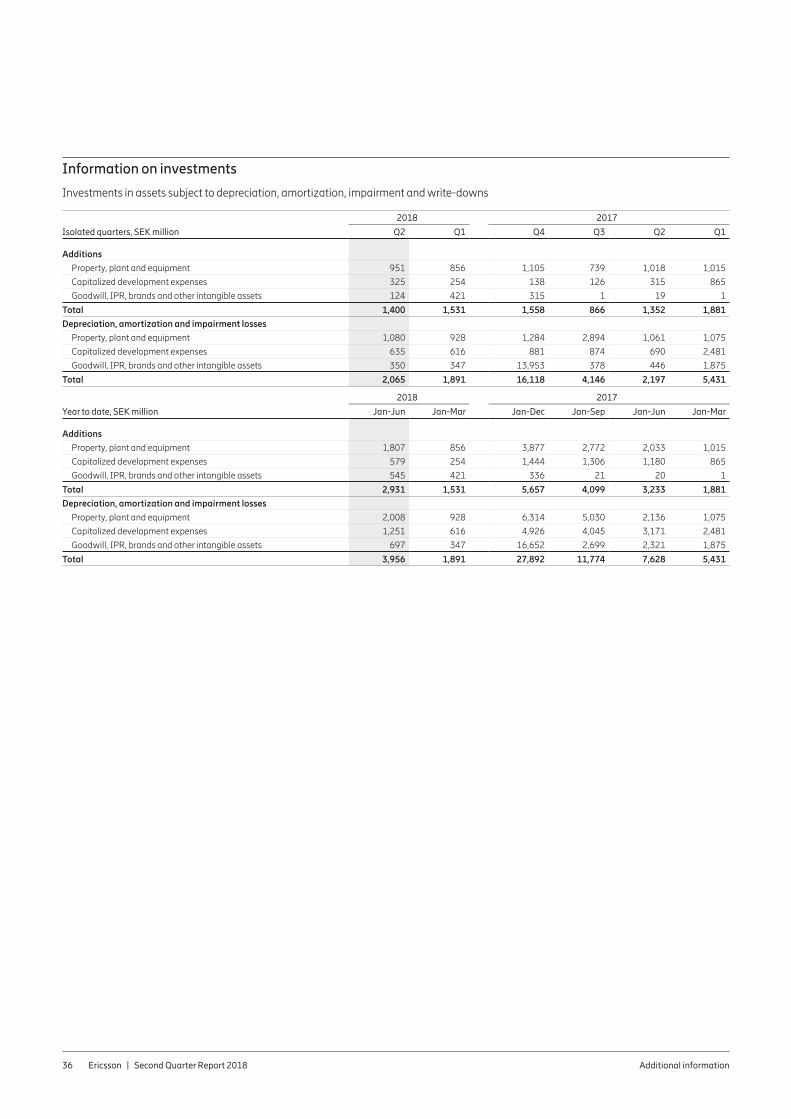
Ericsson | Second Quarter Report 2018 Additional information36
Information on investments
Investments in assets subject to depreciation, amortization, impairment and write-downs
2018 2017
Isolated quarters, SEK million Q2 Q1 Q4 Q3 Q2 Q1
Additions
Property, plant and equipment 951 856 1,105 739 1,018 1,015
Capitalized development expenses 325 254 138 126 315 865
Goodwill, IPR, brands and other intangible assets 124 421 315 1 19 1
Total 1,400 1,531 1,558 866 1,352 1,881
Depreciation, amortization and impairment losses
Property, plant and equipment 1,080 928 1,284 2,894 1,061 1,075
Capitalized development expenses 635 616 881 874 690 2,481
Goodwill, IPR, brands and other intangible assets 350 347 13,953 378 446 1,875
Total 2,065 1,891 16,118 4,146 2,197 5,431
2018 2017
Year to date, SEK million Jan-Jun Jan-Mar Jan-Dec Jan-Sep Jan-Jun Jan-Mar
Additions
Property, plant and equipment 1,807 856 3,877 2,772 2,033 1,015
Capitalized development expenses 579 254 1,444 1,306 1,180 865
Goodwill, IPR, brands and other intangible assets 545 421 336 21 20 1
Total 2,931 1,531 5,657 4,099 3,233 1,881
Depreciation, amortization and impairment losses
Property, plant and equipment 2,008 928 6,314 5,030 2,136 1,075
Capitalized development expenses 1,251 616 4,926 4,045 3,171 2,481
Goodwill, IPR, brands and other intangible assets 697 347 16,652 2,699 2,321 1,875
Total 3,956 1,891 27,892 11,774 7,628 5,431
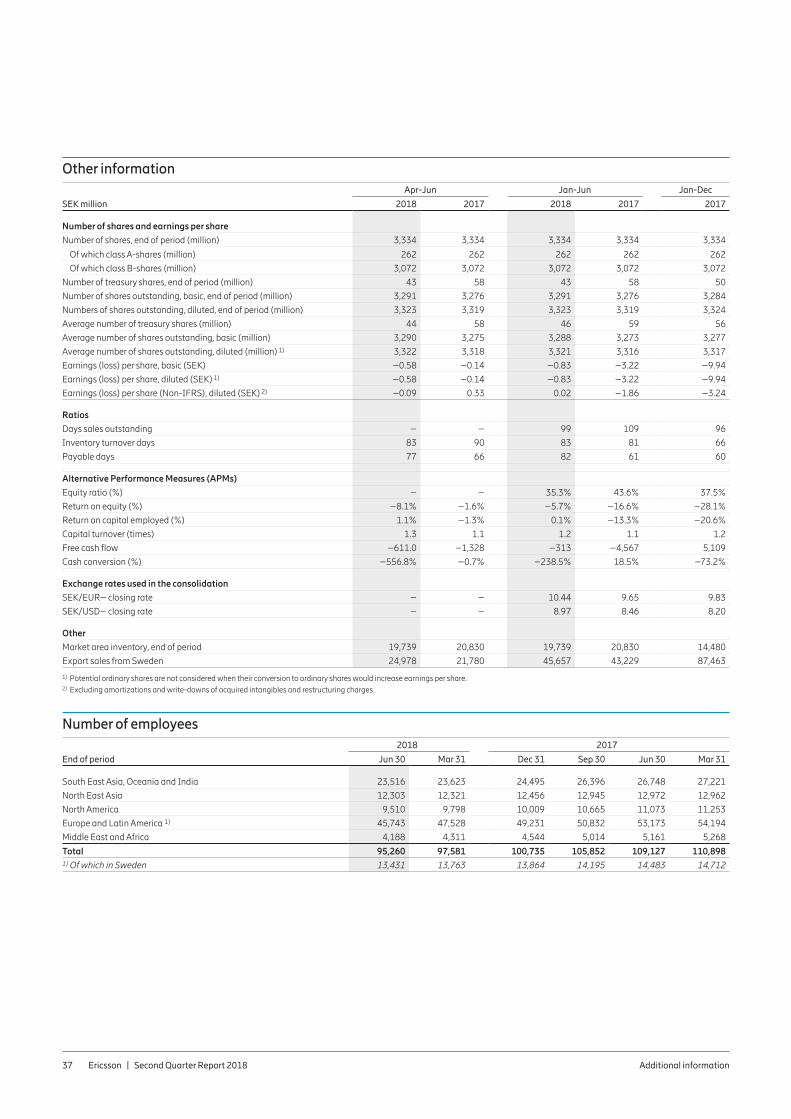
Ericsson | Second Quarter Report 2018 Additional information37
Other informationApr-Jun Jan-Jun Jan-Dec
SEK million 2018 2017 2018 2017 2017
Number of shares and earnings per share
Number of shares, end of period (million) 3,334 3,334 3,334 3,334 3,334
Of which class A-shares (million) 262 262 262 262 262
Of which class B-shares (million) 3,072 3,072 3,072 3,072 3,072
Number of treasury shares, end of period (million) 43 58 43 58 50
Number of shares outstanding, basic, end of period (million) 3,291 3,276 3,291 3,276 3,284
Numbers of shares outstanding, diluted, end of period (million) 3,323 3,319 3,323 3,319 3,324
Average number of treasury shares (million) 44 58 46 59 56
Average number of shares outstanding, basic (million) 3,290 3,275 3,288 3,273 3,277
Average number of shares outstanding, diluted (million) 1) 3,322 3,318 3,321 3,316 3,317
Earnings (loss) per share, basic (SEK) –0.58 –0.14 –0.83 –3.22 –9.94
Earnings (loss) per share, diluted (SEK) 1) –0.58 –0.14 –0.83 –3.22 –9.94
Earnings (loss) per share (Non-IFRS), diluted (SEK) 2) –0.09 0.33 0.02 –1.86 –3.24
Ratios
Days sales outstanding – – 99 109 96
Inventory turnover days 83 90 83 81 66
Payable days 77 66 82 61 60
Alternative Performance Measures (APMs)
Equity ratio (%) – – 35.3% 43.6% 37.5%
Return on equity (%) –8.1% –1.6% –5.7% –16.6% –28.1%
Return on capital employed (%) 1.1% –1.3% 0.1% –13.3% –20.6%
Capital turnover (times) 1.3 1.1 1.2 1.1 1.2
Free cash flow –611.0 –1,328 –313 –4,567 5,109
Cash conversion (%) –556.8% –0.7% –238.5% 18.5% –73.2%
Exchange rates used in the consolidation
SEK/EUR– closing rate – – 10.44 9.65 9.83
SEK/USD– closing rate – – 8.97 8.46 8.20
Other
Market area inventory, end of period 19,739 20,830 19,739 20,830 14,480
Export sales from Sweden 24,978 21,780 45,657 43,229 87,463
1) Potential ordinary shares are not considered when their conversion to ordinary shares would increase earnings per share. 2) Excluding amortizations and write-downs of acquired intangibles and restructuring charges.
Number of employees2018 2017
End of period Jun 30 Mar 31 Dec 31 Sep 30 Jun 30 Mar 31
South East Asia, Oceania and India 23,516 23,623 24,495 26,396 26,748 27,221
North East Asia 12,303 12,321 12,456 12,945 12,972 12,962
North America 9,510 9,798 10,009 10,665 11,073 11,253
Europe and Latin America 1) 45,743 47,528 49,231 50,832 53,173 54,194
Middle East and Africa 4,188 4,311 4,544 5,014 5,161 5,268
Total 95,260 97,581 100,735 105,852 109,127 110,8981) Of which in Sweden 13,431 13,763 13,864 14,195 14,483 14,712
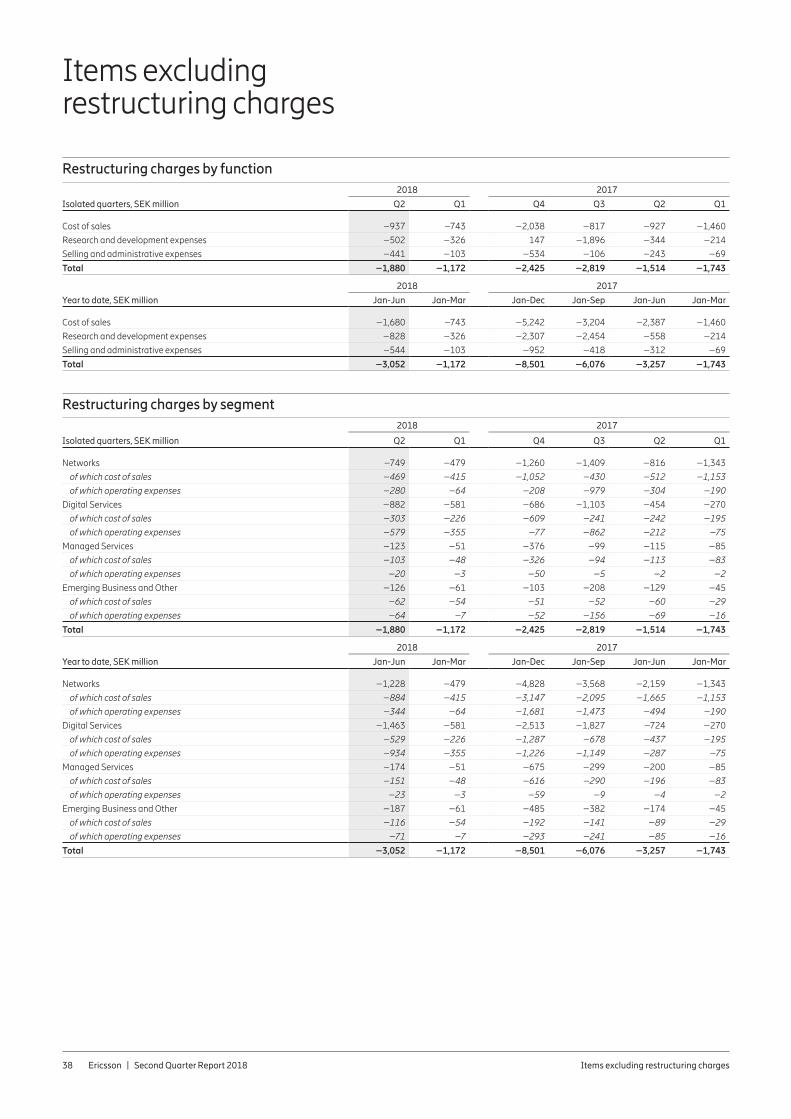
Ericsson | Second Quarter Report 2018 Items excluding restructuring charges38
Restructuring charges by function
Isolated quarters, SEK million
2018 2017
Q2 Q1 Q4 Q3 Q2 Q1
Cost of sales –937 –743 –2,038 –817 –927 –1,460
Research and development expenses –502 –326 147 –1,896 –344 –214
Selling and administrative expenses –441 –103 –534 –106 –243 –69
Total –1,880 –1,172 –2,425 –2,819 –1,514 –1,743
Year to date, SEK million
2018 2017
Jan-Jun Jan-Mar Jan-Dec Jan-Sep Jan-Jun Jan-Mar
Cost of sales –1,680 –743 –5,242 –3,204 –2,387 –1,460
Research and development expenses –828 –326 –2,307 –2,454 –558 –214
Selling and administrative expenses –544 –103 –952 –418 –312 –69
Total –3,052 –1,172 –8,501 –6,076 –3,257 –1,743
Restructuring charges by segment2018 2017
Isolated quarters, SEK million Q2 Q1 Q4 Q3 Q2 Q1
Networks –749 –479 –1,260 –1,409 –816 –1,343
of which cost of sales –469 –415 –1,052 –430 –512 –1,153
of which operating expenses –280 –64 –208 –979 –304 –190
Digital Services –882 –581 –686 –1,103 –454 –270
of which cost of sales –303 –226 –609 –241 –242 –195
of which operating expenses –579 –355 –77 –862 –212 –75
Managed Services –123 –51 –376 –99 –115 –85
of which cost of sales –103 –48 –326 –94 –113 –83
of which operating expenses –20 –3 –50 –5 –2 –2
Emerging Business and Other –126 –61 –103 –208 –129 –45
of which cost of sales –62 –54 –51 –52 –60 –29
of which operating expenses –64 –7 –52 –156 –69 –16
Total –1,880 –1,172 –2,425 –2,819 –1,514 –1,743
2018 2017
Year to date, SEK million Jan-Jun Jan-Mar Jan-Dec Jan-Sep Jan-Jun Jan-Mar
Networks –1,228 –479 –4,828 –3,568 –2,159 –1,343
of which cost of sales –884 –415 –3,147 –2,095 –1,665 –1,153
of which operating expenses –344 –64 –1,681 –1,473 –494 –190
Digital Services –1,463 –581 –2,513 –1,827 –724 –270
of which cost of sales –529 –226 –1,287 –678 –437 –195
of which operating expenses –934 –355 –1,226 –1,149 –287 –75
Managed Services –174 –51 –675 –299 –200 –85
of which cost of sales –151 –48 –616 –290 –196 –83
of which operating expenses –23 –3 –59 –9 –4 –2
Emerging Business and Other –187 –61 –485 –382 –174 –45
of which cost of sales –116 –54 –192 –141 –89 –29
of which operating expenses –71 –7 –293 –241 –85 –16
Total –3,052 –1,172 –8,501 –6,076 –3,257 –1,743
Items excluding restructuring charges
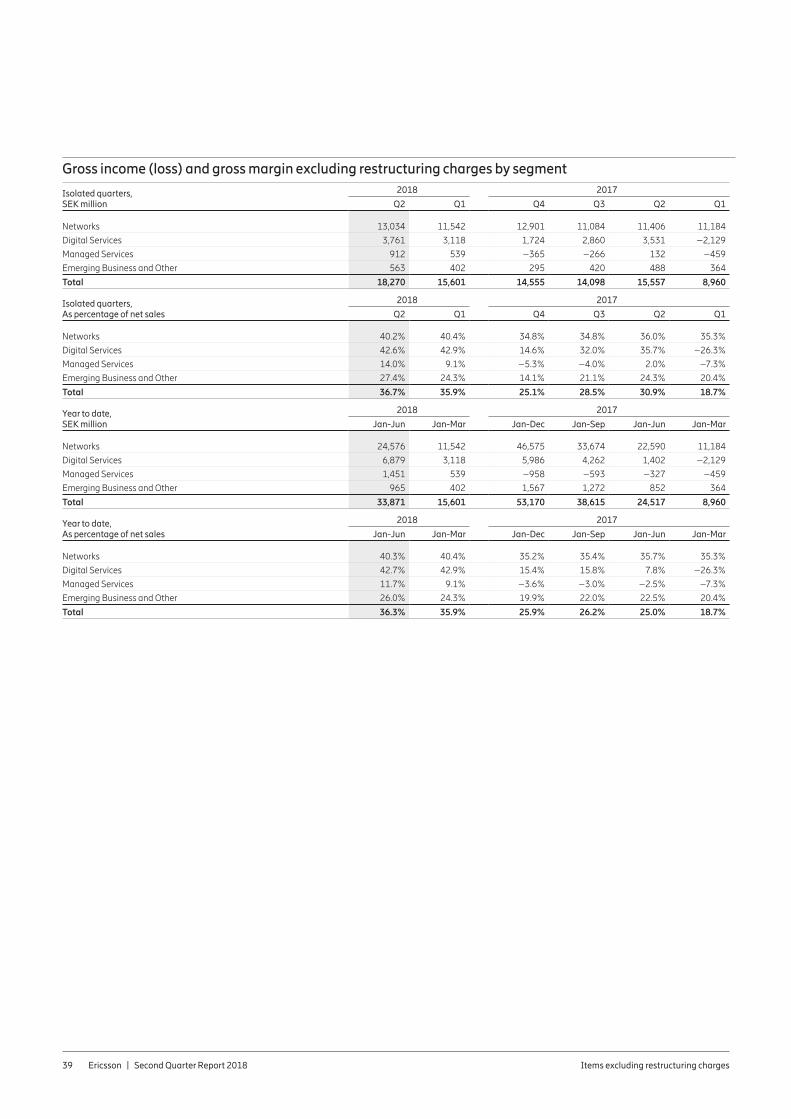
Ericsson | Second Quarter Report 2018 Items excluding restructuring charges39
Gross income (loss) and gross margin excluding restructuring charges by segment
Isolated quarters, SEK million
2018 2017
Q2 Q1 Q4 Q3 Q2 Q1
Networks 13,034 11,542 12,901 11,084 11,406 11,184
Digital Services 3,761 3,118 1,724 2,860 3,531 –2,129
Managed Services 912 539 –365 –266 132 –459
Emerging Business and Other 563 402 295 420 488 364
Total 18,270 15,601 14,555 14,098 15,557 8,960
Isolated quarters, As percentage of net sales
2018 2017
Q2 Q1 Q4 Q3 Q2 Q1
Networks 40.2% 40.4% 34.8% 34.8% 36.0% 35.3%
Digital Services 42.6% 42.9% 14.6% 32.0% 35.7% –26.3%
Managed Services 14.0% 9.1% –5.3% –4.0% 2.0% –7.3%
Emerging Business and Other 27.4% 24.3% 14.1% 21.1% 24.3% 20.4%
Total 36.7% 35.9% 25.1% 28.5% 30.9% 18.7%
Year to date, SEK million
2018 2017
Jan-Jun Jan-Mar Jan-Dec Jan-Sep Jan-Jun Jan-Mar
Networks 24,576 11,542 46,575 33,674 22,590 11,184
Digital Services 6,879 3,118 5,986 4,262 1,402 –2,129
Managed Services 1,451 539 –958 –593 –327 –459
Emerging Business and Other 965 402 1,567 1,272 852 364
Total 33,871 15,601 53,170 38,615 24,517 8,960
Year to date, As percentage of net sales
2018 2017
Jan-Jun Jan-Mar Jan-Dec Jan-Sep Jan-Jun Jan-Mar
Networks 40.3% 40.4% 35.2% 35.4% 35.7% 35.3%
Digital Services 42.7% 42.9% 15.4% 15.8% 7.8% –26.3%
Managed Services 11.7% 9.1% –3.6% –3.0% –2.5% –7.3%
Emerging Business and Other 26.0% 24.3% 19.9% 22.0% 22.5% 20.4%
Total 36.3% 35.9% 25.9% 26.2% 25.0% 18.7%
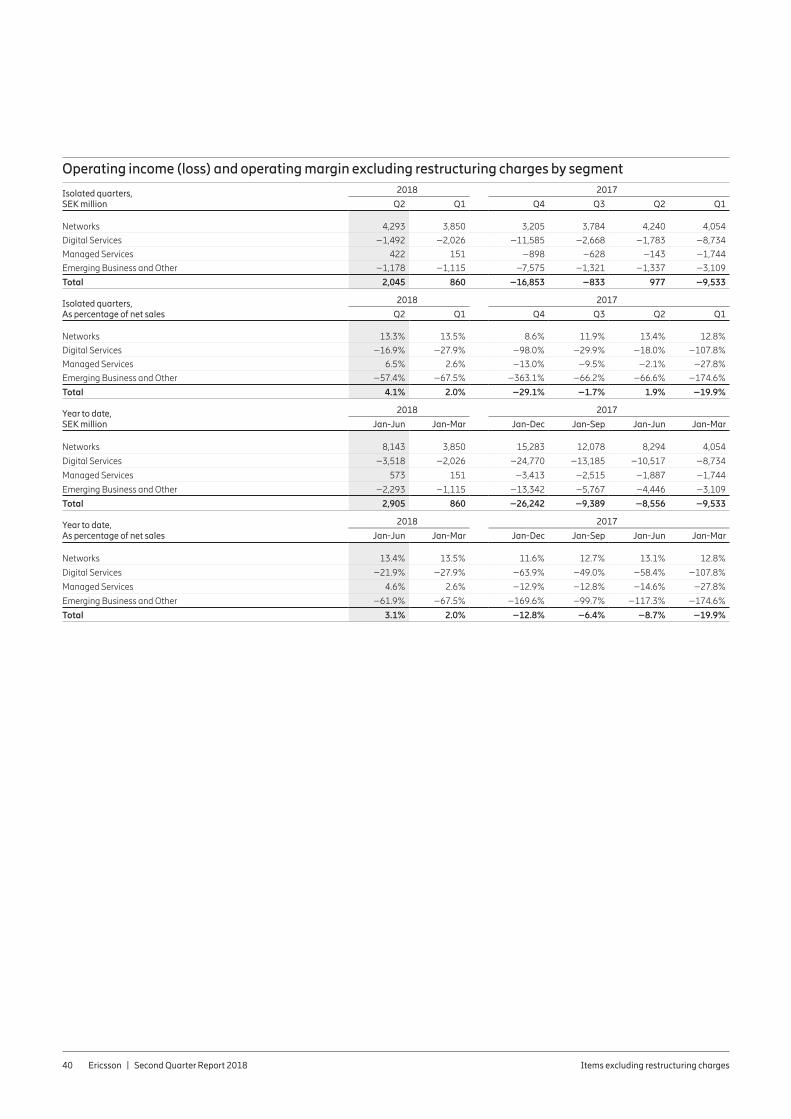
Ericsson | Second Quarter Report 2018 Items excluding restructuring charges40
Operating income (loss) and operating margin excluding restructuring charges by segment
Isolated quarters, SEK million
2018 2017
Q2 Q1 Q4 Q3 Q2 Q1
Networks 4,293 3,850 3,205 3,784 4,240 4,054
Digital Services –1,492 –2,026 –11,585 –2,668 –1,783 –8,734
Managed Services 422 151 –898 –628 –143 –1,744
Emerging Business and Other –1,178 –1,115 –7,575 –1,321 –1,337 –3,109
Total 2,045 860 –16,853 –833 977 –9,533
Isolated quarters, As percentage of net sales
2018 2017
Q2 Q1 Q4 Q3 Q2 Q1
Networks 13.3% 13.5% 8.6% 11.9% 13.4% 12.8%
Digital Services –16.9% –27.9% –98.0% –29.9% –18.0% –107.8%
Managed Services 6.5% 2.6% –13.0% –9.5% –2.1% –27.8%
Emerging Business and Other –57.4% –67.5% –363.1% –66.2% –66.6% –174.6%
Total 4.1% 2.0% –29.1% –1.7% 1.9% –19.9%
Year to date, SEK million
2018 2017
Jan-Jun Jan-Mar Jan-Dec Jan-Sep Jan-Jun Jan-Mar
Networks 8,143 3,850 15,283 12,078 8,294 4,054
Digital Services –3,518 –2,026 –24,770 –13,185 –10,517 –8,734
Managed Services 573 151 –3,413 –2,515 –1,887 –1,744
Emerging Business and Other –2,293 –1,115 –13,342 –5,767 –4,446 –3,109
Total 2,905 860 –26,242 –9,389 –8,556 –9,533
Year to date, As percentage of net sales
2018 2017
Jan-Jun Jan-Mar Jan-Dec Jan-Sep Jan-Jun Jan-Mar
Networks 13.4% 13.5% 11.6% 12.7% 13.1% 12.8%
Digital Services –21.9% –27.9% –63.9% –49.0% –58.4% –107.8%
Managed Services 4.6% 2.6% –12.9% –12.8% –14.6% –27.8%
Emerging Business and Other –61.9% –67.5% –169.6% –99.7% –117.3% –174.6%
Total 3.1% 2.0% –12.8% –6.4% –8.7% –19.9%
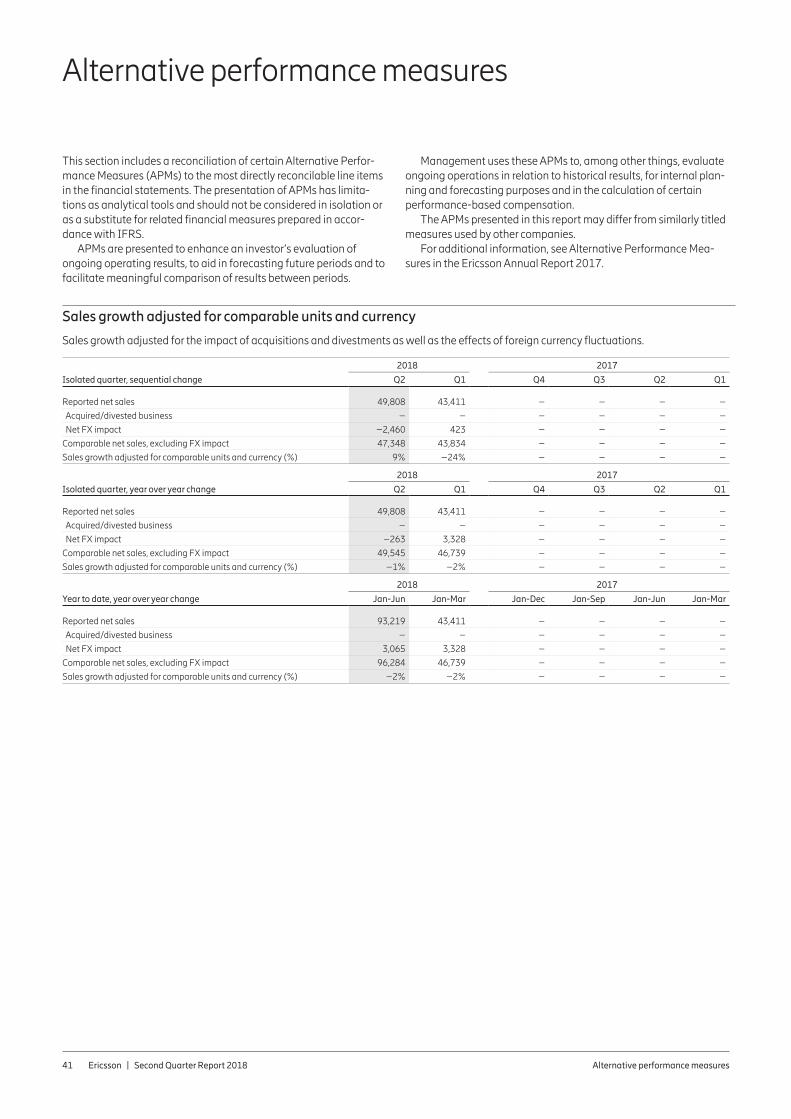
Ericsson | Second Quarter Report 2018 Alternative performance measures 41
This section includes a reconciliation of certain Alternative Perfor-mance Measures (APMs) to the most directly reconcilable line items in the financial statements. The presentation of APMs has limita-tions as analytical tools and should not be considered in isolation or as a substitute for related financial measures prepared in accor-dance with IFRS.
APMs are presented to enhance an investor’s evaluation of ongoing operating results, to aid in forecasting future periods and to facilitate meaningful comparison of results between periods.
Management uses these APMs to, among other things, evaluate ongoing operations in relation to historical results, for internal plan-ning and forecasting purposes and in the calculation of certain performance-based compensation.
The APMs presented in this report may differ from similarly titled measures used by other companies.
For additional information, see Alternative Performance Mea-sures in the Ericsson Annual Report 2017.
Sales growth adjusted for comparable units and currency
Sales growth adjusted for the impact of acquisitions and divestments as well as the effects of foreign currency fluctuations.
2018 2017
Isolated quarter, sequential change Q2 Q1 Q4 Q3 Q2 Q1
Reported net sales 49,808 43,411 – – – –
Acquired/divested business – – – – – –
Net FX impact –2,460 423 – – – –
Comparable net sales, excluding FX impact 47,348 43,834 – – – –
Sales growth adjusted for comparable units and currency (%) 9% –24% – – – –
2018 2017
Isolated quarter, year over year change Q2 Q1 Q4 Q3 Q2 Q1
Reported net sales 49,808 43,411 – – – –
Acquired/divested business – – – – – –
Net FX impact –263 3,328 – – – –
Comparable net sales, excluding FX impact 49,545 46,739 – – – –
Sales growth adjusted for comparable units and currency (%) –1% –2% – – – –
2018 2017
Year to date, year over year change Jan-Jun Jan-Mar Jan-Dec Jan-Sep Jan-Jun Jan-Mar
Reported net sales 93,219 43,411 – – – –
Acquired/divested business – – – – – –
Net FX impact 3,065 3,328 – – – –
Comparable net sales, excluding FX impact 96,284 46,739 – – – –
Sales growth adjusted for comparable units and currency (%) –2% –2% – – – –
Alternative performance measures
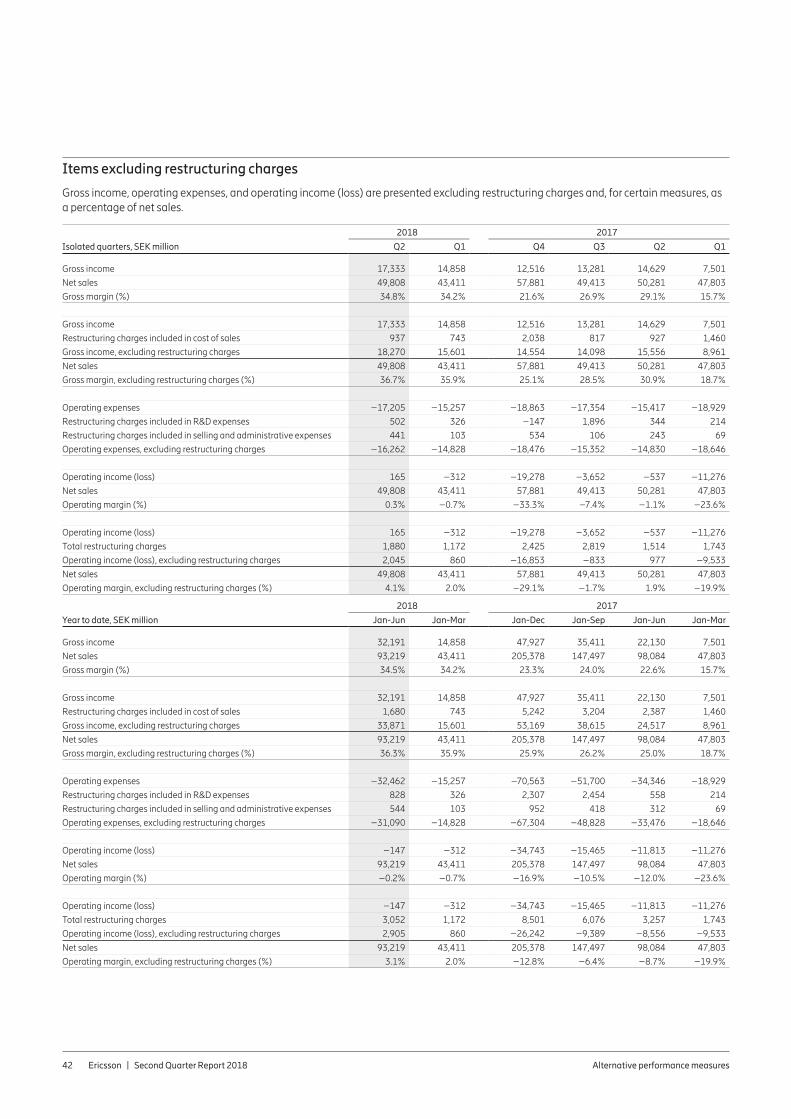
Ericsson | Second Quarter Report 2018 Alternative performance measures 42
Items excluding restructuring charges
Gross income, operating expenses, and operating income (loss) are presented excluding restructuring charges and, for certain measures, as a percentage of net sales.
2018 2017
Isolated quarters, SEK million Q2 Q1 Q4 Q3 Q2 Q1
Gross income 17,333 14,858 12,516 13,281 14,629 7,501
Net sales 49,808 43,411 57,881 49,413 50,281 47,803
Gross margin (%) 34.8% 34.2% 21.6% 26.9% 29.1% 15.7%
Gross income 17,333 14,858 12,516 13,281 14,629 7,501
Restructuring charges included in cost of sales 937 743 2,038 817 927 1,460
Gross income, excluding restructuring charges 18,270 15,601 14,554 14,098 15,556 8,961
Net sales 49,808 43,411 57,881 49,413 50,281 47,803
Gross margin, excluding restructuring charges (%) 36.7% 35.9% 25.1% 28.5% 30.9% 18.7%
Operating expenses –17,205 –15,257 –18,863 –17,354 –15,417 –18,929
Restructuring charges included in R&D expenses 502 326 –147 1,896 344 214
Restructuring charges included in selling and administrative expenses 441 103 534 106 243 69
Operating expenses, excluding restructuring charges –16,262 –14,828 –18,476 –15,352 –14,830 –18,646
Operating income (loss) 165 –312 –19,278 –3,652 –537 –11,276
Net sales 49,808 43,411 57,881 49,413 50,281 47,803
Operating margin (%) 0.3% –0.7% –33.3% –7.4% –1.1% –23.6%
Operating income (loss) 165 –312 –19,278 –3,652 –537 –11,276
Total restructuring charges 1,880 1,172 2,425 2,819 1,514 1,743
Operating income (loss), excluding restructuring charges 2,045 860 –16,853 –833 977 –9,533
Net sales 49,808 43,411 57,881 49,413 50,281 47,803
Operating margin, excluding restructuring charges (%) 4.1% 2.0% –29.1% –1.7% 1.9% –19.9%
2018 2017
Year to date, SEK million Jan-Jun Jan-Mar Jan-Dec Jan-Sep Jan-Jun Jan-Mar
Gross income 32,191 14,858 47,927 35,411 22,130 7,501
Net sales 93,219 43,411 205,378 147,497 98,084 47,803
Gross margin (%) 34.5% 34.2% 23.3% 24.0% 22.6% 15.7%
Gross income 32,191 14,858 47,927 35,411 22,130 7,501
Restructuring charges included in cost of sales 1,680 743 5,242 3,204 2,387 1,460
Gross income, excluding restructuring charges 33,871 15,601 53,169 38,615 24,517 8,961
Net sales 93,219 43,411 205,378 147,497 98,084 47,803
Gross margin, excluding restructuring charges (%) 36.3% 35.9% 25.9% 26.2% 25.0% 18.7%
Operating expenses –32,462 –15,257 –70,563 –51,700 –34,346 –18,929
Restructuring charges included in R&D expenses 828 326 2,307 2,454 558 214
Restructuring charges included in selling and administrative expenses 544 103 952 418 312 69
Operating expenses, excluding restructuring charges –31,090 –14,828 –67,304 –48,828 –33,476 –18,646
Operating income (loss) –147 –312 –34,743 –15,465 –11,813 –11,276
Net sales 93,219 43,411 205,378 147,497 98,084 47,803
Operating margin (%) –0.2% –0.7% –16.9% –10.5% –12.0% –23.6%
Operating income (loss) –147 –312 –34,743 –15,465 –11,813 –11,276
Total restructuring charges 3,052 1,172 8,501 6,076 3,257 1,743
Operating income (loss), excluding restructuring charges 2,905 860 –26,242 –9,389 –8,556 –9,533
Net sales 93,219 43,411 205,378 147,497 98,084 47,803
Operating margin, excluding restructuring charges (%) 3.1% 2.0% –12.8% –6.4% –8.7% –19.9%
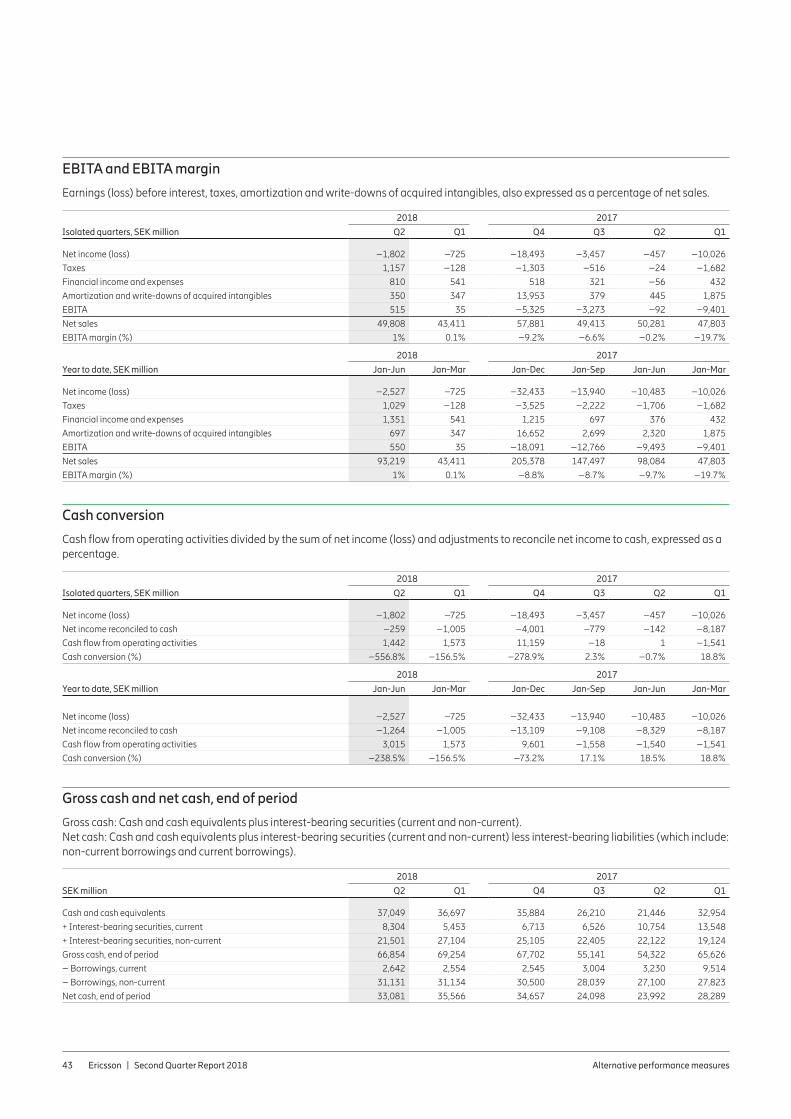
Ericsson | Second Quarter Report 2018 Alternative performance measures 43
EBITA and EBITA margin
Earnings (loss) before interest, taxes, amortization and write-downs of acquired intangibles, also expressed as a percentage of net sales.
2018 2017
Isolated quarters, SEK million Q2 Q1 Q4 Q3 Q2 Q1
Net income (loss) –1,802 –725 –18,493 –3,457 –457 –10,026
Taxes 1,157 –128 –1,303 –516 –24 –1,682
Financial income and expenses 810 541 518 321 –56 432
Amortization and write-downs of acquired intangibles 350 347 13,953 379 445 1,875
EBITA 515 35 –5,325 –3,273 –92 –9,401
Net sales 49,808 43,411 57,881 49,413 50,281 47,803
EBITA margin (%) 1% 0.1% –9.2% –6.6% –0.2% –19.7%
2018 2017
Year to date, SEK million Jan-Jun Jan-Mar Jan-Dec Jan-Sep Jan-Jun Jan-Mar
Net income (loss) –2,527 –725 –32,433 –13,940 –10,483 –10,026
Taxes 1,029 –128 –3,525 –2,222 –1,706 –1,682
Financial income and expenses 1,351 541 1,215 697 376 432
Amortization and write-downs of acquired intangibles 697 347 16,652 2,699 2,320 1,875
EBITA 550 35 –18,091 –12,766 –9,493 –9,401
Net sales 93,219 43,411 205,378 147,497 98,084 47,803
EBITA margin (%) 1% 0.1% –8.8% –8.7% –9.7% –19.7%
Cash conversion
Cash flow from operating activities divided by the sum of net income (loss) and adjustments to reconcile net income to cash, expressed as a percentage.
2018 2017
Isolated quarters, SEK million Q2 Q1 Q4 Q3 Q2 Q1
Net income (loss) –1,802 –725 –18,493 –3,457 –457 –10,026
Net income reconciled to cash –259 –1,005 –4,001 –779 –142 –8,187
Cash flow from operating activities 1,442 1,573 11,159 –18 1 –1,541
Cash conversion (%) –556.8% –156.5% –278.9% 2.3% –0.7% 18.8%
2018 2017
Year to date, SEK million Jan-Jun Jan-Mar Jan-Dec Jan-Sep Jan-Jun Jan-Mar
Net income (loss) –2,527 –725 –32,433 –13,940 –10,483 –10,026
Net income reconciled to cash –1,264 –1,005 –13,109 –9,108 –8,329 –8,187
Cash flow from operating activities 3,015 1,573 9,601 –1,558 –1,540 –1,541
Cash conversion (%) –238.5% –156.5% –73.2% 17.1% 18.5% 18.8%
Gross cash and net cash, end of period
Gross cash: Cash and cash equivalents plus interest-bearing securities (current and non-current).Net cash: Cash and cash equivalents plus interest-bearing securities (current and non-current) less interest-bearing liabilities (which include: non-current borrowings and current borrowings).
2018 2017
SEK million Q2 Q1 Q4 Q3 Q2 Q1
Cash and cash equivalents 37,049 36,697 35,884 26,210 21,446 32,954
+ Interest-bearing securities, current 8,304 5,453 6,713 6,526 10,754 13,548
+ Interest-bearing securities, non-current 21,501 27,104 25,105 22,405 22,122 19,124
Gross cash, end of period 66,854 69,254 67,702 55,141 54,322 65,626
– Borrowings, current 2,642 2,554 2,545 3,004 3,230 9,514
– Borrowings, non-current 31,131 31,134 30,500 28,039 27,100 27,823
Net cash, end of period 33,081 35,566 34,657 24,098 23,992 28,289
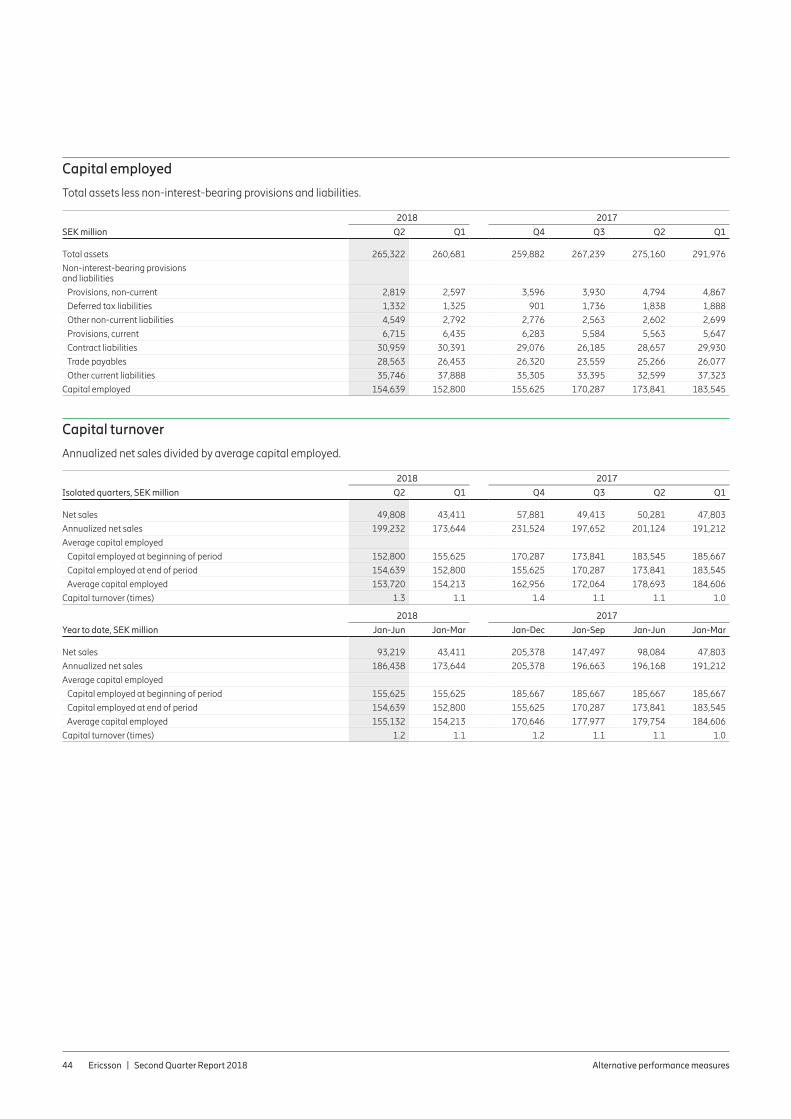
Ericsson | Second Quarter Report 2018 Alternative performance measures 44
Capital employed
Total assets less non-interest-bearing provisions and liabilities.
2018 2017
SEK million Q2 Q1 Q4 Q3 Q2 Q1
Total assets 265,322 260,681 259,882 267,239 275,160 291,976
Non-interest-bearing provisions and liabilities
Provisions, non-current 2,819 2,597 3,596 3,930 4,794 4,867
Deferred tax liabilities 1,332 1,325 901 1,736 1,838 1,888
Other non-current liabilities 4,549 2,792 2,776 2,563 2,602 2,699
Provisions, current 6,715 6,435 6,283 5,584 5,563 5,647
Contract liabilities 30,959 30,391 29,076 26,185 28,657 29,930
Trade payables 28,563 26,453 26,320 23,559 25,266 26,077
Other current liabilities 35,746 37,888 35,305 33,395 32,599 37,323
Capital employed 154,639 152,800 155,625 170,287 173,841 183,545
Capital turnover
Annualized net sales divided by average capital employed.
2018 2017
Isolated quarters, SEK million Q2 Q1 Q4 Q3 Q2 Q1
Net sales 49,808 43,411 57,881 49,413 50,281 47,803
Annualized net sales 199,232 173,644 231,524 197,652 201,124 191,212
Average capital employed
Capital employed at beginning of period 152,800 155,625 170,287 173,841 183,545 185,667
Capital employed at end of period 154,639 152,800 155,625 170,287 173,841 183,545
Average capital employed 153,720 154,213 162,956 172,064 178,693 184,606
Capital turnover (times) 1.3 1.1 1.4 1.1 1.1 1.0
2018 2017
Year to date, SEK million Jan-Jun Jan-Mar Jan-Dec Jan-Sep Jan-Jun Jan-Mar
Net sales 93,219 43,411 205,378 147,497 98,084 47,803
Annualized net sales 186,438 173,644 205,378 196,663 196,168 191,212
Average capital employed
Capital employed at beginning of period 155,625 155,625 185,667 185,667 185,667 185,667
Capital employed at end of period 154,639 152,800 155,625 170,287 173,841 183,545
Average capital employed 155,132 154,213 170,646 177,977 179,754 184,606
Capital turnover (times) 1.2 1.1 1.2 1.1 1.1 1.0
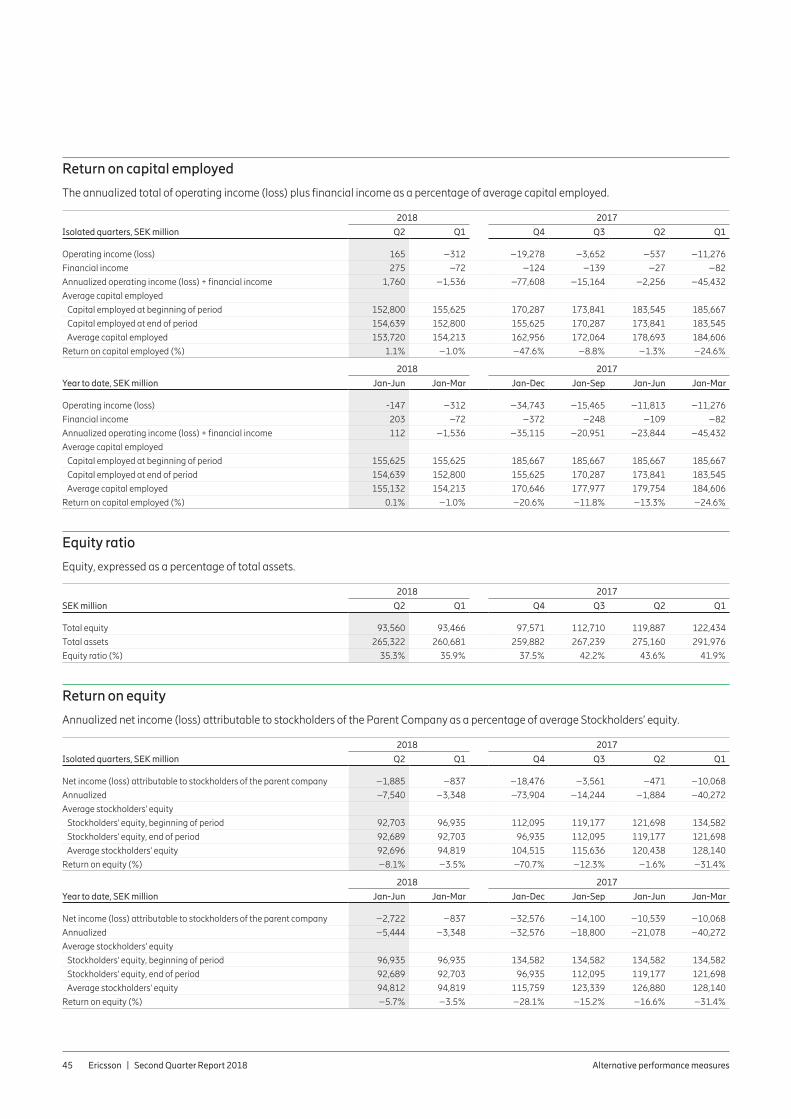
Ericsson | Second Quarter Report 2018 Alternative performance measures 45
Return on capital employed
The annualized total of operating income (loss) plus financial income as a percentage of average capital employed.
2018 2017
Isolated quarters, SEK million Q2 Q1 Q4 Q3 Q2 Q1
Operating income (loss) 165 –312 –19,278 –3,652 –537 –11,276
Financial income 275 –72 –124 –139 –27 –82
Annualized operating income (loss) + financial income 1,760 –1,536 –77,608 –15,164 –2,256 –45,432
Average capital employed
Capital employed at beginning of period 152,800 155,625 170,287 173,841 183,545 185,667
Capital employed at end of period 154,639 152,800 155,625 170,287 173,841 183,545
Average capital employed 153,720 154,213 162,956 172,064 178,693 184,606
Return on capital employed (%) 1.1% –1.0% –47.6% –8.8% –1.3% –24.6%
2018 2017
Year to date, SEK million Jan-Jun Jan-Mar Jan-Dec Jan-Sep Jan-Jun Jan-Mar
Operating income (loss) -147 –312 –34,743 –15,465 –11,813 –11,276
Financial income 203 –72 –372 –248 –109 –82
Annualized operating income (loss) + financial income 112 –1,536 –35,115 –20,951 –23,844 –45,432
Average capital employed
Capital employed at beginning of period 155,625 155,625 185,667 185,667 185,667 185,667
Capital employed at end of period 154,639 152,800 155,625 170,287 173,841 183,545
Average capital employed 155,132 154,213 170,646 177,977 179,754 184,606
Return on capital employed (%) 0.1% –1.0% –20.6% –11.8% –13.3% –24.6%
Equity ratio
Equity, expressed as a percentage of total assets.
2018 2017
SEK million Q2 Q1 Q4 Q3 Q2 Q1
Total equity 93,560 93,466 97,571 112,710 119,887 122,434
Total assets 265,322 260,681 259,882 267,239 275,160 291,976
Equity ratio (%) 35.3% 35.9% 37.5% 42.2% 43.6% 41.9%
Return on equity
Annualized net income (loss) attributable to stockholders of the Parent Company as a percentage of average Stockholders’ equity.
2018 2017
Isolated quarters, SEK million Q2 Q1 Q4 Q3 Q2 Q1
Net income (loss) attributable to stockholders of the parent company –1,885 –837 –18,476 –3,561 –471 –10,068
Annualized –7,540 –3,348 –73,904 –14,244 –1,884 –40,272
Average stockholders' equity
Stockholders' equity, beginning of period 92,703 96,935 112,095 119,177 121,698 134,582
Stockholders' equity, end of period 92,689 92,703 96,935 112,095 119,177 121,698
Average stockholders' equity 92,696 94,819 104,515 115,636 120,438 128,140
Return on equity (%) –8.1% –3.5% –70.7% –12.3% –1.6% –31.4%
2018 2017
Year to date, SEK million Jan-Jun Jan-Mar Jan-Dec Jan-Sep Jan-Jun Jan-Mar
Net income (loss) attributable to stockholders of the parent company –2,722 –837 –32,576 –14,100 –10,539 –10,068
Annualized –5,444 –3,348 –32,576 –18,800 –21,078 –40,272
Average stockholders' equity
Stockholders' equity, beginning of period 96,935 96,935 134,582 134,582 134,582 134,582
Stockholders' equity, end of period 92,689 92,703 96,935 112,095 119,177 121,698
Average stockholders' equity 94,812 94,819 115,759 123,339 126,880 128,140
Return on equity (%) –5.7% –3.5% –28.1% –15.2% –16.6% –31.4%
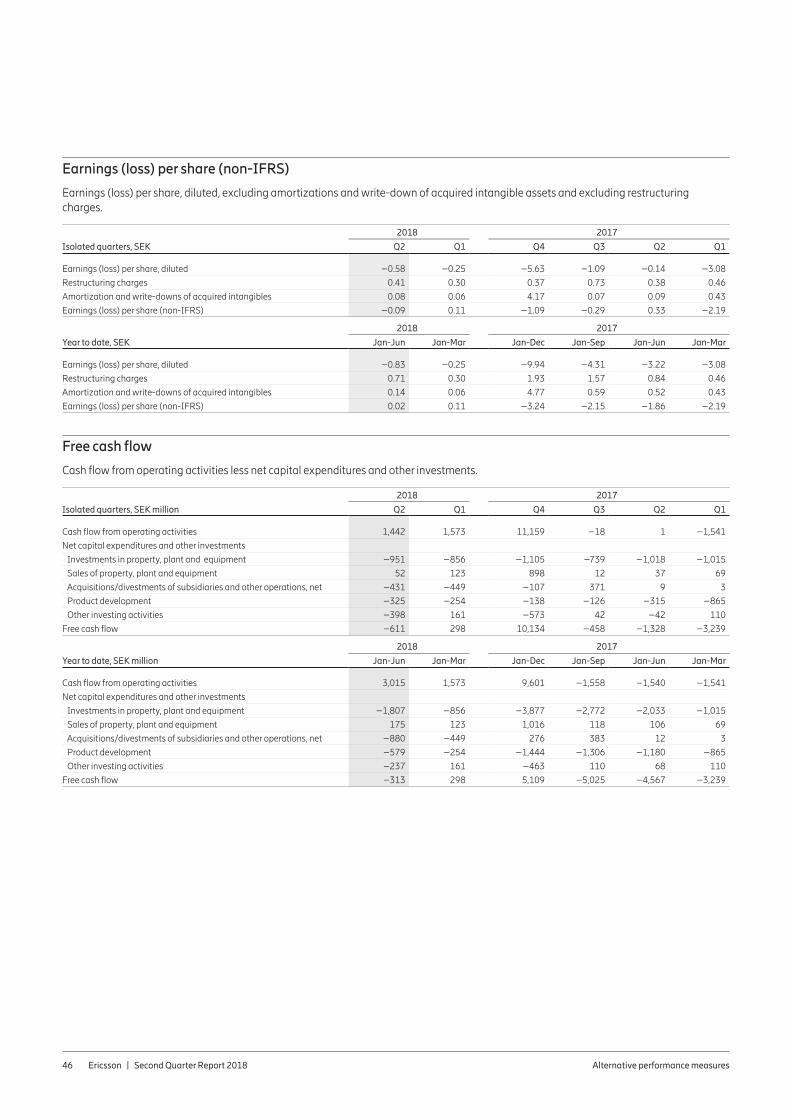
Ericsson | Second Quarter Report 2018 Alternative performance measures 46
Earnings (loss) per share (non-IFRS)
Earnings (loss) per share, diluted, excluding amortizations and write-down of acquired intangible assets and excluding restructuring charges.
2018 2017
Isolated quarters, SEK Q2 Q1 Q4 Q3 Q2 Q1
Earnings (loss) per share, diluted –0.58 –0.25 –5.63 –1.09 –0.14 –3.08
Restructuring charges 0.41 0.30 0.37 0.73 0.38 0.46
Amortization and write-downs of acquired intangibles 0.08 0.06 4.17 0.07 0.09 0.43
Earnings (loss) per share (non-IFRS) –0.09 0.11 –1.09 –0.29 0.33 –2.19
2018 2017
Year to date, SEK Jan-Jun Jan-Mar Jan-Dec Jan-Sep Jan-Jun Jan-Mar
Earnings (loss) per share, diluted –0.83 –0.25 –9.94 –4.31 –3.22 –3.08
Restructuring charges 0.71 0.30 1.93 1.57 0.84 0.46
Amortization and write-downs of acquired intangibles 0.14 0.06 4.77 0.59 0.52 0.43
Earnings (loss) per share (non-IFRS) 0.02 0.11 –3.24 –2.15 –1.86 –2.19
Free cash flow
Cash flow from operating activities less net capital expenditures and other investments.
2018 2017
Isolated quarters, SEK million Q2 Q1 Q4 Q3 Q2 Q1
Cash flow from operating activities 1,442 1,573 11,159 –18 1 –1,541
Net capital expenditures and other investments
Investments in property, plant and equipment –951 –856 –1,105 –739 –1,018 –1,015
Sales of property, plant and equipment 52 123 898 12 37 69
Acquisitions/divestments of subsidiaries and other operations, net –431 –449 –107 371 9 3
Product development –325 –254 –138 –126 –315 –865
Other investing activities –398 161 –573 42 –42 110
Free cash flow –611 298 10,134 –458 –1,328 –3,239
2018 2017
Year to date, SEK million Jan-Jun Jan-Mar Jan-Dec Jan-Sep Jan-Jun Jan-Mar
Cash flow from operating activities 3,015 1,573 9,601 –1,558 –1,540 –1,541
Net capital expenditures and other investments
Investments in property, plant and equipment –1,807 –856 –3,877 –2,772 –2,033 –1,015
Sales of property, plant and equipment 175 123 1,016 118 106 69
Acquisitions/divestments of subsidiaries and other operations, net –880 –449 276 383 12 3
Product development –579 –254 –1,444 –1,306 –1,180 –865
Other investing activities –237 161 –463 110 68 110
Free cash flow –313 298 5,109 –5,025 –4,567 –3,239