seasonal variation and hydro-chemical characterization of ... kwarteng, et al.pdf · seasonal...
TRANSCRIPT

Int.J.Curr.Microbiol.App.Sci (2017) 6(11): 990-1007
990
Original Research Article https://doi.org/10.20546/ijcmas.2017.611.116
Seasonal Variation and Hydro-chemical Characterization of Manchalapur
Lake Quality for Drinking and Agricultural Purposes
Francis Kwarteng1*
, Umapathy Satishkumar1, Moddi Nemichandrappa
1,
Banda Maheshwara Babu1 and Veeresh Hogarnal
2
1Department of Soil and Water Engineering,
2Department of Soil Science and Agricultural
Chemistry, College of Agriculture, University of Agricultural Sciences, Raichur,
P. B. No. 329, Raichur 584102, Karnataka, India *Corresponding author
A B S T R A C T
Introduction
Among the various environmental challenges
that India faces this century, better
management of water quality is of high
priority as there is increased stress on surface
water sources due to population pressure. The
major threat to the sustainability of surface
water systems is pollution. Pollution affects
the quality of water and limits its multiple
uses. Besides, the rate of water system
pollution increases as population increases
International Journal of Current Microbiology and Applied Sciences ISSN: 2319-7706 Volume 6 Number 11 (2017) pp. 990-1007 Journal homepage: http://www.ijcmas.com
In this study the hydrochemical characteristics of the Manchalapur tank water or lake was
analysed for its suitability for domestic, fish rearing and irrigation purposes. A total of 10
water samples each were drawn from the inlet, outlet and two other locations in the water
spread area of the tank and analysed for TDS, pH, EC, BOD5, COD, major ions, detergent
and pathogen contamination in three distinct seasons, viz. pre-monsoon, monsoon and
post-monsoon, based on standard methods. The concentration of pollutants had varied
within these seasons with TDS, pH, EC, COD, and the major ions measuring the highest in
the pre-monsoon season when tank had received undiluted sewage from the Raichur city.
The order of dominance of ions in water samples of this study area is Na+> Ca
2+> Mg
2+>
K+ and Cl
-> SO4
2-> Nitrate > PO4
3->HCO3
->CO3
2- as estimated in the pre-monsoon season,
and Na+> Ca
2+> K
+>Mg
2+ and Cl
-> SO4
2-> Nitrate > PO4
3->HCO3
->CO3
2- in both the
monsoon and post-monsoon seasons. According to pH values, tank water is alkaline during
all three sampling seasons. The weighted water quality index was used to assess the
suitability of tank water for domestic purposes. The ∑WQI was estimated as 24, 30 and 26
in the pre-monsoon, monsoon and post-monsoon seasons respectively, indicating a critical
water quality condition and thus raising high objection against the use of the tank water for
drinking purpose. However, the tank water was found most suitable for irrigation in the
monsoon season as compared to other seasons since it poses no or limited salinity and
sodium hazards. This is corroborated by TDS, EC, major ions, SAR and Na% values
measured in the monsoon season which are all within permissible limits. On the other
hand, high BOD5, COD, excess in NPK present in water system, surfactants and pathogen
contamination rendered tank water unsupportive for fish and thus may impair aquatic life.
Hence, other than irrigation (even that only in the monsoon season), the Manchalapur tank
water is unsuitable for drinking and fish propagation.
K e y w o r d s Manchalapur Lake,
Water quality,
Salinity, Domestic use, Irrigation, Fish
propagation, Raichur
city.
Accepted:
10 September 2017
Available Online:
10 November 2017
Article Info
Int.J.Curr.Microbiol.App.Sci (2017) 6(11): 990-1007
991
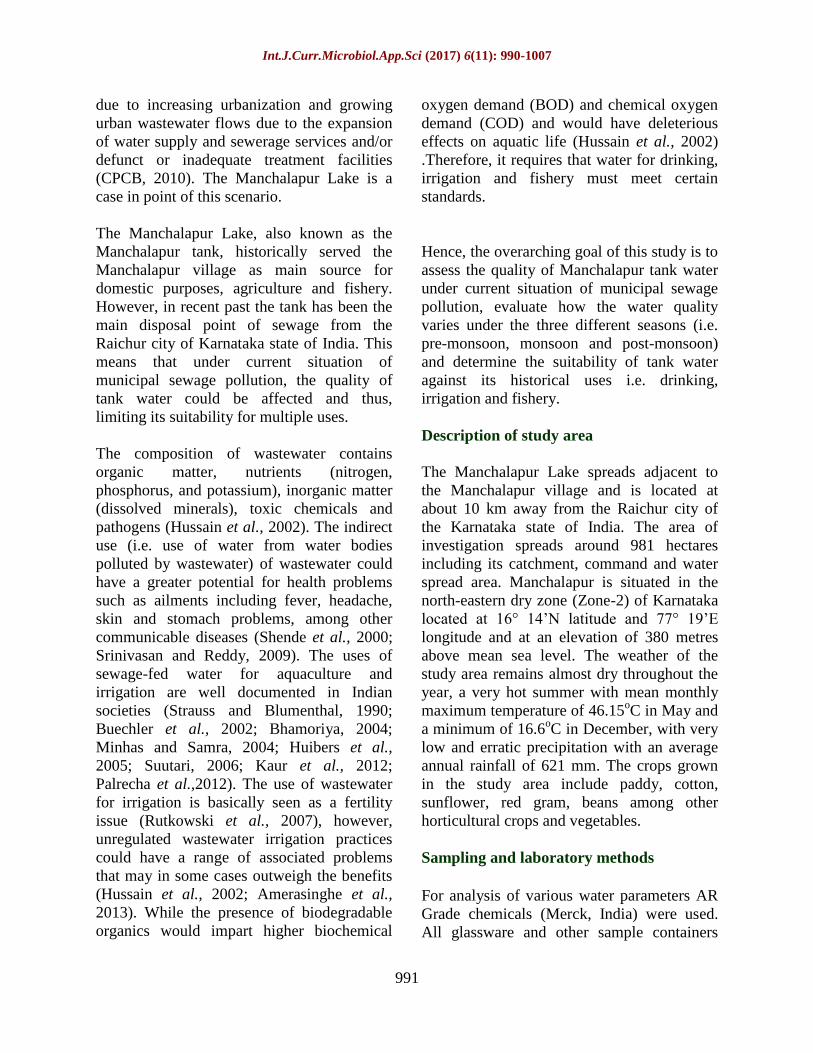
due to increasing urbanization and growing
urban wastewater flows due to the expansion
of water supply and sewerage services and/or
defunct or inadequate treatment facilities
(CPCB, 2010). The Manchalapur Lake is a
case in point of this scenario.
The Manchalapur Lake, also known as the
Manchalapur tank, historically served the
Manchalapur village as main source for
domestic purposes, agriculture and fishery.
However, in recent past the tank has been the
main disposal point of sewage from the
Raichur city of Karnataka state of India. This
means that under current situation of
municipal sewage pollution, the quality of
tank water could be affected and thus,
limiting its suitability for multiple uses.
The composition of wastewater contains
organic matter, nutrients (nitrogen,
phosphorus, and potassium), inorganic matter
(dissolved minerals), toxic chemicals and
pathogens (Hussain et al., 2002). The indirect
use (i.e. use of water from water bodies
polluted by wastewater) of wastewater could
have a greater potential for health problems
such as ailments including fever, headache,
skin and stomach problems, among other
communicable diseases (Shende et al., 2000;
Srinivasan and Reddy, 2009). The uses of
sewage-fed water for aquaculture and
irrigation are well documented in Indian
societies (Strauss and Blumenthal, 1990;
Buechler et al., 2002; Bhamoriya, 2004;
Minhas and Samra, 2004; Huibers et al.,
2005; Suutari, 2006; Kaur et al., 2012;
Palrecha et al.,2012). The use of wastewater
for irrigation is basically seen as a fertility
issue (Rutkowski et al., 2007), however,
unregulated wastewater irrigation practices
could have a range of associated problems
that may in some cases outweigh the benefits
(Hussain et al., 2002; Amerasinghe et al.,
2013). While the presence of biodegradable
organics would impart higher biochemical
oxygen demand (BOD) and chemical oxygen
demand (COD) and would have deleterious
effects on aquatic life (Hussain et al., 2002)
.Therefore, it requires that water for drinking,
irrigation and fishery must meet certain
standards.
Hence, the overarching goal of this study is to
assess the quality of Manchalapur tank water
under current situation of municipal sewage
pollution, evaluate how the water quality
varies under the three different seasons (i.e.
pre-monsoon, monsoon and post-monsoon)
and determine the suitability of tank water
against its historical uses i.e. drinking,
irrigation and fishery.
Description of study area
The Manchalapur Lake spreads adjacent to
the Manchalapur village and is located at
about 10 km away from the Raichur city of
the Karnataka state of India. The area of
investigation spreads around 981 hectares
including its catchment, command and water
spread area. Manchalapur is situated in the
north-eastern dry zone (Zone-2) of Karnataka
located at 16° 14’N latitude and 77° 19’E
longitude and at an elevation of 380 metres
above mean sea level. The weather of the
study area remains almost dry throughout the
year, a very hot summer with mean monthly
maximum temperature of 46.15oC in May and
a minimum of 16.6oC in December, with very
low and erratic precipitation with an average
annual rainfall of 621 mm. The crops grown
in the study area include paddy, cotton,
sunflower, red gram, beans among other
horticultural crops and vegetables.
Sampling and laboratory methods
For analysis of various water parameters AR
Grade chemicals (Merck, India) were used.
All glassware and other sample containers

Int.J.Curr.Microbiol.App.Sci (2017) 6(11): 990-1007
992
were rinsed with double-distilled water and
sterilized prior to use. The seasons chosen for
sampling were pre-monsoon, monsoon and
post monsoon for the 2014/2015 period. 10
water samples were taken each from the inlet,
outlet and two different locations in the water
spread area of the tank (represented as WS-I
for first location in water spread area and WS-
II for second location in water spread area).
Using standard methods for the examination
of water and wastewater as per APHA, 1998,
the water samples were analysed for most
water quality influencing physicochemical
parameters, which included pH, EC, TDS,
nitrogen, phosphorus, potassium,
bicarbonates, chloride, sulphate, sodium,
calcium, magnesium, COD, BOD, coliform
and surfactants. Pearson’s correlation
coefficient (r) was also worked out to judge
the strength and direction of relation between
various parameters and reported at 0.01 and
0.05 levels of significance using Sigmastat
3.5.
Results and Discussion
Seasonal variation in Manchalapur tank
water quality
Tank water quality in the pre monsoon
season
The pH values measured in the pre-monsoon
season ranged between 7.2 and 8.84 with an
average approximately 8.4 which indicates
that the tank water is alkaline in the pre-
monsoon season. EC of tank water ranges
from 1.45 to 1.72 dS/m with an average of
1.525 dS/m. TDS measured averagely 992
mg/l with the highest recorded at the outlet.
This indicates that the amount of soluble
inorganic substances tend to be higher at the
outlet than any other location during this
season. The values of parameters measured at
the inlet, two separate locations at the water
spread area and outlet of the tank is given in
the Table 1. The dominant ions in the tank
water is in the order of Na+> Ca
2+> Mg
2+>K
+
for cations and Cl-> SO4
2-> Nitrate > PO4
3-
>HCO3->CO3
2- for anions. All the cations
measured the highest at the inlet of the tank as
well as available plants nutrients (NPK) and
HCO3-. During the pre-monsoon season, the
tank received undiluted sewage flow from the
Raichur city. Thus, it can be concluded that
the inflow received contributed to the
inorganic contaminants of tank water but was
also rich in beneficial plant nutrients. Unlike
the rest of the ions, chloride and sulphate
contamination was bulged at the water spread
areas and the outlet. Anthropological
activities like fertiliser and pesticide
applications in fields close to these areas
would have also contributed to the significant
increment. This would have also resulted in
higher chemical and biochemical oxygen
demands recorded at the water spread areas
and the outlet of the tank.
Surfactants are widely used in household
products. After use, surfactants as well as
their products are mainly found in the
Manchalapur tank water through discharge of
sewage from the Raichur city. Surfactants
measured in receiving flow recorded the
highest, 5.5 ppm LAS, and is measured as
twice or more as compared to other locations
of the tank. Even though the proximity of the
villagers’ laundry to the tank, which is about
50 metres away downstream, may contribute
to surfactant contamination by runoff, the
major source is the receiving flow from the
Raichur city.
Tank water quality in the monsoon season
The onset of monsoon is mostly from July to
October and characterised by heavy
downpour. The authors in a companion study,
Kwarteng et al., (2016), analysed the probable
quantity of sewage inflow from Raichur city
and estimated rainfall-runoff from the

Int.J.Curr.Microbiol.App.Sci (2017) 6(11): 990-1007
993
catchment. They estimated the dilution ratio
(as runoff as a fraction of sewage in
percentage) as approximately 18.8 % and
concluded that this would likely have
significant effect on tank water quality due to
this dilution of sewage by rainfall-runoff. The
results of parameters measured in the
monsoon season with their mean values are
given in Table 2.
The pH values measured ranged from 7.23 at
the inlet to 8.21 with an average of
approximately 7.68. EC was also measured
the highest at the inlet of tank as 1.66 dS/m
and lowest at the outlet which measured 1.36
dS/m. TDS, however, ranged from 360 mg/l
at the inlet to 560 mg/l at the water spread
area II. The dominant ions measured in the
monsoon season in the tank water samples is
in the increasing order Na+
> Ca2+
> K+ >
Mg2+
for cations and Cl- > SO4
2- > Nitrate >
PO43-
> HCO3- > CO3
2- for anions. Average
value of sodium, calcium, magnesium had
decreased in concentration from that
measured in pre-monsoon by 76.84 %, 10.06
% and 6.85 % respectively. Anion
concentrations such as chloride, sulphate and
HCO3-+CO3
2- on the other hand had also
decreased by 31%, 20.73% and 12.94%
respectively. Mean concentrations of TKN,
phosphate and potassium had also increased
by 85.36%, 21.14% and 102.99%
respectively; the highest being percentage
increase in potassium. Surfactant
contamination was also on the increase
ranging from 2.9 to 7.2 ppm LAS.
Tank Water Quality in the post-monsoon
season
The chemical parameters measured in the
post-monsoon season are given in Table 3.
The dominant ions as measured in the post-
monsoon season are Ca2+
> Na+> K
+> Mg
2+
for cations and Cl-> SO4
2-> Nitrate > PO4
3-
>HCO3->CO3
2- for anions in that order. The
average concentrations of dissolved solids and
ions measured in the post-monsoon season
had all experienced a significant increment in
concentration from those measured in the
monsoon season with the exception of
magnesium which rather decreased by about
32.9%.
The percentage increase in sodium recorded
the highest as 105.3% and a marginal
increment in calcium by 0.746%. Percentage
increment in concentrations of potassium,
chloride, sulphates, TKN, phosphates and
bicarbonate are as follows: 9.98%, 28% and
23.38%, 3.27%, 77.79% and 2.02%
respectively. Surfactant contamination,
however, recorded a decrease by 25.98%
from the previous season.
The tank water is alkaline in all the three
sampling seasons. The average pH was
measured highest in the pre-monsoon season
and it could be as a result of higher dissolved
salts and low water volume. This also
accounted for higher pH measured in post-
monsoon season as compared to in monsoon
season where pH actually recorded the least.
Total Dissolved Solids in tank water
originates from natural sources, sewage and
runoff from catchment. The values are
generally higher in the pre-monsoon season
and this could be due to stagnation of tank
water and higher dissolved salts. According to
Table 4, there are statistically significant (α =
0.05) positive correlations between TDS and
pH (r = 0.608). There also exist a positive
correlation between pH and Cl (r = 0.802) and
pH and SO42-
(r = 0.721) at the 0.01 level.
TDS on the other hand also correlated
significantly with Cl- (r = 0.713) and Na
+ (r =
0.823) at 0.01 los. The highest value of EC is
also measured highest in the pre-monsoon
season, followed by monsoon season and post
monsoon season. This variation may be due to
high evaporation of tank water during the
summer season and dilution of salinity during

Int.J.Curr.Microbiol.App.Sci (2017) 6(11): 990-1007
994
rainy season (Al-Khashman et al., 2013). EC
in tank water correlates positively with Ca2+
(r
= 0.629) at the 0.05 level and with Mg2+
(r =
0.935) at the 0.01 level.
Higher dissolved ions during the pre-monsoon
season, followed by post monsoon season and
monsoon season which is corroborated by EC
and TDS accounts for why Cl-, SO4
2-, HCO3
-,
water soluble Ca2+
and Mg2+
and Na+
recorded the highest in pre-monsoon season.
Lower water volume and higher dissolution of
salts from bed rocks may also be attributed to
why these anions and cations recorded the
highest in the pre-monsoon season. Aside the
sewage inflow, sulphate concentration present
in the water samples could also be due to
atmospheric deposition from acid rain, human
and animal waste, and farming activities
(Souligny et al., 2001).
The chloride concentration was measured the
highest in the pre-monsoon season (360 – 592
mg/l), followed by post monsoon season (398
– 489 mg/l) and least in monsoon season (302
– 411 mg/l). The higher concentration of
chloride in the pre-monsoon season is perhaps
as a result of human excrement, chlorides
consumed (commonly NaCl) which is a
constituent of domestic sewage inflow and the
evaporation of water in the tank and may not
necessarily be the chlorination of the
municipal water supply (Al-Khashman et al.,
2013). Sodium for instance was very high
during the pre-monsoon season and is because
sewage contains organic contents, faeces (as
evidenced by exceeding limits of faecal
coliform), bio-degradable and non-
biodegradable chemicals from various
domestic activities. On the other hand, the
decrease in ion concentrations from pre-
monsoon to monsoon season could be as a
result of dilution of tank water by rainfall-
runoff. Carbonate concentration in all areas in
all three sampling seasons was very low. The
ion concentrations measured correlates
positively with each other at the two different
levels as given in Table 4.
The significant positive and negative
correlation among some of the hydrochemical
parameters as presented in Table 4 is
indications of the possibility of pollutant load
from a common source or a source causing
pollution having similar effects on parameters
that are correlated. Thus, a particulate
increasing an ion concentration for example
would also result in an increment in the other
parameter where there exists a significant
positive correlation and likewise in case of a
decrement. Positive correlations between two
parameters indicate that they tended to
increase or decrease together whereas
negative correlation indicating that one
parameter increased as the other decreased.
BOD5 was highest during monsoon due to
higher inflow, and high decomposition of
organic matter as a result of higher oxygen
concentration because of low temperature,
followed by pre-monsoon and least in post-
monsoon season. COD on the other hand was
high during summer due to lower water
volume and dissolved ions. There exist a
positive correlation between COD and Cl (r =
0.588) at 0.05 los. The inflow of domestic
wastewater, agricultural runoff (due to
fertiliser use), animal waste and detergent-
filled sewage is the probable source for NPK
concentration. TKN, phosphates and
potassium all showed a similar trend as they
were recorded highest in the post-monsoon
season, followed by monsoon and pre-
monsoon seasons. Comparatively higher
inflow of both sewage and runoff from
agricultural land during the monsoon and post
monsoon seasons (highest here due to
relatively higher decomposition of organic
matter) accounted for higher NPK unlike
during the pre-monsoon season when only
sewage inflow and less or no application of
fertiliser are expected.

Int.J.Curr.Microbiol.App.Sci (2017) 6(11): 990-1007
995
Drinking water quality
The water quality index is regarded an
important tool in assessing the overall status
of water quality in a very simple manner and
for easy interpretation (Mahuya et al., 2001;
Gupta et al., 2003). Nine important water
quality indicators were selected which are
widely used in drinking water analyses. The
derivation of this cumulated WQI involves
assigning of unit index to each parameter
(Wi); rating of each parameter (Vr); product of
assigned unit index and rating (Wi Vr); and
then ranking of water quality based on the
index table.
In assigning index to each parameter, the
following equation was used:
ii
i
V
k
VW
1
Where k is constant of proportionality and
estimated as:
ni i
Vk
0/1
1
As most studies have revealed, the weights of
the assessment indicators were assigned based
on their relative importance to overall water
quality (Tyagi et al., 2013), and the weighting
method is as follows:
Li
q
q
L
i
i
i
i ,.....,2,1
1
Where ωi and qi are the weight and the
importance parameter of the ith
indicator,
respectively. L is the amount of indicators. qi
is a dimensionless number with a domain,
where 1, 2, 3, 4, and 5 denote very little, little,
average, great, and greatest importance,
respectively (Semiromi et al., 2011). And
finally the WQI was generated as an
aggregation of the sub-indices following a
weighted aggregation method using the
weighted sum model as per (Semiromi et al.,
2011; Srebotnjak et al., 2012).
L
i
i QiWQI
1
Where Qiis sub-index for ith water quality
parameter. The final step involves ranking of
water quality based on the index table (Table
5).
The results of estimated WQI for the three
sampling seasons are given in Table 6.
The estimated Qi for all the parameters
(except for pH which is within permissible
limit) in determining the water quality for
domestic purposes were high beyond
desirable limits culminating in rendering the
tank water unsuitable for drinking. The
concentrations of phosphate and BOD are
critical which measured Qi= 2.0 and Qi= 5
respectively throughout the sampling seasons.
Temperature change and excess in nitrates are
among parameters with very low Qi. The
estimated ∑WQI for the pre-monsoon and
post-monsoon seasons are 24 and 26
respectively, indicating a very bad water
quality. Whereas, the quality of tank water in
monsoon season is bad according to the water
quality rating with estimated ∑WQI = 30.
Irrigation water quality
Salinity and sodium hazards
Water with high salinity is toxic to plants and
poses a salinity hazard. Water salinity is
usually measured by the TDS (total dissolved
solids) or the EC (electric conductivity).
Salinization in water relates to increase in
TDS and overall chemical content of water.
This is corroborated by the presence of

Int.J.Curr.Microbiol.App.Sci (2017) 6(11): 990-1007
996
dissolved chemical ions such as sodium,
chloride, sulphates, bicarbonate and carbonate
which when in excess in irrigation water, can
affect soil fertility and crop productivity.
However, the dissolved solids and chemical
ions measured in water samples from the
Manchalapur tank were below the maximum
permissible limit of irrigation water (BIS,
2012). However, according to Bauder et al.,
(2014), chloride, especially, exceeding 350
mg/l can cause severe problems to crops and
thus tank water must be used with proper
management measures. Another most
influential parameter to assess salinity hazard
is the EC. The primary effect of high ECof
irrigation water on crop productivity is the
inability of the plant to compete with ions in
the soil solution for water (physiological
drought). Classification of irrigation water
based on EC (Raghunath, 1987) is given in
Table 7 which shows that the water samples
drawn from the Manchalapur tank were
within permissible limit. However, prolonged
use of tank water with no proper irrigation
management is likely to result in
accumulation of salt at the root zone of crops
over time.
Concentration of sodium plays a major role in
evaluating the water quality for irrigation
since accumulation of sodium concentration
can result in sodicity which causes swelling
and dispersion of soil clays, surface crusting
and pore plugging, and thus obstructs
infiltration and may increase runoff. Sodicity
causes a decrease in the downward movement
of water into and through the soil, and
actively growing plants roots may not get
adequate water, despite pooling of water on
the soil surface after irrigation. Although
plant growth is primarily limited by the
salinity level of the irrigation water, the
application of water with a sodium imbalance
can further reduce yield under certain soil
texture conditions. The sodium hazard is the
relative proportion of sodium to calcium and
magnesium ions. It is usually expressed in
terms of sodium adsorption ratio (SAR). SAR
is calculated by (Richards, 1954),
2
MgCa
NaSAR
22
Where the concentrations are represented in
meq/l.
SAR measured from water samples are given
in Table 8 which indicates very low values
only in the monsoon season and thus tank
water may pose no sodium hazard to soil and
crops during this season.
SAR values of irrigation water less than 10 is
considered to be low and suitable for
irrigation but caution must be taken in cases
of sodium sensitive crops especially during
the post monsoon season which recorded
SAR values closer to 10. SAR measured at
two sampling locations during the pre-
monsoon ranges between 10 to 18 and the
other two locations SAR ranges from 18 to
26. This is an indication that tank water may
generally not be suitable for irrigation during
the pre-monsoon season based on SAR.
On the other hand, as the SAR value
measured in the monsoon season ranges from
4.154 to 4.496 with corresponding EC
exceeding 1.20 dS/m at all locations, the
infiltration rate should not be affected,
however, since flood irrigation is generally
practised by farmers, SAR value between 3
and 9 could mean that the sodium content
could be toxic to plants through accumulation
over time (Ayers et al., 1985).
Sodium percentage (Na%) of water samples
from Manchalapur tank water was calculated
by Raghunath (1987),

Int.J.Curr.Microbiol.App.Sci (2017) 6(11): 990-1007
997
Table.1 Chemical characteristics of tank water measured in the pre-monsoon season
Parameters Unit Inlet WS-I WS-II Outlet Mean
BOD5 mg/l 163 168 136 192 164.75
COD mg/l 929 1586 1506 220 1060.25
TDS mg/l 796 980 956 1236 992
pH no unit 7.23 8.75 8.84 8.72 8.385
EC dS/m 1.72 1.47 1.46 1.45 1.525
Sodium
mg/l 136 128 108 116 122
Calcium
mg/l 88 70 67.20 72.80 74.50
Magnesium
mg/l 26 18 17.28 18.72 20
Potassium
mg/l 22.03 19.23 17.75 18.0 19.25
TKN mg/l 38.23 27.57 23.45 21.85 27.775
Phosphate
mg/l 16.37 12.39 12.01 8.23 12.25
Chloride
mg/l 360 592 568 524 511
Sulphate
mg/l 88 108 110 104 102.5
HCO3-
mg/l 9.6 8.4 6.2 7.2 7.85
CO32-
mg/l 0.2 BDL 1.2 1.2 0.65
Surfactant Ppm LAS 5.5 2.5 2.2 2.4 3.15
Faecal coliform MPN/100ml > 1600 900 900 900 -
Total coliform MPN/100ml > 1600 1600 1600 1600 - BDL = Below Detectable Limit
Table.2 Chemical characteristics of Manchalapur tank water measured in the monsoon season
Parameters Unit Inlet WS-I WS-II Outlet Mean
BOD5 mg/l 232 210 205 213 215
COD mg/l 434 446 304 394 394.5
TDS mg/l 360 400 560 400 430
pH no unit 7.23 7.96 7.31 8.21 7.6775
EC dS/m 1.66 1.46 1.40 1.36 1.47
Sodium
mg/l 32 28 26 27 28.25
Calcium
mg/l 79 68.6 53.2 67.2 67
Magnesium
mg/l 25.92 17.64 13.68 17.28 18.63
Potassium
mg/l 42.30 38.70 36.80 38.50 39.075
TKN mg/l 65.42 53.90 48.22 38.40 51.485
Phosphate
mg/l 34.68 16.10 6.06 2.52 14.84
Chloride
mg/l 302 341 356 411 352.5
Sulphate
mg/l 79 82 84 80 81.25
HCO3-
mg/l 7.2 6.4 6.0 7.2 6.7
CO32-
mg/l BDL 1.2 1.2 0.4 0.70
Surfactant ppm LAS 7.2 2.9 4.5 3.1 4.425
Faecal coliform MPN/100ml 1600 900 900 > 1600 -
Total coliform MPN/100ml > 1600 1600 1600 > 1600 - BDL = Below Detectable Limit

Int.J.Curr.Microbiol.App.Sci (2017) 6(11): 990-1007
998
Table.3 Chemical characteristics of Manchalapur tank water measured in the
post-monsoon season
Parameters Unit Inlet WS-I WS-II Outlet Mean
BOD5 mg/l 178 162 156 159 163.75
COD mg/l 537 406 452 559 488.5
TDS mg/l 480 400 720 540 535
pH no unit 7.10 7.32 8.54 8.64 7.90
EC dS/m 1.32 1.11 1.07 1.06 1.14
Sodium
mg/l 65 61 51 55 58
Calcium
mg/l 79 60 58 73 67.5
Magnesium
mg/l 18 11 9.28 11.72 12.5
Potassium
mg/l 41.60 43.10 43.30 43.90 42.975
TKN mg/l 68.53 54.36 48.87 40.91 53.1675
Phosphate
mg/l 35.48 20.40 28.24 21.42 26.385
Chloride
mg/l 398 451 467 489 451.25
Sulphate
mg/l 81 99 98 123 100.25
HCO3-
mg/l 5.2 7.6 6.6 5.2 6.15
CO32-
mg/l 1.2 1.2 1.2 2.0 1.4
Surfactant Ppm LAS 7.0 1.0 2.7 2.4 3.275
Faecal coliform MPN/100ml 900 > 1600 > 1600 900 -
Total coliform MPN/100ml 1600 > 1600 > 1600 1600 -
Table.4 Pearson correlation between hydro-chemical characteristics of
Manchalapur tank water samples
** Correlation is significant at the 0.01 level, * Correlation is significant at the0.05 level
Table.5 Water Quality Rating as per NSF-WQI
WQI range Category-Rank
0-25 Very bad
26-50 Bad
51-70 Moderate
71-90 Good
91-100 Very good
pH EC TDS Cl- SO42- HCO3
- TKN PO43- Na+ Ca2+ Mg2+ K+ BOD5 COD Surfact-
ants
pH 1
EC -0.265 1
TDS 0.608* 0.208 1
Cl 0.802** -0.321 0.713** 1
SO42- 0.721** -0.443 0.536 0.823** 1
HCO3-- 0.0244 0.264 0.388 0.141 0.152 1
TKN -0.771** -0.124 -0.821** -0.744** -0.613* -0.427 1
PO43- -0.405 -0.144 -0.367 -0.297 -0.134 -0.315 0.729** 1
Na+ 0.309 0.344 0.823** 0.601* 0.472 0.611* -0.655* -0.17 1
Ca2+ -0.11 0.629* 0.162 -0.156 -0.0258 0.354 -0.0986 0.199 0.483 1
Mg2+ -0.333 0.935** 0.097 -0.372 -0.431 0.226 0.0121 0.0816 0.329 0.819** 1
K+ -0.428 -0.551 -0.87** -0.551 -0.317 -0.475 0.817** 0.516 -0.853** -0.34 -0.406 1
BOD5 -0.397 0.409 -0.427 -0.683 -0.703* -0.272 0.419 -0.0137 -0.569 0.0701 0.406 0.299 1
COD 0.383 0.285 0.453 0.588* 0.421 0.203 -0.495 -0.125 -0.659* 0.233 0.204 -0.637* -0.563 1
Surfactant -0.682* 0.538 -0.306 -0.663* -0.648* -0.31 0.585* 0.521 -0.144 0.433 0.653* 0.185 0.471 -0.148 1

Int.J.Curr.Microbiol.App.Sci (2017) 6(11): 990-1007
999
Table.6 Weighted aggregation water quality index for the three sampling seasons
Factor Weight Qi-pre-mon. Qi-monsoon Qi-post monsoon
Dissolved Oxygen (% saturation) 0.17 26 49 33
Faecal Coliform (CFU/100 mL) 0.16 20 23 20
pH 0.16 70 91 88
BOD (mg/L) 0.11 5 5 5
Temperature Change (oC) 0.11 10 16 15
Total Phosphate (mg/L) 0.10 2 2 2
Nitrates (mg/L) 0.10 29 9 8
Turbidity (NTU) 0.08 33 41 34
Total Solids (mg/L) 0.07 20 20 20
∑WQI=24 ∑WQI=30 ∑WQI=26
Table.7 Irrigation water quality based on EC (dS/m)
EC (dS/m) Water Class Remarks
<0.25 Excellent Can be used safely
0.25 – 0.75 Good Can be used with moderate leaching
0.75 – 2.0 Permissible Not suitable at 2 dS/m though but can be
used with proper management below
that.
2.0 – 3.0 Doubtful Cannot be used for irrigation
> 3.0 Unsuitable Cannot be used for purposes
Table.8 Suitability of Manchalapur tank water for irrigation based on SAR
SAR Remarks Pre-monsoon Monsoon Post monsoon
< 10 Little or no hazard
-
Inlet – 4.42
WS-I – 4.26
WS-II – 4.50
Outlet – 4.15
Inlet – 9.80
WS-II – 8.79
Outlet – 8.45
10 – 18 Can be used with
appropriate
management
(leaching and
application of soil
amendments)
WS-II – 16.62
Outlet – 17.15
-
WS-I – 10.24
18 – 26 Unsatisfactory for
most of the crops
Inlet – 18.01
WS-I – 19.30 - -
> 26 Unsafe for
irrigation - - -

Int.J.Curr.Microbiol.App.Sci (2017) 6(11): 990-1007
1000
Table.9 Quality of Manchalapur tank water for irrigation based on Na%
Na% Water Class Pre monsoon (%) Monsoon (%) Post monsoon (%)
< 20 Excellent - - -
20 – 40 Good
-
Inlet – 28.84
WS-I – 31.08
WS-II – 35.31
Outlet – 31.05
-
40 – 60 Permissible Inlet – 49.66
WS-I – 54.79
WS-II – 51.76
Outlet – 51.42
-
Inlet – 41.67
WS-I – 48.96
WS-II – 47.53
Outlet – 43.19
60 – 80 Doubtful - - -
> 80 Unsuitable - - -
Fig.1 A representation on tank (a) inlet showing growth of thorny bushes, (b) outlet, (c) showing
algae bloom, concrete failure and weeds in part of water spread area and (d) damaged sluice
A B
B
C D

Int.J.Curr.Microbiol.App.Sci (2017) 6(11): 990-1007
1001
(a) b) (c)
Fig.2 Impacts of tank water irrigation on (a) soil and cotton plantation, (b) paddy field after
harvesting and (c) fish die-off observed at inlet of tank
)KNaMg(Ca
100)K(Na Na%
22
Where all concentrations are expressed in
meq/l.
Na% measured in water samples from the
tank are given Table 9 and indicates good
water quality only during the monsoon season
based on Na%. However, the Na% measured
at all sampling locations in the pre-monsoon
season and post monsoon fall within
permissible limit.
NPK
The presence of NPK in irrigation water is
largely a fertility issue and the tank water
shows appreciable content of NPK especially
during the post monsoon season. However, an
excess of nutrients in the water system can
cause eutrophication and impair aquatic life.
Excess nitrogen, at concentrations ranging
from 0.1 to more than 1.6 mg/l, in surface
waters can cause excessive algae growth,
which depletes dissolved oxygen in water and
impacts other aquatic species
(Tjandraatmandja et al., 2010). Potassium is
important for grain formation and is also
necessary for tuber development. All root
crops generally give response to application
of potassium (Rai et al., 2011). Regarding
potassium concentrations, tank water can be
recommended for irrigation purposes as
potassium is essential for protein synthesis,
starch formation and for translocation of
sugars. Therefore, while the Manchalapur
tank water would be a good source of
nutrients for plants growth, the excess NPK in
the water system would result in algae growth
and thus have dire consequences on fish
reared in the tank.
BOD5
BOD measured in this study exceeded the
maximum permissible limit of 100 mg/l for
irrigation water. According to the CPCB
water quality criteria for propagation of
fisheries, the recommended BOD5 of water
should be 2 mg/l or less. Hence, the
Manchalapur tank water is not suitable for
irrigation and unsupportive for aquatic life
based on BOD. Fish mortality was observed
at certain locations of the tank in the pre-
monsoon season.
Detergents
Due to their amphiphilic nature surfactants in
raw sewage can adsorb to the surface of
resident particulate matter. Surfactants may
also precipitate from solution in the presence
of metal ions (particularly Ca2+
). Such
behaviour may result in a significant

Int.J.Curr.Microbiol.App.Sci (2017) 6(11): 990-1007
1002
proportion of the surfactant load of raw
sewage being associated with the particulate
fraction. Toxic effects of surfactants are also
combined with adsorption tendencies of
surfactant molecules. In the concentration
range of 1 to 100 ppm, surfactants are
strongly toxic to fish (Tomiyama, 1975).
According to Tomiyama (1975), surfactants
are not ingested in the alimentary track of fish
but they are adsorbed on gills. They form
complex of surfactant and gill proteins
disturbs the functioning of gills resulting into
oxygen deficit.
Pathogens
Total coli form and faecal coli form by
themselves are usually not pathogenic; they
are indicator organisms, which mean they
may indicate the presence of other pathogenic
bacteria. The presence of coli form in tank
water is due to overflow of domestic sewage
and non-point sources of human and animal
waste. The results from this study showed that
E. coli population, both total coliform and
faecal coliform, were found to be greater than
1600 MPN/100ml at all sampling locations in
the pre-monsoon season. And it varied from
900 MPN/100ml to 1600 MPN/100ml in the
monsoon and post monsoon seasons. The
presence of coliform contamination indicates
that the water has been contaminated with
faecal material of man or other animals and
this has potential health risks for individuals
who may consume fish reared in the tank or
crops irrigated with tank water over time.
Exploratory study of Manchalapur tank
system and implications on multiple uses
The Manchalapur tank is subjected to heavy
inflow of domestic wastewater from the
Raichur city and this is the foremost threat to
the multiple uses of tank water. Other threats
such as weed growth in supply channel,
surplus weir, damaged sluice, and siltation are
threats of poor management. It is also
observed that weeds have also taken
significant part of the tank water spread area.
The tank has one sluice which is damaged,
one surplus weir (concrete breaking) and six
waste weirs. The waste weirs are rather in
good condition. Tank bunds are breached and
thorny bushes surrounds tank (Fig. 1).
Portions have become breeding sites for
mosquitoes. The colour of the Manchalapur
tank water appeared light brownish to light
greenish. When the flow of water is low it
appeared light brownish colour at the inlet
and light greenish colour at the outlet and
water spread area. Water appears turbid
especially during rainy days and at the time of
sewage inflow. The greenish colour may
indicate the high productivity of the water
ecosystem and the presences of high amount
of nutrients present in the water that increase
the amount of phytoplankton productivity in
the water. The brownish colour may be due to
the presence of the colloidal particles. The
tank water has earthy odour and a cloudy
appearance. With lapse of time, due to
microbial action, the smell of the water
becomes more pronounced.
The tank was originally considered as source
of drinking water for man and livestock,
washing, pond for pisciculture and irrigation
system for crops. However, these uses are
limited in number now as uses are now
limited to only irrigation and rearing of fish.
Large section of the village mass of
Manchalapur village in one or other way are
facing adverse effects of sewage
contamination in terms of health problems
and steep decline in agricultural productivity,
due to usage of tank water for irrigation.
Farmers have, thus, shown great concern and
have raised strong objections against the
disposal of domestic wastewater from the
Raichur city. They have called for appropriate
measures to curtail tank water pollution

Int.J.Curr.Microbiol.App.Sci (2017) 6(11): 990-1007
1003
within threshold. The City Municipal
Corporation, Pollution Control Board,
Raichur Office, and Minor Irrigation Office
have equally shown concerns about current
status of the tank and have suggested that
finding a solution to this problem of pollution
would go a long to contribute significantly to
the livelihood of the Manchalapur people.
However, any such initiatives are yet to be
undertaken. In India, local level institutions
play very crucial role in sustainable
management of water systems as well as local
farmers who mostly form water user’s
association. Thus, under current circumstance
of accessing the sustainable benefits
(multiplicity of uses) and maintaining tank
ecosystem services, the tank need high
priority attention and management from both
the Government officials and the local people.
The tank has a capacity of about 677,740 cum
and 1.5 metres deep. The components that
make up the inflow into the tank depend on
domestic wastewater and runoff resulting
from rainfall from its catchment. Kwarteng et
al., (2016) estimated the quantity of sewage
inflow and runoff into the tank for the past ten
years and projected future expected inflows.
They found out the highest ratio of runoff to
sewage inflow over the past 10 years to be
31.52 per cent and concluded that with the
growth rate of the Raichur city, the sewage
inflow is expected to be very high in the near
future. This would diminish the dilution ratio
and consequently increase the pollution load
of tank water. Hence, they underscored the
need for urgent attention in curtailing tank
water pollution using innovative and
sustainable technologies.
Impact on domestic activities
Water required for drinking and other
household activities must be of very high
quality due to various associated problems of
polluted water source. The estimated WQI for
all three sampling seasons indicates that the
Manchalapur tank is unsuitable for drinking
purpose. Treatment to safe use may not be
economically viable as WQI ranging from 0-
24 is considered to be beyond treatment
measures (Singh et al., 2015) and costs of
household WTP for improvements to drinking
water quality are typically very expensive
(Dodds et al., 2009; Dogot et al., 2010).
Due to the high level of pollution, the people
of Manchalapur for some time now have
become averse to relying on tank water for
domestic purposes. Stink and mosquitoes
have driven the village residents away from
the tank. As Raichur city expanded with
setting up new industries, people from
surrounding villages migrated there in search
of livelihood. A landfill came up in a nearby
village Eklaspur for its solid waste and
Manchalapur tank became a disposal point of
its liquid waste. Also in recent past, the tank
has been subjected to heavy inflow of
municipal sewage from Raichur city
throughout the year. The bore wells and open
wells located in the fringe of the village and
in the command area as a result are also
subjected to influence of intrusion of seepage
from the saline water body which likely
pollute the groundwater to a greater degree.
There are many reported cases of cancer,
arthritis and ailments of nervous system due
to consumption of water from wells located in
the command area and its fringes. Thus, the
village now relies on the Krishna basin as the
main source of supply of potable water for the
households.
Impact on agriculture (Irrigation, livestock
and fishing)
The dependence on Manchalapur tank water
for irrigation is as a result of lack of
alternative source of irrigation water. The
tank receives concentrated sewage from the
Raichur city during summer and diluted
Int.J.Curr.Microbiol.App.Sci (2017) 6(11): 990-1007
1004
during monsoon when the rains are expected.
Regardless of knowledge of source of inflow
into the tank and dangers it may pose, farmers
still rely on tank for irrigation and fish
farming. Livestock, mostly cattle, trekking to
the environs of water body to drink from the
pool of water is a rare scene at Manchalapur
and this could be as a result of the stink and
poor tank water quality.
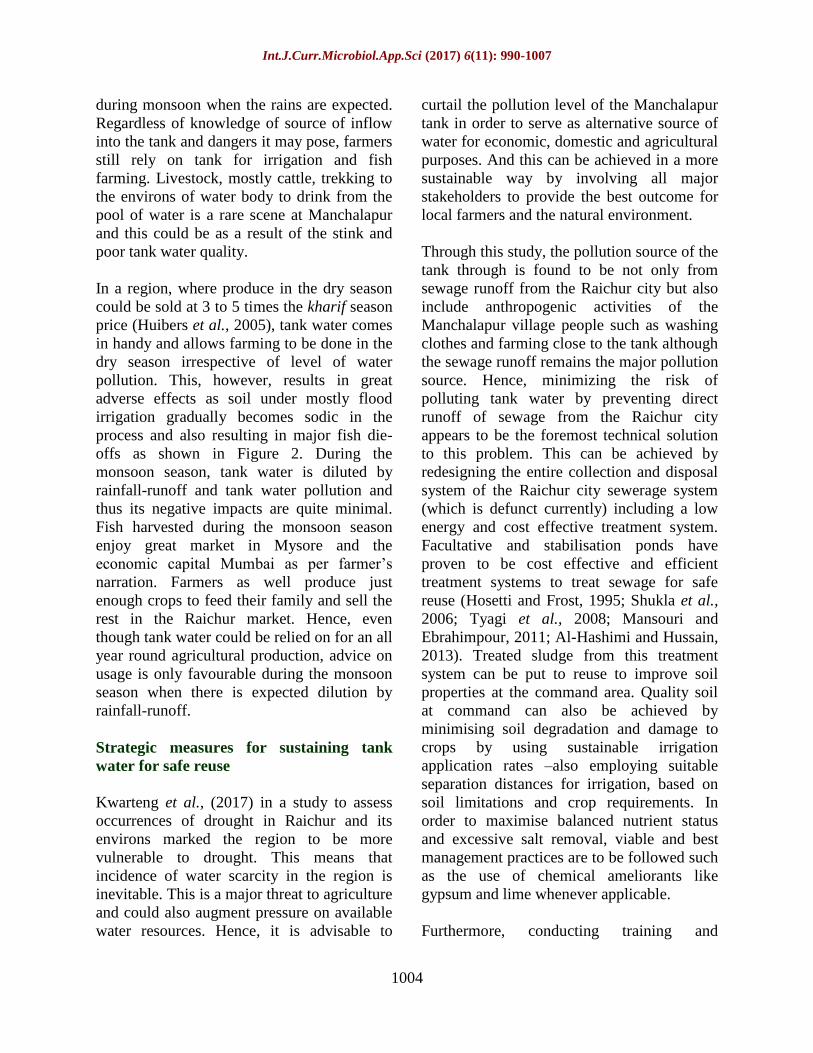
In a region, where produce in the dry season
could be sold at 3 to 5 times the kharif season
price (Huibers et al., 2005), tank water comes
in handy and allows farming to be done in the
dry season irrespective of level of water
pollution. This, however, results in great
adverse effects as soil under mostly flood
irrigation gradually becomes sodic in the
process and also resulting in major fish die-
offs as shown in Figure 2. During the
monsoon season, tank water is diluted by
rainfall-runoff and tank water pollution and
thus its negative impacts are quite minimal.
Fish harvested during the monsoon season
enjoy great market in Mysore and the
economic capital Mumbai as per farmer’s
narration. Farmers as well produce just
enough crops to feed their family and sell the
rest in the Raichur market. Hence, even
though tank water could be relied on for an all
year round agricultural production, advice on
usage is only favourable during the monsoon
season when there is expected dilution by
rainfall-runoff.
Strategic measures for sustaining tank
water for safe reuse
Kwarteng et al., (2017) in a study to assess
occurrences of drought in Raichur and its
environs marked the region to be more
vulnerable to drought. This means that
incidence of water scarcity in the region is
inevitable. This is a major threat to agriculture
and could also augment pressure on available
water resources. Hence, it is advisable to
curtail the pollution level of the Manchalapur
tank in order to serve as alternative source of
water for economic, domestic and agricultural
purposes. And this can be achieved in a more
sustainable way by involving all major
stakeholders to provide the best outcome for
local farmers and the natural environment.
Through this study, the pollution source of the
tank through is found to be not only from
sewage runoff from the Raichur city but also
include anthropogenic activities of the
Manchalapur village people such as washing
clothes and farming close to the tank although
the sewage runoff remains the major pollution
source. Hence, minimizing the risk of
polluting tank water by preventing direct
runoff of sewage from the Raichur city
appears to be the foremost technical solution
to this problem. This can be achieved by
redesigning the entire collection and disposal
system of the Raichur city sewerage system
(which is defunct currently) including a low
energy and cost effective treatment system.
Facultative and stabilisation ponds have
proven to be cost effective and efficient
treatment systems to treat sewage for safe
reuse (Hosetti and Frost, 1995; Shukla et al.,
2006; Tyagi et al., 2008; Mansouri and
Ebrahimpour, 2011; Al-Hashimi and Hussain,
2013). Treated sludge from this treatment
system can be put to reuse to improve soil
properties at the command area. Quality soil
at command can also be achieved by
minimising soil degradation and damage to
crops by using sustainable irrigation
application rates –also employing suitable
separation distances for irrigation, based on
soil limitations and crop requirements. In
order to maximise balanced nutrient status
and excessive salt removal, viable and best
management practices are to be followed such
as the use of chemical ameliorants like
gypsum and lime whenever applicable.
Furthermore, conducting training and

Int.J.Curr.Microbiol.App.Sci (2017) 6(11): 990-1007
1005
awareness programmes for farmers on water
use are to be launched and practiced. This
would help prevent adverse health impacts on
the public and livestock. This can be
complemented with the formation of
environmental clubs comprising of the village
people, the Raichur district Pollution Control
Board and students and professors from the
College of Agricultural Engineering
(specifically the Soil and Water Engineering
department) and College of Agriculture all of
the University of Agricultural Sciences,
Raichur, for effective water quality and
ecological monitoring. Farmers can also
benefit from their expertise in the form of
education on proper agricultural management
practices, water management, modern
concepts of agriculture including best
irrigation practices and crop type to grow.
The proximity of farming activities to the tank
and resultant fertiliser usage also contribute to
the pollution of tank water by runoff from the
agricultural land. Thus, a buffer zone must be
delineated and farmers restricted from
farming in this zone. For aesthetic reasons
and reduction in evaporation rates, trees
preferably those with phytoremediation
potential can be planted along this buffer
zone.
The water samples from the Manchalapur
tank assessed was alkaline in all three
sampling seasons as per pH values measured.
The water quality had varied with season with
COD, dissolved solids and major ions
measuring the highest in the pre-monsoon
season, followed by in post-monsoon and
least in the monsoon seasons. This is when
tank received undiluted sewage from the
Raichur city. There is, however, a self-
purification of lake during the monsoon
season as lake gets diluted by rainfall-runoff
and as a result concentrations of dissolved
solids and ions are reduced significantly.
BOD5 as well as NPK rather measured
highest in the monsoon season and this could
be due to high decomposition of organic
matter and additional NPK from agricultural
lands. There was also the presence of
surfactant and high level of coliform in water
samples throughout the seasons. Carbonate
concentration, however, in all areas was very
low. The estimated weighted water quality
index were 24, 30 and 26 in pre-monsoon,
monsoon and post-monsoon season
respectively, indicating high pollution level
and thus rendering tank water highly
unsuitable for drinking purposes. BOD5,
COD, surfactants, excess in NPK, total
coliform and faecal coliform were at limits
that could have potential deleterious effect on
aquatic life. EC, TDS, major ions, SAR and
Na% measured to assess suitability of
irrigation only proved suitable in the monsoon
season. Hence, it is concluded that the
Manchalapur tank has not outlived majority
of its historical purposes other than irrigation
which also proved only suitable in the
monsoon season.
References
Al-Hashimi, M. A. and Hussain, H. T., 2013,
Stabilisation pond for wastewater treatment.
European Scientific J., 9(14): 278-294.
Al-Khashman, O. A., Al-Hwaiti, M., Al-Khatib,
L. and Fraige, F., 2013, Assessment and
evaluation of treated municipal wastewater
quality for irrigation purposes. Research J.
Environ. Earth Sci., 5(5): 229-236.
Amerasinghe, P., Bhardwaj, R. M., Scott, C.,
Jella, K. and Marshall, F., 2013, Urban
Wastewater and Agricultural Reuse
Challenges in India. International Water
Management Institute (IWMI) Research
Report 147.
American Public Health Association (APHA),
AWWA and WPCF, (1998), Standard
Methods for Estimation of water and waste
water, American Public Health Association,
Washington, 20th ed., New York.
Bauder, T. A., Waskom, R. M., Sutherland, P. L.
and Davis, J. G. (2014) Irrigation water

Int.J.Curr.Microbiol.App.Sci (2017) 6(11): 990-1007
1006
quality criteria. Colorado State University
Extension, no. 0.506.
Bhamoriya, V., 2004, Wastewater Irrigation in
Vadodara, Gujarat, India: Economic Catalyst
for Marginalized Communities. In: Scott CA,
Faruqui NI and Raschid-Sally L. (Eds).
Wastewater Use in Irrigated Agriculture:
Confronting Livelihhod and Environmental
Realities. CAB International in Association
with IWMI: Colmbo, Sri Lanka, and IDRC:
Ottawa, Canada.
BIS (Bureau of Indian Standards) (2012) Indian
standard drinking water specification, second
revision ISO: 10500:2012, Bureau of Indian
Standards. Drinking Water Sectional
Committee, FAD 25, New Delhi, India
Buechler, S., Devi, G. and Raschid, L., 2002,
Livelihoods and wastewater irrigated
agriculture along the Musi river in Hyderabad
city, Andhra Pradesh, India. Urban
Agriculture, 14-17.
Central Pollution Control Board, 2010, CPCB
Report Series: CUPS/70/2009-10. Status of
Water Supply, Wastewater Generation and
Treatment in Class I Cities and Class II
Towns of India. Central Pollution Control
Board, India.
Dodds, W. K., Bouska, W. W., Eitzmann, J. L.,
Pilger, T. J., Pitts, K. L., Riley, A. J.,
Schloesser, J. T. and Thornbrugh, D. J.
(2009), Eutrophication of U.S. Freshwaters:
Analysis of potential economic damages,
Environmental Science and Technology,
43(1): 12-19.
Dogot, T., Xanthoulis, Y., Fonder, N. and
Xanthoulis, D. (2010), Estimating the costs of
collective treatment of wastewater: the case
of Walloon Region (Belgium). Water Science
& Technology 62(3): 640-648.
Gupta, A. K., Gupta, S. K. and Patil, R. S. (2003).
A comparison of water quality indices for
coastal water, J. Environ. Sci. Health 38 (11):
2711–2725.
Hosetti, B. B. and Frost, S., 1995, A review of the
sustainable value of effluents and sludges
from wastewater stabilization ponds.
Ecological Engineering, 5(4): 421-431.
Huibers, F. P. and van Lier, J. B., 2005, Use of
wastewater in agriculture: The water chain
approach, Irrigation and Drainage, 54: 3-9.
Hussain, I., Raschid, L., Hanjra, M. A., Marikar,
F. and van der Hoek, W., 2002, Wastewater
use in agriculture: Review of impacts and
methodological issues in valuing impacts.
Colombo, Sri Lanka: IWMI. Working Paper,
37: 3-12.
Kaur, R., Wani, S. P., Singh, A. K. and Lal, K.,
2012, Wastewater production, treatment and
use in India, Country Report – India, p 13.
Kwarteng Francis, et al., (2017) Reconnaissance
Drought Index as Potential Drought
Monitoring Tool in a Deccan Plateau, Hot
Semi-Arid Climatic Zone. International
Journal of Agriculture Sciences, Volume 9,
Issue 1, pp.-2183-2186.
Kwarteng, F., Satishkumar, U., Veeresh, H.,
Nemichandrappa, M. and Babu, B. M.
(2016). Assessing quality and quantification
of municipal sewage inflow based on per
capita water supply and runoff estimation,
Int’l Jr. Agril Sci.&Res. 6(2): 53-64
Mahuya, D. G. A., Purohit, K. M. and Datta, J.
(2001). Assessment of drinking water quality
of river Brahmani. Indian J. Environ. Prot.,
8, 285-291.
Mansouri, B. and Ebrahimpour, M., 2011, Heavy
metals characteristics of wastewater
stabilisation ponds. American-Eurasian J.
Agric. & Environ. Sci., 10(5): 763-768.
Minhas, P. S. and Samra, J. S., 2004, Wastewater
Use in Peri-urban Agriculture: Impacts and
Opportunities. Bulletin No. 2, CSSRI, Karnal
132001, India.
Palrecha, A., Kapoor, D. and Malladi, T., 2012,
Wastewater irrigation in Gujarat: An
exploratory study. IWMI-TATA Water
Policy Program. Available at:
(www.iwmi.cgiar.org/iwmitata/PDFs/2012_H
ighlight-30.pdf)
Raghunath, H. M. (1987) Groundwater. Wiley
Eastern Ltd, New Delhi 563
Rai, S., Chopra, A. K., Pathak, C., Sharma, D. K.,
Sharma, R. and Gupta, P. M. (2011).
Comparative study of some physicochemical
parameters of soil irrigated with sewage
water and canal water of Dehradun city,
India. Arch. Appl. Sci. Res., 3(2): 318-325.
Richards, L. A. (1954) Diagnosis and
improvement of saline and alkali soils, US
Department of Agriculture Handbook, p 60
Rutkowski, T., Raschid-Sally, L. and Buechler, S.,
2007, Wastewater irrigation in the developing

Int.J.Curr.Microbiol.App.Sci (2017) 6(11): 990-1007
1007
world - Two case studies from the
Kathmandu Valley in Nepal. Agricl water
manage., 88: 83-91.
Semiromi, F. B., Hassani, A., Torabian, A.,
Karbassi, A. and Lotfi, F. H. (2011).
Evolution ofa new surface water quality
index for Karoon catchment in Iran. Water
Sci. Technol. 64, 2483–2491.
Shende, G. B., Chakraborti, C., Rai and Nashikar,
R. P., 2000, Status of wastewater treatment
and agricultural reuse with special references
to Indian experience and research and
development needs. Proc. FAO Regional
Seminar on the Treatment and Use of Sewage
Effluent for Irrigation, Nicosia, Cyprus, 7-9,
London.
Shukla, S. K., Tripathi, P., Pandey, M., Dubey,
A., Mangal, M. S. and Vivek, K., 2006,
Treatment of municipal sewage by the
combination of anaerobic and facultative
treatment process – a case study.
Environmental Engineering and Management
J., 5(5): 1085-1094.
Singh, S., Ghosh, N. C., Krishan, G., Galkate, R.,
Thomas, T. & Jaiswal, R. K. (2015).
Development of an Overall Water Quality
Index (OWQI) for Surface Water in Indian
Context, Current World Environment 10(3):
813-822
Souligny EA, Davidson JD, Martin TD, Mcinnish
MB, Schultz BS, Wilson CG, Wood JL,
Hollabaugh CL (2001) Sulfate content of
surface waters of West Georgia: variations
with land usage and flow characteristics of
streams in Carroll and Heard Counties,
Georgia. The Geological Society of America
annual meeting, Paper no: 151.
Srebotnjak, T., Carr, G., de Sherbinin, A. &
Rickwood, C. (2012). A global Water Quality
Index and hot-deck imputation of missing
data. Ecol. Indic. 17, 108–119.
Srinivasana, J. T. and Reddy, V. R., 2009, Impact
of irrigation water quality on human health:
A case study in India. Ecological Economics,
68: 2800-2807.
Strauss, M. and Blumenthal, U., 1990, Human
Waste Use in agriculture and Aquaculture:
Utilization Practice and Health Perspectives.
IRCWD Report 09/90. International
Reference Centre for Waste Disposal,
Duebendorf, Germany.
Suutari, A., 2006, India – East Kolkata – Making
the most of it: wastewater, fishponds and
agriculture. The EcoTipping Points Project.
(http://ecotippingpoints.org/our-stories/ indepth/
india-calcutta-wetland-wastewater-agriculture-
fishpond.html) (Accessed, 15/09/2017).
Tjandraatmadja, G., Pollard, C., Sheedy, C. and
Gozukara, Y. (2010). Sources of priority
contaminants in domestic wastewater:
contaminant loads from household products,
Water for a Healthy Country National
Research flagship, CSIRO Publishing.
Tomiyama S., 1975: Fundamental study of
biochemical behavior of anionic sulfonate
andsulfatetype surfactants, J. Am. Oil Chem.
Soc., 52(5), 135-139.
Tyagi, S., Sharma, B., Singh, P. and Dobhal, R.
(2013). Water Quality Assessment in Terms
of Water Quality Index, American Journal of
Water Resources, 1(3), 34-38
Tyagi, V. K., Kazmi, A. A. and Chopra, A. K.,
2008, Removal of faecal indicators and
pathogens in a waste stabilization pond
system treating municipal wastewater in
India. Water Environment Research, 80(11):
2111-2117.
How to cite this article:
Francis Kwarteng, Umapathy Satishkumar, Moddi Nemichandrappa, Banda Maheshwara Babu
and Veeresh Hogarnal. 2017. Seasonal Variation and Hydro-chemical Characterization of
Manchalapur Lake Quality for Drinking and Agricultural Purposes.
Int.J.Curr.Microbiol.App.Sci. 6(11): 990-1007. doi: https://doi.org/10.20546/ijcmas.2017.611.116