seasonal distribution of seasonal distribution of...
TRANSCRIPT
SEASONAL DISTRIBUTION OF SEASONAL DISTRIBUTION OF SEASONAL DISTRIBUTION OF SEASONAL DISTRIBUTION OF
NEMATODESNEMATODESNEMATODESNEMATODES
INTRODUCTION
The seasonal distribution of parasites is an important factor to understand the
intensity of infection in the edible fishes of a given region. The distribution of
nematode parasites mainly carried by the infected host which may be harmful, such
hosts and parasite relationship is parasitosis. In some infections to the hosts where
there is no damage of tissue, such relationship between them is referred to as
parasitiasis. Thus the distribution of nematode parasites in any given area much
depends on either parasitosis or parasitiasis or both (Plate no 56, Fig no 1-6). In
some nematode parasites like anisakids, release their eggs into the water where
they become larvae and lead a zooplanktonic life and carried to different places till
they find entry into the fish host. Nematode larvae are more harmful than adults
and can penetrate into the tissue of various organs. Livers are more frequently
invaded by the larvae, quiet often hundreds of them are present in this organ,
causing severe tissue damage and destruction of cells (Plate no 57, Fig. no 1-5).
Due to their smaller size they can circulate within blood stream and can reach to
any of the organ of the fish including brain, eye, skin, muscles and gills etc.
PLATE-56
Fig 1 : Liver infected with Nibea maculata.
Fig 2 : Same. (Enlarged view)
Fig 3 : Nematode cysts in the stomach of Saurida
undosquamis.
Fig 4 : Liver infected with Johnius sp.
Fig 5 : Liver infected with Otolithus argenteus.
Fig 6 : Stomach infected with Otolithus argenteus.
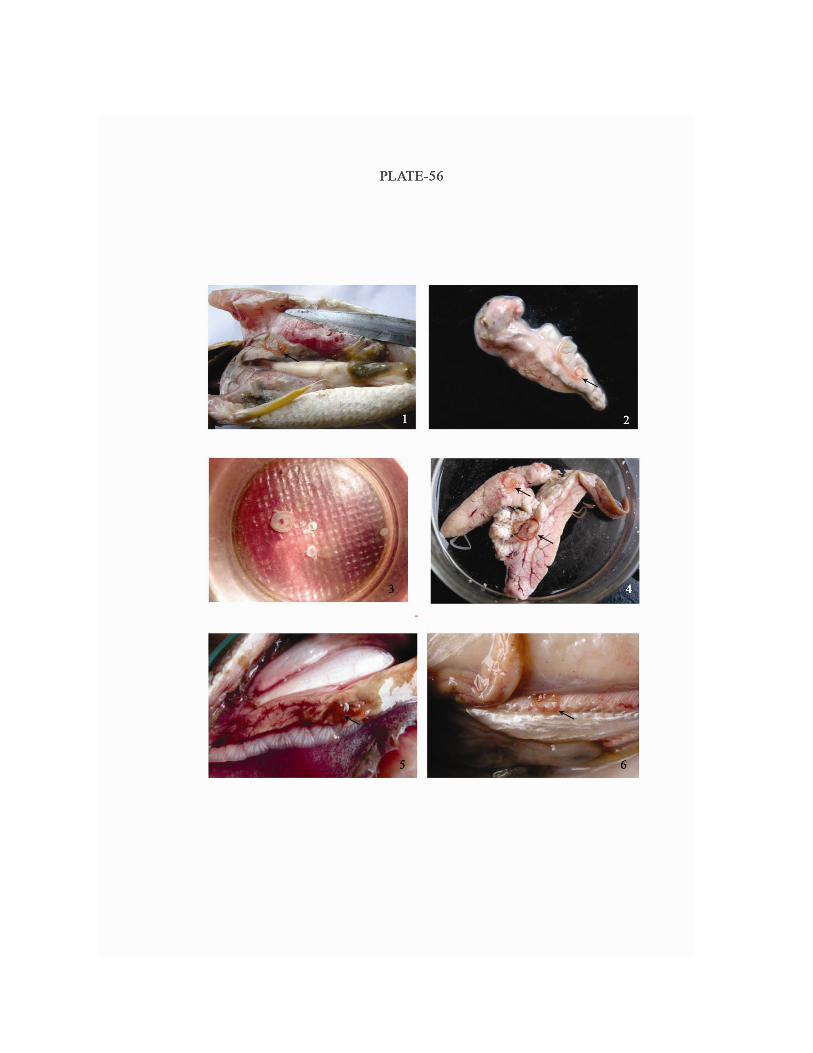
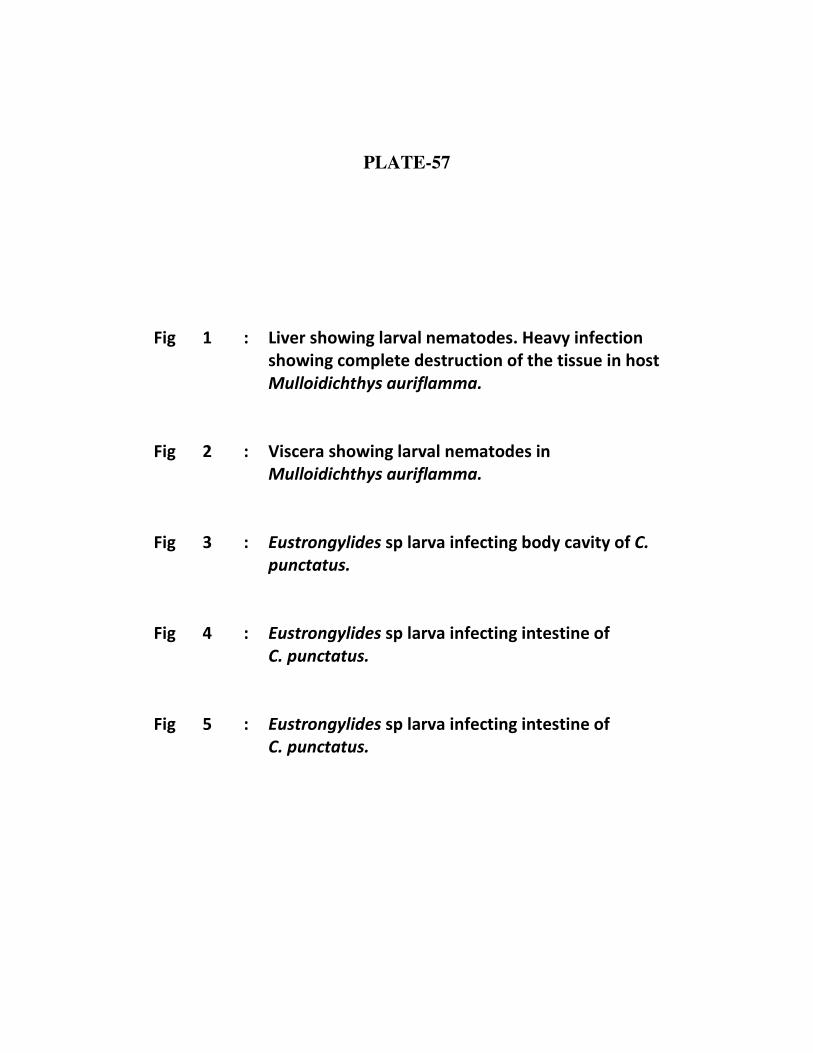
PLATE-57
Fig 1 : Liver showing larval nematodes. Heavy infection
showing complete destruction of the tissue in host
Mulloidichthys auriflamma.
Fig 2 : Viscera showing larval nematodes in
Mulloidichthys auriflamma.
Fig 3 : Eustrongylides sp larva infecting body cavity of C.
punctatus.
Fig 4 : Eustrongylides sp larva infecting intestine of
C. punctatus.
Fig 5 : Eustrongylides sp larva infecting intestine of
C. punctatus.

Distribution of nematode parasites in different marine fishes were
examined from January 2007 to December 2009. Prevalence of infection, mean
intensity and relative density were studied.
In 2007, the highest prevalence of infection (38.5%) was recorded in May
and the lowest (3%) in February. The highest mean intensity (3.3%) was
observed in March and lowest in June (1.3%) and highest relative density (0.6%)
was observed in May and lowest (0.1%) was recorded for three months i.e
March, August and September (Table -1, Graph-1, 2, 3).
In the year 2008, the highest prevalence (14.2%) was recorded in May and
the lowest (1.4%) in November. The highest mean intensity (1.7%) was
observed in July and lowest (1.0%) in September and November and highest
relative density (0.2%) was observed in May and lowest in April, June and July
and was nil in eight months i.e January, February, March, August, September,
October, November and December (Table-2, Graph-1, 2, 3).
In the year 2009, the highest prevalence (20%) was recorded in May and
the lowest (1.5%) in November. The highest mean intensity (1.5%) was
observed in August and lowest (1.0%) in November and highest relative density
(0.2%) was observed in May and was nil in six months i.e January, February,
July, August, November and December (Table-3, Graph-1, 2, 3).
The present study deals with the effect of seasons on total nematode
population from the hosts collected during three annual cycles, 2007-2009.
Each annual cycle comprises
(1) Rainy Season (July to October)
(2) Winter Season (November to February)
(3) Summer Season (March to June)
From the table-4, it indicates that in three years, the incidence of infection was
moderate in winter and has risen considerably in rainy season and reached its
peak in summer season (Graph-4).
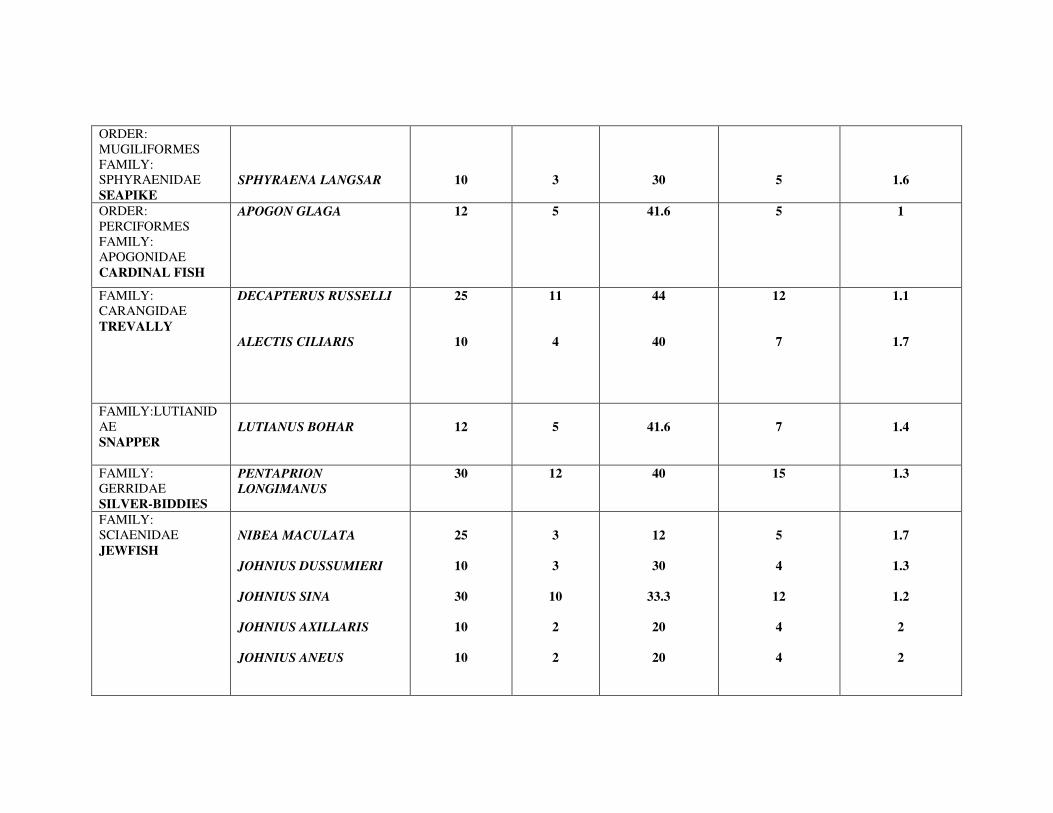
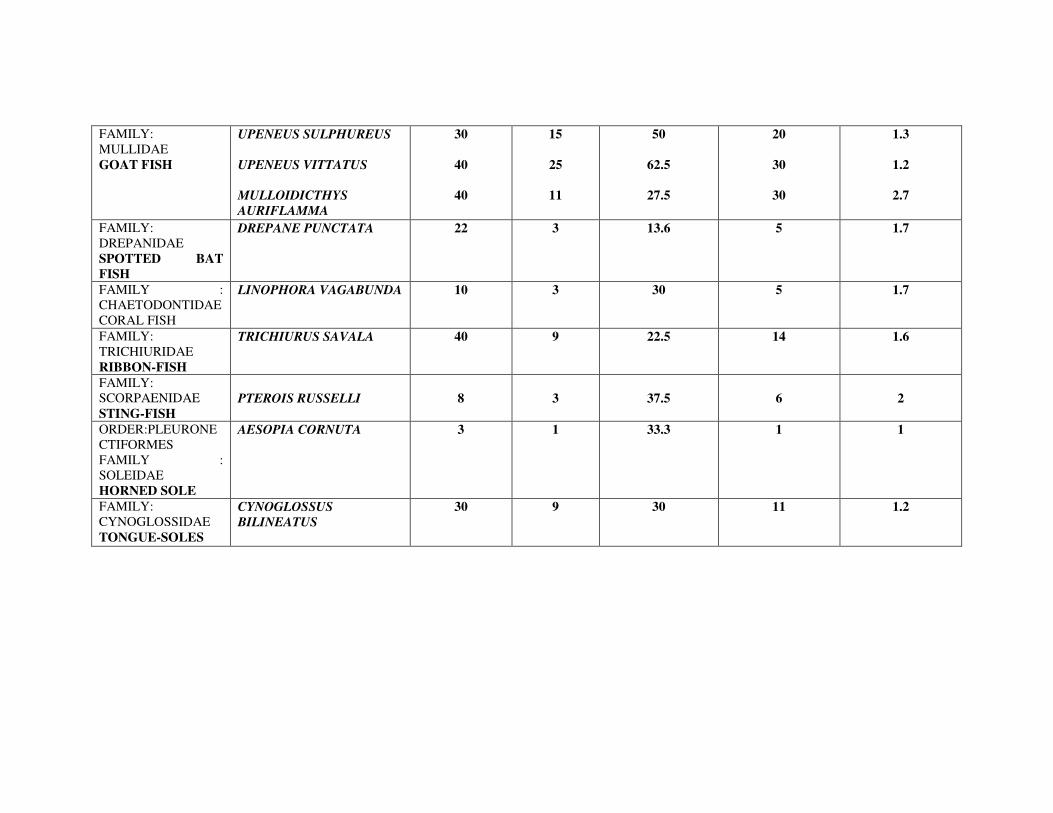
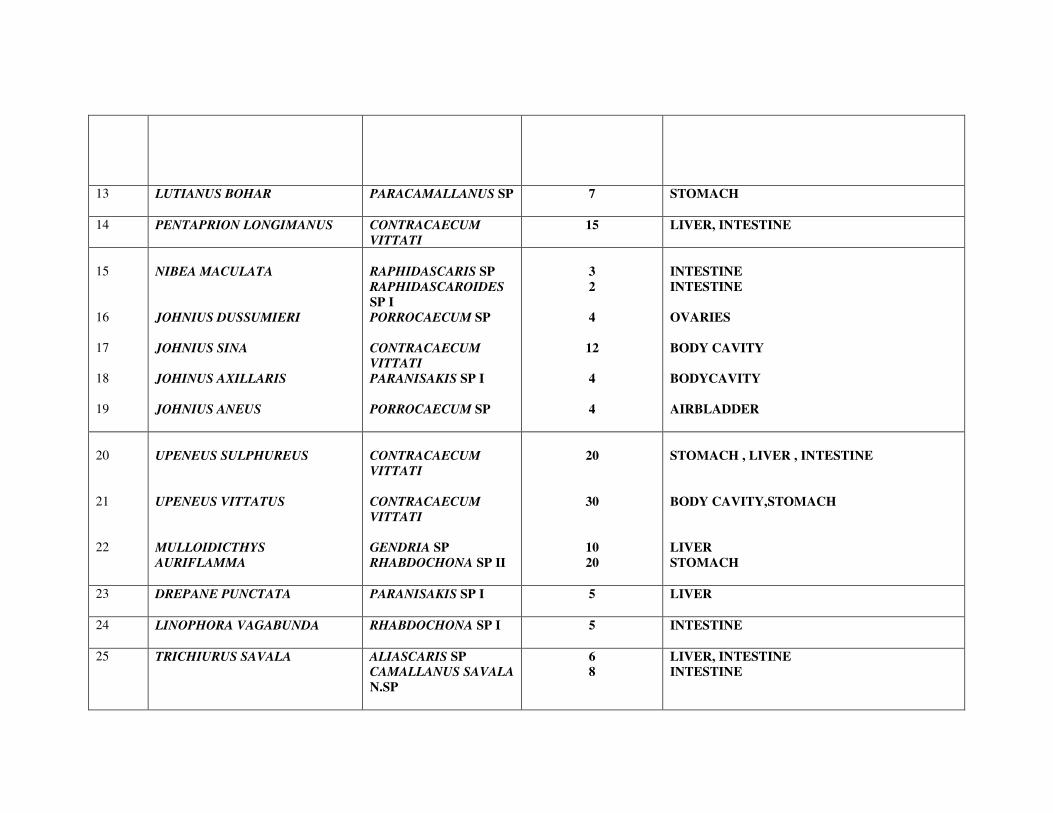
To understand, which species of marine fish is more prone to nematode
infection, an in-depth study was conducted. In these three years the highest
prevalence of infection was recorded in the fish Upeneus vittatus (62.5%) and
lowest (8%) in Muraenesox talabanoides (Table-5). The prevalence in other
fishes observed has been as follows- Thryssocles mystax (50%), Upeneus
sulphureus (50%), Saurida undosquamis (46.6%), Decapterus russelli (44%),
Trachinocephalus myops (41.6%), Apogon glaga (41.6%), Lutianus bohar
(41.6%), Alectis indica (40%), Pentaprion longimanus (40%), Pterois russelli
(37.5%), Thryssocles dussumieri (36.6%), Johnius sina (33.3%), Aesopia
cornuta (33.3%), Saurida tumbil (30%), Sphyraena langsar (30%), Johnius
dussumieri (30%), Linophora vagabunda (30%), Cynoglossus bilineatus (30%),
Mulloidicthys auriflamma (27.5%), Trichiurus savala (22.5%), Holocentrus
lacteo-guttatus (20%), Johnius axillaris (20%), Johnius aneus (20%), Drepane

punctata (13.6%), Muraenesox cinereus (13.3%) and Nibea maculata (12%)
(Graph 5-10).
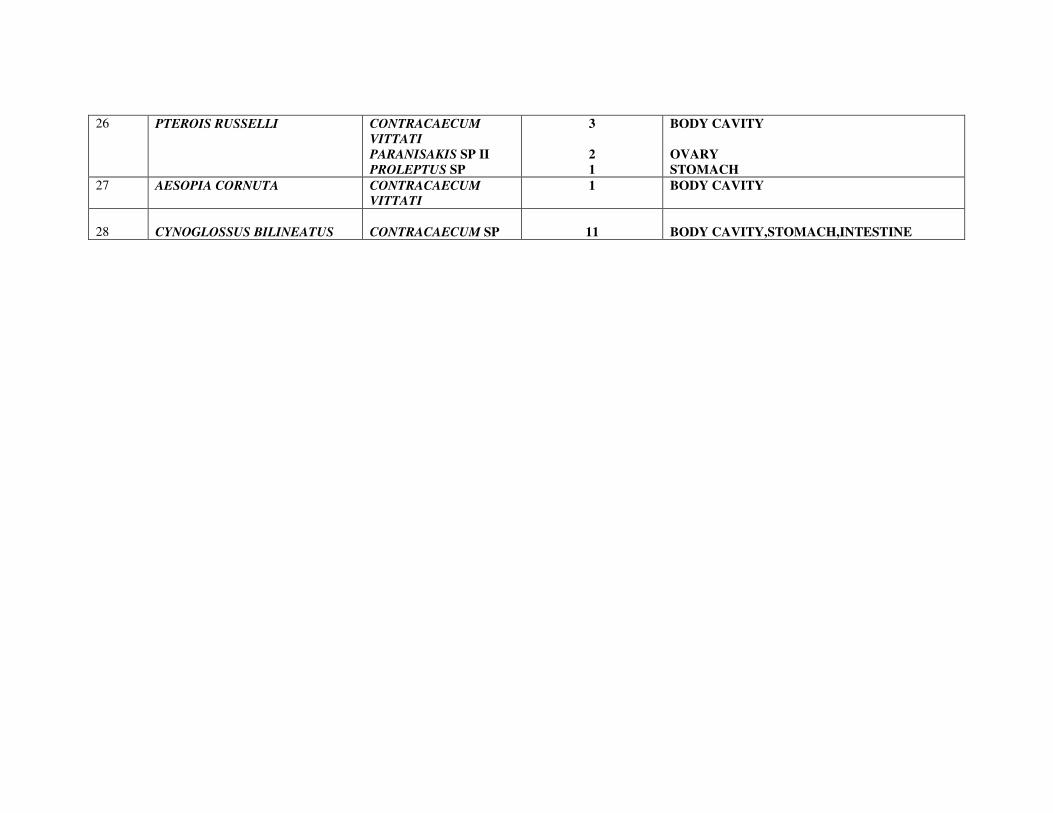
It is evident from this study, that nematode parasites exhibit a marked
seasonal occurrence, as the peak infection was recorded among the fish Upeneus
vittatus, Thryssocles mystax, Upeneus sulphureus, and Saurida undosquamis
with the occurrence of Contracaecum in the summer season i.e. from March to
June (Table-6, Graph-11, 12).
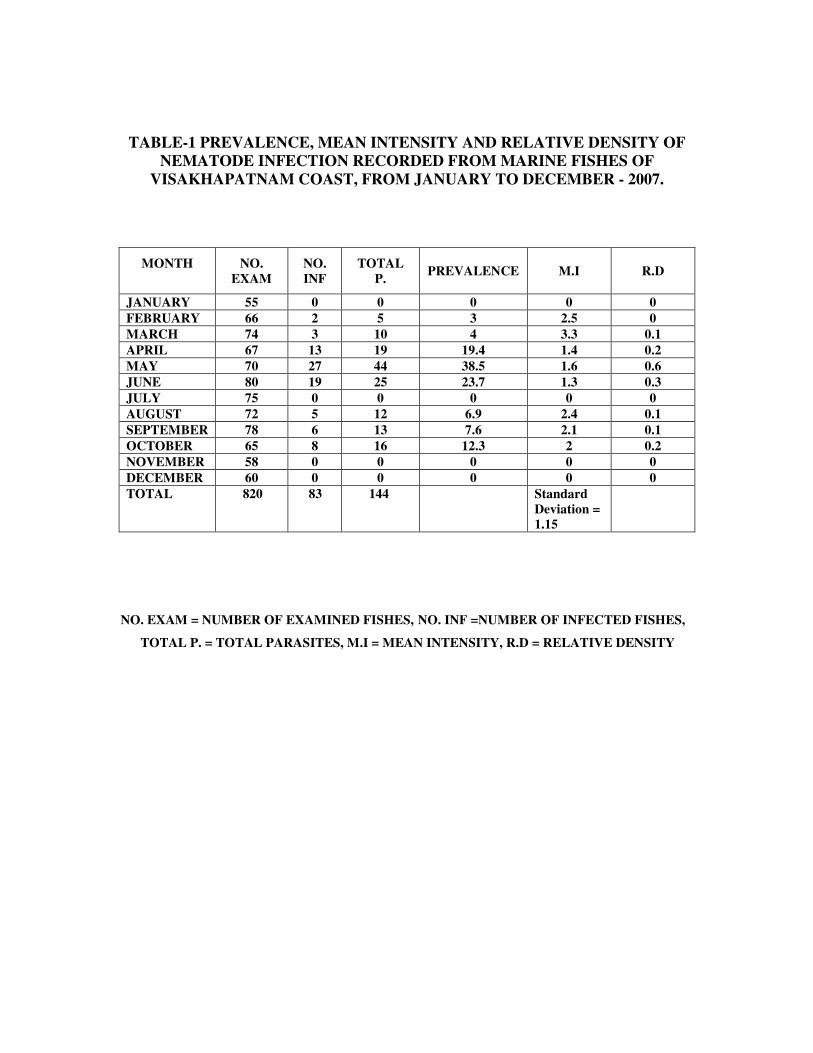
TABLE-1 PREVALENCE, MEAN INTENSITY AND RELATIVE DENSITY OF
NEMATODE INFECTION RECORDED FROM MARINE FISHES OF
VISAKHAPATNAM COAST, FROM JANUARY TO DECEMBER - 2007.
NO. EXAM = NUMBER OF EXAMINED FISHES, NO. INF =NUMBER OF INFECTED FISHES,
TOTAL P. = TOTAL PARASITES, M.I = MEAN INTENSITY, R.D = RELATIVE DENSITY
MONTH
NO.
EXAM
NO.
INF
TOTAL
P. PREVALENCE M.I
R.D
JANUARY 55 0 0 0 0 0
FEBRUARY 66 2 5 3 2.5 0
MARCH 74 3 10 4 3.3 0.1
APRIL 67 13 19 19.4 1.4 0.2
MAY 70 27 44 38.5 1.6 0.6
JUNE 80 19 25 23.7 1.3 0.3
JULY 75 0 0 0 0 0
AUGUST 72 5 12 6.9 2.4 0.1
SEPTEMBER 78 6 13 7.6 2.1 0.1
OCTOBER 65 8 16 12.3 2 0.2
NOVEMBER 58 0 0 0 0 0
DECEMBER 60 0 0 0 0 0
TOTAL 820 83 144 Standard
Deviation = 1.15
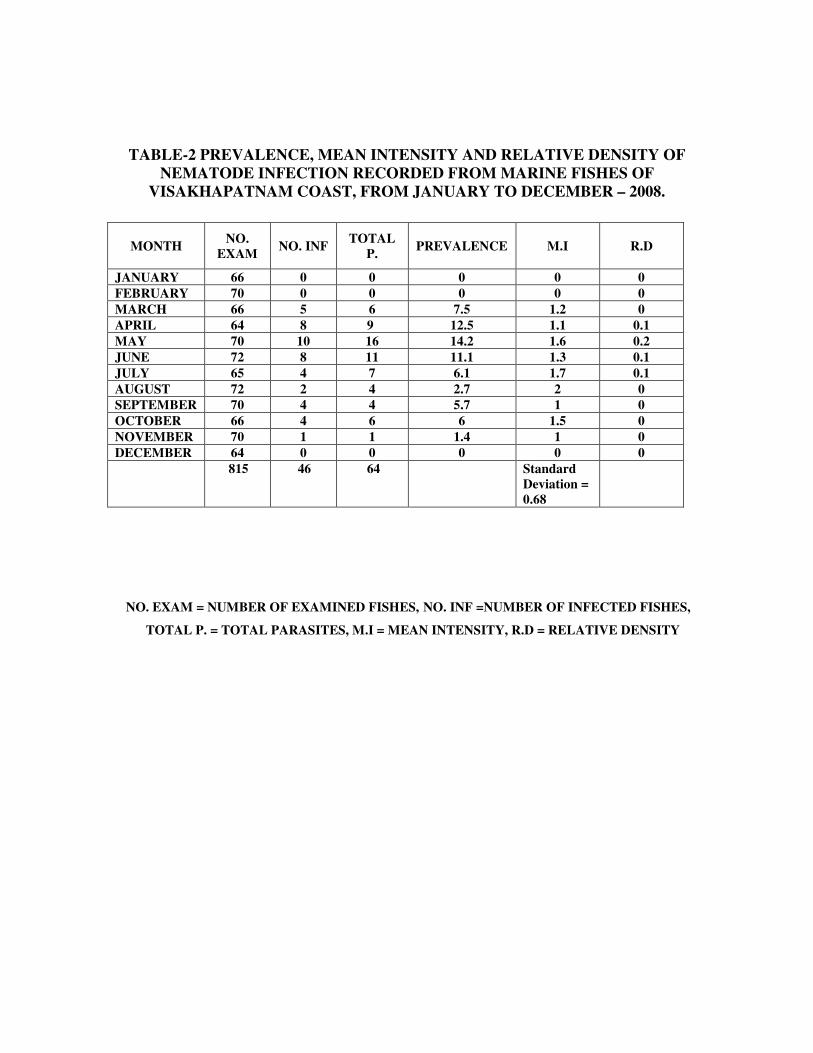
TABLE-2 PREVALENCE, MEAN INTENSITY AND RELATIVE DENSITY OF
NEMATODE INFECTION RECORDED FROM MARINE FISHES OF
VISAKHAPATNAM COAST, FROM JANUARY TO DECEMBER – 2008.
NO. EXAM = NUMBER OF EXAMINED FISHES, NO. INF =NUMBER OF INFECTED FISHES,
TOTAL P. = TOTAL PARASITES, M.I = MEAN INTENSITY, R.D = RELATIVE DENSITY
MONTH NO.
EXAM NO. INF
TOTAL
P. PREVALENCE M.I
R.D
JANUARY 66 0 0 0 0 0
FEBRUARY 70 0 0 0 0 0
MARCH 66 5 6 7.5 1.2 0
APRIL 64 8 9 12.5 1.1 0.1
MAY 70 10 16 14.2 1.6 0.2
JUNE 72 8 11 11.1 1.3 0.1
JULY 65 4 7 6.1 1.7 0.1
AUGUST 72 2 4 2.7 2 0
SEPTEMBER 70 4 4 5.7 1 0
OCTOBER 66 4 6 6 1.5 0
NOVEMBER 70 1 1 1.4 1 0
DECEMBER 64 0 0 0 0 0
815 46 64 Standard
Deviation =
0.68
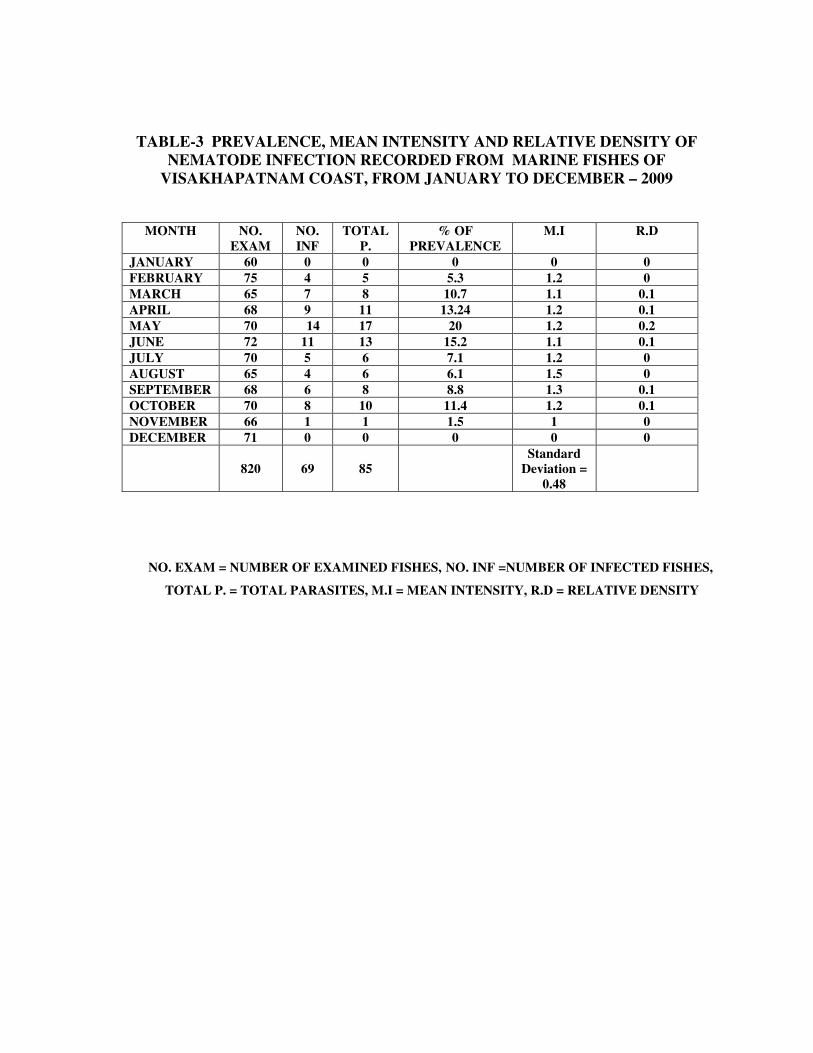
TABLE-3 PREVALENCE, MEAN INTENSITY AND RELATIVE DENSITY OF
NEMATODE INFECTION RECORDED FROM MARINE FISHES OF
VISAKHAPATNAM COAST, FROM JANUARY TO DECEMBER – 2009
NO. EXAM = NUMBER OF EXAMINED FISHES, NO. INF =NUMBER OF INFECTED FISHES,
TOTAL P. = TOTAL PARASITES, M.I = MEAN INTENSITY, R.D = RELATIVE DENSITY
MONTH
NO.
EXAM
NO.
INF
TOTAL
P.
% OF
PREVALENCE
M.I R.D
JANUARY 60 0 0 0 0 0
FEBRUARY 75 4 5 5.3 1.2 0
MARCH 65 7 8 10.7 1.1 0.1
APRIL 68 9 11 13.24 1.2 0.1
MAY 70 14 17 20 1.2 0.2
JUNE 72 11 13 15.2 1.1 0.1
JULY 70 5 6 7.1 1.2 0
AUGUST 65 4 6 6.1 1.5 0
SEPTEMBER 68 6 8 8.8 1.3 0.1
OCTOBER 70 8 10 11.4 1.2 0.1
NOVEMBER 66 1 1 1.5 1 0
DECEMBER 71 0 0 0 0 0
820 69 85
Standard Deviation =
0.48
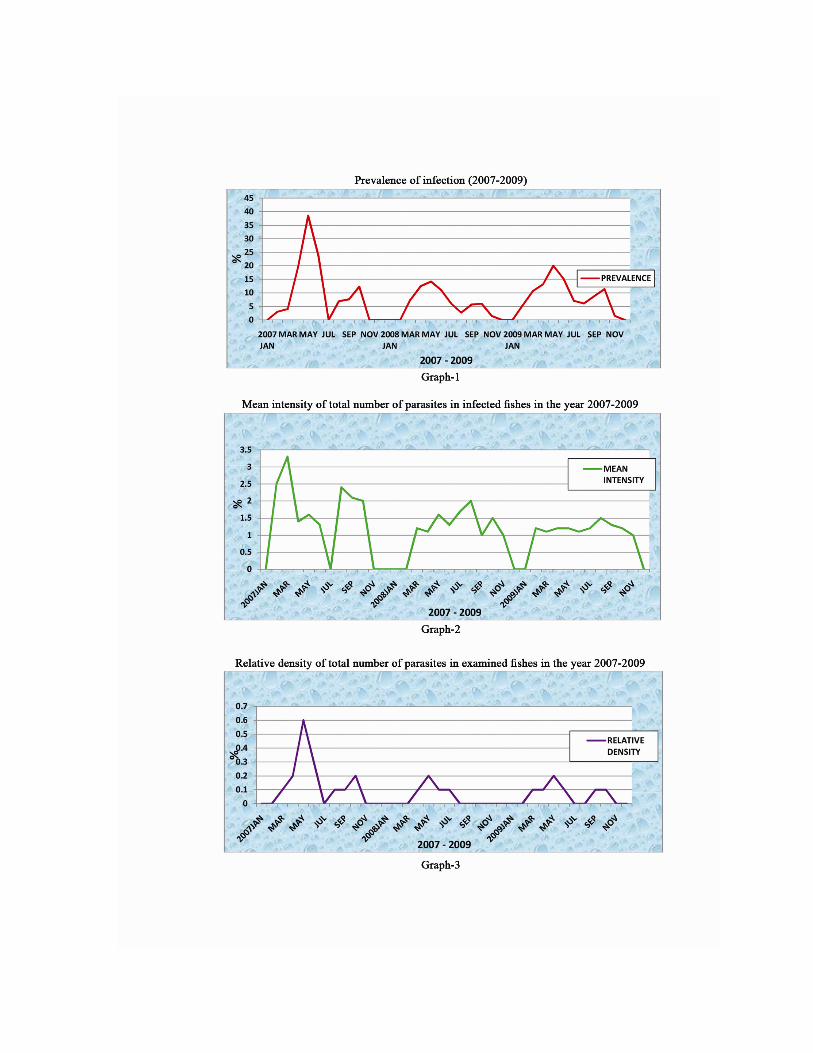
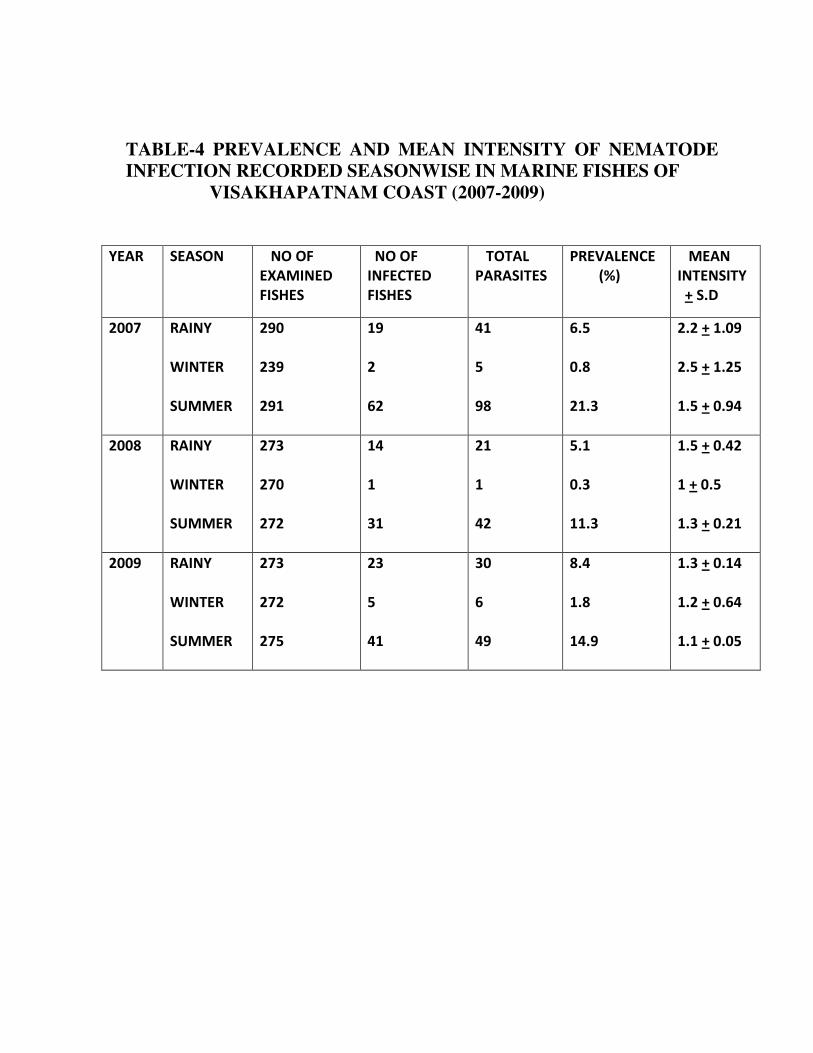
TABLE-4 PREVALENCE AND MEAN INTENSITY OF NEMATODE INFECTION RECORDED SEASONWISE IN MARINE FISHES OF
VISAKHAPATNAM COAST (2007-2009)
YEAR SEASON NO OF
EXAMINED
FISHES
NO OF
INFECTED
FISHES
TOTAL
PARASITES
PREVALENCE
(%)
MEAN
INTENSITY
+ S.D
2007 RAINY
WINTER
SUMMER
290
239
291
19
2
62
41
5
98
6.5
0.8
21.3
2.2 + 1.09
2.5 + 1.25
1.5 + 0.94
2008 RAINY
WINTER
SUMMER
273
270
272
14
1
31
21
1
42
5.1
0.3
11.3
1.5 + 0.42
1 + 0.5
1.3 + 0.21
2009 RAINY
WINTER
SUMMER
273
272
275
23
5
41
30
6
49
8.4
1.8
14.9
1.3 + 0.14
1.2 + 0.64
1.1 + 0.05

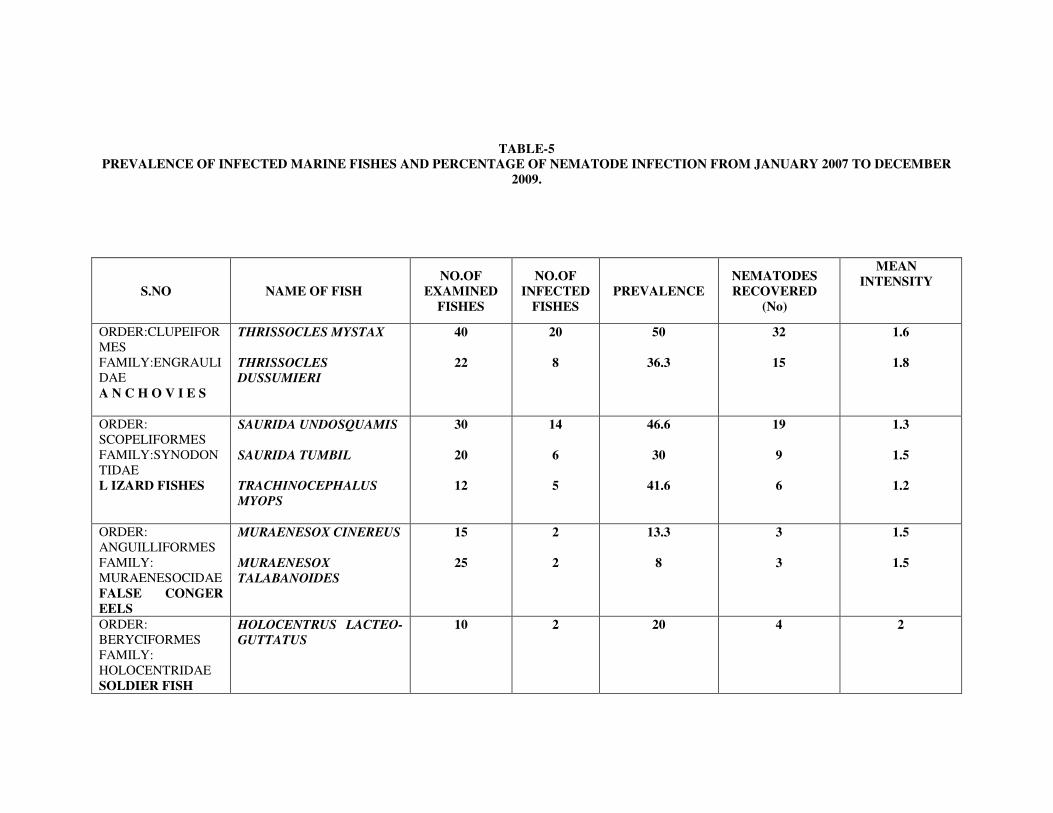
TABLE-5 PREVALENCE OF INFECTED MARINE FISHES AND PERCENTAGE OF NEMATODE INFECTION FROM JANUARY 2007 TO DECEMBER
2009.
S.NO NAME OF FISH
NO.OF
EXAMINED
FISHES
NO.OF
INFECTED
FISHES
PREVALENCE
NEMATODES
RECOVERED
(No)
MEAN
INTENSITY
ORDER:CLUPEIFOR
MES
FAMILY:ENGRAULI
DAE
A N C H O V I E S
THRISSOCLES MYSTAX
THRISSOCLES
DUSSUMIERI
40
22
20
8
50
36.3
32
15
1.6
1.8
ORDER:
SCOPELIFORMES
FAMILY:SYNODON
TIDAE
L IZARD FISHES
SAURIDA UNDOSQUAMIS
SAURIDA TUMBIL
TRACHINOCEPHALUS
MYOPS
30
20
12
14
6
5
46.6
30
41.6
19
9
6
1.3
1.5
1.2
ORDER:
ANGUILLIFORMES
FAMILY:
MURAENESOCIDAE
FALSE CONGER
EELS
MURAENESOX CINEREUS
MURAENESOX
TALABANOIDES
15
25
2
2
13.3
8
3
3
1.5
1.5
ORDER:
BERYCIFORMES
FAMILY:
HOLOCENTRIDAE
SOLDIER FISH
HOLOCENTRUS LACTEO-
GUTTATUS
10 2 20 4 2
ORDER:
MUGILIFORMES
FAMILY:
SPHYRAENIDAE
SEAPIKE
SPHYRAENA LANGSAR
10
3
30
5
1.6
ORDER:
PERCIFORMES
FAMILY:
APOGONIDAE
CARDINAL FISH
APOGON GLAGA 12 5 41.6 5 1
FAMILY:
CARANGIDAE
TREVALLY
DECAPTERUS RUSSELLI
ALECTIS CILIARIS
25
10
11
4
44
40
12
7
1.1
1.7
FAMILY:LUTIANID
AE
SNAPPER
LUTIANUS BOHAR
12
5
41.6
7
1.4
FAMILY:
GERRIDAE
SILVER-BIDDIES
PENTAPRION
LONGIMANUS
30 12 40 15 1.3
FAMILY:
SCIAENIDAE
JEWFISH
NIBEA MACULATA
JOHNIUS DUSSUMIERI
JOHNIUS SINA
JOHNIUS AXILLARIS
JOHNIUS ANEUS
25
10
30
10
10
3
3
10
2
2
12
30
33.3
20
20
5
4
12
4
4
1.7
1.3
1.2
2
2
FAMILY:
MULLIDAE
GOAT FISH
UPENEUS SULPHUREUS
UPENEUS VITTATUS
MULLOIDICTHYS
AURIFLAMMA
30
40
40
15
25
11
50
62.5
27.5
20
30
30
1.3
1.2
2.7
FAMILY:
DREPANIDAE
SPOTTED BAT
FISH
DREPANE PUNCTATA 22 3 13.6 5 1.7
FAMILY :
CHAETODONTIDAE
CORAL FISH
LINOPHORA VAGABUNDA 10 3 30 5 1.7
FAMILY:
TRICHIURIDAE
RIBBON-FISH
TRICHIURUS SAVALA 40 9 22.5 14 1.6
FAMILY:
SCORPAENIDAE
STING-FISH
PTEROIS RUSSELLI
8
3
37.5
6
2
ORDER:PLEURONE
CTIFORMES
FAMILY :
SOLEIDAE
HORNED SOLE
AESOPIA CORNUTA 3 1 33.3 1 1
FAMILY:
CYNOGLOSSIDAE
TONGUE-SOLES
CYNOGLOSSUS
BILINEATUS
30 9 30 11 1.2
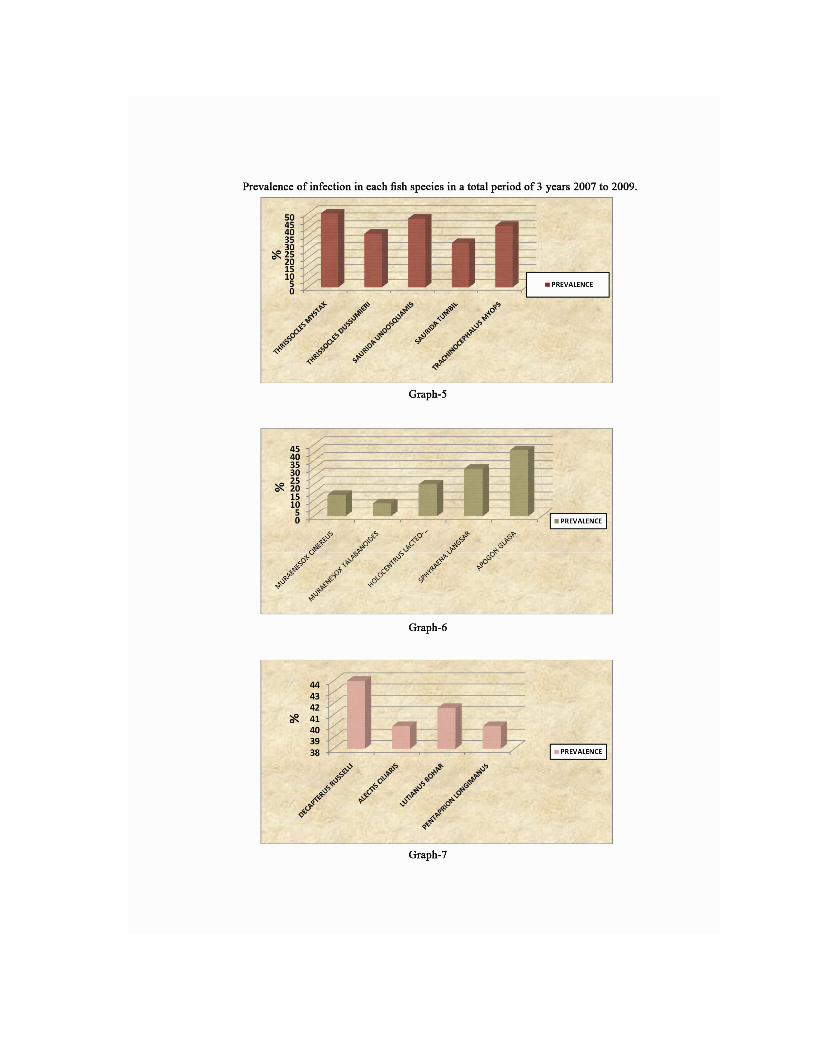
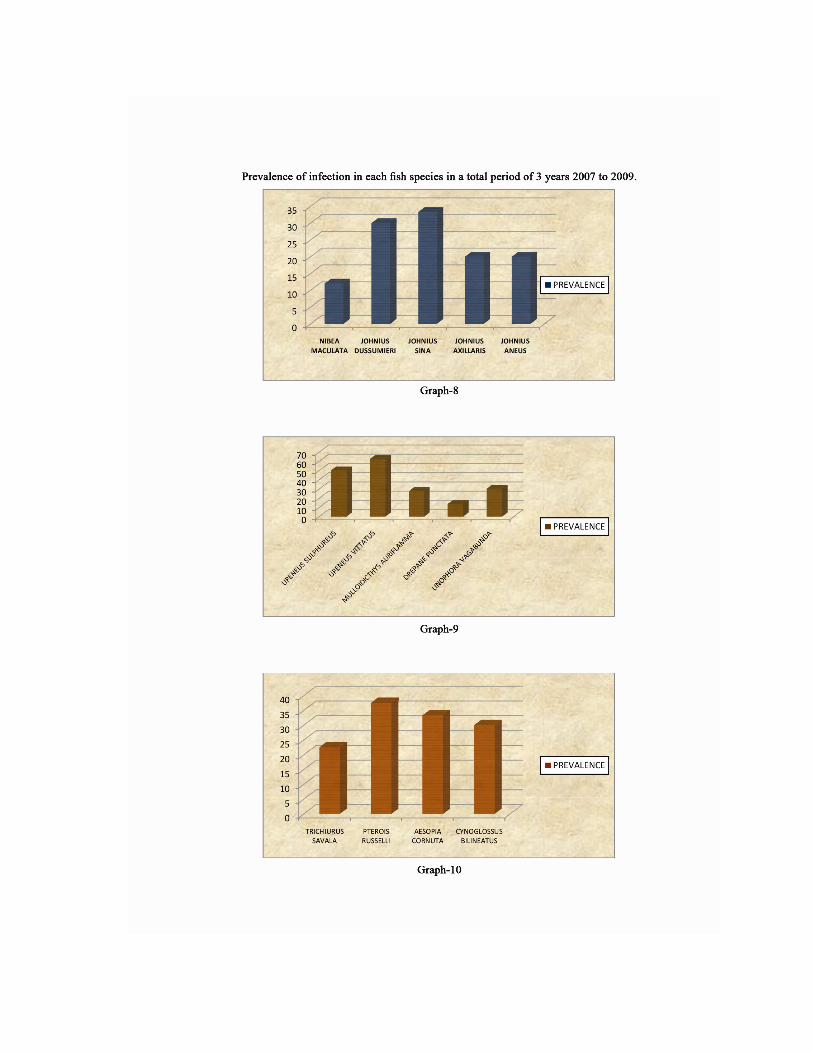
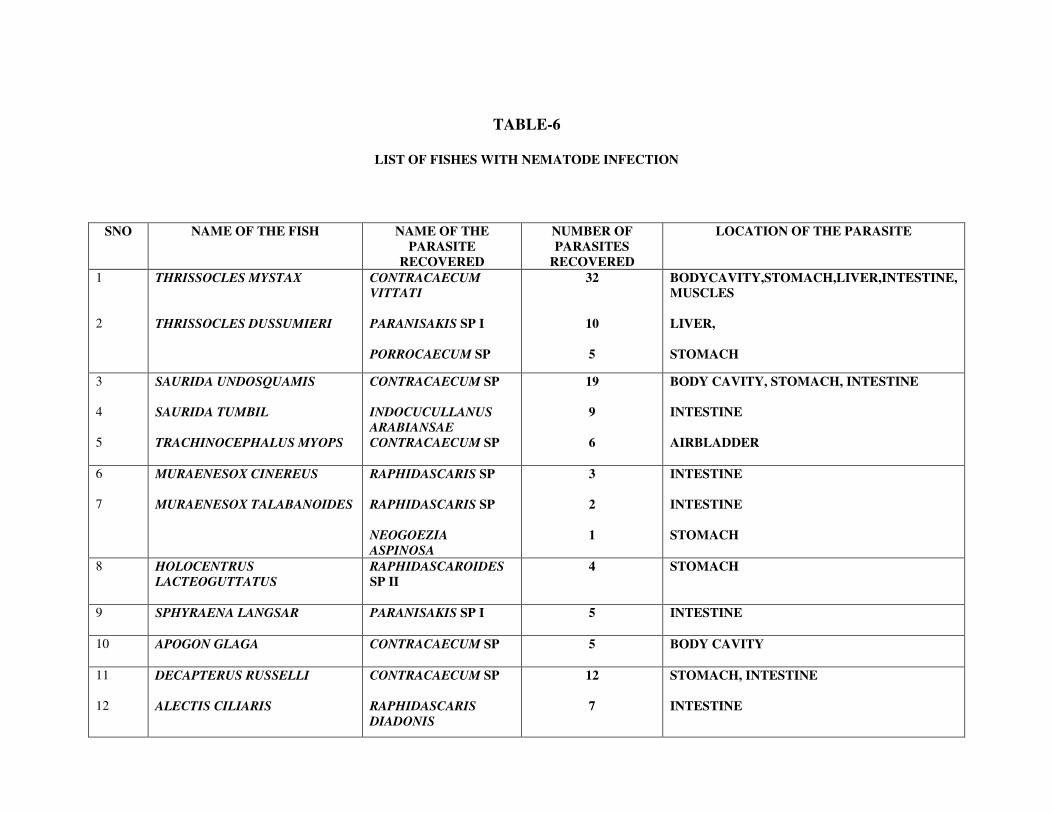
TABLE-6
LIST OF FISHES WITH NEMATODE INFECTION
SNO NAME OF THE FISH NAME OF THE
PARASITE
RECOVERED
NUMBER OF
PARASITES
RECOVERED
LOCATION OF THE PARASITE
1
2
THRISSOCLES MYSTAX
THRISSOCLES DUSSUMIERI
CONTRACAECUM
VITTATI
PARANISAKIS SP I
PORROCAECUM SP
32
10
5
BODYCAVITY,STOMACH,LIVER,INTESTINE, MUSCLES
LIVER,
STOMACH
3
4
5
SAURIDA UNDOSQUAMIS
SAURIDA TUMBIL
TRACHINOCEPHALUS MYOPS
CONTRACAECUM SP
INDOCUCULLANUS
ARABIANSAE
CONTRACAECUM SP
19
9
6
BODY CAVITY, STOMACH, INTESTINE
INTESTINE
AIRBLADDER
6
7
MURAENESOX CINEREUS
MURAENESOX TALABANOIDES
RAPHIDASCARIS SP
RAPHIDASCARIS SP
NEOGOEZIA
ASPINOSA
3
2
1
INTESTINE
INTESTINE
STOMACH
8 HOLOCENTRUS
LACTEOGUTTATUS
RAPHIDASCAROIDES
SP II
4 STOMACH
9 SPHYRAENA LANGSAR
PARANISAKIS SP I
5 INTESTINE
10 APOGON GLAGA
CONTRACAECUM SP 5 BODY CAVITY
11
12
DECAPTERUS RUSSELLI
ALECTIS CILIARIS
CONTRACAECUM SP
RAPHIDASCARIS
DIADONIS
12
7
STOMACH, INTESTINE
INTESTINE
13 LUTIANUS BOHAR
PARACAMALLANUS SP
7
STOMACH
14 PENTAPRION LONGIMANUS
CONTRACAECUM
VITTATI
15 LIVER, INTESTINE
15
16
17
18
19
NIBEA MACULATA
JOHNIUS DUSSUMIERI
JOHNIUS SINA
JOHINUS AXILLARIS
JOHNIUS ANEUS
RAPHIDASCARIS SP
RAPHIDASCAROIDES
SP I
PORROCAECUM SP
CONTRACAECUM
VITTATI
PARANISAKIS SP I
PORROCAECUM SP
3
2
4
12
4
4
INTESTINE
INTESTINE
OVARIES
BODY CAVITY
BODYCAVITY
AIRBLADDER
20
21
22
UPENEUS SULPHUREUS
UPENEUS VITTATUS
MULLOIDICTHYS
AURIFLAMMA
CONTRACAECUM
VITTATI
CONTRACAECUM
VITTATI
GENDRIA SP
RHABDOCHONA SP II
20
30
10
20
STOMACH , LIVER , INTESTINE
BODY CAVITY,STOMACH
LIVER
STOMACH
23 DREPANE PUNCTATA
PARANISAKIS SP I
5
LIVER
24 LINOPHORA VAGABUNDA
RHABDOCHONA SP I 5 INTESTINE
25 TRICHIURUS SAVALA
ALIASCARIS SP
CAMALLANUS SAVALA
N.SP
6 8
LIVER, INTESTINE INTESTINE
26 PTEROIS RUSSELLI
CONTRACAECUM
VITTATI
PARANISAKIS SP II
PROLEPTUS SP
3
2
1
BODY CAVITY
OVARY
STOMACH
27 AESOPIA CORNUTA
CONTRACAECUM
VITTATI 1 BODY CAVITY
28
CYNOGLOSSUS BILINEATUS
CONTRACAECUM SP
11
BODY CAVITY,STOMACH,INTESTINE

EFFECT OF TEMPERATURE ON THE INTENSITY OF INFECTION
IN MARINE FISHES
Environmental factors are of crucial importance influencing the parasitic
infection in fish and the subsequent expression of pathogenic potential. It has
been observed that the nematode infection relates to the environmental factors
like temperature and salinity. These two important parameters distinctly
influence the intensity of nematode infection in the marine fish community. It
has been observed in the laboratory, 2ml of 60+1
0 C of habitat water when
added to an active nematode, which influences to restrict the movement. In a
similar way 400C +1
0 increases the activity of the nematode parasites. This
shows clearly the effect of temperature is directly proportional to the intensity
of activity of a nematode which influences the intensity of infection. This
factor clearly has been observed in the marine environment where the intensity
of nematode infection to the fish is higher during the periods of high
temperature and less infection during the periods of low temperatures.
On the basis of the available information provided by the National
Institute of Oceanography (N I O) that the marine environment especially of
the coastal regions there are two peaks of high temperatures in each year
recorded from 2007 to 2009. In these peak periods the intensity of nematode
infections was also recorded high. This is an indication that the high
temperature of the coastal marine environment plays an important role for the
intensity of nematode infection to the marine fish.
In the year 2007, two peaks of high temperatures were recorded. The
first peak of high temperatures 30.040C and 29.56
0C were recorded during the
month of May and June respectively. In these two months the high intensity of
nematode infection among the fish is recorded as 62.8% and 31.2%
respectively. Among the infected fish Thryssocles mystax and Upeneus
sulphureus were infected by the nematode parasite Contracaecum vittati. The
second peak of high temperatures i.e 29.060C and 29.44
0C were recorded
during the month of September and October respectively. In these two months
the intensity of nematode infection in the fish is also high as 16.6% and 24.6%
respectively. Mulloidicthys auriflamma and Alectis indica were infected by the
nematode parasite Rhabdochona sp and Raphidascaris diadonis (Graph 13).
In the year 2008 the first peak of high temperatures 30.0C and 30.12
0C
were recorded during the month of May and June respectively. In these two
months the high intensity of nematode infection among the fish is recorded as
22.8% and 15.2% respectively. Among the infected fish Saurida undosquamis
and Johnius sina were infected high by the nematode parasite Contracaecum
sp and Contracaecum vittati. The second peak of high temperatures 28.990C
and 28.090C were recorded during the month of September and October
respectively. In these months the intensity of nematode infection in the fish is
also high as 5.7% and 9% respectively. Pentaprion longimanus and
Trachinocephalus myops were infected by the nematode parasite
Contracaecum vittati and Contracaecum sp (Graph 13).
In the year 2009 the first peak of high temperatures 30.160C and 29.24
0C
were recorded during the month of May and June respectively. In these two
months the high intensity of nematode infection among the fish is recorded as
24.2% and 18% respectively. Among the infected fish Upeneus vittatus,
Saurida tumbil and Trichiurus savala were infected high by the nematode
parasite Contracaecum vittati, Indocucullanus arabiansae and Camallanus
savala n.sp. The second peak of high temperatures 29.550C and 29.57
0C were
recorded during the month of September and October respectively. In these
months the intensity of nematode infection in the fish is also high as 11.7% and
14.2% respectively. Among the infected fish Sphyraena langsar, Thyrissocles
dussumieri and Cynoglossus bilineatus were infected high by the nematode
parasite Paranisakis and Contracaecum sp (Graph 13).
The low temperatures were recorded as 25.842720C, 27.85814
0C and
26.720410C during the months of January, November and December
respectively in the year 2007. In these three months the percentage of infection
is nil. In other months less intensity of infection was observed (Graph 13).
The low temperatures were recorded as 26.111390C, 26.695
0C and
26.409770C during the months of January, February and December
respectively in the year 2008. In these three months the percentage of infection
is nil. In other months less intensity of infection was observed (Graph 13).
The low temperatures were recorded as 25.636130C and 26.62484
0C
during the months of January and December respectively in the year 2009. In
these two months the percentage of infection is nil. In other months less
intensity of infection was observed (Graph 13).
EFFECT OF SALINITY ON THE INTENSITY OF INFECTION IN
MARINE FISHES
Salinity is another important parameter for the survival of animals in the
marine environment and regulates their distribution. During this study data has
been collected to examine the influence of salinity on infection and distribution
of nematode parasites in the coastal marine waters of Visakhapatnam.
According to the information of the operators of the trawlers and fishing boats,
they operate between 5 to 90 meters depth. Information on salinity in the
coastal waters of Visakhapatnam coast has been obtained from National
Institute of Oceanography (N I O) for a period of three years i.e from January
2007 to December 2009. During this period there was not much variation in
salinity in the horizontal depth stratification. Salinity ranged between
33.407o/oo to 34.702
o/oo (Graph 13).
