searching for the hidden broad-line region in centaurus a
TRANSCRIPT
Searching for the hidden broad-line region in Centaurus A
D. M. Alexander,1* J. H. Hough,1 S. Young,1 J. A. Bailey,2 C. A. Heisler,3 S. L. Lumsden2
and A. Robinson1
1Department of Physical Sciences, University of Hertfordshire, Hatfield, Hertfordshire AL10 9AB2Anglo-Australian Observatory, PO Box 296, Epping, NSW 2121, Australia3Mount Stromlo and Siding Springs Observatory, Research School for Astronomy and Astrophysics, Institute of Advanced Studies,The Australian National University, Weston Creek Post Office, Canberra, ACT 2611, Australia
Accepted 1998 November 18. Received 1998 July 20
A B S T R A C TWe present the first near-infrared (K-band) spectropolarimetric observations of the nuclearregion of Centaurus A. Although the data are of high signal-to-noise ratio, polarized broad Brgis not detected and we place a 3j upper limit of 3.9 × 10¹15 erg s¹1 cm¹2 in polarized flux. Wefind a correlation between the K-band nuclear continuum and broad Ha line luminosity andestimate the strength of broad Brg based on a number of possible models.
Key words: polarization – techniques: polarimetric – techniques: spectroscopic – galaxies:active – galaxies: individual: Cen A.
1 I N T RO D U C T I O N
Centaurus A, the famous southern radio counterpart to NGC 5128,identified by Bolton, Stanley & Slee (1949), lies at a distance of< 3.1 Mpc (Tonry & Schechter 1990) and is classified as an FR Itype galaxy (Fanaroff & Riley 1974). It is a multifaceted object,showing evidence of a merger, starburst and active galactic nuclei(AGN) activity. Well-studied features include its X-ray and radiojets, radio lobes, optical filaments, dust lane, H II regions, shells andthe X-ray halo. Although observed from gamma-ray to radiowavelengths, and showing variability at most wavelengths, thetrue nature of the central source, obscured from direct view bytens of magnitude of visual extinction, is uncertain.
Optically, Cen A is most notable for the dust lane that intersectsthe host galaxy NGC 5128. Observations of SN1986G, probablyembedded within the dust lane, suggest a visual extinction of3.8 6 0.6 mag to the supernova (Hough et al. 1987), whilstHubble Space Telescope (HST) I- and R-band imaging polarimetrysets boundaries on the visual extinction, through the dust lane,between 0.5 and 7 mag, varying across the extent of the dust lane(Schreier et al. 1996). Hough et al. found that the dust lane has awavelength dependence of polarization in the optical and near-infrared similar to interstellar polarization in our galaxy, with thepolarization vector parallel to the dust lane.
Near infrared polarimetry by Bailey et al. (1986) showed thecentral region to be more highly polarized than the dust lane. Aftercorrection for starlight and polarization in the dust lane, Bailey et al.determined an intrinsic polarization of 9 per cent at a position angleof 1478, perpendicular to the X-ray and radio jet, and interpretedthis as synchrotron emission from a BL Lac source inclined to our
line of sight. Other observations also point towards Cen A contain-ing a BL Lac. Galactic population studies have suggested that FR Itype galaxies are the parent population of BL Lacs (Padovani &Urrey 1990, 1991). Morganti et al. (1991, 1992) observed ionizationstructure in the optical emission line filaments and attributed themto photoionization from an anisotropically emitting source andsuggested a ‘misdirected’ BL Lac as the most likely candidate.Submillimetre observations (Hawarden et al. 1993) have shown anunresolved central source (FWHM < 6 arcsec at 800 and 450 mm)whilst the millimetre to submillimetre spectral slope appears veryflat and non-thermal in origin, typical of a BL Lac. Very long-baseline array (VLBA) radio observations at 43 GHz show amilliarcsec core with a size < 0.01 pc (Kellerman, Zensus &Cohen 1997), currently the smallest extragalactic radio sourceknown.
Near-infrared (IR) images (Turner et al. 1992) have shown thatthe nucleus is not detected at J and H, presumably as a result of highextinction, as suggested by X-ray observations (Blanco, Ward &Wright 1990), but is seen at K and L. Packham et al. (1996), usingnear-IR imaging polarimetry, have shown that the nuclear polariza-tion observed in the K band is most likely owing to scattered lightfrom the nucleus. Whilst this presents a different explanation to thatof Bailey et al. (1986), it does not preclude the possibility that thepolarization is produced by the scattering of light from a BL Lacsource. Packham et al. calculated that even the scattered nuclearradiation is visually extincted by < 16 mag, however, this is lessthan the direct visual extinction to the nucleus, measured by Blanco,Ward & Wright as < 70 mag, from X-ray observations, and Turneret al. as between 38 and 55 mag, from the depth of the 9.7-mmsilicate feature.
Recent HST Paa imaging (Schreier et al. 1998) of the centralregion has shown a bipolar cone-like structure centred upon thenucleus, interpreted as a warped accretion disc. As this structure is
Mon. Not. R. Astron. Soc. 303, L17–L22 (1999)
q 1999 RAS
*Present address: SISSA, via Beirut 2–4, 34014 Trieste, Italy. E-mail:[email protected]
at the same location and of the same size as the enhanced scatteringregion detected by Packham et al. (1996), we believe that it isequally plausible that it is an ionization cone. A possible broad ironKa emission line has been observed by Turner et al. (1997) at6.5 keV. The detection of this X-ray line is dependent on the X-raypower-law continuum fit but suggests an origin in material withupper limit velocities < 11 000 km¹1.
All of the above evidence can be interpreted within the unifiedscheme of AGN as a heavily obscured central continuum region (forexample an accretion disc surrounded by an optically and geome-trically thick torus) with a relativistically beamed blazar jet produ-cing the ionized optical filaments and X-ray and radio jets.Scattered radiation from the nuclear region can reach us, and beobserved in polarized flux, but itself suffers heavy extinction, so canonly be observed at near-IR wavelengths. Of fundamental impor-tance to the unified scheme of AGN is whether all objects contain abroad-line region (BLR). Optical spectropolarimetry has beenimportant in showing that some AGN contain a hidden BLRwhich is not seen directly but in scattered, and hence, polarizedflux (e.g. NGC 1068, Antonucci & Miller 1985). The heavyextinction suffered by the scattered continuum in Cen A meansthat if it does contain a hidden BLR, it will only be detectable inpolarized flux at IR wavelengths.
This paper presents the first near-IR spectropolarimetric obser-vations of the nucleus of Cen A and is structured as follows: Section2 presents observational and data reduction procedures, Section 3presents the results and Section 4 discusses the results.
2 O B S E RVAT I O N S A N D DATA R E D U C T I O N
Observations were made using the near-IR spectropolarimeter,constructed by the University of Hertfordshire as part of theAnglo-Australian observatory IRIS imaging spectrometer (Gil-lingham & Lankshear 1990) which employs a 128 ×128 pixelRockwell array. The polarimeter consists of a half-wave retarder,achromatic between 1.0 and 2.5 mm, which can be stepped to setangular positions. This is placed upstream of IRIS in which amagnesium flouride Wollaston prism is used as an analyser. Forlinear polarization observations are made with the half-waveretarder stepped to 08, 458, 22.58 and 67.58. Only H- and K-bandgrisms are available for IRIS. Paa at 1.87 mm could not beobserved because of the marked terrestrial atmospheric absorp-tion at this wavelength, thus all observations were made of theBrg line in the K band.
The observations were taken on two occasions, 1996 March 28and 1997 April 15, under good transparency but indifferent seeing(varying between < 1 and 3 arcsec). The 3.9-m AAT was used in f/15 mode, with each pixel 0.61 arcmin and with a spectral resolutionR = 300. A dual slot focal plane mask was used on the March 28observation, giving two slots on the sky; each slot of width1.2 arcmin, length 18.9 arcmin and separated by 38.4 arcmin. Asingle-slot focal plane mask was used on April 15, giving a single1.2 by 18.9 arcmin2 aperture on the sky. The slit was positioned atthe same position angle on the sky as the radio jets (PA < 558) at thepoint of K-band peak emission. Multiple observations were taken ineach of the four waveplate positions and were then co-added to giveimproved signal to noise. Owing to the extended nature of Cen A,sky frames were taken by moving off the object to a clear patch ofsky (300 arcmin north or south of the nucleus). The total exposuretime on object was 9000 s on March 28 and 8800 s on April 15. Thetwo sets have been combined to give a total object exposure time of17800 s.
The images were dark-current and bias subtracted on-line. Flat-fields were determined by illuminating the dome ceiling with a desklamp. Additional data reduction consisted of interpolating overknown bad pixels, sky subtraction, cosmic-ray removal and wave-length calibration. The wavelength calibration was performed usingan argon lamp. All the data reduction procedures were batchprocesses using FIGARO (Shortridge et al. 1997) and KAPPA (Currie1995) routines. Flux calibration and atmospheric removal wasperformed using observations of standard stars. Standards ofspectral type A (HD 129540 and HD 107112) were observed onMarch 28 whilst a G-type standard (HD 115394) was observed onApril 15. With the low spectral resolution of IRIS any Brg absorp-tion in the G-type standard were smoothed into the continuum,however, removal of stellar Brg absorption was required on the A-type standards. This was performed with a linear interpolationroutine, using the G-type standard as a measure of line removalaccuracy.
Instrumental polarization was determined by observing unpolar-ized stars and was found to be < 0.1 per cent in the K band. Theefficiency of the polarizer was previously calibrated using a wiregrid and is effectively 100 per cent in all bands. Further details of thespectropolarimetric performance will be given in Hough et al. (inpreparation). The zero of position angle was determined fromobservations of HD 38563C, ChaF36 and Elias14, chosen fromWhittet et al. (1992).
3 R E S U LT S
The results are presented in two sections – first for the total flux andthen for the polarimetry. Data have been binned along the 1.2-arcsecslit by 6 pixels (3.7 arcsec), representing a nuclear spectrum. Thedust lane properties have been obtained by binning along the slit by22 pixels (13.2 arcsec) and then subtracting the nuclear spectrum.All the line properties were obtained using the FIGARO routine GAUSS;the FWHM have been corrected for instrumental resolution, whereFWHM2 = FWHM2
obs – FWHM2res and FWHMres = 1000 km s¹1.
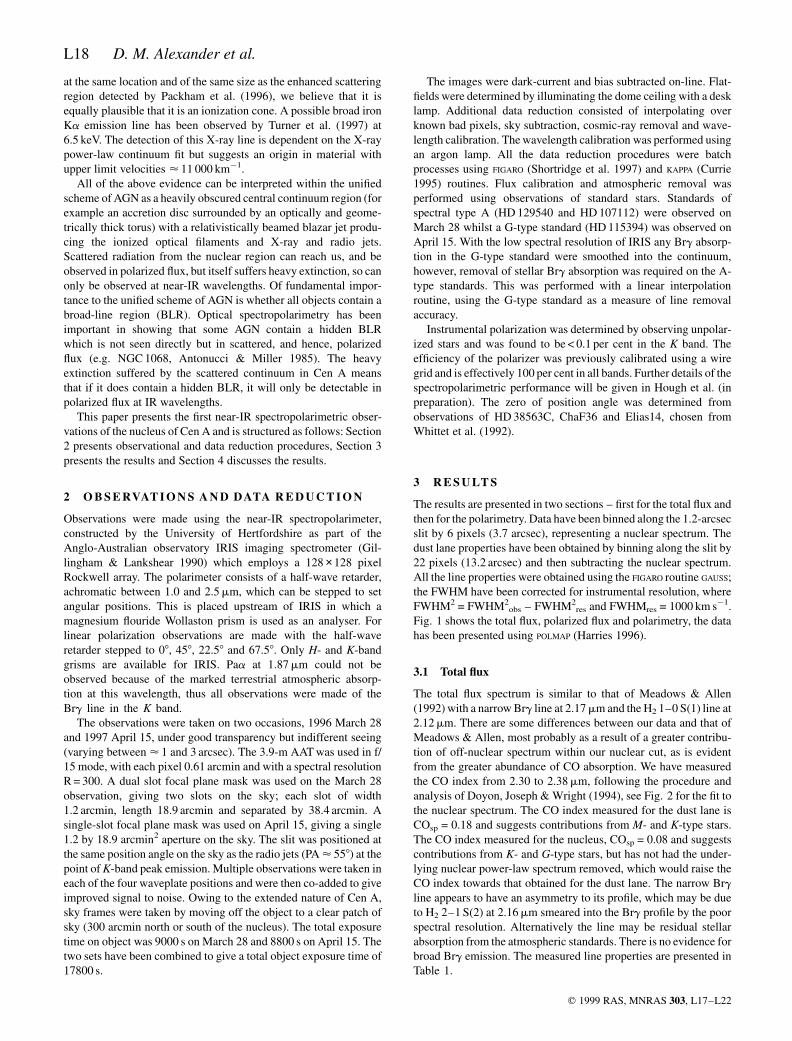
Fig. 1 shows the total flux, polarized flux and polarimetry, the datahas been presented using POLMAP (Harries 1996).
3.1 Total flux
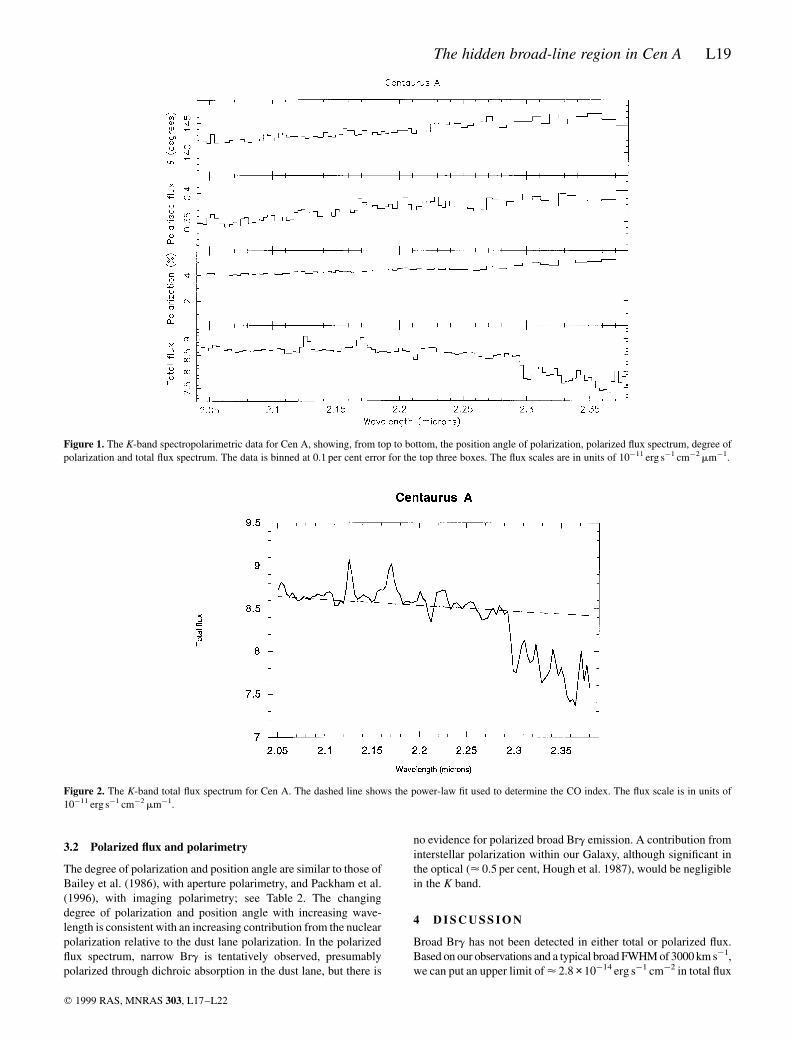
The total flux spectrum is similar to that of Meadows & Allen(1992) with a narrow Brg line at 2.17 mm and the H2 1–0 S(1) line at2.12 mm. There are some differences between our data and that ofMeadows & Allen, most probably as a result of a greater contribu-tion of off-nuclear spectrum within our nuclear cut, as is evidentfrom the greater abundance of CO absorption. We have measuredthe CO index from 2.30 to 2.38 mm, following the procedure andanalysis of Doyon, Joseph & Wright (1994), see Fig. 2 for the fit tothe nuclear spectrum. The CO index measured for the dust lane isCOsp = 0.18 and suggests contributions from M- and K-type stars.The CO index measured for the nucleus, COsp = 0.08 and suggestscontributions from K- and G-type stars, but has not had the under-lying nuclear power-law spectrum removed, which would raise theCO index towards that obtained for the dust lane. The narrow Brgline appears to have an asymmetry to its profile, which may be dueto H2 2–1 S(2) at 2.16 mm smeared into the Brg profile by the poorspectral resolution. Alternatively the line may be residual stellarabsorption from the atmospheric standards. There is no evidence forbroad Brg emission. The measured line properties are presented inTable 1.
L18 D. M. Alexander et al.
q 1999 RAS, MNRAS 303, L17–L22
3.2 Polarized flux and polarimetry
The degree of polarization and position angle are similar to those ofBailey et al. (1986), with aperture polarimetry, and Packham et al.(1996), with imaging polarimetry; see Table 2. The changingdegree of polarization and position angle with increasing wave-length is consistent with an increasing contribution from the nuclearpolarization relative to the dust lane polarization. In the polarizedflux spectrum, narrow Brg is tentatively observed, presumablypolarized through dichroic absorption in the dust lane, but there is
no evidence for polarized broad Brg emission. A contribution frominterstellar polarization within our Galaxy, although significant inthe optical (< 0.5 per cent, Hough et al. 1987), would be negligiblein the K band.
4 D I S C U S S I O N
Broad Brg has not been detected in either total or polarized flux.Based on our observations and a typical broad FWHM of 3000 km s¹1,we can put an upper limit of < 2.8 × 10¹14 erg s¹1 cm¹2 in total flux
The hidden broad-line region in Cen A L19
q 1999 RAS, MNRAS 303, L17–L22
Figure 1. The K-band spectropolarimetric data for Cen A, showing, from top to bottom, the position angle of polarization, polarized flux spectrum, degree ofpolarization and total flux spectrum. The data is binned at 0.1 per cent error for the top three boxes. The flux scales are in units of 10¹11 erg s¹1 cm¹2 mm¹1.
Figure 2. The K-band total flux spectrum for Cen A. The dashed line shows the power-law fit used to determine the CO index. The flux scale is in units of10¹11 erg s¹1 cm¹2 mm¹1.
and < 3.9 × 10¹15 erg s¹1 cm¹2 in polarized flux, both at the 3j
level.In the absence of the detection of broad lines in Cen A we will
estimate the probable flux of polarized broad Brg based on thenuclear continuum flux. In calculating the broad line strength wewill make the assumption that Cen A possesses a Seyfert-likenucleus, which powers the BLR, and a BL Lac beam, which doesnot. Recent time-series observations of BL Lacertae (Corbett et al.1999), the prototypical BL Lac, have shown that the luminosity ofthe broad Ha line is anticorrelated with the optical continuum,believed to be beamed synchrotron emission from the jet, suggest-ing that the broad Ha line is photoionized by a second continuumsource. The broad Ha luminosity is typical of a Seyfert and suggeststhat the second source is a Seyfert-like accretion disc. An obviouscandidate for the production of the featureless polarized continuumin Cen A is synchrotron radiation from the BL Lac source, however,Packham et al. (1996) comphrehensively ruled this out as thedominant nuclear polarization mechanism and we will not considerit any further. Of course, the reason for the absence of broad Brgmay be because Cen A does not possess a BLR, however, theobservations of broad iron Ka (Turner et al. 1997) and a hot andvariable X-ray absorbing gas (Morini, Anselmo & Molteni 1989)suggest appropriate broad-line environments.
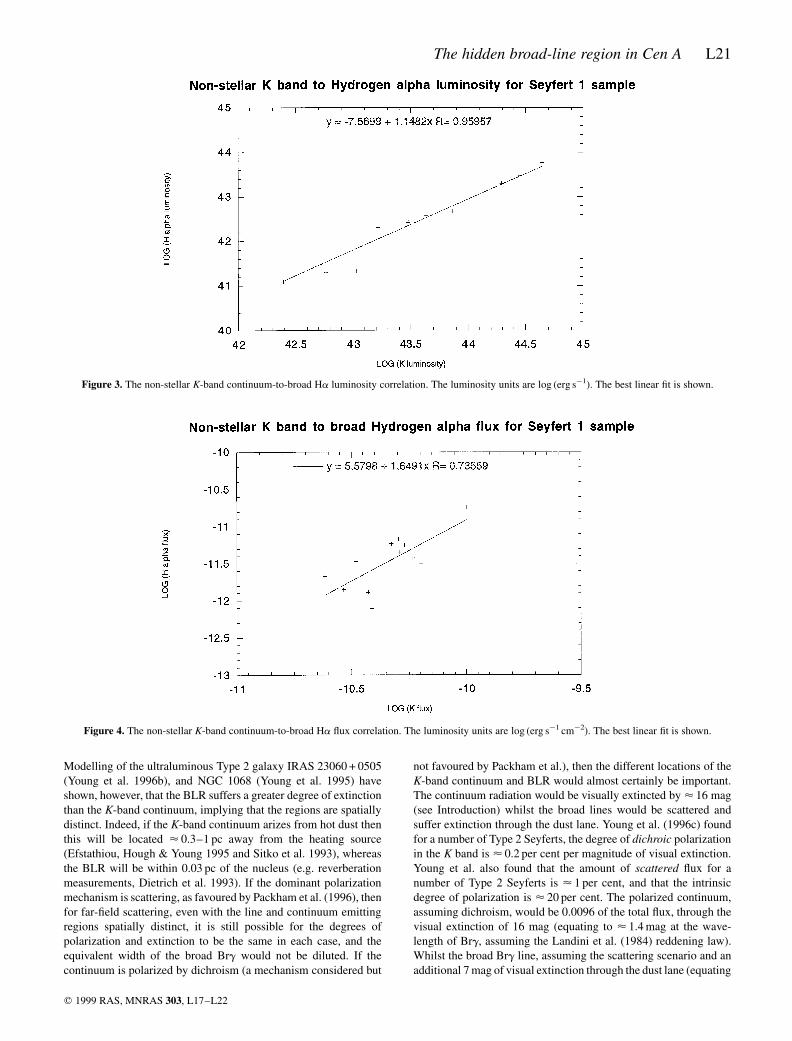
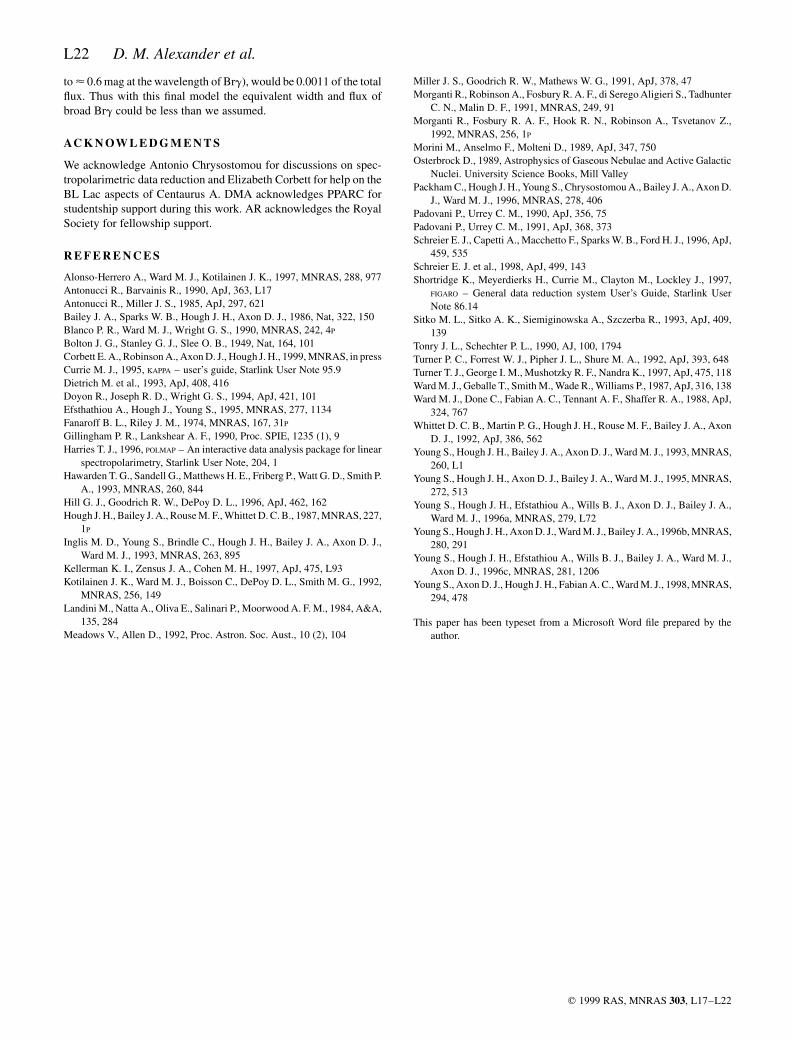
In estimating the expected polarized broad Brg flux we have useda simple model in which two main assumptions are made (i)whatever mechanism polarizes the line and continuum, it polarizesthem equally and (ii) the broad lines and continuum suffer the samedegree of extinction. Based on these assumptions, the broad-lineflux can be simply determined from the equivalent width of broadBrg for a directly observed Type 1 nucleus. In the absence of a largesample of Type 1 broad Brg equivalent widths, we have combinedthe data from Ward et al. (1988) and Alonso-Herrero, Ward &Kotilainen (1997) to produce a sample of K band to broad Ha ratiosfor Seyfert 1s. The K-band data have been corrected for starlight, apotential large contributor to the K-band flux even in a smallaperture, using the starlight fractions given by Kotilainen et al.(1992). The sample shows an excellent correlation in luminosityunits, see Fig. 3,and a reasonable correlation in flux units, seeFig. 4. The poorer correlation in flux units shows that the high and
low luminosity objects are affected differently. This may be becausethere is an additional K-band component, unrelated to the nucleus,that needs to be removed or that the K-band continuum and broadHa region see different radiation sources. However, the correlationshows that, to a first approximation, a relationship between the tworegions exists, yielding a mean K band-to-broad Ha flux ratio of16.6 6 12.6.
Using our K-band nuclear continuum, in polarized flux, andcorrecting for the contribution from the dust lane, we obtain apredicted polarized broad Ha flux of 4.2 × 10¹13 erg s¹1 cm¹2.Assuming the Case B approximation (Osterbrock 1989), whichhas been shown to be appropriate for Type 1 objects, at leastbetween Ha and the IR hydrogen lines (Hill, Goodrich & DePoy1996), a polarized broad Brg flux of 4.0 ×10¹15 erg s¹1 cm¹2 iscalculated. Ward et al. (1987) have shown that the BLR, relative tothe narrow line region, suffers a visual extinction of < 0.5 mag,correcting for this gives a polarized broad Brg flux of5.5 ×10¹15 erg s¹1 cm¹2. Based on our K band-to-broad Ha ratiowe obtain a range of probable broad Brg fluxes of3.1 ×10¹15¹2.3 ×10¹14 erg s¹1 cm¹2. This line flux range suggestswe might well have detected broad Brg based on this model. Thereare, however, other factors which could reduce the equivalent widthof the broad line.
The broad Brg equivalent width could be diluted by the postu-lated BL Lac beam. Although the BL Lac beam is not seen directlyin the K band it may be seen by the scattering particles, which wouldhave a direct view of the beam (Antonucci & Barvainis 1990). Anyscattered radiation of the BL Lac beam would add to the nuclear K-band continuum and dilute the broad Brg equivalent width. How-ever, the FR II galaxy 3C 321 has shown polarized broad Ha (Younget al. 1996a) with a typical Seyfert equivalent width and as theaverage Lorentz beam factor of an FR II galaxy is similar or higherthan an FR I, it is unlikely that dilution from a BL Lac beam wouldbe very high in Cen A.
The broad Brg equivalent width could be diluted by motion ofthe scatterers. A number of Type 2 objects have shown redshiftedbroad lines in polarized flux (e.g. IRAS 11058–1131, Young et al.1993). This redshifting is generally attributed to the motion of thescattering particles. If the scatterers are relativistic, or have a largerange of velocities, then the polarized broad line could be eitherredshifted out of the observation band or smeared into the con-tinuum. Although it has been shown that the electron scatterersbroaden and redshift the polarized broad Hb line in NGC 1068(Miller, Goodrich & Mathews 1991), the effect is not large(v < 1000 km s¹1). Additionally, observations of radio loud Type2s have shown scattered polarized broad lines with very littlescattered broadening and redshifting (e.g. Inglis et al. 1993;Young et al. 1996a, 1998), therefore this is unlikely to be animportant dilution factor in Cen A.
The broad Brg equivalent width could be diluted throughdifferential extinction between the line and continuum region.Our model assumed are that the continuum and BLR are cospatial.
L20 D. M. Alexander et al.
q 1999 RAS, MNRAS 303, L17–L22
Table 1. Total flux line properties.
Line Wavelength (mm) Flux FWHM Wl (A)
H2 1–0 S(1) 2.12 28.5 6 1.7 500 6 400 3.3 6 0.2H2 2–1 S(2)a 2.16 9.5 6 1.7 500 6 400 1.1 6 0.2Brg 2.17 42.0 6 1.7 900 6 400 4.9 6 0.2
Flux in units of 10¹15 erg s¹1 cm¹2; FWHM in units of km s¹1; a = see text.
Table 2. Polarization properties.
Spectrum Polarization percentage Positionangle
Central region 4.25 6 0.01 143.0 6 0.1Dust lane 0.79 6 0.01 130.8 6 1.0
Note: the central region represents a 3.1 arcsec cut along theslit, the dust lane represents a region off this central region.The values presented are binned spectrally between 2.1 and2.2 mm.
Modelling of the ultraluminous Type 2 galaxy IRAS 23060 + 0505(Young et al. 1996b), and NGC 1068 (Young et al. 1995) haveshown, however, that the BLR suffers a greater degree of extinctionthan the K-band continuum, implying that the regions are spatiallydistinct. Indeed, if the K-band continuum arizes from hot dust thenthis will be located < 0.3–1 pc away from the heating source(Efstathiou, Hough & Young 1995 and Sitko et al. 1993), whereasthe BLR will be within 0.03 pc of the nucleus (e.g. reverberationmeasurements, Dietrich et al. 1993). If the dominant polarizationmechanism is scattering, as favoured by Packham et al. (1996), thenfor far-field scattering, even with the line and continuum emittingregions spatially distinct, it is still possible for the degrees ofpolarization and extinction to be the same in each case, and theequivalent width of the broad Brg would not be diluted. If thecontinuum is polarized by dichroism (a mechanism considered but
not favoured by Packham et al.), then the different locations of theK-band continuum and BLR would almost certainly be important.The continuum radiation would be visually extincted by < 16 mag(see Introduction) whilst the broad lines would be scattered andsuffer extinction through the dust lane. Young et al. (1996c) foundfor a number of Type 2 Seyferts, the degree of dichroic polarizationin the K band is < 0.2 per cent per magnitude of visual extinction.Young et al. also found that the amount of scattered flux for anumber of Type 2 Seyferts is < 1 per cent, and that the intrinsicdegree of polarization is < 20 per cent. The polarized continuum,assuming dichroism, would be 0.0096 of the total flux, through thevisual extinction of 16 mag (equating to < 1.4 mag at the wave-length of Brg, assuming the Landini et al. (1984) reddening law).Whilst the broad Brg line, assuming the scattering scenario and anadditional 7 mag of visual extinction through the dust lane (equating
The hidden broad-line region in Cen A L21
q 1999 RAS, MNRAS 303, L17–L22
Figure 3. The non-stellar K-band continuum-to-broad Ha luminosity correlation. The luminosity units are log (erg s¹1). The best linear fit is shown.
Figure 4. The non-stellar K-band continuum-to-broad Ha flux correlation. The luminosity units are log (erg s¹1 cm¹2). The best linear fit is shown.
to < 0.6 mag at the wavelength of Brg), would be 0.0011 of the totalflux. Thus with this final model the equivalent width and flux ofbroad Brg could be less than we assumed.
AC K N OW L E D G M E N T S
We acknowledge Antonio Chrysostomou for discussions on spec-tropolarimetric data reduction and Elizabeth Corbett for help on theBL Lac aspects of Centaurus A. DMA acknowledges PPARC forstudentship support during this work. AR acknowledges the RoyalSociety for fellowship support.
R E F E R E N C E S
Alonso-Herrero A., Ward M. J., Kotilainen J. K., 1997, MNRAS, 288, 977Antonucci R., Barvainis R., 1990, ApJ, 363, L17Antonucci R., Miller J. S., 1985, ApJ, 297, 621Bailey J. A., Sparks W. B., Hough J. H., Axon D. J., 1986, Nat, 322, 150Blanco P. R., Ward M. J., Wright G. S., 1990, MNRAS, 242, 4P
Bolton J. G., Stanley G. J., Slee O. B., 1949, Nat, 164, 101Corbett E. A., Robinson A., Axon D. J., Hough J. H., 1999, MNRAS, in pressCurrie M. J., 1995, KAPPA – user’s guide, Starlink User Note 95.9Dietrich M. et al., 1993, ApJ, 408, 416Doyon R., Joseph R. D., Wright G. S., 1994, ApJ, 421, 101Efsthathiou A., Hough J., Young S., 1995, MNRAS, 277, 1134Fanaroff B. L., Riley J. M., 1974, MNRAS, 167, 31P
Gillingham P. R., Lankshear A. F., 1990, Proc. SPIE, 1235 (1), 9Harries T. J., 1996, POLMAP – An interactive data analysis package for linear
spectropolarimetry, Starlink User Note, 204, 1Hawarden T. G., Sandell G., Matthews H. E., Friberg P., Watt G. D., Smith P.
A., 1993, MNRAS, 260, 844Hill G. J., Goodrich R. W., DePoy D. L., 1996, ApJ, 462, 162Hough J. H., Bailey J. A., Rouse M. F., Whittet D. C. B., 1987, MNRAS, 227,
1P
Inglis M. D., Young S., Brindle C., Hough J. H., Bailey J. A., Axon D. J.,Ward M. J., 1993, MNRAS, 263, 895
Kellerman K. I., Zensus J. A., Cohen M. H., 1997, ApJ, 475, L93Kotilainen J. K., Ward M. J., Boisson C., DePoy D. L., Smith M. G., 1992,
MNRAS, 256, 149Landini M., Natta A., Oliva E., Salinari P., Moorwood A. F. M., 1984, A&A,
135, 284Meadows V., Allen D., 1992, Proc. Astron. Soc. Aust., 10 (2), 104
Miller J. S., Goodrich R. W., Mathews W. G., 1991, ApJ, 378, 47Morganti R., Robinson A., Fosbury R. A. F., di Serego Aligieri S., Tadhunter
C. N., Malin D. F., 1991, MNRAS, 249, 91Morganti R., Fosbury R. A. F., Hook R. N., Robinson A., Tsvetanov Z.,
1992, MNRAS, 256, 1P
Morini M., Anselmo F., Molteni D., 1989, ApJ, 347, 750Osterbrock D., 1989, Astrophysics of Gaseous Nebulae and Active Galactic
Nuclei. University Science Books, Mill ValleyPackham C., Hough J. H., Young S., Chrysostomou A., Bailey J. A., Axon D.
J., Ward M. J., 1996, MNRAS, 278, 406Padovani P., Urrey C. M., 1990, ApJ, 356, 75Padovani P., Urrey C. M., 1991, ApJ, 368, 373Schreier E. J., Capetti A., Macchetto F., Sparks W. B., Ford H. J., 1996, ApJ,
459, 535Schreier E. J. et al., 1998, ApJ, 499, 143Shortridge K., Meyerdierks H., Currie M., Clayton M., Lockley J., 1997,
FIGARO – General data reduction system User’s Guide, Starlink UserNote 86.14
Sitko M. L., Sitko A. K., Siemiginowska A., Szczerba R., 1993, ApJ, 409,139
Tonry J. L., Schechter P. L., 1990, AJ, 100, 1794Turner P. C., Forrest W. J., Pipher J. L., Shure M. A., 1992, ApJ, 393, 648Turner T. J., George I. M., Mushotzky R. F., Nandra K., 1997, ApJ, 475, 118Ward M. J., Geballe T., Smith M., Wade R., Williams P., 1987, ApJ, 316, 138Ward M. J., Done C., Fabian A. C., Tennant A. F., Shaffer R. A., 1988, ApJ,
324, 767Whittet D. C. B., Martin P. G., Hough J. H., Rouse M. F., Bailey J. A., Axon
D. J., 1992, ApJ, 386, 562Young S., Hough J. H., Bailey J. A., Axon D. J., Ward M. J., 1993, MNRAS,
260, L1Young S., Hough J. H., Axon D. J., Bailey J. A., Ward M. J., 1995, MNRAS,
272, 513Young S., Hough J. H., Efstathiou A., Wills B. J., Axon D. J., Bailey J. A.,
Ward M. J., 1996a, MNRAS, 279, L72Young S., Hough J. H., Axon D. J., Ward M. J., Bailey J. A., 1996b, MNRAS,
280, 291Young S., Hough J. H., Efstathiou A., Wills B. J., Bailey J. A., Ward M. J.,
Axon D. J., 1996c, MNRAS, 281, 1206Young S., Axon D. J., Hough J. H., Fabian A. C., Ward M. J., 1998, MNRAS,
294, 478
This paper has been typeset from a Microsoft Word file prepared by theauthor.
L22 D. M. Alexander et al.
q 1999 RAS, MNRAS 303, L17–L22