seafood industry year in review - department of fisheries ... · year’s seafood industry year in...
TRANSCRIPT
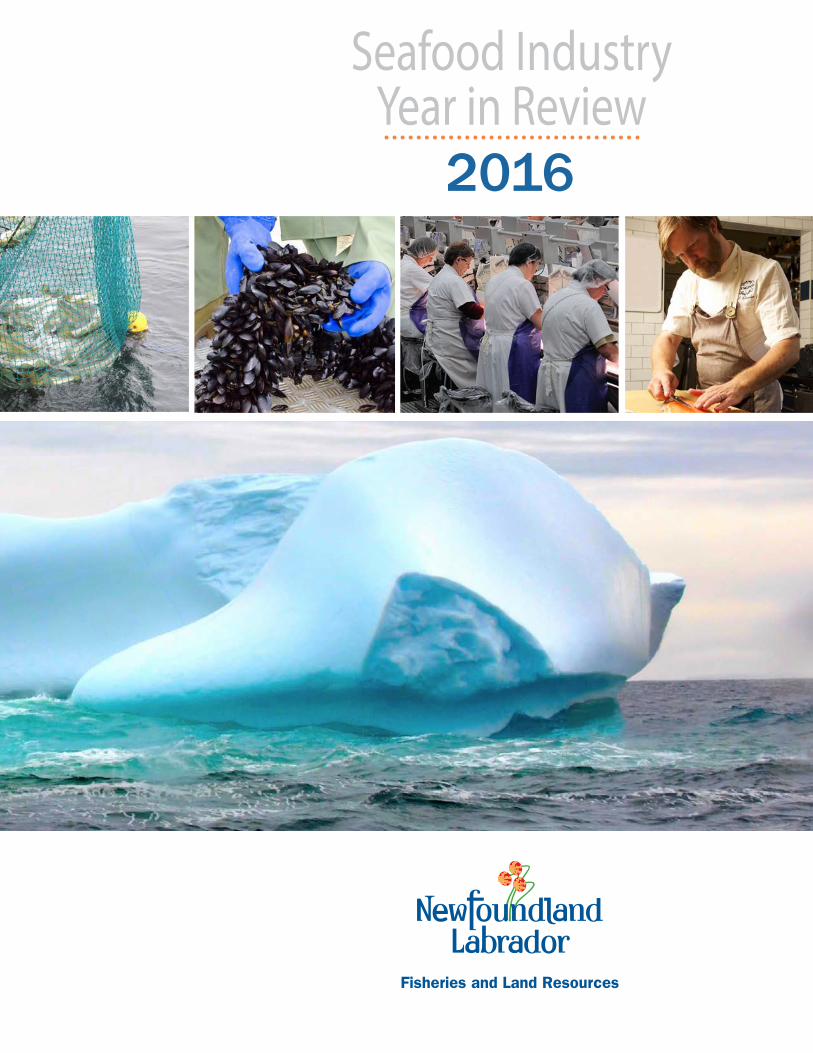
Seafood Industry Year in Review
2016

As Minister of Fisheries and Land Resources, I am proud to present this year’s Seafood Industry Year in Review. This document is intended to provide a comprehensive, yet easy-to-reference overview of our wild and farmed fisheries in 2016 and our vision for continued growth and diversification into the future.
The production value of our seafood industry reached yet another record high in 2016, totalling over $1.4 billion. Nearly 20 per cent of that total came from our aquaculture sector, which continues to grow. The seafood industry is a substantial contributor to our provincial economy, directly employing well over 17,000 people and benefiting many more individuals and enterprises.
Newfoundland and Labrador’s seafood products are exported to more than 40 countries. It is essential that we continue to leverage the industry’s tremendous potential.
The Way Forward: A Vision for Sustainability and Growth in Newfoundland and Labrador sets ambitious long-term goals to achieve a stronger, more diversified province with a high standard of living. We have committed to growing our salmon aquaculture industry to 50,000 tonnes and the mussel industry to over 10,000 tonnes. I am pleased to say that with some significant developments in the aquaculture sector this year, we are maintaining momentum to achieve that goal and beyond. I look forward to working with our salmonid and mussel industries in the coming year to increase growth in these sectors.
We have also made progress towards establishing our provincial Fisheries Advisory Council, which will provide independent guidance for the growth and sustainability of the industry in Newfoundland and Labrador. The council will soon be formed and will immediately begin work on initiatives which will support our industry in its transition to groundfish.
There is significant demand for our province’s high quality and sustainable seafood products throughout the world. Into 2017 and beyond, we will continue our efforts to seek new opportunities and strengthen this valuable industry for the benefit of all Newfoundlanders and Labradorians.
Steve CrockerMHA, District of Carbonear - Trinity - Bay de Verde Minister of Fisheries and Land Resources
MINISTER’S MESSAGE
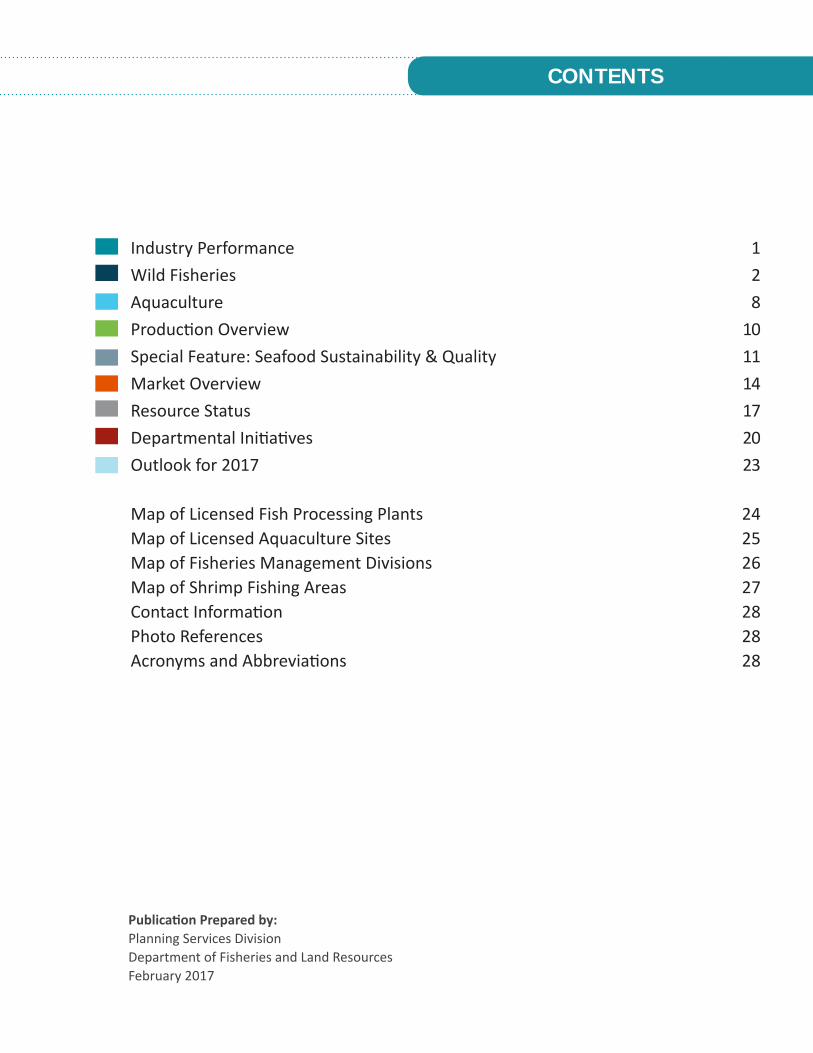
Publication Prepared by: Planning Services Division Department of Fisheries and Land Resources February 2017
CONTENTS
Industry Performance 1Wild Fisheries 2Aquaculture 8Production Overview 10Special Feature: Seafood Sustainability & Quality 11Market Overview 14Resource Status 17Departmental Initiatives 20Outlook for 2017 23
Map of Licensed Fish Processing Plants 24Map of Licensed Aquaculture Sites 25Map of Fisheries Management Divisions 26Map of Shrimp Fishing Areas 27Contact Information 28Photo References 28Acronyms and Abbreviations 28
1
INDUSTRY PERFORMANCE
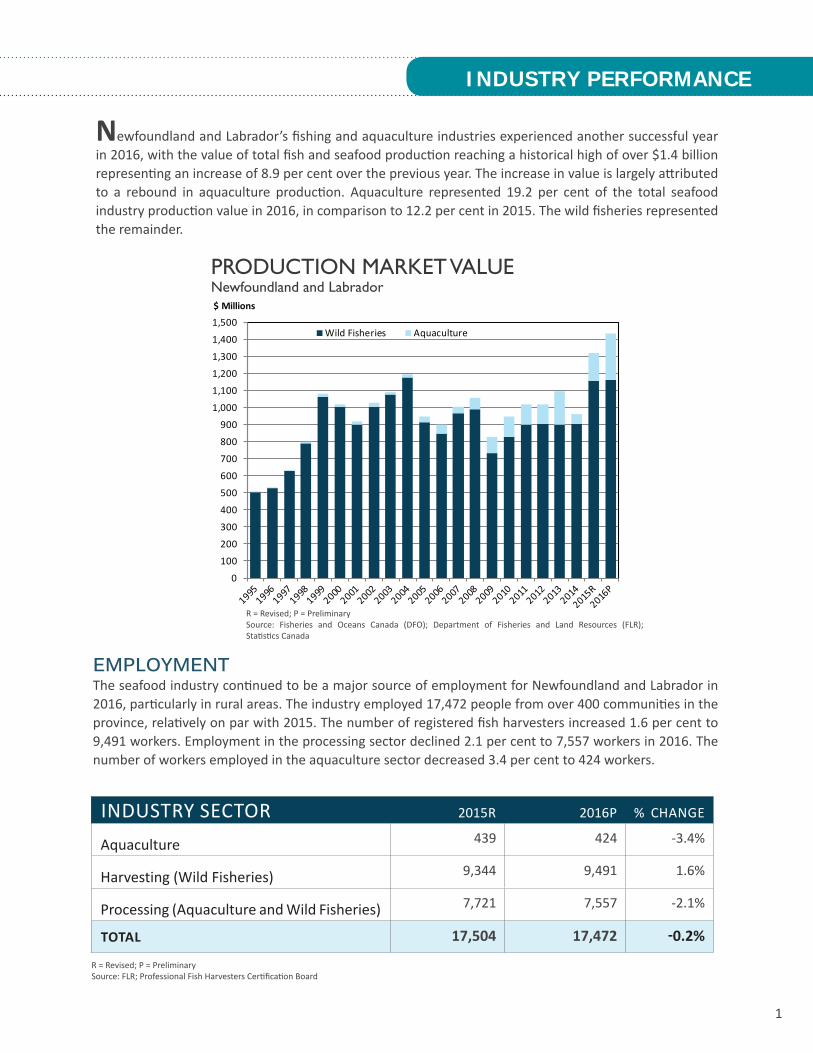
INDUSTRY SECTOR 2015R 2016P % CHANGE
Aquaculture 439 424 -3.4%
Harvesting (Wild Fisheries) 9,344 9,491 1.6%
Processing (Aquaculture and Wild Fisheries) 7,721 7,557 -2.1%
TOTAL 17,504 17,472 -0.2%
Newfoundland and Labrador’s fishing and aquaculture industries experienced another successful year in 2016, with the value of total fish and seafood production reaching a historical high of over $1.4 billion representing an increase of 8.9 per cent over the previous year. The increase in value is largely attributed to a rebound in aquaculture production. Aquaculture represented 19.2 per cent of the total seafood industry production value in 2016, in comparison to 12.2 per cent in 2015. The wild fisheries represented the remainder.
PRODUCTION MARKET VALUENewfoundland and Labrador$ Millions
0
100
200
300
400
500
600
700
800
900
1,000
1,100
1,200
1,300
1,400
1,500Wild Fisheries Aquaculture
R = Revised; P = PreliminarySource: Fisheries and Oceans Canada (DFO); Department of Fisheries and Land Resources (FLR); Statistics Canada
R = Revised; P = PreliminarySource: FLR; Professional Fish Harvesters Certification Board
EMPLOYMENTThe seafood industry continued to be a major source of employment for Newfoundland and Labrador in 2016, particularly in rural areas. The industry employed 17,472 people from over 400 communities in the province, relatively on par with 2015. The number of registered fish harvesters increased 1.6 per cent to 9,491 workers. Employment in the processing sector declined 2.1 per cent to 7,557 workers in 2016. The number of workers employed in the aquaculture sector decreased 3.4 per cent to 424 workers.
2
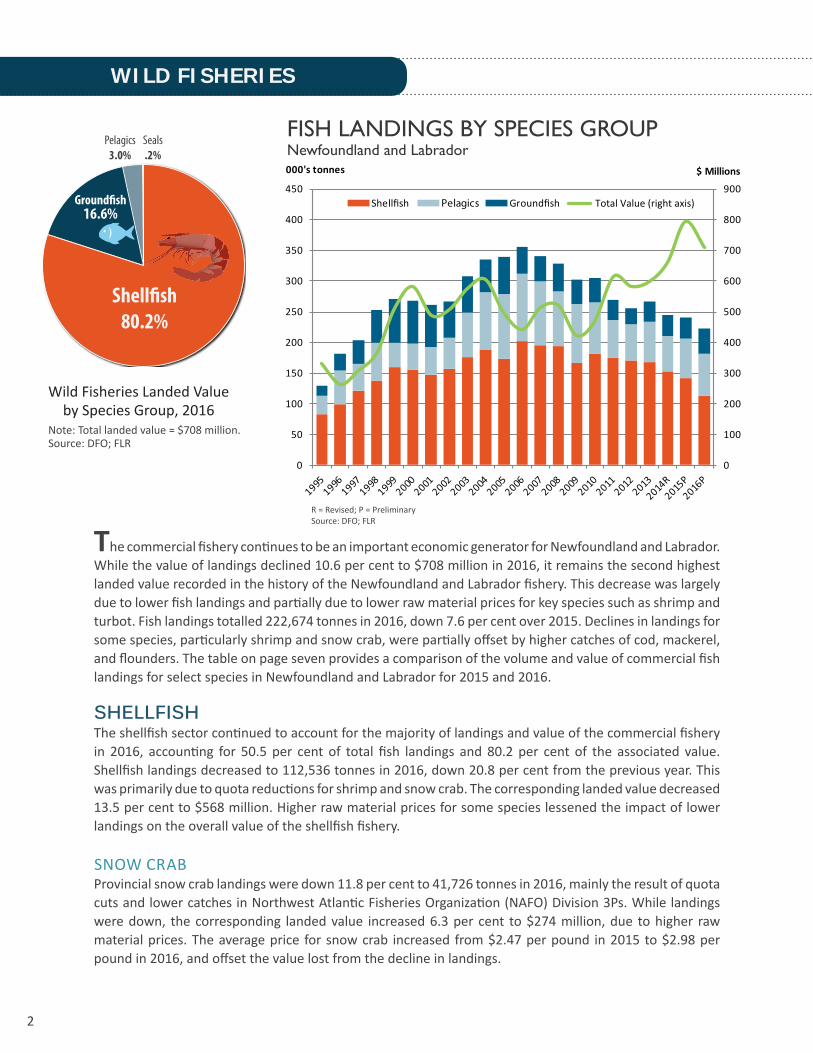
FISH LANDINGS BY SPECIES GROUPNewfoundland and Labrador
0
100
200
300
400
500
600
700
800
900
0
50
100
150
200
250
300
350
400
450
$ Millions000's tonnes
Shellfish Pelagics Groundfish Total Value (right axis)
Shell�sh80.2%
Pelagics3.0%
Seals.2%
Ground�sh16.6%
Note: Total landed value = $708 million. Source: DFO; FLR
Wild Fisheries Landed Value by Species Group, 2016
R = Revised; P = PreliminarySource: DFO; FLR
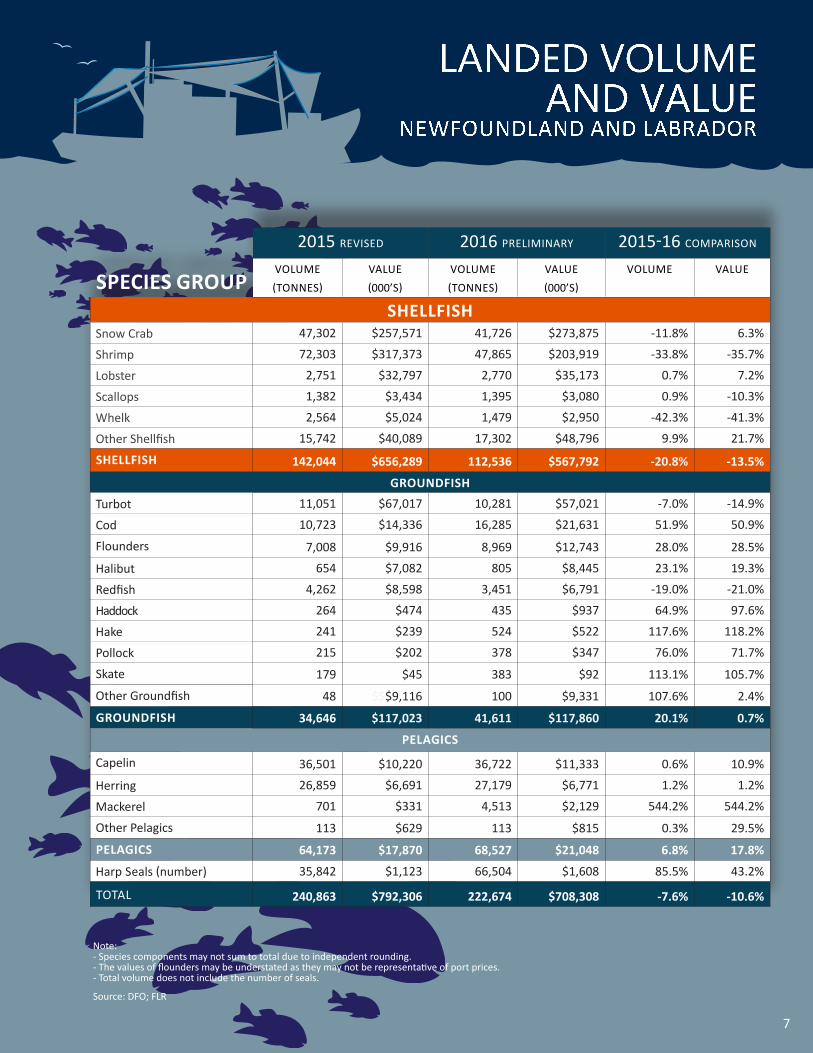
The commercial fishery continues to be an important economic generator for Newfoundland and Labrador. While the value of landings declined 10.6 per cent to $708 million in 2016, it remains the second highest landed value recorded in the history of the Newfoundland and Labrador fishery. This decrease was largely due to lower fish landings and partially due to lower raw material prices for key species such as shrimp and turbot. Fish landings totalled 222,674 tonnes in 2016, down 7.6 per cent over 2015. Declines in landings for some species, particularly shrimp and snow crab, were partially offset by higher catches of cod, mackerel, and flounders. The table on page seven provides a comparison of the volume and value of commercial fish landings for select species in Newfoundland and Labrador for 2015 and 2016.
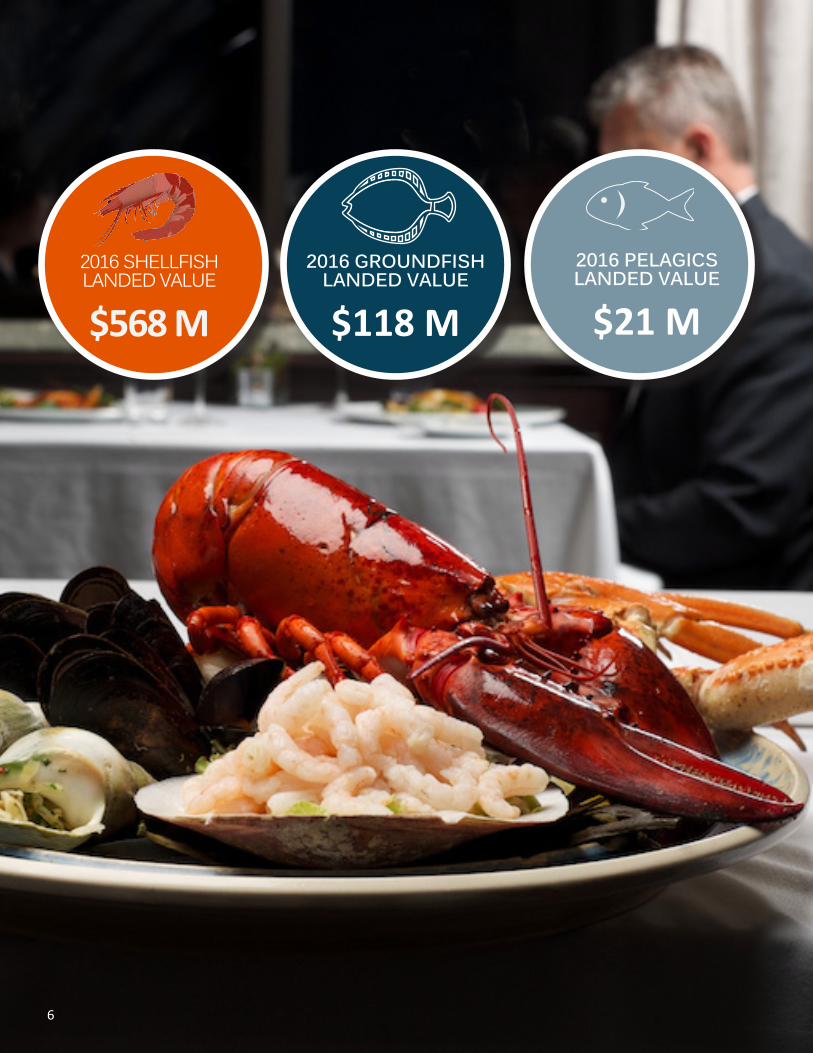
SHELLFISHThe shellfish sector continued to account for the majority of landings and value of the commercial fishery in 2016, accounting for 50.5 per cent of total fish landings and 80.2 per cent of the associated value. Shellfish landings decreased to 112,536 tonnes in 2016, down 20.8 per cent from the previous year. This was primarily due to quota reductions for shrimp and snow crab. The corresponding landed value decreased 13.5 per cent to $568 million. Higher raw material prices for some species lessened the impact of lower landings on the overall value of the shellfish fishery.
SNOW CRABProvincial snow crab landings were down 11.8 per cent to 41,726 tonnes in 2016, mainly the result of quota cuts and lower catches in Northwest Atlantic Fisheries Organization (NAFO) Division 3Ps. While landings were down, the corresponding landed value increased 6.3 per cent to $274 million, due to higher raw material prices. The average price for snow crab increased from $2.47 per pound in 2015 to $2.98 per pound in 2016, and offset the value lost from the decline in landings.
WILD FISHERIES
3
.
WILD FISHERIES
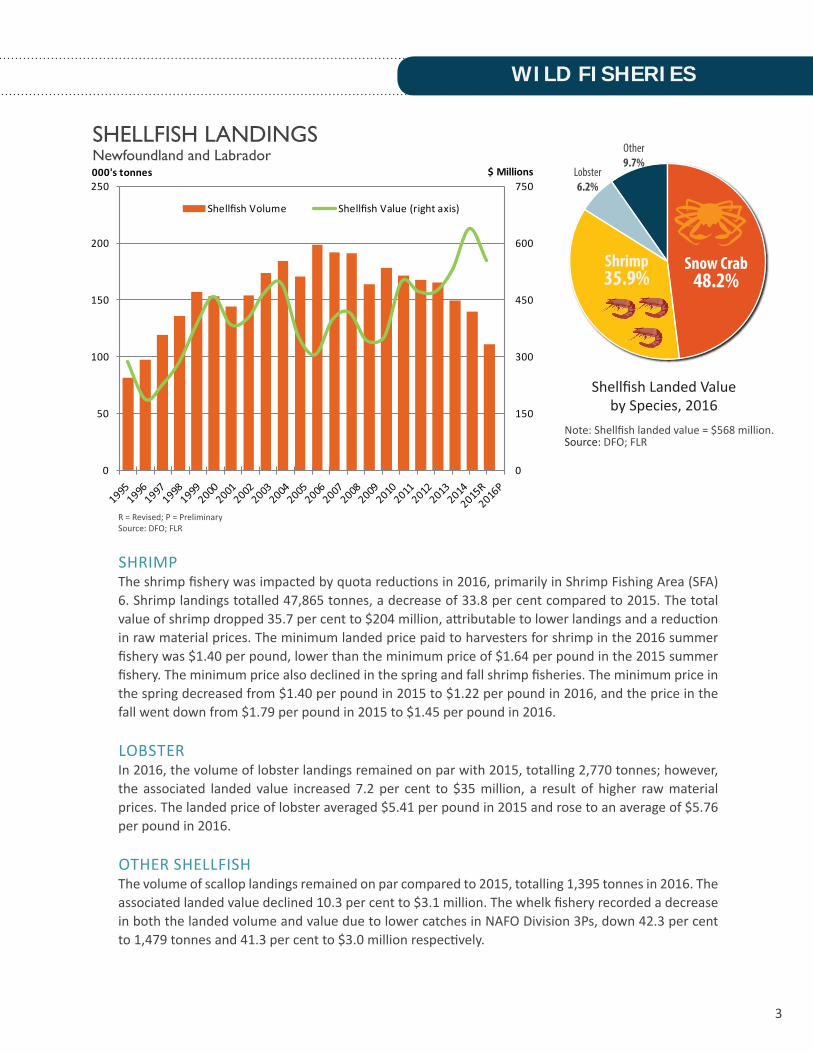
SHELLFISH LANDINGSNewfoundland and Labrador
0
150
300
450
600
750
0
50
100
150
200
250$ Millions000's tonnes
Shellfish Volume Shellfish Value (right axis)
Note: Shellfish landed value = $568 million. Source: DFO; FLR
Shellfish Landed Value by Species, 2016
R = Revised; P = PreliminarySource: DFO; FLR
Shrimp35.9%
Lobster 6.2%
Other9.7%
Snow Crab48.2%
SHRIMPThe shrimp fishery was impacted by quota reductions in 2016, primarily in Shrimp Fishing Area (SFA) 6. Shrimp landings totalled 47,865 tonnes, a decrease of 33.8 per cent compared to 2015. The total value of shrimp dropped 35.7 per cent to $204 million, attributable to lower landings and a reduction in raw material prices. The minimum landed price paid to harvesters for shrimp in the 2016 summer fishery was $1.40 per pound, lower than the minimum price of $1.64 per pound in the 2015 summer fishery. The minimum price also declined in the spring and fall shrimp fisheries. The minimum price in the spring decreased from $1.40 per pound in 2015 to $1.22 per pound in 2016, and the price in the fall went down from $1.79 per pound in 2015 to $1.45 per pound in 2016.
LOBSTERIn 2016, the volume of lobster landings remained on par with 2015, totalling 2,770 tonnes; however, the associated landed value increased 7.2 per cent to $35 million, a result of higher raw material prices. The landed price of lobster averaged $5.41 per pound in 2015 and rose to an average of $5.76 per pound in 2016. OTHER SHELLFISHThe volume of scallop landings remained on par compared to 2015, totalling 1,395 tonnes in 2016. The associated landed value declined 10.3 per cent to $3.1 million. The whelk fishery recorded a decrease in both the landed volume and value due to lower catches in NAFO Division 3Ps, down 42.3 per cent to 1,479 tonnes and 41.3 per cent to $3.0 million respectively.
4
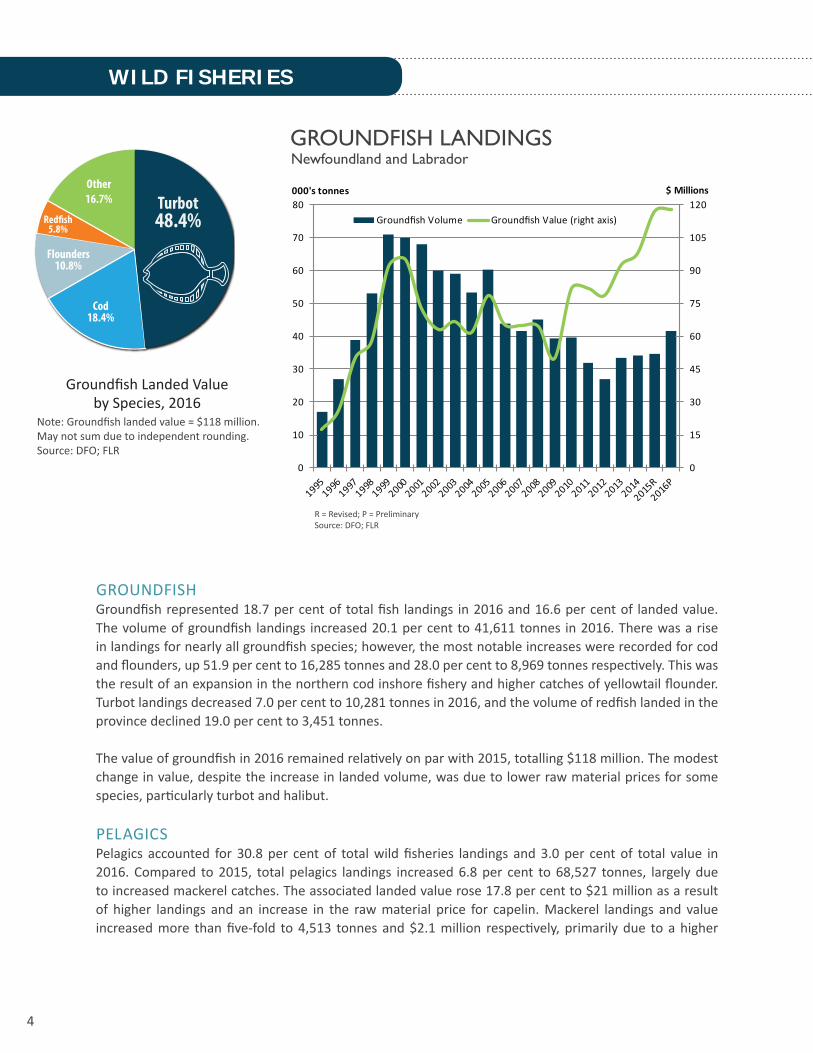
GROUNDFISH LANDINGSNewfoundland and Labrador
0
15
30
45
60
75
90
105
120
0
10
20
30
40
50
60
70
80$ Millions000's tonnes
Groundfish Volume Groundfish Value (right axis)
Groundfish Landed Value by Species, 2016
R = Revised; P = PreliminarySource: DFO; FLR
Note: Groundfish landed value = $118 million.May not sum due to independent rounding.Source: DFO; FLR
Turbot48.4%Red�sh
5.8%
Other16.7%
Cod18.4%
Flounders10.8%
WILD FISHERIES
GROUNDFISHGroundfish represented 18.7 per cent of total fish landings in 2016 and 16.6 per cent of landed value. The volume of groundfish landings increased 20.1 per cent to 41,611 tonnes in 2016. There was a rise in landings for nearly all groundfish species; however, the most notable increases were recorded for cod and flounders, up 51.9 per cent to 16,285 tonnes and 28.0 per cent to 8,969 tonnes respectively. This was the result of an expansion in the northern cod inshore fishery and higher catches of yellowtail flounder. Turbot landings decreased 7.0 per cent to 10,281 tonnes in 2016, and the volume of redfish landed in the province declined 19.0 per cent to 3,451 tonnes.
The value of groundfish in 2016 remained relatively on par with 2015, totalling $118 million. The modest change in value, despite the increase in landed volume, was due to lower raw material prices for some species, particularly turbot and halibut.
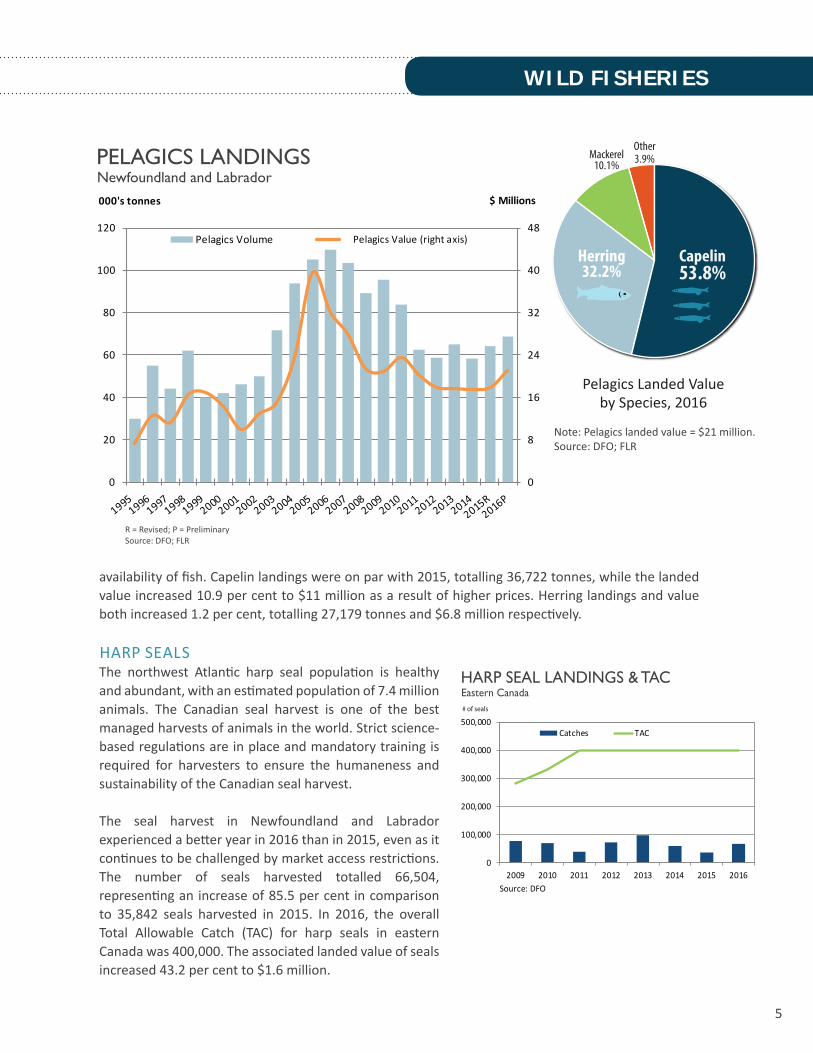
PELAGICSPelagics accounted for 30.8 per cent of total wild fisheries landings and 3.0 per cent of total value in 2016. Compared to 2015, total pelagics landings increased 6.8 per cent to 68,527 tonnes, largely due to increased mackerel catches. The associated landed value rose 17.8 per cent to $21 million as a result of higher landings and an increase in the raw material price for capelin. Mackerel landings and value increased more than five-fold to 4,513 tonnes and $2.1 million respectively, primarily due to a higher
5
Capelin53.8%
Other3.9%
Herring32.2%
Mackerel10.1%PELAGICS LANDINGS
Newfoundland and Labrador
0
8
16
24
32
40
48
0
20
40
60
80
100
120
$ Millions000's tonnes
Pelagics Volume Pelagics Value (right axis)
Pelagics Landed Value by Species, 2016
R = Revised; P = PreliminarySource: DFO; FLR
Note: Pelagics landed value = $21 million.Source: DFO; FLR
availability of fish. Capelin landings were on par with 2015, totalling 36,722 tonnes, while the landed value increased 10.9 per cent to $11 million as a result of higher prices. Herring landings and value both increased 1.2 per cent, totalling 27,179 tonnes and $6.8 million respectively.
HARP SEALSThe northwest Atlantic harp seal population is healthy and abundant, with an estimated population of 7.4 million animals. The Canadian seal harvest is one of the best managed harvests of animals in the world. Strict science-based regulations are in place and mandatory training is required for harvesters to ensure the humaneness and sustainability of the Canadian seal harvest.
The seal harvest in Newfoundland and Labrador experienced a better year in 2016 than in 2015, even as it continues to be challenged by market access restrictions. The number of seals harvested totalled 66,504, representing an increase of 85.5 per cent in comparison to 35,842 seals harvested in 2015. In 2016, the overall Total Allowable Catch (TAC) for harp seals in eastern Canada was 400,000. The associated landed value of seals increased 43.2 per cent to $1.6 million.
WILD FISHERIES
HARP SEAL LANDINGS & TACEastern Canada
Source: DFO
0
100,000
200,000
300,000
400,000
500,000
2009 2010 2011 2012 2013 2014 2015 2016
Catches TAC
# of seals
6
2016 SHELLFISH LANDED VALUE
$568 M
2016 PELAGICS LANDED VALUE
$21 M
2016 GROUNDFISH LANDED VALUE
$118 M
6
7
LANDED VOLUME AND VALUE
NEWFOUNDLAND AND LABRADOR
Note: - Species components may not sum to total due to independent rounding.- The values of flounders may be understated as they may not be representative of port prices.- Total volume does not include the number of seals.
Source: DFO; FLR
SPECIES GROUP
2015 REVISED 2016 PRELIMINARY 2015-16 COMPARISON
VOLUME (TONNES)
VALUE (000’S)
VOLUME (TONNES)
VALUE (000’S)
VOLUME VALUE
SHELLFISHSnow Crab 47,302 $257,571 41,726 $273,875 -11.8% 6.3%
Shrimp 72,303 $317,373 47,865 $203,919 -33.8% -35.7%
Lobster 2,751 $32,797 2,770 $35,173 0.7% 7.2%
Scallops 1,382 $3,434 1,395 $3,080 0.9% -10.3%
Whelk 2,564 $5,024 1,479 $2,950 -42.3% -41.3%
Other Shellfish 15,742 $40,089 17,302 $48,796 9.9% 21.7%
SHELLFISH 142,044 $656,289 112,536 $567,792 -20.8% -13.5%
GROUNDFISH
Turbot 11,051 $67,017 10,281 $57,021 -7.0% -14.9%
Cod 10,723 $14,336 16,285 $21,631 51.9% 50.9%
Flounders 7,008 $9,916 8,969 $12,743 28.0% 28.5%
Halibut 654 $7,082 805 $8,445 23.1% 19.3%
Redfish 4,262 $8,598 3,451 $6,791 -19.0% -21.0%
Haddock 264 $474 435 $937 64.9% 97.6%
Hake 241 $239 524 $522 117.6% 118.2%
Pollock 215 $202 378 $347 76.0% 71.7%
Skate 179 $45 383 $92 113.1% 105.7%
Other Groundfish 48 $$$9,116 100 $9,331 107.6% 2.4%
GROUNDFISH 34,646 $117,023 41,611 $117,860 20.1% 0.7%
PELAGICS
Capelin 36,501 $10,220 36,722 $11,333 0.6% 10.9%
Herring 26,859 $6,691 27,179 $6,771 1.2% 1.2%
Mackerel 701 $331 4,513 $2,129 544.2% 544.2%
Other Pelagics 113 $629 113 $815 0.3% 29.5%
PELAGICS 64,173 $17,870 68,527 $21,048 6.8% 17.8%
Harp Seals (number) 35,842 $1,123 66,504 $1,608 85.5% 43.2%
TOTAL 240,863 $792,306 222,674 $708,308 -7.6% -10.6%
7
8
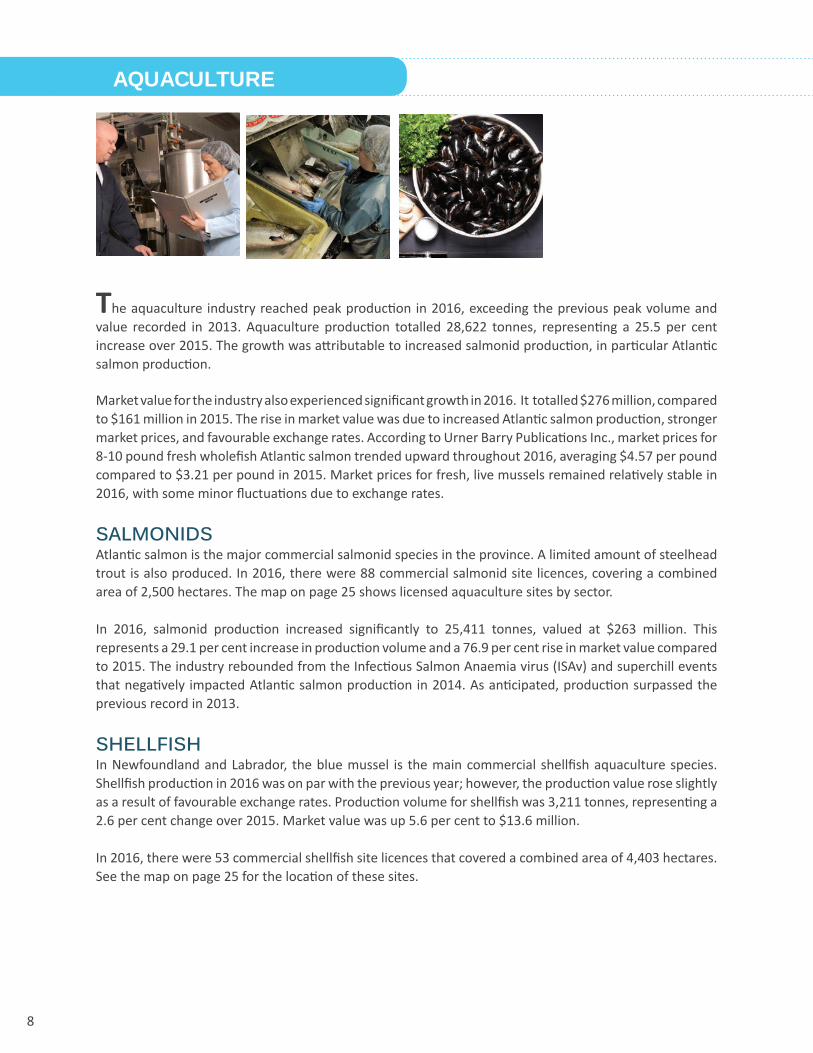
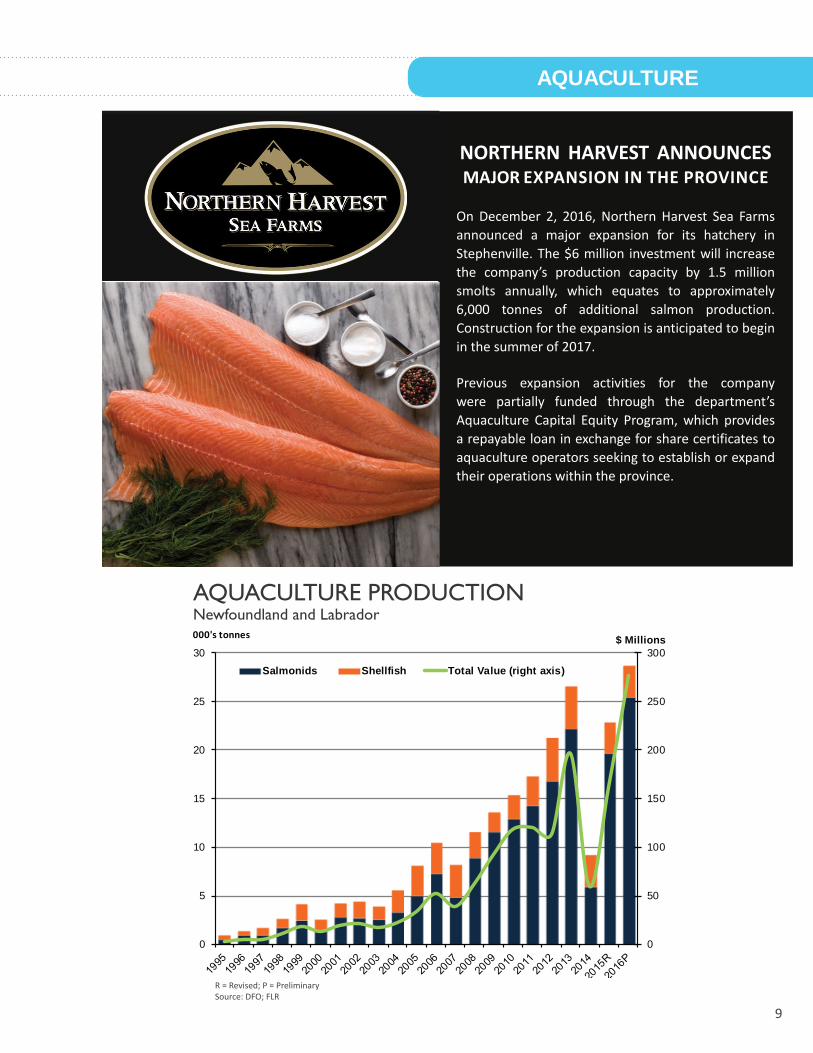
The aquaculture industry reached peak production in 2016, exceeding the previous peak volume and value recorded in 2013. Aquaculture production totalled 28,622 tonnes, representing a 25.5 per cent increase over 2015. The growth was attributable to increased salmonid production, in particular Atlantic salmon production.
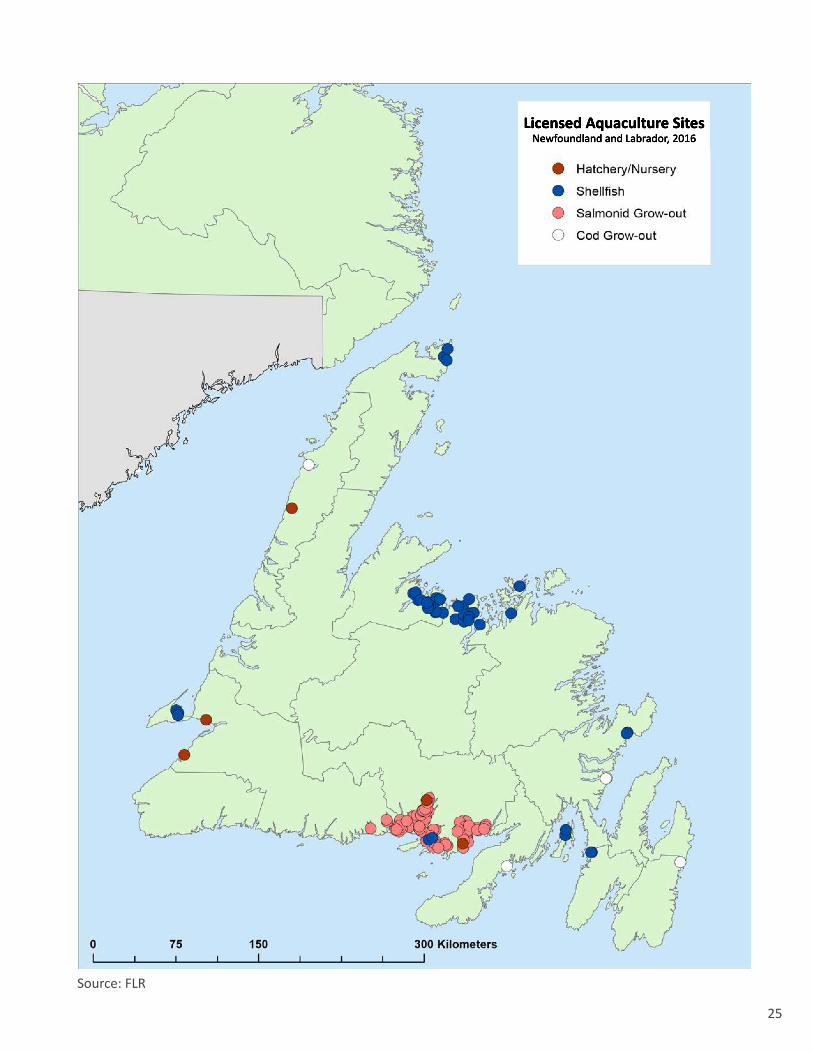
Market value for the industry also experienced significant growth in 2016. It totalled $276 million, compared to $161 million in 2015. The rise in market value was due to increased Atlantic salmon production, stronger market prices, and favourable exchange rates. According to Urner Barry Publications Inc., market prices for 8-10 pound fresh wholefish Atlantic salmon trended upward throughout 2016, averaging $4.57 per pound compared to $3.21 per pound in 2015. Market prices for fresh, live mussels remained relatively stable in 2016, with some minor fluctuations due to exchange rates. SALMONIDS Atlantic salmon is the major commercial salmonid species in the province. A limited amount of steelhead trout is also produced. In 2016, there were 88 commercial salmonid site licences, covering a combined area of 2,500 hectares. The map on page 25 shows licensed aquaculture sites by sector.
In 2016, salmonid production increased significantly to 25,411 tonnes, valued at $263 million. This represents a 29.1 per cent increase in production volume and a 76.9 per cent rise in market value compared to 2015. The industry rebounded from the Infectious Salmon Anaemia virus (ISAv) and superchill events that negatively impacted Atlantic salmon production in 2014. As anticipated, production surpassed the previous record in 2013.
SHELLFISH In Newfoundland and Labrador, the blue mussel is the main commercial shellfish aquaculture species. Shellfish production in 2016 was on par with the previous year; however, the production value rose slightly as a result of favourable exchange rates. Production volume for shellfish was 3,211 tonnes, representing a 2.6 per cent change over 2015. Market value was up 5.6 per cent to $13.6 million.
In 2016, there were 53 commercial shellfish site licences that covered a combined area of 4,403 hectares. See the map on page 25 for the location of these sites.
AQUACULTURE
9
AQUACULTURE
R = Revised; P = PreliminarySource: DFO; FLR
AQUACULTURE PRODUCTIONNewfoundland and Labrador
0
50
100
150
200
250
300
0
5
10
15
20
25
30$ Millions000's tonnes
Salmonids Shellfish Total Value (right axis)
ve
raeye
NORTHERN HARVEST ANNOUNCES MAJOR EXPANSION IN THE PROVINCE
On December 2, 2016, Northern Harvest Sea Farms announced a major expansion for its hatchery in Stephenville. The $6 million investment will increase the company’s production capacity by 1.5 million smolts annually, which equates to approximately 6,000 tonnes of additional salmon production. Construction for the expansion is anticipated to begin in the summer of 2017.
Previous expansion activities for the company were partially funded through the department’s Aquaculture Capital Equity Program, which provides a repayable loan in exchange for share certificates to aquaculture operators seeking to establish or expand their operations within the province.
10
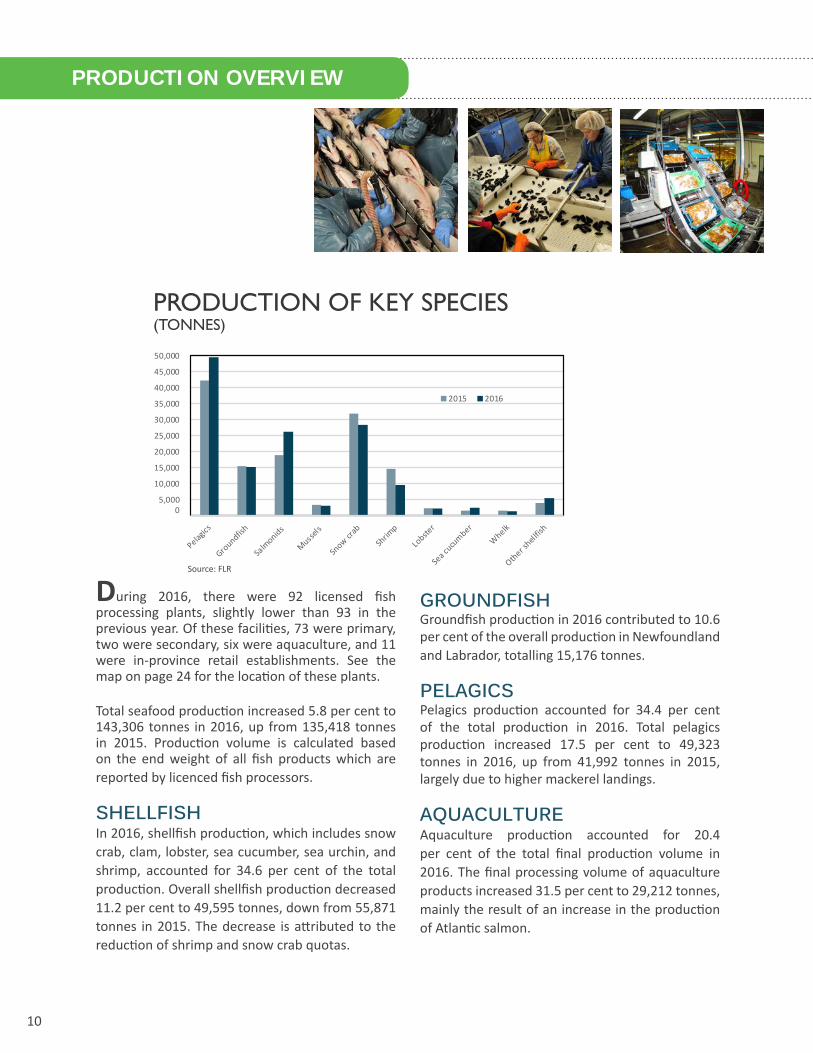
PRODUCTION OF KEY SPECIES(TONNES)
5,000
10,000
15,000
20,000
25,000
30,000
35,000
40,000
45,000
50,000
2015 2016
0
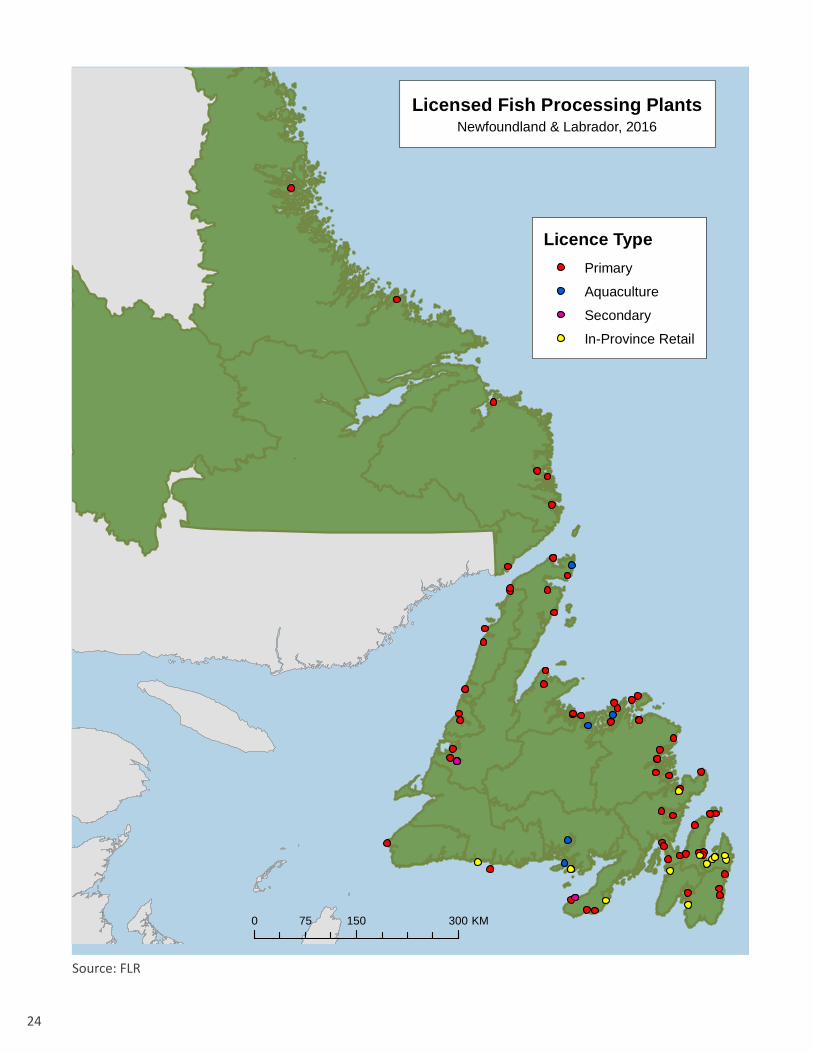
During 2016, there were 92 licensed fish processing plants, slightly lower than 93 in the previous year. Of these facilities, 73 were primary, two were secondary, six were aquaculture, and 11 were in-province retail establishments. See the map on page 24 for the location of these plants.
Total seafood production increased 5.8 per cent to 143,306 tonnes in 2016, up from 135,418 tonnes in 2015. Production volume is calculated based on the end weight of all fish products which are reported by licenced fish processors.
SHELLFISHIn 2016, shellfish production, which includes snow crab, clam, lobster, sea cucumber, sea urchin, and shrimp, accounted for 34.6 per cent of the total production. Overall shellfish production decreased 11.2 per cent to 49,595 tonnes, down from 55,871 tonnes in 2015. The decrease is attributed to the reduction of shrimp and snow crab quotas.
GROUNDFISHGroundfish production in 2016 contributed to 10.6 per cent of the overall production in Newfoundland and Labrador, totalling 15,176 tonnes.
PELAGICSPelagics production accounted for 34.4 per cent of the total production in 2016. Total pelagics production increased 17.5 per cent to 49,323 tonnes in 2016, up from 41,992 tonnes in 2015, largely due to higher mackerel landings.
AQUACULTUREAquaculture production accounted for 20.4 per cent of the total final production volume in 2016. The final processing volume of aquaculture products increased 31.5 per cent to 29,212 tonnes, mainly the result of an increase in the production of Atlantic salmon.
PRODUCTION OVERVIEW
Source: FLR
11
SEAFOOD SUSTAINABILITY & QUALITYNEWFOUNDLAND AND LABRADOR
The Newfoundland and Labrador seafood industry is export driven with the majority of products sold in the global market. Enhancing global competitiveness has become vital to the future of the industry.
Consumers are becoming increasingly concerned about the origins of their seafood products and whether they were procured in a sustainable manner. In response, major retailers and foodservice operations worldwide have committed to selling only seafood products that have been certified to a credible standard. Sustainability and traceability are becoming more important for our seafood producers to gain and maintain market access.
WILD FISHERIES SUSTAINABILITYThere are numerous programs worldwide that assess and certify fisheries as sustainable, with the Marine Stewardship Council (MSC) having the most widely recognized certification program for wild fisheries. In recognition of the importance of eco-certification, the province has supported various MSC pre-assessments, assessments, and re-certifications. Today, Newfoundland and Labrador’s northern shrimp, yellowtail flounder, snow crab, surf clam, 4R herring, and 3Ps cod fisheries have been certified to the MSC standard and the 3LN redfish fishery is currently under assessment. Around 80 per cent of the province’s wild fisheries, by value, have achieved the MSC certification. In addition, the department has supported fisheries improvement projects for northern cod to help guide the fishery towards certification and has supported other initiatives to promote sustainability and enhance the quality and value of Atlantic cod.
To attain MSC and other seafood certifications, a high level of understanding of both stock status and any associated impact on the surrounding ecosystem is necessary. Eco-certification requires the establishment of precautionary and effective management strategies for the fishery in question, such as harvest
TM
www.msc.orgMSC
CERTIFIEDSUSTAINABLESEAFOOD
SPECIAL FEATURE
12
control rules to guide the setting of quota levels and other management measures. A wide range of fisheries research efforts are undertaken in Newfoundland and Labrador waters by DFO, the Centre for Fisheries Ecosystems Research (CFER), and through public/private partnerships with industry. These initiatives have provided a wealth of information regarding the status of fisheries resources to inform decision-making processes and promote the sustainability of the fishing industry.
AQUACULTURE SUSTAINABILITYIn the aquaculture sector, the industry has worked diligently with the Newfoundland Aquaculture Industry Association (NAIA) towards third-party certifications in recent years. The majority of the province’s mussel producers and the two major mussel processors have achieved the Best Aquaculture Practices (BAP) certification standards developed by Global Aquaculture Alliance and the Canadian Organic Aquaculture Standards. Atlantic salmon and steelhead trout producers have also achieved or are working towards certification under the BAP standards. These certifications demonstrate our industry’s commitment to sustainability and create new market opportunities for our aquaculture producers.
SEAFOOD QUALITYIn addition to supporting the eco-certification initiatives, the department works closely with industry stakeholders to enhance quality and sustainability of the seafood industry. The market value and competitiveness of the final products are largely determined by quality, which is closely related to the performance and efficiency of each component of the supply chain. Furthermore, the Newfoundland and Labrador seafood industry is entering a transitional period in which the shellfish intensive industry will become one that is more groundfish focused. The department, through the Seafood Innovation and Transition Program (SITP), has supported a number of initiatives, particularly related to groundfish, to improve operational efficiency, product quality, and overall seafood value chain performance.
Some examples in the harvesting sector include the development of an automatic cod ranching feeding system, the installation of automatic longline and jigger technology, the design and test of a new cod pot, and vessel upgrades including the installation of insulated boxes, on board bleeding and slush tanks, and refrigerated seawater systems. These initiatives improve the quality of fish landed and enhance efficiency and economic viabilty of the industry. In the processing sector, the province has supported the installation of an automated rack and palletizing system for placing and removing fish from freezers, fillet portioning technology, and the testing and evaluation of innovative thawing technology to improve quality and support the processing operations to become more economically viable in the long term.
The province’s aquaculture industry is regularly testing and employing new technology to increase efficiency, lower costs, and improve overall operations to ensure the sustainable development of the industry. The department has supported the development of new deep water mussel socking and harvesting technology and a new land-based net washing facility in Milltown to enhance biosecurity. The industry has also invested in new technologies such as automated feeding systems that are controlled by computer to reduce feed wastage and well boats for on-site activities. These initiatives will support the sustainable development of the provincial aquaculture industry.
12
13
13
USA $499 M (52%*)
CHN $149 M (16%)
UK $68 M (7%)
JPN $42 M (4%)
HK $37 M (4%)
ALL VALUES BASED ON
JANUARY TO NOVEMBER 2016
NL FISH EXPORTS $964 M
* This represents the percentage of total export value.
14
United States
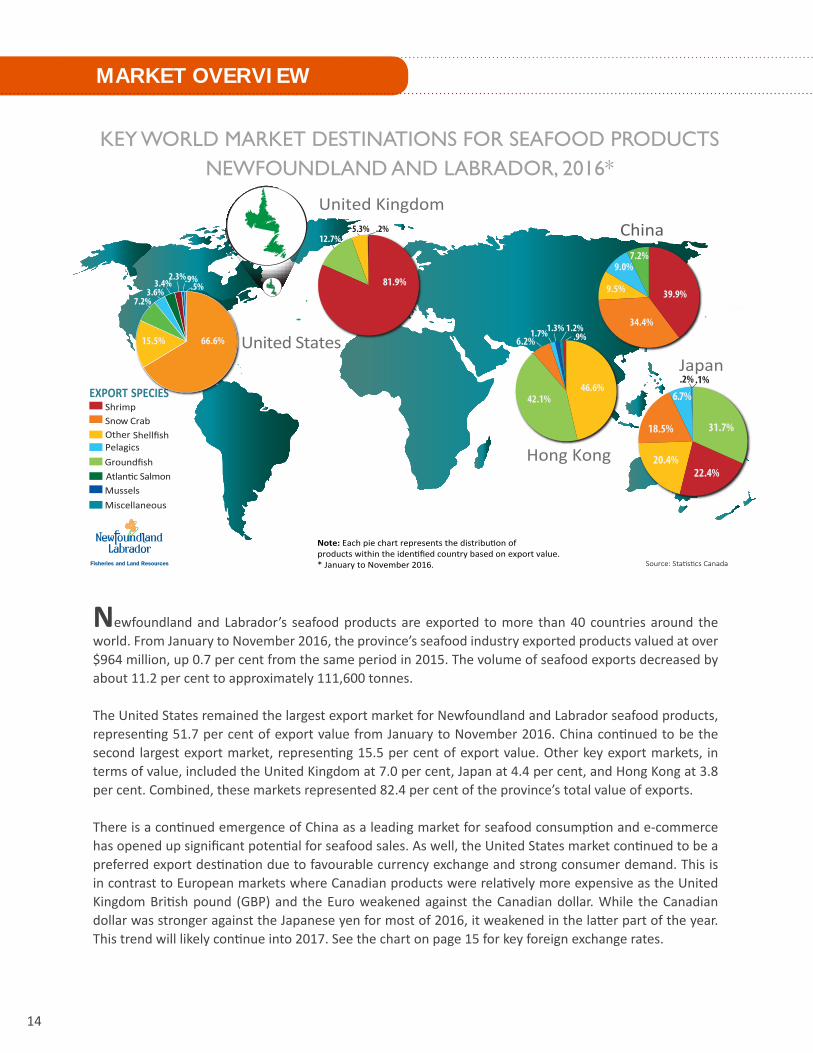
Note: Each pie chart represents the distribution of products within the identified country based on export value. * January to November 2016. Source: Statistics Canada
ChinaUnited Kingdom
EXPORT SPECIES
5.7%
79.2%ShrimpSnow CrabOther ShellfishPelagicsGroundfish
MiscellaneousMusselsAtlantic Salmon
81.9%
12.7%5.3% .2%
39.9%9.5%
34.4%
9.0%7.2%
46.6%
1.7%1.3%
42.1%
6.2%1.2%
.9%
Hong Kong
3.6%
2.3%.9%.5%
66.6%15.5%
7.2%
3.4%
Japan
31.7%
20.4%22.4%
18.5%
6.7%.2% .1%
KEY WORLD MARKET DESTINATIONS FOR SEAFOOD PRODUCTSNEWFOUNDLAND AND LABRADOR, 2016*
MARKET OVERVIEW
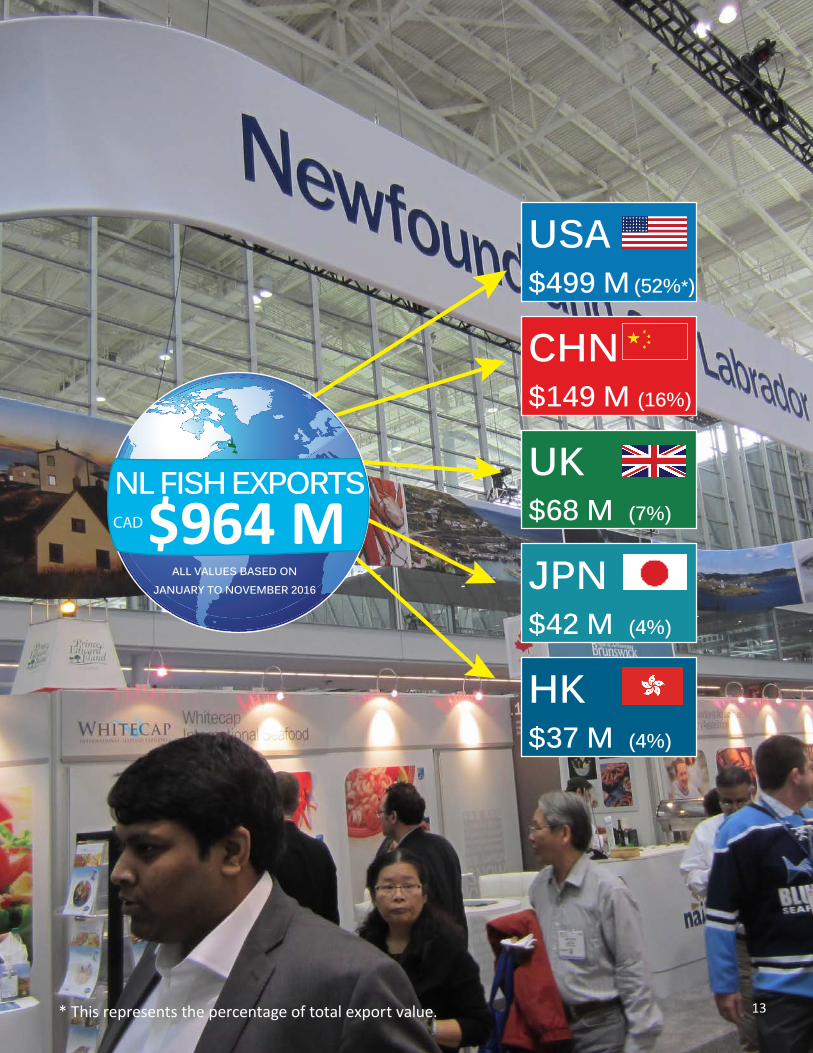
Newfoundland and Labrador’s seafood products are exported to more than 40 countries around the world. From January to November 2016, the province’s seafood industry exported products valued at over $964 million, up 0.7 per cent from the same period in 2015. The volume of seafood exports decreased by about 11.2 per cent to approximately 111,600 tonnes.
The United States remained the largest export market for Newfoundland and Labrador seafood products, representing 51.7 per cent of export value from January to November 2016. China continued to be the second largest export market, representing 15.5 per cent of export value. Other key export markets, in terms of value, included the United Kingdom at 7.0 per cent, Japan at 4.4 per cent, and Hong Kong at 3.8 per cent. Combined, these markets represented 82.4 per cent of the province’s total value of exports.
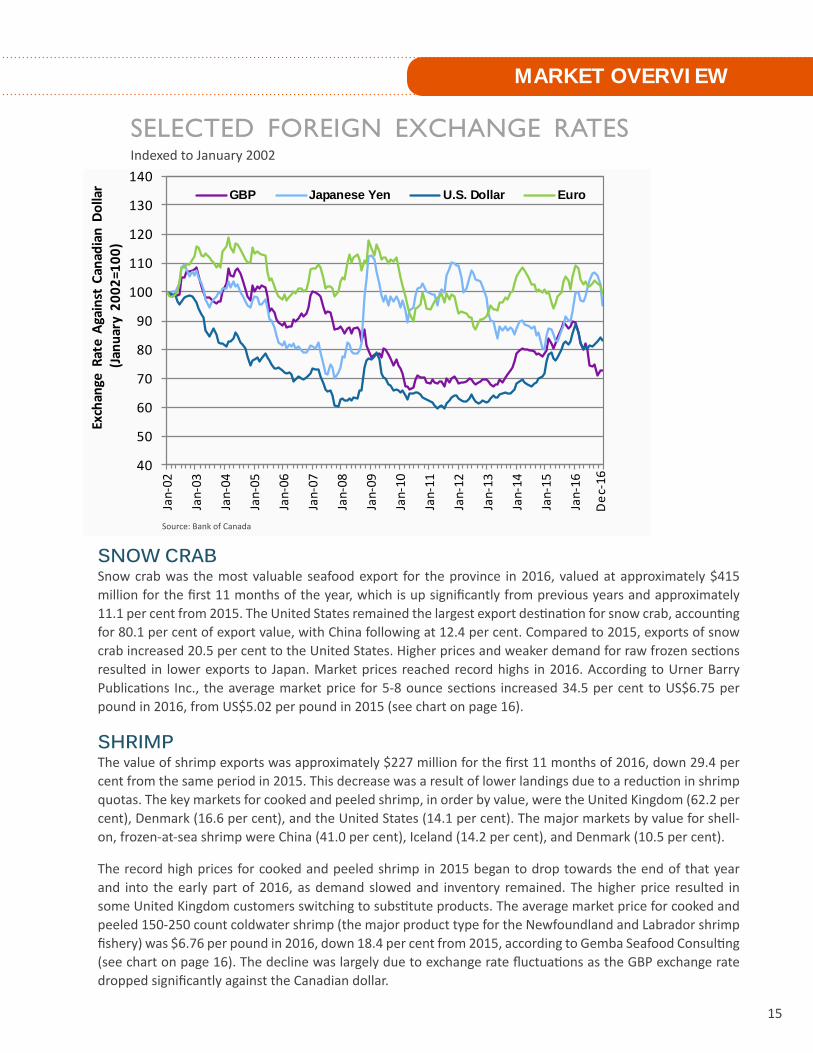
There is a continued emergence of China as a leading market for seafood consumption and e-commerce has opened up significant potential for seafood sales. As well, the United States market continued to be a preferred export destination due to favourable currency exchange and strong consumer demand. This is in contrast to European markets where Canadian products were relatively more expensive as the United Kingdom British pound (GBP) and the Euro weakened against the Canadian dollar. While the Canadian dollar was stronger against the Japanese yen for most of 2016, it weakened in the latter part of the year. This trend will likely continue into 2017. See the chart on page 15 for key foreign exchange rates.
15
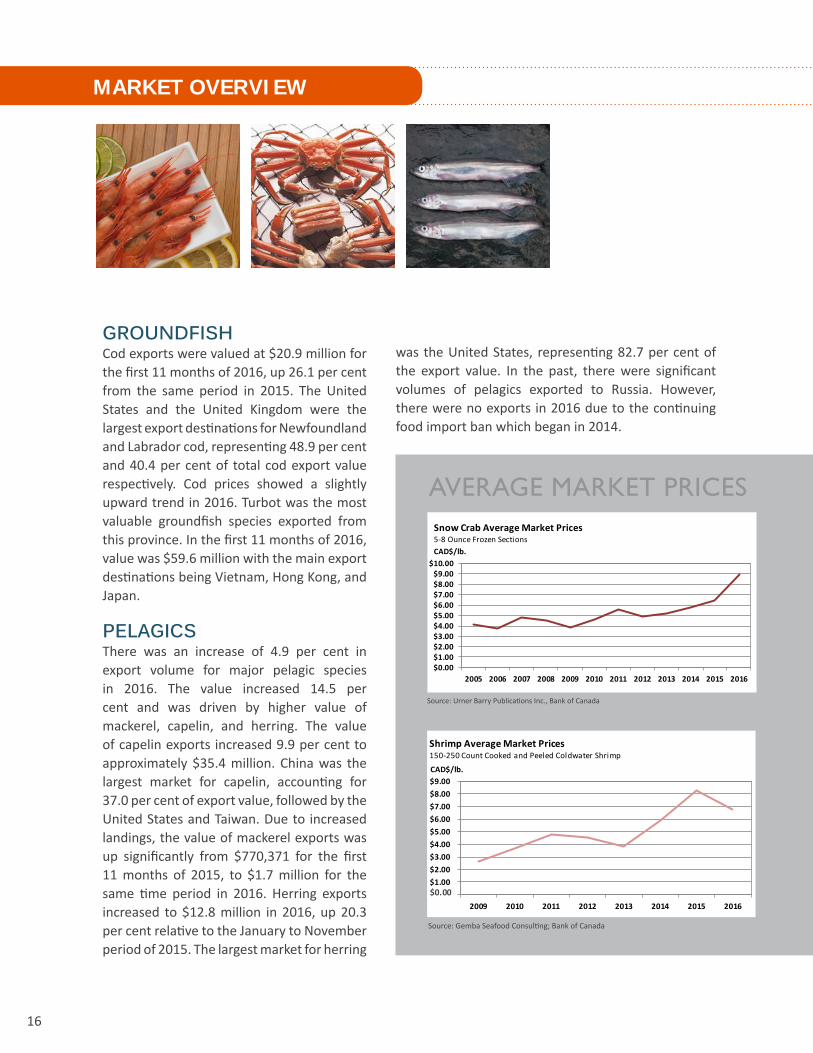
SNOW CRAB Snow crab was the most valuable seafood export for the province in 2016, valued at approximately $415 million for the first 11 months of the year, which is up significantly from previous years and approximately 11.1 per cent from 2015. The United States remained the largest export destination for snow crab, accounting for 80.1 per cent of export value, with China following at 12.4 per cent. Compared to 2015, exports of snow crab increased 20.5 per cent to the United States. Higher prices and weaker demand for raw frozen sections resulted in lower exports to Japan. Market prices reached record highs in 2016. According to Urner Barry Publications Inc., the average market price for 5-8 ounce sections increased 34.5 per cent to US$6.75 per pound in 2016, from US$5.02 per pound in 2015 (see chart on page 16).
SHRIMPThe value of shrimp exports was approximately $227 million for the first 11 months of 2016, down 29.4 per cent from the same period in 2015. This decrease was a result of lower landings due to a reduction in shrimp quotas. The key markets for cooked and peeled shrimp, in order by value, were the United Kingdom (62.2 per cent), Denmark (16.6 per cent), and the United States (14.1 per cent). The major markets by value for shell-on, frozen-at-sea shrimp were China (41.0 per cent), Iceland (14.2 per cent), and Denmark (10.5 per cent).
The record high prices for cooked and peeled shrimp in 2015 began to drop towards the end of that year and into the early part of 2016, as demand slowed and inventory remained. The higher price resulted in some United Kingdom customers switching to substitute products. The average market price for cooked and peeled 150-250 count coldwater shrimp (the major product type for the Newfoundland and Labrador shrimp fishery) was $6.76 per pound in 2016, down 18.4 per cent from 2015, according to Gemba Seafood Consulting (see chart on page 16). The decline was largely due to exchange rate fluctuations as the GBP exchange rate dropped significantly against the Canadian dollar.
SELECTED FOREIGN EXCHANGE RATES Indexed to January 2002
MARKET OVERVIEW
40
50
60
70
80
90
100
110
120
130
140Ja
n-02
Jan-
03
Jan-
04
Jan-
05
Jan-
06
Jan-
07
Jan-
08
Jan-
09
Jan-
10
Jan-
11
Jan-
12
Jan-
13
Jan-
14
Jan-
15
Jan-
16
Exch
ange
Rat
e Ag
ains
t Ca
nadi
an D
olla
r(Ja
nuar
y 20
02=1
00)
GBP Japanese Yen U.S. Dollar Euro
Dec
-16
Source: Bank of Canada
16
GROUNDFISHCod exports were valued at $20.9 million for the first 11 months of 2016, up 26.1 per cent from the same period in 2015. The United States and the United Kingdom were the largest export destinations for Newfoundland and Labrador cod, representing 48.9 per cent and 40.4 per cent of total cod export value respectively. Cod prices showed a slightly upward trend in 2016. Turbot was the most valuable groundfish species exported from this province. In the first 11 months of 2016, value was $59.6 million with the main export destinations being Vietnam, Hong Kong, and Japan.
PELAGICSThere was an increase of 4.9 per cent in export volume for major pelagic species in 2016. The value increased 14.5 per cent and was driven by higher value of mackerel, capelin, and herring. The value of capelin exports increased 9.9 per cent to approximately $35.4 million. China was the largest market for capelin, accounting for 37.0 per cent of export value, followed by the United States and Taiwan. Due to increased landings, the value of mackerel exports was up significantly from $770,371 for the first 11 months of 2015, to $1.7 million for the same time period in 2016. Herring exports increased to $12.8 million in 2016, up 20.3 per cent relative to the January to November period of 2015. The largest market for herring
MARKET OVERVIEW
was the United States, representing 82.7 per cent of the export value. In the past, there were significant volumes of pelagics exported to Russia. However, there were no exports in 2016 due to the continuing food import ban which began in 2014.
AVERAGE MARKET PRICES
$0.00$1.00$2.00$3.00$4.00$5.00$6.00$7.00$8.00$9.00
$10.00
2005 2006 2007 2008 2009 2010 2011 2012 2013 2014 2015 2016
CAD$/lb.
Snow Crab Average Market Prices5-8 Ounce Frozen Sections
Source: Urner Barry Publications Inc., Bank of Canada
Source: Gemba Seafood Consulting; Bank of Canada
$- $1.00 $2.00 $3.00 $4.00 $5.00 $6.00 $7.00 $8.00 $9.00
2009 2010 2011 2012 2013 2014 2015 2016
CAD$/lb.
Shrimp Average Market Prices 150-250 Count Cooked and Peeled Coldwater Shrimp
$0.00
17
RESOURCE STATUS
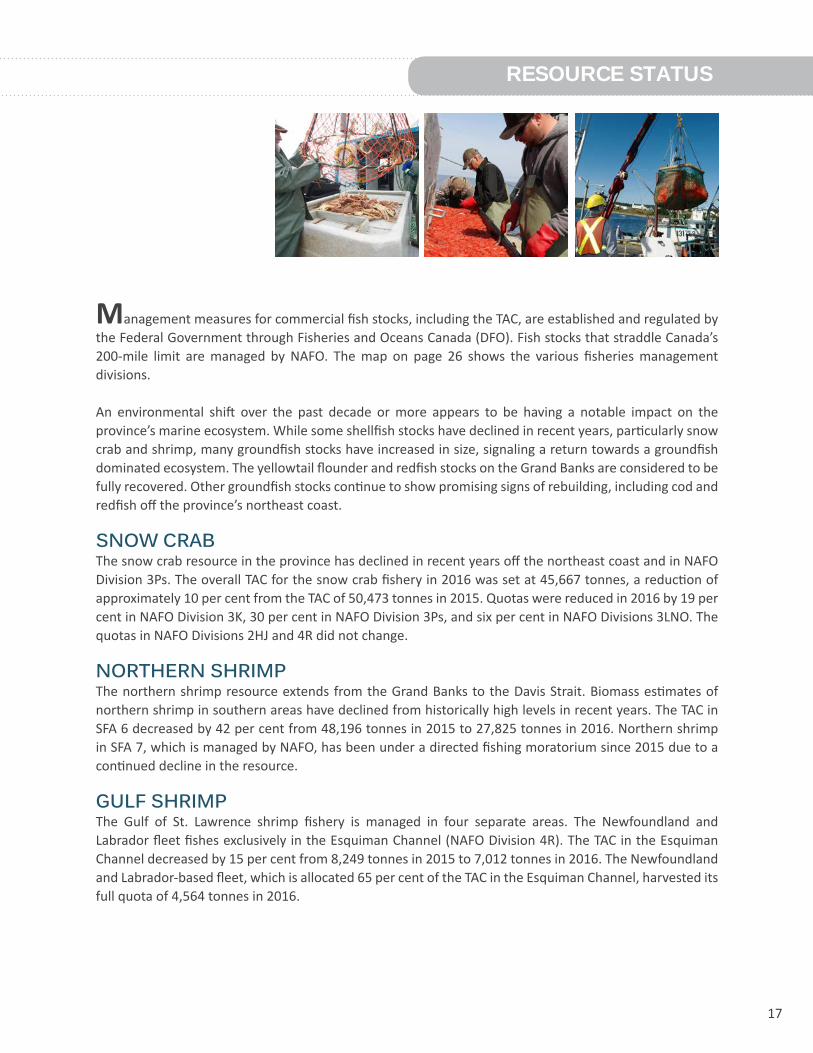
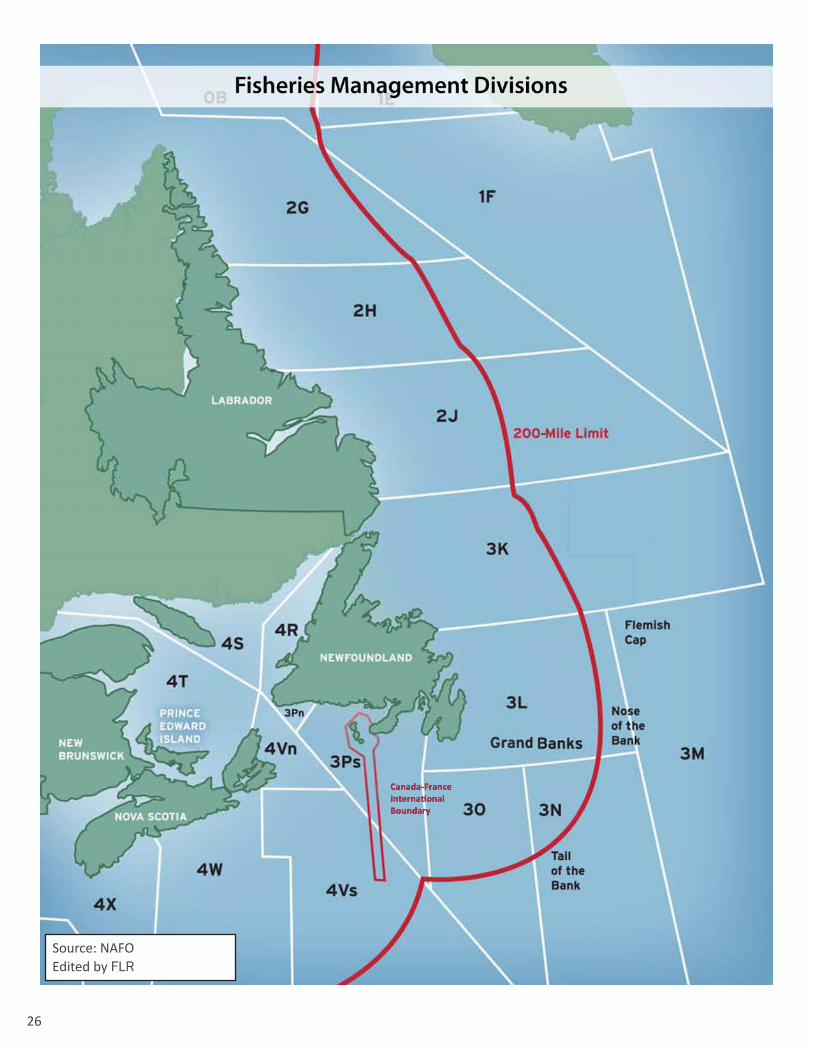
Management measures for commercial fish stocks, including the TAC, are established and regulated by the Federal Government through Fisheries and Oceans Canada (DFO). Fish stocks that straddle Canada’s 200-mile limit are managed by NAFO. The map on page 26 shows the various fisheries management divisions.
An environmental shift over the past decade or more appears to be having a notable impact on the province’s marine ecosystem. While some shellfish stocks have declined in recent years, particularly snow crab and shrimp, many groundfish stocks have increased in size, signaling a return towards a groundfish dominated ecosystem. The yellowtail flounder and redfish stocks on the Grand Banks are considered to be fully recovered. Other groundfish stocks continue to show promising signs of rebuilding, including cod and redfish off the province’s northeast coast.
SNOW CRABThe snow crab resource in the province has declined in recent years off the northeast coast and in NAFO Division 3Ps. The overall TAC for the snow crab fishery in 2016 was set at 45,667 tonnes, a reduction of approximately 10 per cent from the TAC of 50,473 tonnes in 2015. Quotas were reduced in 2016 by 19 per cent in NAFO Division 3K, 30 per cent in NAFO Division 3Ps, and six per cent in NAFO Divisions 3LNO. The quotas in NAFO Divisions 2HJ and 4R did not change.
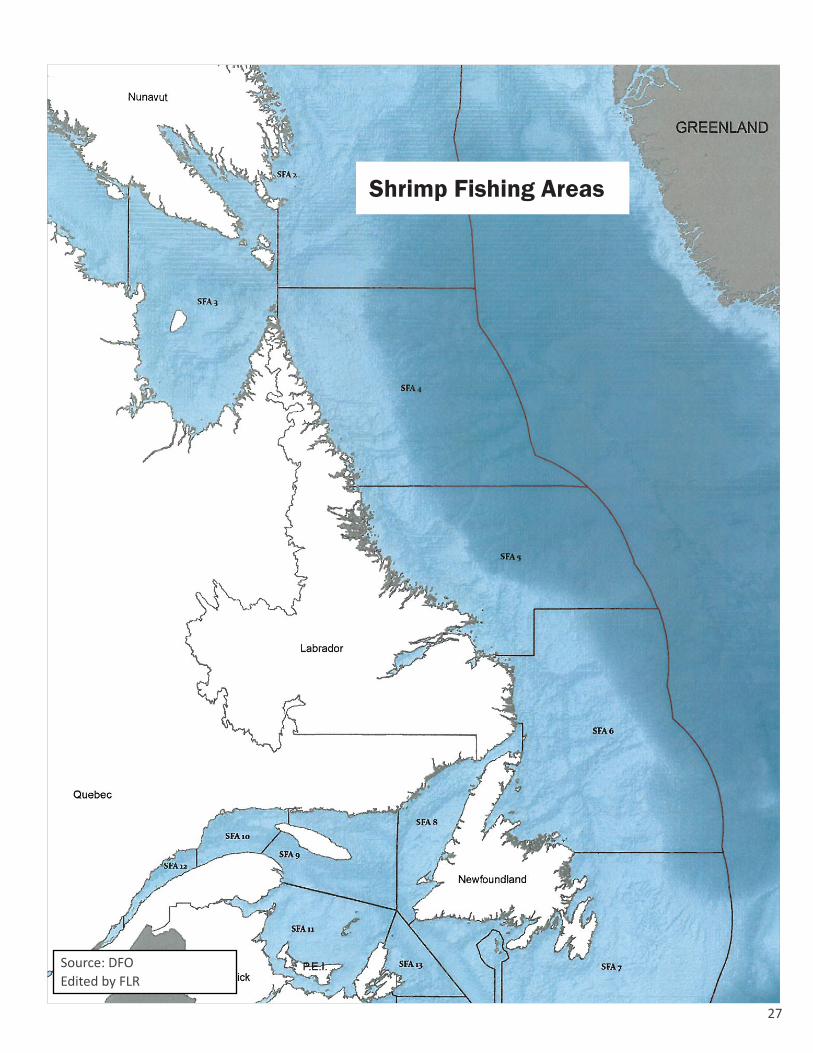
NORTHERN SHRIMPThe northern shrimp resource extends from the Grand Banks to the Davis Strait. Biomass estimates of northern shrimp in southern areas have declined from historically high levels in recent years. The TAC in SFA 6 decreased by 42 per cent from 48,196 tonnes in 2015 to 27,825 tonnes in 2016. Northern shrimp in SFA 7, which is managed by NAFO, has been under a directed fishing moratorium since 2015 due to a continued decline in the resource.
GULF SHRIMPThe Gulf of St. Lawrence shrimp fishery is managed in four separate areas. The Newfoundland and Labrador fleet fishes exclusively in the Esquiman Channel (NAFO Division 4R). The TAC in the Esquiman Channel decreased by 15 per cent from 8,249 tonnes in 2015 to 7,012 tonnes in 2016. The Newfoundland and Labrador-based fleet, which is allocated 65 per cent of the TAC in the Esquiman Channel, harvested its full quota of 4,564 tonnes in 2016.
18
RESOURCE STATUS
CODThe northern cod stock (NAFO Divisions 2J3KL) consists of an inshore and offshore component. The offshore component has been under a directed fishing moratorium since 1992. A limited inshore fishery was conducted from 1998 to 2002, and again from 2006 to 2016. In 2016, the inshore stewardship fishery permitted harvesters a landing limit of 2,000 pounds per week from August 15 to September 4, and 3,000 pounds per week from September 5 to December 16. This resulted in a harvest of about 10,000 tonnes in 2016. The northern cod stock has increased over the past decade. It is anticipated to increase further over the next few years but remains well below historical levels.
Cod in NAFO Division 3Ps is located off the south coast of the province. In 2014, a rebuilding plan for 3Ps cod was adopted to guide decision-making for the stock. In accordance with the plan, the TAC for 3Ps cod was increased by 15 per cent to 13,225 tonnes for 2014 and two per cent to 13,490 tonnes for 2015. The TAC was reduced by three per cent to 13,043 tonnes for 2016. In recent years, total landings of 3Ps cod have been significantly lower than the TAC, which is reportedly due to a number of factors, including a reduced availability of cod in some areas.
The northern Gulf of St. Lawrence cod stock (NAFO Divisions 3Pn4RS) remains below its historical level. Since 2012, the annual TAC has been set at 1,500 tonnes and remained at this level in 2016. Newfoundland and Labrador is allocated 72 per cent of the inshore quota for this stock.
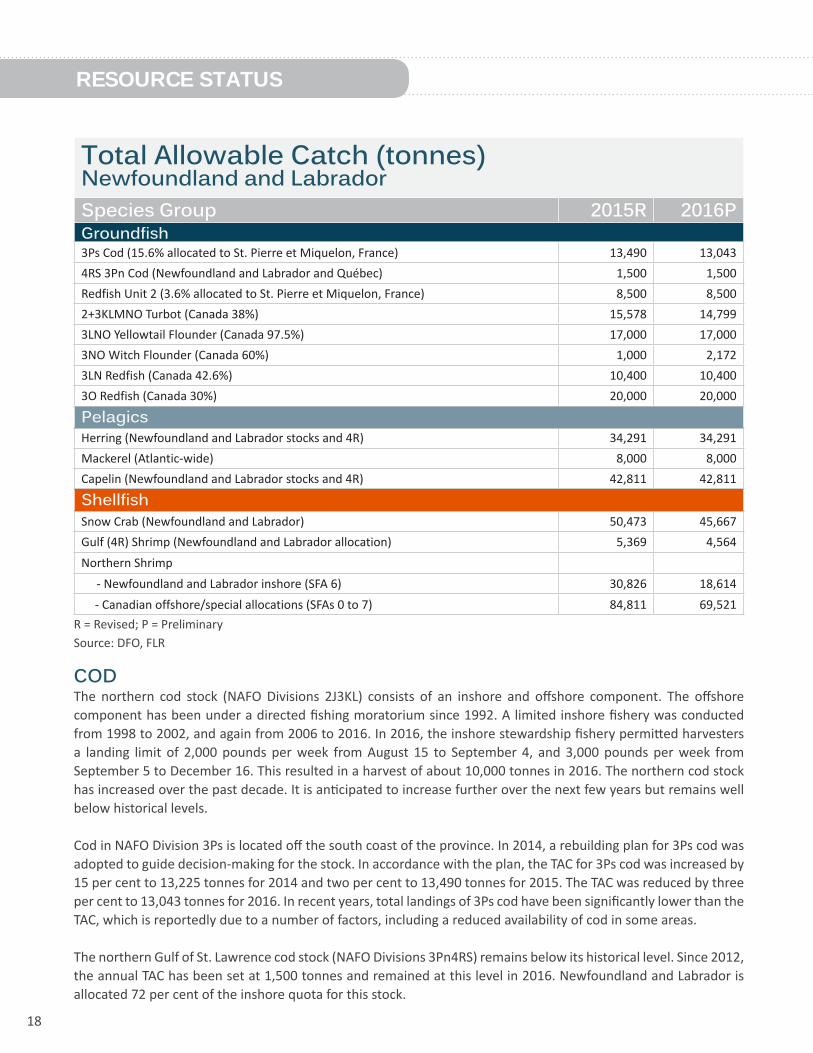
Total Allowable Catch (tonnes)Newfoundland and LabradorSpecies Group 2015R 2016PGroundfish 3Ps Cod (15.6% allocated to St. Pierre et Miquelon, France) 13,490 13,0434RS 3Pn Cod (Newfoundland and Labrador and Québec) 1,500 1,500Redfish Unit 2 (3.6% allocated to St. Pierre et Miquelon, France) 8,500 8,5002+3KLMNO Turbot (Canada 38%) 15,578 14,7993LNO Yellowtail Flounder (Canada 97.5%) 17,000 17,0003NO Witch Flounder (Canada 60%) 1,000 2,1723LN Redfish (Canada 42.6%) 10,400 10,4003O Redfish (Canada 30%) 20,000 20,000
PelagicsHerring (Newfoundland and Labrador stocks and 4R) 34,291 34,291Mackerel (Atlantic-wide) 8,000 8,000Capelin (Newfoundland and Labrador stocks and 4R) 42,811 42,811
ShellfishSnow Crab (Newfoundland and Labrador) 50,473 45,667Gulf (4R) Shrimp (Newfoundland and Labrador allocation) 5,369 4,564Northern Shrimp - Newfoundland and Labrador inshore (SFA 6) 30,826 18,614 - Canadian offshore/special allocations (SFAs 0 to 7) 84,811 69,521
R = Revised; P = PreliminarySource: DFO, FLR
19
RESOURCE STATUS
UNIT 2 REDFISHUnit 2 redfish is located off the south coast of the island portion of the province and on the eastern Scotian Shelf. Since 2006, the TAC has been set at 8,500 tonnes. Landings over the past number of years have been lower than the TAC due to reduced fishing effort. The outlook for redfish in Unit 2 is encouraging due to evidence of large numbers of young fish, which is expected to lead to a stock increase in the next few years.
NAFO-MANAGED GROUNDFISH STOCKS2+3KLMNO TURBOT (GREENLAND HALIBUT)In 2010, NAFO adopted a new management plan for this stock. Under the plan, annual downward adjustments were made to the TAC over the following four years due to indications of a short-term decline in the stock from 17,185 tonnes in 2011 to 15,441 tonnes in 2014. The TAC was slightly increased to 15,578 tonnes in 2015, but was reduced by five per cent to 14,799 tonnes in 2016. The TAC will remain at this level in 2017. Canada’s allocation of the TAC is 38 per cent, which is mainly fished by Newfoundland and Labrador-based vessels. NAFO will undertake a review of the management plan for turbot in 2017.
3LNO YELLOWTAIL FLOUNDERThe yellowtail flounder resource in NAFO Divisions 3LNO is considered to be fully recovered to levels equivalent to those of the 1980s. The TAC has been set at 17,000 tonnes since 2009, and will remain the same in 2017. Canada’s share of this stock is 97.5 per cent, which offshore vessels based in Newfoundland and Labrador harvest.
3NO WITCH FLOUNDERThe witch flounder stock in NAFO Division 3NO was closed to directed fishing in 1995 and remained under moratorium for two decades. The stock has grown in recent years and reopened to directed fishing activities in 2015 with a TAC of 1,000 tonnes. Given the continued growth of the stock, the TAC was increased to 2,172 tonnes in 2016 and will further increase to 2,225 tonnes in 2017. Canada’s share of 3NO witch flounder is 60 per cent, which offshore vessels based in this province mainly harvest.
3LN REDFISHThe redfish fishery in NAFO Division 3LN was under moratorium from 1998 to 2009. The stock has since increased to a healthy level and the fishery was reopened in 2010 with a TAC of 3,500 tonnes. Under the current management plan, the TAC was 10,400 tonnes in 2016 and will increase to 14,200 tonnes in 2017. Canada’s share of this stock is 42.6 per cent, which offshore vessels based in Newfoundland and Labrador mainly harvest.
3O REDFISHThe TAC for the redfish resource in NAFO Division 3O has been set at 20,000 tonnes since 2005 and will remain the same in 2017. Canada’s share of 3O redfish is 30 per cent. Harvest levels associated with this stock are low due to the size of the fish and available fishing grounds.
OTHER STOCKSOther straddling groundfish stocks such as 3NO cod, 2J3KL witch flounder, and 3LNO American plaice were under moratoria in 2016 and will remain closed to directed fishing in 2017.
20
DEPARTMENTAL INITIATIVES
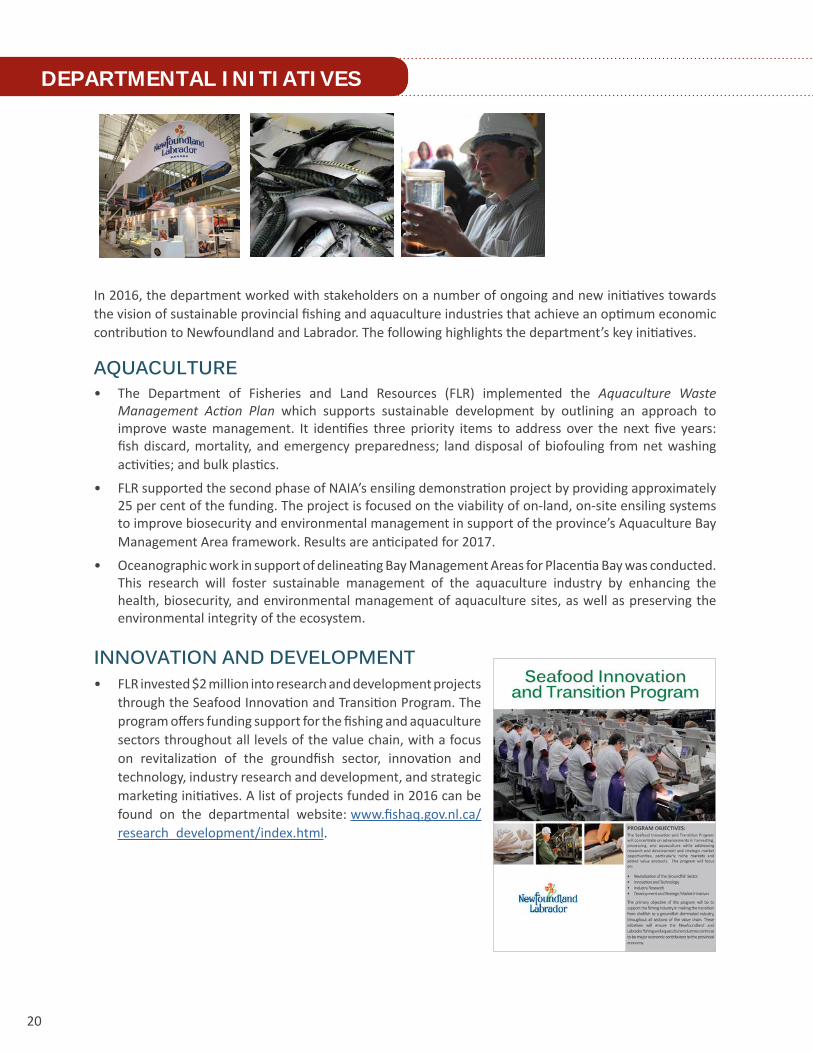
In 2016, the department worked with stakeholders on a number of ongoing and new initiatives towards the vision of sustainable provincial fishing and aquaculture industries that achieve an optimum economic contribution to Newfoundland and Labrador. The following highlights the department’s key initiatives.
AQUACULTURE• The Department of Fisheries and Land Resources (FLR) implemented the Aquaculture Waste
Management Action Plan which supports sustainable development by outlining an approach to improve waste management. It identifies three priority items to address over the next five years: fish discard, mortality, and emergency preparedness; land disposal of biofouling from net washing activities; and bulk plastics.
• FLR supported the second phase of NAIA’s ensiling demonstration project by providing approximately 25 per cent of the funding. The project is focused on the viability of on-land, on-site ensiling systems to improve biosecurity and environmental management in support of the province’s Aquaculture Bay Management Area framework. Results are anticipated for 2017.
• Oceanographic work in support of delineating Bay Management Areas for Placentia Bay was conducted. This research will foster sustainable management of the aquaculture industry by enhancing the health, biosecurity, and environmental management of aquaculture sites, as well as preserving the environmental integrity of the ecosystem.
INNOVATION AND DEVELOPMENT• FLR invested $2 million into research and development projects
through the Seafood Innovation and Transition Program. The program offers funding support for the fishing and aquaculture sectors throughout all levels of the value chain, with a focus on revitalization of the groundfish sector, innovation and technology, industry research and development, and strategic marketing initiatives. A list of projects funded in 2016 can be found on the departmental website: www.fishaq.gov.nl.ca/research_development/index.html.
21
DEPARTMENTAL INITIATIVES
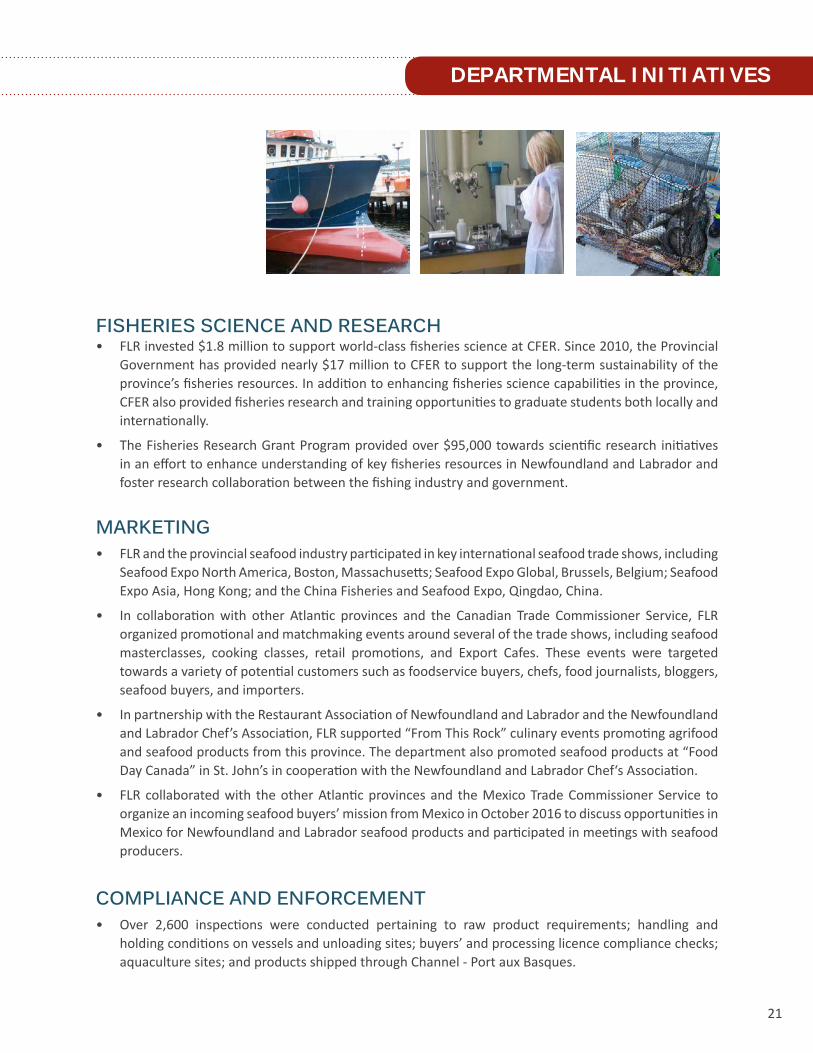
FISHERIES SCIENCE AND RESEARCH• FLR invested $1.8 million to support world-class fisheries science at CFER. Since 2010, the Provincial
Government has provided nearly $17 million to CFER to support the long-term sustainability of the province’s fisheries resources. In addition to enhancing fisheries science capabilities in the province, CFER also provided fisheries research and training opportunities to graduate students both locally and internationally.
• The Fisheries Research Grant Program provided over $95,000 towards scientific research initiatives in an effort to enhance understanding of key fisheries resources in Newfoundland and Labrador and foster research collaboration between the fishing industry and government.
MARKETING• FLR and the provincial seafood industry participated in key international seafood trade shows, including
Seafood Expo North America, Boston, Massachusetts; Seafood Expo Global, Brussels, Belgium; Seafood Expo Asia, Hong Kong; and the China Fisheries and Seafood Expo, Qingdao, China.
• In collaboration with other Atlantic provinces and the Canadian Trade Commissioner Service, FLR organized promotional and matchmaking events around several of the trade shows, including seafood masterclasses, cooking classes, retail promotions, and Export Cafes. These events were targeted towards a variety of potential customers such as foodservice buyers, chefs, food journalists, bloggers, seafood buyers, and importers.
• In partnership with the Restaurant Association of Newfoundland and Labrador and the Newfoundland and Labrador Chef’s Association, FLR supported “From This Rock” culinary events promoting agrifood and seafood products from this province. The department also promoted seafood products at “Food Day Canada” in St. John’s in cooperation with the Newfoundland and Labrador Chef‘s Association.
• FLR collaborated with the other Atlantic provinces and the Mexico Trade Commissioner Service to organize an incoming seafood buyers’ mission from Mexico in October 2016 to discuss opportunities in Mexico for Newfoundland and Labrador seafood products and participated in meetings with seafood producers.
COMPLIANCE AND ENFORCEMENT• Over 2,600 inspections were conducted pertaining to raw product requirements; handling and
holding conditions on vessels and unloading sites; buyers’ and processing licence compliance checks; aquaculture sites; and products shipped through Channel - Port aux Basques.
22
23
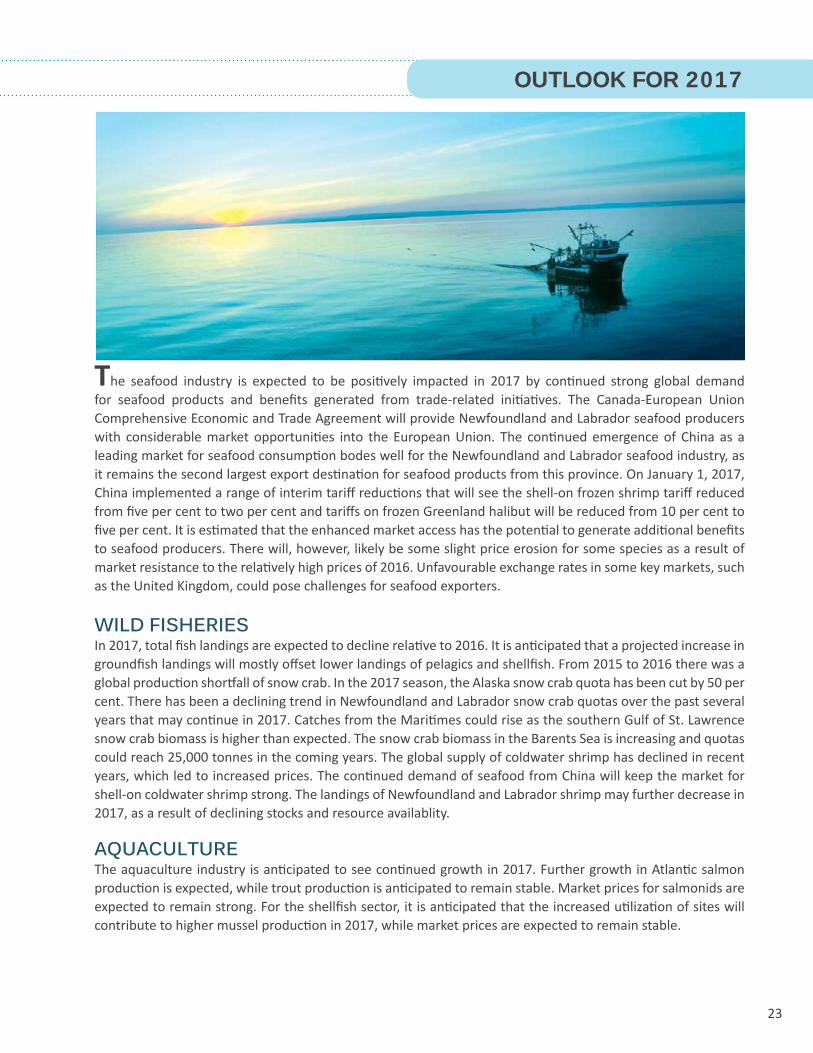
The seafood industry is expected to be positively impacted in 2017 by continued strong global demand for seafood products and benefits generated from trade-related initiatives. The Canada-European Union Comprehensive Economic and Trade Agreement will provide Newfoundland and Labrador seafood producers with considerable market opportunities into the European Union. The continued emergence of China as a leading market for seafood consumption bodes well for the Newfoundland and Labrador seafood industry, as it remains the second largest export destination for seafood products from this province. On January 1, 2017, China implemented a range of interim tariff reductions that will see the shell-on frozen shrimp tariff reduced from five per cent to two per cent and tariffs on frozen Greenland halibut will be reduced from 10 per cent to five per cent. It is estimated that the enhanced market access has the potential to generate additional benefits to seafood producers. There will, however, likely be some slight price erosion for some species as a result of market resistance to the relatively high prices of 2016. Unfavourable exchange rates in some key markets, such as the United Kingdom, could pose challenges for seafood exporters.
WILD FISHERIESIn 2017, total fish landings are expected to decline relative to 2016. It is anticipated that a projected increase in groundfish landings will mostly offset lower landings of pelagics and shellfish. From 2015 to 2016 there was a global production shortfall of snow crab. In the 2017 season, the Alaska snow crab quota has been cut by 50 per cent. There has been a declining trend in Newfoundland and Labrador snow crab quotas over the past several years that may continue in 2017. Catches from the Maritimes could rise as the southern Gulf of St. Lawrence snow crab biomass is higher than expected. The snow crab biomass in the Barents Sea is increasing and quotas could reach 25,000 tonnes in the coming years. The global supply of coldwater shrimp has declined in recent years, which led to increased prices. The continued demand of seafood from China will keep the market for shell-on coldwater shrimp strong. The landings of Newfoundland and Labrador shrimp may further decrease in 2017, as a result of declining stocks and resource availablity.
AQUACULTUREThe aquaculture industry is anticipated to see continued growth in 2017. Further growth in Atlantic salmon production is expected, while trout production is anticipated to remain stable. Market prices for salmonids are expected to remain strong. For the shellfish sector, it is anticipated that the increased utilization of sites will contribute to higher mussel production in 2017, while market prices are expected to remain stable.
OUTLOOK FOR 2017
24
Licensed Fish Processing PlantsNewfoundland & Labrador, 2016
0 150 30075 KM
Licence TypePrimary
Aquaculture
Secondary
In-Province Retail
.Source: FLR
25
Licensed Aquaculture SitesNewfoundland and Labrador, 2016
Source: FLR
26
Source: NAFOEdited by FLR
27
Shrimp Fishing Areas
Source: DFOEdited by FLR
28
Steve Crocker Minister(709) 729-3705 ● [email protected]
Lori Anne Companion Deputy Minister(709) 729-3707 ● [email protected]
Wanda Wiseman Assistant Deputy Minister, Fisheries and Aquaculture(709) 729-1725 ● [email protected]
Vanessa Colman-Sadd Director of Communications(709) 729-3733 ● [email protected]
Department of Fisheries and Land Resources30 Strawberry Marsh RoadP.O. Box 8700St. John’s, NL, Canada A1B 4J6(709) 729-3723www.ffa.gov.nl.caTwitter@FLR_GovNL
PHOTO REFERENCES
CONTACT INFORMATION
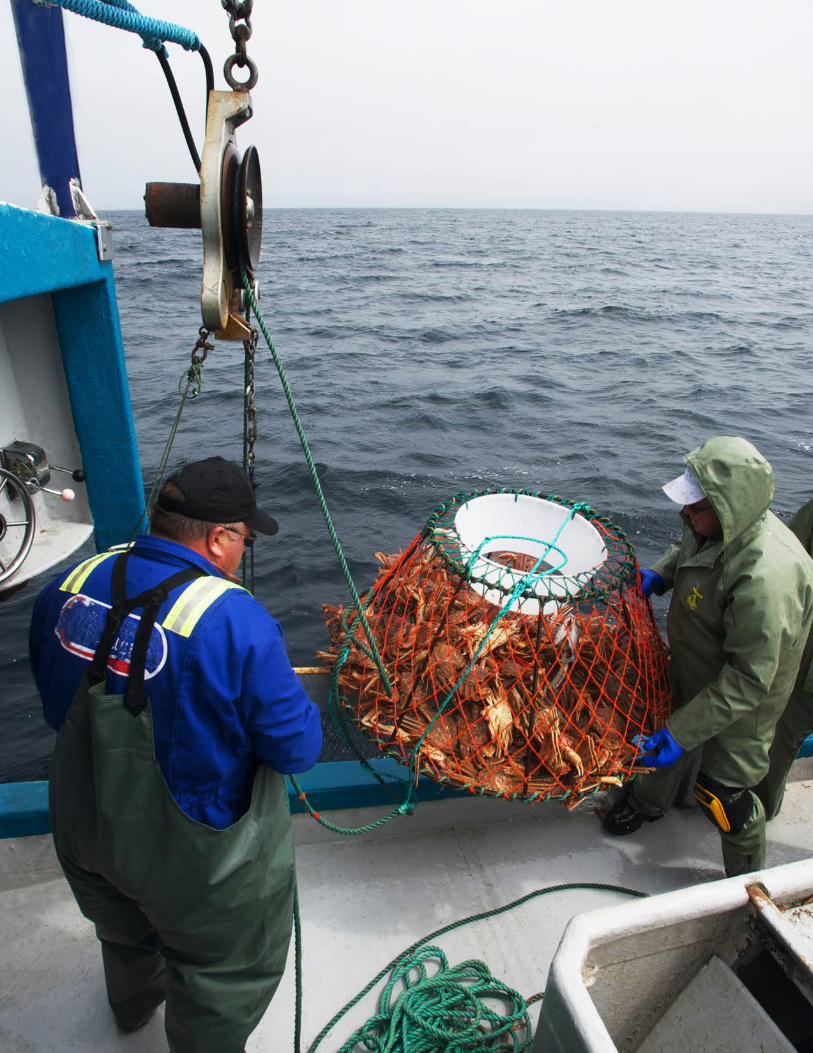
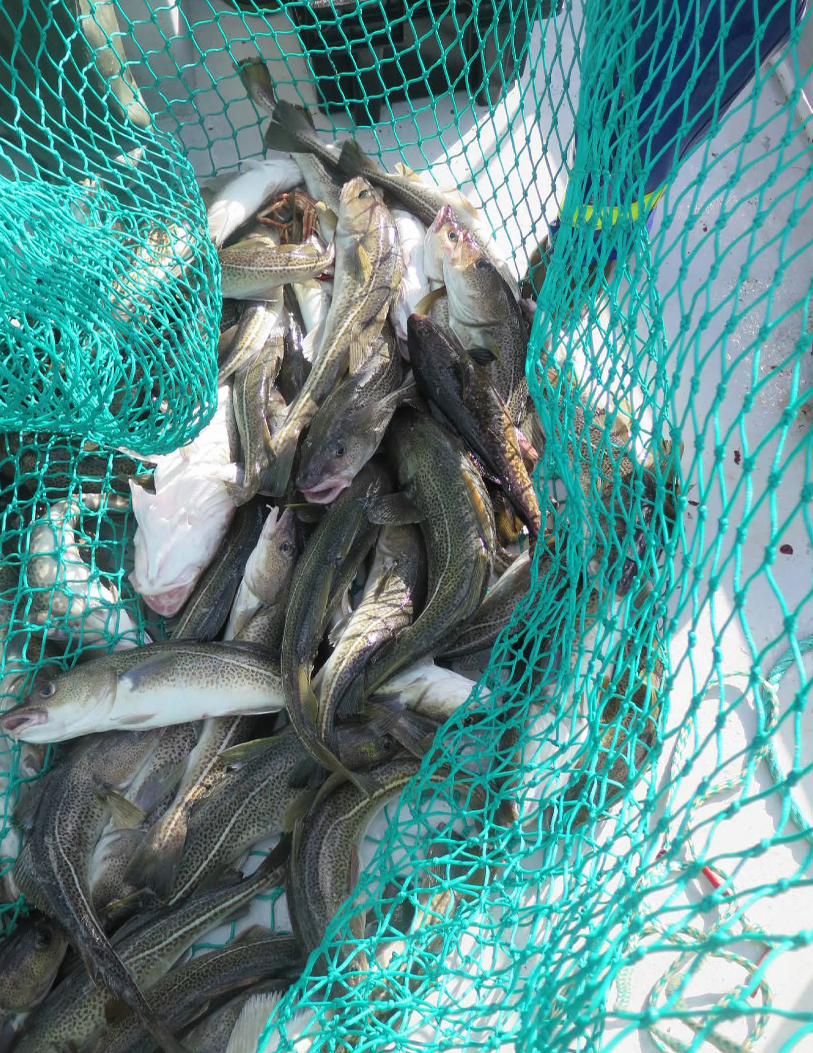
Front and back cover feature image: icebergFront cover inset: cod harvesting, mussels, processing, Chef Jeremy Charles Back cover inset: crab harvesting, fishing vesssels in Belleoram, salmonid sites inFortune Bay, shrimp processing
Front cover inset:Page ii: assorted seafoodPage iv: snow crab harvestersPage vi: icebergPage 6: assorted seafoodPage 8: aquaculture development,
salmon processing, musselsPage 9: Atlantic salmonPage 10: salmon processing, mussel processing,
snow crab processingPage 11: shrimp, snow crab, surf clamsPage 12: mussels, cod, yellowtail flounderPage 13: Seafood Expo North AmericaPage 16: shrimp, snow crab, capelinPage 17: snow crab harvesting, shrimp
harvesting, shrimp harvestingPage 20: Seafood Expo North America, mackerel,
aquaculture waste managementPage 21: energy efficient fishing vessel, fisheries research, cod pottingPage 22: codPage 23: shrimp fishing vesselPage 29: assorted seafood
All images are the property of FLR.
ACRONYMS AND ABBREVIATIONSThe following acronyms and abbreviations are used throughout this document and are provided here for reference.BAP Best Aquaculture Practices CFER Centre for Fisheries Ecosystems ResearchDFO Fisheries and Oceans CanadaFLR Department of Fisheries and Land ResourcesGBP United Kingdom British poundMSC Marine Stewardship CouncilNAIA Newfoundland Aquaculture Industry AssociationNAFO Northwest Atlantic Fisheries OrganizationSFA Shrimp Fishing AreaSITP Seafood Innovation and Transition ProgramTAC Total Allowable Catch
30 Strawberry Marsh RoadP.O. Box 8700
St. John’s, NL, Canada A1B 4J6(709) 729-3723
www.ffa.gov.nl.caTwitter@FLR_GovNL
Department of Fisheries and Land Resources