scottish arthroplasty project - arthro.scot.nhs.uk · — cva/stroke within 30 days ... available...
TRANSCRIPT

A summary of procedures and outcomes for patients undergoing arthroplasty operations during 2010 & 2011
Biennial Report 2012
Scottish Arthroplasty
Project
© NHS National Services Scotland/Crown Copyright 2012Brief extracts from this publication may be reproduced provided the source is fully acknowledged. Proposals for reproduction of large extracts should be addressed to:
ISD Scotland PublicationsInformation Services Division NHS National Services Scotland Gyle Square 1 South Gyle Crescent Edinburgh EH12 9EB
phone: +44 (0)131 275 6233 email: nss.isd‑[email protected]
Design and layoutISD Scotland Publications
Translation ServiceIf you would like this leaflet in a different language, large print or Braille (English only), or would like information on how it can be translated into your community language, please phone 0131 275 6665.

Table of Contents
Foreword ...................................................................................................................................................................................................................................................................................................1
Introduction ......................................................................................................................................................................................................................................................................................2
Key Points ...............................................................................................................................................................................................................................................................................................3
1. Number of Arthroplasties .......................................................................................................................................................................................................................41.1 National rates ............................................................................................................................................................................................................................................................................41.2 Number of arthroplasties by NHS Board .................................................................................................................................................................................................. 51.3 Consultants performing small volumes ......................................................................................................................................................................................................8
2. Patient Demographics .................................................................................................................................................................................................................................. 92.1 Age ........................................................................................................................................................................................................................................................................................................92.2 Pre‑operative medical conditions ..................................................................................................................................................................................................................10
3. Inpatient Episodes .............................................................................................................................................................................................................................................. 123.1 Length of stay ....................................................................................................................................................................................................................................................................... 12
4. Orthopaedic Complication Rates ..................................................................................................................................................................................144.1 National trends ................................................................................................................................................................................................................................................................... 144.2 Hip — dislocation within one year ...................................................................................................................................................................................................................174.3 Hip — infection within one year .........................................................................................................................................................................................................................174.4 Hip — Deep vein thrombosis/pulmonary embolism (DVT/PE) within one year .......................................................................................184.5 Hip — Death within 90 days ..................................................................................................................................................................................................................................184.6 Knee — Infections within one year .................................................................................................................................................................................................................194.7 Knee — Deep vein thrombosis/pulmonary embolism (DVT/PE) within one year ...................................................................................194.8 Knee — Death within 90 days ..............................................................................................................................................................................................................................20
5. Anaesthetic Complication Rates ........................................................................................................................................................................................215.1 Hip — AMI within 30 days .........................................................................................................................................................................................................................................215.2 Hip — Acute renal failure within 30 days ................................................................................................................................................................................................ 225.3 Hip — CVA/Stroke within 30 days ................................................................................................................................................................................................................... 225.4 Knee — AMI within 30 days ................................................................................................................................................................................................................................... 235.5 Knee — Acute renal failure within 30 days ............................................................................................................................................................................................ 235.6 Knee — CVA/Stroke within 30 days ............................................................................................................................................................................................................... 24
6. Revision Rates ................................................................................................................................................................................................................................................................256.1 National rates ........................................................................................................................................................................................................................................................................256.2 Hip — Revision within one year .......................................................................................................................................................................................................................... 266.3 Hip — Revision within three years ................................................................................................................................................................................................................... 266.4 Hip — Revision within five years .........................................................................................................................................................................................................................276.5 Knee — Revision within one year.......................................................................................................................................................................................................................276.6 Knee — Revision within three years ...............................................................................................................................................................................................................286.7 Knee — Revision within five years ....................................................................................................................................................................................................................28
Clinical Governance Reviews .............................................................................................................................................................................................................29
Appendix A — Data .........................................................................................................................................................................................................................................................31

Scottish Arthroplasty Project Biennial Report 2012
1
Foreword
This report presents the numbers of arthroplasties for 2010 and 2011 and complications for these patients. Previously published as an annual report, the current change was instituted due to the temporary suspension of the Scottish Arthroplasty Project in 2011 for economic reasons. The extensive surgeon support for the project was highlighted at this time by a unanimous call for its re‑establishment. We are currently considering retaining this biennial format with topics of interest published on alternate years. The report as usual includes named NHS Board data and, along with all previous reports, will be available on the SAP website at www.arthro.scot.nhs.uk.
We are grateful for the continued support of the surgeons and NHS Boards in both the provision and checking of the quality of data and for their participation in the governance process. Summary data for individual surgeons will continue to be provided directly to the surgeons in a tabular format. This information provides an important resource in helping in the continued improvement in patient care and for individual surgeons’ revalidation procedures.
The implementation of the continual monitoring of surgeon complications with CUSUM (our method for quickly identifying unusual sequences of complications) has resulted in a more rapid response to potential problems and is now well established. This year we will be investigating its effectiveness in monitoring NHS boards and will report on this next year.
The close relationship the SAP has with Scottish consultants has recently been recognised by a number of arthroplasty registers from around the world, with members of the committee presenting to the orthopaedic surgeons in those countries. These groups are interested in trying to implement the best aspects of the successful Scottish feedback process.
The next two years will be challenging for the Arthroplasty Project and the committee recognises the urgent need for the tracing of the different implant types in use in Scotland. We are exploring the differing options at present and hope to increase the breadth of data whilst retaining the feedback process. Exciting initiatives led by NHS Scotland in electronic patient records offers us unique opportunities for such audit. We will also need to work with our colleagues in other registers in creating uniform information collection across Europe.
Mr. G.P. Ashcroft Chair, Scottish Arthroplasty Project Steering Committee

Scottish Arthroplasty Project Biennial Report 2012
2
Introduction
The Scottish Arthroplasty Project (SAP) analyses hospital inpatient information to link joint replacement surgery (arthroplasty) patients with subsequent medical complications resulting from each operation. Hip and knee replacements are by far the most numerous type of arthroplasty carried out in Scotland1.
Operations and subsequent complications are routinely monitored and any causes for concern (where the rate of incidence of complications rises above an agreed level) are notified to the care team involved. They then review each complication involved, and submit their review and proposed remedial action (if required) for appraisal.
Engagement of the orthopaedic surgery community with this clinical governance process is, with minor exceptions, excellent.
The SAP is administrated by the Information Services Division (ISD) of National Services Scotland (NSS), a special NHS Health Board which provides national strategic support services and expert advice to NHS Scotland. The SAP is managed by the Scottish Arthroplasty Project Steering Committee (SAPSC), and clinical members of the SAPSC carry out appraisal on submitted reviews and remedial action plans. The SAP is overseen by the Scottish Committee for Orthopaedics and Trauma (SCOT).
Previously the monitoring and review process has included complication rates at consultant level only. Developmental work has taken place in 2012 and the extension of this process at hospital and NHS Board level has commenced. This will, in future, allow the identification of causes for concern within extended and multiple care teams.
The SAPSC would like to thank the orthopaedic surgery community for their ongoing support and active engagement with the SAP audit process.
1 It should be noted that this report covers NHS patients and their operations. Where information is presented at NHS Board level, NHS patients treated by independent hospitals are grouped as a proxy NHS Board (Independent Hospital). These data refer to episodes where NHS treatment is carried out by independent (private) providers under local agreements with NHS Boards. They do not represent fully ‘private’ patients; data for these patients is not available to ISD.

Scottish Arthroplasty Project Biennial Report 2012
3
Key Points
• Since 2006, the number of NHS hip and knee replacement operations in Scottish hospitals has remained relatively steady. There were 6,956 primary hip NHS replacements and 6,552 primary knee NHS replacements in Scotland in 2011 (Section 1.1).
• Relatively high numbers of hip and knee arthroplasties were carried out by consultants who performed these operations relatively infrequently, increasing the risk of subsequent complication (Section 1.3).
• The average length of inpatient stay when undergoing hip or knee surgery continued to decrease; from 10 days in 2001 to six in 2011 (Section 3.1).
• Scottish rates of death following hip or knee arthroplasty were less than 0.5% (the lowest ever for hip arthroplasty, Section 4.1).
• Scottish rates of major orthopaedic complications were all less than 1.5% (Section 4.1).
• Scottish rates of revision within one year of hip or knee arthroplasty were less than 1% (Section 6.1).
• Scottish rates of revision within five years of hip or knee arthroplasty were less than 2.5% (Section 6.1).

Scottish Arthroplasty Project Biennial Report 2012
4
1. Number of Arthroplasties
1.1 National ratesSince 2006, the number of NHS hip and knee replacement operations in Scottish hospitals has remained relatively steady.
The vast majority of operations continued to be performed as elective procedures (in 2011, 95% of primary hip replacements and 88% of revisions; 99% of primary knee replacements and 95% of revisions). In 2011, 11% of all hip arthroplasties were revisions. Seven per cent of all knee arthroplasties were revisions.
Figure 1a — Recent trends in numbers of primary hip and knee arthroplasty, Scotland
Figure 1b — Recent trends in numbers of revision hip and knee arthroplasty, Scotland
Knee arthroplastyHip arthroplasty
201120102009200820072006200520042003200220012,000
3,000
4,000
5,000
6,000
7,000
8,000
Num
ber o
f ope
ratio
ns
4,219
6,956
6,552
3,343
Knee revisionHip revision
20112010200920082007200620052004200320022001200
400
600
800
1,000
Num
ber o
f ope
ratio
ns 789
865
473
249

Scottish Arthroplasty Project Biennial Report 2012
5
1.2 Number of arthroplasties by NHS BoardThe number of primary hip and knee arthroplasty operations carried out by NHS Boards broadly reflects the population in each board.
The Golden Jubilee National Hospital (GJNH) is a special NHS Board and accepts NHS patients from all of Scotland. Similarly, NHS patients from all of Scotland may receive NHS funded treatment in independent hospitals (at the discretion of their NHS Board).
Orkney and Shetland NHS Boards do not routinely schedule arthroplasty operations, and patients requiring orthopaedic surgery are scheduled with mainland NHS Boards.
Figure 2a — Number of primary hip arthroplasties 2010/11, by NHS Board of treatment (NHS GG&C split)
Figure 2b — Number of primary knee arthroplasties 2010/11, by NHS Board of treatment (NHS GG&C split)
Num
ber o
f ope
ratio
ns
Hip primary arthroplasties 2011Hip primary arthroplasties 2010Independent h
ospita
lGJN
H
Western
Isles
Taysi
de
Loth
ian
Lanark
shire
Highland
South G
lasgow
North G
lasgow
Clyde
Grampian
Forth
Valley
Fife
Dumfries &
Gall
oway
Borders
Ayrshire
& Arran
0
200
400
600
800
1,000
1,200
Knee primary arthroplasties 2011Knee primary arthroplasties 2010
Num
ber o
f ope
ratio
ns
Independent hosp
ital
GJNH
Western
Isles
Taysi
de
Loth
ian
Lanark
shire
Highland
South G
lasgow
North G
lasgow
Clyde
Grampian
Forth
Valley
Fife
Dumfries &
Gall
oway
Borders
Ayrshire
& Arran
0
200
400
600
800
1,000
1,200

Scottish Arthroplasty Project Biennial Report 2012
6
Table 1a — Number of hip arthroplasties by NHS Board of treatment (NHS GG&C split)
NHS Board
Average number
of operations 2006–2009
Number of operations
2010
Number of operations
2011
Average number
of revisions 2006–2009
Number of revisions
2010
Number of revisions
2011
Ayrshire & Arran 361 417 385 43 52 42Borders 147 181 158 8 1 5
Dumfries & Galloway 121 147 165 7 5 6Fife 352 447 440 39 45 43
Forth Valley 175 183 186 37 28 31Grampian 723 694 695 125 84 93
Clyde 338 394 377 43 56 60North Glasgow 693 685 713 119 99 114South Glasgow 407 421 419 128 106 90
Highland 393 360 414 34 31 37Lanarkshire 376 299 404 47 43 39
Lothian 918 874 945 161 136 155Tayside 715 741 573 87 75 63
Western Isles 44 31 24 0 0 0GJNH 722 938 1038 34 81 87
Independent hospital 319 116 20 2 3 0Scotland 6,801 6,928 6,956 913 845 865
Table 1b — Number of knee arthroplasties by NHS Board of treatment (NHS GG&C split)
NHS Board
Average number
of operations 2006–2009
Number of operations
2010
Number of operations
2011
Average number
of revisions 2006–2009
Number of revisions
2010
Number of revisions
2011
Ayrshire & Arran 305 450 425 26 33 31Borders 134 143 145 9 14 4
Dumfries & Galloway 112 102 164 6 1 Fife 382 367 420 35 55 48
Forth Valley 190 164 202 21 18 20Grampian 546 598 624 38 64 42
Clyde 353 420 370 30 42 44North Glasgow 758 721 819 61 47 67South Glasgow 357 358 373 36 34 43
Highland 290 244 244 22 22 18Lanarkshire 382 448 395 28 37 33
Lothian 817 734 744 65 79 58Tayside 556 617 488 40 38 29
Western Isles 16 21 10 0 0 0GJNH 929 1138 1121 40 52 35
Independent hospital 306 131 8 2 1Scotland 6,432 6,656 6552 456 536 473
SAP monitors rates for all types of arthroplasty; although hip and knee operations are by far the most common, other orthopaedic replacement operations are routinely undertaken in Scotland. Table 2 shows (in descending order) the number and type of arthroplasties carried out on NHS patients in Scotland.
The numbers of consultants performing operations is included to provide a rough indication of operational requirements throughout Scotland; it is not comprehensive and does not reflect the complex factors involved in workforce planning.

Scottish Arthroplasty Project Biennial Report 2012
7
Table 2 — Number of arthroplasties and operative consultants in 2010 and 2011
Average number
of operations 2006–2009
Number of operations
2010
Number of operations
2011
Average number of consultants performing operations 2006–2009
Number of consultants performing operations
2010
Number of consultants performing operations
2011
Hip 6,801 6,928 6,956 204 219 219Knee 6,432 6,656 6,552 186 203 198
Hip revision 913 845 865 140 137 137Knee revision 456 537 473 104 97 98
Shoulder 375 397 378 92 98 97Excision 261 280 321 112 114 117
Other 204 129 121 84 62 65Finger 65 64 66 19 18 21Elbow 60 10 0 17 6 0
Thumb 51 41 53 15 8 15Toe 48 37 30 19 14 11
Ankle 43 42 46 9 13 13Knee resurfacing 35 23 17 19 21 15
Other resurfacing 26 14 18 16 12 16Shoulder revision 20 22 27 12 11 16
Wrist 20 21 12 7 11 6Patella resurfacing 18 16 30 13 15 20
Total 15,824 16,062 15,965 1,069 1,059 1,064
Table 2 includes emergency admissions. The number of surgeons performing operations may be inflated by those who carry out occasional emergency surgery.

Scottish Arthroplasty Project Biennial Report 2012
8
1.3 Consultants performing small volumesConsultants who carry out a relatively low volume of orthopaedic surgical operations risk a higher rate of complication due to relatively lower levels of experience and knowledge. Each hospital and consultant will have a unique work pattern and in many cases arthroplasty represents only a small part of the overall surgical workload. However, operating teams are encouraged to promote the use of specialist arthroplasty surgeons in preference to ‘occasional’ surgeons.
Figure 3 — Recent trends in operations carried out by low volume operators
Perc
enta
ge o
f ope
ratio
ns
Knee arthroplasties carried out by surgeons who perform such operations <= 20 times in the calendar yearKnee revisions carried out by surgeons who perform such operations <= 5 times in the calendar year
Hip arthroplasties carried out by surgeons who perform such operations <= 20 times in the calendar yearHip revisions carried out by surgeons who perform such operations <= 10 times in the calendar year
0
10
20
30
40
50
60
20112010200920082007200620052004200320022001

Scottish Arthroplasty Project Biennial Report 2012
9
2. Patient Demographics
2.1 AgeOrthopaedic patients are, by the nature of the medical conditions requiring arthroplasty, relatively older inpatients. Since 2001, the average age for primary hip arthroplasty has remained relatively steady, while that of primary knee arthroplasty has decreased slightly in recent years. This may be due to improvements in orthopaedic sport‑related treatments allowing their increased provision to younger age groups. Figure 4 shows the recent trends in the average (mean) ages of hip and knee arthroplasty patients.
In 2011 59% of primary hip or knee arthroplasty patients were female, compared to 57% of hip or knee revisions. This trend has been relatively unchanged in recent years.
Patients undergoing revision operations tend to be older than those undergoing primary operations, due to the fact that revisions are carried out on existing implants. Major operations such as joint replacement tend to be undertaken less frequently in the very elderly due to pre‑existing complications.
One of the demographic factors contributing to complications following hip or knee arthroplasty is obesity, and consideration of this is common in the review of complications. Analysis of this on a national level would be useful, but due to the nature of nationally established data collection processes, indicators of obesity (BMI, height/weight etc.) are not available.
Figure 4 — Recent trends in average age of hip and knee arthroplasty patients
Year
s
Knee revisionKnee arthroplastyHip revisionHip arthroplasty
2011201020092008200720062005200420032002200166
67
68
69
70
71

Scottish Arthroplasty Project Biennial Report 2012
10
2.2 Pre‑operative medical conditionsThe principal medical condition recorded for patients receiving hip arthroplasty in 2011 was coxarthrosis, a degenerative disease of the hip. The main medical condition recorded for patients receiving knee arthroplasty in 2011 was gonarthrosis, a degenerative disease of the knee.
It should be noted that the principal condition is recorded as the main reason for admission/surgery, but the patient may have additional conditions which are taken into consideration by the care team; the principal condition is not the sole determinant for surgery.
The following charts show recorded principal pre‑operative conditions; the ‘Other condition’ category combines those conditions which were considerably less prevalent than other categories (usually occurring in very low numbers).
Figure 5a — Principal pre‑operative conditions, hip arthroplasty, 2011
Figure 5b — Principal pre‑operative conditions, hip revision, 2011
Other condition
Other Arthritis
Complications of Int. Prosthesis
Other Arthrosis
Other Joint Disorders
Gonarthrosis
Osteonecrosis
Fracture Of Femur
Coxarthrosis
219
50
53
73
95
108
123
330
6,118
Other condition
Other Joint Disorders
Postprocedural Msk Disorders
Coxarthrosis
Fracture Of Femur
Other Orthopaedic Follow-Up Care
Complications of Int. Prosthesis
56
28
31
36
42
49
645

Scottish Arthroplasty Project Biennial Report 2012
11
Figure 5c — Principal pre‑operative conditions, knee arthroplasty, 2011
Figure 5d — Principal pre‑operative conditions, knee revision, 2011
Other condition
Other Arthrosis
Coxarthrosis
Other Arthritis
Other Joint Disorders
Other Rheumatoid Arthritis
Gonarthrosis
118
67
68
78
82
96
6,208
Other condition
Gonarthrosis
Other Joint Disorders
Other Orthopaedic Follow-Up Care
Complications of Int. Prosthesis
50
37
40
45
330

Scottish Arthroplasty Project Biennial Report 2012
12
3. Inpatient Episodes
3.1 Length of staySince 2006, the mean length of inpatient stay when undergoing HS hip and knee replacement operations in Scottish hospitals has continued to decrease.
Figure 6 — Recent trends in overall length of stay for elective hip and knee arthroplasties
The mean pre‑operative length of stay for hip and knee arthroplasty patients in each NHS Board is relatively uniform (one day or less); patients are rarely admitted any earlier than the day before surgery.
Length of post‑operative care varies widely between boards from four to seven days for hips and knees. Figures 7a and 7b show the average lengths of stay (overall, pre‑ and post‑operative) for each NHS Board.
Within NHS Boards patients spend similar lengths of time in hospitals for both hip and knee replacements. This is due to similar pre‑operative planning, anaesthetic regimes, analgesic regimes, care pathways, nursing and medical attitudes to both hip and knee replacement patients in each NHS Board.
Aver
age
leng
th o
f sta
y (d
ays)
Knee arthroplastyHip arthroplasty
201120102009200820072006200520042003200220015
6
7
8
9
10
11

Scottish Arthroplasty Project Biennial Report 2012
13
Fig 7a — Average length of stay for hip arthroplasties 2011 by NHS Board (NHS GG&C split)
Figure 7b — Average length of stay for knee arthroplasties 2011 by NHS Board (NHS GG&C split)
Day
s
Post-operativePre-operative
Independent hosp
ital
GJNH
Western
Isles
Taysi
de
Loth
ian
Lanark
shire
Highland
South G
lasgow
North G
lasgow
Clyde
Grampian
Forth
Valley
Fife
Dumfries &
Gall
oway
Borders
Ayrshire
& Arran
0
2
4
6
8
10
Day
s
Post-operativePre-operative
Independent hosp
ital
GJNH
Western
Isles
Taysi
de
Loth
ian
Lanark
shire
Highland
South G
lasgow
North G
lasgow
Clyde
Grampian
Forth
Valley
Fife
Dumfries &
Gall
oway
Borders
Ayrshire
& Arran
0
2
4
6
8
10

Scottish Arthroplasty Project Biennial Report 2012
14
4. Orthopaedic Complication Rates
The major complications following elective primary hip or knee replacement are:
• Death;
• Dislocation;
• Infection of the operated joint and
• Deep vein thrombosis/pulmonary embolism (DVT/PE).
Complication rates have been standardised for patient age, gender, osteoarthritis and rheumatoid arthritis. Figures showing complication rates with a follow‑up period of one year exclude operations carried out in 2011. Figures showing complication rates with a follow‑up period of 90 days include operations carried out in 2011.
Where data are presented as a ‘funnel’ chart, the upper confidence limit represents a warning threshold derived from the national rate and number of operations carried out. Rates of complication which appear above the curved red line are a possible cause for concern and should be investigated where possible.
As described in the Foreword and Introduction, developmental work to apply the CUSUM methodology to NHS Boards and individual hospitals is ongoing. When implemented, their complication rates will be monitored on a quarterly basis and they may be asked to submit to a review process where appropriate.
4.1 National trendsKnee dislocations are very rare so are not included in these charts.
Figure 8a — National rates for complications within 90 days, hip arthroplasty
Perc
enta
ge
Death within 90 daysDVT/PE within 90 days
2011201020092008200720062005200420032002200120000
0.5
1
1.5
2
2.5

Scottish Arthroplasty Project Biennial Report 2012
15
Figure 8b — National rates for complications within one year, hip arthroplasty
Figure 8c — National rates for complications within 90 days, knee arthroplasty
Perc
enta
ge
Infection within 1 yearDislocation within 1 year
2011201020092008200720062005200420032002200120000
0.5
1
1.5
2
Perc
enta
ge
Death within 90 daysDVT/PE within 90 days
2011201020092008200720062005200420032002200120000
0.5
1
1.5
2
2.5

Scottish Arthroplasty Project Biennial Report 2012
16
Figure 8d — National rates for complications within one year, knee arthroplasty
Perc
enta
ge
Infection within 1 year
2011201020092008200720062005200420032002200120000
0.5
1
1.5
2
2.5

Scottish Arthroplasty Project Biennial Report 2012
17
4.2 Hip — dislocation within one yearFigure 9 — Percentage of 2010 hip arthroplasty patients with subsequent dislocation within one year
Average, funnel and standardisation calculated on 5-year data 2006–2010.
4.3 Hip — infection within one yearFigure 10 — Percentage of 2010 hip arthroplasty patients with subsequent infection within one year
Average, funnel and standardisation calculated on 5-year data 2006–2010.
Operations
Stan
dard
ised
rate
(%)
National complication rateNHS Board of Treatment (NHS GG&C split)Upper confidence limit
0 100 200 300 400 500 600 700 800 900 1,0000
0.5
1
1.5
2
2.5
3
A&A
SGFife
GramNG
Tay
LothGJNHClyde
High
D&G
WI Bord F VInd
Lan
Operations
Stan
dard
ised
rate
(%)
National complication rateNHS Board of Treatment (NHS GG&C split)Upper confidence limit
0 100 200 300 400 500 600 700 800 900 1,0000
1
2
3
4
5
6
A&A
SG
Fife Gram
NG
Tay
Loth GJNHClyde
High
D&G
WI
Bord
FV
IndLan
Ind� — Independent HospitalLan — LanarkshireFV� — Forth ValleyLoth� — LothianNG� — North GlasgowTay� — TaysideSG� — South GlasgowWI — Western Isles
A&A — Ayrshire and ArranBord� — BordersCly�d�e� — ClydeD&G� — Dumfries and GallowayFife� — FifeG�JNH� — Golden Jubilee National HospitalG�ramp� — GrampianH�igh� — Highland

Scottish Arthroplasty Project Biennial Report 2012
18
4.4 Hip — Deep vein thrombosis/pulmonary embolism (DVT/PE) within one yearFigure 11 — Percentage of 2010 hip arthroplasty patients with subsequent DVT/PE within one year
Average, funnel and standardisation calculated on 5-year data 2006–2010.
4.5 Hip — Death within 90 daysFigure 12 — Percentage of 2011 hip arthroplasty patients who died within 90 days
Average, funnel and standardisation calculated on 5-year data 2007–2011.
Operations
Stan
dard
ised
rate
(%)
National complication rateNHS Board of Treatment (NHS GG&C split)Upper confidence limit
0 200 400 600 800 1,000 1,2000
1
2
3
4
5
6
A&A SGFife
Gram
NG
Tay
LothGJNH
ClydeHigh
D&G
WI
BordFV
Ind
Lan
Operations
Stan
dard
ised
rate
(%)
National complication rateNHS Board of Treatment (NHS GG&C split)Upper confidence limit
0 200 400 600 800 1,000 1,2000
0.2
0.4
0.6
0.8
1
1.2
1.4
A&A SG Fife
Gram
NG
Tay LothGJNH
Clyde
High
D&G
WI Bord FVInd Lan
Scottish Arthroplasty Project Biennial Report 2012
19
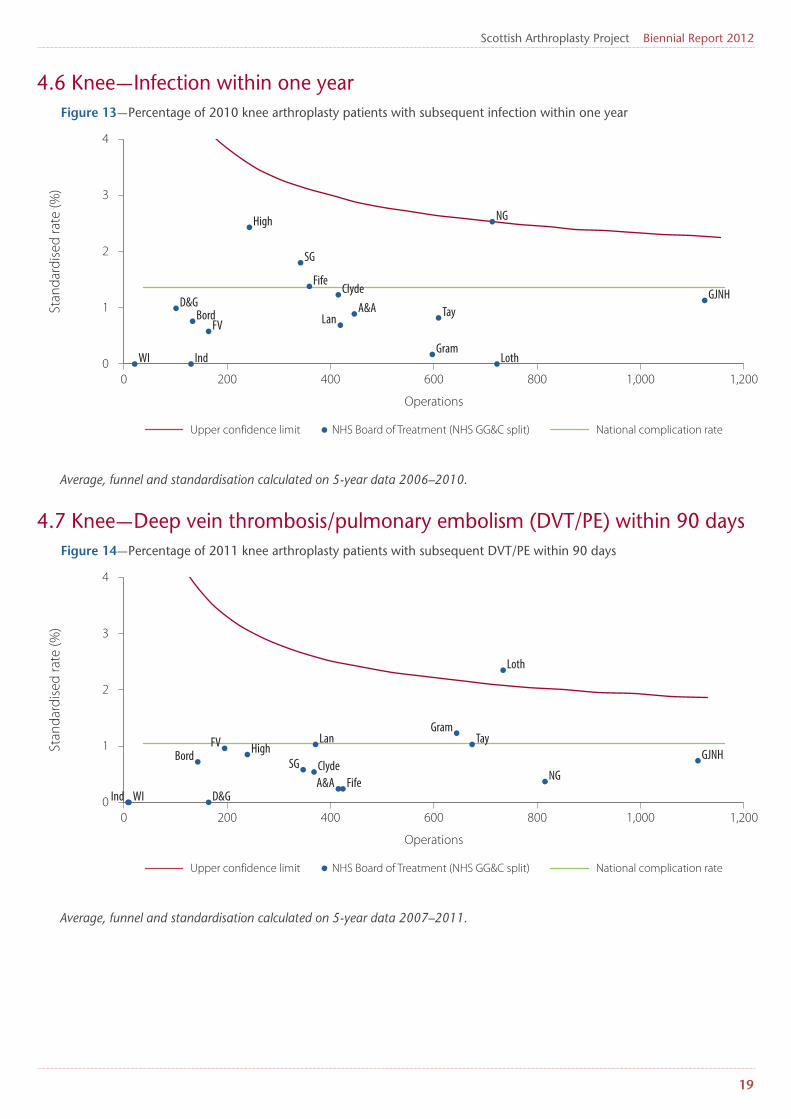
4.6 Knee — Infection within one yearFigure 13 — Percentage of 2010 knee arthroplasty patients with subsequent infection within one year
Average, funnel and standardisation calculated on 5-year data 2006–2010.
4.7 Knee — Deep vein thrombosis/pulmonary embolism (DVT/PE) within 90 daysFigure 14 — Percentage of 2011 knee arthroplasty patients with subsequent DVT/PE within 90 days
Average, funnel and standardisation calculated on 5-year data 2007–2011.
Operations
Stan
dard
ised
rate
(%)
National complication rateNHS Board of Treatment (NHS GG&C split)Upper confidence limit
0 200 400 600 800 1,000 1,2000
1
2
3
4
A&A
SG
Fife
Gram
NG
Tay
Loth
GJNHClyde
High
D&G
WI
BordFV
Ind
Lan
Operations
Stan
dard
ised
rate
(%)
National complication rateNHS Board of Treatment (NHS GG&C split)Upper confidence limit
0 200 400 600 800 1,000 1,2000
1
2
3
4
A&ASG
Fife
Gram
NG
Tay
Loth
GJNHClyde
High
D&GWI
BordFV
Ind
Lan

Scottish Arthroplasty Project Biennial Report 2012
20
4.8 Knee — Death within 90 daysFigure 15 — Percentage of 2011 knee arthroplasty patients who died within 90 days
Average, funnel and standardisation calculated on 5-year data 2007–2011.
Operations
Stan
dard
ised
rate
(%)
National complication rateNHS Board of Treatment (NHS GG&C split)Upper confidence limit
0 200 400 600 800 1,000 1,2000
0.4
0.8
1
1.6
2
A&A
SG
Fife
GramNG
TayLoth
GJNHClyde
High
D&GWI Bord FVInd
Lan

Scottish Arthroplasty Project Biennial Report 2012
21
5. Anaesthetic Complication Rates
Complications associated with the surgical application of anaesthetic are:
• Acute myocardial infarction (AMI);
• Acute renal failure and,
• Cerebrovascular accident (CVA) or stroke.
Complication rates are standardised for type of operation (primary or revision), patient age, gender, osteoarthritis and rheumatoid arthritis.
Figures showing complication rates with a follow‑up period of one year exclude operations carried out in 2011. Figures showing complication rates with a follow‑up period of 90 days include operations carried out in 2011.
Where data are presented as a ‘funnel’ chart, the upper confidence limit represents a warning threshold derived from the national rate and number of operations carried out. Rates of complication which appear above this curved red line are a possible cause for concern and should be investigated where possible.
5.1 Hip — AMI within 30 daysFigure 16 — Percentage of 2011 hip arthroplasty patients with subsequent AMI within 30 days
Average, funnel and standardisation calculated on 5-year data 2007–2011.
Operations
Stan
dard
ised
rate
(%)
National complication rateNHS Board of Treatment (NHS GG&C split)Upper confidence limit
0 200 400 600 800 1,000 1,2000
0.4
0.8
1.2
1.6
2
A&A SG
Fife
Gram NG
Tay Loth
GJNH
Clyde
High
D&G
WI
BordFV
Ind
Lan

Scottish Arthroplasty Project Biennial Report 2012
22
5.2 Hip — Acute renal failure within 30 daysFigure 17 — Percentage of 2011 hip arthroplasty patients with subsequent acute renal failure within 30 days
Average, funnel and standardisation calculated on 5-year data 2007–2011.
5.3 Hip — CVA/Stroke within 30 daysFigure 18 — Percentage of 2011 hip arthroplasty patients with subsequent CVA/stroke within 30 days
Average, funnel and standardisation calculated on 5-year data 2007–2011.
Operations
Stan
dard
ised
rate
(%)
National complication rateNHS Board of Treatment (NHS GG&C split)Upper confidence limit
0 200 400 600 800 1,000 1,2000
1
2
3
4
A&ASG
FifeGram
NG
TayLoth
GJNHClydeHigh
D&G
WI
Bord
FVInd
Lan
Operations
Stan
dard
ised
rate
(%)
National complication rateNHS Board of Treatment (NHS GG&C split)Upper confidence limit
0 200 400 600 800 1,000 1,2000
0.4
0.8
1.2
1.6
2
A&A
SGFife
Gram
NG
Tay
Loth
GJNH
Clyde
HighD&G
WI
Bord
FVInd Lan

Scottish Arthroplasty Project Biennial Report 2012
23
5.4 Knee — AMI within 30 daysFigure 19 — Percentage of 2011 knee arthroplasty patients with subsequent AMI within 30 days
Average, funnel and standardisation calculated on 5-year data 2007–2011.
5.5 Knee — Acute renal failure within 30 daysFigure 20 — Percentage of 2011 knee arthroplasty patients with subsequent acute renal failure within 30 days
Average, funnel and standardisation calculated on 5-year data 2007–2011.
Operations
Stan
dard
ised
rate
(%)
National complication rateNHS Board of Treatment (NHS GG&C split)Upper confidence limit
0 200 400 600 800 1,000 1,2000
0.4
0.8
1.2
1.6
2
A&A
SG
Fife
Gram NG
Tay
Loth
GJNH
Clyde
High
D&GWI
Bord
FV
Ind
Lan
Operations
Stan
dard
ised
rate
(%)
National complication rateNHS Board of Treatment (NHS GG&C split)Upper confidence limit
0 200 400 600 800 1,000 1,2000
0.5
1
1.5
2
2.5
3
18
18.5
19
A&ASG
Fife
Gram
NG
Tay
Loth
GJNH
Clyde
High
D&G
WI
Bord
FVInd
Lan

Scottish Arthroplasty Project Biennial Report 2012
24
5.6 Knee — CVA/Stroke within 30 daysFigure 21 — Percentage of 2011 knee arthroplasty patients with subsequent CVA/stroke within 30 days
Average, funnel and standardisation calculated on 5-year data 2007–2011.
Operations
Stan
dard
ised
rate
(%)
National complication rateNHS Board of Treatment (NHS GG&C split)Upper confidence limit
0 200 400 600 800 1,000 1,2000
0.5
1
1.5
2
2.5
A&A
SG
Fife
Gram
NG
Tay
Loth
GJNH
Clyde
High
D&G
WI
Bord
F VInd Lan

Scottish Arthroplasty Project Biennial Report 2012
25
6. Revision Rates
Revision rates are calculated at 1, 3 and 5 years after surgery and have been standardised for patient age, gender, osteoarthritis and rheumatoid arthritis.
Where data are presented as a ‘funnel’ chart, the upper confidence limit represents a warning threshold derived from the national rate and number of operations carried out. Rates which appear above this curved red line are a possible cause for concern and should be investigated where possible.
6.1 National ratesFigure 22a — National rates for hip arthroplasty with subsequent revision
Figure 22b — National rates for knee arthroplasty with subsequent revision
Patie
nts w
ith su
bseq
uent
revi
sion
(%)
Within 5 yearsWithin 3 yearsWithin 1 yearWithin 90 days
2011201020092008200720062005200420032002200120000
0.5
1
1.5
2
2.5
Patie
nts w
ith su
bseq
uent
revi
sion
(%)
2011201020092008200720062005200420032002200120000
0.5
1
1.5
2
2.5
3
Within 5 yearsWithin 3 yearsWithin 1 yearWithin 90 days

Scottish Arthroplasty Project Biennial Report 2012
26
6.2 Hip — Revision within one yearFigure 23 — Percentage of 2010 hip arthroplasty patients with subsequent revison within one year
Average, funnel and standardisation calculated on 5-year data 2006–2010.
6.3 Hip — Revision within three yearsFigure 24 — Percentage of 2008 hip arthroplasty patients with subsequent revision within three years
Average, funnel and standardisation calculated on 5-year data 2004–2008.
0 200 400 600 800 1,000 1,2000
0.5
1
1.5
2
2.5
3
Operations
Stan
dard
ised
rate
(%)
National complication rateNHS Board of Treatment (NHS GG&C split)Upper confidence limit
A&A
SG FifeGram
NGTay
Loth
GJNHClyde
High
D&G
WI Bord
FV
Ind
Lan
Operations
Stan
dard
ised
rate
(%)
National complication rateNHS Board of Treatment (NHS GG&C split)Upper confidence limit
0 100 200 300 400 500 600 700 800 900 1,0000
1
2
3
4
5
A&A
SG
Fife GramNG
Tay
Loth
GJNHClyde
High
D&G
WI
Bord
FV
Ind
Lan

Scottish Arthroplasty Project Biennial Report 2012
27
6.4 Hip — Revision within five yearsFigure 25 — Percentage of 2006 hip arthroplasty patients with subsequent revision within five years
Average, funnel and standardisation calculated on 5-year data 2002–2006.
6.5 Knee — Revision within one yearFigure 26 — Percentage of 2010 knee arthroplasty patients with subsequent revision within one year
Average, funnel and standardisation calculated on 5-year data 2006–2010.
Operations
Stan
dard
ised
rate
(%)
National complication rateNHS Board of Treatment (NHS GG&C split)Upper confidence limit
0 100 200 300 400 500 600 700 800 900 1,0000
1
2
3
4
5
6
A&A
SG
FifeGram
NG
Tay
Loth
GJNH
Clyde
High
D&G
WI
Bord
FV
Ind
Lan
Operations
Stan
dard
ised
rate
(%)
National complication rateNHS Board of Treatment (NHS GG&C split)Upper confidence limit
0 200 400 600 800 1,000 1,2000
0.4
0.8
1.2
1.6
2
A&A
SG
Fife
Gram
NG
Tay
Loth GJNHClyde
HighD&GWI
Bord
FVInd
Lan

Scottish Arthroplasty Project Biennial Report 2012
28
6.6 Knee — Revision within three yearsFigure 27 — Percentage of 2008 knee arthroplasty patients with subsequent revision within three years
Average, funnel and standardisation calculated on 5-year data 2004–2008.
6.7 Knee — Revision within five yearsFigure 28 — Percentage of 2006 knee arthroplasty patients with subsequent revision within five years
Average, funnel and standardisation calculated on 5-year data 2002–2006.
Operations
Stan
dard
ised
rate
(%)
National complication rateNHS Board of Treatment (NHS GG&C split)Upper confidence limit
0 200 400 600 800 1,000 1,2000
1
2
3
4
5
6
7
8
9
A&A
SG
FifeGram
NGTay Loth GJNH
Clyde
HighD&G
WI
Bord
FV
Ind
Lan
Operations
Stan
dard
ised
rate
(%)
National complication rateNHS Board of Treatment (NHS GG&C split)Upper confidence limit
0 100 200 300 400 500 600 700 800 900 1,0000
1
2
3
4
5
6
A&A
SG
Fife
GramNG
Tay
LothGJNHClyde
High
D&G
WI
Bord
FV
Ind
Lan

Scottish Arthroplasty Project Biennial Report 2012
29
Clinical Governance Reviews
Clinical Governance: ’A framework through which NHS organisations are accountable for continually improving the quality of their services and safeguarding high standards of care by creating an environment in which excellence in clinical care will flourish.’2
Clinical Governance is the system used by NHS organisations to monitor and review the quality of healthcare provided so that high standards of care are maintained and patient safety improved. Since 2004, with the support of the Scottish Committee for Orthopaedics and Trauma (SCOT), the policy of the Scottish Arthroplasty Project (SAP) has been to provide high quality data on activity and complications that can be used at a local level to promote quality improvement. Simple monitoring of activity and quality may influence clinical practice but can be insufficient to create significant change. With the support of the SCOT committee, the SAP operates a feedback and review system at NHS Board and consultant level to identify potential quality issues.
From 2003 to 2009, Shewhart control chart methodology was used to present complication data and identify any unusual variation. In the control charts, 5‑year aggregated outcomes for NHS Boards or consultants were casemix‑adjusted and plotted in relation to three standard deviations above and below the mean. If an NHS Board or consultant lay outside this statistical limit they were identified as outliers. At this point, under our Clinical Governance remit, we provided them with this information and asked that they review their complications.
In 2010, the SAP developed CUSUM (CUmulative SUMmation) methodology to allow us to better identify unusual runs of complications more quickly than the previous method. In simple terms, operations are plotted on a graph as a rate over time. If an operation has an associated complication, the CUSUM rate increases markedly. Subsequent operations without known complication bring the rate down by smaller increments. Three of these ‘jumps’ for the same type of complication in close succession, will raise the CUSUM rate over an agreed control limit; in practice the limit is usually breached over longer periods of time, which include more ‘jumps’ but also many completely successful operations.
These rates are calculated each month for all consultants carrying out orthopaedic operations on NHS patients in Scotland.
When outliers are identified, recipients are asked to undertake local reviews that investigate the reasons for these results and report back to the SAP. The introduction of a new technique, a new implant or particular case mix issues may be identified as reasons for an apparent rise. Clinical members of the Scottish Arthroplasty Project Steering Committee (SAPSC) grade these reviews and provide feedback. If the response is viewed as less than satisfactory, a resubmission is requested and the issue may be escalated to senior management within the appropriate NHS Board. The review process is administered by ISD analysts and is subject to NSS confidentiality policy — individual consultant responses are anonymised before being passed on for review.
Figure 29 shows the number of outlier notifications passed to consultants during 2010/11. The high number at the beginning of 2010 reflects the inception of CUSUM methodology; being the first time this was run, an initially higher number of outliers were identified. Feedback and the grading of reviews by the committee is confidential; responses, in general, contain high levels of self‑review and self‑criticism with constructive initiatives to address any issues arising from the analysis.
2 Scally G. and Donaldson L.J., (1998), Clinical governance and the drive for quality improvement in the new NHS in England., British Medical Journal 317 (7150), 4 July, pp.61–65.

Scottish Arthroplasty Project Biennial Report 2012
30
Figure 29 — SAP outlier notifications 2010 and 2011
The purpose of reviewing outliers is to emphasise quality improvement, rather than to attribute blame. The aim of the review process is to continue to encourage local review of clinical practice and data quality, both of which contribute to the continual improvement of patient care.
Num
ber o
f not
ifica
tions
Number of outlier notifications sent
Jul–Dec 2011Jan–Jun 2011Jul–Dec 2010Jan–Jun 20100
10
20
30
40
50
43
34
12
21

Scottish Arthroplasty Project Biennial Report 2012
31
Appendix A — Data
Data SourcesThe Scottish Arthroplasty Project is administrated by the Information Services Division (ISD) of National Services Scotland (NSS), a special NHS Health Board. ISD use information submitted by Scottish hospitals (known as SMR01 data) to calculate statistical information related to NHS arthroplasty operations in Scottish hospitals.
Information on SMR01 is available here: www.isdscotland.org/Products‑and‑Services/Hospital‑Records‑Data‑Monitoring.
Data completenessAll SMR01 data are required to be securely submitted to ISD no later than six weeks after the end of the month of discharge. Although Medical Records departments within hospitals and NHS Boards make every effort to comply, circumstances outwith their control may mean that this target is not always met. SMR01 data required for the analyses in this report are considered to be 100% complete.
Information on SMR01 data completeness is available here: www.isdscotland.org/Products‑and‑Services/Hospital‑Records‑Data‑Monitoring.
Arthroplasty codingInformation on codes used to identify arthroplasty operations is available here: www.arthro.scot.nhs.uk/Data_Collection/OPCS_codes_summary_150710.pdf.