scott a. speakman, ph.d. basics of x-ray powder diffraction scott a speakman, ph.d....
TRANSCRIPT
Scott A. Speakman, Ph.D. http://prism.mit.edu/xray
Basics of X-Ray Powder Diffraction
Scott A Speakman, [email protected]
(617) 253-6887
http://prism.mit.edu/xray

Scott A. Speakman, Ph.D. http://prism.mit.edu/xray
Training Required to become an Independent User in the
X-Ray Shared Experimental Facilityat the
Center for Materials Science and Engineering at MIT

Required Safety Training
1. The “X-Ray and Lab Specific Safety Training Class” taught in the X-Ray SEF will fulfill two mandatory requirements:– All users must complete the EHS X-ray Safety training, course #EHS0361c– All users must complete the X-ray SEF Lab Specific Safety Training
2. All users must complete the MIT online chemical hygiene training, course #EHS0100w
3. All users must be up to date on their MIT managing hazardous waste training, course #EHS0501w
4. All users must be registered in CMSE user management system, MUMMS– https://cmse-coral.mit.edu/mumms/home.html
5. All users must read the CMSE chemical hygiene plan and sign-off on the chemical hygiene plan in MUMMS
Instrument Specific Training
• These courses cover how to safely operate instruments to collect data.• Users much complete the instrument specific training for each instrument
that they wish to use, even if they have used a similar instrument elsewhere.
• Powder Diffractometers:– PANalytical X’Pert Pro Multipurpose Powder Diffractometer– Rigaku SmartLab Multipurpose Diffractometer– Rigaku Cr-Source Powder Diffractometer– Bruker D8 with GADDS 2-dimensional detector
• Other instruments– Bruker D8 HRXRD– Bruker Handheld XRF– Multiwire Back-Reflection Laue Diffractometer
Data Analysis Workshops
• These workshops are optional, but highly recommended, so that users can perform effective and accurate analysis of their diffraction data
• Basic XRPD Data Analysis using HighScore Plus– Primary focus is on phase identification and qualitative analysis, with some discussion on
topics such as lattice parameter and crystallite size calculations
• Quantitative Analysis using Profile Fitting and Line Profile Analysis– Profile fitting is the most precise way to determine diffraction peak position, intensity,
and width for calculating lattice parameters and crystallite size
• Rietveld Refinement– The Rietveld method is used to refine the crystal structure model of a material. It can be
used for quantitative phase analysis, lattice parameter and crystallite size calculations, and to refine crystal structure parameters such as atomic positions and occupancies
High Resolution X-Ray Diffraction (HRXRD) Training
• HRXRD is used to analyze epitaxial thin films– Can determine composition, strain/relaxation, lattice parameters (in-
plane and out-of-plane), thickness, and defect concentration
• X-Ray Reflectivity (XRR) is used to analyze thin films, including amorphous and non-textured films– Can determine thickness, roughness, and density
• Introduction Lecture• Instrument training on the Bruker HRXRD and/or Rigaku
SmartLab• HRXRD Data Analysis Workshop

Scott A. Speakman, Ph.D. http://prism.mit.edu/xray
Introduction to Crystallography and X-Ray Diffraction Theory

2012 was the 100th Anniversary of X-Ray Diffraction
• X-rays were discovered by WC Rontgen in 1895• In 1912, PP Ewald developed a formula to describe the
passage of light waves through an ordered array of scattering atoms, based on the hypothesis that crystals were composed of a space-lattice-like construction of particles.
• Maxwell von Laue realized that X-rays might be the correct wavelength to diffract from the proposed space lattice.
• In June 1912, von Laue published the first diffraction pattern in Proceedings of the Royal Bavarian Academy of Science.
The diffraction pattern of copper sulfate, published in 1912
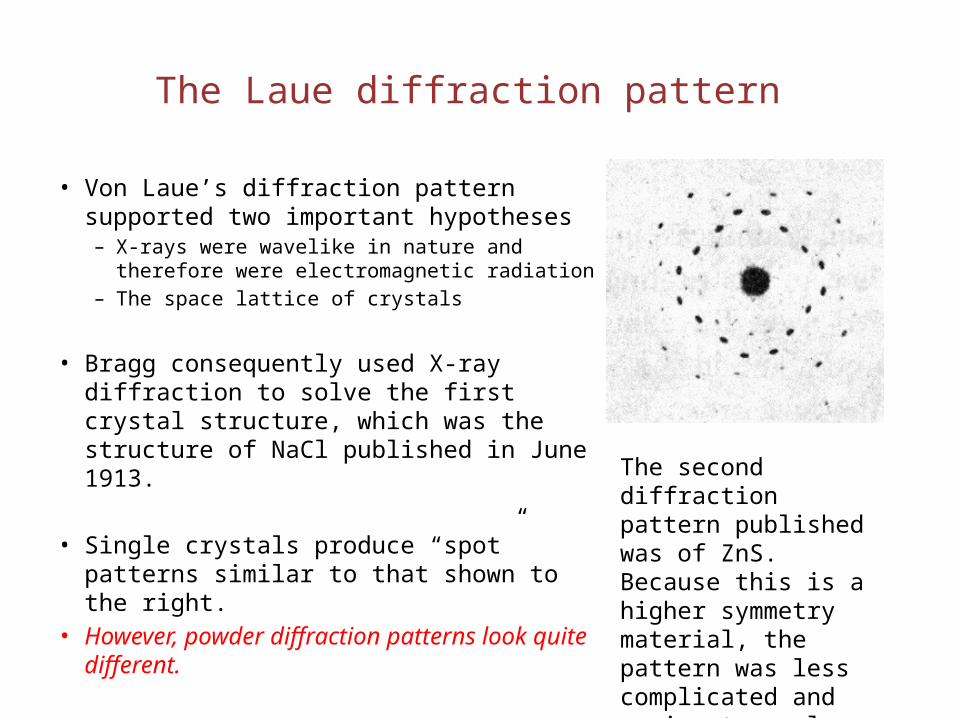
The Laue diffraction pattern
• Von Laue’s diffraction pattern supported two important hypotheses– X-rays were wavelike in nature and therefore
were electromagnetic radiation– The space lattice of crystals
• Bragg consequently used X-ray diffraction to solve the first crystal structure, which was the structure of NaCl published in June 1913.
• Single crystals produce “spot” patterns similar to that shown to the right.
• However, powder diffraction patterns look quite different.
The second diffraction pattern published was of ZnS. Because this is a higher symmetry material, the pattern was less complicated and easier to analyze
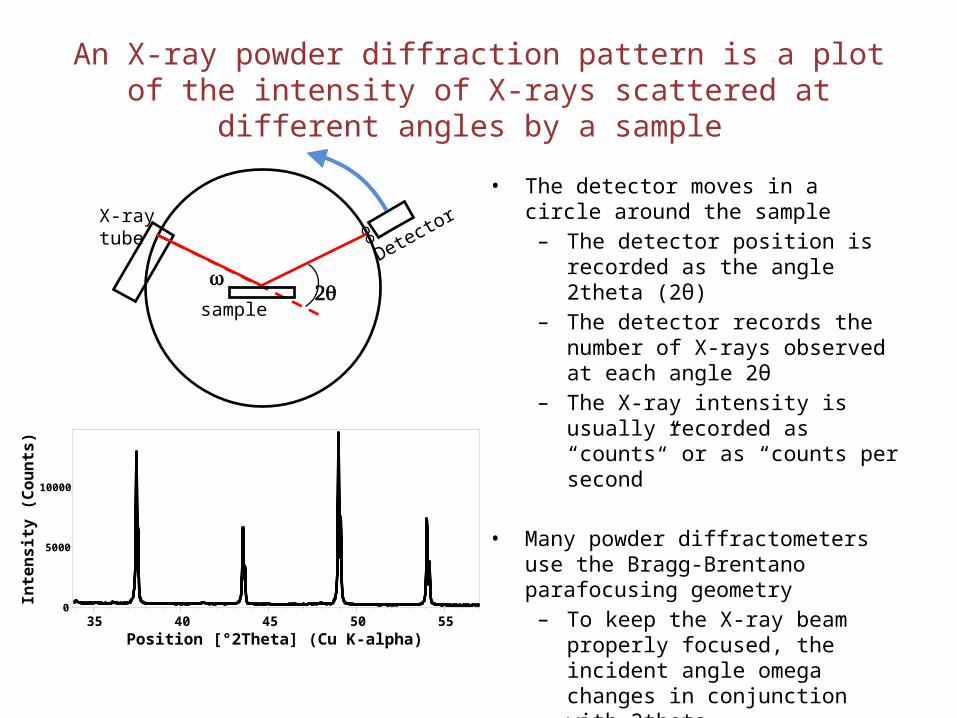
An X-ray powder diffraction pattern is a plot of the intensity of X-rays scattered at different angles by a sample
• The detector moves in a circle around the sample
– The detector position is recorded as the angle 2theta (2θ)
– The detector records the number of X-rays observed at each angle 2θ
– The X-ray intensity is usually recorded as “counts” or as “counts per second”
• Many powder diffractometers use the Bragg-Brentano parafocusing geometry
– To keep the X-ray beam properly focused, the incident angle omega changes in conjunction with 2theta
– This can be accomplished by rotating the sample or by rotating the X-ray tube.
w2q
X-ray tube
Detector
sample
Position [°2Theta] (Cu K-alpha)35 40 45 50 55
Inte
ns
ity
(C
ou
nts
)
0
5000
10000
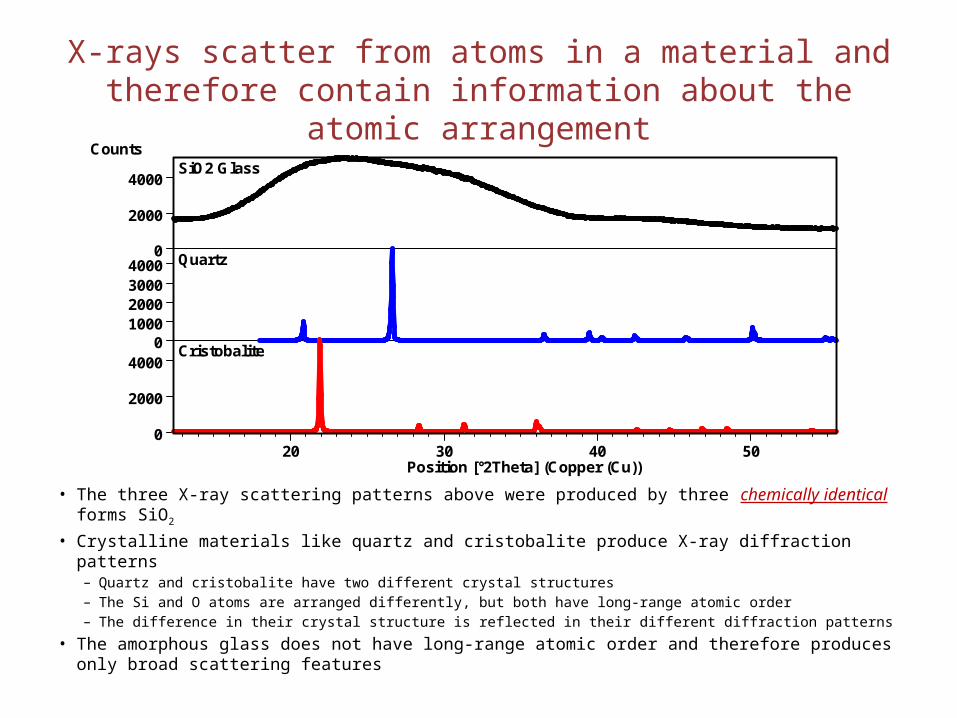
X-rays scatter from atoms in a material and therefore contain information about the atomic arrangement
• The three X-ray scattering patterns above were produced by three chemically identical forms SiO2
• Crystalline materials like quartz and cristobalite produce X-ray diffraction patterns– Quartz and cristobalite have two different crystal structures– The Si and O atoms are arranged differently, but both have long-range atomic order– The difference in their crystal structure is reflected in their different diffraction patterns
• The amorphous glass does not have long-range atomic order and therefore produces only broad scattering features
Position [°2Theta] (Copper (Cu))20 30 40 50
Counts
0
2000
4000
01000200030004000
0
2000
4000
SiO2 Glass
Quartz
Cristobalite
Diffraction occurs when light is scattered by a periodic array with long-range order, producing constructive interference at
specific angles.
• The electrons in each atom coherently scatter light. – We can regard each atom as a coherent point scatterer– The strength with which an atom scatters light is proportional to the number of electrons
around the atom.
• The atoms in a crystal are arranged in a periodic array with long-range order and thus can produce diffraction.
• The wavelength of X rays are similar to the distance between atoms in a crystal. Therefore, we use X-ray scattering to study atomic structure.
• The scattering of X-rays from atoms produces a diffraction pattern, which contains information about the atomic arrangement within the crystal
• Amorphous materials like glass do not have a periodic array with long-range order, so they do not produce a diffraction pattern. Their X-ray scattering pattern features broad, poorly defined amorphous ‘humps’.
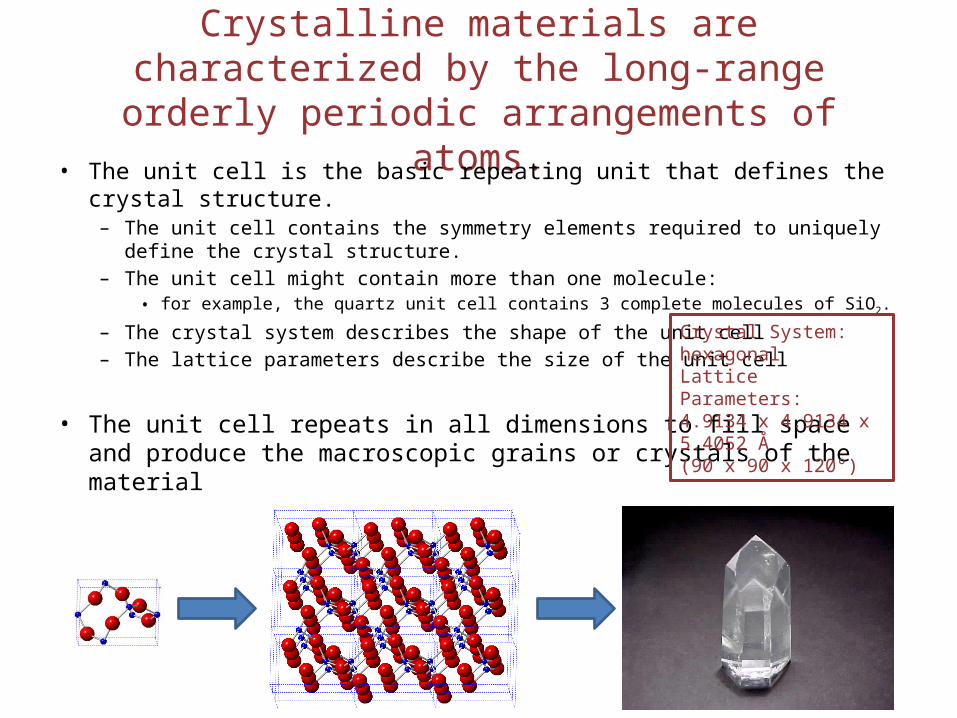
Crystalline materials are characterized by the long-range orderly periodic arrangements of atoms.
• The unit cell is the basic repeating unit that defines the crystal structure.– The unit cell contains the symmetry elements required to uniquely define the
crystal structure.– The unit cell might contain more than one molecule:
• for example, the quartz unit cell contains 3 complete molecules of SiO2.
– The crystal system describes the shape of the unit cell– The lattice parameters describe the size of the unit cell
• The unit cell repeats in all dimensions to fill space and produce the macroscopic grains or crystals of the material
Crystal System: hexagonalLattice Parameters: 4.9134 x 4.9134 x 5.4052 Å (90 x 90 x 120°)
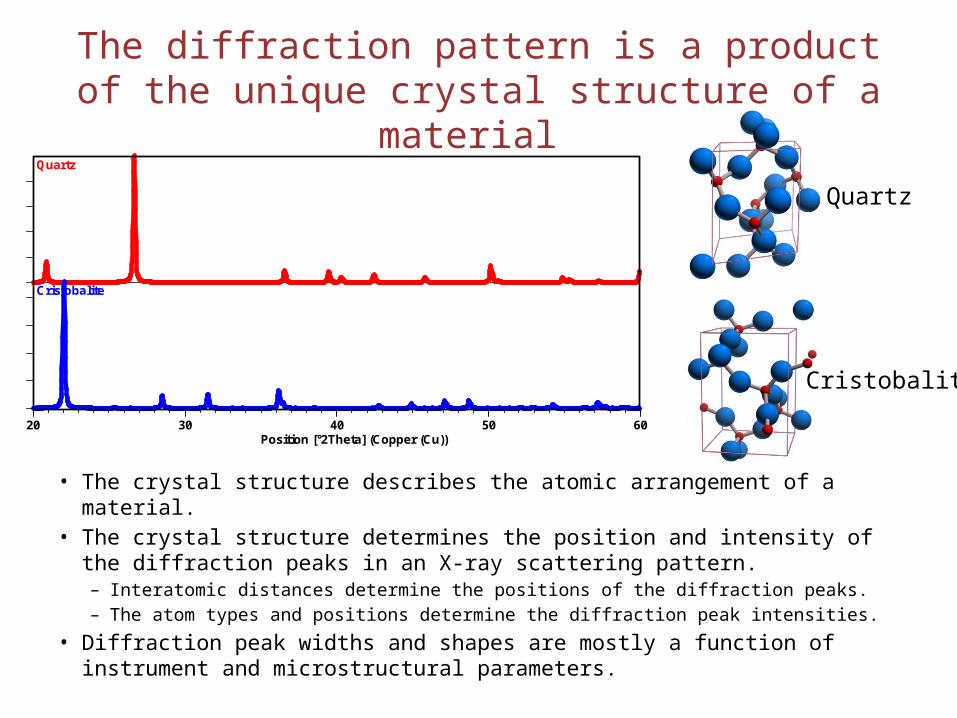
The diffraction pattern is a product of the unique crystal structure of a material
• The crystal structure describes the atomic arrangement of a material.• The crystal structure determines the position and intensity of the diffraction
peaks in an X-ray scattering pattern. – Interatomic distances determine the positions of the diffraction peaks. – The atom types and positions determine the diffraction peak intensities.
• Diffraction peak widths and shapes are mostly a function of instrument and microstructural parameters.
Quartz
Cristobalite
Position [°2Theta] (Copper (Cu))20 30 40 50 60
Counts
0
2000
4000
6000
8000
0
2000
4000
6000
8000
Quartz
Cristobalite
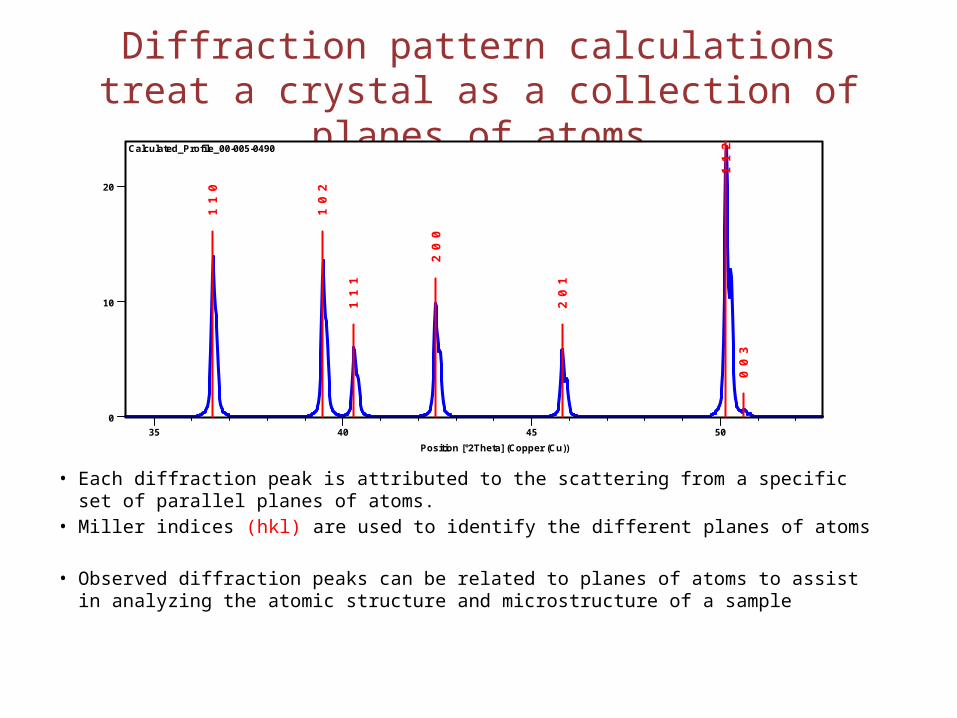
Diffraction pattern calculations treat a crystal as a collection of planes of atoms
• Each diffraction peak is attributed to the scattering from a specific set of parallel planes of atoms.
• Miller indices (hkl) are used to identify the different planes of atoms
• Observed diffraction peaks can be related to planes of atoms to assist in analyzing the atomic structure and microstructure of a sample
Position [°2Theta] (Copper (Cu))
35 40 45 50
Counts
0
10
20
1 1
0
1 0
2
1 1
1
2 0
0
2 0
1
1 1
20
0 3
Calculated_Profile_00-005-0490
Peak List
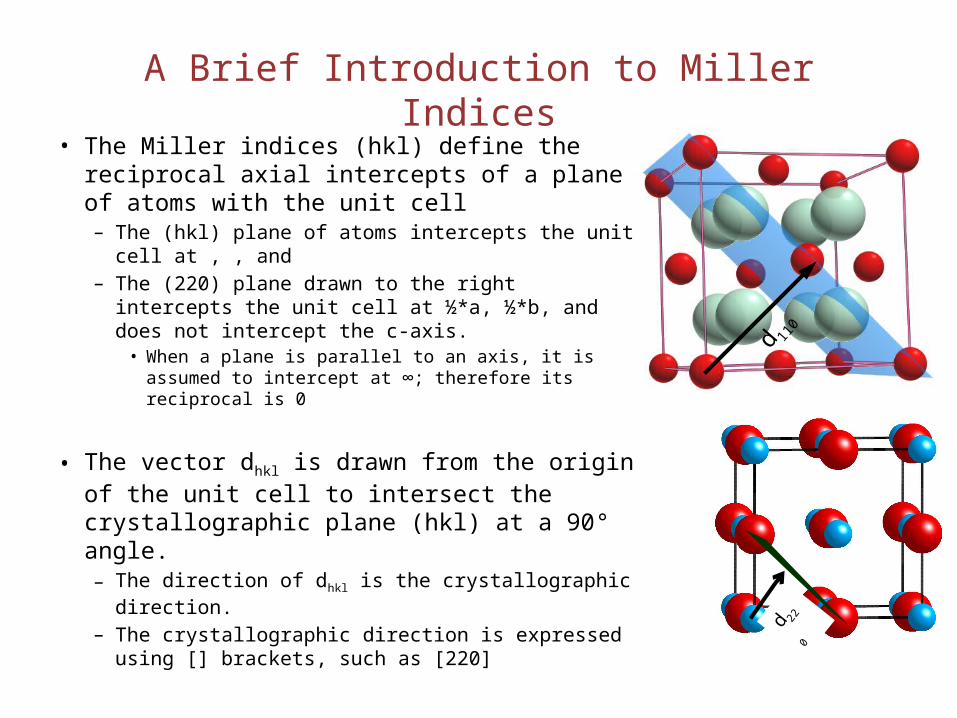
A Brief Introduction to Miller Indices• The Miller indices (hkl) define the reciprocal
axial intercepts of a plane of atoms with the unit cell– The (hkl) plane of atoms intercepts the unit cell at , ,
and – The (220) plane drawn to the right intercepts the
unit cell at ½*a, ½*b, and does not intercept the c-axis.
• When a plane is parallel to an axis, it is assumed to intercept at ∞; therefore its reciprocal is 0
• The vector dhkl is drawn from the origin of the unit cell to intersect the crystallographic plane (hkl) at a 90° angle. – The direction of dhkl is the crystallographic direction. – The crystallographic direction is expressed using []
brackets, such as [220]
d 220
d 110
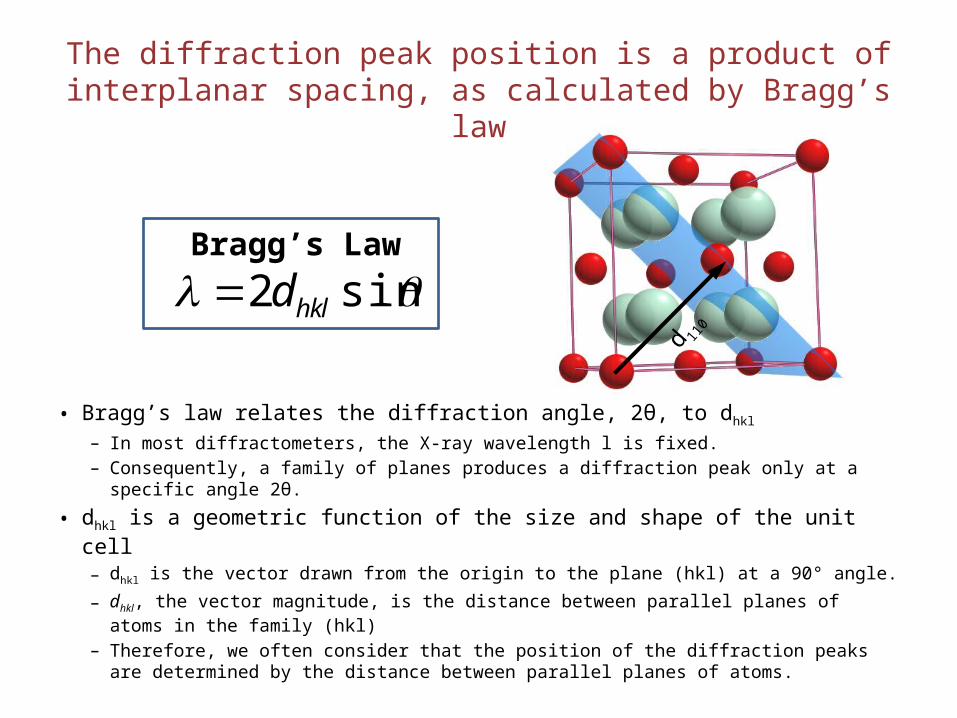
The diffraction peak position is a product of interplanar spacing, as calculated by Bragg’s law
• Bragg’s law relates the diffraction angle, 2θ, to dhkl – In most diffractometers, the X-ray wavelength l is fixed.– Consequently, a family of planes produces a diffraction peak only at a specific angle 2θ.
• dhkl is a geometric function of the size and shape of the unit cell– dhkl is the vector drawn from the origin to the plane (hkl) at a 90° angle.
– dhkl, the vector magnitude, is the distance between parallel planes of atoms in the family (hkl)
– Therefore, we often consider that the position of the diffraction peaks are determined by the distance between parallel planes of atoms.
sin2 hkld
d 110
Bragg’s Law
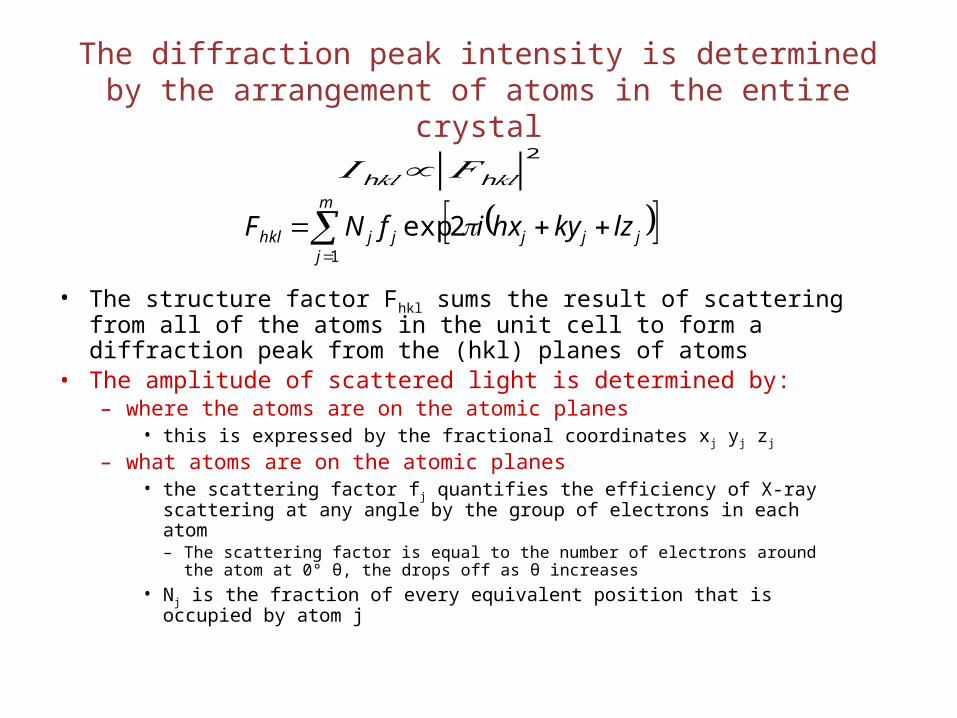
The diffraction peak intensity is determined by the arrangement of atoms in the entire crystal
• The structure factor Fhkl sums the result of scattering from all of the atoms in the unit cell to form a diffraction peak from the (hkl) planes of atoms
• The amplitude of scattered light is determined by:– where the atoms are on the atomic planes
• this is expressed by the fractional coordinates xj yj zj
– what atoms are on the atomic planes • the scattering factor fj quantifies the efficiency of X-ray scattering at any angle
by the group of electrons in each atom– The scattering factor is equal to the number of electrons around the atom at 0° θ,
the drops off as θ increases• Nj is the fraction of every equivalent position that is occupied by atom j
m
jjjjjjhkl lzkyhxifNF
1
2exp
𝐼 h𝑘𝑙∝|𝐹 h𝑘𝑙|2

Bragg’s law provides a simplistic model to understand what conditions are required for diffraction.
• For parallel planes of atoms, with a space dhkl between the planes, constructive interference only occurs when Bragg’s law is satisfied.
– In our diffractometers, the X-ray wavelength l is fixed.– A family of planes produces a diffraction peak only at a specific angle 2q.
• Additionally, the plane normal [hkl] must be parallel to the diffraction vector s– Plane normal [hkl]: the direction perpendicular to a plane of atoms– Diffraction vector s: the vector that bisects the angle between the incident and
diffracted beam
sin2 hkld q q dh
kld
hkl
s[hkl]

Many powder diffractometers use the Bragg-Brentano parafocusing geometry.
w2q
• The incident angle, w, is defined between the X-ray source and the sample.• The diffraction angle, 2q, is defined between the incident beam and the detector. • The incident angle w is always ½ of the detector angle 2q .
– In a q:2q instrument (e.g. Rigaku H3R), the tube is fixed, the sample rotates at q °/min and the detector rotates at 2q °/min.
– In a q:q instrument (e.g. PANalytical X’Pert Pro), the sample is fixed and the tube rotates at a rate -q °/min and the detector rotates at a rate of q °/min.
• In the Bragg-Brentano geometry, the diffraction vector (s) is always normal to the surface of the sample.
– The diffraction vector is the vector that bisects the angle between the incident and scattered beam
X-ray tube
Detector
s

A single crystal specimen in a Bragg-Brentano diffractometer would produce only one family of peaks in the diffraction pattern.
2q
At 20.6 °2 , Bragg’s law fulfilled for the (100) planes, producing a diffraction peak.
The (110) planes would diffract at 29.3 °2 ; however, they are not properly aligned to produce a diffraction peak (the perpendicular to those planes does not bisect the incident and diffracted beams). Only background is observed.
The (200) planes are parallel to the (100) planes. Therefore, they also diffract for this crystal. Since d200 is ½ d100, they appear at 42 °2 .
s[100] [110]
s[200]
s

A polycrystalline sample should contain thousands of crystallites. Therefore, all possible diffraction peaks should be observed.
2q 2q 2q
• For every set of planes, there will be a small percentage of crystallites that are properly oriented to diffract (the plane perpendicular bisects the incident and diffracted beams).
• Basic assumptions of powder diffraction are that for every set of planes there is an equal number of crystallites that will diffract and that there is a statistically relevant number of crystallites, not just one or two.
s
[100] [110]s s
[200]
Powder diffraction is more aptly named polycrystalline diffraction
• Samples can be powder, sintered pellets, coatings on substrates, engine blocks... • The ideal “powder” sample contains tens of thousands of randomly oriented
crystallites– Every diffraction peak is the product of X-rays scattering from an equal number
of crystallites– Only a small fraction of the crystallites in the specimen actually contribute to
the measured diffraction pattern• XRPD is a somewhat inefficient measurement technique
• Irradiating a larger volume of material can help ensure that a statistically relevant number of grains contribute to the diffraction pattern– Small sample quantities pose a problem because the sample size limits the
number of crystallites that can contribute to the measurement

X-rays are scattered in a sphere around the sample
• Each diffraction peak is actually a Debye diffraction cone produced by the tens of thousands of randomly oriented crystallites in an ideal sample.
– A cone along the sphere corresponds to a single Bragg angle 2theta
• The linear diffraction pattern is formed as the detector scans along an arc that intersects each Debye cone at a single point
• Only a small fraction of scattered X-rays are observed by the detector.

X-Ray Powder Diffraction (XRPD) is a somewhat inefficient measurement technique
• Only a small fraction of crystallites in the sample actually contribute to the observed diffraction pattern– Other crystallites are not oriented properly to produce diffraction from
any planes of atoms– You can increase the number of crystallites that contribute to the
measured pattern by spinning the sample
• Only a small fraction of the scattered X-rays are observed by the detector– A point detector scanning in an arc around the sample only observes
one point on each Debye diffraction cone– You can increase the amount of scattered X-rays observed by using a
large area (2D) detector

Diffraction patterns are collected as absolute intensity vs 2q vs, but are best reported as relative intensity vs dhkl.
• The peak position as 2q depends on instrumental characteristics such as wavelength.– The peak position as dhkl is an intrinsic, instrument-independent, material
property.• Bragg’s Law is used to convert observed 2q positions to dhkl.
• The absolute intensity, i.e. the number of X rays observed in a given peak, can vary due to instrumental and experimental parameters. – The relative intensities of the diffraction peaks should be instrument
independent.• To calculate relative intensity, divide the absolute intensity of every peak by the
absolute intensity of the most intense peak, and then convert to a percentage. The most intense peak of a phase is therefore always called the “100% peak”.
– Peak areas are much more reliable than peak heights as a measure of intensity.
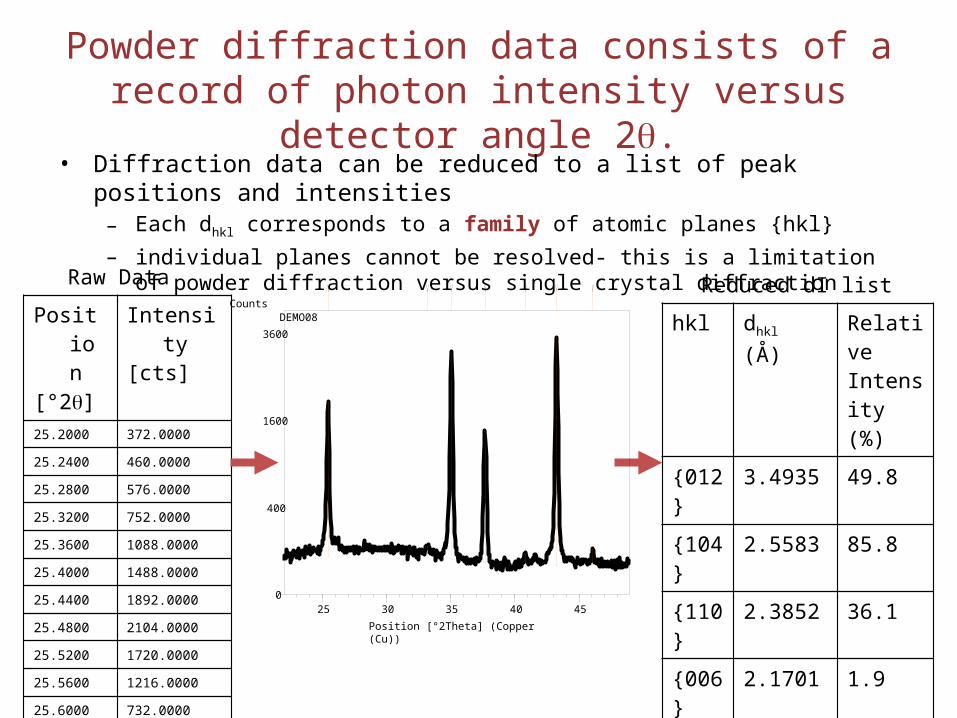
Powder diffraction data consists of a record of photon intensity versus detector angle 2q.
• Diffraction data can be reduced to a list of peak positions and intensities– Each dhkl corresponds to a family of atomic planes {hkl}– individual planes cannot be resolved- this is a limitation of powder diffraction versus
single crystal diffraction
hkl dhkl (Å) Relative Intensity (%)
{012}
3.4935 49.8
{104}
2.5583 85.8
{110} 2.3852 36.1
{006}
2.1701 1.9
{113} 2.0903 100.0
{202}
1.9680 1.4
Position[°2q]
Intensity [cts]
25.2000 372.0000
25.2400 460.0000
25.2800 576.0000
25.3200 752.0000
25.3600 1088.0000
25.4000 1488.0000
25.4400 1892.0000
25.4800 2104.0000
25.5200 1720.0000
25.5600 1216.0000
25.6000 732.0000
25.6400 456.0000
25.6800 380.0000
25.7200 328.0000
Raw Data Reduced dI list
Position [°2Theta] (Copper (Cu))
25 30 35 40 45
Counts
0
400
1600
3600
DEMO08

Scott A. Speakman, Ph.D. http://prism.mit.edu/xray
Applications of XRPD
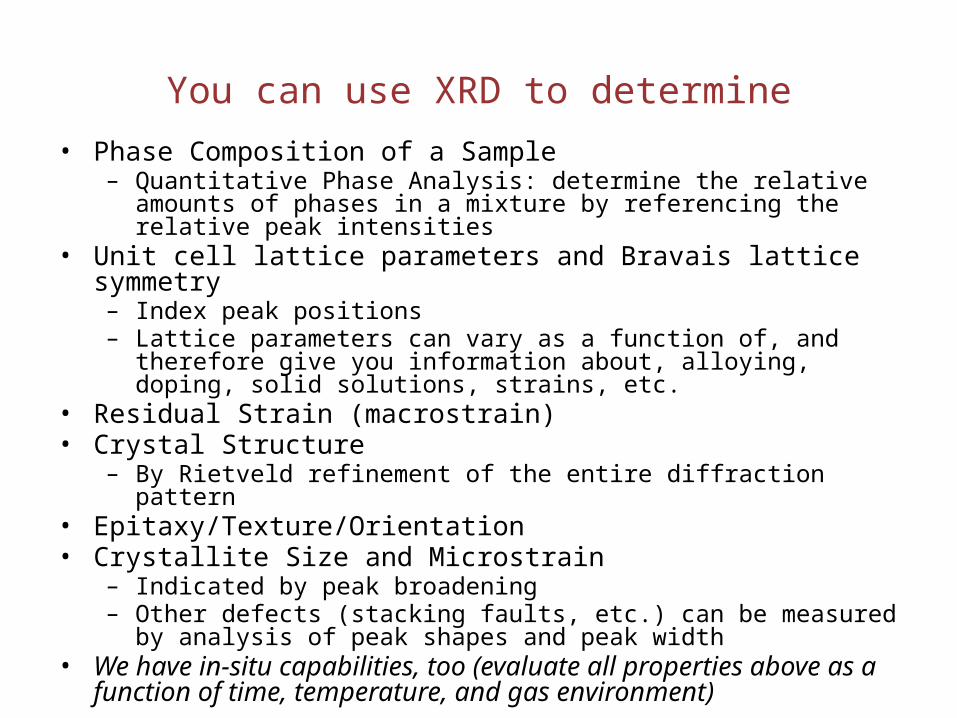
You can use XRD to determine• Phase Composition of a Sample
– Quantitative Phase Analysis: determine the relative amounts of phases in a mixture by referencing the relative peak intensities
• Unit cell lattice parameters and Bravais lattice symmetry– Index peak positions– Lattice parameters can vary as a function of, and therefore give you
information about, alloying, doping, solid solutions, strains, etc.• Residual Strain (macrostrain)• Crystal Structure
– By Rietveld refinement of the entire diffraction pattern• Epitaxy/Texture/Orientation• Crystallite Size and Microstrain
– Indicated by peak broadening– Other defects (stacking faults, etc.) can be measured by analysis of peak
shapes and peak width • We have in-situ capabilities, too (evaluate all properties above as a
function of time, temperature, and gas environment)

Phase Identification• The diffraction pattern for every phase is as unique as your fingerprint
– Phases with the same chemical composition can have drastically different diffraction patterns.
– Use the position and relative intensity of a series of peaks to match experimental data to the reference patterns in the database
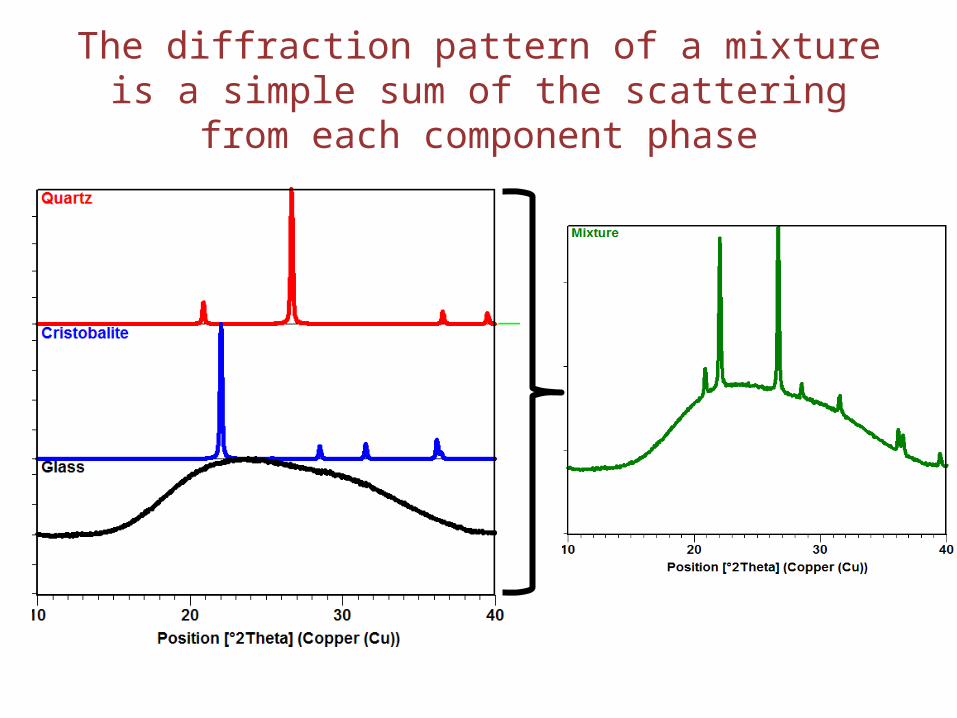
The diffraction pattern of a mixture is a simple sum of the scattering from each component phase
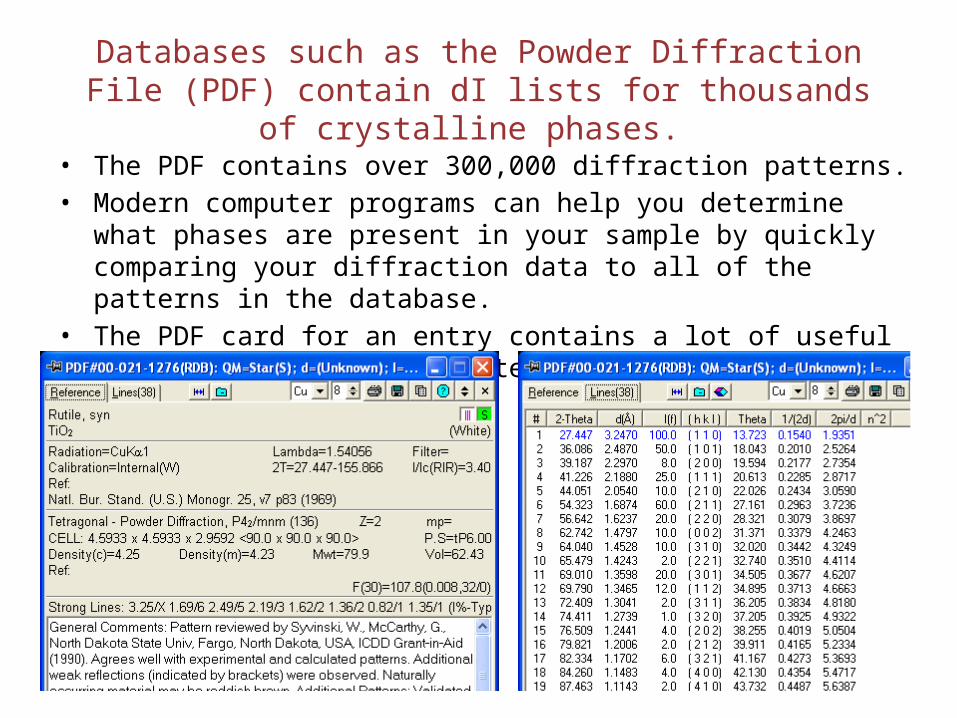
Databases such as the Powder Diffraction File (PDF) contain dI lists for thousands of crystalline phases.
• The PDF contains over 300,000 diffraction patterns.• Modern computer programs can help you determine what phases are
present in your sample by quickly comparing your diffraction data to all of the patterns in the database.
• The PDF card for an entry contains a lot of useful information, including literature references.
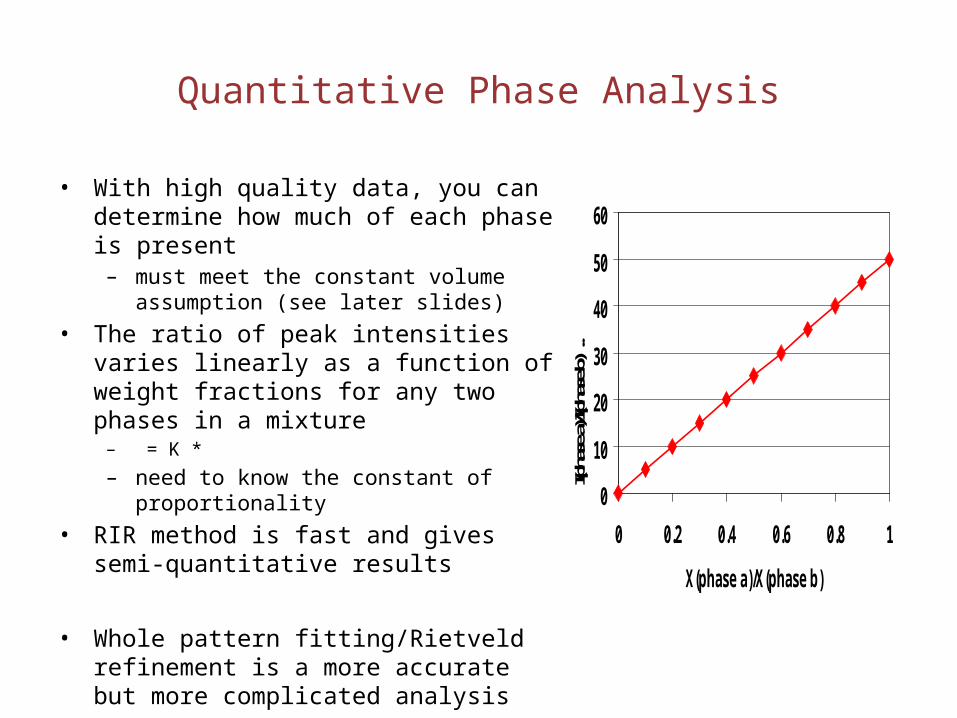
Quantitative Phase Analysis
• With high quality data, you can determine how much of each phase is present
– must meet the constant volume assumption (see later slides)
• The ratio of peak intensities varies linearly as a function of weight fractions for any two phases in a mixture
– = K * – need to know the constant of proportionality
• RIR method is fast and gives semi-quantitative results
• Whole pattern fitting/Rietveld refinement is a more accurate but more complicated analysis
0
10
20
30
40
50
60
0 0.2 0.4 0.6 0.8 1
X(phase a)/X(phase b)I(p
hase
a)/I(p
hase
b) ..

You cannot guess the relative amounts of phases based only on the relative intensities of the diffraction peaks
• The pattern shown above contains equal amounts of TiO2 and Al2O3
• The TiO2 pattern is more intense because TiO2 diffracts X-rays more efficiently
With proper calibration, you can calculate the amount of each phase present in the sample
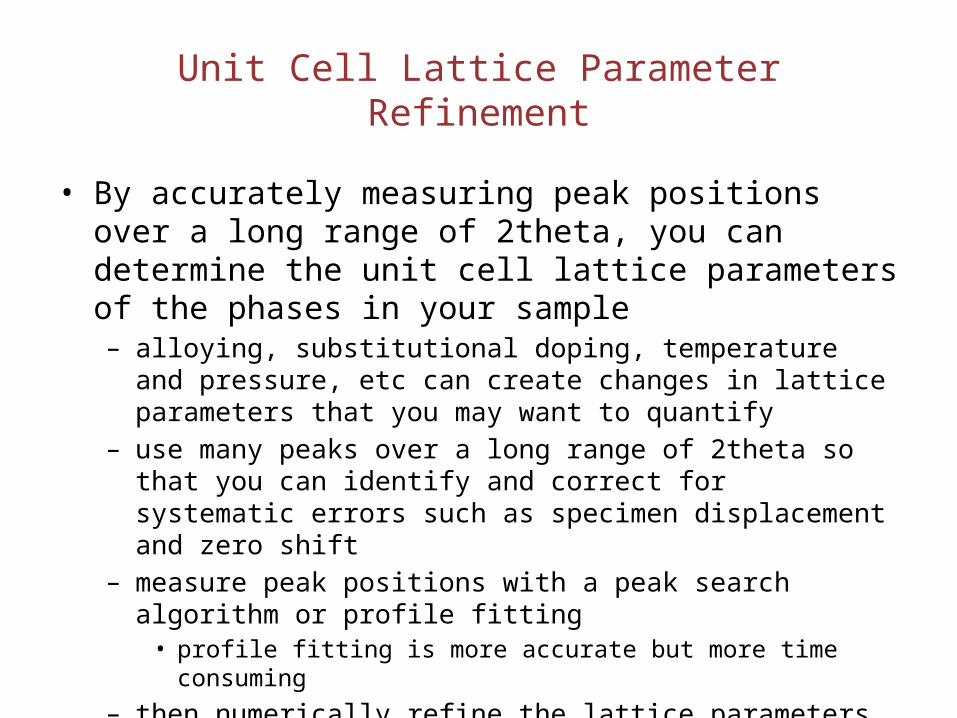
Unit Cell Lattice Parameter Refinement
• By accurately measuring peak positions over a long range of 2theta, you can determine the unit cell lattice parameters of the phases in your sample– alloying, substitutional doping, temperature and pressure, etc can
create changes in lattice parameters that you may want to quantify– use many peaks over a long range of 2theta so that you can identify
and correct for systematic errors such as specimen displacement and zero shift
– measure peak positions with a peak search algorithm or profile fitting• profile fitting is more accurate but more time consuming
– then numerically refine the lattice parameters
23 24 25 26 27 28 29 30 31 32 33 34 35 36 37 38 39 40 412q (deg.)
Inte
nsity
(a.u
.)
00-043-1002> Cerianite- - CeO2
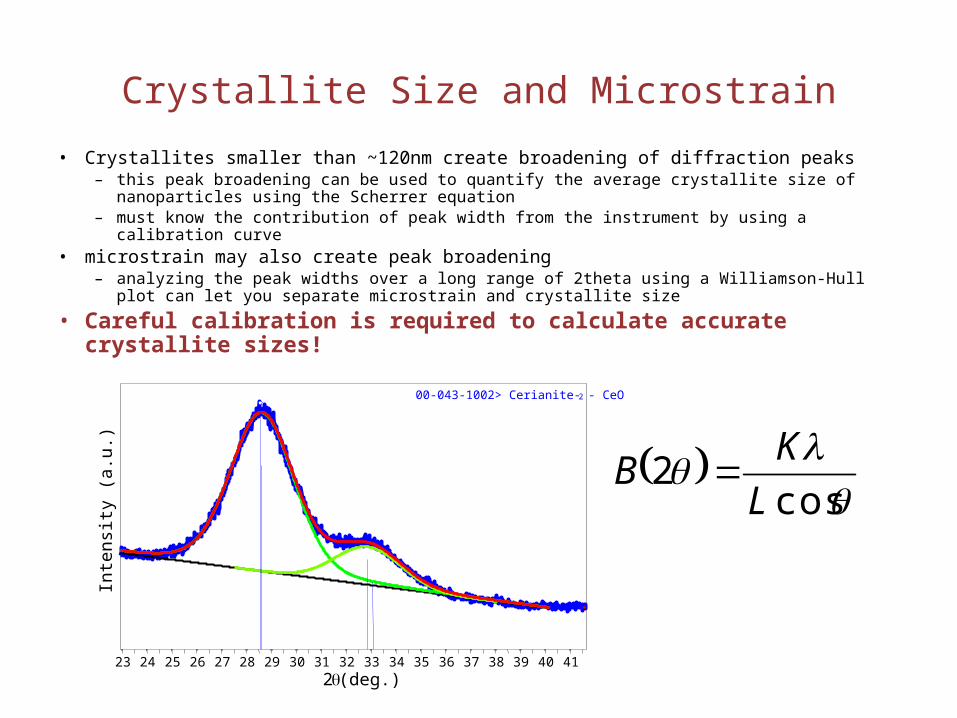
Crystallite Size and Microstrain
• Crystallites smaller than ~120nm create broadening of diffraction peaks– this peak broadening can be used to quantify the average crystallite size of nanoparticles
using the Scherrer equation– must know the contribution of peak width from the instrument by using a calibration curve
• microstrain may also create peak broadening– analyzing the peak widths over a long range of 2theta using a Williamson-Hull plot can let
you separate microstrain and crystallite size
• Careful calibration is required to calculate accurate crystallite sizes!
cos
2L
KB
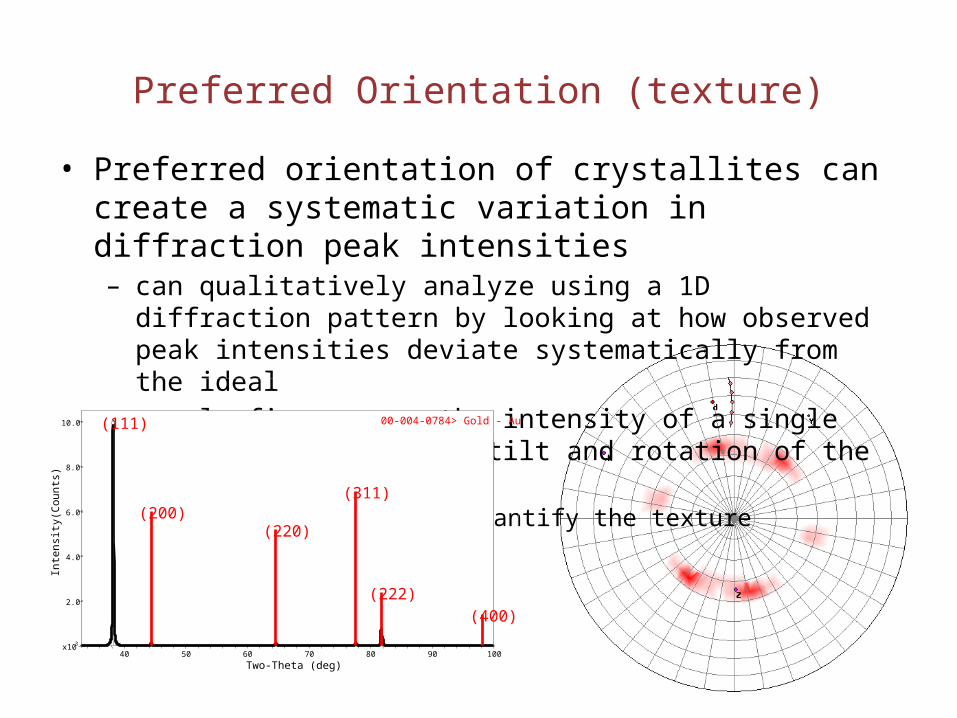
Preferred Orientation (texture)
• Preferred orientation of crystallites can create a systematic variation in diffraction peak intensities– can qualitatively analyze using a 1D diffraction pattern by looking at
how observed peak intensities deviate systematically from the ideal– a pole figure maps the intensity of a single peak as a function of tilt
and rotation of the sample• this can be used to quantify the texture
(111)
(311)(200)
(220)
(222)(400)
40 50 60 70 80 90 100Two-Theta (deg)
x103
2.0
4.0
6.0
8.0
10.0
Inte
nsity
(Cou
nts)
00-004-0784> Gold - Au
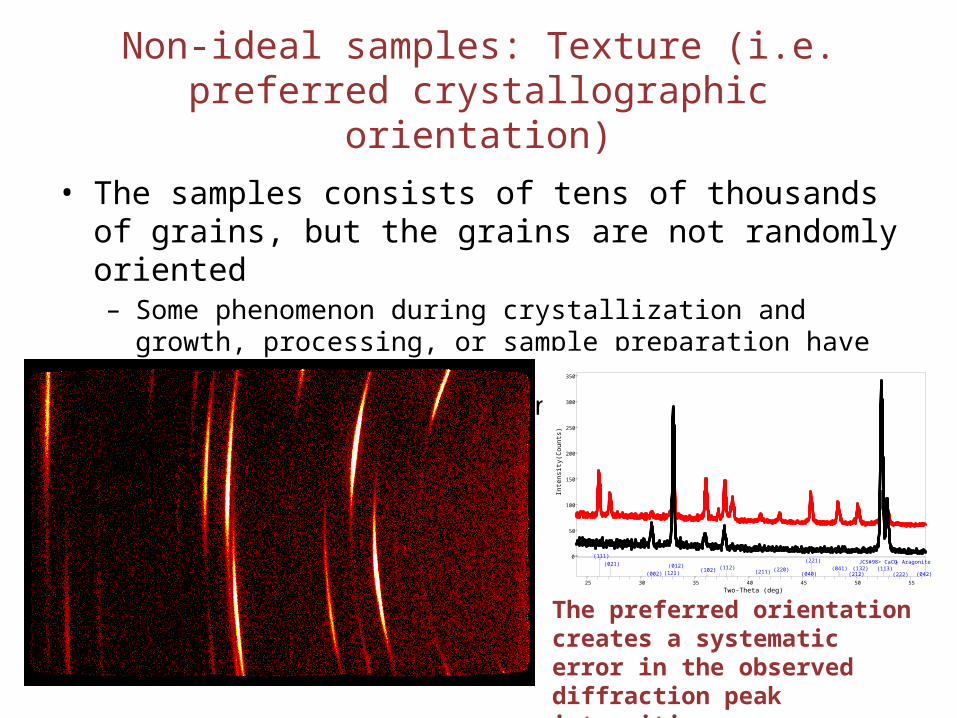
Non-ideal samples: Texture (i.e. preferred crystallographic orientation)
• The samples consists of tens of thousands of grains, but the grains are not randomly oriented– Some phenomenon during crystallization and growth, processing, or
sample preparation have caused the grains to have preferred crystallographic direction normal to the surface of the sample
The preferred orientation creates a systematic error in the observed diffraction peak intensities.
0
50
100
150
200
250
300
350
Inte
nsity
(Cou
nts)
(111)(221)
(021) (012) (112) (041) (132) (113)(220)(102) (211)(121)(002) (040) (212) (042)(222)
JCS#98> CaCO3 - Aragonite
25 30 35 40 45 50 55
Two-Theta (deg)

Scott A. Speakman, Ph.D. http://prism.mit.edu/xray
Overview of the Diffractometer
Essential Parts of the Diffractometer
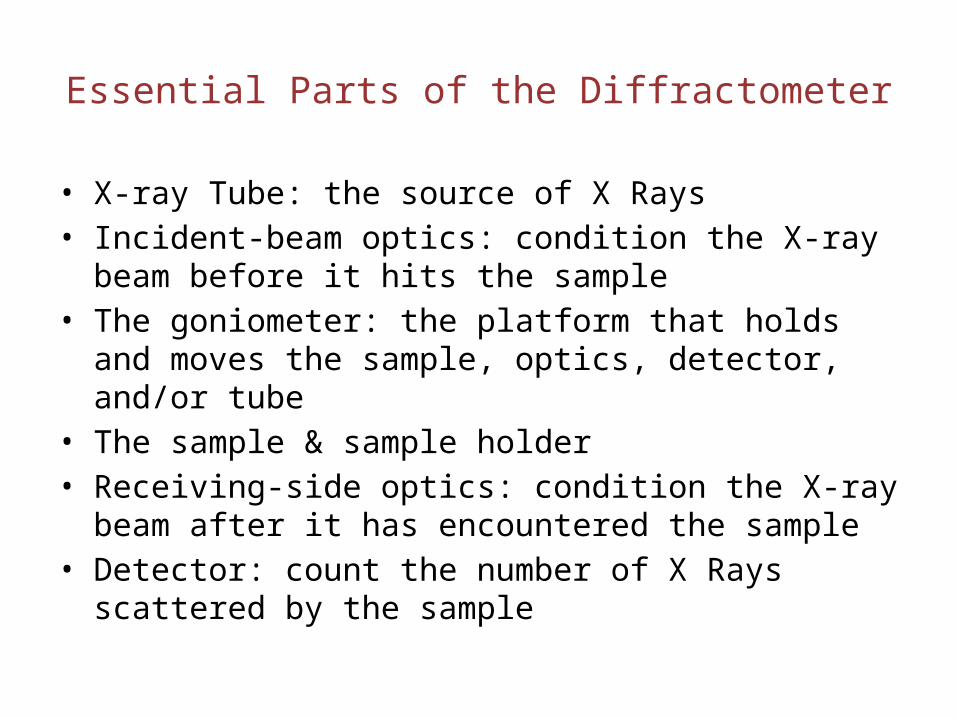
• X-ray Tube: the source of X Rays• Incident-beam optics: condition the X-ray beam before it hits
the sample• The goniometer: the platform that holds and moves the
sample, optics, detector, and/or tube• The sample & sample holder• Receiving-side optics: condition the X-ray beam after it has
encountered the sample• Detector: count the number of X Rays scattered by the sample
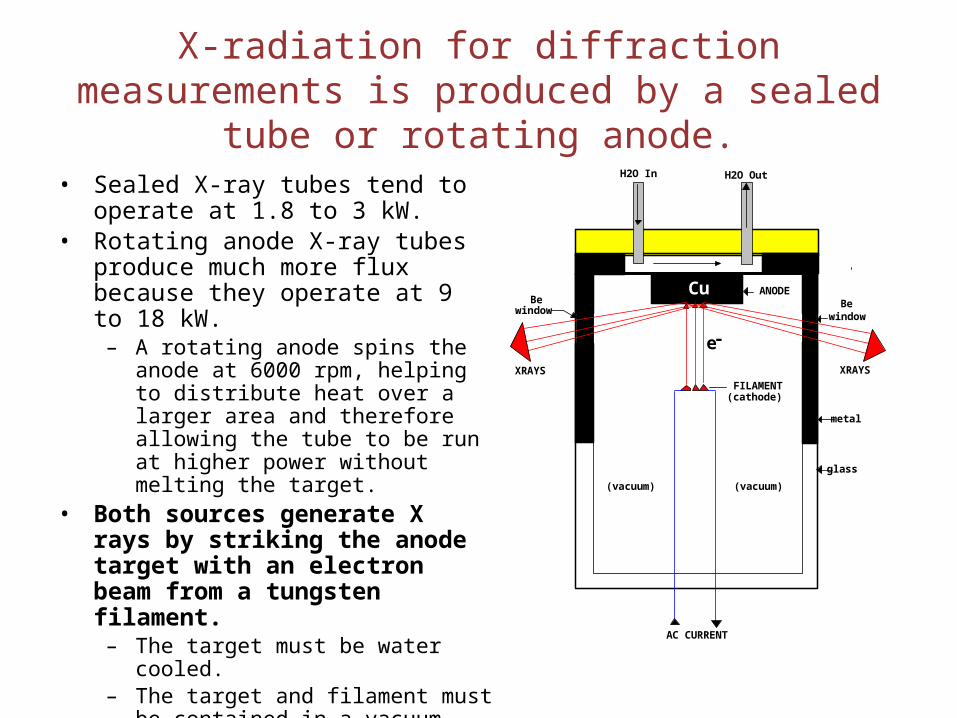
X-radiation for diffraction measurements is produced by a sealed tube or rotating anode.
• Sealed X-ray tubes tend to operate at 1.8 to 3 kW.
• Rotating anode X-ray tubes produce much more flux because they operate at 9 to 18 kW.
– A rotating anode spins the anode at 6000 rpm, helping to distribute heat over a larger area and therefore allowing the tube to be run at higher power without melting the target.
• Both sources generate X rays by striking the anode target with an electron beam from a tungsten filament.
– The target must be water cooled.– The target and filament must be
contained in a vacuum.
Cu
H2O In H2O Out
e-
Be
XRAYS
windowBe
XRAYS
FILAMENT
ANODE
(cathode)
AC CURRENT
window
metal
glass
(vacuum) (vacuum)

The wavelength of X rays is determined by the anode of the X-ray source.
• Electrons from the filament strike the target anode, producing characteristic radiation via the photoelectric effect.
• The anode material determines the wavelengths of characteristic radiation.• While we would prefer a monochromatic source, the X-ray beam actually consists
of several characteristic wavelengths of X rays.
KL
M
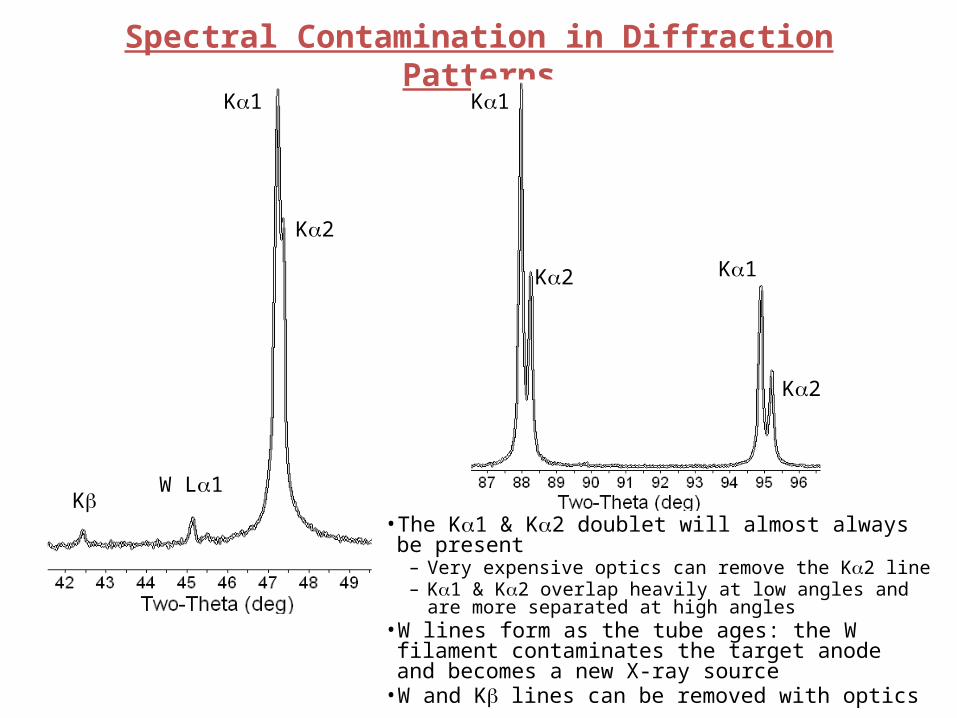
Spectral Contamination in Diffraction PatternsKa1
Ka2
KbW La1
Ka1
Ka2 Ka1
Ka2
• The Ka1 & Ka2 doublet will almost always be present– Very expensive optics can remove the Ka2 line– Ka1 & Ka2 overlap heavily at low angles and are more separated
at high angles• W lines form as the tube ages: the W filament contaminates
the target anode and becomes a new X-ray source• W and Kb lines can be removed with optics

Monochromators remove unwanted wavelengths of radiation from the incident or diffracted X-ray beam.
• Diffraction from a monochromator crystal can be used to select one wavelength of radiation and provide energy discrimination.
• Most powder diffractometer monochromators only remove K-beta, W-contamination, and Brehmstralung radiation– Only HRXRD monochromators or specialized powder monochromators remove
K-alpha2 radiation as well. • A monochromator can be mounted between the tube and sample
(incident-beam) or between the sample and detector (diffracted-beam)– An incident-beam monochromator only filters out unwanted wavelengths of
radiation from the X-ray source– A diffracted-beam monochromator will also remove fluoresced photons.– A monochromator may eliminate 99% of K-beta and similar unwanted
wavelengths of radiation. – A diffracted-beam monochromator will provide the best signal-to-noise ratio,
but data collection will take a longer time
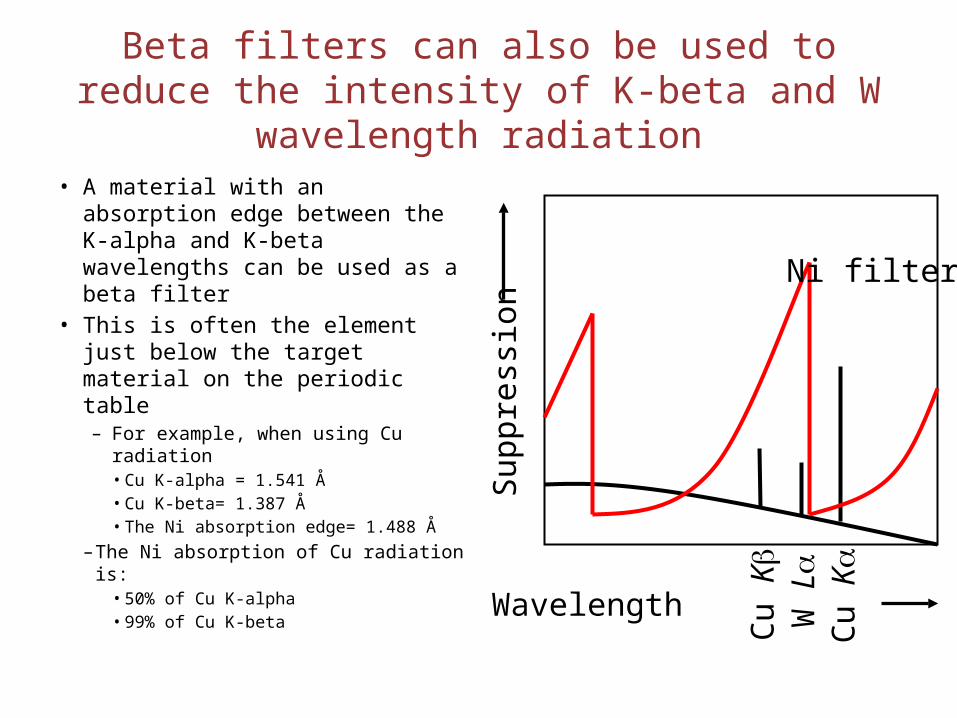
Beta filters can also be used to reduce the intensity of K-beta and W wavelength radiation
• A material with an absorption edge between the K-alpha and K-beta wavelengths can be used as a beta filter
• This is often the element just below the target material on the periodic table– For example, when using Cu
radiation• Cu K-alpha = 1.541 Å• Cu K-beta= 1.387 Å• The Ni absorption edge= 1.488 Å
– The Ni absorption of Cu radiation is: • 50% of Cu K-alpha• 99% of Cu K-beta
Sup
pre
ssio
n
Wavelength
Cu K
W L
Cu K
Ni filter
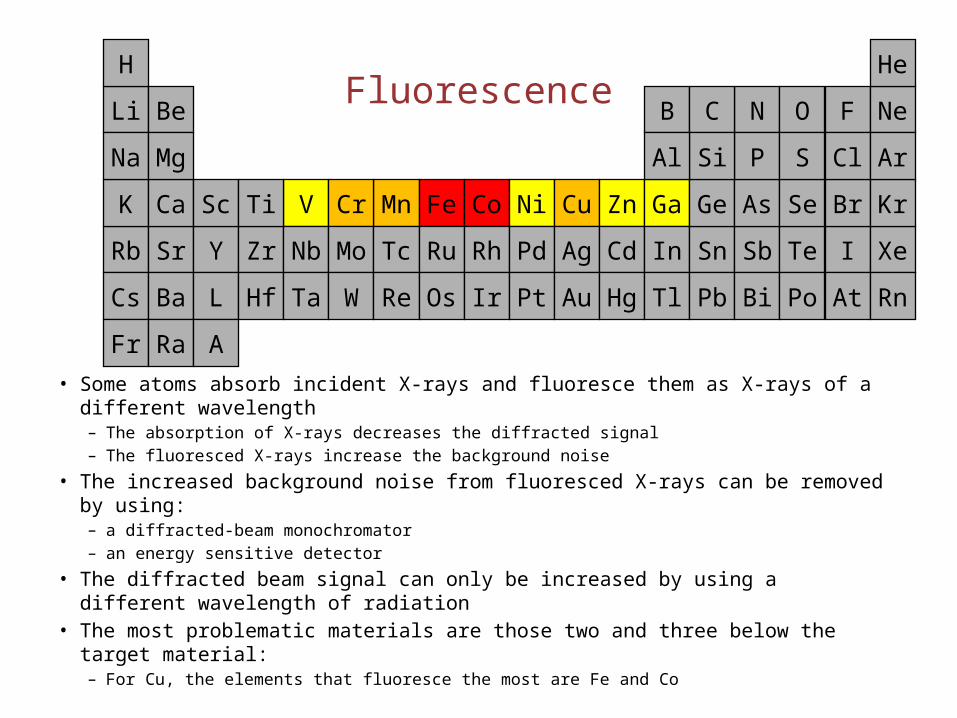
Fluorescence
• Some atoms absorb incident X-rays and fluoresce them as X-rays of a different wavelength
– The absorption of X-rays decreases the diffracted signal– The fluoresced X-rays increase the background noise
• The increased background noise from fluoresced X-rays can be removed by using:– a diffracted-beam monochromator – an energy sensitive detector
• The diffracted beam signal can only be increased by using a different wavelength of radiation
• The most problematic materials are those two and three below the target material:– For Cu, the elements that fluoresce the most are Fe and Co
Mn Fe Co Ni Cu Zn GaV Cr
Rb Sr Y Zr Nb Mo Tc Ru Rh Pd Ag Cd In Sn Sb Te I Xe
Cs Ba L Hf Ta W Re Os Ir Pt Au Hg Tl Pb Bi Po At Rn
K Ca Sc Ti Ge As Se Br Kr
F Ne
Cl Ar
N O
P S
B C
Si
Li Be
Na Mg
HeH
Fr Ra A
Al
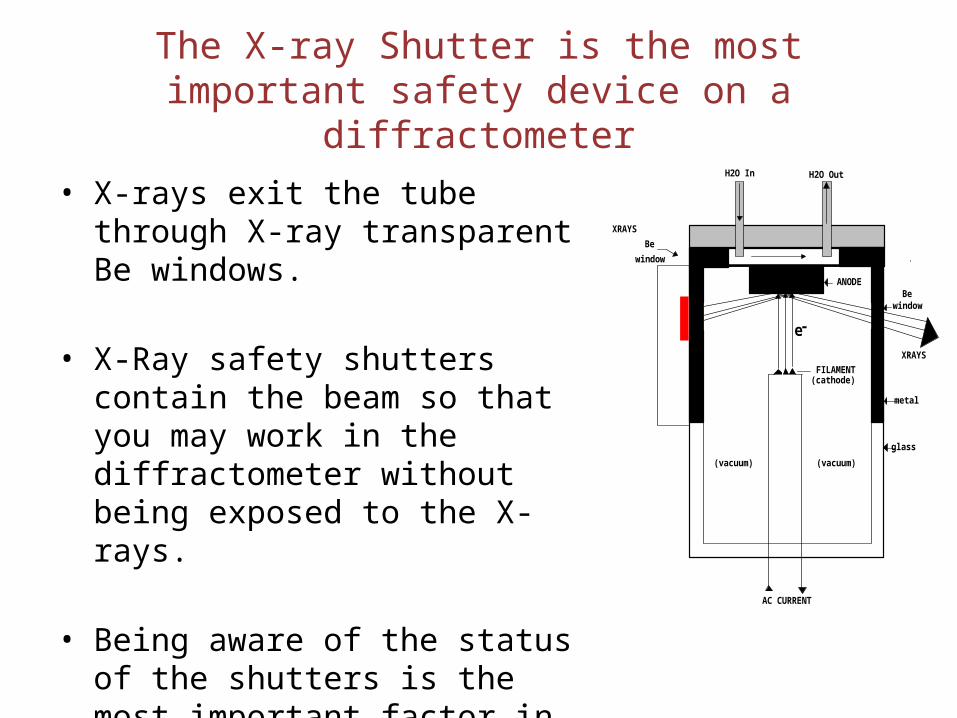
The X-ray Shutter is the most important safety device on a diffractometer
• X-rays exit the tube through X-ray transparent Be windows.
• X-Ray safety shutters contain the beam so that you may work in the diffractometer without being exposed to the X-rays.
• Being aware of the status of the shutters is the most important factor in working safely with X rays.
Cu
H2O In H2O Out
e-
Be
XRAYS
windowBe
XRAYS
FILAMENT
ANODE
(cathode)
AC CURRENT
window
metal
glass
(vacuum) (vacuum)
Primary
Shutter
Secondary
Shutter
Solenoid
SAFETY SHUTTERS

The X-ray beam produced by the X-ray tube is divergent. Incident-beam optics are used to limit this divergence
• X Rays from an X-ray tube are: – divergent– contain multiple characteristic wavelengths as well as Bremmsstrahlung radiation
• neither of these conditions suit our ability to use X rays for analysis– the divergence means that instead of a single incident angle q, the sample is actually
illuminated by photons with a range of incident angles. – the spectral contamination means that the smaple does not diffract a single wavelength
of radiation, but rather several wavelengths of radiation. • Consequently, a single set of crystallographic planes will produce several diffraction peaks
instead of one diffraction peak.
• Optics are used to:– limit divergence of the X-ray beam– refocus X rays into parallel paths– remove unwanted wavelengths
sin2 hkld
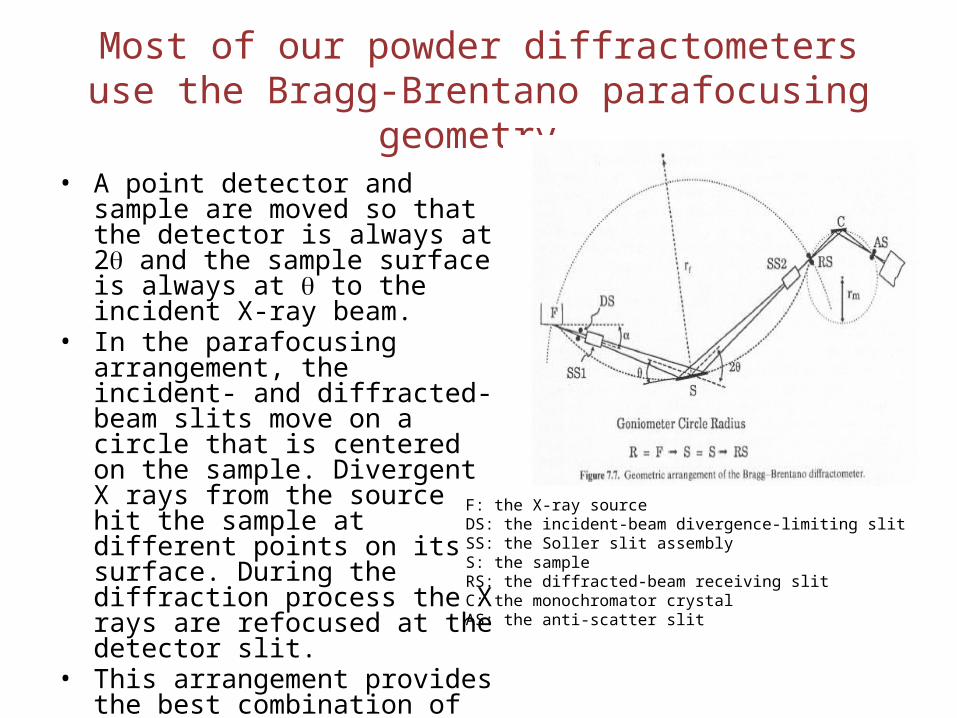
Most of our powder diffractometers use the Bragg-Brentano parafocusing geometry.
• A point detector and sample are moved so that the detector is always at 2q and the sample surface is always at q to the incident X-ray beam.
• In the parafocusing arrangement, the incident- and diffracted-beam slits move on a circle that is centered on the sample. Divergent X rays from the source hit the sample at different points on its surface. During the diffraction process the X rays are refocused at the detector slit.
• This arrangement provides the best combination of intensity, peak shape, and angular resolution for the widest number of samples.
F: the X-ray sourceDS: the incident-beam divergence-limiting slitSS: the Soller slit assemblyS: the sampleRS: the diffracted-beam receiving slitC: the monochromator crystalAS: the anti-scatter slit

Divergence slits are used to limit the divergence of the incident X-ray beam.
• The slits block X-rays that have too great a divergence.
• The size of the divergence slit influences peak intensity and peak shapes.
• Narrow divergence slits:– reduce the intensity of the X-ray beam– reduce the length of the X-ray beam hitting
the sample– produce sharper peaks
• the instrumental resolution is improved so that closely spaced peaks can be resolved.
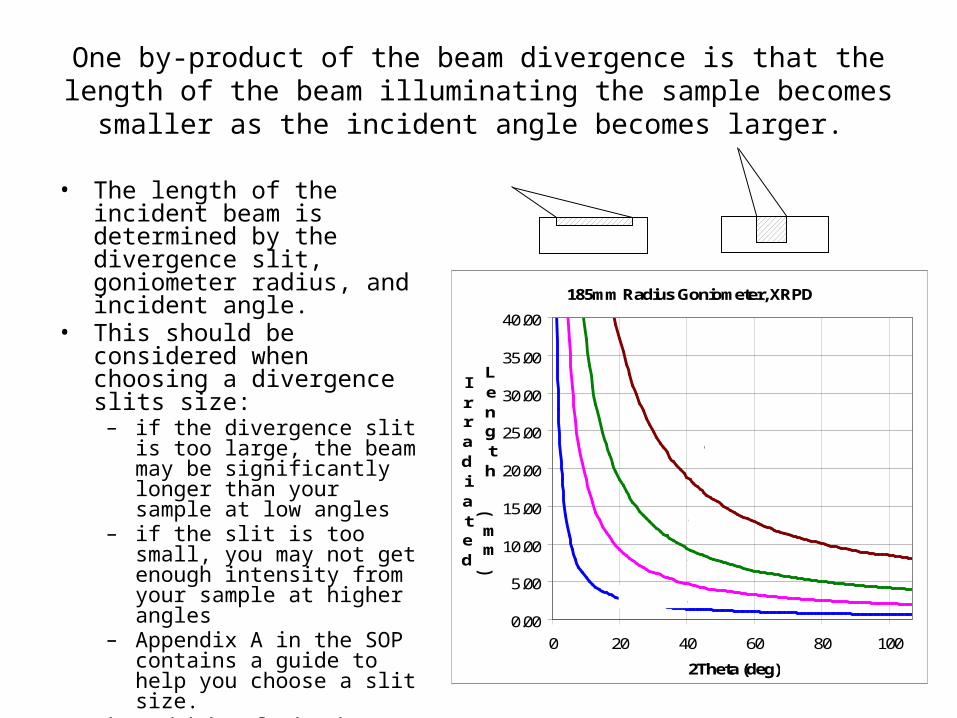
One by-product of the beam divergence is that the length of the beam illuminating the sample becomes smaller as the incident
angle becomes larger.
• The length of the incident beam is determined by the divergence slit, goniometer radius, and incident angle.
• This should be considered when choosing a divergence slits size:
– if the divergence slit is too large, the beam may be significantly longer than your sample at low angles
– if the slit is too small, you may not get enough intensity from your sample at higher angles
– Appendix A in the SOP contains a guide to help you choose a slit size.
• The width of the beam is constant: 12mm for the Rigaku RU300.
185mm Radius Goniometer, XRPD
0.00
5.00
10.00
15.00
20.00
25.00
30.00
35.00
40.00
0 20 40 60 80 100
2Theta (deg)
Irradiated
Length
(
mm
)
2°DS
1°DS
0.5°DS
0.15°DS
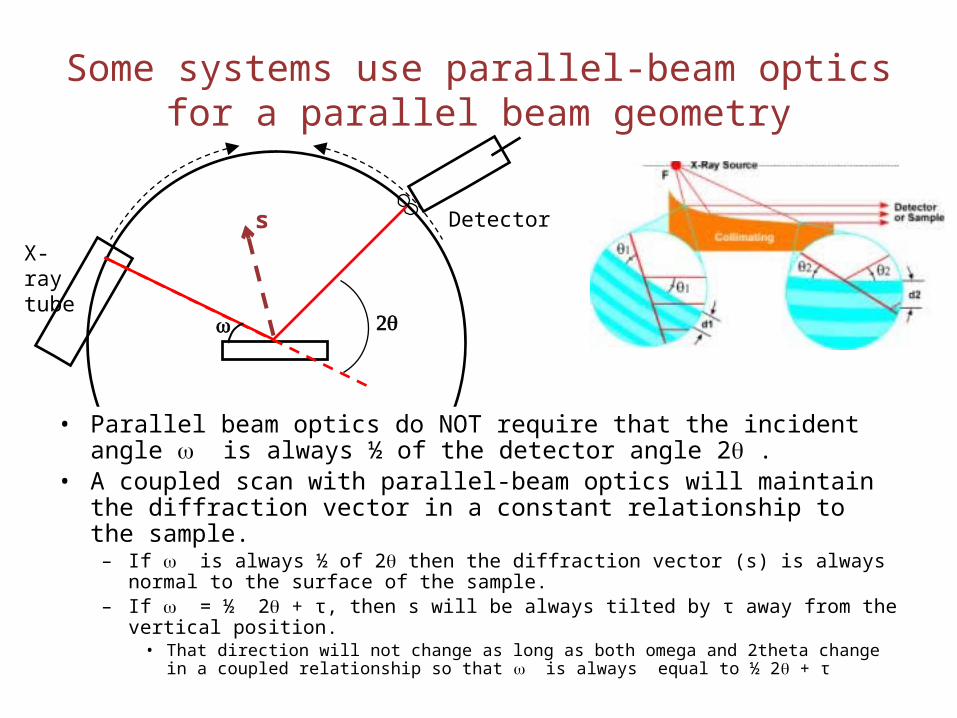
Some systems use parallel-beam optics for a parallel beam geometry
w 2q
• Parallel beam optics do NOT require that the incident angle w is always ½ of the detector angle 2q .
• A coupled scan with parallel-beam optics will maintain the diffraction vector in a constant relationship to the sample.
– If w is always ½ of 2q then the diffraction vector (s) is always normal to the surface of the sample.
– If w = ½ 2q + τ, then s will be always tilted by τ away from the vertical position. • That direction will not change as long as both omega and 2theta change in a coupled
relationship so that w is always equal to ½ 2q + τ
X-ray tube
Detectors
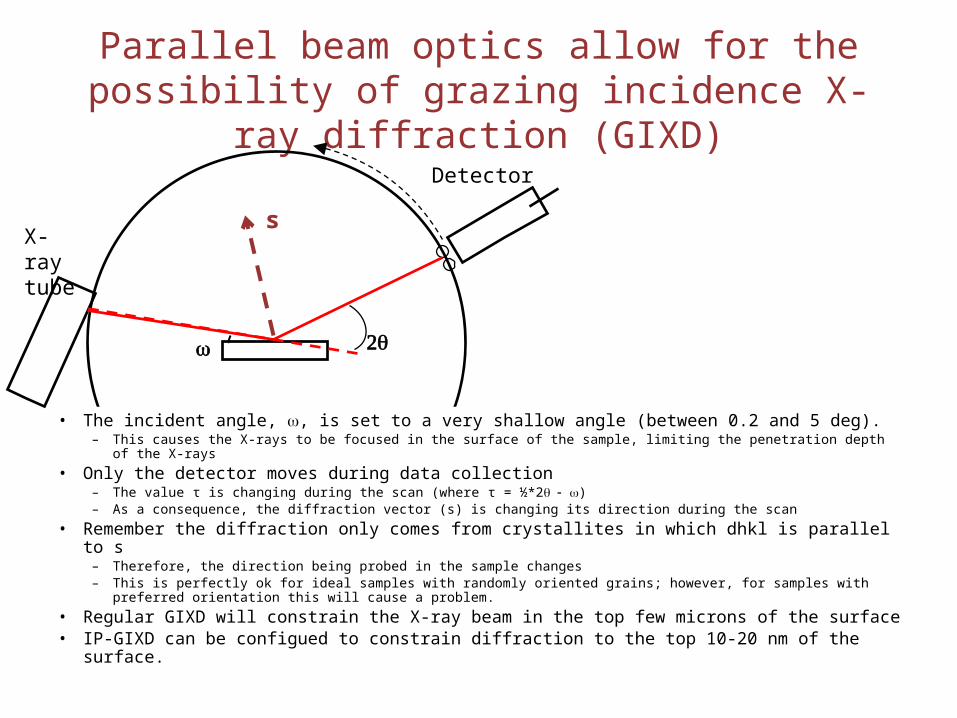
Parallel beam optics allow for the possibility of grazing incidence X-ray diffraction (GIXD)
w 2q
• The incident angle, w, is set to a very shallow angle (between 0.2 and 5 deg). – This causes the X-rays to be focused in the surface of the sample, limiting the penetration depth of the X-rays
• Only the detector moves during data collection– The value τ is changing during the scan (where τ = ½*2 -q w)– As a consequence, the diffraction vector (s) is changing its direction during the scan
• Remember the diffraction only comes from crystallites in which dhkl is parallel to s– Therefore, the direction being probed in the sample changes– This is perfectly ok for ideal samples with randomly oriented grains; however, for samples with preferred
orientation this will cause a problem.
• Regular GIXD will constrain the X-ray beam in the top few microns of the surface• IP-GIXD can be configued to constrain diffraction to the top 10-20 nm of the surface.
X-ray tube
Detector
s
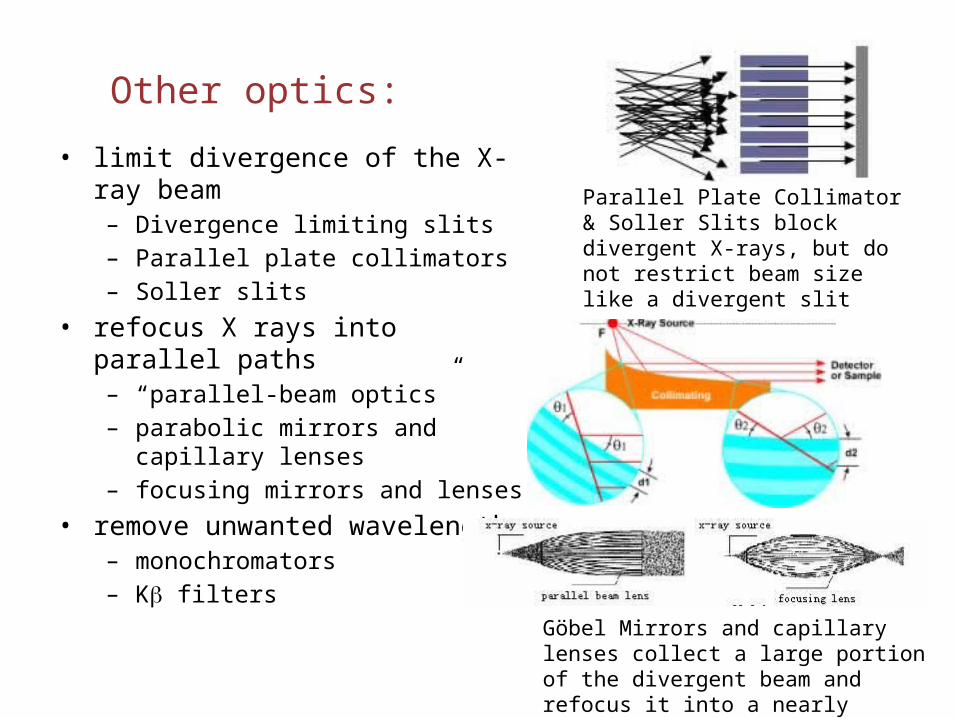
Other optics:
• limit divergence of the X-ray beam– Divergence limiting slits– Parallel plate collimators– Soller slits
• refocus X rays into parallel paths– “parallel-beam optics”– parabolic mirrors and capillary lenses– focusing mirrors and lenses
• remove unwanted wavelengths– monochromators– Kb filters
Parallel Plate Collimator & Soller Slits block divergent X-rays, but do not restrict beam size like a divergent slit
Göbel Mirrors and capillary lenses collect a large portion of the divergent beam and refocus it into a nearly parallel beam
Detectors
• point detectors– observe one point of space at a time
• slow, but compatible with most/all optics– scintillation and gas proportional detectors count all photons, within an energy
window, that hit them– Si(Li) detectors can electronically analyze or filter wavelengths
• position sensitive detectors– linear PSDs observe all photons scattered along a line from 2 to 10° long– 2D area detectors observe all photons scattered along a conic section– gas proportional (gas on wire; microgap anodes)
• limited resolution, issues with deadtime and saturation– CCD
• limited in size, expensive – solid state real-time multiple semiconductor strips
• high speed with high resolution, robust
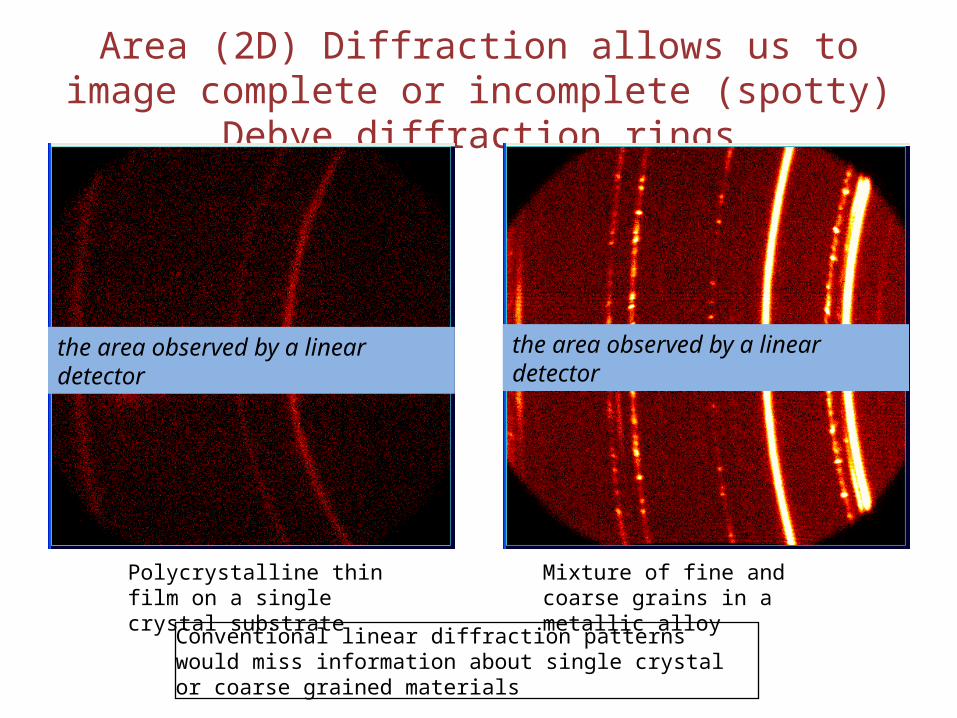
Area (2D) Diffraction allows us to image complete or incomplete (spotty) Debye diffraction rings
Polycrystalline thin film on a single crystal substrate
Mixture of fine and coarse grains in a metallic alloy
Conventional linear diffraction patterns would miss information about single crystal or coarse grained materials
the area observed by a linear detector
the area observed by a linear detector
Scott A. Speakman, Ph.D. http://prism.mit.edu/xray
Instruments in the X-Ray SEFat the Center for Material Science and
Engineering at MIT

PANalytical X’Pert Pro Multipurpose Diffractometer• Prefix optics allow the configuration to be quickly changed to accommodate a wide
variety of data collection strategies. • This diffractometer can be used to collect XRPD, GIXD, XRR, residual stress, and
texture data. • A vertical-circle theta-theta goniometer is used so that the sample always lies flat
and does not move. – Sample sizes may be as large as 60mm diameter by 3-12mm thick, though a more typical
sample size is 10-20mm diameter.• Data collection modes can be changed between:
– high-speed high-resolution divergent beam diffraction• Programmable divergence slits can maintain a constant irradiated area on sample surface
– parallel beam diffraction using incident Gobel mirror and receiving-side parallel plate collimator
• eliminates errors due to irregular sample surfaces, sample displacement, and defocusing during glancing angle measurements
• A variety of sample stages include:– 15 specimen automatic sample changer– open Eulerian cradle with automated z-translation as well as phi and psi rotation for
texture, reflectivity, and residual stress measurements– furnace for heating a sample to 1200°C in air, vacuum, or controlled atmosphere– a cryostat for cooling a sample to 11 K in vacuum

In-situ XRD can yield quantitative analysis to study reaction pathways, rate constants, activation energy, and phase equilibria
N NaAlH 4N
NaAlH 4
0 e k1t
N Na3AlH 6
1
3N
NaAlH 4
0 k1
k2 k1e k1t e k2t
N
Na3AlH 6
0 e k2t
N Al NNaAlH 4
0 2
3
1
3
k2
k2 k1
1 e k1t
1
3
k1
k2 k11 e k2t
N
Na3AlH 6
0 1 e k2t
N Al
0
NaAlH4
Al
NaCl
Na3AlH6
Rigaku SmartLab Multipurpose Diffractometer
• High power 9kw source• Available diffracted-beam monochromator for improved signal-to-noise ratio• Easy to change between Bragg-Brentano (BB) and Parellel-Beam (PB) geometry
– Capable of GIXD and IP-GIXD measurements that are very useful for the analysis of thin films
– While capable of collecting data from powder samples, we mostly use this instrument for thin film analysis and use the PANalytical X’Pert Pro for powder analysis
• Able to measure pole figure of highly oriented thin films using in-plane pole figures
• Specialized optics for samples sealed in capillary tubes• Incident-beam monochromator for analysis of epitaxial and nearly-epitaxial
thin films• A furnace that can heat up to 1400 C configured for very fast data collection• In-situ battery cell to collect data while battery materials are discharged and
recharged.

Rigaku Cr-Source Powder Diffractometer• Fast, precision XRPD using theta/2theta motion• High-power (10kW) rotating anode source supplies high X ray flux• Diffracted-beam monochromators provide very good signal-to-noise ratio• Horizontal-circle powder diffractometers
– Horizontal circle facilitates precision movement of goniometer– Disadvantage: sample sits vertical, can easily fall out of sample holder
• Sample size is generally 20mm x 10mm x 0.3mm, though we have a variety of sample holders and mounting procedures to accommodate varied sample geometries.
• Special accessories include:– Inert atmosphere sample chamber for air/moisture sensitive samples– Zero background sample holders for high accuracy measurements from small quantities
of powder
• Requires special considerations if your sample is a single crystal or a thin film on a single crystal substrate
Bruker D8 Diffractometer with GADDS
• Ideal for texture (pole figure) and stress measurements, as well as traditional XRPD and limited SCD and GIXD.
• Two-dimensional area detector (GADDS) permits simultaneous collection of diffraction data over a 2theta and chi (tilt) range as large as 30°
• Eularian cradle facilitates large range of tilts and rotations of the sample• A selectable collimator, which conditions the X-ray beam to a spot 0.5mm to
0.05mm diameter, combined with a motorized xy stage stage, permits microdiffraction for multiple select areas of a sample or mapping across a sample’s surface.
• Samples can include thin films on wafers or dense pieces up to 6” in diameter (maximum thickness of 3 mm), powders in top-loaded sample holders or in capillaries, dense pieces up to 60mm x 50mm x 15mm (and maybe even larger).
• Has an attachment for SAXS measurements.
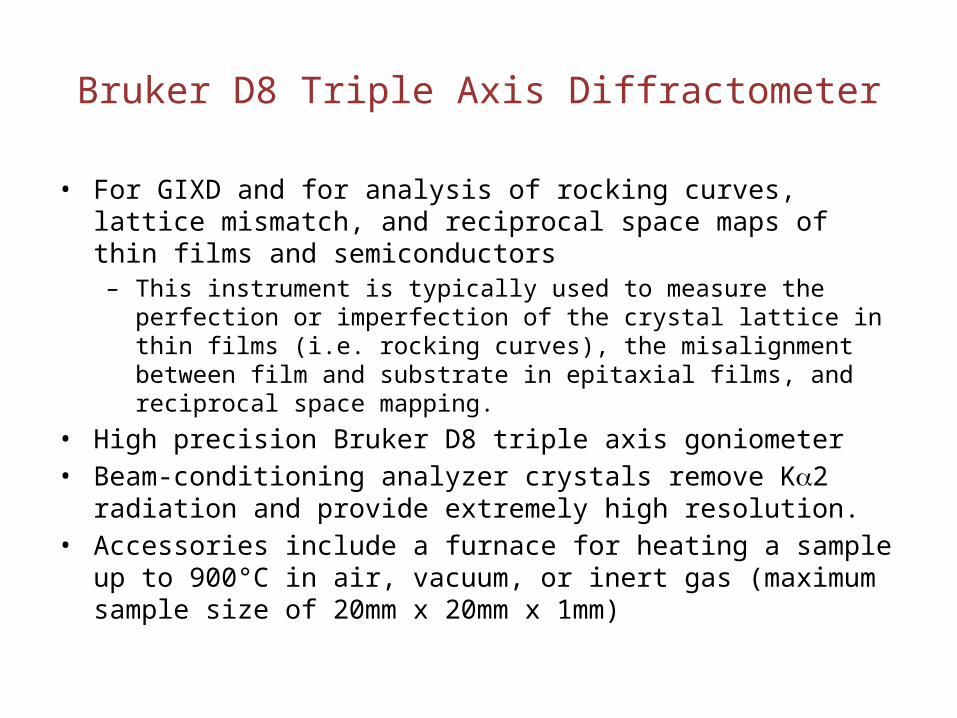
Bruker D8 Triple Axis Diffractometer
• For GIXD and for analysis of rocking curves, lattice mismatch, and reciprocal space maps of thin films and semiconductors– This instrument is typically used to measure the perfection or imperfection of
the crystal lattice in thin films (i.e. rocking curves), the misalignment between film and substrate in epitaxial films, and reciprocal space mapping.
• High precision Bruker D8 triple axis goniometer • Beam-conditioning analyzer crystals remove Ka2 radiation and provide
extremely high resolution. • Accessories include a furnace for heating a sample up to 900°C in air,
vacuum, or inert gas (maximum sample size of 20mm x 20mm x 1mm)
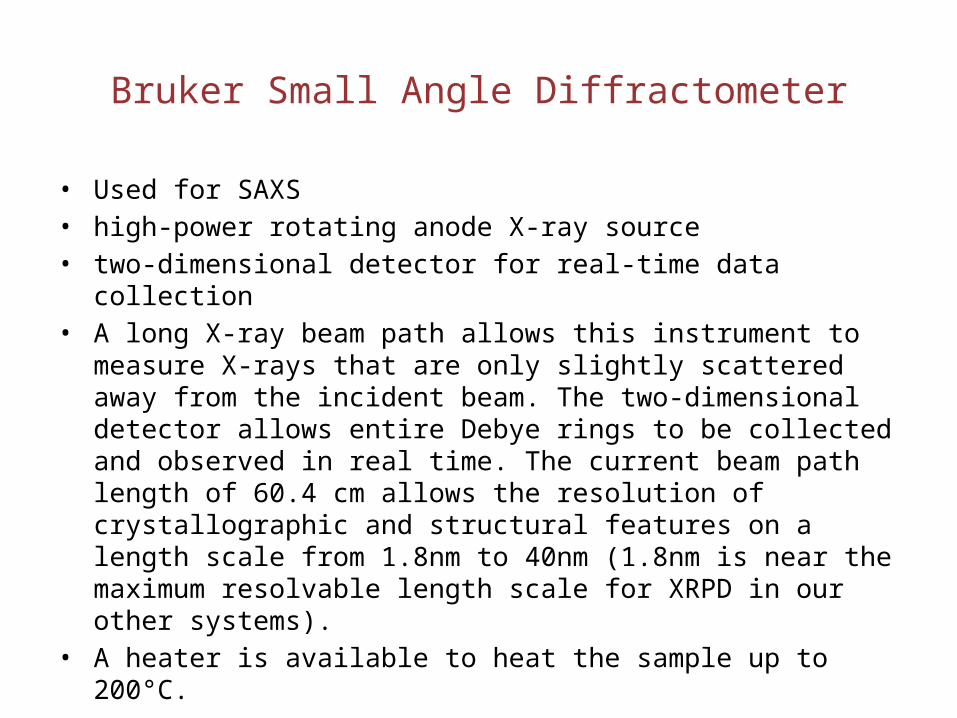
Bruker Small Angle Diffractometer
• Used for SAXS • high-power rotating anode X-ray source• two-dimensional detector for real-time data collection • A long X-ray beam path allows this instrument to measure X-rays that are
only slightly scattered away from the incident beam. The two-dimensional detector allows entire Debye rings to be collected and observed in real time. The current beam path length of 60.4 cm allows the resolution of crystallographic and structural features on a length scale from 1.8nm to 40nm (1.8nm is near the maximum resolvable length scale for XRPD in our other systems).
• A heater is available to heat the sample up to 200°C.
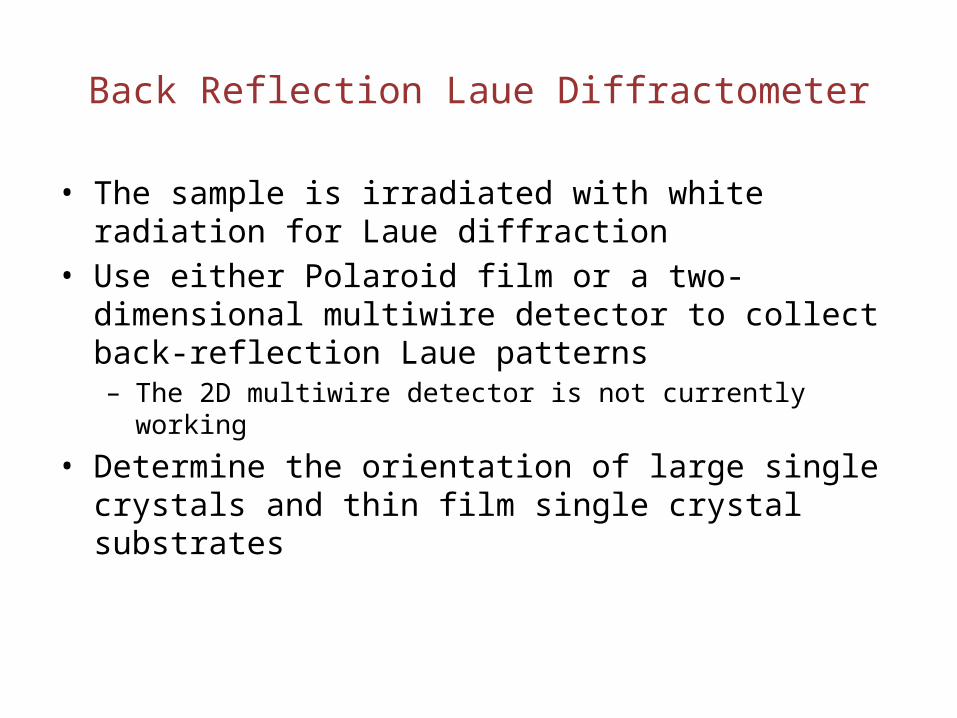
Back Reflection Laue Diffractometer
• The sample is irradiated with white radiation for Laue diffraction
• Use either Polaroid film or a two-dimensional multiwire detector to collect back-reflection Laue patterns – The 2D multiwire detector is not currently working
• Determine the orientation of large single crystals and thin film single crystal substrates
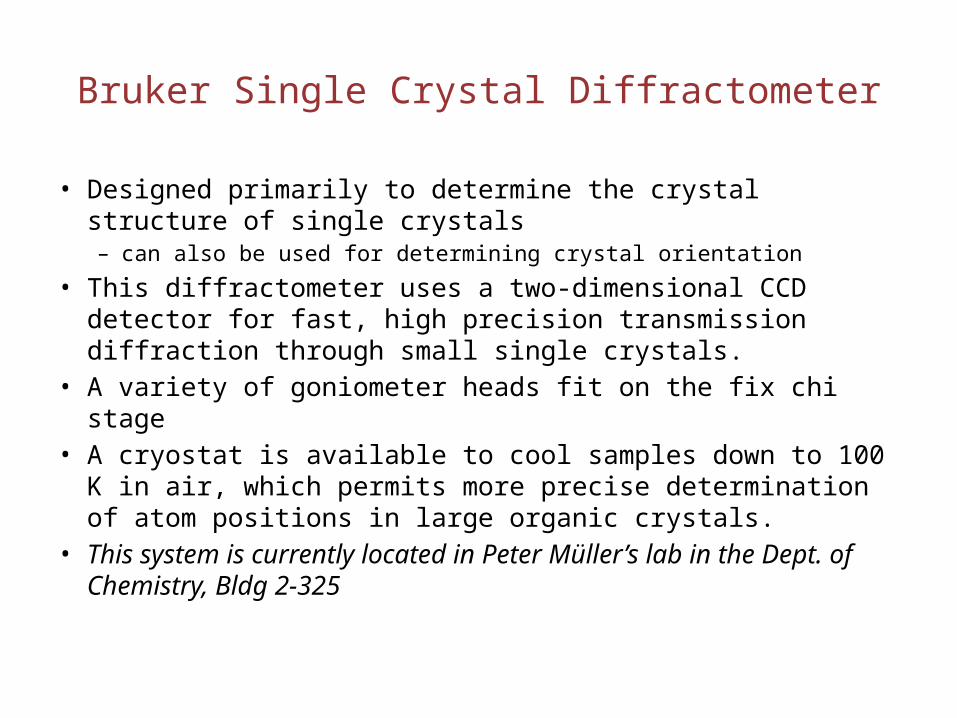
Bruker Single Crystal Diffractometer
• Designed primarily to determine the crystal structure of single crystals – can also be used for determining crystal orientation
• This diffractometer uses a two-dimensional CCD detector for fast, high precision transmission diffraction through small single crystals.
• A variety of goniometer heads fit on the fix chi stage• A cryostat is available to cool samples down to 100 K in air,
which permits more precise determination of atom positions in large organic crystals.
• This system is currently located in Peter Müller’s lab in the Dept. of Chemistry, Bldg 2-325

Scott A. Speakman, Ph.D. http://prism.mit.edu/xray
Sample Preparation
Important characteristics of samples for XRPD
• a flat plate sample for XRPD should have a smooth flat surface– if the surface is not smooth and flat, X-ray absorption may reduce the
intensity of low angle peaks– parallel-beam optics can be used to analyze samples with odd shapes
or rough surfaces
• Densely packed• Randomly oriented grains/crystallites• Grain size less than 10 microns
– So that there are tens of thousands of grains irradiated by the X-ray beam
• ‘Infinitely’ thick• homogeneous

Preparing a powder specimen
• An ideal powder sample should have many crystallites in random orientations– the distribution of orientations should be smooth and equally distributed
amongst all orientations• Large crystallite sizes and non-random crystallite orientations both lead to
peak intensity variation– the measured diffraction pattern will not agree with that expected from an
ideal powder– the measured diffraction pattern will not agree with reference patterns in the
Powder Diffraction File (PDF) database• If the crystallites in a sample are very large, there will not be a smooth
distribution of crystal orientations. You will not get a powder average diffraction pattern.– crystallites should be <10mm in size to get good powder statistics
Preferred orientation
• If the crystallites in a powder sample have plate or needle like shapes it can be very difficult to get them to adopt random orientations– top-loading, where you press the powder into a holder, can cause
problems with preferred orientation
• in samples such as metal sheets or wires there is almost always preferred orientation due to the manufacturing process
• for samples with systematic orientation, XRD can be used to quantify the texture in the specimen
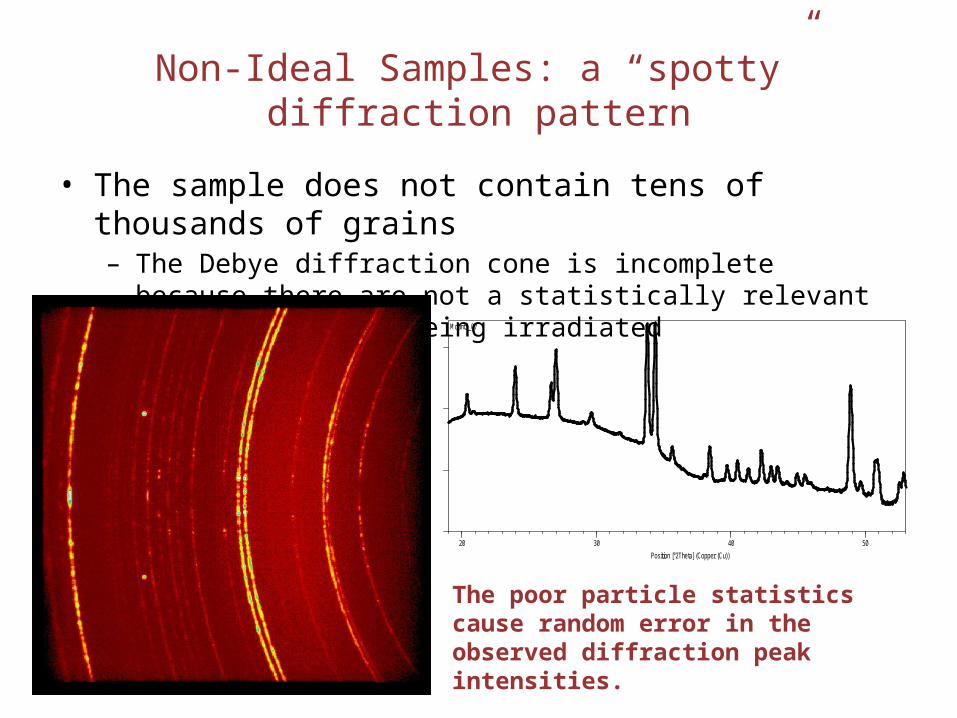
Non-Ideal Samples: a “spotty” diffraction pattern
• The sample does not contain tens of thousands of grains– The Debye diffraction cone is incomplete because there are not a
statistically relevant number of grains being irradiated
Position [°2Theta] (Copper (Cu))
20 30 40 50
Counts
0
400
1600
3600
Mount3_07
The poor particle statistics cause random error in the observed diffraction peak intensities.

Non-ideal samples: Texture (i.e. preferred crystallographic orientation)
• The samples consists of tens of thousands of grains, but the grains are not randomly oriented– Some phenomenon during crystallization and growth, processing, or
sample preparation have caused the grains to have preferred crystallographic direction normal to the surface of the sample
The preferred orientation creates a systematic error in the observed diffraction peak intensities.
0
50
100
150
200
250
300
350
Inte
nsity
(Cou
nts)
(111)(221)
(021) (012) (112) (041) (132) (113)(220)(102) (211)(121)(002) (040) (212) (042)(222)
JCS#98> CaCO3 - Aragonite
25 30 35 40 45 50 55
Two-Theta (deg)

Ways to prepare a powder sample
• Top-loading a bulk powder into a well – deposit powder in a shallow well of a sample holder. Use a slightly
rough flat surface to press down on the powder, packing it into the well.
• using a slightly rough surface to pack the powder can help minimize preferred orientation
• mixing the sample with a filler such as flour or glass powder may also help minimize preferred orientation
• powder may need to be mixed with a binder to prevent it from falling out of the sample holder
– alternatively, the well of the sample holder can be coated with a thin layer of vaseline
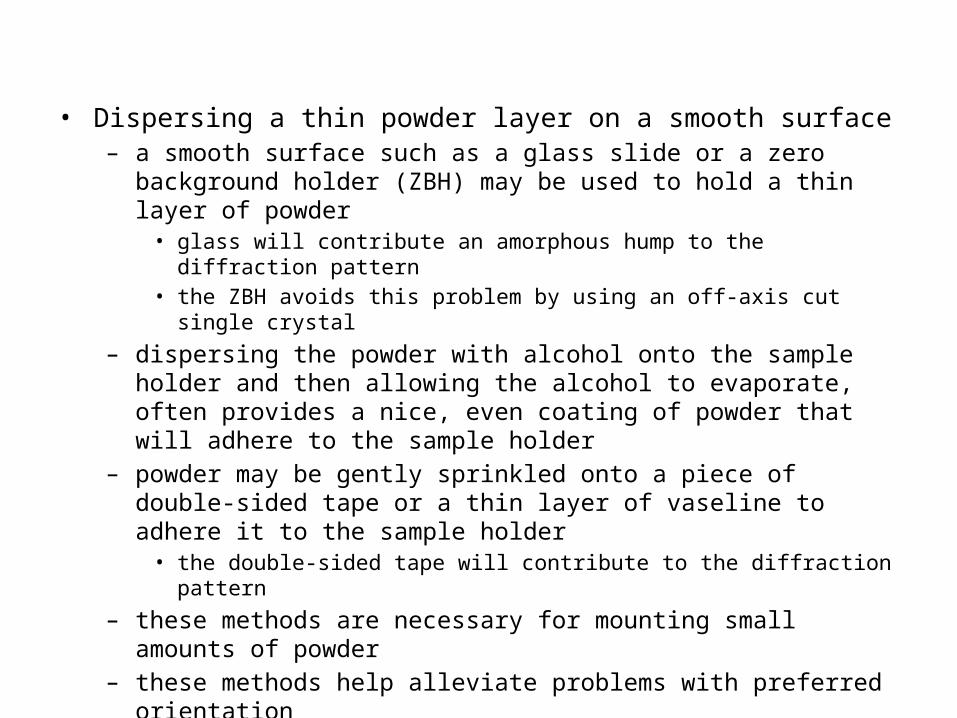
• Dispersing a thin powder layer on a smooth surface– a smooth surface such as a glass slide or a zero background holder (ZBH) may
be used to hold a thin layer of powder• glass will contribute an amorphous hump to the diffraction pattern• the ZBH avoids this problem by using an off-axis cut single crystal
– dispersing the powder with alcohol onto the sample holder and then allowing the alcohol to evaporate, often provides a nice, even coating of powder that will adhere to the sample holder
– powder may be gently sprinkled onto a piece of double-sided tape or a thin layer of vaseline to adhere it to the sample holder
• the double-sided tape will contribute to the diffraction pattern– these methods are necessary for mounting small amounts of powder– these methods help alleviate problems with preferred orientation– the constant volume assumption is not valid for this type of sample, and so
quantitative and Rietveld analysis will require extra work and may not be possible

Scott A. Speakman, Ph.D. http://prism.mit.edu/xray
Experimental Considerations
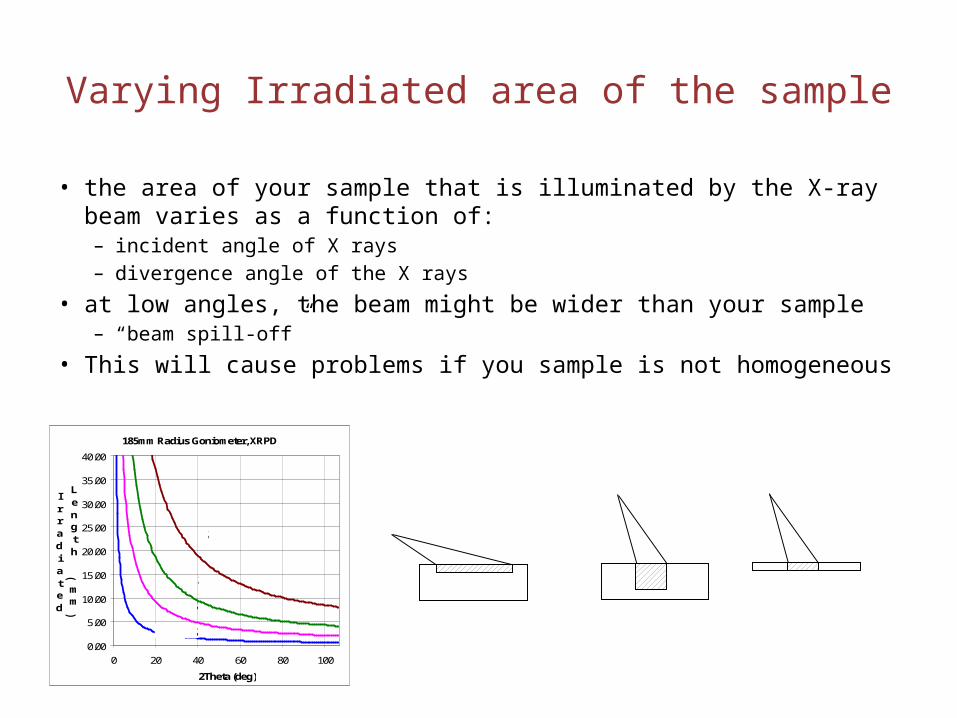
Varying Irradiated area of the sample
• the area of your sample that is illuminated by the X-ray beam varies as a function of:– incident angle of X rays– divergence angle of the X rays
• at low angles, the beam might be wider than your sample– “beam spill-off”
• This will cause problems if you sample is not homogeneous185mm Radius Goniometer, XRPD
0.00
5.00
10.00
15.00
20.00
25.00
30.00
35.00
40.00
0 20 40 60 80 100
2Theta (deg)
Irradiated
Length
(
mm
)
2°DS
1°DS
0.5°DS
0.15°DS
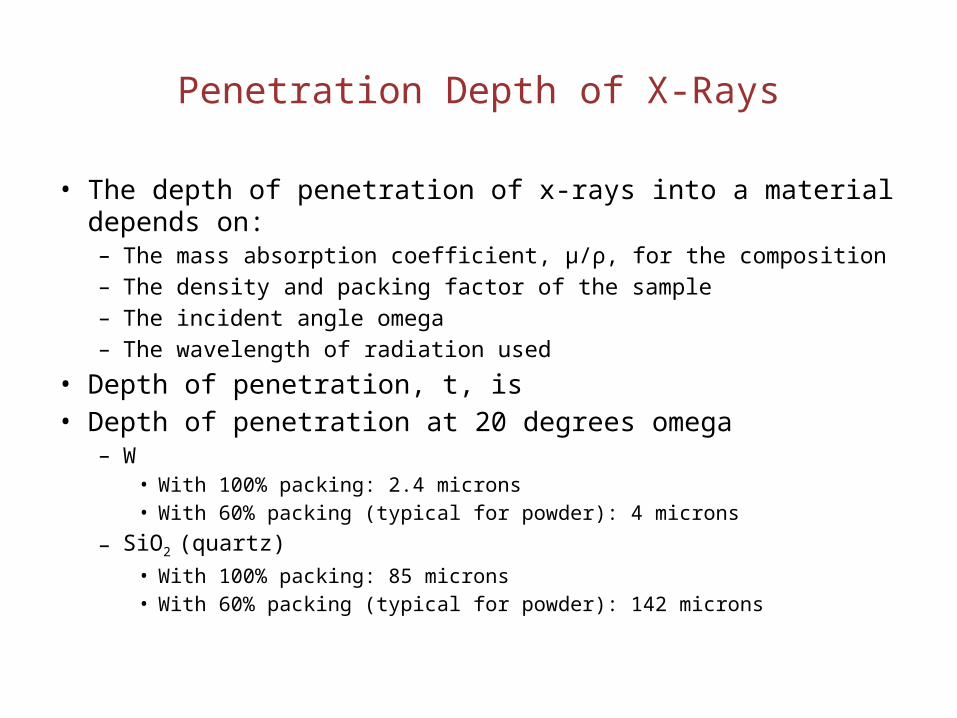
Penetration Depth of X-Rays
• The depth of penetration of x-rays into a material depends on:– The mass absorption coefficient, μ/ρ, for the composition– The density and packing factor of the sample – The incident angle omega– The wavelength of radiation used
• Depth of penetration, t, is • Depth of penetration at 20 degrees omega
– W• With 100% packing: 2.4 microns• With 60% packing (typical for powder): 4 microns
– SiO2 (quartz)• With 100% packing: 85 microns• With 60% packing (typical for powder): 142 microns
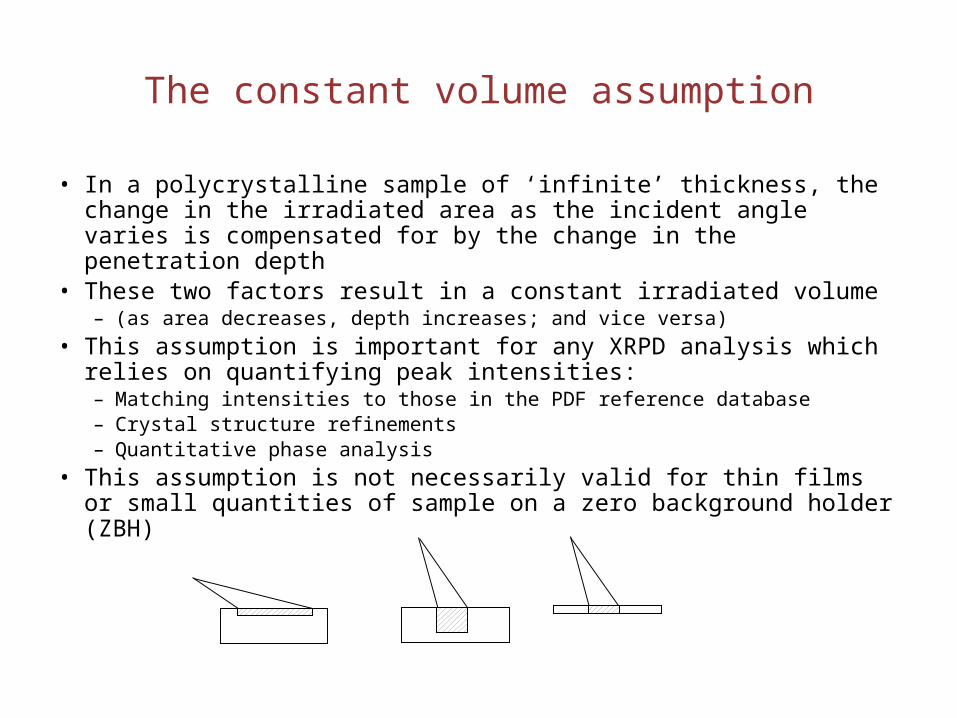
The constant volume assumption
• In a polycrystalline sample of ‘infinite’ thickness, the change in the irradiated area as the incident angle varies is compensated for by the change in the penetration depth
• These two factors result in a constant irradiated volume– (as area decreases, depth increases; and vice versa)
• This assumption is important for any XRPD analysis which relies on quantifying peak intensities:– Matching intensities to those in the PDF reference database– Crystal structure refinements– Quantitative phase analysis
• This assumption is not necessarily valid for thin films or small quantities of sample on a zero background holder (ZBH)
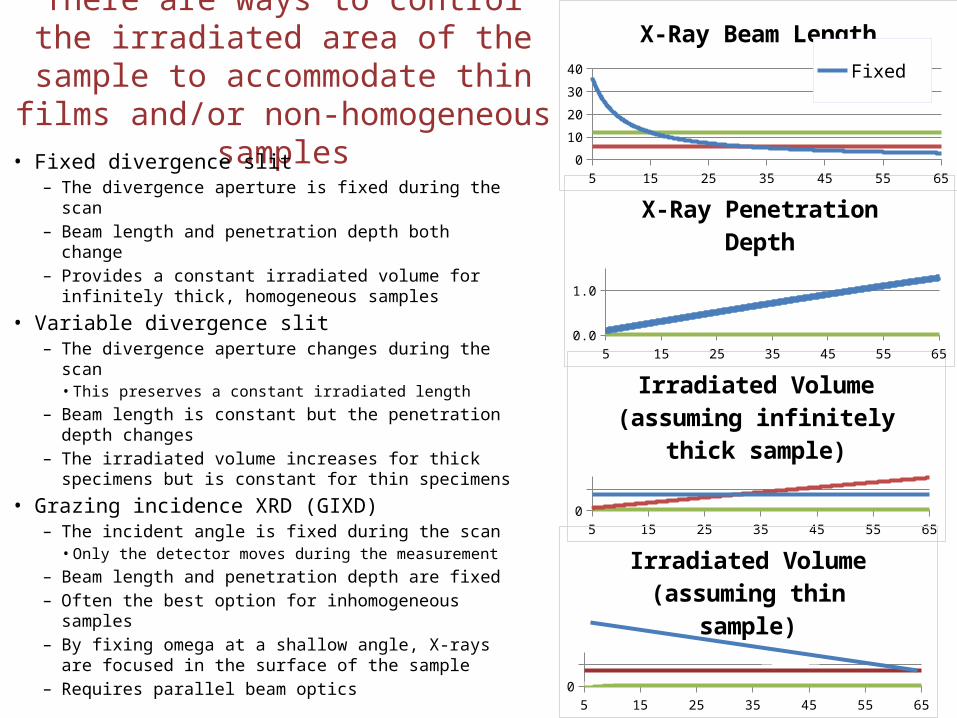
There are ways to control the irradiated area of the sample to accommodate thin films and/or non-homogeneous samples
• Fixed divergence slit– The divergence aperture is fixed during the scan– Beam length and penetration depth both change– Provides a constant irradiated volume for infinitely
thick, homogeneous samples
• Variable divergence slit – The divergence aperture changes during the scan
• This preserves a constant irradiated length– Beam length is constant but the penetration depth
changes– The irradiated volume increases for thick specimens
but is constant for thin specimens
• Grazing incidence XRD (GIXD)– The incident angle is fixed during the scan
• Only the detector moves during the measurement– Beam length and penetration depth are fixed– Often the best option for inhomogeneous samples– By fixing omega at a shallow angle, X-rays are
focused in the surface of the sample– Requires parallel beam optics
5 15 25 35 45 55 6502468
Irradiated Volume(assuming infinitely thick
sample)
5 15 25 35 45 55 650.0
0.5
1.0
1.5
X-Ray Penetration Depth5 15 25 35 45 55 65
0
10
20
30
40
X-Ray Beam LengthFixedVariableGIXD
5 15 25 35 45 55 650
2
4
6
8
Irradiated Volume(assuming thin sample)

Many sources of error are associated with the focusing circle of the Bragg-Brentano parafocusing geometry
• The Bragg-Brentano parafocusing geometry is used so that the divergent X-ray beam reconverges at the focal point of the detector.
• This produces a sharp, well-defined diffraction peak in the data.
• If the source, detector, and sample are not all on the focusing circle, errors will appear in the data.
• The use of parallel-beam optics eliminates all sources of error associated with the focusing circle.
sample
tubedetector
ReceivingSlits

Sample Displacement Error• When the sample is not on the focusing
circle, the X-ray beam does not converge at the correct position for the detector.
• The observed peak position is incorrect. • This is the greatest source of error in
most data• This is a systematic error:
– s is the amount of displacement, R is the goniometer radius.
– at 28.4° 2theta, s=0.006” will result in a peak shift of 0.08°
)(cos2
2 radiansinR
s
tubedetector
ReceivingSlits
sample
Ways to compensate for sample displacement:• This is most commonly analyzed and compensated for using data analysis algorithms• For sample ID, simply remember that your peak positions may be shifted a little bit• Historically, the internal calibration standard was required for publication quality data
• The computer algorithms for calculating the displacement error are now much better• Can be minimized by using a zero background sample holder• Can be eliminated by using parallel-beam optics
sample
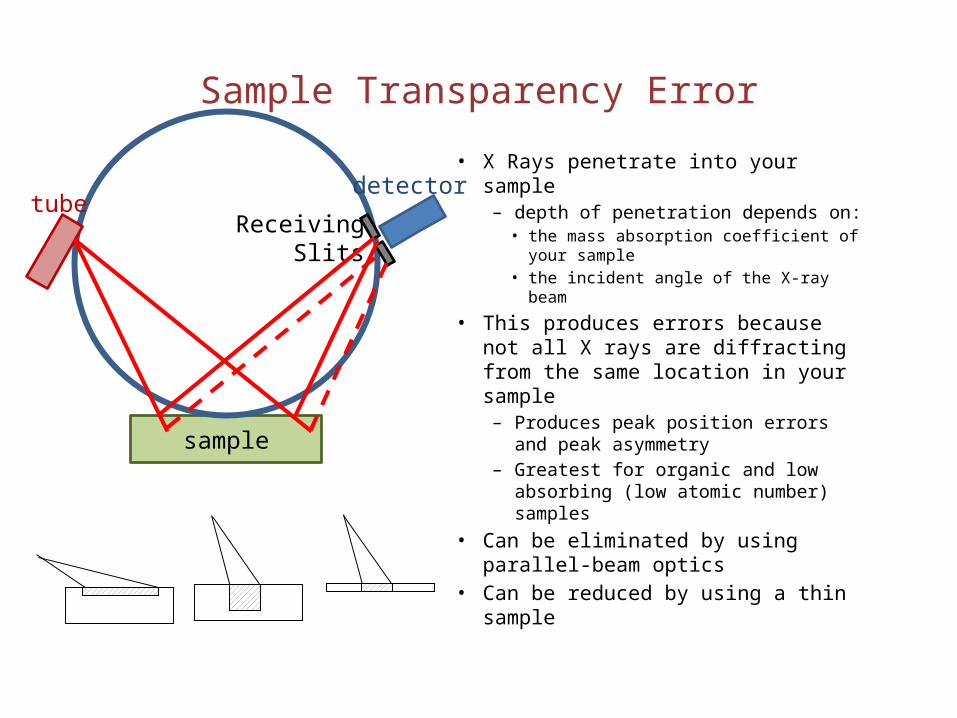
Sample Transparency Error
• X Rays penetrate into your sample– depth of penetration depends on:
• the mass absorption coefficient of your sample
• the incident angle of the X-ray beam
• This produces errors because not all X rays are diffracting from the same location in your sample– Produces peak position errors and
peak asymmetry– Greatest for organic and low
absorbing (low atomic number) samples
• Can be eliminated by using parallel-beam optics
• Can be reduced by using a thin sample
tubedetector
ReceivingSlits
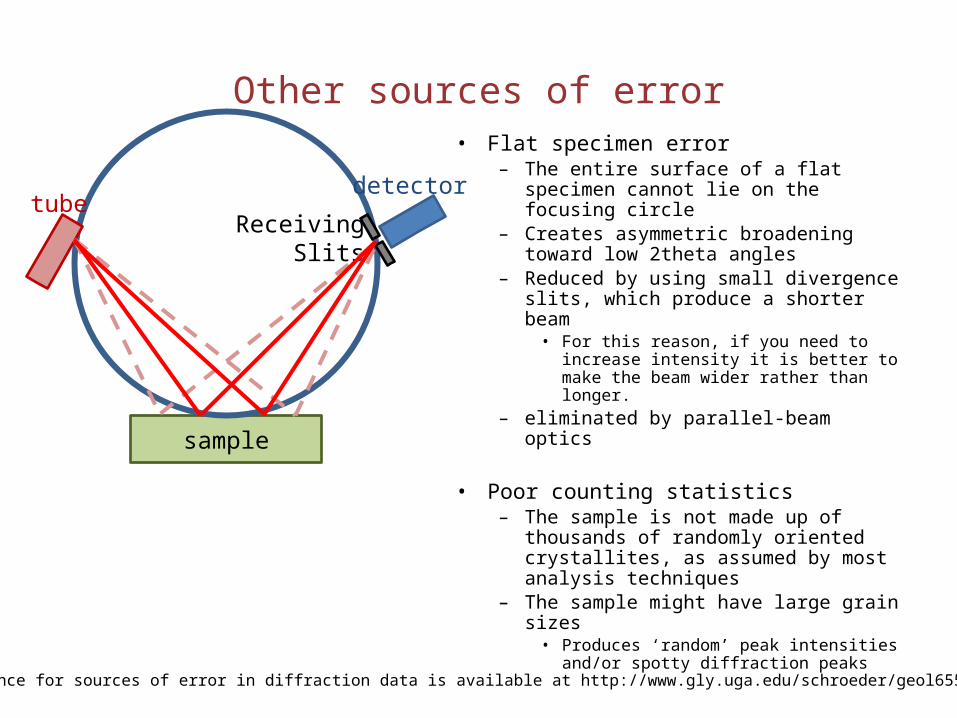
Other sources of error• Flat specimen error
– The entire surface of a flat specimen cannot lie on the focusing circle
– Creates asymmetric broadening toward low 2theta angles
– Reduced by using small divergence slits, which produce a shorter beam
• For this reason, if you need to increase intensity it is better to make the beam wider rather than longer.
– eliminated by parallel-beam optics
• Poor counting statistics– The sample is not made up of thousands
of randomly oriented crystallites, as assumed by most analysis techniques
– The sample might have large grain sizes• Produces ‘random’ peak intensities and/or
spotty diffraction peaks
sample
tubedetector
ReceivingSlits
A good reference for sources of error in diffraction data is available at http://www.gly.uga.edu/schroeder/geol6550/XRD.html

Axial divergence
• Axial divergence– Due to divergence of the X-ray beam in plane with the sample– creates asymmetric broadening of the peak toward low 2theta angles– Creates peak shift: negative below 90° 2theta and positive above 90°– Reduced by Soller slits and/or capillary lenses
20000
40000
60000
Counts
Position [°2Theta] (Copper (Cu))3 4 5 6
0.02rad Soller Slits 0.04rad incident Soller slit and 0.02rad detector Soller Slit 0.04rad Soller Slits

Scott A. Speakman, Ph.D. http://prism.mit.edu/xray
End of presentation: other slides are old or extra

Techniques in the XRD SEF
• X-ray Powder Diffraction (XRPD)• Single Crystal Diffraction (SCD)• Back-reflection Laue Diffraction (no acronym)• Grazing Incidence Angle Diffraction (GIXD)• X-ray Reflectivity (XRR)• Small Angle X-ray Scattering (SAXS)
X-Ray Powder Diffraction (XRPD)
• More appropriately called polycrystalline X-ray diffraction, because it can also be used for sintered samples, metal foils, coatings and films, finished parts, etc.
• Used to determine:– phase composition (commonly called phase ID)- what phases are present?– quantitative phase analysis- how much of each phase is present?– unit cell lattice parameters– crystal structure– average crystallite size of nanocrystalline samples– crystallite microstrain– texture – residual stress (really residual strain)– in-situ diffraction (from 11 K to 1200C in air, vacuum, or inert gas)
Grazing Incident Angle Diffraction (GIXD)
• also called Glancing Angle X-Ray Diffaction• The incident angle is fixed at a very small angle (<5°) so that X-rays are
focused in only the top-most surface of the sample. • GIXD can perform many of analyses possible with XRPD with the added
ability to resolve information as a function of depth (depth-profiling) by collecting successive diffraction patterns with varying incident angles– orientation of thin film with respect to substrate– lattice mismatch between film and substrate– epitaxy/texture– macro- and microstrains– reciprocal space map
X-Ray Reflectivity (XRR)
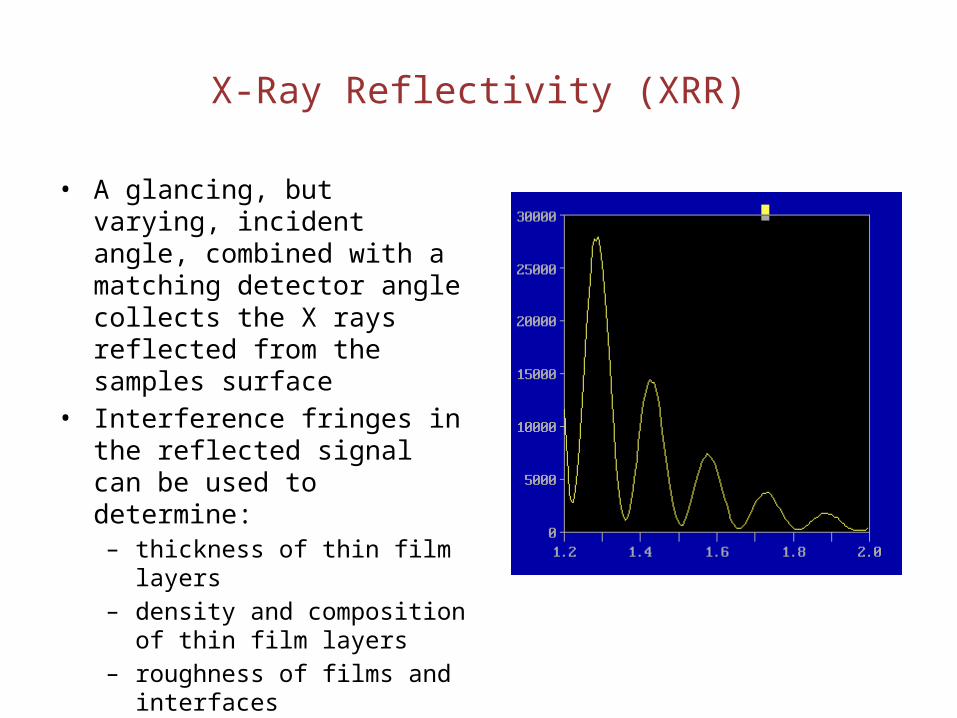
• A glancing, but varying, incident angle, combined with a matching detector angle collects the X rays reflected from the samples surface
• Interference fringes in the reflected signal can be used to determine:– thickness of thin film layers– density and composition of thin
film layers– roughness of films and interfaces
Back Reflection Laue
• Used to determine crystal orientation• The beam is illuminated with ‘white’ radiation
– Use filters to remove the characteristic radiation wavelengths from the X-ray source
– The Bremmsstrahlung radiation is left• Weak radiation spread over a range of wavelengths
• The single crystal sample diffracts according to Bragg’s Law– Instead of scanning the angle theta to make multiple crystallographic
planes diffract, we are effectively ‘scanning’ the wavelength– Different planes diffract different wavelengths in the X-ray beam,
producing a series of diffraction spots
Small Angle X-ray Scattering (SAXS)
• Highly collimated beam, combined with a long distance between the sample and the detector, allow sensitive measurements of the X-rays that are just barely scattered by the sample (scattering angle <6°)
• The length scale of d (Å) is inversely proportional to the scattering angle: therefore, small angles represented larger features in the samples
• Can resolve features of a size as large as 200 nm– Resolve microstructural features, as well as crystallographic
• Used to determine:– crystallinity of polymers, organic molecules (proteins, etc.) in solution, – structural information on the nanometer to submicrometer length scale– ordering on the meso- and nano- length scales of self-assembled molecules
and/or pores– dispersion of crystallites in a matrix
Single Crystal Diffraction (SCD)
• Used to determine:– crystal structure– orientation– degree of crystalline perfection/imperfections (twinning, mosaicity,
etc.)
• Sample is illuminated with monochromatic radiation– The sample axis, phi, and the goniometer axes omega and 2theta are
rotated to capture diffraction spots from at least one hemisphere– Easier to index and solve the crystal structure because it diffraction
peak is uniquely resolved
Instruments in the XRD SEF
• Rigaku RU300 Powder Diffractometers• Bruker D8 with GADDS • Bede D3• PANalytical X’Pert Pro• Back-reflection Laue (polaroid)• SAXS• Bruker Smart APEX*
Available Software
• PANalytical HighScore Plus– Phase identification– Profile fitting or whole pattern fitting for
• unit cell refinement• nanocrystallite size and strain• quantitative phase analysis
– indexing– Rietveld refinement of crystal structures– cluster analysis
Software• MDI Jade
– phase ID– indexing and unit cell refinement– RIR quantitative phase analysis– residual stress– nanocrystallite size and strain– calculated diffraction patterns
Available Software
• PANalytical Stress- residual stress analysis• PANalytical Texture- pole figure mapping of texture• PANalytical Reflectivity- reflectivity from multilayer thin films
• Bruker Multex Area- pole figure mapping of texture• Bruker Leptos for epitaxial thin film and XRR analysis.
Available Free Software
• GSAS- Rietveld refinement of crystal structures• FullProf- Rietveld refinement of crystal structures• Rietan- Rietveld refinement of crystal structures
• PowderCell- crystal visualization and simulated diffraction patterns
• JCryst- stereograms

Website
• http://prism.mit.edu/xray– reserving instrument time– instrument status– training schedules– links to resources– SOP’s– tutorials
Single Crystal Diffractometers
• The design challenge for single crystal diffractometers: how to determine the position and intensity of these diffraction spots– Reflection vs transmission
• Transmission: small samples & organic crystals• Reflection: large samples, epitaxial thin films
– Laue vs. SCD• Laue: stationary sample bathed with white radiation (i.e. many
wavelengths)• SCD: monochromatic radiation hits a sample as it is rotated and
manipulated to bring different planes into diffracting condition
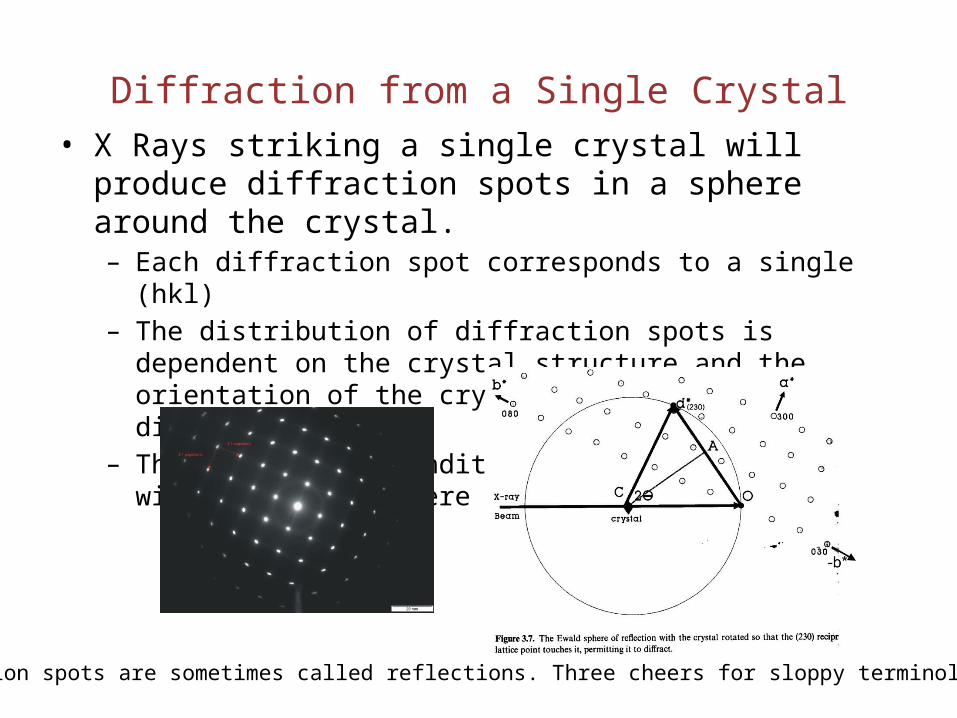
Diffraction from a Single Crystal• X Rays striking a single crystal will produce diffraction spots in
a sphere around the crystal.– Each diffraction spot corresponds to a single (hkl)– The distribution of diffraction spots is dependent on the crystal
structure and the orientation of the crystal in the diffractometer– The diffracting condition is best illustrated with the Ewald sphere in
reciprocal space
*Diffraction spots are sometimes called reflections. Three cheers for sloppy terminology!
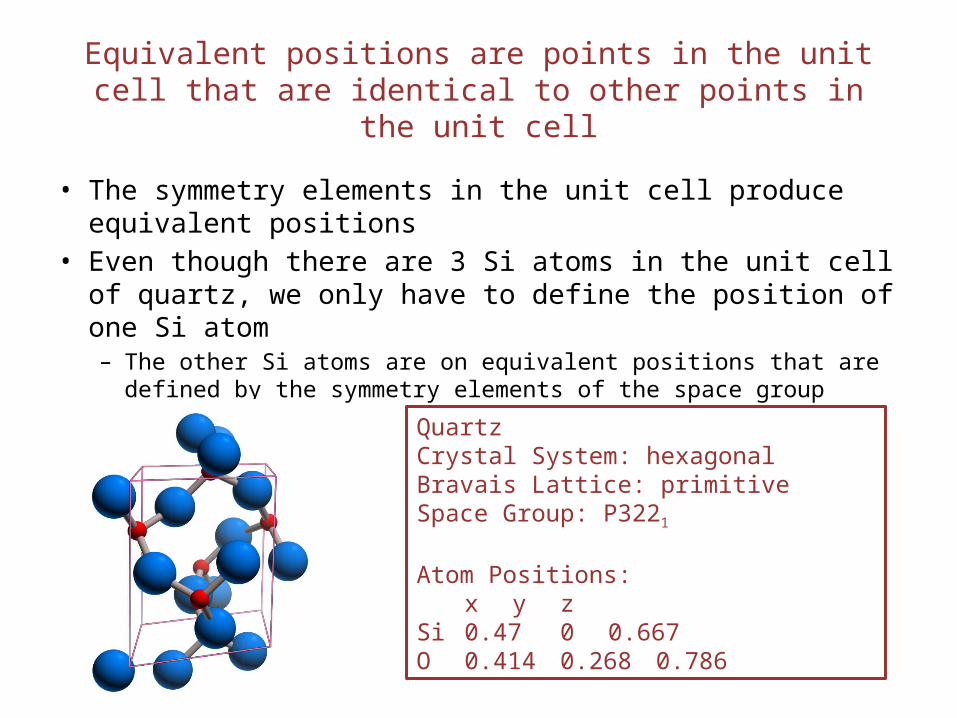
Equivalent positions are points in the unit cell that are identical to other points in the unit cell
• The symmetry elements in the unit cell produce equivalent positions
• Even though there are 3 Si atoms in the unit cell of quartz, we only have to define the position of one Si atom– The other Si atoms are on equivalent positions that are defined by the
symmetry elements of the space groupQuartzCrystal System: hexagonalBravais Lattice: primitiveSpace Group: P3221
Atom Positions:x y z
Si 0.47 0 0.667O 0.414 0.268 0.786
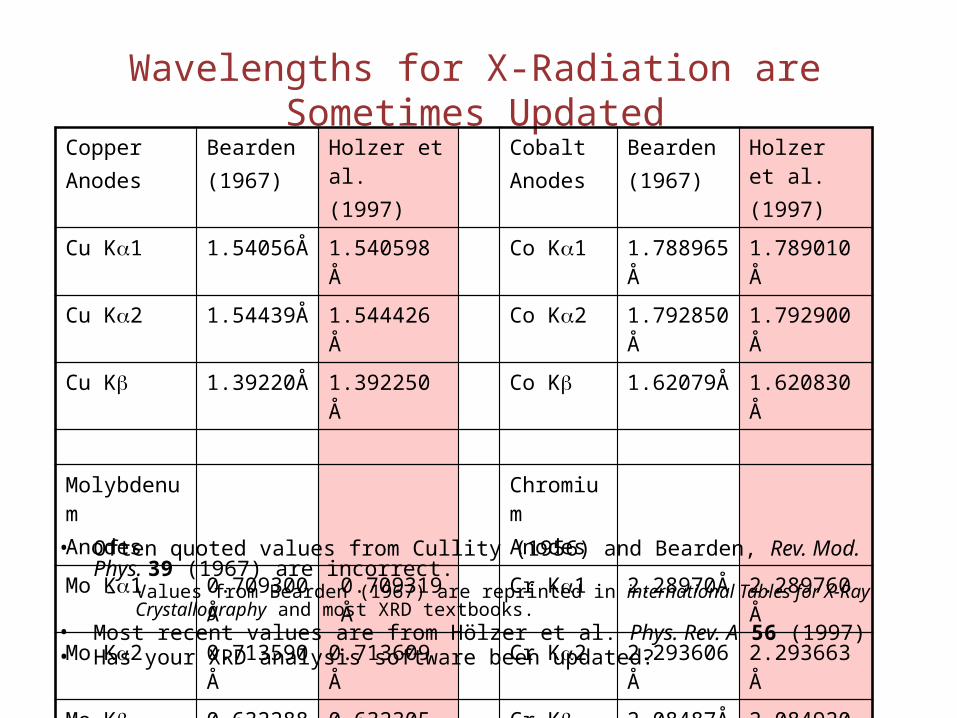
Wavelengths for X-Radiation are Sometimes UpdatedCopperAnodes
Bearden(1967)
Holzer et al.(1997)
CobaltAnodes
Bearden(1967)
Holzer et al.(1997)
Cu Ka1 1.54056Å 1.540598 Å Co Ka1 1.788965Å 1.789010 Å
Cu Ka2 1.54439Å 1.544426 Å Co Ka2 1.792850Å 1.792900 Å
Cu Kb 1.39220Å 1.392250 Å Co Kb 1.62079Å 1.620830 Å
MolybdenumAnodes
ChromiumAnodes
Mo Ka1 0.709300Å 0.709319 Å Cr Ka1 2.28970Å 2.289760 Å
Mo Ka2 0.713590Å 0.713609 Å Cr Ka2 2.293606Å 2.293663 Å
Mo Kb 0.632288Å 0.632305 Å Cr Kb 2.08487Å 2.084920 Å
• Often quoted values from Cullity (1956) and Bearden, Rev. Mod. Phys. 39 (1967) are incorrect.
– Values from Bearden (1967) are reprinted in international Tables for X-Ray Crystallography and most XRD textbooks.
• Most recent values are from Hölzer et al. Phys. Rev. A 56 (1997)• Has your XRD analysis software been updated?
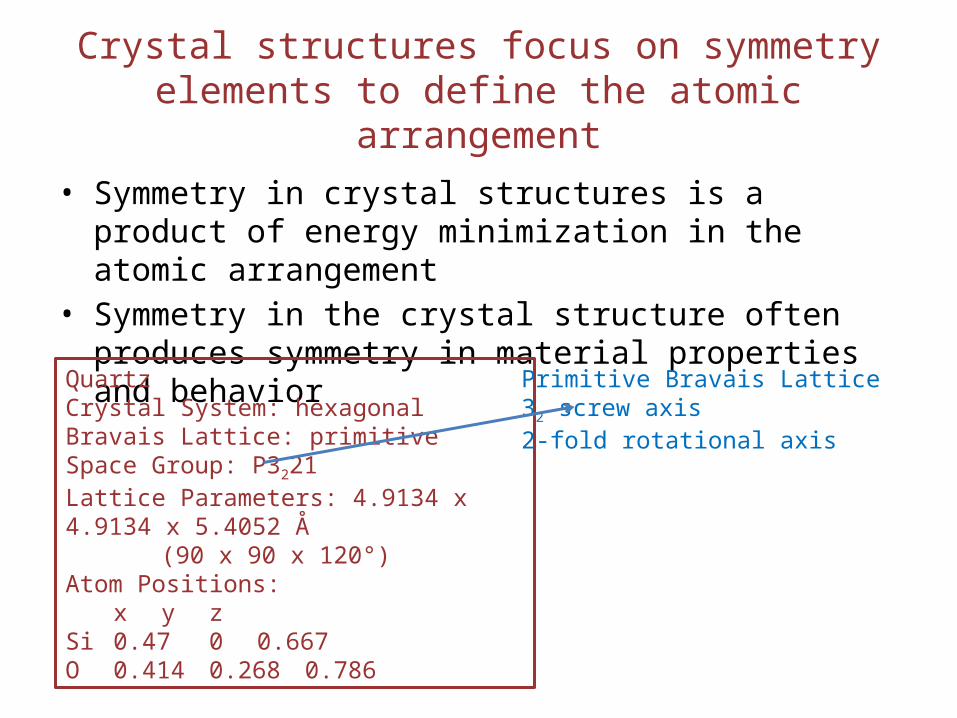
Crystal structures focus on symmetry elements to define the atomic arrangement
• Symmetry in crystal structures is a product of energy minimization in the atomic arrangement
• Symmetry in the crystal structure often produces symmetry in material properties and behavior
QuartzCrystal System: hexagonalBravais Lattice: primitiveSpace Group: P3221Lattice Parameters: 4.9134 x 4.9134 x 5.4052 Å
(90 x 90 x 120°)Atom Positions:
x y zSi 0.47 0 0.667O 0.414 0.268 0.786
Primitive Bravais Lattice32 screw axis2-fold rotational axis
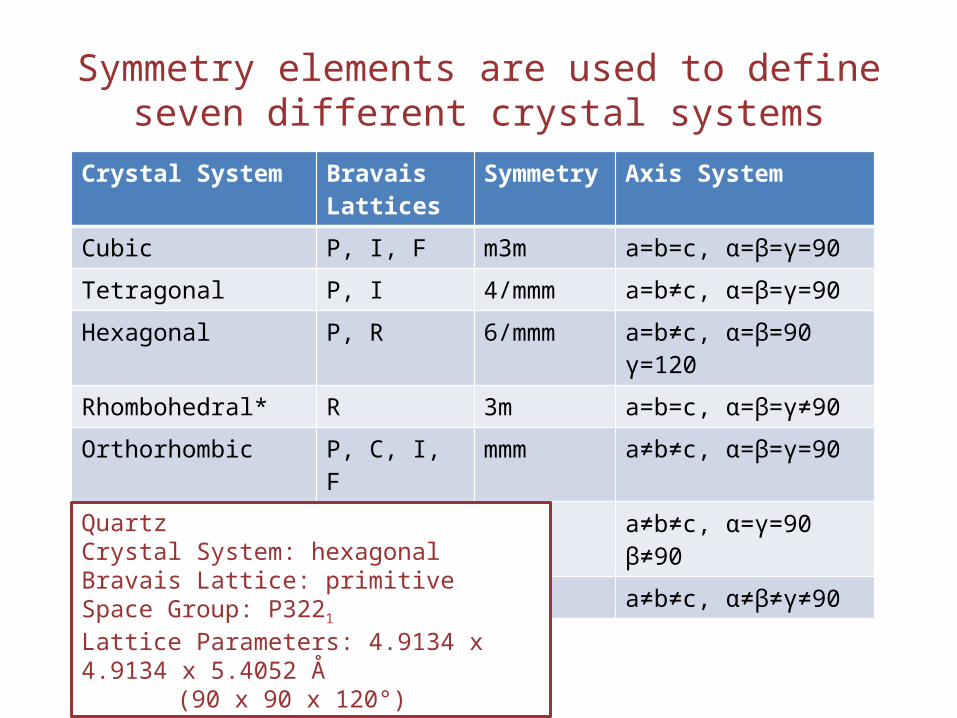
Symmetry elements are used to define seven different crystal systems
Crystal System Bravais Lattices
Symmetry Axis System
Cubic P, I, F m3m a=b=c, α=β=γ=90
Tetragonal P, I 4/mmm a=b≠c, α=β=γ=90
Hexagonal P, R 6/mmm a=b≠c, α=β=90 γ=120
Rhombohedral* R 3m a=b=c, α=β=γ≠90
Orthorhombic P, C, I, F mmm a≠b≠c, α=β=γ=90
Monoclinic P, C 2/m a≠b≠c, α=γ=90 β≠90
Triclinic P 1 a≠b≠c, α≠β≠γ≠90
QuartzCrystal System: hexagonalBravais Lattice: primitiveSpace Group: P3221
Lattice Parameters: 4.9134 x 4.9134 x 5.4052 Å (90 x 90 x 120°)
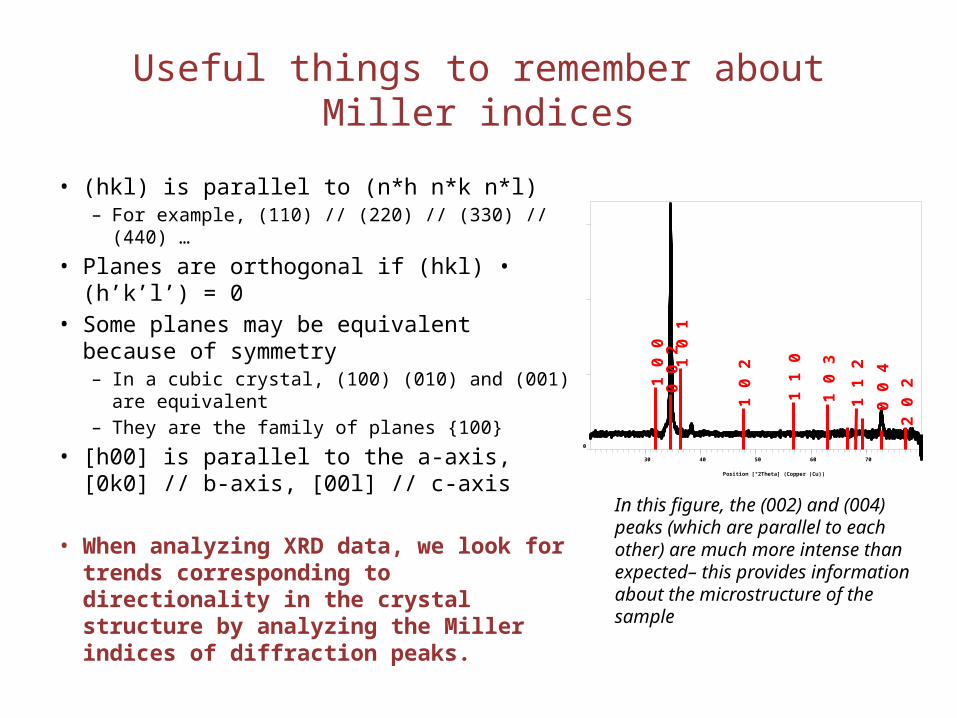
Useful things to remember about Miller indices
• (hkl) is parallel to (n*h n*k n*l)– For example, (110) // (220) // (330) // (440) …
• Planes are orthogonal if (hkl) • (h’k’l’) = 0• Some planes may be equivalent because of
symmetry– In a cubic crystal, (100) (010) and (001) are
equivalent– They are the family of planes {100}
• [h00] is parallel to the a-axis, [0k0] // b-axis, [00l] // c-axis
• When analyzing XRD data, we look for trends corresponding to directionality in the crystal structure by analyzing the Miller indices of diffraction peaks.
Position [°2Theta] (Copper (Cu))
30 40 50 60 70
0
1 0
00
0 2 1
0 1
1 0
2
1 1
0
1 0
3
1 1
2
0 0
4
2 0
2
In this figure, the (002) and (004) peaks (which are parallel to each other) are much more intense than expected– this provides information about the microstructure of the sample
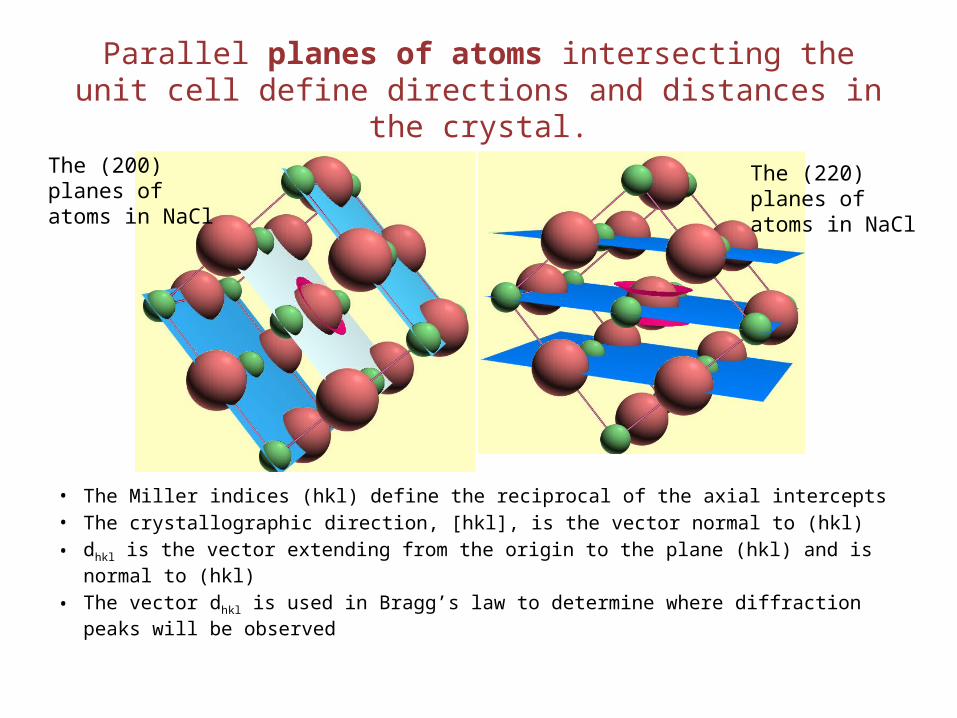
Parallel planes of atoms intersecting the unit cell define directions and distances in the crystal.
• The Miller indices (hkl) define the reciprocal of the axial intercepts• The crystallographic direction, [hkl], is the vector normal to (hkl)• dhkl is the vector extending from the origin to the plane (hkl) and is normal to (hkl)
• The vector dhkl is used in Bragg’s law to determine where diffraction peaks will be observed
The (200) planes of atoms in NaCl
The (220) planes of atoms in NaCl
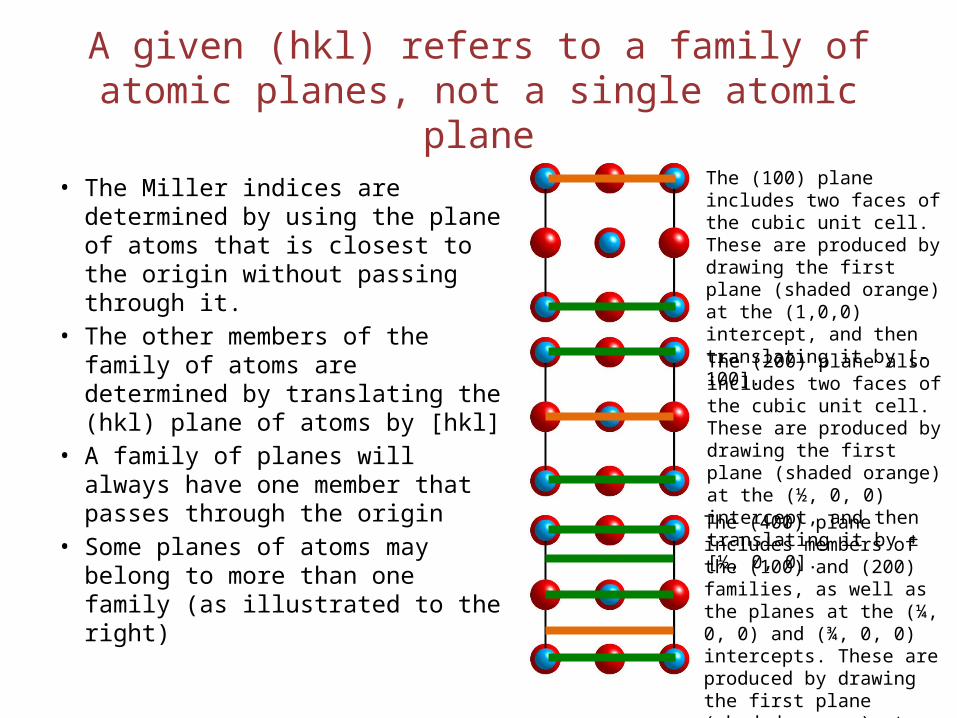
A given (hkl) refers to a family of atomic planes, not a single atomic plane
• The Miller indices are determined by using the plane of atoms that is closest to the origin without passing through it.
• The other members of the family of atoms are determined by translating the (hkl) plane of atoms by [hkl]
• A family of planes will always have one member that passes through the origin
• Some planes of atoms may belong to more than one family (as illustrated to the right)
The (100) plane includes two faces of the cubic unit cell. These are produced by drawing the first plane (shaded orange) at the (1,0,0) intercept, and then translating it by [-100].
The (200) plane also includes two faces of the cubic unit cell. These are produced by drawing the first plane (shaded orange) at the (½, 0, 0) intercept, and then translating it by ±[½, 0, 0].
The (400) plane includes members of the (100) and (200) families, as well as the planes at the (¼, 0, 0) and (¾, 0, 0) intercepts. These are produced by drawing the first plane (shaded orange) at the (¼, 0, 0) intercept, and then translating it by ±[n*¼, 0, 0].