scorpio spectrum monitoring system - mpssme.ae · tci’s scorpio development team dismissed all...
TRANSCRIPT
TCI’s Scorpio development team dismissed all preconceptions, and addressed the central question of “how should a spectrum monitoring system be designed?” The main criteria that emerged shaped Scorpio into a system that meets today’s spectrum monitoring requirements by offering:
❯ A single-DSP-based, custom-built server unit that includes all receivers and switches
❯ Control of one or more servers from one or more client computers
❯ Ability to work over unreliable and slow communication links
❯ Ease of use that ensures measurement results are independent of operator skill level
❯ Fully integrated, extensive Built-In-Self-Test (BIST) within the core design
❯ Automatic calibration of antenna and server components that require no external test equipment or operator intervention
❯ Single-unit antenna eliminates complex assembly for mobile operations
❯ GPS-based location, timing (frequency), and time standard
TCI Scorpio Windows®-based client software controls the TCI spectrum monitoring servers to which they are connected. The client application provides complete command and control of spectrum monitoring and direction finding (DF) operations and is fully compliant with the applicable ITU recommendations and the 2011 Spectrum Monitoring Handbook.
ScorPIo Spectrum Monitoring System
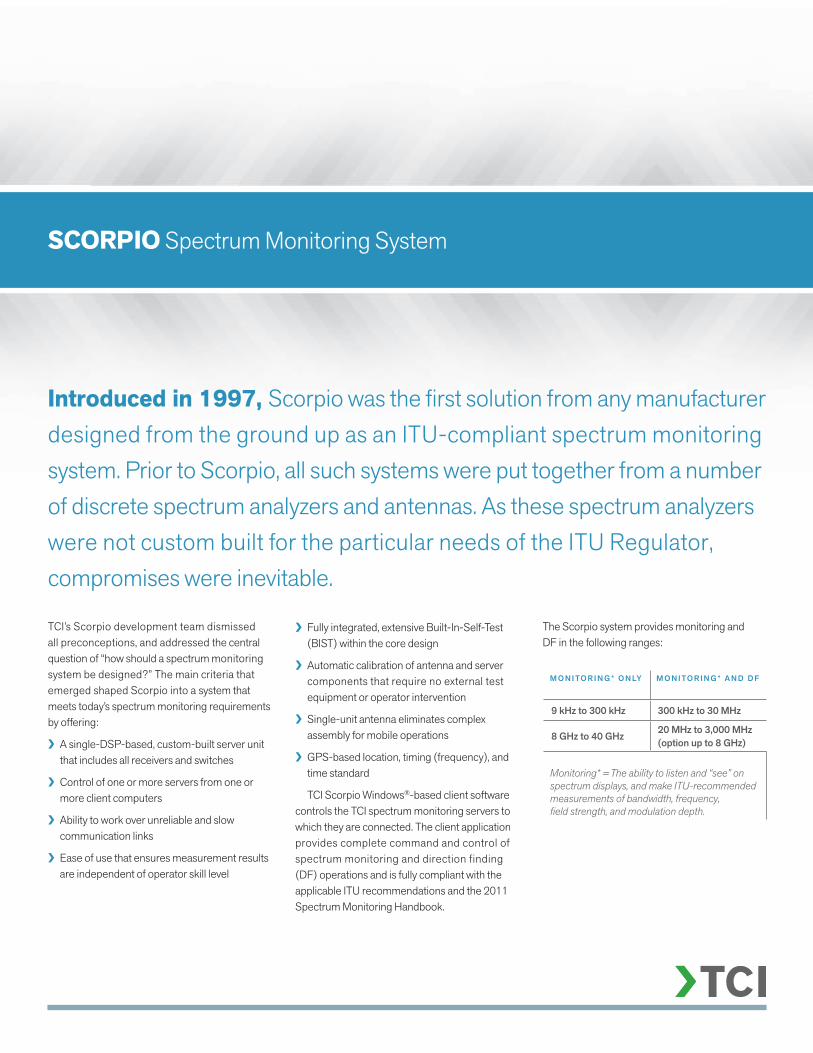
Introduced in 1997, Scorpio was the fi rst solution from any manufacturer designed from the ground up as an ITU-compliant spectrum monitoring system. Prior to Scorpio, all such systems were put together from a numberof discrete spectrum analyzers and antennas. As these spectrum analyzers were not custom built for the particular needs of the ITU Regulator, compromises were inevitable.
The Scorpio system provides monitoring and DF in the following ranges:
M O N I TO R I N G * O N LY M O N I TO R I N G * A N D D F
9 kHz to 300 kHz 300 kHz to 30 MHz
8 GHz to 40 GHz20 MHz to 3,000 MHz (option up to 8 GHz)
Monitoring* =The ability to listen and “see” on spectrum displays, and make ITU-recommended measurements of bandwidth, frequency, fi eld strength, and modulation depth.

ScorPIo Spectrum Monitoring Software
K e y f e at u r e S
❯ Integrated, ITU-compliant spectrum monitoring system covering the ranges:• 300 kHz to 30 MHz monitoring and DF (monitoring only from 9 kHz to 300 kHz)• 20 MHz to 3000 MHz monitoring and DF• 3000 MHz to 8000 MHz monitoring and DF (option to 20 to 3000 MHz system)
❯ 4 MHz Instantaneous Bandwidth (IBW) for high-density/high-power signal environments with optional 40 MHz wideband IBW receivers for fast spectrum scanning.
❯ Multichannel receiver design for high-speed DF and mitigation of the multichannel/multipath DF issues single-channel systems cannot resolve well.
❯ Intercepts, measures, and locates traditional signals and modern digital formats.
❯ Client-server architecture supports fl exible operating modes: local, remote, multiuser, and network operation.
❯ Client Graphical User Interface (GUI) is intuitive, easy to learn and based on task icons, toolbars, and point and click.
❯ Real-time signal display and simple single-button-click parameter measurement.
❯ Tasks scheduled to run on server, with results staying on the server until retrieved by the client, allowing client computers to be disconnected from the network or even shut down while the server runs the scheduled tasks.
❯ Remote audio capability; audio demodulated at the server location can be transferred to the client for listening and identifi cation.
❯ Client recording capability; remote audio can be recorded on the local client computer.
Supervise the spectrum with technology designed from the ground up for ITU compliance.
System Details ScorPIo
Full Compliance With ITU RecommendationsScorpio provides comprehensive spectrum monitoring and analysis that meets or exceeds all ITU recommendations for the measurement of frequency, fi eld strength, occupied bandwidth, modulation, direction finding, spectrum occupancy, and automatic violation detection.
User-Friendly SoftwareTCI’s Scorpio™ software incorporates a wide variety of powerful graphical displays with easy-to-use features, such as drop-down boxes and automatic default values (where appropriate) to enhance understanding and simplify operations. Scorpio software can be operated interactively, allowing the operator full control of the measurements and displays with instantaneous feedback, or in automatic scheduled mode without operator intervention. In scheduled (calendar) mode for unattended operation, Scorpio automatically initializes and starts operation when power is applied.
Lower Life-Cycle CostTCI’s more than 40 years of experience in designing, installing, and maintaining spectrum monitoring equipment has made TCI systems best-value solutions that offer the highest performance and reliability. Because TCI systems are field-repairable and self-calibrating, they do not require fi eld or factory calibration after repair or extended use. And TCI features such as Built-in Self Test (BIST) reduce the need for on-site maintenance, to achieve lower lifecycle ownership cost.
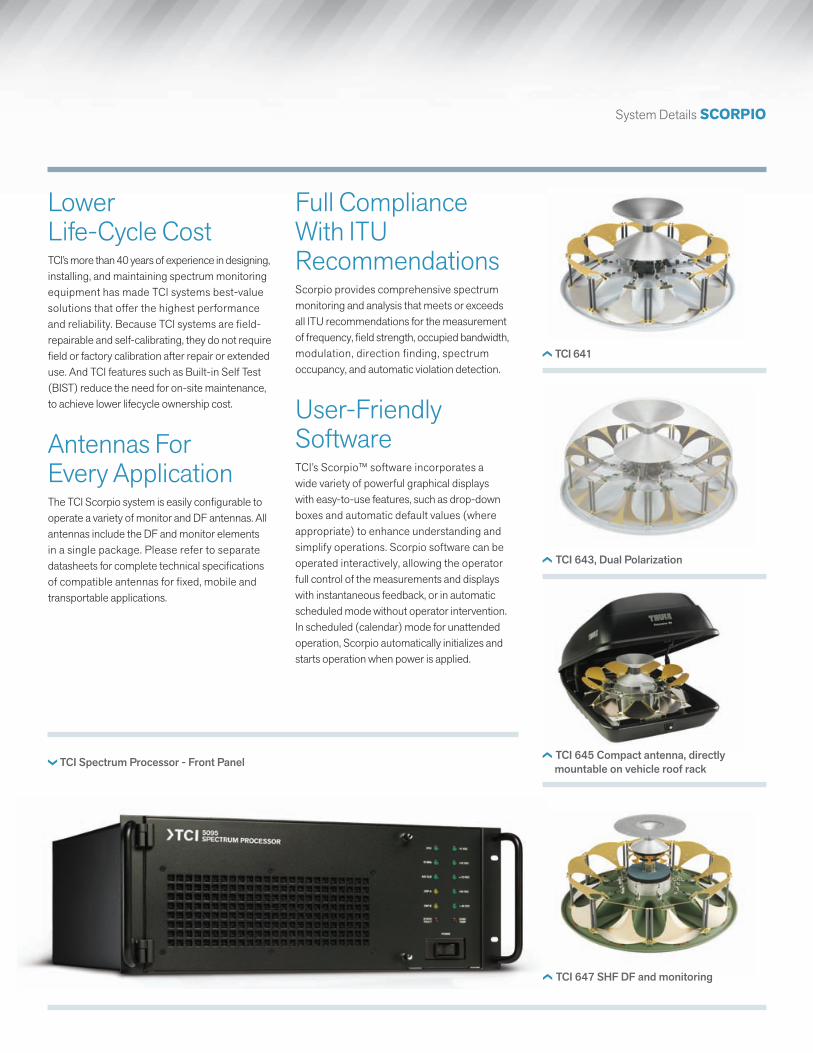
Antennas For Every ApplicationThe TCI Scorpio system is easily confi gurable to operate a variety of monitor and DF antennas. All antennas include the DF and monitor elements in a single package. Please refer to separate datasheets for complete technical specifi cations of compatible antennas for fixed, mobile and transportable applications.
TCI Spectrum Processor - Front Panel
TCI 641
TCI 643, Dual Polarization
TCI 645 Compact antenna, directly mountable on vehicle roof rack
TCI 647 SHF DF and monitoring
Scorpio System Details
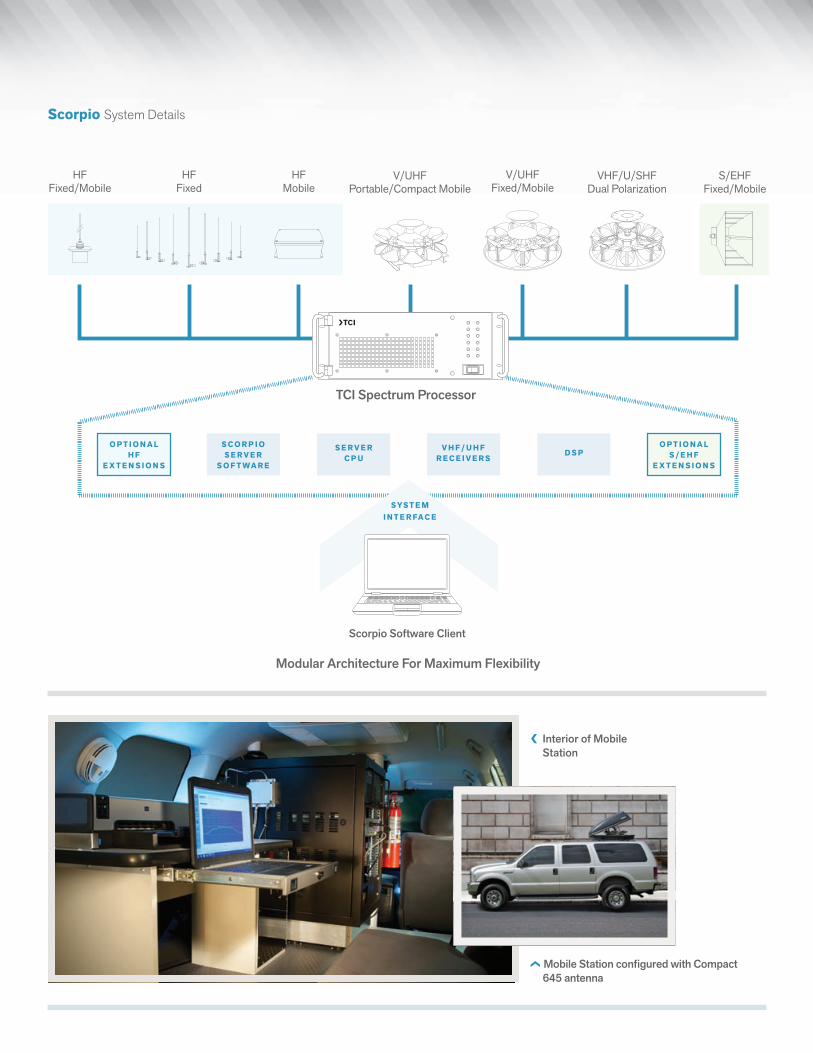
TCI Spectrum Processor
SySt e m I n t e r fac e
Scorpio Software Client
❮ Interior of Mobile Station
HFFixed/Mobile
HFFixed
HFMobile
V/UHFPortable/Compact Mobile
V/UHFFixed/Mobile
VHF/U/SHFDual Polarization
S/EHFFixed/Mobile
D S Pv h f / u h fr e c e I v e r S
S e r v e rc P u
S c o r P I oS e r v e r
S o f t wa r e
o Pt I o n a Lh f
e X t e n S I o n S
o Pt I o n a LS / e h f
e X t e n S I o n S
Mobile Station configured with Compact 645 antenna
Modular Architecture For Maximum Flexibility
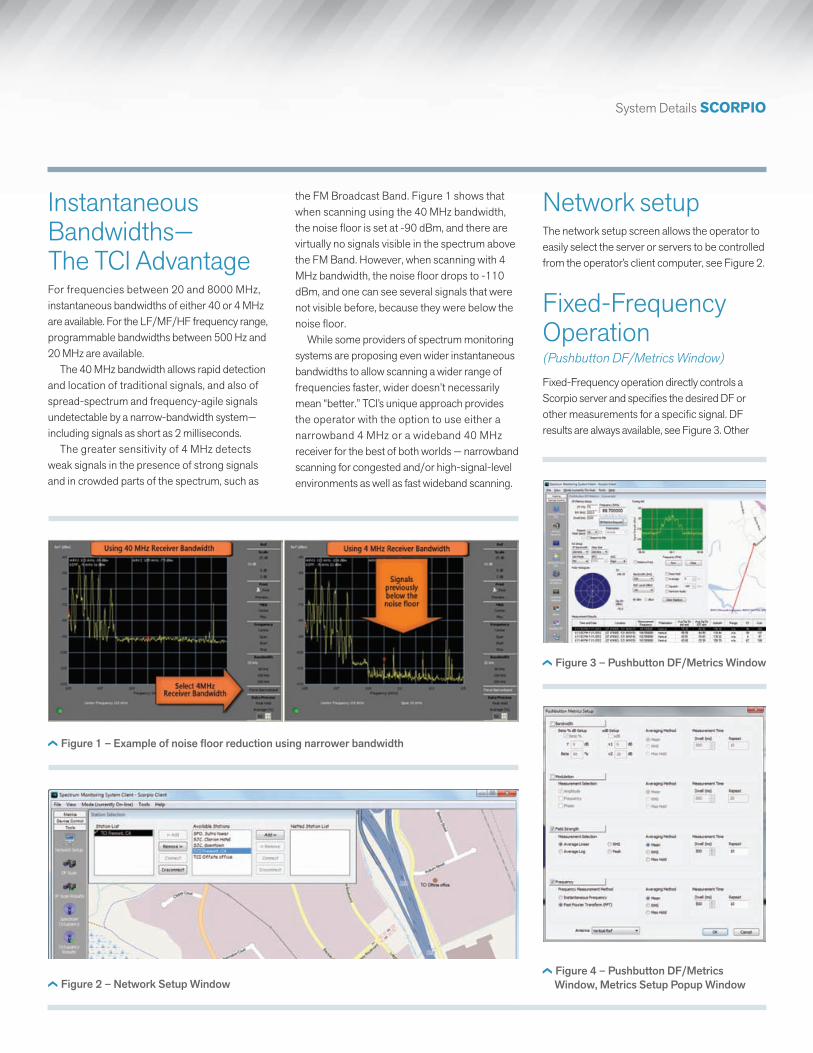
Network setupThe network setup screen allows the operator to easily select the server or servers to be controlled from the operator’s client computer, see Figure 2.
Fixed-Frequency Operation (Pushbutton DF/Metrics Window)
Fixed-Frequency operation directly controls a Scorpio server and specifies the desired DF or other measurements for a specific signal. DF results are always available, see Figure 3. Other
the FM Broadcast Band. Figure 1 shows that when scanning using the 40 MHz bandwidth, the noise floor is set at -90 dBm, and there are virtually no signals visible in the spectrum above the FM Band. However, when scanning with 4 MHz bandwidth, the noise floor drops to -110 dBm, and one can see several signals that were not visible before, because they were below the noise floor.
While some providers of spectrum monitoring systems are proposing even wider instantaneous bandwidths to allow scanning a wider range of frequencies faster, wider doesn’t necessarily mean “better.” TCI’s unique approach provides the operator with the option to use either a narrowband 4 MHz or a wideband 40 MHz receiver for the best of both worlds — narrowband scanning for congested and/or high-signal-level environments as well as fast wideband scanning.
Instantaneous Bandwidths—The TCI AdvantageFor frequencies between 20 and 8000 MHz, instantaneous bandwidths of either 40 or 4 MHz are available. For the LF/MF/HF frequency range, programmable bandwidths between 500 Hz and 20 MHz are available.
The 40 MHz bandwidth allows rapid detection and location of traditional signals, and also of spread-spectrum and frequency-agile signals undetectable by a narrow-bandwidth system—including signals as short as 2 milliseconds.
The greater sensitivity of 4 MHz detects weak signals in the presence of strong signals and in crowded parts of the spectrum, such as
System Details ScorPIo
Figure 1 – Example of noise floor reduction using narrower bandwidth
Figure 2 – Network Setup Window
Figure 3 – Pushbutton DF/Metrics Window
Figure 4 – Pushbutton DF/Metrics Window, Metrics Setup Popup Window
ScorPIo System Details
Automatic Frequency Scan and Scan from List FunctionsFor tasking windows that allow ranges of frequency, such as the AVD, DF Scan, and Spectrum Occupancy tasking windows, the operator defines scan parameters, such as: one or many F1-to-F2 frequency ranges, exclusion frequencies, step size, signal activity threshold, and DF and signal-measurement parameters. Alternatively, the operator can specify a set of discrete frequencies of interest for a scan-from-list task. For either the frequency scan or the scan-from-list functions, the server automatically performs the operator-specified activities and stores the results in the database , and are replicated to the operator’s client computer database when requested. The results may be displayed on the client computer and/or a report can be generated, if desired.
indicating signal strength of each measurement.The same DF results are also plotted on a
compass rose oriented with respect to the front of the vehicle, so the operator can quickly and easily see the signal’s direction relative to his vehicle, and direct the driver’s approach to the signal transmitter.
The location of the mobile unit itself is determined by the Scorpio system’s built-in GPS, and the orientation of the vehicle to north is determined using combined readings from an electronic fluxgate compass and the system GPS.
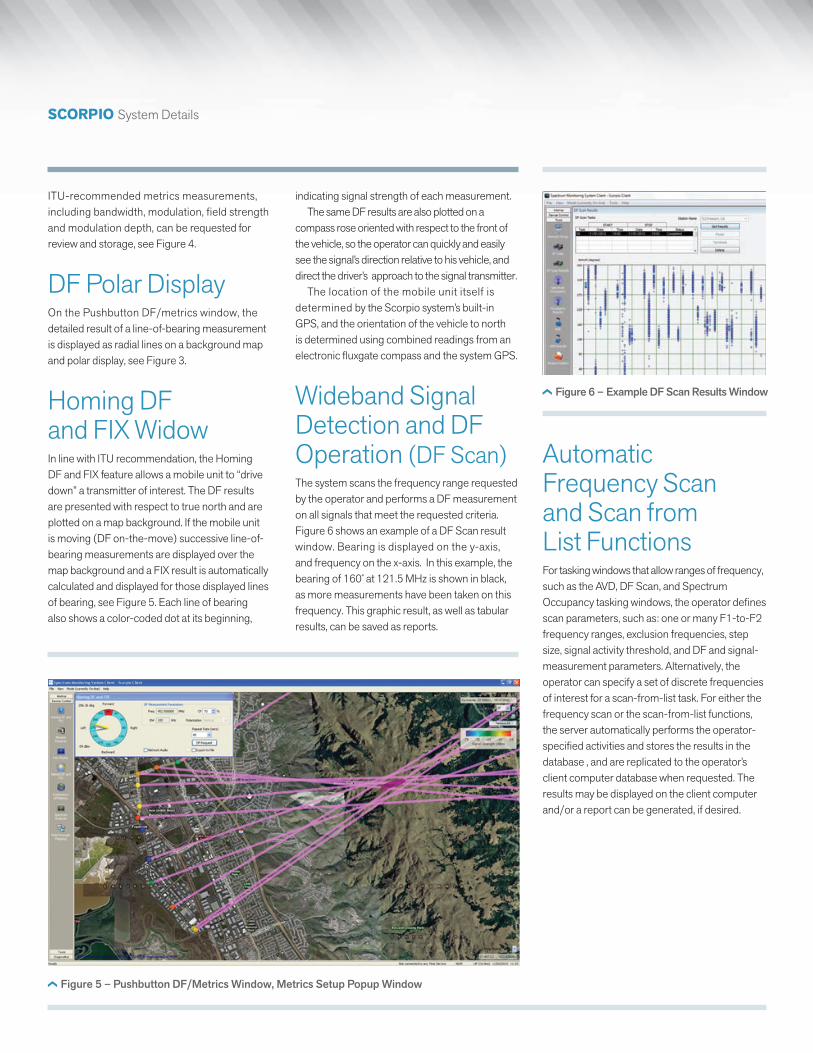
Wideband Signal Detection and DF Operation (DF Scan)The system scans the frequency range requested by the operator and performs a DF measurement on all signals that meet the requested criteria. Figure 6 shows an example of a DF Scan result window. Bearing is displayed on the y-axis, and frequency on the x-axis. In this example, the bearing of 160˚ at 121.5 MHz is shown in black, as more measurements have been taken on this frequency. This graphic result, as well as tabular results, can be saved as reports.
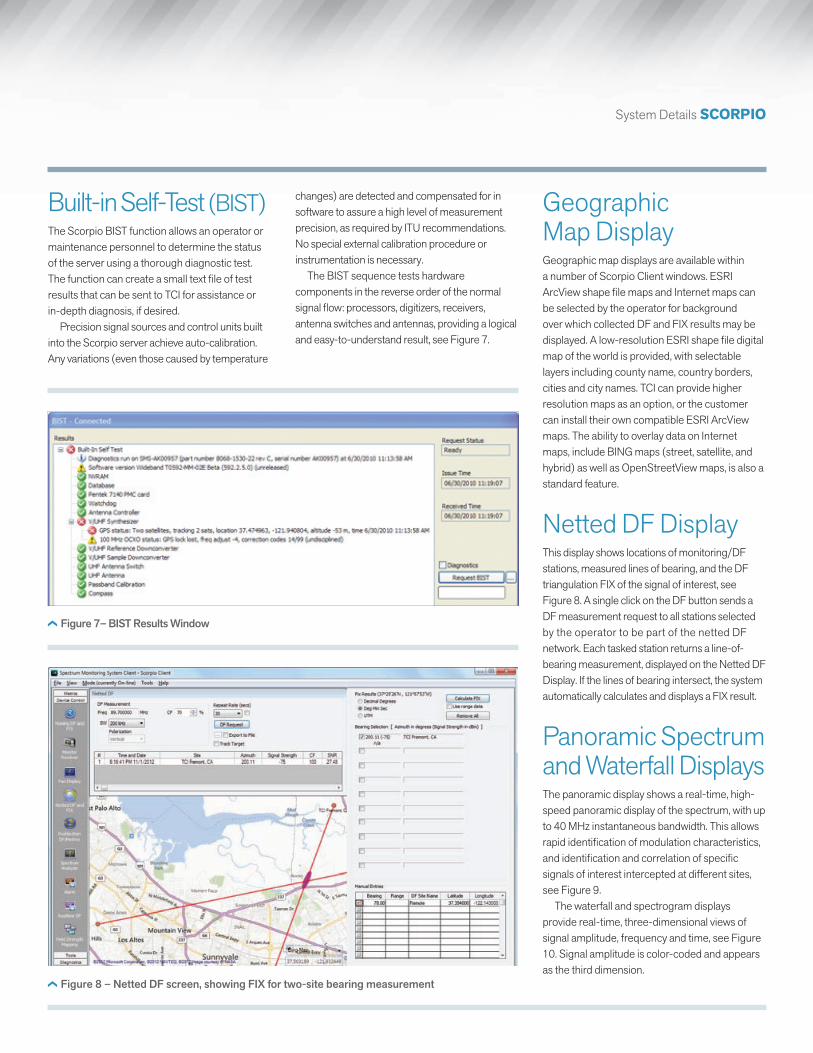
ITU-recommended metrics measurements, including bandwidth, modulation, field strength and modulation depth, can be requested for review and storage, see Figure 4.
DF Polar DisplayOn the Pushbutton DF/metrics window, the detailed result of a line-of-bearing measurement is displayed as radial lines on a background map and polar display, see Figure 3.
Homing DF and FIX WidowIn line with ITU recommendation, the Homing DF and FIX feature allows a mobile unit to “drive down” a transmitter of interest. The DF results are presented with respect to true north and are plotted on a map background. If the mobile unit is moving (DF on-the-move) successive line-of-bearing measurements are displayed over the map background and a FIX result is automatically calculated and displayed for those displayed lines of bearing, see Figure 5. Each line of bearing also shows a color-coded dot at its beginning,
Figure 5 – Pushbutton DF/Metrics Window, Metrics Setup Popup Window
Figure 6 – Example DF Scan Results Window
System Details ScorPIo
Geographic Map DisplayGeographic map displays are available within a number of Scorpio Client windows. ESRI ArcView shape file maps and Internet maps can be selected by the operator for background over which collected DF and FIX results may be displayed. A low-resolution ESRI shape file digital map of the world is provided, with selectable layers including county name, country borders, cities and city names. TCI can provide higher resolution maps as an option, or the customer can install their own compatible ESRI ArcView maps. The ability to overlay data on Internet maps, include BING maps (street, satellite, and hybrid) as well as OpenStreetView maps, is also a standard feature.
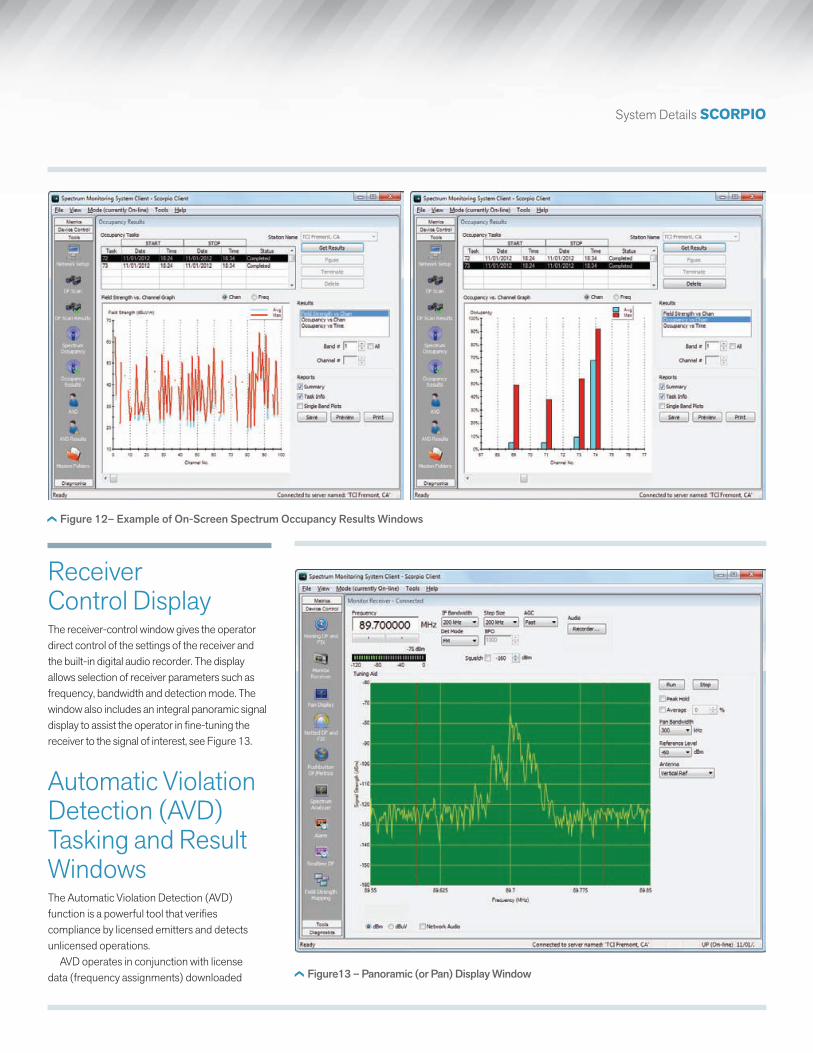
Netted DF DisplayThis display shows locations of monitoring/DF stations, measured lines of bearing, and the DF triangulation FIX of the signal of interest, see Figure 8. A single click on the DF button sends a DF measurement request to all stations selected by the operator to be part of the netted DF network. Each tasked station returns a line-of-bearing measurement, displayed on the Netted DF Display. If the lines of bearing intersect, the system automatically calculates and displays a FIX result.
Panoramic Spectrum and Waterfall DisplaysThe panoramic display shows a real-time, high-speed panoramic display of the spectrum, with up to 40 MHz instantaneous bandwidth. This allows rapid identification of modulation characteristics, and identification and correlation of specific signals of interest intercepted at different sites, see Figure 9.
The waterfall and spectrogram displays provide real-time, three-dimensional views of signal amplitude, frequency and time, see Figure 10. Signal amplitude is color-coded and appears as the third dimension.
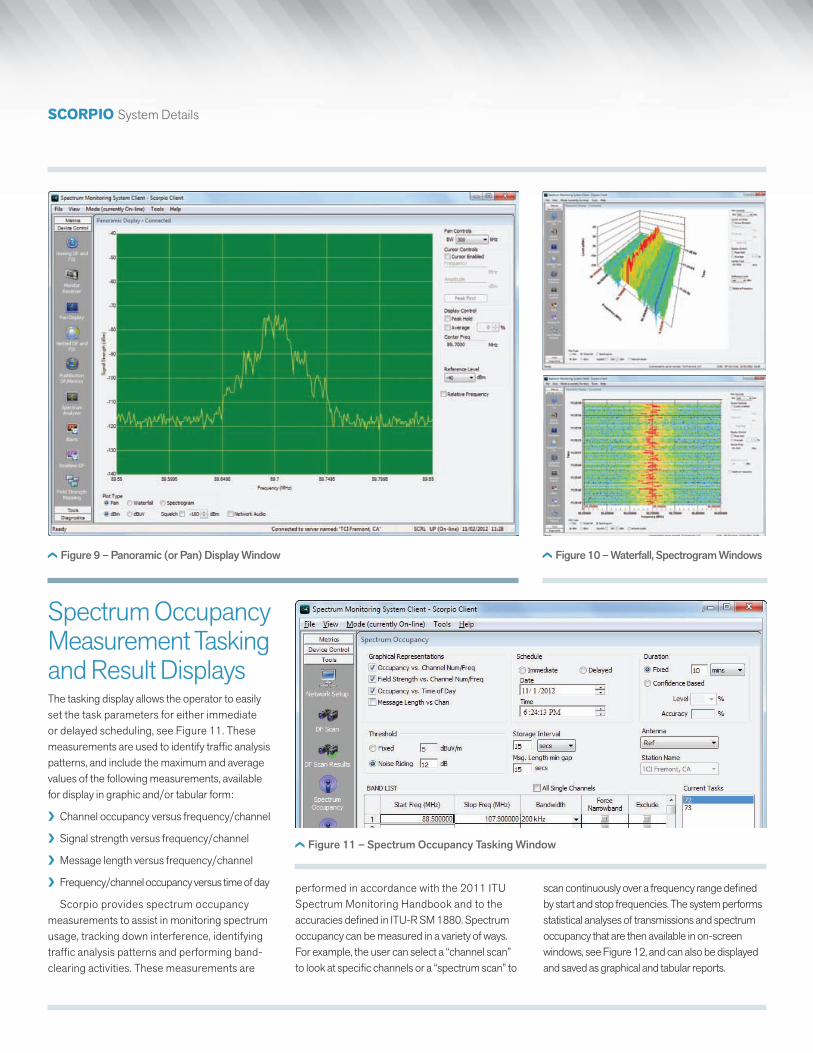
changes) are detected and compensated for in software to assure a high level of measurement precision, as required by ITU recommendations. No special external calibration procedure or instrumentation is necessary.
The BIST sequence tests hardware components in the reverse order of the normal signal flow: processors, digitizers, receivers, antenna switches and antennas, providing a logical and easy-to-understand result, see Figure 7.
Built-in Self-Test (BIST)The Scorpio BIST function allows an operator or maintenance personnel to determine the status of the server using a thorough diagnostic test. The function can create a small text file of test results that can be sent to TCI for assistance or in-depth diagnosis, if desired.
Precision signal sources and control units built into the Scorpio server achieve auto-calibration. Any variations (even those caused by temperature
Figure 7– BIST Results Window
Figure 8 – Netted DF screen, showing FIX for two-site bearing measurement
ScorPIo System Details
performed in accordance with the 2011 ITU Spectrum Monitoring Handbook and to the accuracies defined in ITU-R SM 1880. Spectrum occupancy can be measured in a variety of ways. For example, the user can select a “channel scan” to look at specific channels or a “spectrum scan” to
Spectrum Occupancy Measurement Tasking and Result DisplaysThe tasking display allows the operator to easily set the task parameters for either immediate or delayed scheduling, see Figure 11. These measurements are used to identify traffic analysis patterns, and include the maximum and average values of the following measurements, available for display in graphic and/or tabular form:
❯ Channel occupancy versus frequency/channel
❯ Signal strength versus frequency/channel
❯ Message length versus frequency/channel
❯ Frequency/channel occupancy versus time of day
Scorpio provides spectrum occupancy measurements to assist in monitoring spectrum usage, tracking down interference, identifying traffic analysis patterns and performing band-clearing activities. These measurements are
Figure 9 – Panoramic (or Pan) Display Window Figure 10 – Waterfall, Spectrogram Windows
Figure 11 – Spectrum Occupancy Tasking Window
scan continuously over a frequency range defined by start and stop frequencies. The system performs statistical analyses of transmissions and spectrum occupancy that are then available in on-screen windows, see Figure 12, and can also be displayed and saved as graphical and tabular reports.
System Details ScorPIo
Receiver Control DisplayThe receiver-control window gives the operator direct control of the settings of the receiver and the built-in digital audio recorder. The display allows selection of receiver parameters such as frequency, bandwidth and detection mode. The window also includes an integral panoramic signal display to assist the operator in fine-tuning the receiver to the signal of interest, see Figure 13.
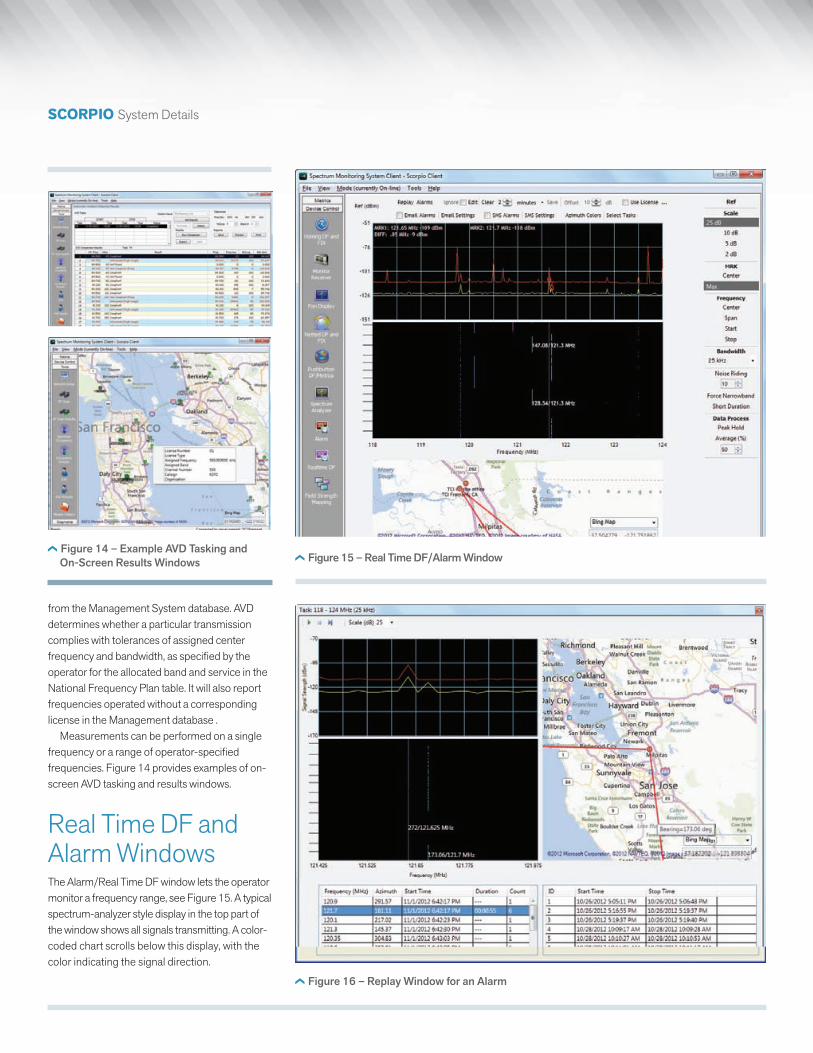
Automatic Violation Detection (AVD) Tasking and Result WindowsThe Automatic Violation Detection (AVD) function is a powerful tool that verifies compliance by licensed emitters and detects unlicensed operations.
AVD operates in conjunction with license data (frequency assignments) downloaded
Figure 12– Example of On-Screen Spectrum Occupancy Results Windows
Figure13 – Panoramic (or Pan) Display Window
ScorPIo System Details
from the Management System database. AVD determines whether a particular transmission complies with tolerances of assigned center frequency and bandwidth, as specified by the operator for the allocated band and service in the National Frequency Plan table. It will also report frequencies operated without a corresponding license in the Management database .
Measurements can be performed on a single frequency or a range of operator-specified frequencies. Figure 14 provides examples of on-screen AVD tasking and results windows.
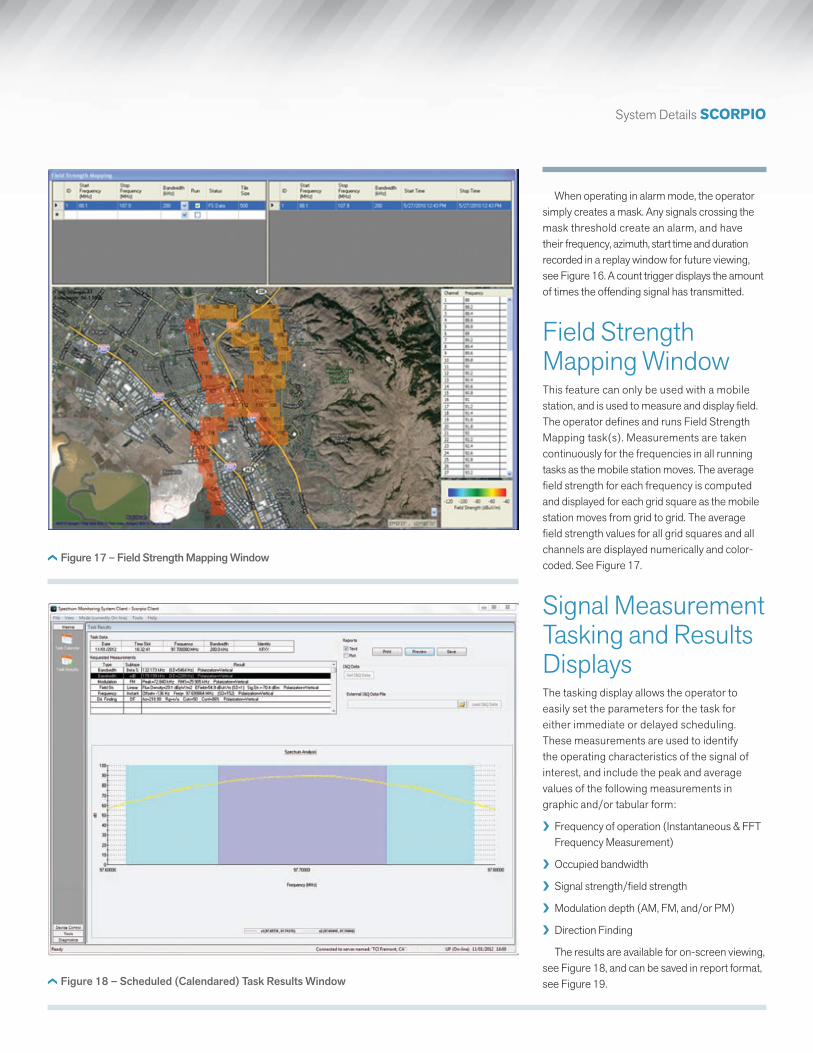
Real Time DF and Alarm WindowsThe Alarm/Real Time DF window lets the operator monitor a frequency range, see Figure 15. A typical spectrum-analyzer style display in the top part of the window shows all signals transmitting. A color-coded chart scrolls below this display, with the color indicating the signal direction.
Figure 14 – Example AVD Tasking and On-Screen Results Windows Figure 15 – Real Time DF/Alarm Window
Figure 16 – Replay Window for an Alarm
System Details ScorPIo
When operating in alarm mode, the operator simply creates a mask. Any signals crossing the mask threshold create an alarm, and have their frequency, azimuth, start time and duration recorded in a replay window for future viewing, see Figure 16. A count trigger displays the amount of times the offending signal has transmitted.
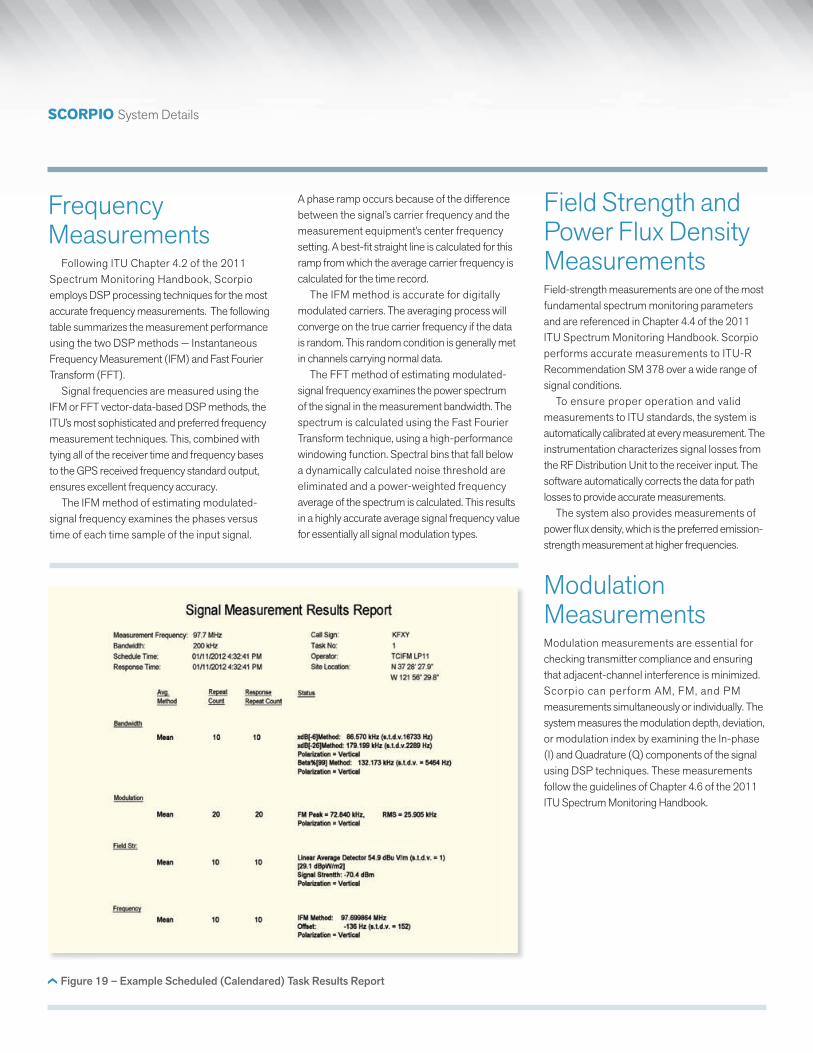
Field Strength Mapping WindowThis feature can only be used with a mobile station, and is used to measure and display field. The operator defines and runs Field Strength Mapping task(s). Measurements are taken continuously for the frequencies in all running tasks as the mobile station moves. The average field strength for each frequency is computed and displayed for each grid square as the mobile station moves from grid to grid. The average field strength values for all grid squares and all channels are displayed numerically and color-coded. See Figure 17.
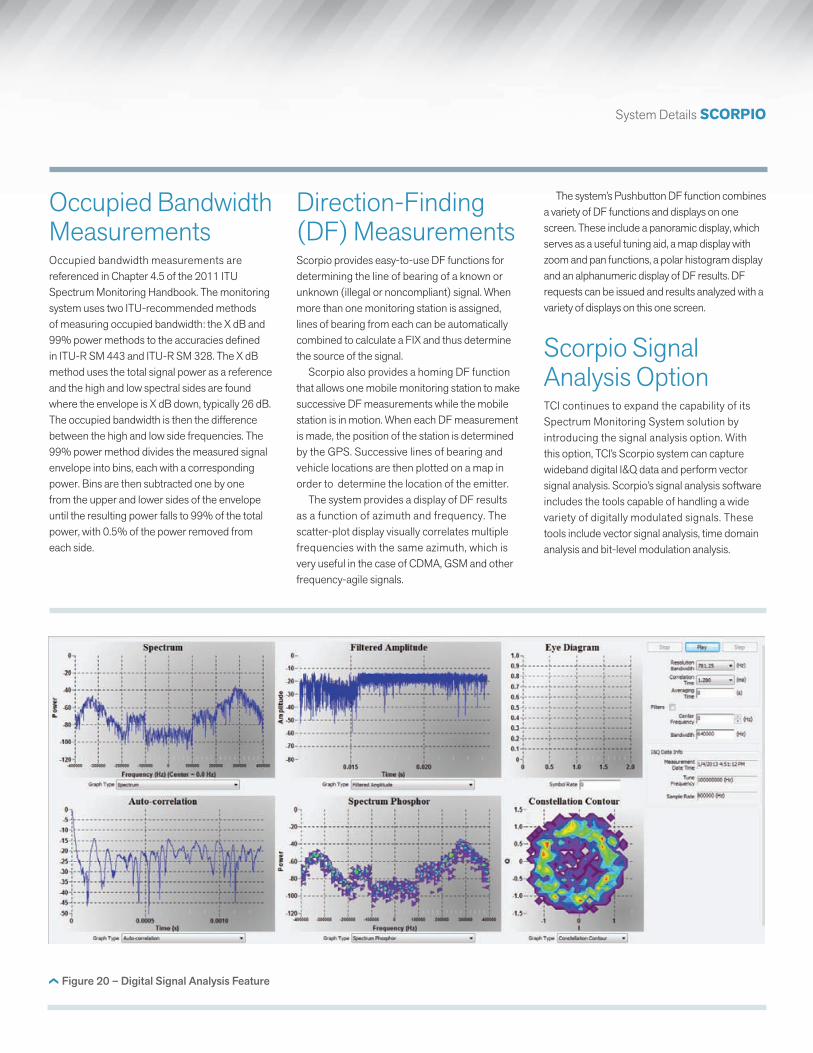
Signal Measurement Tasking and Results DisplaysThe tasking display allows the operator to easily set the parameters for the task for either immediate or delayed scheduling. These measurements are used to identify the operating characteristics of the signal of interest, and include the peak and average values of the following measurements in graphic and/or tabular form:
❯ Frequency of operation (Instantaneous & FFT Frequency Measurement)
❯ Occupied bandwidth
❯ Signal strength/field strength
❯ Modulation depth (AM, FM, and/or PM)
❯ Direction Finding
The results are available for on-screen viewing, see Figure 18, and can be saved in report format, see Figure 19.
Figure 17 – Field Strength Mapping Window
Figure 18 – Scheduled (Calendared) Task Results Window
ScorPIo System Details
Field Strength and Power Flux Density MeasurementsField-strength measurements are one of the most fundamental spectrum monitoring parameters and are referenced in Chapter 4.4 of the 2011 ITU Spectrum Monitoring Handbook. Scorpio performs accurate measurements to ITU-R Recommendation SM 378 over a wide range of signal conditions.
To ensure proper operation and valid measurements to ITU standards, the system is automatically calibrated at every measurement. The instrumentation characterizes signal losses from the RF Distribution Unit to the receiver input. The software automatically corrects the data for path losses to provide accurate measurements.
The system also provides measurements of power fl ux density, which is the preferred emission-strength measurement at higher frequencies.
Modulation MeasurementsModulation measurements are essential forchecking transmitter compliance and ensuring that adjacent-channel interference is minimized. Scorpio can perform AM, FM, and PM measurements simultaneously or individually. The system measures the modulation depth, deviation, or modulation index by examining the In-phase (I) and Quadrature (Q) components of the signal using DSP techniques. These measurements follow the guidelines of Chapter 4.6 of the 2011 ITU Spectrum Monitoring Handbook.
Frequency Measurements
Following ITU Chapter 4.2 of the 2011 Spectrum Monitoring Handbook, Scorpio employs DSP processing techniques for the most accurate frequency measurements. The following table summarizes the measurement performance using the two DSP methods — Instantaneous Frequency Measurement (IFM) and Fast Fourier Transform (FFT).
Signal frequencies are measured using the IFM or FFT vector-data-based DSP methods, the ITU’s most sophisticated and preferred frequency measurement techniques. This, combined with tying all of the receiver time and frequency bases to the GPS received frequency standard output, ensures excellent frequency accuracy.
The IFM method of estimating modulated-signal frequency examines the phases versus time of each time sample of the input signal.
Figure 19 – Example Scheduled (Calendared) Task Results Report
A phase ramp occurs because of the difference between the signal’s carrier frequency and the measurement equipment’s center frequency setting. A best-fi t straight line is calculated for this ramp from which the average carrier frequency is calculated for the time record.
The IFM method is accurate for digitally modulated carriers. The averaging process will converge on the true carrier frequency if the data is random. This random condition is generally met in channels carrying normal data.
The FFT method of estimating modulated-signal frequency examines the power spectrum of the signal in the measurement bandwidth. The spectrum is calculated using the Fast Fourier Transform technique, using a high-performance windowing function. Spectral bins that fall below a dynamically calculated noise threshold are eliminated and a power-weighted frequency average of the spectrum is calculated. This results in a highly accurate average signal frequency value for essentially all signal modulation types.
System Details ScorPIo
The system’s Pushbutton DF function combines a variety of DF functions and displays on one screen. These include a panoramic display, which serves as a useful tuning aid, a map display with zoom and pan functions, a polar histogram display and an alphanumeric display of DF results. DF requests can be issued and results analyzed with a variety of displays on this one screen.
Scorpio Signal Analysis OptionTCI continues to expand the capability of its Spectrum Monitoring System solution by introducing the signal analysis option. With this option, TCI’s Scorpio system can capture wideband digital I&Q data and perform vector signal analysis. Scorpio’s signal analysis software includes the tools capable of handling a wide variety of digitally modulated signals. These tools include vector signal analysis, time domain analysis and bit-level modulation analysis.
Direction-Finding (DF) MeasurementsScorpio provides easy-to-use DF functions for determining the line of bearing of a known or unknown (illegal or noncompliant) signal. When more than one monitoring station is assigned, lines of bearing from each can be automatically combined to calculate a FIX and thus determine the source of the signal.
Scorpio also provides a homing DF function that allows one mobile monitoring station to make successive DF measurements while the mobile station is in motion. When each DF measurement is made, the position of the station is determined by the GPS. Successive lines of bearing and vehicle locations are then plotted on a map in order to determine the location of the emitter.
The system provides a display of DF results as a function of azimuth and frequency. The scatter-plot display visually correlates multiple frequencies with the same azimuth, which is very useful in the case of CDMA, GSM and other frequency-agile signals.
Occupied Bandwidth MeasurementsOccupied bandwidth measurements are referenced in Chapter 4.5 of the 2011 ITU Spectrum Monitoring Handbook. The monitoring system uses two ITU-recommended methods of measuring occupied bandwidth: the X dB and 99% power methods to the accuracies defined in ITU-R SM 443 and ITU-R SM 328. The X dB method uses the total signal power as a reference and the high and low spectral sides are found where the envelope is X dB down, typically 26 dB. The occupied bandwidth is then the difference between the high and low side frequencies. The 99% power method divides the measured signal envelope into bins, each with a corresponding power. Bins are then subtracted one by one from the upper and lower sides of the envelope until the resulting power falls to 99% of the total power, with 0.5% of the power removed from each side.
Figure 20 – Digital Signal Analysis Feature
Scorpio System Details
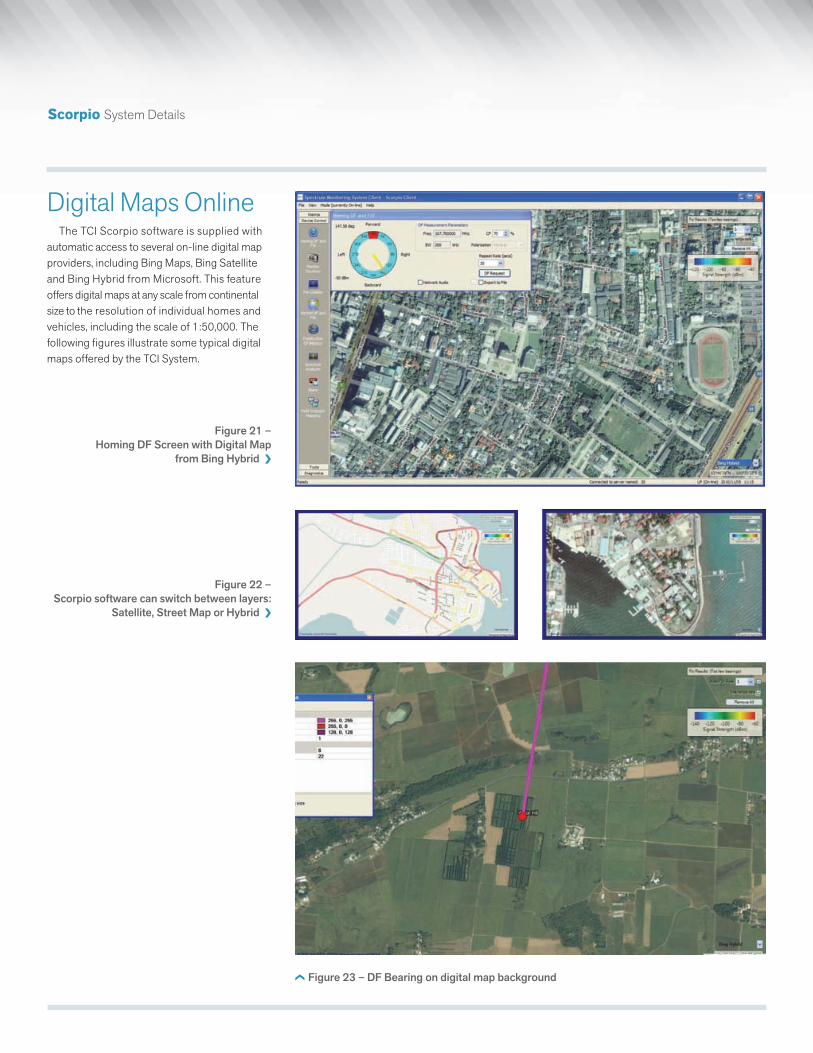
Digital Maps OnlineThe TCI Scorpio software is supplied with
automatic access to several on-line digital map providers, including Bing Maps, Bing Satellite and Bing Hybrid from Microsoft. This feature offers digital maps at any scale from continental size to the resolution of individual homes and vehicles, including the scale of 1:50,000. The following figures illustrate some typical digital maps offered by the TCI System.
Figure 21 – Homing DF Screen with Digital Map
from Bing Hybrid ❯
Figure 23 – DF Bearing on digital map background
Figure 22 – Scorpio software can switch between layers:
Satellite, Street Map or Hybrid ❯
System Details ScorPIo
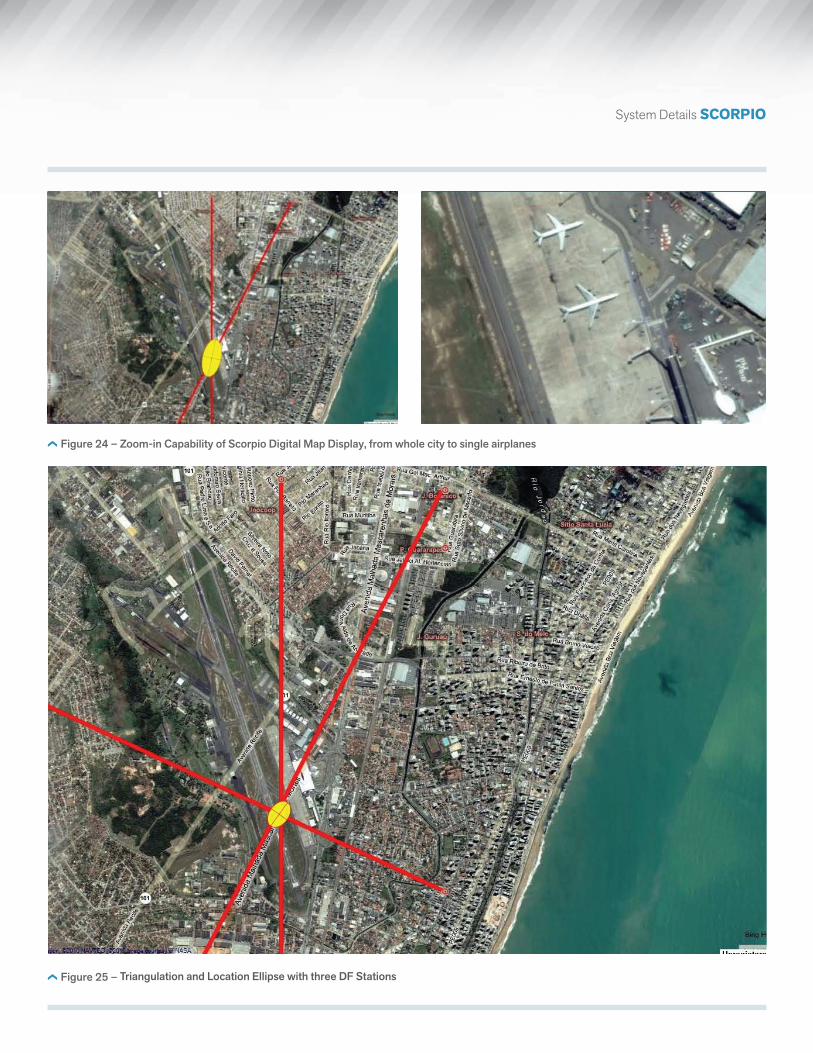
Figure 24 – Zoom-in Capability of Scorpio Digital Map Display, from whole city to single airplanes
Figure 25 – Triangulation and Location Ellipse with three DF Stations
T C I I N T E R N AT I O N A L , I N C .
3541 Gateway Blvd.
Fremont, CA 94538-6585 USA
TEL: 1-510-687-6100
USA: 1-800-824-8074
FAX: 1-510-687-6101
www.tcibr.com
Specialized Expertise in a Global Family
TCI International, Inc., a leading supplier of end-to-end, ITU-compliant RF spectrum
monitoring and management solutions, is a wholly-owned subsidiary of SPX Corporation.
Headquartered in Charlotte, North Carolina, SPX is a multi-industry, Fortune 500
enterprise with operations in more than 35 countries and approximately 18,000
associates worldwide. SPX team members collaborate across business segments and
borders to deliver greater effi ciencies and better ideas for helping customers succeed
and grow their businesses.
At TCI, this commitment to innovation serves civilian spectrum regulatory
departments and provides COMINT, ISR, and DF solutions for Military, National Security
and Intelligence agencies.
TCI has developed high-performance RF and spectrum monitoring solutions
for more than 40 years. Our complete, in-house hardware and software engineering
capabilities include RF/analog equipment design, system engineering and integration,
digital Signal Processing (DSP) design and implementation and expert client-server
software design and development.
An SPX Company
Company proprietaryData and specifi cations subject to change without notifi cationNot for distribution without prior permission from TCI. SCORPIO-01-08-13©2004-2013 TCI—All Rights Reserved