scm manual
DESCRIPTION
STRATEGIC COST MANAGEMENT.Improving Supply Chain - Competitiveness & Profitability in the 21st CenturyTRANSCRIPT

STRATEGIC COST MANAGEMENT
Improving Supply Chain Competitiveness & Profitability
in the 21st Century
Presented by
Anklesaria Group, Inc. 1172 Cuchara Drive
Del Mar, California 92014 Telephone: (858) 755-7119
Fax: (858) 755-2139 E-mail: [email protected]
Website: www.anklesaria.com
Copyright © 2001, Anklesaria Group, Inc. Del Mar, California

Part of this program is based on the book Zero Base Pricing™: Achieving World Class Competitiveness
Through Reduced All-in-Cost by
David N. Burt, Warren Norquist and Jimmy Anklesaria Byline Publishing
Zero Base Pricing™ is trademarked
by the Polaroid Corporation.
AIM & DRIVE is a registered servicemark by Jimmy Anklesaria
The material included in this Program Manual is copyrighted and may not be reproduced in whole or part
without the express written permission of Anklesaria Group, Inc., 1172 Cuchara Drive, Del Mar, California 92014.
Copyright © 2001, Anklesaria Group, Inc., Del Mar, California
All rights reserved
Code:010117

STRATEGIC COST MANAGEMENT TABLE OF CONTENTS
Page # The Anklesaria Group, Inc. Team 1 Firms That Have Participated in Anklesaria Group, Inc. Programs 3 Seminar Agenda and Objectives 4-5 Strategic Cost Management: The Concept 6-11 Cost and Price Management 12-42
Should Cost Models 16 Percentage of Sales Model 26 Price Discipline 30 Total Cost of Ownership Model 37
Implementing SCM 43-46 Exercises: 47-70 Case 1: Coating the Price 48 Case 2: Cable Connection 50 Case 3: Paying the Price 54 Case 4: Ace Incorporated 61 Case 5: The Collins Corporation 65 Optional Exercises: (Service Cases): 71-82 Case 1A: Price Maintenance 72 Case 3A: A Pricing Dilemma 74 Case 4A: A Temporary Solution 78 Appendix : 83-97 Appendix A: Economic Census 84 Appendix B: Pacific Bell Study - Overhead Rates 88 Appendix C: WageWeb Salary Data 89 Appendix D: Industry Financial Information 90 Appendix E: Producer Price Index 94 Appendix F: Bureau of Labor Statistics 96 Appendix G: Other Sources of data 99 Appendix H: International data sources 100 Appendix I: Present Value Interest Factor table 102

THE ANKLESARIA GROUP, INC. TEAM
JIMMY ANKLESARIA
Jimmy Anklesaria, F.C.A., LL.B. is the founder of Anklesaria Group, Inc. He is a Fellow Member of the Institute of Chartered Accountants, and holds a law degree and an M.B.A. Mr. Anklesaria is co-author of Zero Base Pricing™: Achieving World-Class Competitiveness Through Reduced All-In-Cost with David N. Burt and Warren E. Norquist. In January 1998 he founded Cost Management Solutions, LLC, which brings solutions to his various cost management programs through the use of sophisticated software. Mr. Anklesaria holds the international servicemark/patent for the AIM & DRIVE process. He has published several articles and cases in leading purchasing and financial journals and texts in the United States and abroad. One of America's most sought-after speakers on cost management, Mr. Anklesaria conducts seminars and workshops around the world. He has a unique ability to provide practical solutions to complex business problems. Mr. Anklesaria has been the keynote speaker for a number of organizations and companies. Mr. Anklesaria teaches a graduate level course in Strategic Cost Management at the University of San Diego, where he has been named Outstanding Professor of the Year. He is also a faculty member of the Certificate in International Business program in San Diego and is a guest lecturer at the University of Chicago, Graduate School of Business.
SANJIT MENEZES
Sanjit Menezes, CMA holds a Master of International Business degree from the University of San Diego. He is also a Certified Management Accountant. Mr. Menezes is currently the Anklesaria Group, Inc. Executive-in-Residence at the University of San Diego, where he teaches the undergraduate course in Strategic Cost Management/Contract Pricing. He was ranked among the top five instructors at the University of San Diego’s School of Business. Mr. Menezes has facilitated working sessions on cost management and conducted seminars for numerous firms around the world. He has developed a number case studies used to teach Strategic Cost Management and the AIM & DRIVE process. An enthusiastic and dynamic instructor, Mr. Menezes thinks quickly on his feet and has a natural ability to relate the material in the courses to real life situations. Mr. Menezes is currently responsible for the AGI Knowledge Center where he helps client companies bridge the knowing-doing gap. His expertise in "implementing" the Principles of Strategic Cost Management has saved clients millions of dollars.
PHIL KELLER
Phil Keller was with DuPont for 29 years and held positions in R&D, Sales, Marketing and for the past 20 years in many different line and management positions in procurement. His areas of expertise include Chemical raw materials, Specialty Chemicals, Capital Equipment and MRO supplies. Dr. Keller played a key role in developing DuPont's Strategic Sourcing Best Practice. He was instrumental in bringing both Strategic Cost Management and Managing the Cost of the Supply Chain

into DuPont. For the past 5 years he has facilitated Strategic Cost Management and mentored teams in applying cost management concepts. Dr. Keller's education includes a Bachelors degree and Ph.D in Chemistry from Temple University.
JOSEPH SANDOR
Joe Sandor, CPM, CPIM is one of America’s most respected Procurement visionaries. Prior to aligning with AGI, he was Chief Procurement Officer and Director of Corporate Purchasing and Logistics for the Sara Lee Corporation. Mr. Sandor currently is an adjunct professor of Supply Chain Management at the University of Chicago, Graduate School of Business. He brings over 24 years of Supply Management experience with Sara Lee, General Motors, NL Industries and Beatrice. Prior to joining Sara Lee, Mr. Sandor consulted for 3 years with companies such as, Sara Lee, RCA, Kraft, TRW, Hallmark Cards and others with emphasis on Materials Management strategy development. He holds an MBA from the University of Chicago, and is both a C.P.M. (Certified Purchasing Manager) and a CPIM (Certified in Production and Inventory Management).
M.P. “SID” SIDDHARTH
Sid Siddharth is an industrial marketing consultant specializing in competitive benchmarking, plant cost analysis, customer and supplier evaluations. He has a wide range of experience in the marketing consulting arena, including 10 years with Technomic Consultants, International. Providing in-depth analysis of supplier costs before a negotiation is one of his areas of expertise. He has consulted with several Fortune 500 firms in the areas of competitive cost analysis, new product introductions and acquisition/due diligence analyses. Mr. Siddharth has a Bachelor’s degree in Civil Engineering from Indian Institute of Technology, Madras, a Master’s in Civil Engineering from Vanderbilt University and an M.B.A. from Lehigh University.
JOHN STRIEBICH John Striebich has extensive knowledge and experience in corporate finance and accounting through his private and public sector work experience and academic preparation. He is an Adjunct Professor at Rochester Institute of Technology (R.I.T.) and the State University of New York at Geneseo, where he teaches courses in Finance and Economics. He has consulted with many small and medium-sized business in areas such as business plan development, venture capital acquisition and financial projections. Mr. Striebich holds an M.B.A. in Finance from R.I.T.

A partial list of firms that have participated in Anklesaria Group, Inc. programs
Abbot Laboratories Agilent Air Liquide Airborne Express Allen-Bradley Allied Signal Amana Electronics American Airlines American Express Amkor Electronics Amoco Chemicals Apple Computers Applied Materials Arizona Public Service ASM Int’l AVX Balzers Beitzell Bell Atlantic Bersdoff Extruders Bessin Corp. Bil Mar Foods Blackhawk Foundry Border States Burlington Air Exp. C-PAK Cadmus Capital One Financial Canon Casio Celestica Compact Industries Computer Task Group Conexant Chisso (Japan) Chevron Ciba-Geigy Conrail Columbia Gear Crenlo Cryovac Daichiyu Denshi Co. Dana Corporation Danzas Deco Tool Supply Deere & Co. Dewar Dewco Dexter Electronics DHL Dickey-John DISCO (Japan) Dow Chemical DNS DuPont EAC Plexus Eastman Chemical Eastman Kodak
Eaton Corp. Ebara Ecoplast Electrolux Emery Worldwide Faxon Federal Express FL Optics Flextronics Florida Power Fluor Daniel Fluorware FMC Corp. Ford Motor Co. Gem City General Dynamics General Electric Globe Machinery Grede Foundry Griffith Labs. GTI Hanover Direct Hamilton Standard Haraeus Harley Davidson Harris Corporation Hashimoto Hedwin Corp. Herman Miller Hewlett-Packard Hillshire Farm KLA-Tencor Kanto Hikari Photo Printing Hitachi Cable Hitachi Chemical Hoechst Celanese Honeywell, Inc. Reliant Energy IBM Iida Co. Ltd. Iomega Italtel Japan Energy Jimmy Dean Foods Kanto Japan Kelly Services KSK (Japan) Kuroda Electric Co. Kuwano (Japan) Kyocera Lam Research Litton Lockheed Lucent Maersk Manpower Matheson/Semi Gas
Maytag Mayville Engineering Medical Associates MEMC Menlo Logistics Mercury Aircraft Mercury Marine Mentor Graphics Mercedes-Benz Metalworks Incs. Metro Automation Millenium Petrochem. Milliken Mitsubishi Mitsui Metal Monona Tube Motorola Co. 3M N.A.P.M. Nalco Chemicals Nationway Transport NMC Nidec Nippon Nitto Novellus Nikon Norell Services NTK NSC Occidental Chemical Octel Network Ogilvy & Mather Oildyne Panalpina (Mexico) Parker Hannifin Partnership Works Philips Playtex Pratt & Whitney Praxair Probe Technologies PSEG Puget Plastics Qualcomm Quantum Rolls-Royce Rockwell Rohm Co., Ltd. Samsung Sandvik Sauer Sundstrand Sara Lee Schenker Eurocargo Scott Paper Sears Sequent Computer Sharp Corp.
Shell Oil Co. Shinetsu Shinkawa Shinko Shipley Signamax Signet Systems Soei (Japan) Solar Turbines Solectron Sony Corp. Southeast Freight SEH (America) Staples Star Manufacturing State of Illinois Steel Case Sumicarrier Sumitomo Chemical Superior Coffee TDK Takaki Tanaka Tandem Computers Teepak Tektronix Tennant Company Texas Instruments Tillotson Toppan (Japan) Tokyo Ohka Tokyo Seimitsu Tokyu Toshiba Triangle Plastics TRW UPS U.S. Marine Ushio UTC VDO Car Comm. VWR Waste Management Watanabe Watkins Johnson Co. Weber Seats Weyerhaeuser Wisconsin Label Xilinx Xyratex Yamadsa Yamashita Electric Yasuda Warehouse York International Young & Rubicam Z.F.Industries Zytec

Anklesaria Group, Inc. 2001
AGENDA
Day 1
u Introductionsu Strategic Cost Management: The Conceptu Anklesaria’s AIM & DRIVE® Process
Ø Case 1: Zero Base Pricing™
u Product Should Cost ModelsØ Case 2: Product Should Cost Model
u Service Should Cost ModelsØ Case 3: Service Should Cost Model
Anklesaria Group, Inc. 2001
AGENDA
Day 2u Cost Model: Percentage of Salesu Cost Model: Price Discipline™
Ø Case 4: Applying Price Discipline™
u Cost Model: Total Cost of Ownership (TCO)Ø Case 5: Applying TCO
u Profit Managementu Implementing SCM

Anklesaria Group, Inc. 2001
SEMINAR OBJECTIVES
u To gain a better knowledge of the cost structure of goods, equipment or services procured
u To differentiate between Zero Base Pricing™ and AIM & DRIVE®
u To distinguish between price and cost managementu To identify data sources and use market intelligence
in cost modelsu To use Price Discipline™ in long term contract
negotiationsu To apply the principles of TCO in sourcing decisions
Anklesaria Group, Inc. 2001
This slide is intentionally blank

STRATEGIC COST MANAGEMENT: THE CONCEPT

Anklesaria Group, Inc. 2001
It’s unwise to pay too much. But it’s worse to pay too little.
When you pay too much you lose a little money,that is all.
When you pay too little you sometimes lose everything, because the thing you bought was incapable of doing what it was bought to do.
The common law of business balance prohibits paying a little and getting a lot.
It can’t be done.
If you deal with the lowest bidder, it is well to add something for the risk you run.
And if you do that, you will have enough to pay for something better.
There is hardly anything in the world that someone can’t make a little worse and sell a little cheaper -- and people who consider price alone
are this man’s lawful prey.
John Ruskin(1819-1900)
Prices

Anklesaria Group, Inc. 2001
A HISTORICAL PERSPECTIVE
u The ‘50’s: Rebuilding the infrastructureu The ‘60’s: Decade of “catching up”u The ‘70’s: Emergence of global competitivenessu The ‘80’s: Quality, quality, qualityu The ‘90’s: Cost management & informationu 2000 & Beyond: Leveraging ideas over the
internet
Anklesaria Group, Inc. 2001
SUPPLY CHAIN COST FLOWA
cquisition Price
Conversion
GS&
A &
Profit
Revenue
Conversion
GS&
A &
Profit
Revenue
Acquisition P
rice
Acquisition P
rice
Supply Base Your Company
+ + = + + =
A1 A2 A3 A A B C X X
Cu
stomer
Drivers Drivers
$Money enters
the chain only once

Anklesaria Group, Inc. 2001
SELECTING YOUR STRATEGY
Time
Comparative
Costs $
This is where we generate real cost savings
•Jointly develop cost management strategies with suppliers (Cost Challenges)
•Execute strategies•Create knowledge base to leverage ideas
Breakthrough (AIM&DRIVE®)
•Leverage Volume•Price Analysis•Understand Costs•Price Discipline™
Negotiation (SCM)
Benchmark Competitor
Initial Cost Savings
Your Company
Anklesaria Group, Inc. 2001
USING COST DATA
Observations
Data
Understand the numbers
Manage Cost
Discussion
COST COOPERATION

Anklesaria Group, Inc. 2001
OVERCOMING BARRIERS TO COST SHARING
u Only request “relevant” datau Do not become an auditoru Sign a confidentiality agreement if
necessaryu Provide constructive feedbacku Communicate that cost knowledge is the
foundation for building a cost management strategy
Anklesaria Group, Inc. 2001
This slide is intentionally blank
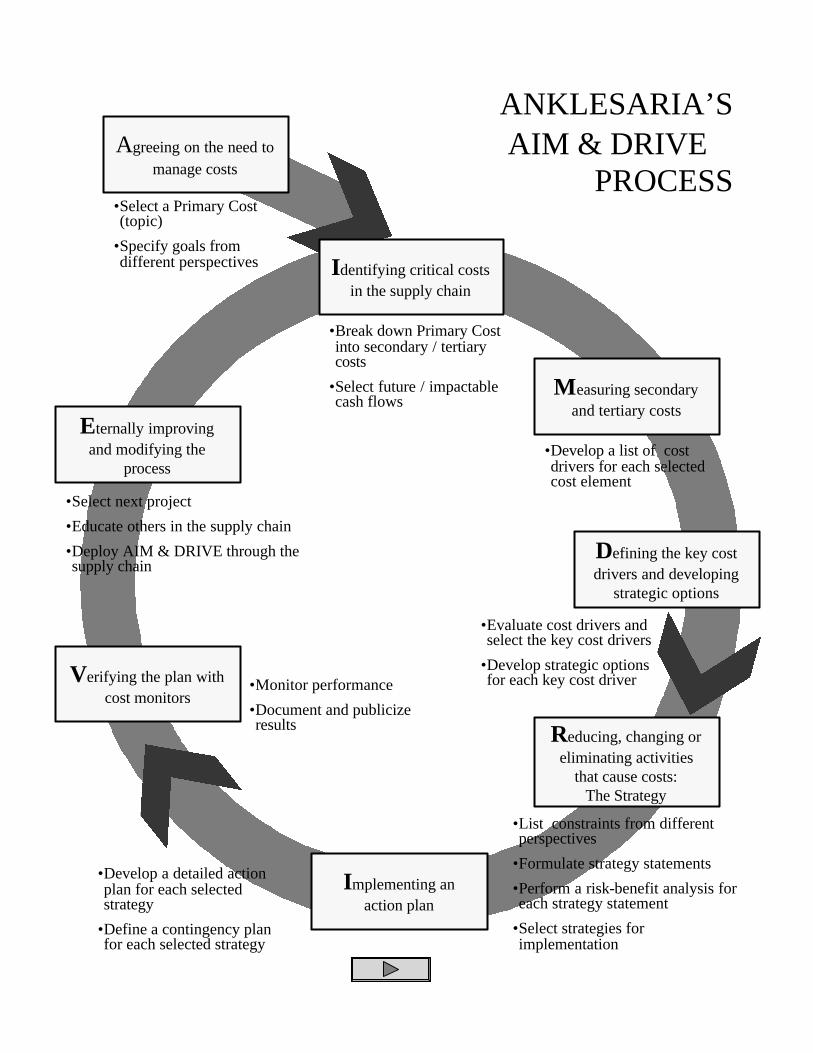
ANKLESARIA’S AIM & DRIVE
PROCESSAgreeing on the need to
manage costs
Implementing an action plan
Reducing, changing or eliminating activities
that cause costs:The Strategy
Defining the key cost drivers and developing
strategic options
Eternally improving and modifying the
process
Measuring secondary and tertiary costs
Identifying critical costs in the supply chain
Verifying the plan with cost monitors
•Select a Primary Cost (topic)
•Specify goals from different perspectives
•Break down Primary Cost into secondary / tertiary costs
•Select future / impactable cash flows
•Develop a list of cost drivers for each selected cost element
•Evaluate cost drivers and select the key cost drivers
•Develop strategic options for each key cost driver
•List constraints from different perspectives
•Formulate strategy statements
•Perform a risk-benefit analysis for each strategy statement
•Select strategies for implementation
•Develop a detailed action plan for each selected strategy
•Define a contingency plan for each selected strategy
•Monitor performance
•Document and publicize results
•Select next project
•Educate others in the supply chain
•Deploy AIM & DRIVE through the supply chain
PRICE AND COST MANAGEMENT

Anklesaria Group, Inc. 2001
PRICE ANALYSIS
u Evaluates and reviews only “bottom line” priceu Price analysis alone is useful when price is the
only variable that differentiates competing firmsu Can be used for standard products and servicesu Conducted through:
Ø Quote ComparisonsØ Internet cataloguesØ Historical Price ComparisonsØ Internet auction sitesØ Independent estimates
Anklesaria Group, Inc. 2001
COST ANALYSIS
u Initially evaluates each cost element that makes up the purchase price, including profit
u Later, extends to all other elements included in the “Total Cost of Ownership”
u Requires cost information from:Ø Supplier provided data (RFI/RFP/RFQ/survey)Ø Absolute Competitiveness Studies (benchmark
comparison)Ø Cost Models
u Can be used in single source or in competitive situations

Anklesaria Group, Inc. 2001
TYPES OF COST MODELS
uShould Cost ModelsØ Product Should CostØ Service Should Cost
uPercentage of Sales ModeluPrice Discipline™ Model
To evaluate Purchase Price:
*Note: The “Product Should Cost” approach was developed by Mark Cohen of Pacific Bell
To determine Life Cycle Costs:
uTotal Cost of Ownership Model
Anklesaria Group, Inc. 2001
THE POWER OF COST MODELS
u Educate the user in the cost structure of a product or service procured
u Engage a supplier that has not provided any cost information
u Ensure that cost discussions are based on facts and logic
u Build credibility and respect for well informed buyers

Anklesaria Group, Inc. 2001
SOME COST DEFINITIONS
Total of all cost elements
Profit before deduction of federal and state taxes
Costs incurred to keep the organization in operation (R&D, finance, procurement, mktg …)
Sub-total
Indirect costs associated with the conversion process (Depreciation, other plant costs, supervision, research support ...)
Product: Labor required to convert direct material into a finished product (production worker wages)
Service: Labor required to execute activities in the Statement of Work (SOW)
Bill of Materials (BOM)
Definition
PRICE=
Profit Before Tax+
Operating (GS&A)& Other Expenses
+
Cost of Goods Sold (COGS) or Cost of Sales (COS)
=
Manufacturing Overheador Service Overhead
+
Direct Labor+
Direct Material
Element
Anklesaria Group, Inc. 2001
AN INCOME STATEMENT APPROACH
NET PROFIT AFTER TAX=
TAXES (a percentage of Profit Before Tax)-
PROFIT BEFORE TAX=
OPERATING & OTHER EXPENSES-
GROSS PROFIT=
COST OF GOODS SOLD or COST OF SALES-
NET SALES (PRICE)
Element

Anklesaria Group, Inc. 2001
SHOULD COST MODEL
u Calculate a fair price for a product or service purchased
u Compare suppliers’ quotes to industry averages and to one another
u Extract cost information from suppliersu Identify key cost element/s for detailed
analysisu Estimate a target cost of a final product or
service
Application:
Anklesaria Group, Inc. 2001
SHOULD COST PHASES
u Development of a broad outline (framework)u Adjustments for:
a. Geographical locationb. Economic conditionsc. More current informationd. Other factors
u Use in negotiation

Anklesaria Group, Inc. 2001
PRODUCTSHOULD COST MODEL
Assumptions:
u Product purchased: Plastic housingu Supplier’s business: Fabricated Plastic Productsu Type of operation: Semi-automatedu Size of Supplier: $48 million in assets
Anklesaria Group, Inc. 2001
This slide is intentionally blank

Anklesaria Group, Inc. 2001
Step 1. Identification of product code and data sources:
BUILDING A PRODUCT SHOULD COST MODEL
Pacific Bell StudyData source for Overhead rates(See example on page 88 )
1.4
BOM, material or component suppliers, trade associations…
Data sources for Material costs1.2
US Census Bureau, Economic Census.
Data source for Labor costs(See example on page 85 )
1.3
RMA, Annual Statement Studies
Data source for financial ratios(See example on page 91 )
1.5
3089 / 308920Identify the SIC/NAICS code1.1
Step 2. Calculation of Direct Material (DM) costs:
= 5 * 2.00= $10.00
Calculate Direct Material costs2.3
$2.00 per lbObtain quotes on BOM elements2.2
5 lbs of resinBreak down the Bill of Materials (BOM)2.1
= 10.00 * 0.338= $3.38
Calculate Direct Labor costs(Direct Material * LM ratio)
3.2
= 8,951,204 / 26,503,716= 0.338
Using the Economic Census, Mfg. Series calculate the Labor/Material (LM) ratio(production worker wages / cost of materials, parts and containers consumed)
3.1
Step 3. Calculation of Direct Labor (DL) costs:

Anklesaria Group, Inc. 2001
Step 4. Calculation of Manufacturing Overhead (MOH):
Step 5. Calculation of Cost of Goods Sold (COGS) and Should Cost:
Step 6. Calculation of Operating & Other Expenses (O&O) and Profit:
PRODUCT SHOULD COST MODEL (CONTD)
= 4.2 / 100 * 25.39= $1.06
Calculate Profit Before Tax(PBT% * Should Cost)
6.2
= (18.1 + 1.7) / 100 * 25.39= $5.03
Calculate Operating & Other Expenses(O&O% * Should Cost)
6.1
= 19.30 / 0.76= $25.39
Estimate Should Cost(COGS$ / COGS%)
5.3
= 100.0 – 24.0= 76.0%
Using RMA, calculate COGS percentage(Net sales – Gross Profit)
5.2
= 10.00 + 3.38 + 5.92= $19.30
Calculate Cost of Goods Sold(DM + DL + MOH)
5.1
= 3.38 * 175= $5.92
Calculate MOH(Direct Labor * OH rate)
4.2
Plastic molding, semi-automatedaverage = 175%
Determine the applicable Overhead rate, based on type of operation and degree of automation
4.1

Anklesaria Group, Inc. 2001
PRODUCT SHOULD COST MODEL
SIC CODE 3089: MISC. PLASTIC PRODUCTS
BOM / quote from suppliers39.410.00Direct Material
100.025.39SHOULD COST
RMA, Annual Statement Studies4.21.06Profit Before Taxes
RMA, Annual Statement Studies19.85.03Operating & Other Exp.
RMA, Annual Statement Studies76.019.30Cost of Goods Sold
Pacific Bell Study23.35.92Manufacturing Overhead
Economic Census-Manufacturing Series13.33.38Direct Labor
Source%$Element
Anklesaria Group, Inc. 2001
PRODUCT SHOULD COST MODEL (ACTUAL)
BOM / quote from suppliers10.0010.00Direct Material
COGS $ / 0.7616.7425.39SHOULD COST
Should Cost * 0.0420.701.06Profit Before Taxes
Should Cost * 0.1983.325.03Operating & Other Exp.
Sub-total12.7219.30Cost of Goods Sold
Direct Labor * 32.045.92Manufacturing Overhead
Direct Labor / 50.683.38Direct Labor
SourceActualModelElement
A site visit indicated that the operation was fully automated. A fully automated machine was 5 time faster than a semi-automated one; actual OH was 300% of Direct Labor

Anklesaria Group, Inc. 2001
SERVICESHOULD COST MODEL
Assumptions:
u Service purchased: Design of mechanical toolu Supplier’s business: Engineering Servicesu Supplier location: Decatur, ILu Length of contract: 2 months
Anklesaria Group, Inc. 2001
This slide is intentionally blank

Anklesaria Group, Inc. 2001
Step 1. Identification of service code and data sources:
BUILDING A SERVICE SHOULD COST MODEL
Operations, HR departments of benchmark companies
Data sources for Statement of Work and bill-out ratio
1.4
IRS tables, Finance departmentData sources for corporate tax rate1.5
US Census Bureau, Economic Census, BLS Industry Occupation Matrix, Wageweb.com,
Data sources for Labor costs(See examples on pages 86, 57 & 89)
1.2
Dun & Bradstreet, Key Financial Norms and Ratios
Data sources for financial ratios(See example on page 92)
1.3
8711/541330Identify the SIC/NAICS code1.1

Anklesaria Group, Inc. 2001
SERVICE SHOULD COST MODEL (CONTD)
= 5.1 / (1 – 0.3)= 7.3%
Calculate Profit Before Tax %{PBT% = Net profit after tax% / (1 – tax rate)}
2.7
= 100 – (53.6 + 7.3)= 39.1%
Calculate O & O Expenses %{100 – (COS% + PBT%)}
2.8
= 53.6 – 32.2= 21.4%
Calculate Overhead %(COS% – DL%)
2.5
= 30%Using IRS tables, determine tax rate2.6
= 0.82 * 39.3= 32.2%
Calculate Direct Labor as a percentage of sales (DL% * Payroll%)
2.3
= 100- 46.4= 53.6%
Using D&B ratios, calculate Cost of Sales%(Net Sales% – Gross Profit%)
2.4
= 1,330,332 / 3,380,960= 39.3%
Using the Economic Census, Prof., Scientific and Tech. series, calculate Total Payroll as a percentage of sales(Annual Payroll / Total receipts)
2.2
= 82%
Using BLS IO matrix select Direct Labor items and determine Direct Labor $ as a percentage of Total Payroll
2.1
Step 2. Calculation of industry averages:
7.3Profit Before TaxE
100.0SHOULD COST (C+D+E)F
53.6Cost of Sales (A+B)C
39.1Operating & Other ExpensesD
21.4OverheadB
32.2Direct LaborA
Summary of industry averages (figures in %):

Anklesaria Group, Inc. 2001
Step 3. Calculation of Direct Labor Cost:
SERVICE SHOULD COST MODEL (CONTD)
Step 4. Calculation of Contract Price:
= 96,851 / 0.322= $300,779
Calculate contract price (CP)(Labor $ / Labor%)4.1
Step 5. Calculation of OH, COS, O&O and PBT Dollars:
= 300,779 * 0.073= $21,957
Calculate Profit Before Tax dollars(Contract price * PBT%)
5.4
= 300,779 * 0.391= $117,604
Calculate Operating & Other Exp. dollars(Contract Price * O&O%)
5.3
= 300,779 * 21.4= $64,367
Calculate Overhead dollars(Contract price * OH%)
5.2
= 300,779 * 0.536= $161,218
Calculate COS dollars(Contract price * COS%)
5.1
= 77,481 / 0.8= $96,851
Adjust Direct Labor cost for down-time (Direct Labor Cost / Billed time)3.4
80%, interview with ABC Co., T-Tech Inc.
Estimate percent of time billed out and document the source of this information
3.3
1 Supervisor @ $81,2755 engineers @ $64,1052 Technician @ $31,543Total = $464,886 / yearCost for 2 months:= 464,886 / 6= $77,481
Using data from Wageweb.com, calculate Direct Labor cost for contract term(salaries include Mean Avg. Max. Salary plus bonus)3.2
1 Supervisor5 Mechanical Engineers2 Technicians
Break down the Statement of Work and determine the labor requirements for the contract
3.1

Anklesaria Group, Inc. 2001
SERVICE SHOULD COST MODEL
SIC CODE 8711: Engineering Services
Labor $ / Labor %100.0300,779SHOULD COST
Dun & Bradstreet – Key Financial Ratios7.321,957Profit Before Taxes
Dun & Bradstreet – Key Financial Ratios39.1117,604Operating & Oth. Exp.
Dun & Bradstreet – Key Financial Ratios53.6161,218Cost of Sales
Cost of Sales - Labor21.464,367Overhead
Economic Census- Prof. Scientific, Tech Svcs – Geographic area series32.296,851Labor
Source%$Element
Anklesaria Group, Inc. 2001
SERVICE SHOULD COST MODEL (ACTUAL)
SIC CODE 8711: Engineering Services
Labor cost / 0.322343,748300,779SHOULD COST
Should cost * 0.07325,09421,957Profit Before Taxes
Should cost * 0.391134,405117,604Oper. & Other Exp.
Should Cost * 0.536184,249161,218Cost of Sales
Should cost * 0.21473,56264,367Overhead
96,851 * 0.8 / 0.7110,68796,851Labor
DetailsActualModelElement
Supplier indicated that engineers were billed out approximately 70% of the time

Anklesaria Group, Inc. 2001
PERCENTAGE OF SALES MODEL
Application:
u To understand the break-down of a supplier’s price, even when the price appears fair and reasonable
u To develop Price Discipline™ models in order to evaluate price-change requests over a period of time
u To engage a supplier that has not provided any cost information in a discussion on cost
Anklesaria Group, Inc. 2001
PERCENTAGE OF SALES MODEL
Assumptions:
u Product Purchased: Printed Materialu Supplier’s business: Commercial Printing,
Lithographicu Size of supplier: $30 million in salesu Supplier’s quote: $250 per 100 copies

Anklesaria Group, Inc. 2001
Step 1. Identification of product code and data sources:
Step 2. Calculation of Direct Material (DM) Cost:
Step 3. Calculation of Direct Labor (DL) Cost:
BUILDING A PERCENTAGE OF SALES MODEL
US Census Bureau, Economic Census, Manufacturing Series
Data source for Material costs(See example on page 87)
1.2
Economic Census, Manufacturing SeriesData source for Labor costs1.3
RMA, Annual Statement Studies
Data source for financial ratios(See example on page 93)
1.4
2752 / 323110Identify the SIC/NAICS code1.1
= 250.00 * 0.346= $86.50
Calculate Material costs(Material% * 250)
2.2
= 16,660,337 / (45,392,837+ 2,704,062)= 34.6%
Using the Economic Census, Mfg. Series, calculate Material as a % of Sales(Cost of material parts, containers etc. / {Primary products value of shipments + Secondary products value of shipments})
2.1
=250.00 * 0.18= $45.00
Calculate Direct Labor costs(Labor% * 250)
3.2
= 8,631,629 / (45,392,837+ 2,704,062)= 18.0%
Using the Economic Census, Mfg. Series calculate the Labor as a % of Sales(Production worker wages / {Primary products value of shipments + Secondary products value of shipments})
3.1

Anklesaria Group, Inc. 2001
Step 4. Calculation of COGS, O&O Expenses and Profit dollars:
Step 5. Calculation of Manufacturing Overhead (MOH) dollars:
PERCENTAGE OF SALES MODEL (CONTD)
= 250 * 0.043= $10.75
Calculate Profit Before Tax $(250 * PBT%)
4.5
= 4.3%Using RMA, determine Profit Before Tax%
4.4
= 250 * 0.214= $53.50
Calculate Operating & Other Exp. $(250 * O&O%)
4.3
= 19.4 + 2.0= 21.4%
Using RMA, determine Operating & Other Exp.% (Operating Exp. + Other Exp.)
4.2
= 100.0 – 25.7= 74.3%
Using RMA, calculate COGS%(COGS% = Net Sales% – Gross Profit%)
4.1
= 250 * 0.217= $54.25
Calculate Manufacturing Overhead $(250 * MOH%)
5.2
= 74.3 – {34.6 + 18.0}= 21.7%
Determine MOH as a % of Sales(MOH% = COGS% – {DM% + DL%})
5.1

Anklesaria Group, Inc. 2001
PERCENTAGE OF SALES MODELSIC Code 2752: Commercial Printing, Lithographic
Economic Census –Manufacturing series34.686.50Direct Material
100.0250.00SHOULD COST
RMA, Annual Statement Studies4.310.75Profit Before Taxes
RMA, Annual Statement Studies21.453.50Operating & Oth. Exp.
RMA, Annual Statement Studies74.3185.75Cost of Goods Sold
COGS – (DM = DL)21.754.25Manufacturing Overhead
Economic Census-Manufacturing Series18.045.00Direct Labor
Source%$Element
Anklesaria Group, Inc. 2001
This slide is intentionally blank

Anklesaria Group, Inc. 2001
PRICE DISCIPLINE MODEL
u Determines the reasonableness of a suppliers request for a change in price
u Uses a previous year’s price as a baseu Sets the structure for all future
discussions on priceu Useful in setting up LTA’s
Price Discipline™ involves an understanding that the various elements of cost are NOT directly correlated
Anklesaria Group, Inc. 2001
APPLYING PRICE DISCIPLINE™
ØFixed OH – Volume, inflation
ØVariable OH – InflationOverhead
ØRisk
ØValue added
ØWage rates
ØProductivity
ØMarket priceØTake Down Rate
ØVolume
Profit
ØSkill levels
ØSkill MixLabor
ØStability of ordersØMaterial yields
ØExchange ratesMaterial
SAMPLE FACTORSCOST
Make a list of the factors that impact each cost element, quantify the impact of each factor and adjust respective cost elements

Anklesaria Group, Inc. 2001
Step 2. Adjustment of Material Costs:
Step 1. Comparison of quotes
PRICE DISCIPLINE MODEL
See Percentage of Sales model
Build a Percentage of Sales model for the base year price
1.3
15,00024501
10,00025000
Vol..PriceYr
Compare current quote with base year quote1.2
2000Select a base year1.1
Take-down rates, Bench-marking studies
Supplier Competitive-ness
Quality auditsProductivity
PPIPrice
Track Mech.FactorList the factors that have impacted material costs over the given period and identify tracking mechanisms/indices to evaluate changes in each factor(see page 95)
2.3
Interviews with D Co., A Inc.Document all sources of information2.2
1.00Total
0.09Miscellaneous supplies4.
0.062893-23234Lithographic and offset ink (sheet)3.
0.152796-231Plates2.
0.702621-4Book paper, uncoated free sheet1.
WeightSIC CodeElement#
Break down the BOM into major elements, identify industry codes and assign weights for each. (For services, break down the SOW into activities, identify skill level requirements and assign weights based on time for each activity)
2.1
Anklesaria Group, Inc. 2001
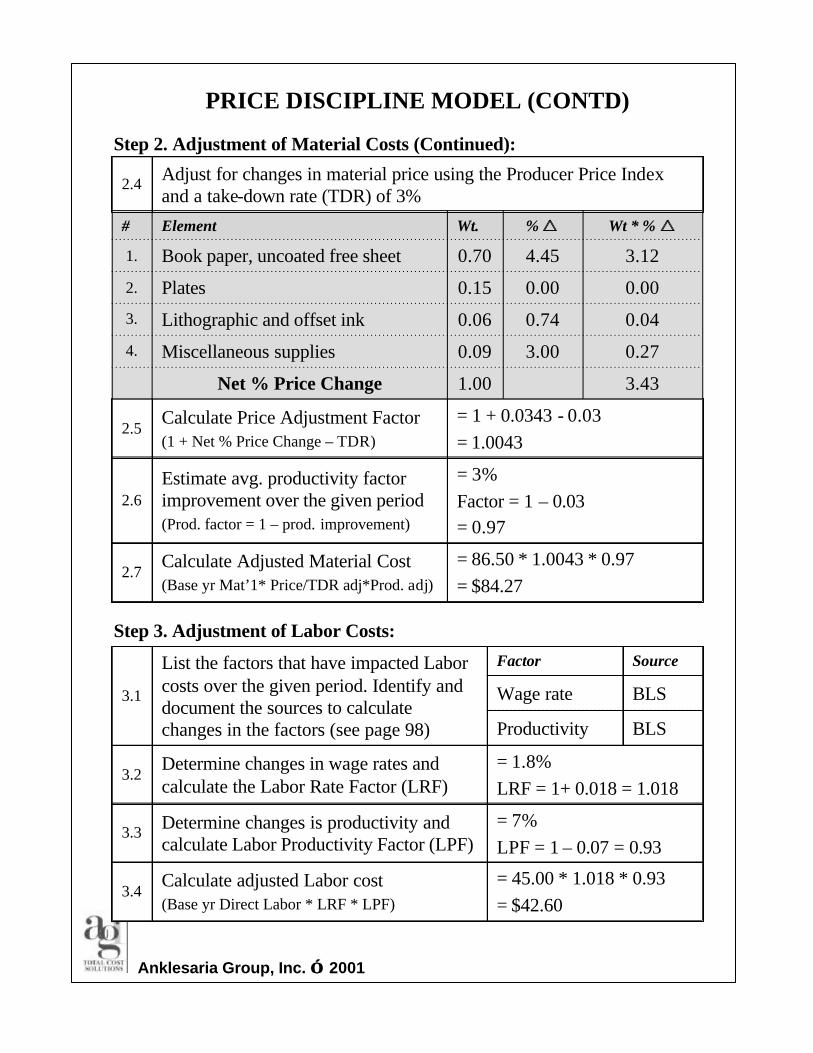
Step 2. Adjustment of Material Costs (Continued):
PRICE DISCIPLINE MODEL (CONTD)
= 86.50 * 1.0043 * 0.97= $84.27
Calculate Adjusted Material Cost(Base yr Mat’1* Price/TDR adj*Prod. adj)
2.7
= 3%Factor = 1 – 0.03= 0.97
Estimate avg. productivity factor improvement over the given period(Prod. factor = 1 – prod. improvement)
2.6
= 1 + 0.0343 - 0.03= 1.0043
Calculate Price Adjustment Factor(1 + Net % Price Change – TDR)
2.5
3.431.00Net % Price Change
0.273.000.09Miscellaneous supplies4.
0.040.740.06Lithographic and offset ink 3.
0.000.000.15Plates2.
3.124.450.70Book paper, uncoated free sheet1.
Wt * % rr% rrWt.Element#
Adjust for changes in material price using the Producer Price Index and a take-down rate (TDR) of 3%
2.4
Step 3. Adjustment of Labor Costs:
= 45.00 * 1.018 * 0.93= $42.60
Calculate adjusted Labor cost(Base yr Direct Labor * LRF * LPF)
3.4
= 7%LPF = 1 – 0.07 = 0.93
Determine changes is productivity and calculate Labor Productivity Factor (LPF)
3.3
= 1.8%LRF = 1+ 0.018 = 1.018
Determine changes in wage rates and calculate the Labor Rate Factor (LRF)
3.2
BLSProductivity
BLSWage rate
SourceFactorList the factors that have impacted Labor costs over the given period. Identify and document the sources to calculate changes in the factors (see page 98)
3.1

Anklesaria Group, Inc. 2001
Step 4. Adjustment of Manufacturing OH and Operating & Other Exp:
54.25
11.1810.85
43.40
(1.03)1
(1.03)1 29.80
1
10/15
Fixed 80%
Variable 20%
Base Yr OH
Adjusted Factory OH =
No volume adj
Volume (BV/CV)*Inflation adj.
Inflation adj
* * =
* * =
+
40.98* BV = Base Volume
CV = Current Volume
Manufacturing OH Adjustment
53.50
5.515.35
48.15
(1.03)1
(1.03)1 33.06
1
10/15
Fixed 90%
Variable 10%
Base Yr OH
Adjusted O & O Exp. =
No volume adj
Volume (BV/CV)*Inflation adj.
Inflation adj
* * =
* * =
+
38.57* BV = Base Volume
CV = Current Volume
Operating & Other Exp. Adjustment
PRICE DISCIPLINE MODEL (CONTD)
Adjust MOH and O&O Expenses as shown below4.3
= 3%Determine inflation rate for OH4.2
MOH = 80% F; 20% VO&O = 90 F; 10% VThis is a rule of thumb for Product Overhead
Determine the mix between Fixed and Variable OH for both Manufacturing Overhead and Operating & Other Expenses
4.1

Anklesaria Group, Inc. 2001
PRICE DISCIPLINE™
SIC Code 2752: Commercial Printing, LithographicSummary
Adjusted for price and productivity changes, and TDR 84.2786.50Direct Material
217.17250.00SHOULD COST
Profit $ kept constant10.7510.75Profit Before Taxes
Adjusted for inflation, Fixed OH for volume38.5753.50Operating & Oth. Exp.
167.85185.75Cost of Goods Sold
Adjusted for inflation, Fixed OH for volume40.9854.25Manufacturing OH
Adjusted for changes in wage rates and productivity42.6045.00Direct Labor
Source20012000Element
Anklesaria Group, Inc. 2001
BUILDING COST MODELS QUICKLY WITH
u Makes life easier for the procurement professionalu Provides a cost breakdown for any product or service in
minutes u Designed in Excel with user-friendly interface (buttons, pop-
up windows, menus, etc.)u Preloaded with:Ø SIC and NAICS codesØ Economic Census DataØ Industry Financial Ratios
u Direct hyperlinks to free web sites where buyers can retrieve relevant company-specific and industry data

Anklesaria Group, Inc. 2001
UNDERSTANDING OVERHEADTYPES OF COST
Based on Allocationu Direct Costs (Costs that can be traced to a product)u Indirect Costs (Costs that cannot be traced to a product)
Based on Behavior (reaction to volume changes)u FixedØConstant in total, vary per unit; as volume changes
ØCommittedã Costs committed for a period of time (building lease)
ØDiscretionaryã Amounts left to management discretion (advertising)
u VariableØConstant per unit, vary in total; as volume changes
Anklesaria Group, Inc. 2001
DETERMINING OVERHEAD RATES
Capacity = 1MM hrsUtilization = 80%
Overhead rate - $1.25/hr($1MM / 800,000)
OVERHEAD POOL (E.g. $1,000,000)
OVERHEAD BASE (E.g. LABOR HOURS – 800,000)
Product ALabor hrs = 3OH = $3.75
Product BLabor hrs = 8OH = $10.00
Product CLabor hrs = 5OH = $6.25
Product DLabor hrs = 4OH = $5.00

Anklesaria Group, Inc. 2001
ALLOCATING OVERHEAD
u Allocation of indirect costs using one or more allocation basesØ Job/Process CostingØ Standard CostingØ Activity Based CostingØ Process Based Costing
u Based on estimates made at the beginning of the year
u Markups on non-value-added activities is a cancer that is killing previously profitable companies
Anklesaria Group, Inc. 2001
No change in material costMOH = 200% of Direct LaborO&O Exp. = 25% of COGSProfit = 10% of Total Cost Wage Rate = $15 per hour
A $15 increase/decrease in labor of Supplier #1 magnifies to $117.00 for end customer
Assumptions:
MAGNIFICATION OF COST
$117.00$85.09$61.88Loaded Cost
10.647.745.63Profit
106.3677.3556.25Total Cost
21.2715.4711.25Operating & Other Exp.
85.0961.8845.00Cost of Goods Sold
N/CN/C30.00Manufacturing OH
N/CN/C$15.00Labor
$85.09$61.88N/CMaterial
Supplier#3Supplier#2Supplier#1

Anklesaria Group, Inc. 2001
TOTAL COST OF OWNERSHIP MODEL
Application:u Evaluate purchase optionsu Make effective sourcing decisionsu Make vs. Buy decisionsu Determine the overall financial impact of
changes in activityu Understand and measure all costs incurred over
the life of a purchased product/service
TCO: The Present value of all costs associated with a product/service, incurred over its expected life
Anklesaria Group, Inc. 2001
TOTAL COST OF OWNERSHIP
Total Cost of Ownership
Costs incurred in getting the product to customer site, incl. freight, admin costs
Costs incurred in converting purchased part/material into finished product and supporting it through its usable life
Costs incurred in the termination of products’ life, incl. disposal costs, winding down of project costs, etc.
Cost elements that make up the purchase price
Price is only a part of cost
Note: This breakdown is only a guideline. TCO
categories vary depending on the nature of the
product/service
Acquisition Costs
Purchase Price
Usage Costs
End of Life Costs
INHOUSE
COSTS

Anklesaria Group, Inc. 2001
TOTAL COST OF OWNERSHIP MODEL
Assumptions:
u Product Purchased: Desktop PC’su Product Life Cycle: 3 yearsu Volume: 1,000 PC’su Cost of Capital: 12%
Anklesaria Group, Inc. 2001
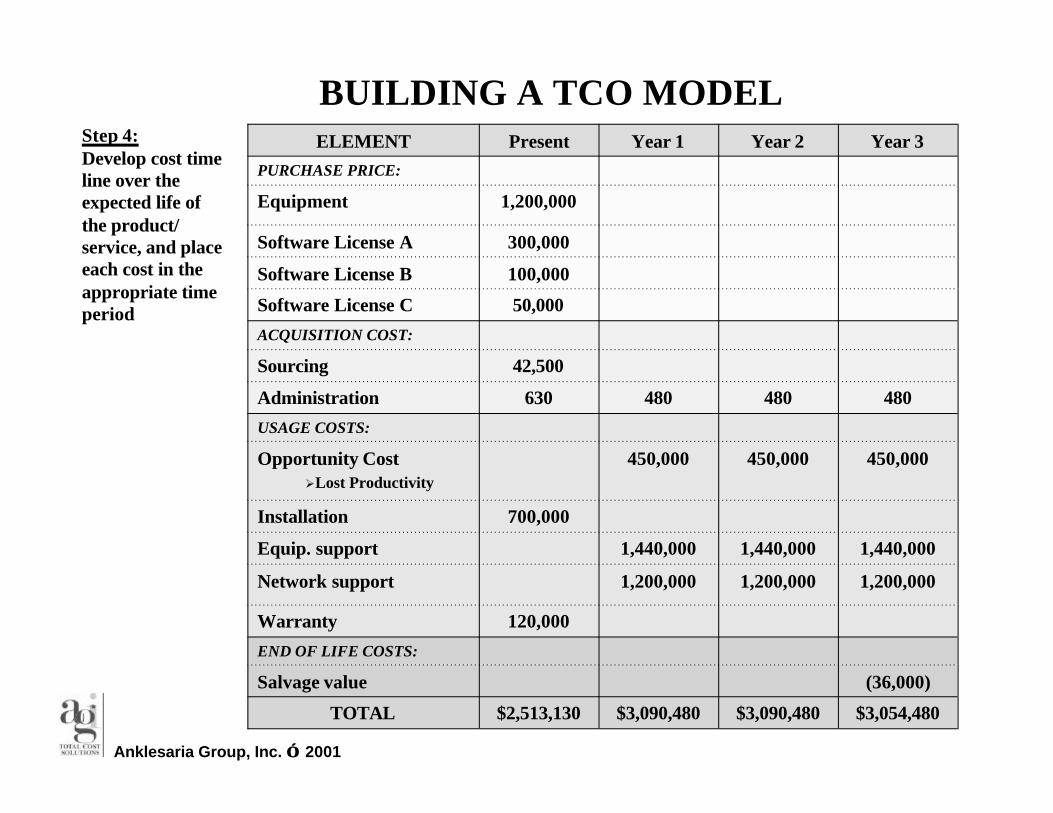
BUILDING A TCO MODEL
END OF LIFE COSTS
USAGE COSTS
ACQUISITION COST
PURCHASE PRICE
ØOpportunity CostØLost ProductivityØLost Sales
END OF LIFE COSTS:
USAGE COSTS:
ØInstallation
ØEquip. support
ØNetwork support
ØWarranty
ACQUISITION COST:
ØSourcing
ØAdministration
PURCHASE PRICE:
ØEquipment
ØSoftware A
ØSoftware B
ØSoftware C
ØSalvage value
Step 1: Construct a broad process map of the activities associated with “owning” the product/service and determine categories for the TCO
Step 2:List the cost elements under each category

Anklesaria Group, Inc. 2001
BUILDING A TCO MODEL
Downtime 15 hrs/PC per yr @ $30/hrRØOpportunity CostØLost Productivity
MEASURER/OELEMENT
ØSalvage value
END OF LIFE COSTS:
ØWarranty
ØNetwork support
ØEquipment support
ØInstallation
USAGE COSTS:
ØAdministration
ØSourcing
ACQUISITION COST:
ØSoftware License C
ØSoftware License B
ØSoftware License A
ØEquipment
PURCHASE PRICE:
O
O
R
R
O
R
R
O
O
O
O
$700/PC includes PC move, install and network
$120/month/PC – supplier quote
$100/month – supplier quote
$120/PC for 3 year warranty
2 FTE @ $70K and $120K for 3 months
1 PO @ $150 and 12 invoices @ $40 each
Supplier quote ($1,200 per PC)
Supplier quote ($300 per PC)
Supplier quote ($100 per PC)
Supplier quote ($150 per PC)
$36 per PC
Step 3:Determine if each cost element is recurring (R) or one-time (O) and identify how each element is to be measured
Anklesaria Group, Inc. 2001
BUILDING A TCO MODEL
450,000450,000450,000Opportunity CostØLost Productivity
$3,054,480$3,090,480$3,090,480$2,513,130TOTAL
120,000
700,000
630
42,500
50,000
100,000
300,000
1,200,000
Present
1,200,000
1,440,000
480
Year 1
1,200,000
1,440,000
480
Year 2
(36,000)
1,200,000
1,440,000
480
Year 3ELEMENT
Salvage value
END OF LIFE COSTS:
Warranty
Network support
Equip. support
Installation
USAGE COSTS:
Administration
Sourcing
ACQUISITION COST:
Software License C
Software License B
Software License A
Equipment
PURCHASE PRICE:
Step 4:Develop cost time line over the expected life of the product/ service, and place each cost in the appropriate time period

Anklesaria Group, Inc. 2001
BUILDING A TCO MODEL
$3,054,480$3,090,480$3,090,480$2,513,130TOTAL
Present Year 1 Year 2 Year 3Time
Step 5:Calculate Present Value Interest Factors (PVIF) for each year, using your firm’s Cost of Capital (12%)(See table on page 102)
0.7120.7970.8931
$2,174,790$2,463,113$2,759,799$2,513,130
Step 6:Calculate Present Values(Total * PVIF)
Step 7:Calculate Total Cost of Ownership(Sum of Present Values in Step 6) $9,910,832

Anklesaria Group, Inc. 2001
TOTAL COST OF OWNERSHIP EXAMPLE
Purchase Price 1,650K
Acquisition 44K
Usage 8,242K
EOL (26K)
Product life cycle
Source: Anklesaria Group, Inc.TCO for Desktop PC’s
Present values
Anklesaria Group, Inc. 2001
PROFITABILITY: THE KEY TO COMPETITIVENESS
u Acknowledge the need for suppliers to make a reasonable profit early in the process
u Profit should be discussed when it becomes a “critical” cost
u Profit should be based on risk and value addedu Select appropriate profit option:
Ø Current supplier profit marginØ Industry marginØ Industry margin plus premiumØ Current absolute per unit dollarsØ Current total dollars (ROIC)

IMPLEMENTING STRATEGIC COST MANAGEMENT

Anklesaria Group, Inc. 2001
IMPLEMENTATION
u Review material presented in this manualu Create an Intelligence Cellu Identify as many sources of data to build a cost
modelsu Communicate new strategy through the supply
chainu Reward suppliers that cooperateu Document & Publicize savings
Anklesaria Group, Inc. 2001
THE NEXT STEP
u Identify key suppliers/commoditiesu Engage in SCM techniquesu Determine readiness for strategy buildingu Establish initial team membersu Develop and deploy AIM&DRIVE®
strategies
Anklesaria Group, Inc. 2001
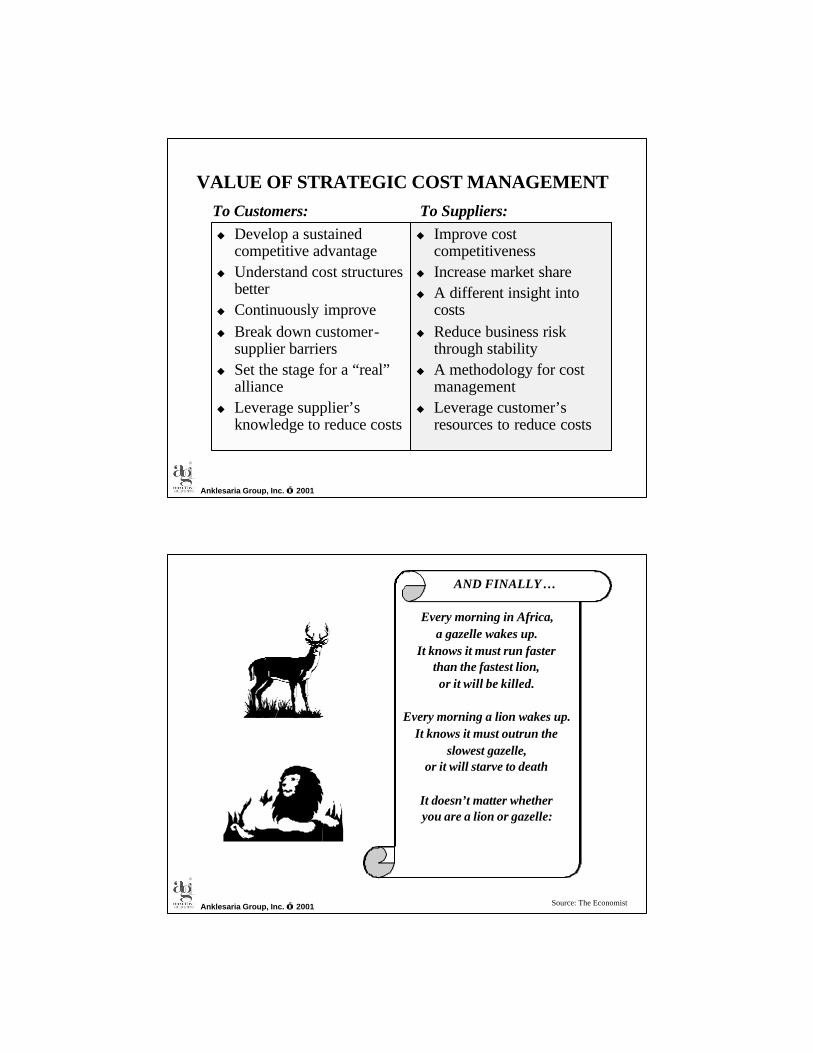
VALUE OF STRATEGIC COST MANAGEMENT
u Develop a sustained competitive advantage
u Understand cost structures better
u Continuously improveu Break down customer-
supplier barriers u Set the stage for a “real”
allianceu Leverage supplier’s
knowledge to reduce costs
u Improve cost competitiveness
u Increase market shareu A different insight into
costsu Reduce business risk
through stabilityu A methodology for cost
managementu Leverage customer’s
resources to reduce costs
To Customers: To Suppliers:
Anklesaria Group, Inc. 2001
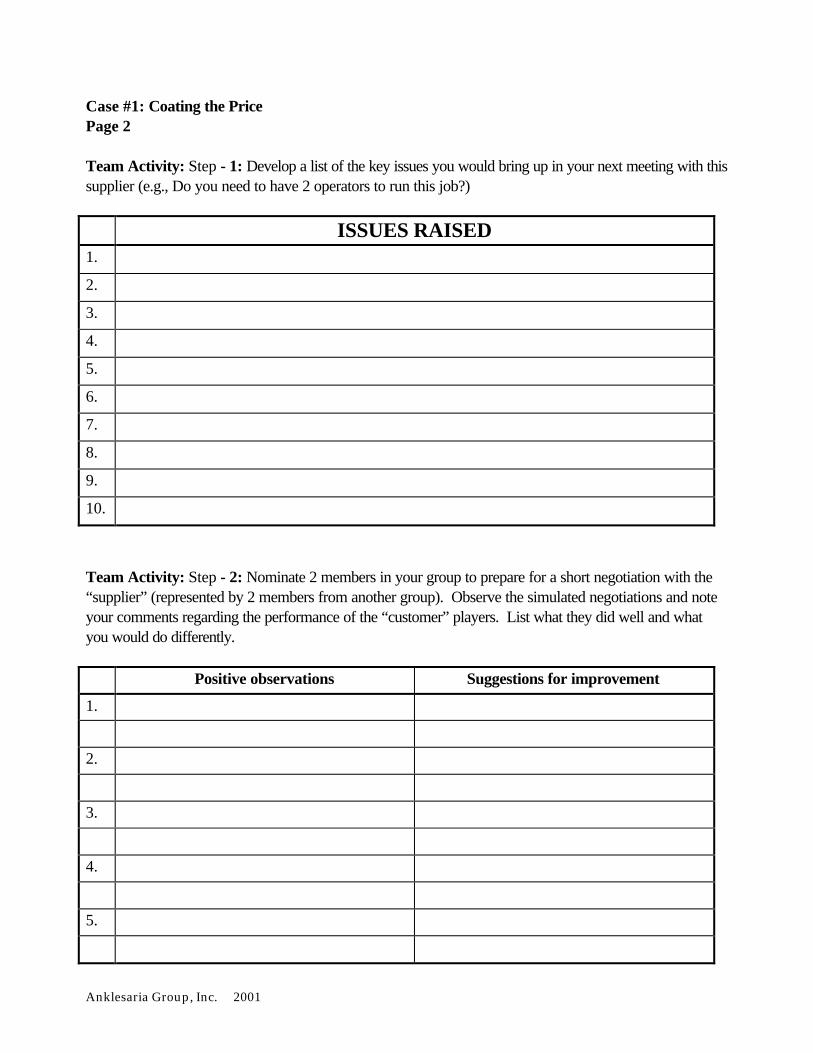
AND FINALLY…
Every morning in Africa,a gazelle wakes up.
It knows it must run fasterthan the fastest lion,or it will be killed.
Every morning a lion wakes up.It knows it must outrun the
slowest gazelle,or it will starve to death
It doesn’t matter whether you are a lion or gazelle:
Source: The Economist

Anklesaria Group, Inc. 2001
WHEN THE SUN COMES UP
YOU HAD BETTER BE RUNNING

EXERCISES

Anklesaria Group, Inc. 2001
CASE #1 Coating the Price
A year ago, you entered into an indefinite quantity contract for coated plastic made to your specification. With experience you are now able to estimate, fairly accurately, that your requirement per month will be 4 million feet. The product that uses the plastic you are buying is doing very well in the market and is expected to have a life of at least three more years. However, customers are applying a lot of pressure on your salespeople to reduce the market price of the finished product to less than $275. This plastic is the main raw material used in the product and constitutes about 27 percent of the total selling price of $325. Hence the pressure is on the purchasing department to find ways to reduce the cost of raw material. You requested the current supplier to quote, together with supporting cost data, for a 12 month extension. The initial cost breakdown and data for the extension is shown below. The sales rep has pointed out that while costs have gone up in most cases, only $0.21, or 0.24%, has been passed on to you.
Cost Breakdown for coated plastic $ per thousand feet Current Proposed Raw Materials Plastic: $2.00/lb., 90% yield $ 57.00 $ 57.00 Coating: 90% yield 5.55 5.55 Total material cost $ 62.55 $ 62.55 Conversion Costs Labor (@10,500 feet/hr.) 2 operators x $20 (proposed labor: $21) 3.78 3.97 Machine Cost: $33.33/hour/10.5 3.17 3.17 Packaging .81 .81 Total conversion cost 7.76 7.95 Overhead Engineering 3.85 3.85 Manufacturing 1.15 1.15 General & Administrative 2.50 2.50 Selling 2.05 2.05 Total overhead 9.55 9.55 Profit 7.98 8.00 Selling Price (Total material + Conversion + Overhead + Profit) $ 87.84 $ 88.05 ====== ======
Anklesaria Group, Inc. 2001
Case #1: Coating the Price Page 2 Team Activity: Step - 1: Develop a list of the key issues you would bring up in your next meeting with this supplier (e.g., Do you need to have 2 operators to run this job?) ISSUES RAISED
1.
2.
3.
4.
5.
6.
7.
8.
9.
10.
Team Activity: Step - 2: Nominate 2 members in your group to prepare for a short negotiation with the “supplier” (represented by 2 members from another group). Observe the simulated negotiations and note your comments regarding the performance of the “customer” players. List what they did well and what you would do differently. Positive observations Suggestions for improvement
1.
2.
3.
4.
5.

Anklesaria Group, Inc. 2001
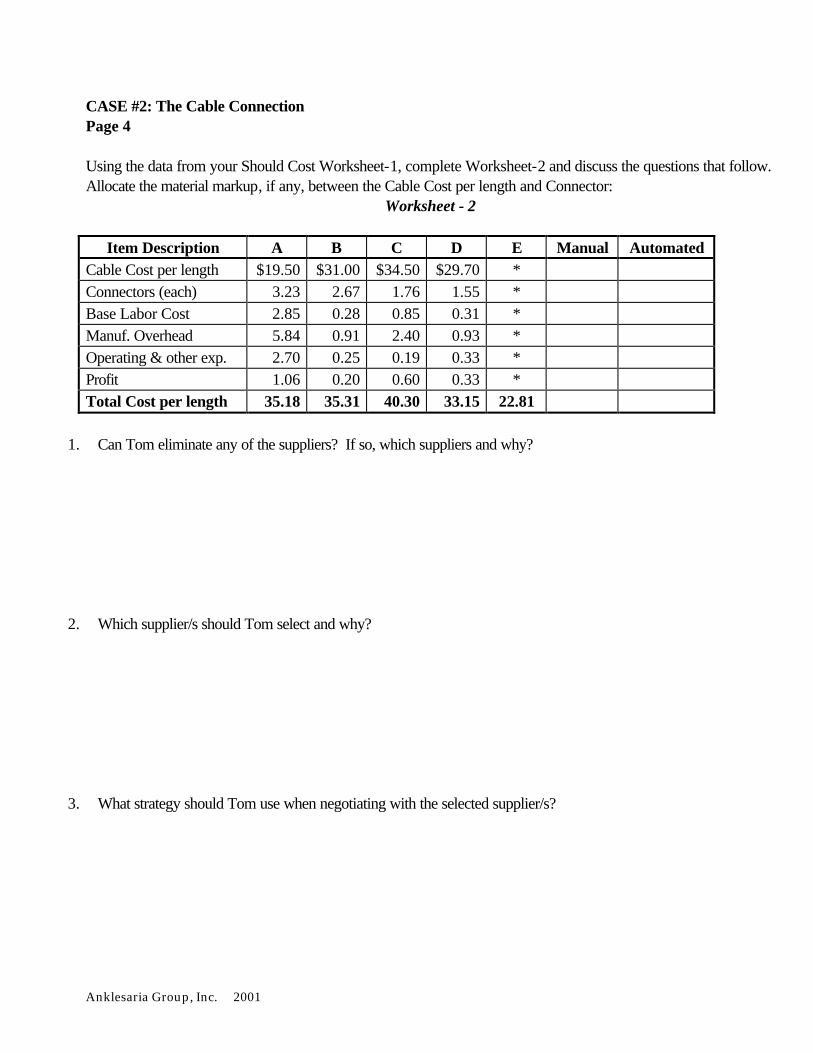
CASE #2 The Cable Connection: Should Cost Models
Tom Mazzone is a senior contract manager of Advanced Telecommunications. He had recently sent out a request for quotation for special connectorized cable. The cables are to be used in a very expensive and sophisticated switching system for a major telephone company. Success on this program could well mean many more such jobs for the company internationally. The selected supplier would need to be capable of meeting the increase in demand overseas as well as the inherent nuances of international business. Key points of the requirements are summarized below. Materials Cable A: 24.75 million feet, averaging 150 feet per length Male connector: one per length of cable Total number of connectors: 165,000 Specifications 25 pair cable; 24 g.a., ICC or equivalent Cable insulation: must have an oxygen index of 28% or better A week later, Tom received the following quotes, which are summarized below.
Item Description
Supplier A
Supplier B
Supplier C
Supplier D
Supplier E
Cable Cost per length $ 19.50 $ 31.00 $ 34.50 $ 29.70 * Connectors (each) 3.23 2.67 1.76 1.55 * Base Labor Cost 2.85 0.28 0.85 0.31 * Manuf. Overhead 5.84 0.91 2.40 0.93 * Operating & other exp. 2.70 0.25 0.19 0.33 * Profit 1.06 0.20 0.60 0.33 * Total Cost per length 35.18 35.31 40.30 33.15 22.81 * Supplier E quoted only a total cost per length. No breakdown was provided. In order to process the proposals, Tom decided to do a little homework. He first called one of the major suppliers of male connectors in Chicago and asked for a price based on 200,000 standard male connectors. The price quoted to him was $2.61 each on quantities below 100,000 pieces; $2.10 on quantities between 100,000 and 200,000; and $1.71 each on quantities of 200,000 or more. Tom realized that these prices could be further negotiated if he were a serious buyer. Besides, Tom feels that suppliers would purchase similar connectors for projects with other customers.

Anklesaria Group, Inc. 2001
CASE #2: The Cable Connection Page 2 Next, Tom called ICC, the country's leading manufacturer of this kind of cable. The prices provided were $0.1832 per foot. These prices were available to Advanced Telecommunication only because of the special relationship between the two companies. ICC usually charges a premium of 10 to 20 percent more to other companies, who in turn further add a markup of 2-15%, depending on the value added. Tom tried to get ICC to quote on the entire job, but was told that the company did not wish to take on that type of contract. ICC was willing to sell the cable to a selected supplier of Advanced at the preferred rate of $0.1832 per foot. However, the suppliers are not aware of this. In order to understand the labor contribution to cost, Tom called the engineer at Advanced, Margaret Teacher, who was familiar with the connectorization process. After reviewing the specifications, Margaret indicated that she knew of some studies that had been performed to evaluate the time standards for similar requirements. Her feeling was that the maximum time to connectorize 25 pair cable would be 15 minutes per cable (4 cables per hour). She pointed out that by using an automated system, the output could be improved to 1.5 minutes per cable (40 cables per hour). Referring to the Department of Labor Area Wage Surveys for the skill level required, Tom determined the labor to be $10.00 per hour. Next, Tom pulled out the files of the respective suppliers. In the past, all of them had dealt with Advanced Telecommunications without any major problem. Companies B, C and D were all large companies (between $40-50 million in asset size with around 750 to 1,000 production workers), while A and E, both between $15 and $20 million companies, had only recently diversified into cable assembly. These companies employed less than 250 production workers. Tom called Supplier E to verify if it really understood the requirement, and also to provide a cost breakdown. The sales representative said that she believed the quote was correct and that it was against company policy to share cost data. No samples were available to the customer for inspection. However, if Tom wished, he could purchase a minimum of 5,000 cable lengths at a price of $40 per length. If the full order of 165,000 cables were placed within 15 days, the $200,000 paid for the 5,000 cables would be adjusted against the full contract price of $22.81 per length. The hardware and software for the switching system is nearly complete and the cabling will have to be done within the next five weeks. An order would have to be placed fairly soon and the selected supplier would be given no more than three weeks to deliver the entire quantity. * This case is an adaptation of a case by Mark L. Cohen of Pacific Bell.

Anklesaria Group, Inc. 2001
CASE #2: The Cable Connection Page 3
Worksheet - 1
Based on the information above, develop a Should Cost model for special connectorized cable. The
information provided below the worksheet will help you in your calculations. Please note that this is a service should cost, so material costs have been calculated separately.
$ per length # Cost Element
Manual Automated 1 Direct Labor (Hourly wage rate ÷ # of cables per hr)
2 Overhead {see information (a) below}
3 Sub-total: Loaded labor Cost
4 GS&A {see information (b) below}
5 Sub-total: Total Cost (Loaded labor + GS&A)
6 Profit {see information (c) below}
7 Cost excluding mat’l (Total Cost + Profit)
8 Material Cost (ICC quote)
9 Connector (enquiry from Chicago)
10 Material Markup (Procurement OH) (use your discretion)
TOTAL SHOULD COST (Lines 7+8+9+10)
The following information has been obtained for SIC Code 3496 (misc. fabricated wire products):
a) Overhead as a percentage of direct labor (Pacific Bell study) for assembly Manual = 100% Semi-automated = 100-200% Automated = 225-400%
b) GS&A as a percentage of Loaded Labor Cost (RMA, 2000) $500K-2 mil. in assets = 35.3% $2-10 mil. in assets = 28.5% $10-50 mil. = 28%
c)Profit as a percentage of Total Cost (RMA, 2000) $500K-2 mil. in assets = 3.3% $2-10 mil. in assets = 5.4% $10-50 mil. = 8.7%
Anklesaria Group, Inc. 2001
CASE #2: The Cable Connection Page 4 Using the data from your Should Cost Worksheet-1, complete Worksheet-2 and discuss the questions that follow. Allocate the material markup, if any, between the Cable Cost per length and Connector:
Worksheet - 2
Item Description A B C D E Manual Automated Cable Cost per length $19.50 $31.00 $34.50 $29.70 * Connectors (each) 3.23 2.67 1.76 1.55 * Base Labor Cost 2.85 0.28 0.85 0.31 * Manuf. Overhead 5.84 0.91 2.40 0.93 * Operating & other exp. 2.70 0.25 0.19 0.33 * Profit 1.06 0.20 0.60 0.33 * Total Cost per length 35.18 35.31 40.30 33.15 22.81
1. Can Tom eliminate any of the suppliers? If so, which suppliers and why? 2. Which supplier/s should Tom select and why? 3. What strategy should Tom use when negotiating with the selected supplier/s?

Anklesaria Group, Inc. 2001
Paying the Price CASE # 3
Dave Matthews had recently joined Power Machine Corp., New York, as Senior Procurement Manager and was faced with a daunting task. He had been requested by Sandra Palmer, the Director of Marketing Operations, to help her obtain the services of a consultant to evaluate and re-engineer the company’s logistics department. There had been a significant reshuffle at the top and the incoming management team had established a 20% company-wide cost reduction target. Over the years Power had utilized the services of several consultants for various projects ranging from benchmarking studies to process re-engineering . Consulting contracts were traditionally put out to bid. On several occasions, Apollo Consulting, a large established management consulting firm headquartered in Chicago, IL had won the bid. Jan Thompson, Dave's predecessor had sent out several RFQ for the project prior to leaving. The responses Dave received were as follows: Supplier Days Contract Amount Apollo Consulting 30 600,000 Henderson Consulting 30 620,000 Carney & Co. 32 630,000 Aquarius Consulting 35 650,000 This was the first time Henderson, Carney and Aquarius had bid on a Power contract. Dave called Henry Dawson, the account manager at Henderson. Henry informed him that it would be impossible for him to lower the contract amount any further. He said that the project would involve a significant initial scope study. This would take about 6 days. It would involve a detailed evaluation of the company's existing organizational structure and operations, and would entail a round of in-depth interviews with several key business managers. Since this was the first time Henderson was involved with Power this would have to be done in great detail. Dave verified this with the account managers at Carney and Aquarius. Apollo had recently completed a large project for Power's manufacturing operation, which included a scope study and may not have to conduct another one. Dave then contacted Steve Lindsey, the Account Executive at Apollo. Steve provided him with the following breakdown team profiles: Project time – 30 days Resource requirements – 2 Senior Consultants, 5 Junior Consultants. Fee Structure: 2 Senior Consultants @ $4,000/day each = $240,000 5 Junior Consultants @ 2,400/day each = $360,000 TOTAL FEE: = $600,000
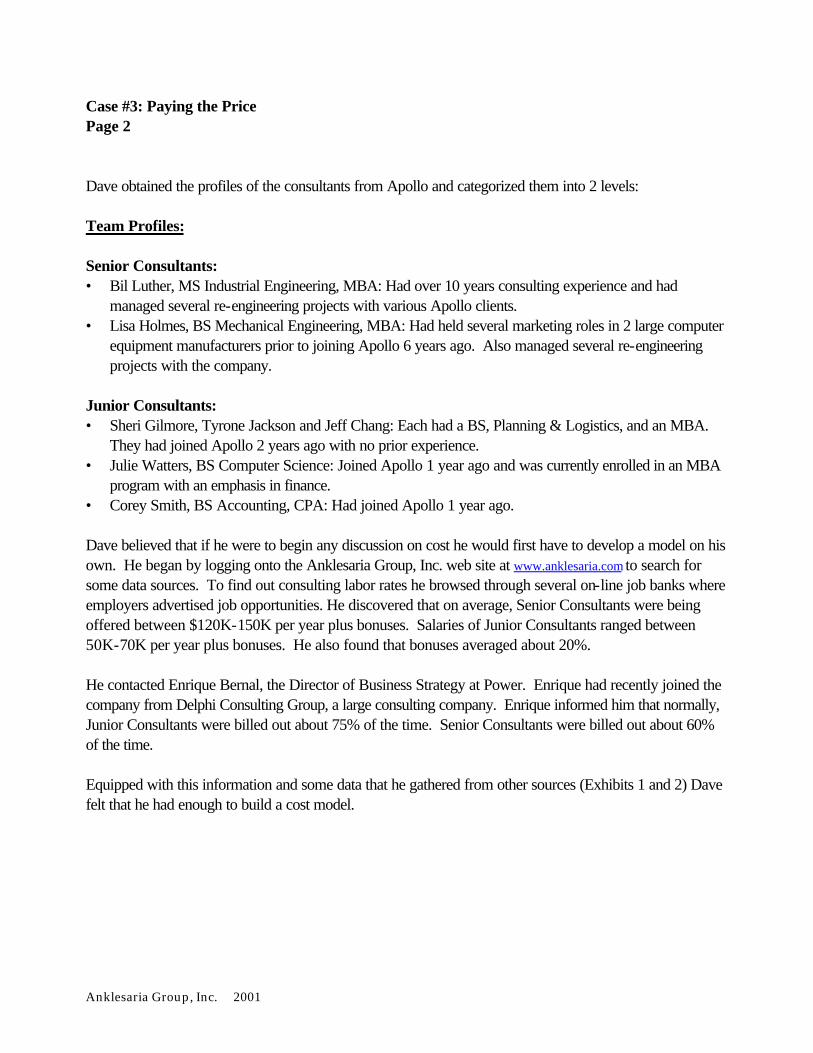
Anklesaria Group, Inc. 2001
Case #3: Paying the Price Page 2 Dave obtained the profiles of the consultants from Apollo and categorized them into 2 levels: Team Profiles: Senior Consultants: • Bil Luther, MS Industrial Engineering, MBA: Had over 10 years consulting experience and had
managed several re-engineering projects with various Apollo clients. • Lisa Holmes, BS Mechanical Engineering, MBA: Had held several marketing roles in 2 large computer
equipment manufacturers prior to joining Apollo 6 years ago. Also managed several re-engineering projects with the company.
Junior Consultants: • Sheri Gilmore, Tyrone Jackson and Jeff Chang: Each had a BS, Planning & Logistics, and an MBA.
They had joined Apollo 2 years ago with no prior experience. • Julie Watters, BS Computer Science: Joined Apollo 1 year ago and was currently enrolled in an MBA
program with an emphasis in finance. • Corey Smith, BS Accounting, CPA: Had joined Apollo 1 year ago. Dave believed that if he were to begin any discussion on cost he would first have to develop a model on his own. He began by logging onto the Anklesaria Group, Inc. web site at www.anklesaria.com to search for some data sources. To find out consulting labor rates he browsed through several on-line job banks where employers advertised job opportunities. He discovered that on average, Senior Consultants were being offered between $120K-150K per year plus bonuses. Salaries of Junior Consultants ranged between 50K-70K per year plus bonuses. He also found that bonuses averaged about 20%. He contacted Enrique Bernal, the Director of Business Strategy at Power. Enrique had recently joined the company from Delphi Consulting Group, a large consulting company. Enrique informed him that normally, Junior Consultants were billed out about 75% of the time. Senior Consultants were billed out about 60% of the time. Equipped with this information and some data that he gathered from other sources (Exhibits 1 and 2) Dave felt that he had enough to build a cost model.

Anklesaria Group, Inc. 2001
Case #3: Paying the Price Page 3 Exhibit 1: Source: Dun & Bradstreet Key Norms and Financial Ratios (1999-00): SIC 8742, Management Consulting Services
Item $ % Net Sales 1,500,000 100 Gross Profit 636,000 45.4 Net Profit After Tax 105,000 7.3 Exhibit 2: Source: U.S. Bureau of Census, 1997 Economic Census – Professional, Scientific & Tech. Services Geographical Area Series – Chicago, Illinois NAICS 541614 Process, physical distribution and logistics consulting services

Anklesaria Group, Inc. 2001
Case #3: Paying the Price Page 4 Exhibit 3:
Industry Total 1061240 100.00 20.45 21702358 100
Managerial & Administrative 223080 20.91 31.87 7109560 33% XFinancial Managers 21030 1.97 33.83 711445 3.28%Personnel, Training & Labor Relations Managers 7910 0.74 26.19 207163 0.95%Purchasing Managers 2480 0.23 21.45 53196 0.25%Marketing/Advertising/Public Relations Managers 23190 2.17 29.04 673438 3.10%Administrative Managers 22690 2.13 23.47 532534 2.45%Engineering, Mathematical & Natural Sciences Managers 10640 1.00 34.37 365697 1.69%Health Services Managers 660 0.06 27.88 18401 0.08%Industrial Production Managers 110 0.01 28.50 3135 0.01%Construction Managers 9210 0.86 28.72 264511 1.22%Communications/Transportation & Utilities Managers 480 0.05 30.47 14626 0.07%Food Service/Lodging Managers 780 0.07 22.74 17737 0.08%Other Services Managers 960 0.09 19.22 18451 0.09%General Managers & Top Executives 85280 8.00 38.06 3245757 14.96%All Other Managers & Administrators 37660 3.53 26.13 984056 4.53%
Professional/Paraprofessional & Technical Occupations 373180 34.96 23.38 8724948 40% XSales & Related Occupations 63580 5.96 17.35 1103113 5.08%Clerical & Administrative Support 246440 23.13 12.05 2969602 13.68%Service Occupations 65650 6.16 8.70 571155 2.63%Agricultural, Forestry, Fishing & Related 5770 0.54 9.98 57585 0.27%Product/Construct/Operate Maintenance/Material Handling 83540 7.70 13.90 1161206 5.35%
SIC Code - 874(Management & Public Relations) Industry-Occupation-Wage Matrix
Salary Dist
Direct LaborOccupation Title
No. of Employees
Mean Salary
Total Salary
Emp.Dist
Anklesaria Group, Inc. 2001
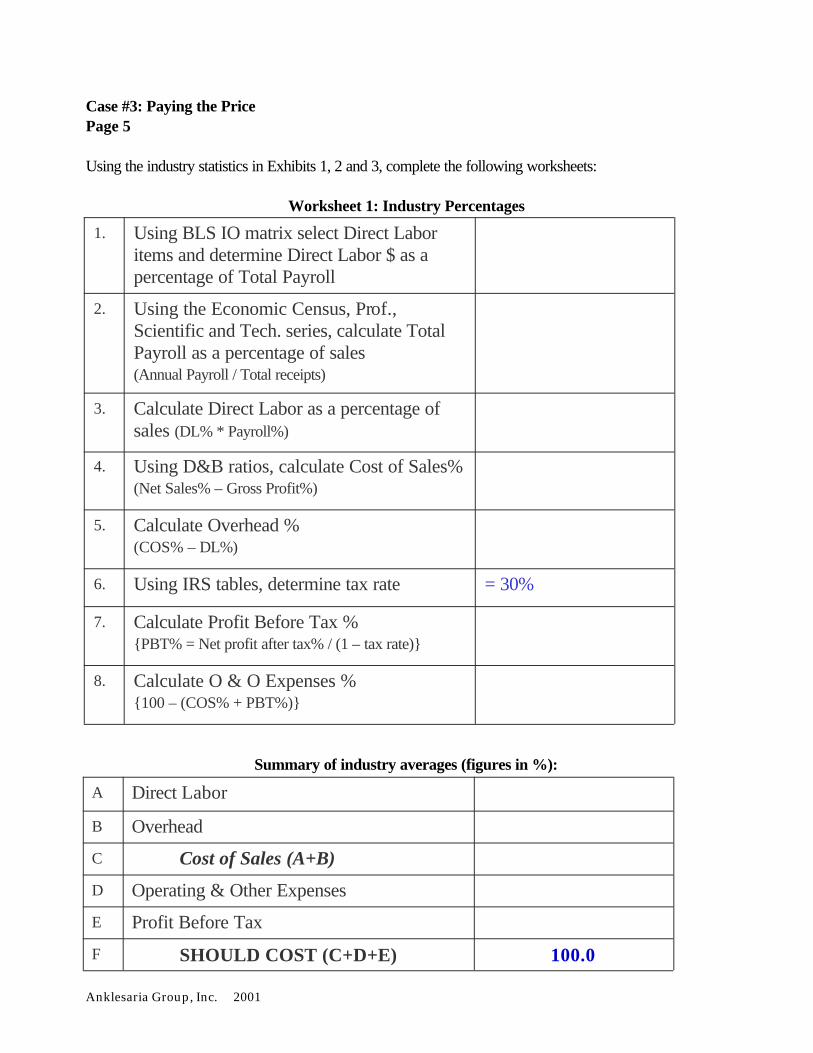
Case #3: Paying the Price Page 5 Using the industry statistics in Exhibits 1, 2 and 3, complete the following worksheets:
Worksheet 1: Industry Percentages
Summary of industry averages (figures in %):
Calculate Profit Before Tax % {PBT% = Net profit after tax% / (1 – tax rate)}
7.
Calculate O & O Expenses % {100 – (COS% + PBT%)}
8.
Calculate Overhead % (COS% – DL%)
5.
= 30% Using IRS tables, determine tax rate 6.
Calculate Direct Labor as a percentage of sales (DL% * Payroll%)
3.
Using D&B ratios, calculate Cost of Sales% (Net Sales% – Gross Profit%)
4.
Using the Economic Census, Prof., Scientific and Tech. series, calculate Total Payroll as a percentage of sales (Annual Payroll / Total receipts)
2.
Using BLS IO matrix select Direct Labor items and determine Direct Labor $ as a percentage of Total Payroll
1.
Profit Before Tax E
100.0 SHOULD COST (C+D+E) F
Cost of Sales (A+B) C
Operating & Other Expenses D
Overhead B
Direct Labor A

Anklesaria Group, Inc. 2001
Case #3: Paying the Price Page 6
Worksheet 2: Daily Direct Labor costs
Element Sr. Consultant Jr. Consultant
Base Annual Salary (use average)
Bonus
Total Annual Compensation
Percentage of time billed-out
Adjusted Annual Compensation
Number of billable hours in a year (default) 2080 2080
Hourly direct labor cost
Daily direct labor cost (use 8-hour workday)
Worksheet 3: Daily billing rate, using summary of industry averages
Element Sr. Consultant
$/day %
Jr. Consultant $/day
Daily direct labor cost
Overhead
COS (Daily rate + Overhead)
Operating & Other Expenses
Total Cost (COS + O&O Exp.)
Profit Before Taxes (PBT)
SHOULD COST (Total Cost + PBT) 100.0
Worksheet 4: Contract Amount
Resource # of
Consultants Daily billing
Rate
# days (less days for Co.
Evaluation) Total $
Senior Consultant
Junior Consultant
Contract Amount

Anklesaria Group, Inc. 2001
Case #3: Paying the Price Page 7 Questions: 1. What strategy should Dave use to negotiate the contract with Apollo? 2. Nominate two members from your team to participate in a negotiation with Apollo (two members from
another team). Note your observations on the negotiations below.
Anklesaria Group, Inc. 2001
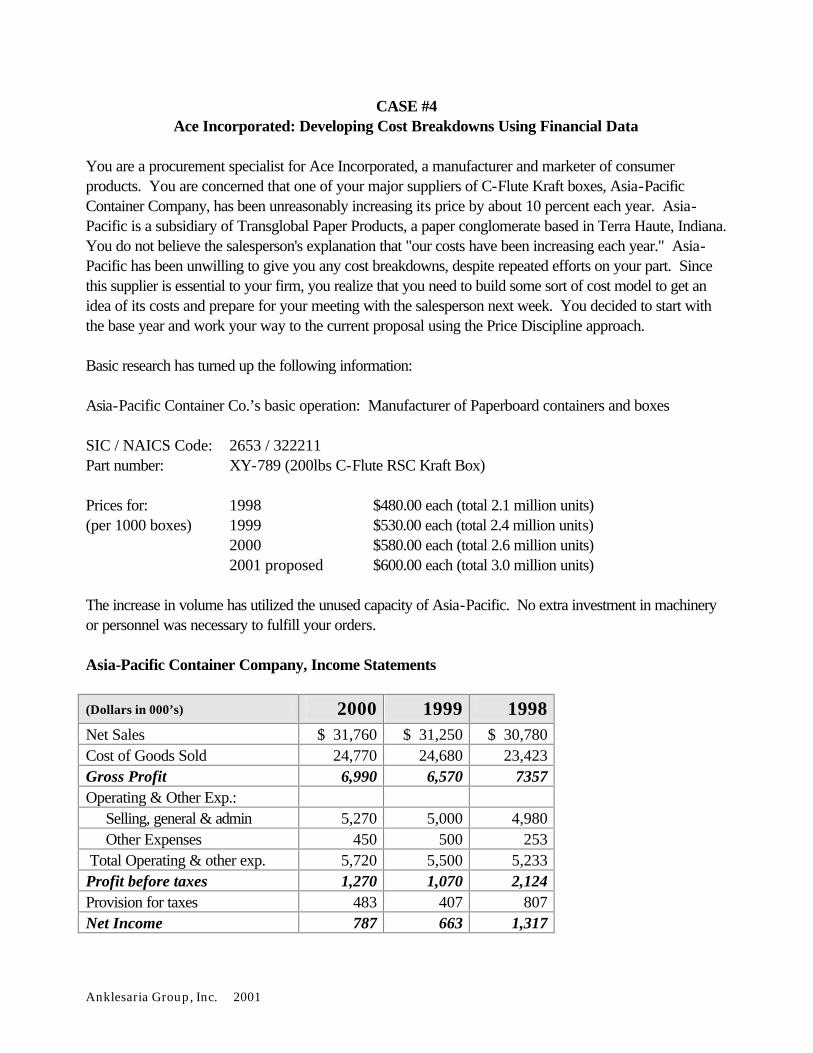
CASE #4 Ace Incorporated: Developing Cost Breakdowns Using Financial Data
You are a procurement specialist for Ace Incorporated, a manufacturer and marketer of consumer products. You are concerned that one of your major suppliers of C-Flute Kraft boxes, Asia-Pacific Container Company, has been unreasonably increasing its price by about 10 percent each year. Asia-Pacific is a subsidiary of Transglobal Paper Products, a paper conglomerate based in Terra Haute, Indiana. You do not believe the salesperson's explanation that "our costs have been increasing each year." Asia-Pacific has been unwilling to give you any cost breakdowns, despite repeated efforts on your part. Since this supplier is essential to your firm, you realize that you need to build some sort of cost model to get an idea of its costs and prepare for your meeting with the salesperson next week. You decided to start with the base year and work your way to the current proposal using the Price Discipline approach. Basic research has turned up the following information: Asia-Pacific Container Co.’s basic operation: Manufacturer of Paperboard containers and boxes SIC / NAICS Code: 2653 / 322211 Part number: XY-789 (200lbs C-Flute RSC Kraft Box) Prices for: 1998 $480.00 each (total 2.1 million units) (per 1000 boxes) 1999 $530.00 each (total 2.4 million units) 2000 $580.00 each (total 2.6 million units) 2001 proposed $600.00 each (total 3.0 million units) The increase in volume has utilized the unused capacity of Asia-Pacific. No extra investment in machinery or personnel was necessary to fulfill your orders. Asia-Pacific Container Company, Income Statements
(Dollars in 000’s) 2000 1999 1998 Net Sales $ 31,760 $ 31,250 $ 30,780 Cost of Goods Sold 24,770 24,680 23,423 Gross Profit 6,990 6,570 7357 Operating & Other Exp.: Selling, general & admin 5,270 5,000 4,980 Other Expenses 450 500 253 Total Operating & other exp. 5,720 5,500 5,233 Profit before taxes 1,270 1,070 2,124 Provision for taxes 483 407 807 Net Income 787 663 1,317

Anklesaria Group, Inc. 2001
CASE #4: Ace Incorporated Page 2 DATA FOR SIC /NAICS CODE 2653 / 322211 (Corrugated and Solid Fiber Boxes) Robert Morris Associates, 1998 Data sorted by $ sales (all numbers are in percent) Note: 1 MM = 1 Million
Income data 1-3MM 3-5MM 5-10MM 10-25MM > 25MM All Sizes
Net Sales 100.0 100.0 100.0 100.0 100.0 100.0 Gross Profit 27.9 28.1 28.1 27.5 25.0 27.5 Operating Exp 24.5 23.2 22.7 21.2 17.6 21.8 Other Expenses 1.7 1.3 0.9 1.0 1.4 1.1 Profit Before Tax 1.8 3.6 4.6 5.3 6.0 4.6
U.S. Bureau of Census, 1997 Economic Census – Manufacturing – Industry Series

Anklesaria Group, Inc. 2001
CASE #4: Ace Incorporated Page 3
Worksheet Step 1: Percentage of Sales (POS)
Using the POS approach, compute each cost element for 2001. To determine the industry averages, use the RMA and ASM data given at the end of the case. For Asia Pacific’s percentages, use the income statement provided in the case. In calculating the material, labor and factory overhead ratios for Asia Pacific, you may assume that the mix between these three costs is in line with the mix in the industry.
Cost Element 1998
Industry Avg (%) 1998
Asia Pacific (%) 1998
Asia Pacific ($) Material
Labor
Manufacturing Overhead
Sub-total (COGS)
Operating & other exp.
Profit
TOTAL 100% 100% $480.00
Step 2: Price Discipline
Using 1998 as the base, calculate a "fair price" for part #XY-789 for 2001. Reviewing the PPI for corrugated paperboard, you observed that Asia-Pacific’s raw material prices have increased by an average of 10.51% per year over the past 2 years. Labor rates have shown a 2% increase per year over the same period. You expect a 3% productivity improvement each year in material. The BLS Industry Productivity Index reveals that labor productivity improved by 6.84% per year over the same period. These trends in Material and Labor are expected to continue for the new contract period. It is estimated that manufacturing overhead is 80% fixed and 20% variable. Operating and other expenses are 90% fixed and 10% variable. The overhead pool (fixed and variable) has grown by 3 percent per year to cover inflation of some of the items in the pool.
Cost Element 1998 ($) 2001 ($) Notes 1 Material adjusted for inflation and productivity
2 Labor adjusted for inflation and productivity
3 Manufacturing OH adjusted for inflation and volume
4 Sub-total (COGS) 1 + 2 + 3
5 Operating & other adjusted for inflation and volume
6 Profit
7 TOTAL $480.00 4 + 5 + 6

Anklesaria Group, Inc. 2001
CASE #4: Ace Incorporated Page 4 Based on the results of the above worksheet, please answer the following questions: 1. How will you negotiate the 2001 contract with Asia-Pacific? 2. Assume Asia-Pacific has spare capacity over the short run and you have bought and paid for the 3
million units. You need 250,000 extra units, what price would you be willing to offer per extra unit? Explain. (Since prices are quoted to you per thousand units, do all calculations per thousand units.)
3. What price would you negotiate in case Asia-Pacific had to run the extra 250,000 units using
overtime? Assume that the firm operates only one shift and there is no spare capacity on that shift. Also, running overtime to fill your order will not affect the production schedule on regular runs in the near future.

Anklesaria Group, Inc. 2001
CASE #5 Techno, Inc.: Total Cost of Ownership
Liz Cooper sat at her desk gazing at the mounds of paper that had accumulated around her. She was the Capital Equipment buyer for Techno Inc.’s (TI) semiconductor division. The papers on her desk were all related to the responses she received to an RFP that was sent out to three of Techno’s capital equipment suppliers SeeMos, Inc., Applied Technologies and Trax Inc. A decision had been made to upgrade the Beam Tools that were used in the production of Techno’s highly successful Quasar product line. Sales had greatly exceeded initial expectations and were projected to grow rapidly over the next 5 years. The equipment that was currently being used was almost 5 years old and would not be able to sustain the expected market growth. Also this step of the production process was the one with the longest cycle time. The new machines had much faster throughput rates, which in turn would translate into increased production and sales. The RFP that was sent out to the three suppliers contained a detailed spec. Engineering had already examined the responses for functionality and were satisfied that all three suppliers met the stated requirements. It was now up to Liz to work the numbers out and determine the best option for Techno. This is where her problems began. She did not know how to proceed. She began by putting together a summary of the information she had. Her summary is below: General Information: Present Value Interest Factors @11%: • Purchase volume - 10 Machines Year 1 - 0.901 • Expected life – 5 years Year 2 - 0.812 • Techno’s cost of capital – 11% Year 3 - 0.731
Year 4 - 0.659 Year 5 - 0.593
Existing Equipment: No. of machines 10 Machine Throughput 67 units per hour Uptime 85% Current Total Annual Production 5,000,000 units Production time (maximum capacity) 24/7 (8760 hours a year) Disposal Costs $50,000 per machine Product Info (based on next year sales estimate of 9,900,000 units: Sales Price $23.50 Fixed Costs $7.25 Variable Costs $11.50 Profit $4.75

Anklesaria Group, Inc. 2001
Case Study # 5, page 2 New Equipment Product Summary (all information is per machine)
Details SeeMos, Inc Applied Technologies Trax, Inc. Model Name AC1 XRT-7 Trax 1000 Base Equipment $1,800,000 $1,300,000 $1,700,000 Discount 10% of Base Equipment cost, based on
order of 10 or more 12.5% of Base Equipment cost, based on order of 10 machines
8% of base price
Add-ons to meet TI spec: 1 Chamber $275,000 $220,000 Included Software $60,000 Included Included Drying system $25,000 $10,000 Included
Installation $25,000 $35,000 $25,000 Operating Costs Each machine would require 1.5 FTE
(Full time equivalent). The loaded cost is $100,000 per year
Each machine would require 2 FTE The loaded cost is $140,000 per year
Each machine would require 2 FTE The loaded cost is $120,000 per year
Training $7,500 for year 1 and $5,000 per year thereafter, for the life of the product.
$8,000 for year 1 and $4,000 per year thereafter, for the life of the product.
$9,000 for year 1 and $6,000 per year thereafter, for the life of the product.
Service/Maintenance $4,250 per month $5,750 per month $5,250 per month Freight to TI Included in equipment price $5,000 $7,500 Warranty 12 months parts and labor. Extended
Warranty of $200,000 for 5 years. This amount is due on delivery of the machines.
24 months parts and labor. Extended Warranty of $300,000 for 5 years. This amount is due on delivery of the machines.
24 months parts and labor. Extended Warranty of $250,000 for 5 years. This amount is due on delivery of the machines.
Delivery lead time 98 days 42 days 28 days Machine Uptime 93% 90% 90% Machine Throughput 122 units per hour 122 units per hour 120 units per hour Salvage value after 5 yrs $50,000 $50,000 $50,000

Anklesaria Group, Inc. 2001
Case Study # 5, page 3
Using the information Liz gathered, complete the following worksheets
Worksheet 1: SeeMos, Inc. - Total Cost of Ownership
Cost Element Year 0 (Now) Year 1 Year 2 Year 3 Year 4 Year 5
Acquisition Costs: Base Equip (less disc.) Additional chamber Software Drying system Freight Costs of Use: Disposal of current equip. Installation Training Operating costs Service/maintenance Extended warranty Opportunity costs (if any) End of Life Costs: Salvage value
TOTAL (sub-total of Acq costs, Cost of use, and EOL)
Present Value (enter the Present Value of each year’s total
in the appropriate box)
TCO: (Sum of all Present Values)

Anklesaria Group, Inc. 2001
Case Study # 5, page 4
Worksheet 2: Applied Technologies - Total Cost of Ownership
Cost Element Year 0 (Now) Year 1 Year 2 Year 3 Year 4 Year 5 Acquisition Costs: Base Equip (less disc.) Additional chamber Software Drying system Freight Costs of Use: Disposal of current equip. Installation Training Operating costs Service/maintenance Extended warranty Opportunity costs (if any) End of Life Costs: Salvage value
TOTAL (sub-total of Acq costs, Cost of use, and EOL)
Present Value (enter the Present Value of each year’s total
in the appropriate box)
TCO: (Sum of all Present Values)

Anklesaria Group, Inc. 2001
Case Study # 5, page 5 Worksheet 3: Trax, Inc. - Total Cost of Ownership
Cost Element Year 0 (Now) Year 1 Year 2 Year 3 Year 4 Year 5
Acquisition Costs: Base Equip (less disc.) Additional chamber Software Drying system Freight Costs of Use: Disposal of current equip. Installation Training Operating costs Service/maintenance Extended warranty Opportunity costs (if any) End of Life Costs: Salvage value
TOTAL (sub-total of Acq costs, Cost of use, and EOL)
Present Value (enter the Present Value of each year’s total
in the appropriate box)
TCO: (Sum of all Present Values)

Anklesaria Group, Inc. 2001
Case Study #5 Page 6 Questions: 1. Based on your TCO models, which supplier/s would you suggest Liz select? Explain your reasons 2. What points would you raise in your negotiations with the selected supplier?

OPTIONAL EXERCISES

Anklesaria Group, Inc. 2001
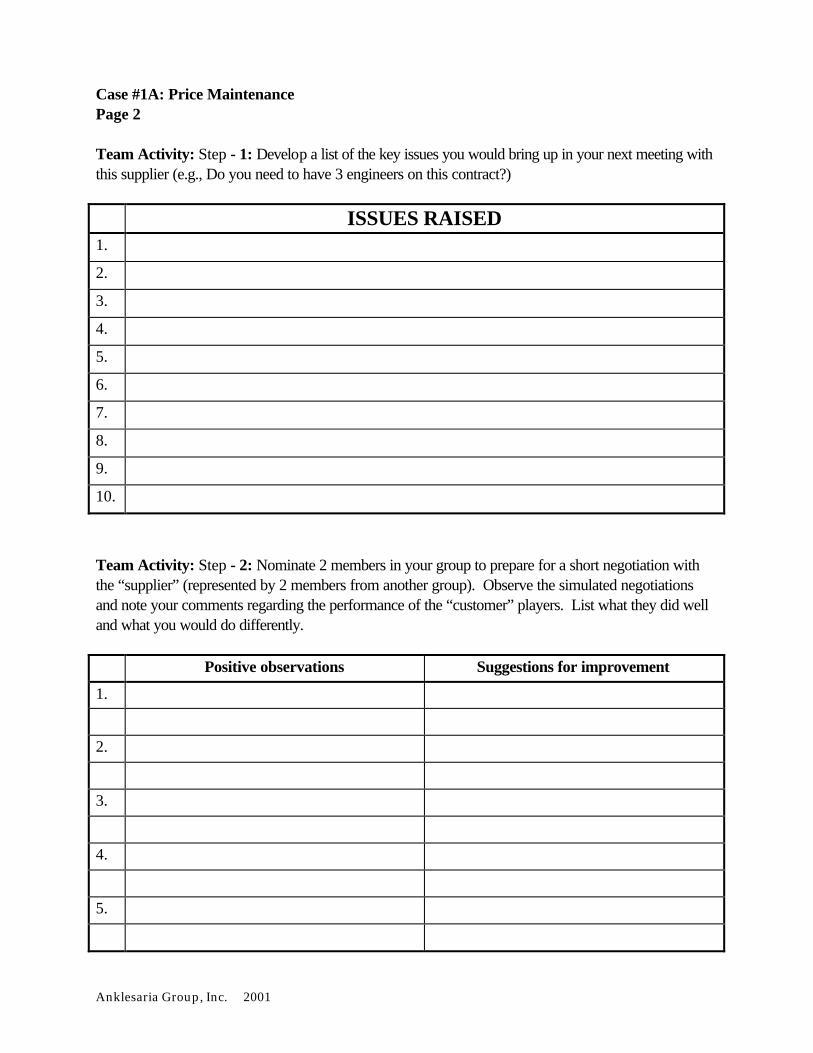
CASE #1A Price Maintenance
Three years ago you entered into a contract with Fluid Air, Inc. for the construction of a custom designed plant to manufacture Fluro dioxide. Fluro dioxide is used as a cleaning agent in the manufacture of integrated circuits (IC’s). The market for IC’s is currently exploding and is expected to continue to grow rapidly. The Fluro dioxide plant was constructed at a cost of $3.5 million and became operational a year after construction began. At that time, a 2-year maintenance contract was drawn up, whereby for a monthly fee of $60,000, Fluid Air would make sure that the plant remained fully operational. Fluid’s performance so far has met your expectations. The maintenance contract is now coming up for review. Fluid proposes to raise the maintenance fee to $65,800. You are aware that over the past two years, material prices have increased by 6% and labor rates have gone up by 10%. When reviewing Fluid’s cost breakdown for the current contract you notice that it had budgeted the labor hours for the 8 maintenance workers and 3 engineers based on routine maintenance, plus a 20% contingency factor for emergence repairs. There were no emergencies last year. Below is a comparison of the breakdowns for the current and proposed contracts.
Cost Breakdown for plant maintenance $ per month Current Proposed Raw Materials Oils, cleaners, tubing etc. 10,000.00 11,000.00 10,000.00 11,000.00 Labor: (Rates shown are current rates) 3 engineers @ $40/hr for 40 hrs. each 4,800.00 5,300.00 1 on site maintenance person @ $3,750/mth 3,750.00 4,000.00 8 maintenance workers @ $15/hr for 80 hrs. each 9,600.00 10,500.00 1 Project Coordinator 5,000.00 5,500.00 23,150.00 25,300.00 Overhead Engineering @ 300% of eng. labor 14,400.00 15,900.00 GS&A @ 25% of Materials and Labor 8,300.00 9,100.00 22,700.00 25,000.00 Profit 4,150.00 4,500.00 Monthly maintenance fee 60,000.00 65,800.00
Anklesaria Group, Inc. 2001
Case #1A: Price Maintenance Page 2 Team Activity: Step - 1: Develop a list of the key issues you would bring up in your next meeting with this supplier (e.g., Do you need to have 3 engineers on this contract?) ISSUES RAISED
1.
2.
3.
4.
5.
6.
7.
8.
9.
10.
Team Activity: Step - 2: Nominate 2 members in your group to prepare for a short negotiation with the “supplier” (represented by 2 members from another group). Observe the simulated negotiations and note your comments regarding the performance of the “customer” players. List what they did well and what you would do differently. Positive observations Suggestions for improvement
1.
2.
3.
4.
5.

Anklesaria Group, Inc. 2001
CASE #3A A Pricing Dilemma
Robin Murphy had recently joined Standard Financial, a multi-billion dollar investment-banking firm, as Senior Procurement Manager, with responsibility for Marketing and Communications (Marcom) purchases. Her commodities included, among others, a variety of printed materials including brochures, prospectuses, and annual and quarterly reports. This was a new post created to bring some supply management expertise into the department. Most Marcom purchases had traditionally been handled within the department through an informal competitive bid process. Robin was currently evaluating the contract for one Standard's prospectuses. This was a high quality 48-page document that was distributed annually to current and prospective customers. The contract had been put out to bid every year for the past three years. On every occasion, Creative Creations (CCI) had been the lowest bidder and won the contract. CCI's was headquartered in Chicago, and last year had sales of $37 million. This year the requirement was for 300,000 sets. The bids over the last 3 years were as follows: 3 years ago 2 years ago 1 year ago This year Volume 200,000 220,000 250,000 300,000 Suppliers: Creative Creations 720,000 840,000 940,000 1,250,000 Kings Printing 790,000 860,000 965,000 1,285,000 Delphi Publishing 800,000 875,000 980,000 1,320,000 Seven Hills Publishing 805,000 890,000 965,000 1,295,000 Robin first called in a favor from a former colleague, Rufus Abrams at Clone Printing. She sent Rufus a sample of the previous years prospectus. While there were several alterations in the content this year, no changes were being made to the prospectus design. After taking a look at it, Rufus indicated that it was high quality for a prospectus. The cover stock was Kromekote which, according to the catalog, cost $0.10 per sheet (the prospectus had a front and back cover). The paper stock was a high quality uncoated paper that was listed at $0.02 per sheet (the prospectus has 24 sheets). A normal yield loss of 1% was anticipated on both the cover and paper stock. Rufus also informed Robin that a job of this nature would involve an initial set-up cost. She called Susan Roby at Kings Printing to verify this. Susan confirmed that there was, indeed, a set-up cost, and mentioned that three years ago when Kings first bid on the contract, the set-up had been budgeted at $200,000. Today however that cost had increased by about 20%. This cost would have to be amortized over one year. Before approaching CCI, Robin decided to develop a cost model. The price she arrived at was significantly lower than CCI's quote. She suddenly felt that Standard had been overcharged.

Anklesaria Group, Inc. 2001
CASE #3A: A Pricing Dilemma Page 2 Use the information provided at the end of the case to complete the worksheets below and answer the questions that follows: WORKSHEET 1
Details Volume (this year) Total $ (this year) Current Quote (CCI) 300,000 Less: Set-up cost (info from Kings) 1 CCI's quote w/o setup (Prod’n Cost) 300,000 WORKSHEET 2: SHOULD COST MODEL FOR THIS YEAR’S PROSPECTUS
Cost element % Per unit ($) Total ($)
Paper (incl. yield loss)
Other Materials
Outside Services
Total Materials
Direct Labor
Factory Overhead
Cost of Goods Sold
Administrative Expenses
Selling Expenses
Other Expenses
Total Oper. & Other Exp.
Profit Before Taxes
SHOULD COST 100

Anklesaria Group, Inc. 2001
CASE #3A: A Pricing Dilemma Page 3 Questions: 1. Was Standard overcharged (gouged) in the past? If so, should Robin continue to do business with
CCI ? 2. What strategy should Robin use in negotiating the contract with CCI?

Anklesaria Group, Inc. 2001
CASE #3A: A Pricing Dilemma Page 4
Source: Printing Industries of America Financial Ratio Survey, 1998: Sheetfed Printers: Data categorized by sales volume.
Report on Operations - Sales = 100%
To 1.5MM 1.5-3MM 3-6MM 6-10MM >10MM All All
Profit Leaders
All Profit
Leaders All
Profit Leaders
All Profit
Leaders All
Profit Leaders
All Profit
Leaders Sales Value 100 100 100 100 100 100 100 100 100 100 100 100 Materials: Paper 18.38 17.54 18.83 18.33 19.85 19.81 21.41 21.93 21.90 22.34 20.01 19.92 Other mat'ls 4.04 3.87 4.80 3.98 5.15 4.82 5.86 5.55 6.11 6.18 5.17 4.85
Outside services 10.44 11.90 9.14 10.05 8.41 8.45 7.17 6.69 9.32 8.12 8.92 9.07 Total Materials 32.86 33.31 32.77 32.36 33.41 33.08 34.44 34.17 37.33 36.64 34.10 33.84 Factory Payroll 25.05 22.22 25.92 23.63 25.97 24.33 26.02 23.06 26.12 24.53 25.82 23.62 Factory Expenses 17.15 15.34 15.67 14.54 14.63 13.72 15.29 14.11 13.6 12.64 15.23 14.05 Total Factory Cost 75.06 70.87 74.36 70.53 74.01 71.13 75.75 71.34 77.05 73.81 75.15 71.51 Gross Profit 24.94 29.13 25.64 29.47 25.99 28.87 24.24 28.66 22.95 26.19 24.85 28.49 Admin & Selling Exp Admin. Exp. 13.56 10.27 12.70 12.67 10.56 9.11 8.58 7.50 7.73 6.81 10.69 9.33 Selling Exp. 6.69 5.08 9.54 8.18 10.47 8.85 10.46 9.83 10.12 9.46 9.49 8.27 Total GS&A 20.25 15.35 22.24 20.85 21.03 17.96 19.04 17.33 17.85 16.27 20.18 17.60 Interest Expense 1.16 0.68 1.45 1.11 1.65 0.99 1.44 0.43 1.26 0.61 1.41 1.75 Profit Before Tax 3.53 13.10 1.95 7.51 3.31 9.92 3.77 10.90 3.84 9.31 3.26 10.10

Anklesaria Group, Inc. 2001
CASE #4A A Temporary Solution: Developing a Price Discipline Model
You are a procurement specialist for Star Corp., a large multi-national manufacturer of Telecommunications equipment based in Torrance, CA. You have recently been given responsibility for the procurement of Administrative services for the company’s headquarters. You are currently reviewing the contract with Rossi Employment Services for supplying Star with temporary administrative personnel (excluding Executive Secretaries). Rossi has been a supplier for the past 3 years. While the company has been performing extremely well, you are concerned that it has been unreasonably increasing its prices each year. Whenever you approach Rossi’s salesperson you get the same reply; “costs have been increasing”. Rossi has been unwilling to give you any cost breakdowns despite repeated efforts on your part. You realize that you need to develop some sort of cost model to get an idea of Rossi’s costs and prepare for your meeting with the salesperson next week. Basic research has turned up the following information: a) Rossi Employment’s basic operation: Temporary Employment Services b) SIC / NAICS code: 7363 / 561320 c) Rossi’s Quote: 1998 100,000 hours @ $19/hr = $1,900,000 1999 120,000 hours @ $21/hr = $2,520,000 2000 150,000 hours @ $22/hr = $3,300,000 2001 (proposed) 160,000 hours @ $24/hr = $3,840,000 d) All individuals provided are employees of Rossi. However, these individuals do not remain on Rossi’s
payroll if there is no vacancy to fill. e) No additional investments in systems or recruiting/administrative personnel were made by Rossi during
the above period f) The latest BLS Industry Occupation Matrix indicated that Direct Labor was 94.9% of Annual Payroll.

Anklesaria Group, Inc. 2001
Case #4A: A Temporary Solution, Page 2 Source: Dun & Bradstreet Key Norms and Financial Ratios (1998): SIC Code – 7363 Help Supply Services
Item $ % Net Sales 5,552,155 100 Gross Profit 1,410,247 25.4 Net Profit After Tax 364,204 3.5 1997 Economic Census: Admin. & support & Waste Mgt. & Remed Svcs
Employment Cost Index Not Seasonally Adjusted Compensation: Total compensation Group: Administrative support, including clerical occupations Ownership: Private Industry Data: Year Qtr1 Qtr2 Qtr3 Qtr4 Ann Avg
1997 133.7 134.7 135.9 137.0
1998 138.2 139.6 140.6 141.4
1999 142.6 143.7 145.0 146.2
2000 149.0 150.6 152.3

Anklesaria Group, Inc. 2001
Case #4A: A Temporary Solution Page 3 Step 1: Percentage of Sale: Using the industry statistics provided, complete the worksheets below:
Worksheet 1: Industry Percentages
Summary of industry averages Cost Elements Industry % Rossi 1998 $
A Direct Labor
B Overhead
C Cost of Sales (A+B)
D Operating & Other Expenses
E Profit Before Tax
F PRICE (C+D+E) 100.0 $19.00
Calculate Profit Before Tax % {PBT% = Net profit after tax% / (1 – tax rate)}
7.
Calculate O & O Expenses % {100 – (COS% + PBT%)}
8.
Calculate Overhead % (COS% – DL%)
5.
= 30% Using IRS tables, determine tax rate 6.
Calculate Direct Labor as a percentage of sales (DL% * Payroll%)
3.
Using D&B ratios, calculate Cost of Sales% (Net Sales% – Gross Profit%)
4.
Using the Economic Census, Prof., Scientific and Tech. series, calculate Total Payroll as a percentage of sales (Annual Payroll / Total receipts)
2.
Using BLS IO matrix select Direct Labor items and determine Direct Labor $ as a percentage of Total Payroll
1.
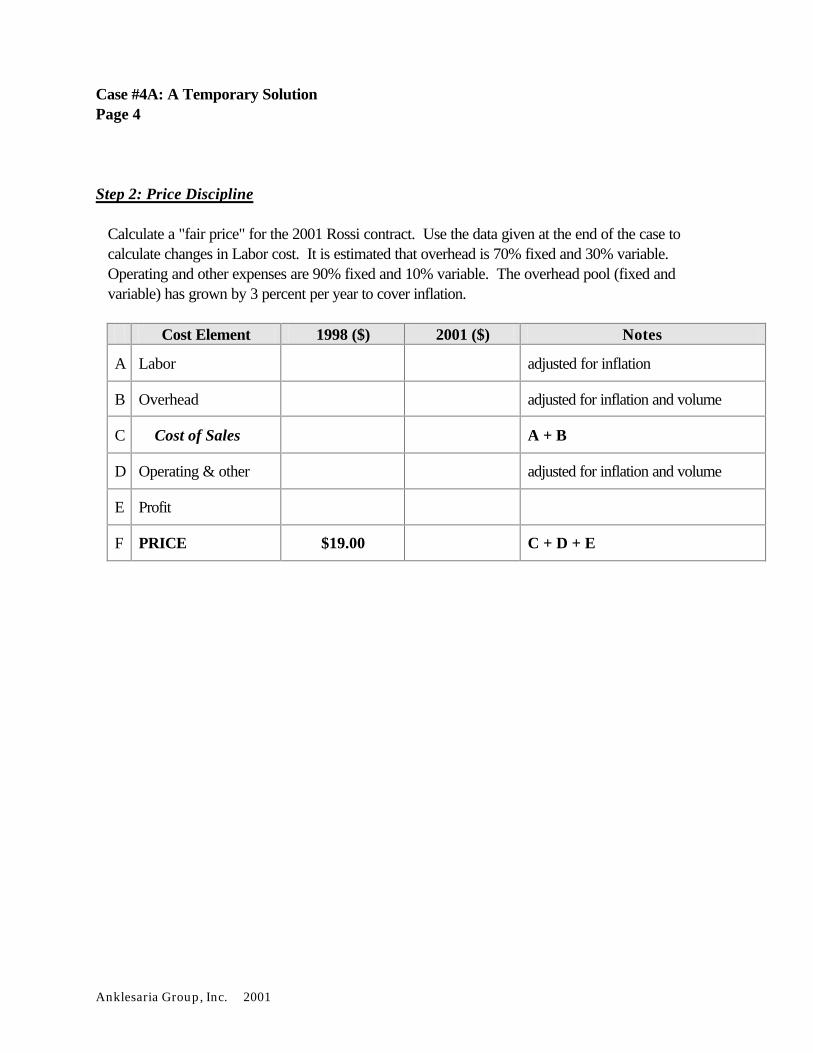
Anklesaria Group, Inc. 2001
Case #4A: A Temporary Solution Page 4
Step 2: Price Discipline
Calculate a "fair price" for the 2001 Rossi contract. Use the data given at the end of the case to calculate changes in Labor cost. It is estimated that overhead is 70% fixed and 30% variable. Operating and other expenses are 90% fixed and 10% variable. The overhead pool (fixed and variable) has grown by 3 percent per year to cover inflation.
Cost Element 1998 ($) 2001 ($) Notes
A Labor adjusted for inflation
B Overhead adjusted for inflation and volume
C Cost of Sales A + B
D Operating & other adjusted for inflation and volume
E Profit
F PRICE $19.00 C + D + E

Anklesaria Group, Inc. 2001
Case #4A: A Temporary Solution Page 5 Step 3: Using the information you now have, how will you negotiate the 2001
contract with Rossi? Step 4: Assume you have contracted for the 160,000 hours for the year 2001. There is
suddenly a need for 15,000 extra hours of help, what rate would you be willing to offer per extra hour? Explain.
Step 5: What rate would you negotiate in case Rossi had to perform the extra hours
using overtime?

APPENDIX

APPENDIX - A U.S BUREAU OF CENSUS, ECONOMIC CENSUS “The Economic Census is indispensable to understanding America's economy. It insures the accuracy of the statistics we rely on for sound economic policy and for successful business planning." --Alan Greenspan, Chairman of the Federal Reserve Board of Governors
Source: Bureau of the Census, U.S. Department of Commerce, Washington DC. Phone: (301) 457-4100 (customer service) website: www.census.gov Also available through the Anklesaria Group, Inc. website at: www.anklesaria.com Economic Census 1997: The Economic Census profiles the US economy every 5 years, from the national to the local level. Data is published primarily on the basis of the new North American Industry Classification System (NAICS). Limited data is published according to the old Standard Industrial Classification (SIC) system. Census results are available on the Internet and on CD-ROM. Only highlights are published in paper reports. However, software on both CD-ROM and the Internet include the ability to print out any of the detailed data. Data is available in a variety of series:
• Geographic Area Series (published for all sectors) provides detail for establishments with employees, for the Nation, states, and substate areas.
• Industry Series (manufacturing, mining, and construction) provides national totals for individual industries and their products, with limited data for states.
• Subject Series (all sectors) provides national and, in some cases, state data on special topics including Merchandise Line Sales, Concentration Ratios, and Establishment and Firm Size.
• ZIP Code Statistics (published for most sectors) includes counts of establishments by employment size by NAICS code for 5-digit ZIP Code.
The following are the specific series available:
Industry Series Geographic Area Series 21 Mining 42 Wholesale Trade 23 Construction 44 Retail Trade 31-33 Manufacturing 51 Information 53 Real Estate and Rental and Leasing 54 Professional, Scientific, and Technical Services 56 Administrative and Support and Waste Management and Remediation Services 61 Educational Services 62 Health Care and Social Assistance 71 Arts, Entertainment and Recreation 72 Accommodation and Foodservices 81 Other Services (exc ept Public Administration) Available in html: Table 1 (1997 by NAICS) Table 2 (1997 and 1992 by SIC) Entire report in pdf

APPENDIX - A (continued) EXTRACTS FROM CENSUS DATA FOR MISC. PLASTIC PRODUCTS (SIC CODE: 3089) MANUFACTURING SERIES

APPENDIX - A (continued) EXTRACTS FROM CENSUS DATA FOR ENGINEERING SERVICES (SIC CODE: 8711) PROFESSIONAL, SCIENTIFIC & TECH. SERVICES – GEOGRAPHIC AREA SERIES

APPENDIX - A (continued) EXTRACTS FROM CENSUS DATA FOR COMMERCIAL PRINTING (SIC CODE: 2752) MANUFACTURING SERIES

APPENDIX - B PACIFIC BELL STUDY OF OVERHEAD RATES
FACTORY OVERHEAD AS A PERCENT OF DIRECT LABOR*
Manual Semi-Automated Automated Hand Type Process Facilities Operations Operations Processes One Stage & Techniques N.C.M. Machine Multi-Stage Computer Operations Machine Systems Operations
Piece Parts 100% 175 to 200% 250 to 300%
Sheet Metal 125% 150 to 200% 250 to 350% Stamping Forming Blanking Drilling Other
Casting 125% 150 to 250% 275 to 400%
Assembly 100% 100 to 200% 225 to 400% (Apparatus)
Components - 175 to 200% 250 to 300%
Equipment 125% 175 to 225% 250 to 500%
Plastic Molding - 150 to 200% 225 to 300%
*This information is based on a study by Pacific Bell.

APPENDIX - C WAGEWEB SALARY DATA FOR ENGINEERING – NATIONAL AVERAGES Salary data as of July 1, 2000. All information is annualized (based on 2080 hours in a year) and in U.S. dollars.
http://www.wageweb.com/eng1.htm
Title # of
Companies Responding
# of Employees in Position
Mean Average Min
Salary
Mean Avg. Salary as of
06/01/00
Mean Average
Max Salary
Average Bonus Paid,
if any Eng. Lab Assistant
134 806 $16,199 $20,780 $25,544 $539
Electronics Tech
112 2,125 $19,805 $25,300 $30,920 $623
Hardware Engineer
107 790 $30,453 $39,794 $49,188 $1,261
Civil Engineer
211 3,927 $39,805 $51,154 $62,645 $1,299
Civil Engineering Supervisor
103 715 $56,594 $68,718 $80,958 $2,381
Mechanical Engineer
193 2,076 $39,1015 $50,685 $62,532 $1,573
Mech Eng Supervisor
173 772 $54,787 $66,699 $79,201 $2,074
Chemical Engineer
159 1,725 $46,732 $61,261 $75,843 $1,789
Chem Eng Supvr
136 297 $72,607 $82,277 $91,154 $2,897
Electrical Engineer
96 857 $39,989 $51,597 $63,524 $1,792
Electrical Eng Sup
84 165 $54,388 $71,027 $87,363 $3,758
VP, Engineering
207 259 $88,366 $148,799 $210,610 $14,115

APPENDIX - D INDUSTRY FINANCIAL INFORMATION PUBLICATION: ROBERT MORRIS ASSOCIATES, ANNUAL STATEMENT STUDIES Source Robert Morris Associates 1 Liberty Place, 1650 Market Street, 23rd Floor Philadelphia, PA 19103. Telephone: (800) 677-7621 Website: www.rmahq.org Description The volume is published annually. It consists of composite balance sheet and income statement information, sorted by industry 4 digit SIC codes. The data is categorized by company size (assets and sales). Information Breakdown: By asset size (0-500M, 500M-2MM, 2-10MM, 10-50MM, 100-250MM, and ALL), or by sales size (0-1MM, 1-3MM, 3-5MM, 5-10MM, 10-25MM, 25+MM and ALL). Ratio information is further broken down into three quartiles (upper or good, median or average, lower or bad). It also contains 16 financial ratios as well as 5 years of comparative historical data. Data incorporates financial information for fiscal year ends through March. PUBLICATION: DUN & BRADSTREET, KEY NORMS AND FINANCIAL RATIOS Source Dun & Bradstreet One Diamond Hill Road Murray Hill, NJ 07974 Phone: 908-665-5000 Main Switchboard Customer Service - U.S. 800-234-3867 Website: www.dnb.com Description The volume is published annually. It contains information very similar to the RMA, Annual Statement Studies. It is a better sources of data for developing Service Cost Models. Information is sorted by 4 digit SIC Code. It also provides 14-key business ratios covering the critical areas of solvency, efficiency and profitability.

APPENDIX - D (continued) SAMPLE RMA PAGE: SIC 3089 -MISC. PLASTIC PRODUCTS (SORTED BY ASSETS)
Type of Statement:Unqualified 4 62 105 38 16 19 244Reviewed 61 173 34 4 2 279Compiled 85 74 12 1 2 194
Tax Returns 10 7 29Other 68 107 71 16 15 12 298
Number of Statements 228 423 222 59 31 35 1044Assets % % % % % % %
Cash & Equivalents 6.4 5.8 4.9 4.8 5 3.2 5.7Trade Receivables - (net) 28.8 26.5 23.9 19.7 19.7 20.3 25.8
Inventory 20.8 19.9 18.1 16.2 13.1 15.5 19.1All Other Current 1.2 1.3 1.8 1.8 3.1 2 1.6
Total Current 57.2 53.5 48.7 42.5 40.9 41 52.2Fixed Assets (net) 35.6 38.4 40.1 40.2 38.9 38.5 37.9Intangibles (net) 1.8 3 5.2 9.5 12.5 13.7 4.2
All Other Non-Current 5.4 5.1 6 7.7 7.8 6.8 5.6Total 100 100 100 100 100 100 100
LiabilitiesNotes Payable-Short Term 10.4 11.5 9.7 6.6 3.8 7.2 10
Curr.Mat.-L/T/D 5.5 5.5 5.4 4.4 2.8 4.3 5.4Trade Payables 16.9 14.9 14.1 12.2 10.8 12.3 15.1
Income Taxes Payable 0.4 0.3 0.3 0.2 0.3 0.2 0.3All Other Current 8.2 7.9 6.8 7.5 8.8 9.1 8
Total Current 41.4 40.1 36.3 30.9 26.5 33.2 38.8Long Term Debt 20.9 18.9 22.7 22.9 30.6 28.4 21.4Deferred Taxes 0.3 0.8 1.2 1.1 3.1 1.2 0.9
All Other Non-Current 4.3 5.6 4.1 4.6 5.2 10.8 5.3Net Worth 33 34.6 35.7 40.5 34.7 26.5 33.6
Total Liabilities & Net Worth 100 100 100 100 100 100 100
Income DataNet Sales 100 100 100 100 100 100 100
Gross Profit 33.6 26.4 24 25.1 24.2 24.6 27.8Operating Expenses 28.7 21.1 18.1 17.6 15.3 15.9 22.2
Operating Profit 4.9 5.3 5.8 7.5 8.9 8.7 5.6All Other Expenses (net) 1.1 1.7 1.7 2.5 3.3 3.3 1.7
Profit Before Taxes 3.8 3.6 4.2 5.1 5.5 5.4 3.9
Ratios
Quick1.3
0.80 0.60
1.3 0.80 0.50
1.3 0.80 0.50
1.4 0.80 0.50
1.3 0.80 0.60
1.1 0.90 0.60
1.1 0.80 0.60
2.1 1.4 1.1
1.9 1.5 1.2
1.9 1.4 1.0
2.1 1.4 1.0
Current2.1 1.4 1.0
2.2 1.3 1.0
2.2 1.4 0.90
$50,000,000 $100,000,00
$100,000,000 $250,000,000
$250000000 and Over
AllAssets Size ->$500,000
$2,000,000$2,000,000 $10,000,00
$10,000,000 $50,000,000

APPENDIX - D (continued) SAMPLE D&B PAGE: SIC 8711 –ENGINEERING SERVICES

APPENDIX - D (continued) SAMPLE RMA PAGE: SIC 2752 -COM'L PRINTING (SORTED BY SALES)
Sales Size -> $0 $1,000,000
$1,000,000 $3,000,000
$3,000,000 $5,000,000
$5,000,000 $10,000,000
$10,000,000 $25,000,000
$25,000,000 and Over All
Type of Statement: Unqualified 1 3 7 24 51 57 143 Reviewed 2 43 43 74 61 14 237 Compiled 10 58 55 31 12 10 176
Tax Returns 11 24 5 1 2 43 Other 13 53 22 49 40 40 217
Number of Statements 37 181 132 179 164 123 816 Assets % % % % % % %
Cash & Equivalents 11.8 7.1 7.2 7.7 7.4 4.3 7.1 Trade Receivables - (net) 27.1 29.6 30.7 29.8 29.3 27.6 29.3
Inventory 8.2 8.5 9.4 9.2 10.8 10.9 9.6 All Other Current 2.1 1.2 1.8 1.1 1.9 1.6 1.5
Total Current 49.2 46.4 49.1 47.8 49.4 44.5 47.6 Fixed Assets (net) 39.4 44.7 43.4 45.3 42.3 42.2 43.5 Intangibles (net) 8.1 3.8 1.9 1.4 2.5 7.3 3.4
All Other Non-Current 3.3 5.2 5.6 5.5 5.8 6 5.5 Total 100 100 100 100 100 100 100
Liabilities Notes Payable-Short Term 12.2 8.2 7.5 7.9 7.5 7.7 8
Curr.Mat.-L/T/D 9.8 7.9 7.6 7 7.3 5.8 7.3 Trade Payables 13.1 15.4 14.5 13.6 13 13.8 14
Income Taxes Payable 0.2 0.2 0.3 0.3 0.3 0.2 0.2 All Other Current 10.7 7 7.3 7.1 8.7 8.1 7.8
Total Current 46.1 38.7 37.1 36 36.8 35.6 37.3 Long Term Debt 38 33.6 26 31.2 27.3 27.2 29.8 Deferred Taxes 0.2 0.4 1.1 1 0.8 1.2 0.8
All Other Non-Current 2.7 5 1.7 3.1 3 4.9 3.5 Net Worth 13.1 22.4 34.1 28.7 32.1 31.1 28.5
Total Liabilities & Net Worth 100 100 100 100 100 100 100
Income Data Net Sales 100 100 100 100 100 100 100
Gross Profit 53.8 40.7 34.7 29.8 29.2 25.7 33.3 Operating Expenses 48.3 37.9 31.1 25.8 24.5 19.4 29.1
Operating Profit 5.4 2.8 3.6 3.9 4.6 6.2 4.2 All Other Expenses (net) 1.5 1.8 1.5 1.5 1.4 2 1.6
Profit Before Taxes 3.9 1 2.1 2.4 3.2 4.3 2.6
Ratios
Current 2.7 1.5 0.70
1.9 1.2 0.90
2.1 1.4 1.0
1.9 1.4 1.0
2.1 1.3 1.0
1.7 1.2 1.0
1.9 1.3 1.0
Quick 2.1 1.2 0.60
1.6 1.0 0.60
1.6 1.0 0.70
1.6 1.10 0.80
1.6 1.0 0.70
1.2 0.90 0.60
1.6 1.0 0.70

APPENDIX - E PRODUCER PRICE INDEXES Source U.S. Department of Labor, Bureau of Labor Statistics Superintendent of Documents, U.S. Government Printing Office, Washington, DC 20420. Telephone (202) 275-3054 Also available through the Anklesaria Group, Inc. website: www.anklesaria.com Description The Producer Price Index is a monthly report on producer price movements including text, tables and technical notes. An annual supplement contains monthly data for the calendar year as well as annual averages. The information is useful for price trend analysis, cost modeling and benchmarking. For sample, please see next page. Contents Table 1: PPIs and percent changes by stage of processing Table 2: PPIs and percent changes for selected commodity groups by stage of processing Table 3: PPIs for selected stage-of-processing groupings, seasonally adjusted Table 4: PPIs for the net output of major industry groups Table 5: PPIs for the net output of selected industries and their products. Sorted by industry code and
by product code. Information includes (1) index base date, (2) current month, i.e., DEC, (3) previous month, i.e., NOV, (4) previous quarter, i.e., AUG, (5) one month percent change, i.e., NOV to DEC, and (6) 12 month percentage change, i.e., DEC to DEC.
Table 6: PPIs and percent changes for commodity groupings and individual items. Same information as Table 5 except it is detailed by commodity.
Table 7: PPIs by durability of product Table 8: PPIs for special commodity groupings Table 9: PPIs and percent changes for selected telephone services Table 10: PPIs for material inputs to construction industries Table 11: PPIs and percent changes for the net output of industry by stage of process Table 12: PPIs and percent changes for net material inputs to industry stage of process and final demand Table 13: Experimental price indexes and percent changes for the computer industry Notes • The index is published monthly with approximately a 3 to 4 month lag. • It is available on-line and can be accessed through the Bureau of Labor Statistics website.

APPENDIX - E (continued) SAMPLE PPI PAGE
Producer Price Index Revision-Current Series
Series Id: PCU2621#4 Industry: Paper mills Product: Uncoated free sheet Base Date: 8106 Year Jan Feb Mar Apr May Jun Jul Aug Sep Oct Nov Dec Ann 1998 137.3 136.8 137.3 135.1 134.9 134.2 133.2 132.6 128.6 127.0 124.9 123.9 132.2 1999 125.2 125.7 126.5 126.9 127.9 128.0 130.3 131.0 131.6 136.6 137.2 139.4 130.5
2000 139.7 140.8 142.8 143.6 143.5 143.7 143.2 143.3 (P)
143.1 (P)
142.3 (P)
143.3 (P)
P : Preliminary. All indexes are subject to revision four months after original publication. Series Id: PCU2796#1 Industry: Platemaking services Product: Lithographic plates Base Date: 8512 Year Jan Feb Mar Apr May Jun Jul Aug Sep Oct Nov Dec Ann 1998 113.8 113.8 113.8 113.8 113.8 113.8 113.8 113.8 113.8 113.8 113.8 113.8 113.8 1999 113.8 113.8 113.8 113.8 113.8 113.8 113.8 113.8 113.8 113.8 113.8 113.8 113.8
2000 113.8 113.8 113.8 113.8 113.8 113.8 113.8 113.8 (P)
113.8 (P)
113.8 (P)
113.8 (P)
P : Preliminary. All indexes are subject to revision four months after original publication. Series Id: PCU2893#2 Industry: Printing ink Product: Lithographic and offset ink (black and color) Base Date: 8406 Year Jan Feb Mar Apr May Jun Jul Aug Sep Oct Nov Dec Ann 1998 136.2 136.2 136.2 136.3 137.1 137.2 137.0 137.0 136.8 136.8 135.6 136.3 136.6 1999 136.0 135.4 135.2 135.0 135.0 135.0 135.0 135.0 134.9 134.9 135.0 135.0 135.1
2000 135.1 135.1 135.1 135.1 135.3 135.5 135.5 135.5 (P)
135.5 (P)
135.4 (P)
136.0 (P)
P : Preliminary. All indexes are subject to revision four months after original publication.

APPENDIX - F BUREAU OF LABOR STATISTICS Bureau of Labor Statistics, US Dept. of Labor, Room 4110, 2 Massachusetts Avenue NW, Washington DC 20212 Telephone: (202) 606-5900 Home page (URL): http://stats.bls.gov/ Also available on the Anklesaria Group, Inc. website at www.anklesaria.com The Bureau of Labor Statistics (BLS) is the principal fact finding agency for the federal government in the broad field of labor, economics and statistics. It collects, processes, analyzes and disseminates sensitive economic and statistical data to the American public, Congress, other federal agencies, state and local governments, business, and labor. Most BLS data is available on-line at the above URL. The data is presented in various form-based query applications, tables and news releases: Most Requested Series is a form-based application which allows you to quickly obtain BLS time series by selecting from lists of the most commonly requested timeseries. Selective Access is a form-based query application which allows you to selectively obtain BLS timeseries data based on search criteria you formulate and execute. News Releases are the most current news releases produced by BLS programs and surveys. Series Report is a form-based application which uses BLS timeseries identifiers as input in extracting data from each survey-specific database according to a specified set of date ranges and output options. Economy at a Glance is a table which contains current data on various economic indicators. The BLS web site also directs users to various national and international statistical agencies. The following are the other statistical sites one can access through the BLS home page: Principal Federal Statistical Agencies Census Bureau Bureau of Economic Analysis Statistics of Income National Agricultural Statistics Service Economic Research Service Energy Information Administration National Center for Health Statistics National Center for Education Statistics Bureau of Justice Statistics Bureau of Transportation Statistics
International Statistical Agencies Statistics Canada British Columbia, Canada Statistics Norway Statistics Finland Statistics Sweden EUROSTAT Statistics New Zealand Statistics Singapore IBGE - Brazil Australian Bureau of Statistics INDEC - Argentina Statistics Netherlands Office of National Statistics (UK) Institut National de la Statistique (France) Landesamt fur Datenverarbeitung (Germany) National Institute of Statistics of Italy Statistics Bureau of Japan Statistics from the OECD Spanish Statistical Office

APPENDIX - F (continued) Labor Productivity: The Bureau of Labor Statistics provides reports on Labor Productivity in the US. These reports are listed under the section “Productivity and Costs” and fall into three broad categories: • Multifactor Productivity Trends • Productivity and Cost Measures • Productivity by Industry Both annual and quarterly data are provided. Users can browse through reports, tables and matrices classified by sector and industry. Contents: Technical note Table 1: Business sector: Productivity, hourly compensation, unit labor costs and prices Table 2: Nonfarm business sector: Productivity, hourly compensation, unit labor costs and prices Table 3: Manufacturing sector: Productivity, hourly compensation and unit labor costs Table 4: Durable manufacturing sector: Productivity, hourly compensation and unit labor costs Table 5: Nondurable manufacturing sector: Productivity, hourly compensation and unit labor costs Table 6: Nonfinancial corporations: Productivity, hourly compensation, unit labor costs, unit profits and prices Sources and footnotes for tables 1-6

APPENDIX - F (continued) SAMPLE BLS PAGE - PRODUCTIVITY AND HOURLY COMPENSATION
Major Sector Productivity and Costs Index Series Id: PRS30006092 Duration: % change quarter ago, at annual rate Measure: Output Per Hour Sector: Manufacturing
Year Qtr1 Qtr2 Qtr3 Qtr4 Ann 1997 1.9 3.9 9.0 5.4 3.8 1998 5.1 5.7 8.7 5.9 6.2 1999 6.8 4.8 4.5 10.2 6.3 2000 7.9 5.7 7.3
Series Id: PRS30006152 Duration: % change quarter ago, at annual rate Measure: Real Hourly Compensation Sector: Manufacturing
Year Qtr1 Qtr2 Qtr3 Qtr4 Ann 1997 -2.1 -0.8 2.1 4.6 -0.2 1998 6.0 3.4 3.5 2.9 3.9 1999 2.8 2.5 3.2 1.7 2.9 2000 0.5 0.4 3.4

APPENDIX G OTHER SOURCES OF DATA GALE RESEARCH: Source: Gale Research, Inc. 835 Penobscot Building Detroit, MI 48226-4094 Phone: (313) 961-2242 (800) 347-GALE Fax: (313) 961-6815 Manufacturing, USA: Industry Analyses, Statistics and Leading Companies (MUSA): MUSA provides statistical information on 459 US manufacturing industries. It represents a synthesis of relevant data from various sources such as the Census of Manufactures, Annual Survey of Manufactures, County Business Patterns data series, the US Industrial outlook, the Benchmark Input-Output Accounts for the US economy and others. Data is grouped by SIC code. It also contains data on more than 2,000 products/materials; approximately 400 occupational groupings employed in manufacturing and more than 22,000 public and private companies. Data is presented in 9 tables, Trend Graphics, General Statistics, Indices of Change, Selected Ratios, Leading Companies, Materials Consumed, Product Share Details, Inputs and Outputs Table, Occupations Employed, Maps and Industry Data by State. Manufacturing Worldwide (MW): MW provides manufacturing data in much the same way as MUSA but on a worldwide scale. However, it is not as highly developed as MUSA. It contains data on 190 countries and 480 products. Data is grouped by ISIC code (International Standard Industrial Classification). Categories of information include number of establishments, employment, wages and salaries, production workers, wages to production workers, hours worked, output, value added, capital investment, investment in machinery and equipment and selected ratios. Service Industries USA: Industry Analyses, Statistics and Leading Organizations (SUSA): This is a comprehensive presentation of statistical data on the US service sector. It combines federal statistics from various sources. It contains information on 2,100 services, grouped into 151 industries. It presents data on 288 occupational categories employed by the service sector. Data is sorted by SIC code. Categories of information include number of establishments, employment, payroll, revenues, ownership, indices of change, leading companies, occupations employed by industry group, and selected ratios.

APPENDIX H INTERNATIONAL DATA SOURCES For financial statistics in over 160 countries: ICC On-line, Ltd: Field House 72 Oldfield Road Hampton, Middlesex TW12 2HQ United Kingdom Phone: 081-783-1122 Fax: 071-251-4616 For specific country statistics contact the respective government agencies responsible for the collection of industrial and economic data. Example: Statistical Data for Germany Statistisches Bundesamt Allgemeiner Auskunftsdienst 65180 Wiesbaden Phone: 06 11/75 24 05 Fax: 06 11/75 33 30 URL: http://www.statistik-bund.de The publication “Produzierendes Gewerbe” contains production and financial data similar to information provided in the Annual Survey of Manufacturers (ASM) and Robert Morris Associates, Annual Statement Studies (RMA). (See Sample that follows). You can find access to various statistical websites for the following countries at the Anklesaria Group, Inc. website: www.anklesaria.com
Americas Europe Asia/Pacific Canada Office of the EC Hong Kong, PRC Mexico Germany Indonesia Brazil UK Singapore
Argentina Ireland Japan Peru France Malaysia
Ecuador Italy South Korea Bolivia The Netherlands Taiwan
Spain Israel Switzerland Finland Australia Sweden New Zealand Austria Denmark Other Eastern European countries

APPENDIX - H (continued) SAMPLE PAGE - PRODUZIERENDES GEWERBE - SECTION 4

APPENDIX - I PRESENT VALUE INTEREST FACTOR TABLE

COURSE EVALUATION