school reform, retention policy, and student achievement ... · school reform, retention policy,...
TRANSCRIPT
School Reform, Retention Policy, and Student Achievement Gains*
Stuart Luppescu Anthony S. Bryk
Paul Deabster University of Chicago
John Q. Easton Chicago Public Schools Yeow Meng Thum University of Chicago
April 17, 1995
Abstract
This paper describes a project whose original purpose was to produce a propensity for reten- tion measure that could be used as a covariate in modeling achievement gains in the elementary schools in Chicago. Recent changes in retention policy has resulted in changes in classroom com- position where students who would have previously been made to repeat a grade are now being promoted. This may be having an effect on achievement as measured by standardized tests. Using a propensity for retention measure, we were able to match students who were retained and those who were promoted, and to compare achievement gains made by students in the two groups. In all cases, students who were promoted made larger gains than students with the same propensity for retention who were retained.
1 Background
There is extremely widespread support for retention among teachers, parents, and administrators despite the overwhelmingly negative evidence from research on its effects (House, 1989). In a review of the literature on retention Holmes found that the studies which showed positive effects of retention were usually those in relatively advantaged districts, and sometimes when the retained students received special remediation (Holmes, 1989). Grissom and Shepard concluded that retained students were 30% more likely to drop out of school, even after adjusting for achievement level and other factors (Grisson and Shepard, 1989).
Around 1987 policy was introduced in Chicago discouraging teachers from promoting solely on the basis of standardized test scores, implicitly encouraging teachers to promote more students than they had been. Previously, a specific minimum test score had been required for promotion in each grade. This was a reaction to criticism that schools had no standards and were promoting and graduating students whose competencies were low. At the same time, a seemingly contradictory
'Draft: Do not quote or cite without permission. Send requests for copies of the final report to: Stuart Luppescu, CCSR, 5835 S. Kimbark Avenue, Chicago IL 60637; or email to [email protected]
policy existed, stating that students should be viewed as individuals; decisions on promotion should be based on all information available; retention should be resorted to only if other intervention had failed and if the teacher genuinely felt that retention was the best course for the student (Easton and Storey, 1990).
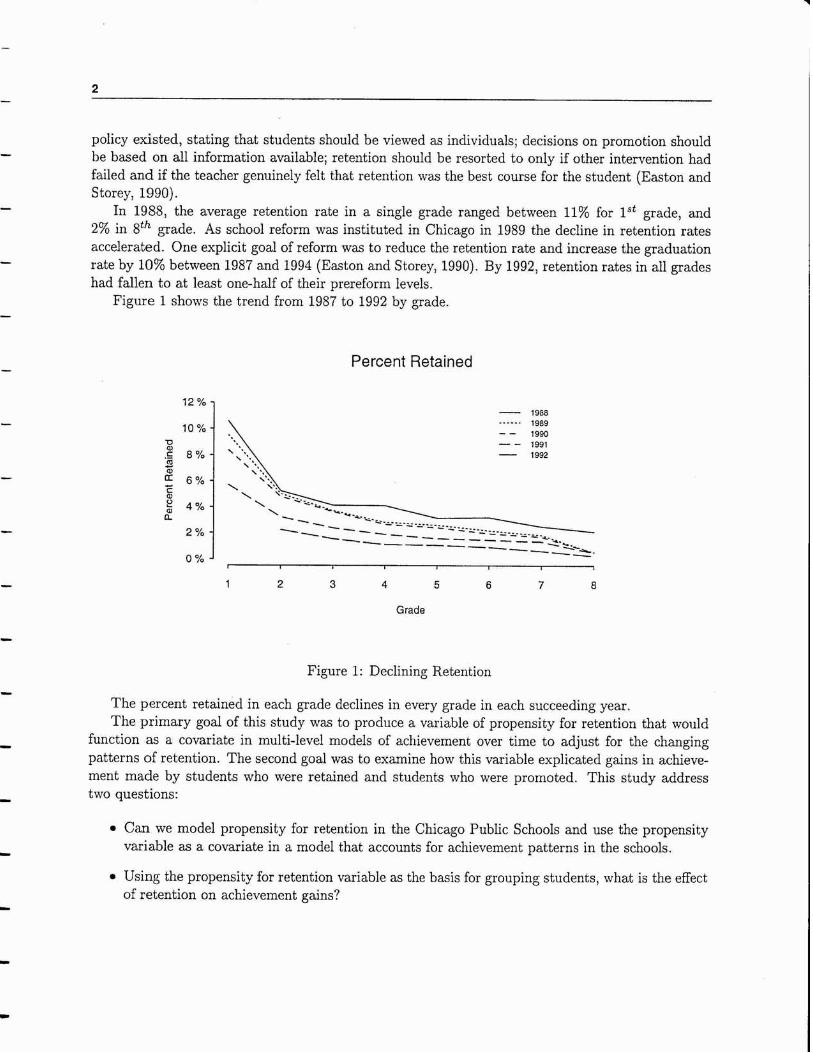
In 1988, the average retention rate in a single grade ranged between 11% for lSt grade, and 2% in 8th grade. As school reform was instituted in Chicago in 1989 the decline in retention rates accelerated. One explicit goal of reform was to reduce the retention rate and increase the graduation rate by 10% between 1987 and 1994 (Easton and Storey, 1990). By 1992, retention rates in all grades had fallen to at least one-half of their prereform levels.
Figure 1 shows the trend from 1987 to 1992 by grade.
Percent Retained
Grade
Figure 1: Declining Retention
The percent retained in each grade declines in every grade in each succeeding year. The primary goal of this study was to produce a variable of propensity for retention that would
function as a covariate in multi-level models of achievement over time to adjust for the changing patterns of retention. The second goal was to examine how this variable explicated gains in achieve- ment made by students who were retained and students who were promoted. This study address two questions:
Can we model propensity for retention in the Chicago Public Schools and use the propensity variable as a covariate in a model that accounts for achievement patterns in the schools.
Using the propensity for retention variable as the basis for grouping students, what is the effect of retention on achievement gains?
2 Design
2.1 Data
The data used in this study come from standardized tests (ITBS) given to first- through eighth-grade students in the Chicago Public Schools from 1987 to 1992. The original test item response strings were analyzed with the Rasch model giving measures of person ability along with standard errors of measurement on a linear scale. Vertical equating was achieved where possible using the overlap of items on adjacent levels of the test. Where this was not possible, common person equating was used. In addition, the forms were equated across years with common people. A total of approximately one million records of equated achievement data was thus obtained.
The larger study, of which this is a small part, seeks to model achievement gains in the schools. (See (Bryk et al., 1994) for more details on the background.) The choice to focus on gains rather than status comes from a number of considerations. Most importantly, we are interested in examining how much each student is learning in a particular school in the period of a year. This view looks at the "value-added" effect of one year of instruction on the students. This requires using only data for each student that exist for at least two time points in a single school. This fact is responsible for there not being a data point for first grade for 1992 in figure 1. Since 1992 is the last year for which we have data, there are data only at one time point for students in first grade in 1992, and it was not possible to calculate gains for these students.
2.2 Predicting Retention
In order to adjust for the changes in retention policy in our models of achievement, we need a variable measuring propensity for retention that is based on prereform retention policy. This was produced by logistic regression on 1987-1988 data with retention at the outcome (0 = promoted, 1 = retained), and a variety of academic and demographic factors as the predictors. When applied to data from subsequent years, the model produces a propensity for retention for that student if the policy had remained the same since 1987. The predictors that were significant in predicting retention in at least some of the grades were math and reading achievement, race (African American, Hispanic, or Other), sex, old-for-grade, young-for-grade, and month of birth. A separate regression was done for each grade, as the patterns of retention and promotion differ greatly across grades. All the predictors were school- and grade-mean centered. That is, the mean for the predictor for each grade in each school was subtracted from each predictor. This was done in an attempt to adjust for between school variation in the means of the predictors. For example, in a school that is 98% African American, being African American is not distinctive. Thus, the independent variable "African American" in such a school for a black student would be 1 - .98 = .02; in a school that is only 30% African American, the same predictor for a black student would be 1 - .30 = .7. This is somewhat of a crude adjustment, but is the best thing short of using a multilevel model.
The "old-for-grade" predictor was 1 if the student was more than 12 months older than the minimum age for that grade as of the start of the school year, and 0 otherwise. The "young-for- grade" predictor was 1 if the student was younger than the minimum age for that grade as of the start of the school year, and 0 otherwise. Note that the age cut off for entrance was changed from December 1 to November 1 to October 1 to September 1 between 1987 and 1990. The "young-for- grade" and "old-for-grade" variables were appropriately adjusted in computing the propensity for

4 2.3 Categorizing Students
retention in those years. The sex variable was coded 1 for boys and 2 for girls. The birth month variable is the number of months since the student reached the minimum age for the grade as of the beginning of the school year. For example, for a student whose birthday is in May, the value of "birth month" would be 4 when the school year begins in September. The variable takes integer values between 0 and 11.
2.3 Categorizing Students
Using the model described above, we were able to compute a propensity for retention for every student in the data file for the years 1988 through 1992. Using the propensity for retention measure each student in each year was then placed into one of two categories: top retention category, or not top. In the top category were those students who were in the top x% on the retention propensity measure, where x is the percent of students in that grade that were retained in 1987.
3 Analysis
3.1 What Predicts Retention?
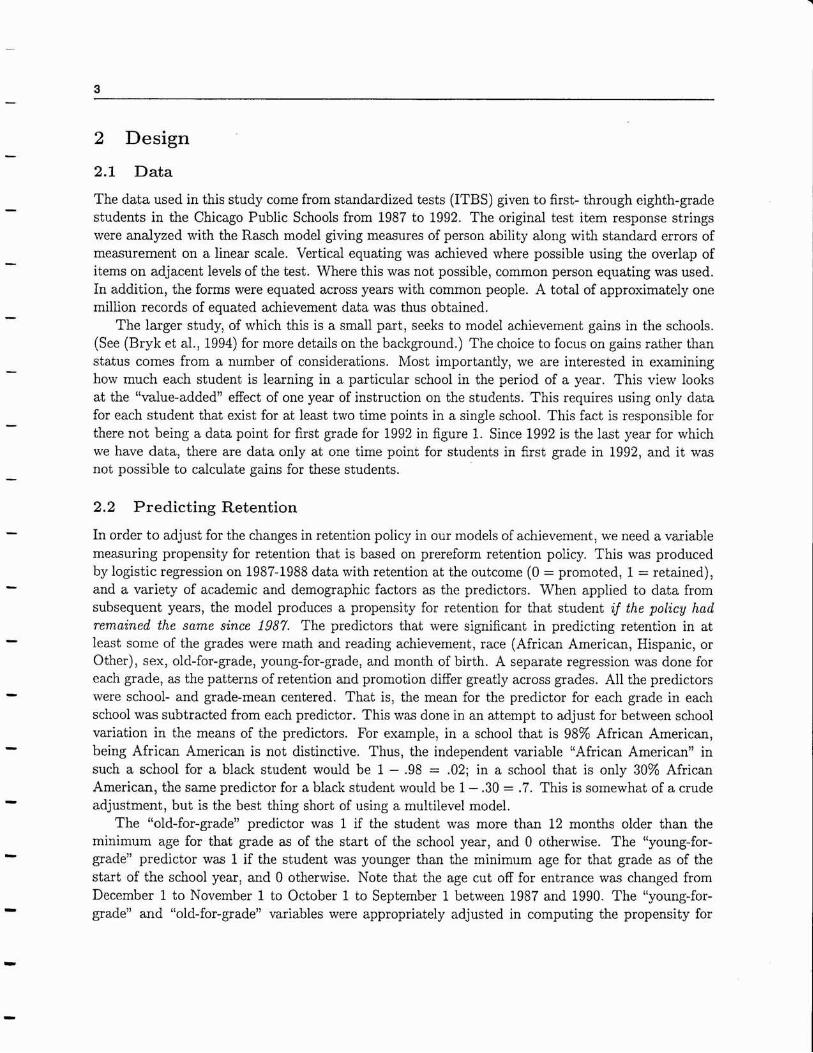
The factors that predict retention vary across grades. The following graphs show the standardized regression coefficients in the prediction equation with retention as the outcome. None of the inter- actions were significant. Nearly all the coefficients are negative; a higher value of the predictor is associated with lower propensity for retention. The only predictor that works in the opposite dir- ection is young for grade. Figure 2 plots the values of the standardized regression coefficients for achievement in the top panel, age related predictors in the middle panel, and demographic predictors in the bottom panel, for each of the grade levels.
In the lower grades, reading achievement is the strongest predictor, while in the later grades reading becomes less important and math increases in importance. It is interesting to note that, holding other factors constant, being a member of a minority reduces slightly the probability of being retained, at least in the lower grades. Being young for grade increases slightly the probability of being retained. Note that this is the only coefficient with a positive value: for all the other predictors, a positive value in the independent variable is associated with a greater probability of being retained. Being old for grade, probably resulting from already having been retained at least once, decreases probability of retention. Girls are slightly less likely to be retained. Birth month, the number of months from the student's birthday until the beginning of the school year, represents a student's relative age within the cohort. Higher values, presumably indicating greater maturity, are associated with lower probability of retention.
5 3.1 What Predicts Retention?
What Predicts Retention?
0.0
-0.2
-0.4
-0.6
V) - C .g -0.8
5 0.1
6 0.0 c 0 .- (I) V)
2' -0.2 0
d u 2 -0.4 .- E m u 6 -0.6 5
-0.8
0.0
-0.2
-0.4
Achievement
_ - - - - - - _ _ - - - - - - _ - - - , - - Young for Grade . - - . - - - - - - . _ _ . _ _ _ . _ _ _
. .----- Birth Month
\------ Old for Grade
Age
. - - - - . - - - - -+-; . - . ------ -Pew/ - 9- -- . Wlack ----------- ---_-- rspanic
Sex
Demographics
Grade
Figure 2: Regression Coefficients by Grade
6 3.2 How Well Can We Predict Retention?
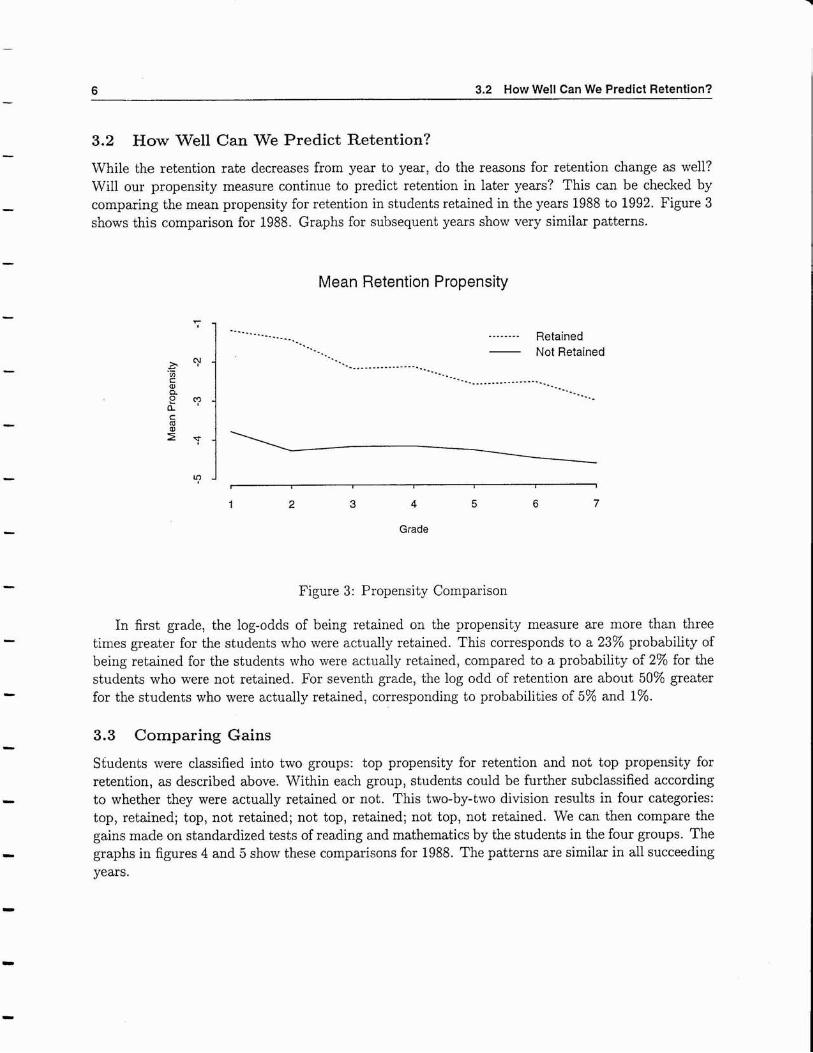
3.2 How Well Can We Predict Retention?
While the retention rate decreases from year to year, do the reasons for retention change as well? Will our propensity measure continue to predict retention in later years? This can be checked by comparing the mean propensity for retention in students retained in the years 1988 to 1992. Figure 3 shows this comparison for 1988. Graphs for subsequent years show very similar patterns.
Mean Retention Propensity
7 J #
1 2 3 4 5 6 7
Grade
7 -
z. Y - .,-. .- V) C a a 2 y - J - a
Figure 3: Propensity Comparison
--._ -.. ..__ -.-__ - - - - - - - - .--.. Retained --.. -. - Not Retained
--_.____._-.-.----..._ . _ _ - 7 . . -. .______.*~---.---...___ - - --. -. ---
In first grade, the log-odds of being retained on the propensity measure are more than three times greater for the students who were actually retained. This corresponds to a 23% probability of being retained for the students who were actually retained, compared to a probability of 2% for the students who were not retained. For seventh grade, the log odd of retention are about 50% greater for the students who were actually retained, corresponding to probabilities of 5% and 1%.
3.3 Comparing Gains
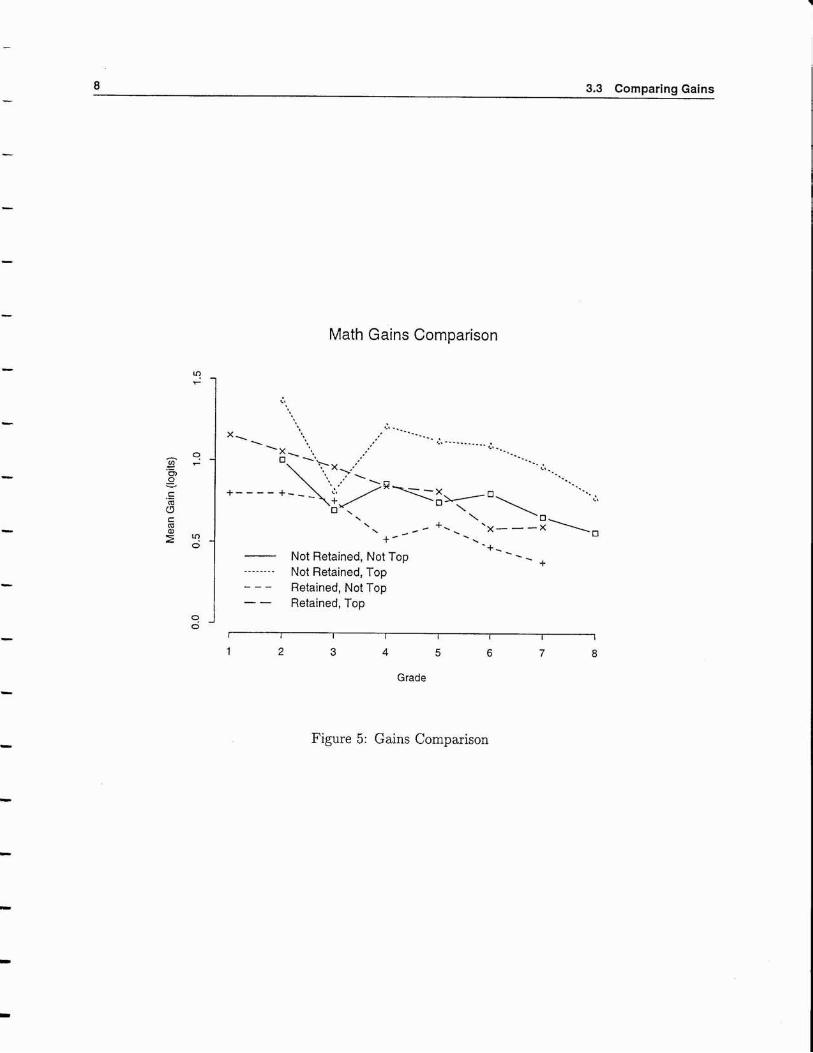
Students were classified into two groups: top propensity for retention and not top propensity for retention, as described above. Within each group, students could be further subclassified according to whether they were actually retained or not. This two-by-two division results in four categories: top, retained; top, not retained; not top, retained; not top, not retained. We can then compare the gains made on standardized tests of reading and mathematics by the students in the four groups. The graphs in figures 4 and 5 show these comparisons for 1988. The patterns are similar in all succeeding years.

7 3.3 Comparing Gains
Reading Gains Comparison
- Not Retained, Not Top - . - - - . . - Not Retained, Top - - - Retained, Not Top - - Retained. TOD
I I I I I
Grade
Figure 4: Gains Comparison
8 3.3 Comparing Gains
Math Gains Comparison
- Not Retained, Not Top +- \ . - - - - -. . - '- +
Not Retained, Top - - - Retained, Not Top - - Retained, Top
Grade
Figure 5: Gains Comparison
We show results for the students who were retained for grades 1 through 7, and for students who were not retained for grades 2 through 8. It may be appropriate to compare gains made by students repeating a grade with those made by students promoted into the next grade ("diagonal" comparison). The gains made by the group of students who were promoted can be thought of as the gains that might have been made by the retained students had they been promoted. It is also possible t o compare the gains made by students in a particular grade who have taken that grade for the first time with the students who have repeated the grade ("vertical" comparison).
4 Discussion
The graphs showing the predictors in the propensity for retention model show few surprises. Achieve- ment is the strongest predictor, with reading being more important than math in the earlier grades. Race makes very little difference and is only a significant predictor for the first three grades, but sex is significant for all grades. One surprising finding is that birth-month is a significant predictor at all grades. In examining the effects of birth month on achievement, we found a substantial connection, but only for the lower primary grades. After that, the plot of achievement versus birth month is flat. It is quite surprising that even in seventh grade, when students are in their early teens, that a difference in age of a few months makes a difference in propensity for retention.
The most important findings of this study can be seen in the comparison of gains. First of all, in almost all cases, students in the top category in propensity for retention showed higher gains than those not in the top category. This is consistent with our investigation of achievement where we found a definite negative correlation between achievement status and gain in the subsequent year.
Comparing gains made by the students who were retained with those who were not retained shows that in almost all cases, students who were retained made smaller gains than students who were promoted. The notable exception is third grade. This holds when we make "diagonal" comparisons, comparing gains made by retained and promoted students within a single cohort in the pre-year; as well as when we make "vertical" comparisons, comparing gains ~nade by students taking a particular grade for the first time with gains made by students taking that grade for the second time. The difference in gains (excluding third grade) averages about one-quarter of a logit. Since the mean gain per year is about three-quarters of a logit, this difference represents about the equivalent of about three more months of learning on the part of the students who were not retained.
The very noticeable drop in gains made by students in third grade is hard to explain, although it has been noticed before (Dean et al., 1992). It is probably at least partly attributable to the change in test format from ITBS Level 8 to ITBS Level 9. This explanation is consistent with the fact that the gains made by students who have repeated the grade, and thus are taking the Level 9 test for the second time, show no such dip. I t might also be possible to explain the drop in gains in math as due to the fact that the absolute value of the coefficient for the math achievement predictor is at its lowest point in second grade. This does not, however, explain the dip in reading, which, while not as pronounced as in math, is quite noticeable. The absolute value of the coefficient for the reading achievement predictor is at its maximum in second grade.
The original intention of this study, to produce a variable that would function as a covariate in a multi-level model, has not yet been realized. This task has turned out to be more complex than was originally imagined. The problem is that changing patterns of retention effects the composition of
both the pre-year classroom and the post-year classroom. Imagine a third grade class in which fewer students are being retained than in previous years. In this class there will be fewer (presumably) lower ability students than under the old policy; they will have been promoted out of the third grade and into the fourth grade. But at the same time, there will be other (presumably) low ability students in the third grade class who would, under the old policy, have been retained in second grade, but are now being promoted. Thus, ehanges in composition of a particular classroom due to changes in retention policy are the result of students who would have been retained under the old policy being promoted out of that class, as well as students being promoted into that class from the previous grade. We have yet to model this adequately.
5 Conclusion
If the purpose of retention is to permit students who lag behind other students the chance to catch up, these results seem to indicate the opposite effect. Students who are prornoted are making greater gains than comparable students who are retained. Rather than letting them catch up, retention results in students falling further and further behind.
References
Bryk, A., Deabster, P., Easton, J., Luppescu, S., and Thum, Y. (1994). Measuring achievement gains in the Chicago Public Schools. Education and Urban Society, 26(3):306-319.
Dean, P., Bryk, A., and Easton, J. (1992). Studying school improvement in Chicago: A construction of post-reform school index measures. Paper presented at the annual meeting of the American Educational Research Association, San Francisco.
Easton, J. Q. and Storey, S. (1990). June 1989 grade retention in Chicago public elementary schools. Technical report, Chicago Panel on Public School Policy and Finance.
Grisson, J. and Shepard, L. (1989). Repeating and dropping out of school. In Shepard, L. and Smith, M., editors, Flunking Grade: Research and Policies on Retention, pages 34-63. Falmer Press, Philadelphia.
Holmes, C. (1989). Grade level retention effects: a meta-analysis of research studies. In Shepard, L. and Smith, M., editors, Flunking Grade: Research and Policies on Retention, pages 16-33. Falmer Press, Philadelphia.
House, E. (1989). Policy implications of retention research. In Shepard, L. and Smith, M., edit- ors, Flunking Grade: Research and Policies on Retention, pages 202-213. Falmer Press, Phil- adelphia.
Shepard, L. and Smith, M., editors (1989). Flunking Grade: Research and Policies on Retention. Falmer Press, Philadelphia.