school readiness
TRANSCRIPT
Running head: School Readiness and Later Achievement DO NOT CITE OR QUOTE
2
MANUSCRIPT UNDER REVIEW - DO NOT CITE OR QUOTE
School Readiness and Later Achievement
Greg J. Duncanab, Chantelle J. Dowsettc, Jeanne Brooks-Gunnd, Amy Claessensb, Kathryn Duckworthe, Mimi Engelb, Leon Feinsteine, Aletha C. Hustonc, Crista Japelf, Pamela
Klebanovg, Katherine Magnusonh, Linda Paganif, and Holly Sextoni
aRussell Sage Foundation, bNorthwestern University, cUniversity of Texas –Austin, dColumbia University, eInstitute of Education, University of London , fUniversité de Montréal, gPrinceton University, hUniversity of Wisconsin – Madison, iCenter for the Analysis of Pathways from
Childhood to Adulthood, University of Michigan
Acknowledgements: A partial version of this paper was presented at the biennial meetings of the Society for Research on Child Development, April 10, 2005. The authors are grateful to the NSF-supported Center for the Analysis of Pathways from Childhood to Adulthood (Grant # 0322356) for research support. We would like to thank Larry Aber, Mark Appelbaum, Mark Lipsey, Arnold Sameroff, Ross Thompson, Sandra Jo Wilson, Nicholas Zill, and other members of CAPCA and the MacArthur Network on Families and the Economy for helpful comments.
Abstract Using six longitudinal data sets, we estimate the influence of two key elements of school
readiness -- kindergarten-entry academic skills and self-regulation -- on later achievement. In an effort to identify how preschool interventions focused on augmenting reading and math skills and self-regulation might influence children’s subsequent learning, our preferred regression models control for cognitive skills and self-regulation measured prior to kindergarten entry.
Our findings suggest that the strongest predictors of later learning are children's academic skills such as knowing numbers, and ordinality (the average effect size of beginning math skills was .34) and knowing letters, words and beginning and ending word sounds (the average effect size of beginning reading skills across our studies was .16). We find much less evidence that emotional self-regulation and social skills make noteworthy, independent contributions to school success. An important exception was that a child’s ability to sustain attention did predict later learning consistently, although its average effect size on later academic achievement was only .09 per standard-deviation increase in attention.
Our results suggest a surprisingly important role for pre-school mastery of math skills, the wisdom of distinguishing between cognitive and emotional self-regulation, and the power of kindergarten assessments of academic skills to predict later school success.
Running head: School Readiness and Later Achievement DO NOT CITE OR QUOTE
2
School Readiness and Later Achievement
Introduction The purpose of this monograph is to assess the comparative role of self-regulation and
academic skills acquired by the point of kindergarten entry in the development of children’s later achievement. Our approach consists of comparable analyses of six major longitudinal developmental studies: the Early Childhood Longitudinal Study – Kindergarten Cohort (ECLS-K); the National Longitudinal Survey of Youth - Child Study (NLSY); the NICHD Study of Early Child Care and Youth Development (NICHD SECCYD); the Infant Health and Development Program (IHDP); the Montreal Longitudinal-Experimental Preschool Study (MLEPS); and the 1970 British Cohort Study (BCS). The ECLS-K and the NLSY samples are representative of U.S. children; the NICHD SECCYD and the IHDP are multi-site U.S. studies; and the MLEPS and the BCS draw from samples outside of the United States.
We use these data to assess continuity and change in social and cognitive development and the interplay between these domains as they relate to school success. We measure success using teacher-reported classroom achievement, test performance, and grade retention by middle childhood, and, in the case of one of our studies, completed schooling and labor market success in early adulthood. All six data sets provide school-entry measures of academic skills as well as assessments of socio-emotional characteristics of children. Moreover, all but one provides measures of cognitive ability and self-regulation prior to the point of school entry, which are used as key control variables in our analyses.
Developmentalists often assert that cognitive and socioemotional developmental domains are interdependent. Beginning in infancy, an individual’s physical, cognitive, and socioemotional characteristics interact with the environment to set the stage for learning. For instance, a healthy, alert infant who is highly sociable is likely to elicit interactive conversation, which in turn promotes language development. Many early education interventions, including Head Start, are designed to enhance children’s physical, intellectual, and social competencies on the grounds that each domain contributes to a child’s overall developmental competence and to his/her readiness for school. These competencies correspond to the five dimensions of school readiness outlined by National Education Goals Panel in 1997: (1) health and physical development; (2) emotional well-being and social competence; (3) approaches to learning; (4) communication skills; and (5) cognition and general knowledge.
The rationale behind this definition of readiness is that a broad constellation of skills allows a child to profit from the learning environment upon school entry. On the other hand, if early acquisition of specific academic skills provides a crucial foundation for later achievement, it would be beneficial to add domain-specific early skills to the definition of school readiness and to devote a substantial portion of the preschool curriculum to teaching these skills.
These two views have emerged in current controversies about what constitutes school readiness, particularly what preschool education programs should be teaching children to prepare them for school. A 1991 survey of kindergarten teachers found that when asked to name the most

Running head: School Readiness and Later Achievement DO NOT CITE OR QUOTE
3
important determinants of readiness to learn, they most frequently mentioned the following: being physically healthy, rested, and well-nourished; being able to communicate needs, wants, and thoughts verbally; being enthusiastic and curious in approaching new activities; taking turns; and knowing how to sit still and pay attention (Lewit & Baker, 1995; National Center for Educational Statistics [NCES], 1993). Only about 10 percent of kindergarten teachers considered it important that children starting school identify letters of the alphabet or count to 20. Supporting the teachers’ position is the Neurons to Neighborhoods report of the National Research Council and Institute on Medicine, which argued that “the elements of early intervention programs that enhance social and emotional development are just as important as the components that enhance linguistic and cognitive competence” (Shonkoff & Phillips, 2000, pp. 398-99).
In contrast, President George W. Bush endorsed skill-oriented Head Start reforms in 2002, observing that “[o]n the first day of school, children need to know letters and numbers. They need a strong vocabulary...These are the building blocks of learning, and this nation must provide them.” Supporting the Bush position is a report from the National Research Council’s Committee on the Prevention of Reading Difficulties in Young Children, which argued for the importance of the acquisition of certain pre-literacy skills before kindergarten and urged that all children be provided access to early childhood environments that promote language and literacy growth (Snow, Burns & Griffin, 1998). Similarly, a recent joint position statement of the National Association for the Education of Young Children and the National Council of Teachers of Mathematics encourages high-quality mathematics education for children ages 3-6 (National Association for the Education of Young Children & National Council of Teachers of Mathematics [NAEYC & NCTM], 2002). Understanding which skills are important for children’s school success has important implications for the curricula of pre-school programs. Should they be oriented more toward teaching narrowly-defined academic skills or broader goals that include self-regulatory and social skills?
In this monograph, we draw from both economic and developmental psychology literatures to identify the components of school success and to derive theoretical predictions about how children’s academic and self-regulatory skills at school entry contribute to short- and long-term success. The economic perspective focuses on the “production” of human capabilities – how it is that some children grow up to be productive adults while other children do not (Cunha, Heckman, Lochner, & Masterov, forthcoming). We view school success as a major indicator of progress toward productive adulthood (Card, 1999). Behind this production framework are simple but appealing ideas shared by both economists and developmental psychologists about what might matter for school and adult success. Both view children’s school learning as a function of the achievement-related and the self-regulatory skills and behaviors they bring to kindergarten, but the relative contribution of different skills is unknown. This is the crux of the Head Start debate—should early interventions be concentrated on teaching specific literacy and numeracy skills, or should they emphasize self-regulatory and social skills as well?
Relations between early skills and later achievement
Economists have long emphasized the acquisition of concrete, achievement-related skills, defined by such indicators as completed schooling and test scores (Becker, 1964), but have recently recognized the potentially critical role of “non-cognitive” characteristics, (e.g., behavior
Running head: School Readiness and Later Achievement DO NOT CITE OR QUOTE
4
and attention patterns, participation in delinquent activities) as important contributors to adult success (Heckman & Rubinstein, 2001). Psychologists typically separate broad cognitive skills (e.g., memory, language, and visual-spatial abilities) from more narrowly-defined academic skills (e.g., reading and math proficiency), and they group many “non-cognitive skills” under the broad rubric “self-regulation.”
Self-regulation has been defined as the "processes by which the human psyche exercises control over its functions, states, and inner processes" (Baumeister & Vohs, 2004, p. 1). It involves the ability to evaluate the steps and actions required to meet a desired goal and to control behavior deliberately in order to reach that goal. Current theory and research on young children’s self-regulation subdivides the construct in a variety of ways, but all of them separate cognitive and emotional components (Eisenberg, Sadovsky, & Spinrad, 2005; Olson, Sameroff, Kerr, Lopez, & Wellman, 2005; Raver, 2004; Raver, Smith-Donald, Hayes, & Jones, 2005; Rhoades, Domitrovich, & Greenberg, 2005). Cognitive self-regulation includes such overlapping constructs as executive function, planning, sustaining attention, “effortful” control of attention or action, task persistence, and inhibition of impulsive responses. Emotional self-regulation is the ability to “modulate the experience and expression of positive and negative emotions” (Bridges, Denham, & Ganiban, 2004, p. 340). It includes ability to control anger, sadness, joy, and other emotional reactions, which predict such behavior as aggression and internalizing problems (e.g., social withdrawal, anxiety) (Eisenberg et al., 2005; Eisenberg, Spinrad, & Morris, 2002; Patrick, 1997).
Information about how children acquire reading and math skills points to the importance of specific academic skills at first, but indicates that more general cognitive skills, particularly oral language and conceptual ability, may be increasingly important for mastering later and more complex reading and mathematical tasks. Poor code-related skills (e.g., knowledge of graphemes, grapheme-phoneme correspondence, and phonological awareness) are the most common source of early reading difficulties, but more general oral language skills are important during the transition to conventional reading, and they are increasingly important as children make the transition from “learning to read” to “reading to learn” (i.e., reading comprehension) (NICHD Early Child Care Research Network, 2005a; Scarborough, 2001; Snow et al, 1998; Storch & Whitehurst, 2002; Whitehurst & Lonigan, 1998). Learning code-related skills occurs primarily as a result of specific instruction (Adams, Treiman, & Pressley, 1998; Tunmer & Nesdale, 1998), but children acquire oral language through everyday exposure to speech and through opportunities to interact verbally with others (NICHD Early Child Care Research Network, 2005a).
Parallel processes occur in the development of mathematical skills. Some mathematical concepts are acquired through everyday interactions, but computational skills are learned primarily through formal teaching (Baroody, 2003). Basic number skills, such as counting, predict subsequent math achievement (Aunola, Leskinen, Lerkkanen, & Nurmi, 2004; Ginsburg, Klein & Starkey, 1998; Entwisle & Alexander, 1996; Case, 1975). The requisite knowledge for later use of arithmetic strategies involves more than just identifying numbers or counting; children also need to view the number system as a dimensional concept (i.e., a mental number line; Resnick, 1989; Griffin, Case, & Siegler, 1994; Hirsh-Pasek, Golinkoff, & Eyer, 2003). Just as basic oral language skills resurface when the scope and difficulty of reading passages increase, foundational concepts of numbers allow for deeper understanding of more complex
Running head: School Readiness and Later Achievement DO NOT CITE OR QUOTE
5
mathematical problems and flexible problem solving techniques (Baroody, 2003; Ferrari & Sternberg, 1998; Hiebert & Wearne, 1996).
Cognitive self-regulation skills are consequential to children’s learning because they increase the time children are engaged and participating in academic endeavors. Among Head Start children, ability to control and sustain attention was associated with math and language skills (Raver, et al., 2005), and first grade teachers’ ratings of classroom participation and attention span predicted achievement test scores and grades throughout the early elementary grades (Alexander, Entwisle, & Dauber, 1993). Cognitive self-regulation (i.e., work-related skills, attention/persistence) is associated with later academic achievement, independent of initial cognitive ability (McClelland, Morrison, & Holmes, 2000; Yen, Konold, & McDermott, 2004), and teachers’ ratings of children’s self-regulatory abilities are related to achievement test scores, net of prior reading ability and current vocabulary (Howse, Lange, Farran, & Boyles, 2003).
Children who are skilled in emotional self-regulation— particularly managing aggression and internalizing problems (e.g., social withdrawal or anxiety) can profit from the educational experiences provided in the classroom. In the Beginning School Study, first grade ratings on items describing a cheerful, outgoing temperament (roughly the opposite of internalizing problems) predicted adult educational attainment better than preschool or first-grade achievement scores did (Entwisle, Alexander, & Olson, 2005). In contrast, disruptive and negative behavior may result in the child’s exclusion from the classroom learning environment, either by placement in a special class or expulsion.
In a recent national survey, children in pre-kindergarten programs were expelled because of their behavior at three times the rate for children in K-12 (Gilliam, 2005). Children with consistently high levels of aggression from age 2 through 9 more often had problems in achievement, attention, and peer relations in third grade (NICHD Early Child Care Research Network, 2004). Inadequate interpersonal skills (and, at the extreme, anti-social behavior) fosters child-teacher conflict and social exclusion (Parker & Asher, 1986; Newcomb, Bukowski, & Pattee, 1993). Conflict and rejection, in turn, may operate as stressors and reduce children’s participation in collaborative learning activities (Ladd, Birch, & Buhs, 1999; Pianta & Stuhlman, 2004). However, not all aggressive children fare poorly. Children who are socially skilled but also assert themselves using some aggression tend to be more popular with their peers and viewed as leaders (Stormshak, Bierman, Bruschi, Dodge, & Coie, 1999; Rodkin, Farmer, Pearl, & Van Acker, 2000; DeRosier & Thomas, 2003). This is likely because aggression and social dominance share some common characteristics (Vaughn, Vollenweider, Bost, Azira-Evans, & Snider, 2003).
Emotional and cognitive self-regulation may work in concert to influence school achievement. In one study, preschool children with high levels of prosocial behavior and low aggression in kindergarten had high levels of cognitive self-control (i.e., working toward long-term goals, staying with an activity until finished, ability to concentrate on one task), which in turn predicted first grade school achievement (Normandeau, 1998). Classroom participation (i.e., complying with teacher requests, following classroom rules and responsibilities, and independent, self-directed behavior) is a strong predictor of achievement and an important mediator of the effects of classroom behavior and peer acceptance on achievement (Ladd, et al., 1999).

Running head: School Readiness and Later Achievement DO NOT CITE OR QUOTE
6
Although problems in cognitive and emotional self-regulation often co-occur, there are strong conceptual and empirical reasons to separate them (e.g., Raver et al., 2005; Lengua, 2003). For example, “externalizing” behavior problems include both aggression, an indicator of low emotional self-regulation, and attention problems, an indicator of low cognitive self-regulation. There is mounting evidence that the associations between behavior problems, including aggression, and low achievement are accounted for by attention problems (Frick, Kamphaus, Lahey, Loeber, Christ, Hart, et. al., 1991; Barriga, Doran, Newell, Morrison, Barbetti, & Robbins, 2002).
Achievement
School achievement can be measured in a variety of ways. Test performance provides an important, independent assessment of academic achievement, but teacher ratings of children’s performance also matter because teachers see children’s everyday achievements, and they assign grades. Children’s behavior has an equal, if not greater importance for teacher-rated attainment than do prior cognitive ability (Lin, Lawrence, & Gorrell, 2003) and academic skills (NCES, 1993). Teachers’ evaluations are probably based on a broad picture of children’s accomplishments, which include their academic skills but also whether they complete assignments on time, work independently, get along with others, and show involvement in the learning agenda of the classroom.
Other important achievement-related outcomes include grade promotion, high school and post-secondary school completion and labor market success. Children with poor test scores and grades in the early years of school, and boys are more likely to be retained in grade (McCoy & Reynolds, 1999; Dauber, Alexander, & Entwisle, 1993). Among boys in a high-risk, low-income sample, low grades and physical aggression in first grade were factors associated with drop-out prior to high school completion (Ensminger & Slusarcick, 1992). Research on labor market outcomes suggests that both cognitive and self-regulation (often called “non-cognitive” in this literature) skills developed by adolescence are important predictors of earnings and occupational attainment (Jencks et al., 1979; Farkas, 2003; Bowles, Gintis, & Osborne, 2001; Caneiro & Heckman, 2003). Researchers have found, for example, that measures of aggression and withdrawal (Feinstein & Bynner, 2004), behavioural problems in high school (Cawley, Heckman & Vytlacil, 2001), and locus of control (Goldsmith, Veum & Darity, 1997) each have predictive power with respect to wages, although there is little agreement on which self-regulation skills matter the most.
Boys, racial/ethnic minorities, and children from families with low socioeconomic status are more likely than their counterparts to have problems with achievement or behavior. On average, boys get poorer grades and have more difficulties in school progress (e.g., grade retention, special education) than girls do, and these gender differences are especially pronounced among African American and low-income children. Boys also have higher frequencies of problems in cognitive self-regulation and higher average levels of externalizing problems (Entwisle et al., 2005; NICHD Early Child Care Research Network, 2004; Moffitt, Caspi, Rutter, & Silva, 2001; Raffaelli, Crockett, & Shen, 2005), and their rates of expulsion from pre-kindergarten are 5 times those for girls (Gilliam, 2005). African American children and children from low-income families enter school with lower mean academic skills, and the gap tends to increase during the school years. These groups also have higher rates of problems in
Running head: School Readiness and Later Achievement DO NOT CITE OR QUOTE
7
self-regulation and externalizing behavior (Entwisle et al., 2005; Meich & Goldsmith, 2001; Raver, 2004). African American children are twice as likely as children from other ethnic groups to be expelled from pre-kindergarten programs (Gilliam, 2005).
Opportunity for Intervention
A wealth of data shows that children’s achievement test scores are strongly related to their prior cognitive functioning and attainment of basic skills in math and literacy such as number and letter recognition (Stevenson & Newman, 1986). In their meta-analysis of early-grade longitudinal studies, La Paro and Pianta (2000) report mean correlations of .43 in academic measures from preschool to either kindergarten or first grade and .48 for academic measures between kindergarten and first or second grade. Similarly, there is evidence for longitudinal consistency of self-regulation (McClelland & Morrison, 2003; Raffaelli et al., 2005). La Paro and Pianta (2000) report mean correlations of about .30 for social/behavioral measures from preschool to either kindergarten or first grade, which are about one-third less than mean correlations for academic measures.
Continuity in early academic and self-regulatory skills is likely to reflect individual differences in ability due in part to genetic and/or neurobiological endowments (Turkheimer, Haley, Waldron, D’Onofrio & Gottesman, 2003). However, the moderate size of these correlations is also an indication of the malleability of early skills, and underscores the potential importance of proximal influences beginning very early in life such as parenting, the home environment, or experiences in settings outside the home (e.g., child care). We are especially interested in identifying cognitive and self-regulatory skills that may be learned or improved by experiences prior to school, whether these be in the family, school, or other settings. If achievement at older ages is the product of a sequential process of skill acquisition, with early skills as a prerequisite for later achievement, an intervention that targets these skills would affect the timing and possibly ultimate level of achievement. But which skills can be modified through instruction, and how do these modifications predict achievement?
A number of experiments provide encouraging evidence that specially designed intervention programs that target pre-school children “at-risk” for school failure produce cognitive and academic achievement gains and long-term reductions in referral for special education services, grade retention, school drop-out, and increases in adult educational attainment (Lazar & Darlington, 1982; Reynolds, 1994; Royce, Darlington, & Murray, 1983; Reynolds & Temple, 1998; Ramey et al., 2000; Campbell, Ramey, Pungello, Sparling, & Miller-Johnson, 2002). But, most of these programs had a broad curriculum designed to enhance cognitive and social skills, so they do not provide tests of the relative value of academically-focused and behaviorally-oriented curricula. Their more persistent effects on grade retention and special education vs. achievement test performance suggests that behavioral outcomes of the interventions may have played a role in their long-term school success (Lazar & Darlington, 1982).
The “model” programs that produced these results were small-scale and costly to implement, which limits the generalizablity of the findings. Rigorous experimental evaluations of Head Start and Early Head Start, two large-scale, national programs that serve low-income families, have recently been implemented. From its inception, Head Start has been designed to provide a comprehensive set of services to address the physical, cognitive, and socio-emotional
Running head: School Readiness and Later Achievement DO NOT CITE OR QUOTE
8
needs of children. First-grade outcomes from the Head Start National Impact Study will be measured in the spring of 2006, but early results after one year of the program show gains in pre-reading (i.e., letter identification and naming) but not math skills for 3- and 4 year-olds, and reductions in total behavior problems (particularly hyperactivity) for 3-year-olds only (U.S. Department of Health and Human Services, Administration for Children and Families, 2005). Similarly, the evaluation of Early Head Start programs shows increases in cognitive and language scores and reductions in aggressive behavior at ages 2 and 3 for children who received program services relative to their control-group counterparts (Love et al., 2003).
Given that teachers emphasize the importance of self-regulatory skills for school readiness, it might be expected that these early skills would have “crossover” effects on later achievement outcomes. There is little conclusive evidence on this issue, because most longitudinal research on children’s capabilities has been conducted within domains, linking, for example, early to later conduct disorder rather than early conduct disorder to later achievement. In order to estimate linkages between early self-regulation and later achievement, the preferred approach would involve a random-assignment intervention that is directed toward changing behavior but that also evaluates impacts on academic achievement. The key shortcoming of extant research in this area is that many programs provide a combination of services to children, so it is not possible to disentangle impacts of the self-regulation and academic components of the program. For example, the Fast Track prevention program provided a number of services to children who were identified as disruptive in kindergarten, including direct tutoring in reading skills in first grade (Conduct Problems Prevention Research Group, 1992; 2002).
Few behavioral interventions also estimate impacts on later academic outcomes. In one such study, low-achieving, socially-rejected fourth graders were assigned to an intensive social skills intervention, academic skills training or a combination of social and academic skills training (Coie & Krehbiel, 1984). Significant impacts of the social skills training were observed for reading comprehension test scores one year later, but there was no difference between treatment and control groups on either mathematics tests (computation and applications) or reading vocabulary. Dolan et al. (1993) report results from a behavioral intervention targeted at both aggressive and shy behaviors among first graders. A random-assignment evaluation showed short-run impacts on both teacher and peer reports of aggressive and shy behavior, but no crossover impacts on reading achievement.
In a third study, Tremblay and colleagues (Tremblay, Pagani-Kurtz, Mâsse, Vitaro, & Pihl, 1995) randomly assigned some of the 166 disruptive kindergarten boys in their study to a two-year treatment consisting of both school-based social skills training and home-based parent training in effective child rearing. Treatment/control differences in delinquency were evident through age 15. Although they did not test their subjects for academic skills, they did track whether the boys were placed in regular classrooms. In this case, impacts of the behavioral intervention on classroom placement were apparent until age 12, after which treatment/control differences faded. A notable limitation of these studies is that they were implemented after the children had some exposure to formal schooling, so it is unclear whether intervention in the pre-kindergarten years would produce larger effects on achievement. However, even small, temporary changes in behavior that open the door for learning might possibly set off a “multiplier” effect when rewarding experiences with classmates and school achievement improve a child’s attitude toward learning and motivation for school success (Dickens, 2005).

Running head: School Readiness and Later Achievement DO NOT CITE OR QUOTE
9
From a life-course perspective, this can have important long-term implications for social integration and economic self-reliance.
A fourth noteworthy study is the Multimodal Treatment Study of Children with ADHD (The MTA Cooperative Group, 1999), which assigned 579 children with ADHD to 14 months of medication management, intensive behavioral therapy, these two treatments combined or to standard community care. Focusing on the combined treatment condition, impacts were observed for both parent and teacher-reported ADHD symptoms, several other measures of emotional self-regulation and reading but not math test scores.
In sum, non-experimental evidence suggests that both self-regulatory skills and social skills predict achievement test scores in the early years of school, as do early academic skills. Although much of this research controls for child characteristics, it is difficult to disentangle the antecedents to individual differences in preschool. Problems of omitted variable bias may still be present. Randomized trials of intervention programs show that children can benefit from targeted direct services, but it remains unclear whether program components directed at specific academic skills and/or self-regulation skills produce impacts on school achievement. Given the increasing pressure on preschool programs to promote school readiness, it is essential to identify teachable early academic and self-regulatory skills that influence later success in school and in adulthood. The focus of this monograph is to estimate, as precisely as possible using longitudinal, non-experimental data, the impacts of early achievement and self-regulation and of increments to those skills on later academic success.
Method/Results In the following section, we give brief descriptions of the data sets involved in this study,
followed by an explanation of the common analytic plan that was implemented across studies. Detailed information about the sample, measures, and results from each study is presented next, followed by a synthesis of results and conclusions.
The Studies
The Early Childhood Longitudinal Study – Kindergarten Cohort
Longitudinal data (n~13,000) from the Early Childhood Longitudinal Study – Kindergarten Cohort were collected on a national sample of children entering kindergarten in 1998 (NCES, 2001). School readiness measures include school-entry test scores on math, reading and general knowledge as well as teacher reports of self-control, sociability, mental health, aggressive behavior, and approaches to learning. Reading and mathematics achievement are assessed in both tests and by teachers, at the end of third grade. Strengths of the ECLS-K data are its achievement tests, which were developed especially for the project, its national scope, and its sample size, which enable investigations of model differences by race/ethnicity and socioeconomic status. Its chief weakness is that it drew its sample at the beginning of kindergarten and thus lacks measurement of child ability and behavior prior to that point.
The Children of the National Longitudinal Survey of Youth
Longitudinal data (n~1,700) collected from the Maternal and Child Supplement to the National Longitudinal Study of Youth (NLSY) 1979 Cohort are also drawn from a representative national sample (Center for Human Resource Research, 2004). In this case, all women ages 14-

Running head: School Readiness and Later Achievement DO NOT CITE OR QUOTE
10
21 were sampled, and it is their children who constitute the sample children used in our analyses. School readiness measures include math and reading test scores (Peabody Individual Achievement Tests) and maternal reports of children’s behavior problems (adapted from the Achenbach Behavior Problems Checklist). Both academic achievement and behavior problems measures were collected biennially for children between the ages of 5 and 14 years of age. In addition, at age 3 or 4, children’s receptive vocabulary was assessed (PPVT) and data on key dimensions of children’s temperament (compliance and sociability) was collected. Strengths of the NLSY data are its national scope, sample size, and the longitudinal design which provide the opportunity to estimate the long-term effects of differing dimensions of school readiness with controls for key early child and family background characteristics (including a measure of mothers’ academic aptitude). Its chief weakness is that behavior problems are assessed by maternal reports, and thus may not reflect important aspects of children’s classroom behavior.
The NICHD Study of Early Child Care and Youth Development
Longitudinal data (n~1,000) from the NICHD Study of Early Child Care and Youth Development (SECCYD) are drawn from a multi-site study of births in 1991 (NICHD Early Child Care Research Network, 2005b). Among the strengths of this dataset is that all school readiness measures are assessed prior to school entry at age 4 ½. Achievement tests and attention/impulsivity tasks are administered in a controlled laboratory setting, and social skills, attention problems, aggression, and internalizing behavior is measured by teacher report in the fall of the kindergarten year. Outcomes at first, third, and fifth grade include achievement in math and reading according to teacher ratings and Woodcock-Johnson test scores. The SECCYD also includes information from infancy about children’s early environments, including child care type and quality, home environment, and parenting. A limitation of this dataset is that we are unable to test for differences by race/ethnicity because it is a predominately white sample.
The Infant Health and Development Program
Data from the Infant Health and Development Program are drawn from an eight-site medical subsample of 700 low birth weight, premature infants and their families (IHDP, 1990). School readiness measures include preschool performance and verbal test scores, parental reports of children’s mental health and aggressive behavior, and observer reports of children’s attention and task persistence. Reading and math achievement are assessed by the Woodcock-Johnson broad reading and math tests and by the WISC-III performance and verbal tests at eight years of age. Strengths of the IHDP data include its multiple administrations of achievement tests and behavioral measures, and extensive measures of the family environment (family income, maternal mental health, HOME environment. The IHDP is fairly represented by African-American and European-American families and by poor and non-poor families, thus allowing examination by racial and SES subgroups. The primary weakness of the IHDP is that it is a sample of low birth weight, premature infants and their families and has a limited sample size.
The Montreal Longitudinal-Experimental Preschool Study
The Montreal Longitudinal-Experimental Preschool Study was launched in 1997 and is composed of several sequential longitudinal cohorts of French language preschool children living in the poorest neighborhoods of Montreal, Canada. School readiness assessments include performance on individually administered number knowledge and receptive vocabulary tests
Running head: School Readiness and Later Achievement DO NOT CITE OR QUOTE
11
upon junior kindergarten (age 4, cohort 1) and senior kindergarten (age 5, cohort 2) entry. Teachers also provided assessments of their classroom social climate and children’s behavioral development, including physically aggressive, anxious, depressive, hyperactive, inattentive, and prosocial behavior. Grade three assessments include a group-administered math test, and teacher ratings of children’s academic self-regulation, French language skills, and the behavioral adjustment factors mentioned above. A strength is that the MLEPS data provide international information and therefore helps in demonstrating the similarities and differences that exist across the different cultures and social policy contexts. Other strengths of the Montreal data are its sampling of a high risk population and its focus on number skills and behavioral development. Its chief weaknesses include absence of reading achievement in grade 3 and early childhood behavioral and cognitive measures prior to junior and senior kindergarten entry.
The British 1958 Birth Cohort
Our final data set features longitudinal data (n~10,000) collected from the British 1958 Birth Cohort, a.k.a. the British Cohort Study (BCS; Bynner, Ferri, & Shepherd, 1997). School entry test measures (age 5 years) include measures of vocabulary and copying skills, as well as mother reports of externalising behaviour, internalising behaviour and attention. Reading and mathematics achievement are assessed in tests at age 10 years. Adult outcomes are performance on national qualifications and hourly wages. The data also include measures of development at ages 22 and 42 months for a 10% sub-sample of the data. Strengths of the BCS data are its national scope, sample size and longitudinality, running from birth, through ages 5 and 10 to adulthood. An important weakness in the current context is that the age 5 measures are taken when the children had already entered school, change in pre-school measures is not available and the study lacks teacher reports of behaviour or socio-emotional development at school entry.
Common Analytic Plan
The common approach taken in our analyses relates academic outcomes measured at various points beyond kindergarten to kindergarten-entry behaviors and academic skills. Taking the example of the Early Childhood Longitudinal Study - Kindergarten Cohort data, the school-entry skills and behaviors are measured in the fall of kindergarten (“FK”) while math and reading achievement are measured in the spring of third grade (“3rd”). The estimating equation is as follows:
(1) ACHi3rd = a1 + ß1 ACADiFK + ß2 SRiFK + γ1 FAMi + γ2 CHILDi + eit
where ACHi3rd is the math or reading achievement of the ith child at the end of third grade. Some of the data sets we employ assess achievement outcomes in adolescence; one has followed a sample of children long enough to gather information on labor market success in early adulthood; and two have both test-score-based and teacher reports of reading and mathematics achievement. ACADiFK is the collection of math, reading and general knowledge skills that child i has acquired at the point of entry into kindergarten, as assessed by achievement tests in the fall of the kindergarten year; SRiFK is the collection of teacher-reported cognitive and emotional self-regulation skills that child i has acquired as of the fall of the kindergarten year; FAMi and CHILDi are sets of family background and child characteristics that are likely to exert
Running head: School Readiness and Later Achievement DO NOT CITE OR QUOTE
12
enduring influences on child achievement up to and beyond the point of school entry; a1 is a constant and eit is a stochastic error term.
Our interest is in estimating ß1 and ß2, which, in the absence of omitted-variable bias and model misspecification, can be interpreted as the impact of school-entry skills and behaviors on subsequent achievement. Our principal strategy for unbiased estimation of ß1 and ß2 , adopted in analyses of all of the data sets we employ, is to estimate an equation of the form of equation (1) that includes as many prior measures of FAM and CHILD as possible. All of the data sets we use contain numerous demographic measures of both the child and the family. Of course, one can never be certain that even large numbers of demographic control variables capture all of the important dimensions of FAM and CHILD, which leaves open the possibility that this approach will still produce biased estimates of ß1 and ß2. An obvious bias of this sort would arise if scores on a kindergarten mathematics test reflected both math skills and underlying cognitive ability.
To combat these biases, all but one of our data sets provides measures of a child’s behaviors and either cognitive ability or achievement taken prior to entry into kindergarten. With these prior measures, our model becomes:
(2) ACHi3rd = a1 + ß1 ACADiFK + ß2 SRiFK + ß3 ACADiPre-K + ß4 SRiPre-K + γ1 FAMi + γ2 CHILDi + eit
There are two ways of viewing this model. First, it is an especially powerful version of equation (1) since its controls for the child’s pre-K skills provide unusual power against omitted-variable bias in estimating ß1 and ß2. Second, when the pre-K and Fall-K measures are comparable, manipulation of (2) leads to a kind of change model in which early increments to achievement and behavior are related to subsequent achievement, controlling for baseline levels of achievement and behavior:
(3) ACHi3rd = b1 + δ1 ΔACADi + δ2ΔSRi + δ3 ACADiPre-K + δ4 SRiPre-K + γ1 FAMi + γ2 CHILDi + ηit
with “Δ” indicating a simple difference between pre-K and the beginning of kindergarten. Algebraic manipulation shows that the δ1 and δ2 parameters in (3) are identical to the ß1 and ß2 parameters of equation (2). Expressing our model as (3) shows that the thought experiment we seek to approximate with our regression analysis is to estimate the impact on subsequent learning and school achievement of an effective randomly-assigned academic or behavioral intervention around the point of entry into kindergarten. If the intervention improves the achievement or behavior of the treatment group relative to the control group at the point of kindergarten entry, do these gains translate into more learning or higher achievement years later? Lacking experimental manipulation of these skills and behaviors, we rely on longitudinal models for estimating these impacts.
Third Grade Achievement in the Early Childhood Longitudinal Study – Kindergarten Cohort Sample
The ECLS-K follows a nationally representative sample of 21,260 children who were in kindergarten in 1998-99. The study intends to collect five waves of data at the following time points: fall of kindergarten and spring of kindergarten, first, third and fifth grades. All but the
Running head: School Readiness and Later Achievement DO NOT CITE OR QUOTE
13
fifth grade data were available to us. Data are collected from multiple sources, including direct achievement tests of children, interviews with parents and surveys of teachers and school administrators (NCES, 2001).
Achievement tests were administered in the fall of kindergarten and in the spring of kindergarten, first and third grades. We use teacher reports of children’s self-regulatory behaviors – self-control, interpersonal skills, externalizing and internalizing behavior problems and a rating of the students’ approaches to learning -- collected in the fall and spring of kindergarten.1 Although baseline data were collected from over 21,000 children, missing data reduced our analysis samples to between 10,000 and 12,000 cases. Students were excluded from the analysis if their data were missing test scores from the fall of kindergarten or the spring of third grade or if they were missing data on gender. We also excluded cases that were missing two or more of the teacher self-regulatory rating scales. The vast majority of our missing data, however, is due to missing test scores -- there are a total of 17,622 reading IRT scores in the fall of kindergarten, and 14,280 reading IRT scores in the spring of third grade.
The battery of achievement tests given as part of the ECLS-K kindergarten and first grade assessments covered three subject areas: language and literacy, mathematical thinking, and general knowledge. The children pointed to answers or gave verbal responses and were not asked to write or explain their reasoning. The tests were administered using a computer-assisted interviewing methodology. The achievement test scores used in our analyses are IRT (item response theory) scores that are included in the ECLS-K data. Reliabilities reported for the overall IRT scores in reading and mathematics for all three grades are over .9.
In third grade, the achievement tests included mathematics, reading and science. We use IRT scores for the first two of these as key dependent variables. These third grade assessments required students to complete workbooks and open-ended mathematics problems. Reading passages and questions were provided to children so that they could reference the passages when answering questions. However, all questions were read to the students. In math, all answer choices were read to the students; in reading, the students read the answer options.
Measures
Dependent Variables
Our key dependent variables consist of third grade achievement test scores, teacher reports of student achievement in reading and mathematics and grade retention. In the case of reading test scores, we constructed composites using only the two most advanced IRT subscales – extrapolation/homonyms and evaluation – of the ECLS-K’s reading test. For third-grade mathematics, we used only the three most advanced subscales – multiplication and division, place value, and rate and measurement. Descriptive statistics for these measures are shown in Table 1.
The ECLS-K also asked third grade teachers to complete academic rating scales (ARS) on student reading and mathematics achievement. In the case of the reading achievement score, we combined teacher ratings of proficiency in expressing ideas, use of strategies to gain information, reading on grade level, and writing. This scale has a reported reliability of .95. A teacher report of students’ math achievement was based on ratings of student mastery of number
Running head: School Readiness and Later Achievement DO NOT CITE OR QUOTE
14
concepts, data analysis, measurement, operations, geometry, application of mathematical strategies and creating and extending patterns. This scale has a reported reliability of .94.
To examine shorter-run links between school entry skills and achievement, we also estimate models using as dependent variables test scores and teacher reports measured at the end of first grade. In contrast with the third-grade scores, the variability in first grade scores across subscales overlapped substantially with kindergarten scores. Accordingly, we opted to use the overall first-grade reading and mathematics IRT scores included in the ECLS-K. The first grade achievement test included five reading and five mathematics proficiency levels2 that reflect a progression of skills and knowledge such that if a child has mastered a higher level, she is likely to have mastered the items in the earlier levels as well. For example, an early skill area would be identifying upper- and lower- case letters of the alphabet, and a later skill area would be reading words in context. Similarly, in mathematics, an early skill area on the first grade test is identifying one-digit numerals and recognizing geometric shapes. A later skill area is multiplication and division.
Finally, to estimate the relationship between school entry skills and short-term school outcomes, we estimate a logistic regression model using grade retention as the dependent variable. The grade retention variable is a dummy variable indicating whether a child was retained between the fall of kindergarten and third grade.
Key Independent Variables
Our key independent variables of interest include achievement test scores and teacher reports of self-regulatory behaviors, all measured in the fall of kindergarten. For reading, our fall kindergarten composite includes subscales for letter recognition, beginning sounds and ending sounds. For mathematics, our composite includes the components of counting up to 10, recognizing numbers and shapes; counting beyond 10, relative size and patterns; and ordinality, sequence and simple word problems. It is important to note that there is no overlap in the subscales used to construct fall-kindergarten and third-grade achievement. This is in keeping with our desire to understand the building blocks of subsequent achievement. “Continuity” is not at work here, since the rudimentary reading and math skills in the kindergarten measures are completely distinct from the more advanced skills assessed in the third grade data. Descriptive statistics on this and other fall-kindergarten variables are presented in Table 1.The measures of self-regulation were all constructed by ECLS-K staff from teacher responses to a self-administered questionnaire from the fall of kindergarten.3 The items in all five measures are measured on a scale of 1 “never” to 4 “very often”. The measure of self-control is constructed from four items that indicate a child’s ability to control behavior by respecting the property rights of others, controlling temper, accepting peer ideas for group activities and responding appropriately to pressure from peers. The scale has a reported reliability of .79 in the fall of kindergarten.
The five items that comprise the measure of interpersonal skills rate a child’s skill in forming and maintaining friendships, getting along with people who are different, comforting or helping other children, expressing feelings, ideas and opinions in positive ways, and showing sensitivity to the feelings of others. The reliability for interpersonal skills in the fall of kindergarten is .89.

Running head: School Readiness and Later Achievement DO NOT CITE OR QUOTE
15
The measure of externalizing problem behaviors consists of five items that rate the frequency with which a child argues, fights, gets angry, acts impulsively, and disturbs ongoing activities. The four items that make up the measure of internalizing behaviors ask about the apparent presence of anxiety loneliness, low self-esteem, and sadness. The reliabilities for externalizing and internalizing problem behaviors are .90 and .80, respectively.
The approaches to learning scale includes six items that measure the child’s attentiveness, task persistence, eagerness to learn, learning independence, flexibility and organization. This measure has a reliability of .89 in the fall of kindergarten.
Our final fall-kindergarten achievement measure is an IRT score on a general knowledge test. The general knowledge test subject matter was too diverse to be divided into proficiency levels, thus only a single overall IRT score is available in the data set. The test assessed knowledge of science and social studies material. It evaluated children’s conception and understanding of the social, physical, and natural world and their ability to draw inferences and comprehend implications. It also measured children’s skills in establishing relationships between and among objects, events, or people and to make inferences and comprehend the implications of verbal and pictorial concepts. While the ECLS-K data does not include a specific measure of cognitive ability, it is possible that the general knowledge test at least partially captures it. The reliability of the general knowledge test for this sample in the fall of kindergarten was .88.
Our change models relate third grade achievement to achievement and self-regulation measured in both the spring and fall of kindergarten. Apart from the timing of the measurement, the spring-kindergarten measures are identical to the ones just described.
[Insert Table 1 about here]
Covariates
In addition to the independent variables described above, we include an extensive list of child and family control variables in most of our models. A list of these variables and descriptive statistics for them can be found in Appendix A.
Results
Correlations
Correlations among the various skill and behavior measures taken at the beginning of kindergarten and the end of first and third grades are shown in Table 2. The first two columns preview some of our regression results by showing stronger fall-K to third grade correlations for math (r=.68) than reading (r=.56) test scores, and a stronger correlation between initial math and third grade reading test scores (r=.61) than between initial reading and third grade math (r=.53). Kindergarten-entry general knowledge test scores have substantial correlations with both third grade math and reading scores. Surprisingly, kindergarten general knowledge scores have higher associations with reading scores at the end of third than first grade. The correlation between third-grade teacher report and test-score-based measures of reading achievement is only .58 and is slightly less – .54 – for mathematics achievement.
With the exception of approaches to learning, the absolute value of the correlations between third grade test scores and teacher-rated school-entry self-regulatory behaviors average

Running head: School Readiness and Later Achievement DO NOT CITE OR QUOTE
16
.17, and none are higher than .22. In contrast, the approaches to learning index correlates with third grade test and teacher-report achievement between .27 and .35.
[Insert Table 2 about here]
Basic Models Table 3 shows estimates of the various forms of the reading and math achievement
models, as measured by test scores and teacher reports, represented by equation (1). All variables have been standardized by full-sample standard deviations so that coefficients are comparable with one another and with the correlations presented in Table 2. Bear in mind that higher scores on internalizing and externalizing behavior problems indicate more problems and are expected to produce negative coefficients in these regressions.
We estimate two models for each of our dependent variables. In the first, only the fall-kindergarten achievement and self-regulation scores are included. For these models, standard errors are adjusted using Huber-White methods to account for the lack of independence caused by classroom clustering of sample students (White, 1980). In the second set of models, the full set of child and family controls listed in Appendix A are included. Since the ECLS-K sample was clustered by classroom, and the same teachers often rated more than one child, we also control in these second models for teacher fixed effects. In essence, this amounts to including dummy variables for individual teachers.
Beginning math, reading, and general knowledge scores are highly predictive of subsequent reading achievement, although general knowledge is less predictive of teacher reports. Kindergarten general knowledge and, especially, math scores are highly predictive of third grade math scores. Early reading skills are barely predictive of subsequent math achievement, with a standardized coefficient of .05 in the model with full controls. Kindergarten reading skills are somewhat more important predictors of teacher reports of both reading and math proficiency, but in both cases early math achievement is much more predictive of these outcomes. With the exception of approaches to learning, kindergarten self-regulatory behaviors are not associated with teacher reported proficiencies in math or reading.
Focusing on the coefficients on the self-regulatory behaviors in Table 3, we see that, with the exception of approaches to learning, in no case are standard deviation increments associated with more than a .02 standard-deviation increase in test scores once control variables are added and none of these coefficients are statistically significant. In contrast, the kindergarten teachers’ assessment of students’ approaches to learning are significant predictors of both reading and math achievement with respective standardized coefficients of .04 and .10. Approaches to learning is an even more powerful predictor of teacher reports of student achievement, with effects of .14 and .12 on reading and math, respectively, in the full-control models.
Turning to the results for grade retention, we see that beginning reading and math scores are also significant predictors of grade retention, with math having a slightly larger effect than reading. Students one standard deviation above the mean math score in the fall of kindergarten are almost 2 percentage points less likely to have been retained by third grade. Consistent with our achievement results, the only self-regulatory behavior that is a significant predictor of grade retention is approaches to learning.
Table 4 presents the same results as those seen in Table 3, but with first grade test scores

Running head: School Readiness and Later Achievement DO NOT CITE OR QUOTE
17
and teacher reports as outcomes rather than third grade. The coefficient on early reading skills in the reading achievement regression is now much larger (.40), reflecting the utility of early reading skills such as letter recognition and mastery of beginning and ending word sounds for first-grade skills such as understanding words by sight and in context. In the case of self-regulatory behaviors, the results are very similar to those shown in Table 3, again, with the exception of approached to learning, no self-regulatory behavior produces consistently significant coefficient.
[Insert Table 3 about here]
We also ran regressions estimating the change model in equation (2). Recall that in the presence of beginning-of-kindergarten controls, the coefficients on the end-of-kindergarten measures can be interpreted as the effect of skill changes over the course of kindergarten. Coefficients on the end-of-kindergarten measures are generally consistent with those from the level models (results not shown). Among the self-regulatory behaviors, only changes in approaches to learning are predictive of third grade achievement with a standardized coefficient of .06 in the reading achievement model and .10 for math achievement. Among the achievement test scores, gains in reading over the course of kindergarten are not more predictive of eventual reading achievement than had been the case in the earlier models (.13 standardized coefficient). Cross-kindergarten gains in math and general knowledge are consistently predictive of subsequent reading and math achievement.
[Insert Table 4 about here]
Improving basic academic and self regulatory skills may matter the most for children with very low levels of these skills. To test for this possibility, we estimated piecewise linear (spline) functions allowing for different coefficients for children in the bottom one-third of the academic and behavioral scales and children in the top two-thirds (results not shown). The results from these analyses show few significant non-linear effects. While there is some evidence that early math skills have a non-linear effect on later math and reading achievement, there is no evidence that other measures of early achievement or behavior have non-linear relationships with the outcomes.
Subgroup models
While most self-regulatory behaviors appear relatively unimportant in regards to achievement for all children taken together, perhaps there are subgroups of children defined by ethnicity, SES or gender for whom the results are different. We estimated level models for black and Latino children; as well as for boys, girls and children in low- and high-SES families (Table 5 includes third grade reading and math achievement). We define low SES as being in the bottom 25% of the weighted distribution on the ECLS-K’s SES composite and high SES as being in the top 25% of that distribution. We do not rescale any of the variables in these regressions. Thus, all are standardized according to full-sample standard deviations, with estimated coefficients reflecting fractions of whole-sample standard deviation changes in a given dependent variable associated with a whole-sample standard deviation change in a given independent variable.
Coefficients on the kindergarten test score variables are generally consistent across subgroups. A notable exception is that beginning-kindergarten reading skills appear to matter
Running head: School Readiness and Later Achievement DO NOT CITE OR QUOTE
18
more for black than for other children. Beginning-kindergarten math achievement and general knowledge are consistently predictive of subsequent math and reading achievement, particularly for the overlapping groups of black and low-SES children. Turning to the self-regulatory behaviors, only in the case of approaches to learning is a given measure predictive of both reading and math achievement for more than one of the subgroups.
[Insert Table 5 about here]
Age 13/14 Achievement in the Children of the National Longitudinal Survey of Youth Sample
The National Longitudinal Survey of Youth is a multi-stage stratified random sample of 12,686 individuals aged fourteen to twenty-one in 1979 (Center for Human Resource Research, 2004). Black, Hispanic, and low-income youth were over-represented in the sample. Annual (through 1994) and biennial (between 1994 and 2000) interviews with sample members, and very low cumulative attrition in the study, contribute to the quality of the study’s data.
Beginning in 1986, the children born to NLSY female participants were tracked through biennial mother interview supplements and direct child assessments. Given the nature of the sample, it is important to note that early cohorts of the child sample were born disproportionately to young mothers. With each additional cohort the children become more representative of all children, and NLSY children younger than age 14 in 2000 share many demographic characteristics of their broader set of age mates.
The sample used in the present analysis consists of 1,762 children whose academic achievement was tracked from age 7/8 to age 13/14 and whose achievement and self-regulatory behavior was assessed at age 5/6. Consequently, our sample is comprised of children who were age 5 or 6 in 1986, 1988, 1990 or 1992. The age 13/14 achievement and behavior of these children were assessed in the respective 1994, 1996, 1998 and 2000 interviews.
Measures
Dependent variables
As summarized in Table 6, the dependent variables include tests of academic achievement (reading and math) assessed during middle childhood (age 7/8) and adolescence (age 13/14). Academic achievement was assessed by the Peabody Individual Achievement Tests (PIAT, reading recognition and math). Children were eligible for the PIAT tests if they were older than 5 years of age. Descriptive statistics for the nationally standardized reading and math achievement tests are presented in Table 6. For the purposes of analysis, scores are standardized to have a mean of 0 and standard deviation of 1.
Interviewers verbally administered the PIATs. Children were first given an age appropriate item, and a basal score was established when a child answered five consecutive questions correctly. Once a basal was established, interviewers continued to ask the child questions until the child answered 5 out of 7 consecutive items incorrectly. Subtracting the number of incorrect scores between the basal and the ceiling score from the ceiling score produced a raw test score.
Running head: School Readiness and Later Achievement DO NOT CITE OR QUOTE
19
The reading recognition test consists of 84 items that measure word recognition and pronunciation ability. It tests children’s skills at matching letters, naming names, and reading single words out loud. Dunn and Markwardt (1970) reported the one-month temporal reliability of a national sample, and the test-retest correlations ranged from a low of .81 for kindergarteners to a high of .94 for third grade students. Overall the test had an average temporal reliability of .89. Studies of the tests concurrent validity find that the test was moderately correlated with other tests of intelligence (e.g.,Wechsler Intelligence Scale for Children-Revised) and reading vocabulary (e.g., Metropolitan Achievement Test) (Davenport, 1976; Wikoff, 1978).
The math subscale consists of 84 multiple-choice items designed to measure mathematic concepts taught in mainstream classrooms. The problems were designed so that children are required to apply math concepts to questions rather than conduct increasingly complicated computations. The test starts with basic skills such as number recognition and counting. The test increases in difficulty to problems involving division, multiplication, and fractions. The most difficult questions involve advanced concepts from algebra and geometry. Dunn & and Markwardt (1970) reported one-month test-retest reliabilities from a national sample. The reliabilities ranged from a low of .52 for kindergarteners to a high of .84 for high school seniors. On average the test-retest reliability was .74. Studies of the PIAT math test’s concurrent validity found that the test correlated moderately with other tests of intelligence and math achievement (Davenport, 1976; Wikoff, 1978).
Grade retention is determined by mothers’ responses to questions that asked whether her child was retained. The exact wording of the questions differed slightly from year to year. For example, in 1988 mothers were asked if their child had repeated any grade whereas in 1994 mothers’ were asked which, if any, grade their child had repeated and then asked to specify which grade. By combining mothers’ responses across the available waves of data, an indicator of whether a child had ever been retained by age 13/14 was created. About 20% of the children were reported by their mothers to have been retained at least once by the time of their age 13/14 assessment.
[Insert Table 6 about here]
Key Independent Variables
Children’s early academic skills (age 5/6) are measured by standardized PIAT reading recognition and math scores. Self-regulatory skills were assessed by mothers’ responses to 28 items that asked how true statements were about a child’s behavior problems during the past 3 months. These questions were created specifically for the NLSY, and consist of items derived from the Achenbach Behavior Problems Checklist as well as other established measures (Baker et al., 1993). The single item questions were recoded so that a response of “not true” corresponded to a score of 0, and “sometimes true” and “often” corresponded to a score of 1.
Six subscales were created by the NLSY staff based on a factor analysis of the items. The process for creating these subscales and the reliability of each is reported in Baker, Keck, Mott, and Quilan (1993). Five of the 6 behavior problem subscales are used in this study—hyperactivity, head strong, antisocial, peer problems, and anxious/depressed.4 The sample average, minima and maxima of the raw scores for each subscale are reported in Table 6.

Running head: School Readiness and Later Achievement DO NOT CITE OR QUOTE
20
However, for the purposes of the analyses, the raw scores are translated into standardized scores with a mean of 0, and standard deviation of 1. The subscales correlate moderately, with correlations between scales ranging from .38 to .56 (Table 7).
The hyperactivity scale is comprised of 5 items that ask about the following child behaviors: being restless and overactive, having difficulty concentrating or paying attention, being easily confused or in a fog, and having trouble with obsessions. The NLSY reports that this subscale has adequate reliability (α =.69).
The headstrong subscale is also comprised of 5 items. Interviewers ask mothers about the following types of child behavior: being high strung, tense or nervous, arguing too much, being disobedient at home, being stubborn, sullen or irritable, and having a strong temper and losing it easily. The reliability of the headstrong subscale is reported to be adequate (alpha of .71).
The antisocial subscale is created from 6 items that measure whether the child cheats or tells lies, bullies or is cruel to others, does not feel sorry after misbehaving, breaks things deliberately, is disobedient at school, and has trouble getting along with teachers. The anti-social subscale has adequate reliability (α =.67).
The anxious/depressed scale consists of 5 items that indicate how often the child: has sudden changes in mood or feeling, feels or complains that no one loves him/her, is too fearful or anxious, feels worthless or inferior, and is unhappy, sad or depressed. The reliability of this scale is also adequate (α =.65).
Finally, the peer conflict scale is comprised of only 3 items. These include questions about how frequently the child is withdrawn and not involved with others, is not liked by other children, and has trouble getting along with others. The smaller number of items results in a somewhat lower level of reliability for this subscale (α =.57).
Covariates
To alleviate concerns that associations between children’s behavior and achievement may be the result of omitted variable biases, the analyses include measures of children’s temperament and achievement in early childhood. In addition, a rich set of child and mother characteristics and early family environments are included in analyses as covariates. Missing data on all covariates is handled by including a set of missing data dummy variables.5
Maternal and interviewer reports of 2 relevant dimensions of children’s temperament, sociability and compliance, are available for children at age 3 or 4.6 The compliance measure was created by summing maternal ratings of the frequency of children’s behavior on a five-point scale from almost never (1) to almost always (5). Taken together, the seven items capture how well the child follows directions. For example, questions include how often “the child obeys when told to go to bed” and “turns off the TV when asked.” This measure has adequate reliability, with NLSY reporting the alpha of .59 for children of all ages (Baker et al., 1993). Descriptive statistics for the temperament measures are presented in Table 6.
Summing 3 interviewer ratings of the child’s cooperation during the assessment created the sociability scale. Children were rated on a scale of poor (1) to excellent (5). Items include, for example, the observer’s rating of how cooperative the child was in completing the assessment
Running head: School Readiness and Later Achievement DO NOT CITE OR QUOTE
21
and of the child’s attitude toward being tested. This measure has a high reliability; the NSLY reports an alpha of .93 (Baker et al., 1993).
The Peabody Picture Vocabulary Test- Revised (PPVT) is used to measure children’s early receptive vocabulary at age 3/4. The PPVT consists of 175 vocabulary items which increase in difficulty. Nationally standardized scores are used in analyses and descriptive statistics for the sample are presented in Table 6.
Data on children’s family environments were coded to correspond to two intervals—between birth and age 5 and at age 5/6. Measures available at both times include: family income, family structure, and urban residence. However, some information was only consistently available when children were age 5/6 including children’s HOME environment and two measures of family structure (blended family and cohabitation). The highest grade a mother completed when the child was age 5/6 is also used as a control (See Appendix B).
The NLSY measures an array of child and mother background characteristics, which are used as covariates in analyses. These variables include, for example, measures of the child’s race (Black, Hispanic, or non-Hispanic white) and mothers’ percentile scores on the Armed Forces Qualifying Test (AFQT, a measure of mothers’ academic aptitude assessed in 1980). In addition, several variables that measure mothers’ risk-taking behaviors (drug and alcohol use) and her adolescent experiences are also included as covariates. For a complete list of these variables see Appendix B.
Results
Correlations
Bivariate correlations among the academic and self-regulatory measures are presented in Table 7. Associations between children’s early and later achievement are stronger than associations between early behavior and later achievement. Children’s math and reading achievement at 13/14 are highly correlated with their achievement at age 7/8 (r=.69 for reading and r=.59 for math) and age 5/6 (r=.42 for reading and r=.43 for math), as well as children’s receptive vocabulary at age 3/4 (r=.40 for reading and r=.44 for math).
The correlations between children’s early self-regulatory behavior and their academic achievement are more modest, and differ according to the type of behavior being considered. Across all ages, hyperactivity is the dimension of behavior most strongly associated with achievement (e.g, for reading r= -.20 at age 5/6, r=-.23 at age 7/8, and r=-.20 at age 13/14), followed closely by antisocial behavior and peer problems. Headstrong behavior has the lowest correlations with children’s achievement.
[Insert Table 7 about here]
Basic Models
Moving from bivariate correlations to multivariate regressions, associations between adolescent’s achievement and their early achievement and behavior decrease by more than half (Table 8). For example, holding math achievement and problem behavior constant, a one standard deviation increase in reading achievement at age 5/6 is associated with a .20 standard deviation higher reading score at age 13/14 (Column 1, Table 8). Adding in covariates for child
Running head: School Readiness and Later Achievement DO NOT CITE OR QUOTE
22
and family background characteristics as well as children’s receptive vocabulary and temperament reduces the estimates only slightly.
Absent controls for background characteristics, temperament, and receptive vocabulary, regression results suggest rather small negative effects of children’s antisocial behavior on their later reading achievement (-.07), and of hyperactivity on their math achievement (-.12). Surprisingly, children’s headstrong behavior has a small positive association with math achievement (.06). However, adding additional controls into the regressions substantially these reduce associations. For example, the effect of hyperactivity on math achievement falls by a third (-.12 to -.08). The positive headstrong effect for math skills is reduced, and a negative hyperactivity effect emerges. Results from regressions with the most complete set of control variables suggest a small negative effect of hyperactivity on both reading and math achievement, as well as a small negative effect of antisocial behavior on reading achievement.7
[Insert Table 8 about here]
Do young children’s problem behaviors have stronger links to their achievement in middle childhood than in adolescence? The next set of analyses estimates the effects of children’s behavior and achievement at age 5/6 on their achievement just two years later (age 7/8). A remarkably similar pattern of results is apparent (see Table 9). Again, children’s academic achievement is a stronger predictor of their later achievement than their behavior problems. Given the closer proximity of the assessments, it is not surprising that these effects are larger than those previously estimated for adolescent achievement. For example, the estimated effects for early reading achievement are nearly twice as large during middle childhood (.34 vs. .17).
In terms of behavior, the results indicate that holding constant child and family background characteristics, the effects of hyperactivity are remarkably consistent across achievement in middle childhood and early adolescence. Estimated effects are slightly larger for age 7/8 reading (-.06 vs. -.05) than later reading, but identical for children’s math achievement (-.08 at both ages).
Other dimensions of self-regulatory behavior are not as consistently predictive of children’s achievement. Although antisocial behavior predicts lower reading achievement at age 13/14 (-.05), it is not associated with reading at age 7/8. In addition, peer problems do not predict reading achievement in early adolescence, but it does appear to matter for children’s reading skills during middle childhood (-.06).
[Insert Table 9 about here]
Considering grade retention, the results indicate that children’s self regulatory behavior is associated with the likelihood of being retained in grade by the age of 13/14. For example, a one standard deviation increase above the mean is associated with a 4% higher probability of having been retained. However, adding covariates decreases the estimated effects to non-significance suggesting that changes in children’s preschool self-regulatory behavior are not uniquely associated with their later school progression.
Spline regressions were conducted to determine if the effects of early hyperactivity and achievement were non-linear, perhaps with improvements among children with higher levels of hyperactivity and lower levels of achievement more predictive of subsequent achievement at age
Running head: School Readiness and Later Achievement DO NOT CITE OR QUOTE
23
13/14 (results not shown). The effects were allowed to differ for children whose scores were in the top half of the hyperactivity score and the bottom half achievement measures. The results from these analyses indicate that the effects of children’s hyperactivity are non-linear, such that increments in higher levels of hyperactive behavior are more detrimental to children’s math achievement (-.15) than increments to lower levels of the same behavior (-.00). This pattern of hyperactivity effects is also apparent for reading achievement (-.10 vs. .00), but the standard errors are large and the coefficients do not reach statistical significance. There is no evidence that early achievement’s effects on later achievement are non-linear.
Subgroup models
Do these average early behavior and achievement effects mask differences across boys and girls or high and low SES children? With respect to early adolescent achievement, it appears that the pattern of effects for children’s behavior does not systematically differ according to gender or SES background (See Table 10). The only exception is that hyperactivity appears to be particularly predictive of math skills among low SES youth, but not high SES youth (low and high SES is defined as having the lowest 25% of family incomes respectively and high SES including the top 75% of incomes).
[Insert Table 10 about here]
Fifth Grade Achievement in the NICHD Study of Early Child Care and Youth Development Sample
Participants were recruited from hospitals located at 10 sites across the U.S in 1991 (Little Rock, AK; Irvine, CA; Lawrence, KS; Boston, MA; Philadelphia, PA; Pittsburgh, PA; Charlottesville, VA; Morganton, NC; Seattle, WA; and Madison, WI). During 24-hour sampling periods, there were 5,265 women new mothers who met the selection criteria and agreed to be contacted after returning home from the hospital. At one month of age, 1,364 healthy newborns were enrolled in the study. Although it is not nationally representative, the study sample closely matches national and census tract records on demographic variables such as household income and ethnicity. Among the 1281 families with children who were retained through the first 15 months, there were 206 with pre-transfer incomes below the poverty threshold, and another 277 whose incomes were between 100% and 200% of the poverty threshold (NICHD ECCRN, 1997). The majority of children in the sample are white, 12% are African-American, and 11% are Hispanic or another ethnicity. Over the first 15 months of the study approximately 39% of the mothers worked less than 10 hours per week, 30% had a high school education or less, and 14% were single parents.
Measures
Dependent Variables
The means and standard deviations of key dependent and independent variables are presented in Table 11. Our key dependent variables consist of achievement test scores and teacher reports of reading and math achievement at first, third, and fifth grade, and parent report of grade retention over the course of the first six years of school (includes kindergarten).
Running head: School Readiness and Later Achievement DO NOT CITE OR QUOTE
24
The Woodcock-Johnson Psycho-Educational Battery– Revised (WJ-R) tests were individually administered to children during the spring of the first, third, and fifth grade years (Woodcock & Johnson, 1989; Woodcock, 1990). Raw scores for each test are converted into W scores (a special transformation of the Rasch ability scale) which have equal interval units and are set to approximate the average performance of beginning fifth-grade students (centered on a value of 500). At third and fifth grades, the broad reading score includes the letter-word identification and passage comprehension tests (5th grade α =.92; 3rd grade α =.93). The first five letter-word identification items require the child to match a pictographic representation of a word with an actual picture of the object, and the remaining items measure skills in identifying isolated letters and words. The first four passage comprehension items require the child to point to the picture represented by a phrase (multiple-choice format), and for the remaining items the child reads a short passage and identifies a missing key word that would be appropriate in the context of the passage. The number of scales administered from the WJ-R differed somewhat at the spring of first grade assessment from what was administered at third and fifth grades. At first grade, the mean of the WJ-R letter-word identification (α =.92) and word attack (α=.92) scales was used as a measure of reading achievement. The word attack scale measures a child’s ability to apply phonic and structural analysis skills to the pronunciation of unfamiliar printed words.
At third and fifth grades, the broad math score includes applied problems and calculation tests (5th grade α =.92; 3rd grade α =.89). The applied problems scale measures the child’s skill in analyzing and solving practical problems in mathematics. This scale requires children to recognize the procedure to be followed and then perform relatively simple calculations. The calculation scale measures the child’s skill in performing mathematical calculations including addition, subtraction, multiplication, division, and combinations of these basic operations, as well as some geometric, trigonometric, logarithmic, and calculus operations. The calculations involve decimals, fractions, and whole numbers. At first grade, the applied problems scale was used as a measure of math achievement (α =.83).
At first, third, and fifth grades, teachers reported on the child’s classroom achievement using the Academic Rating Scale, which was adapted from the Academic Skills measure used in the Early Childhood Longitudinal Study (NCES, 2001). The teacher rates the study child’s performance compared with other children at the same grade level on a 5-point scale (1=“Not Yet” to 5=“Proficient”). The items in the language and literacy scale address listening, speaking, and early reading and writing behaviors (5th grade 10 items, α =.94; 3rd grade 10 items, α=.95; 1st grade 15 items, α=.95), and the items in the mathematical thinking scale address the child’s ability to perceive, understand, and utilize skills in solving mathematical problems (5th grade13 items, α =.92; 3rd grade13 items, α =.91; 1st grade 10 items, α =.92).
Mothers (or alternate primary caregivers) were asked several questions about the schools the study child attended each year. As part of this interview, mothers were asked to indicate the start and stop dates for each school attended within each grade level. We used this information to calculate a dichotomous variable indicating whether or not the child ever repeated a grade from kindergarten through the end of fifth grade (99/1059 children in the sample with valid data through sixth grade had ever repeated a grade; 35 repeated kindergarten, 27 repeated first grade, 18 repeated second grade, 11 repeated third grade, 5 repeated fourth grade, and 6 repeated fifth grade).

Running head: School Readiness and Later Achievement DO NOT CITE OR QUOTE
25
[Insert Table 11 about here]
Key Independent Variables
The WJ-R letter-word identification scale was used to measure early reading skill (α =.84) and applied problems scale is used to measure early skill in mathematics (α =.84) at age 4 ½. The measure of cognitive ability was the mean of the memory for sentences (α =.82), incomplete words (α =.86), and picture vocabulary (α =.76) scales. Memory for sentences is a measure of short-term memory that requires the child to make use of sentence meaning to aid in recall, incomplete words is a measure of auditory processing that requires the child to names a complete word after hearing a recorded word that has one or more phonemes missing, and picture vocabulary is a measure of verbal comprehension or crystallized intelligence.
The Preschool Language Scale–3 (Zimmerman, Steiner & Pond, 1979) was administered during the home visit at age 4 ½ in order to measure the auditory comprehension and expressive communication skills. Because the two scales are highly correlated (.70), only the expressive communication standard score was used in this study. The scale includes 48 items that require the child to “say” what he/she understands (scored “1” for each question if the pass criterion is met or if the child self-corrects a response; scored “0” if the pass criterion is not met or for partially correct or incomplete responses).
Sustained attention and impulsivity were assessed using a 7 ½ minute Continuous Performance Task (CPT), during the laboratory visit at age 4 ½ (Rosvold, Mirsky, Sarason, Bransome & Beck, 1956). Children viewed dot-matrix computer-generated images that were presented on a 2-inch square screen. The child was asked to press a button “as fast as you can” each time the target stimulus (a chair) appeared and to inhibit responding to nontarget stimuli (e.g., butterfly, flower, etc.). The percentage of correct responses to target stimuli was used as a measure of sustained attention and the percentage of incorrect responses to non-target stimuli was used as a measure of impulsivity.
In the fall of the kindergarten year, teachers rated children’s attention problems, internalizing problems, and aggressive behavior using the Teacher Report Form of the Child Behavior Checklist for ages 4-18 (Achenbach, 1991). Teachers responded to 120 items which asked whether the study child currently or during the previous two months had displayed a range of behavioral/emotional problems using a 3-point scale (0 “not true” to 2 “very true”). Narrow band T-scores for attention problems (i.e., can’t concentrate, can’t sit still, confused, fails to finish things, fidgets, day-dreams, difficulty following directions, acts young) and aggression (i.e., argues, defiant, brags, demands a lot of attention, disobedient at school, disturbs other pupils, jealous, fights, cruelty, talks out of turn) and the broad band T-score for internalizing problems (i.e., shy, sad, withdrawn, complains of headaches, complains of nausea, afraid of making mistakes, worries) are used.
Teachers also completed the Social Skills Rating System (SSRS K-6 version) in the fall of the kindergarten year (Gresham & Elliott, 1990). Teachers rated the frequency of a series of behaviors using a 3-point scale from 0 (never) to 3 (very often). The teacher version of the SSRS (α =.93) includes three subscales: cooperation (i.e., paying attention to teacher’s instructions), assertion (i.e., volunteering to help), and self-control in conflict situations (i.e., responding to teasing or peer pressure appropriately). The standardized total score is used in the analyses.

Running head: School Readiness and Later Achievement DO NOT CITE OR QUOTE
26
Key Control Variables at Age 3
The Bracken School Readiness Composite (SRC) subscale of the BBCS Diagnostic Scale was administered to children at 3 years of age. The SRC tests the child's knowledge of the following basic concepts: color, letter identification, number/counting, comparisons, and shape (Bracken, 1984).
The Reynell Developmental Language Scale (RDLS), an observational assessment specifically tailored to detect changes in language development in young children, was administered at the age 3 assessment (Reynell, 1990). The RDLS has two 67-item scales: Verbal Comprehension (α =.93) and Expressive Language (α =.86).
Problem behaviors including internalizing and externalizing symptoms at age 3 were rated by mothers using the Achenbach Child Behavior Checklist (CBCL) for ages 2-3 (Achenbach, 1992). Children were rated on 99 items describing behavioral/emotional problems during the previous two months on a 3-point scale from 0 (not true of child) to 2 (very true of the child).
A forbidden toy task was administered and videotaped during the laboratory visit at age 3. Child was allowed to play with an attractive toy. Then the experimenter told the child that she had some work to do, and the child could play with other toys that were previously played with, but he/she could not touch the attractive toy until told to do so. The attractive toy was placed at arms length from the child and the experimenter sat in the corner of the room doing paperwork for 2.5 minutes. After 2.5 minutes the examiner returned and allowed to play with the attractive toy. Active engagement time with the forbidden toy was used as a measure of impulsivity (inter-rater reliability was .98).
Covariates
Means and standard deviations of the full set of covariates can be found in Appendix C. A variety of measures of child and family characteristics were collected at multiple points during a child’s infancy and early childhood. Baseline information about the child, including gender, ethnicity, and birth order was provided by the mother at the time of study enrollment. At the age 4 ½ assessment period, mothers rated the child’s general health since the last interview on a 4-point scale ranging from 1 (poor health) to 4 (excellent health).
Information about the child’s home environment, including the number of children in the household and household structure was collected at the age 4 ½ interview. A composite parenting quality score was created by first averaging standardized ratings of observed maternal sensitivity and of observed home environmental quality as measured by the Home Observation for Measurement of the Environment (HOME; Caldwell & Bradley, 1984).
Information regarding parental characteristics including mothers age, and mother’s and partner’s education (in years), job status (categorized along a continuum from high status, professional/administrative jobs to low status, laborer/helper type jobs), and total family income (including mother’s and partner’s earnings, from social security and SSI, TANF, and/or food stamps) was gathered at the age 4 ½ interview. A dummy variable was created indicating whether the family ever received public assistance during the first 4 ½ years of the child’s life. Maternal reports of depressive symptoms were assessed at the age 4 ½ interview (α =.90) using the Center for Epidemiological Studies Depression Scales (Radloff, 1997).
Running head: School Readiness and Later Achievement DO NOT CITE OR QUOTE
27
Non-maternal child care was defined as regular care by anyone other than the mother—including care by fathers, relatives, and nannies (whether in home or out of the home), family-day-care providers, and centers—that was routinely scheduled each week. Parents reported the study children’s hours of routine non-maternal care during the phone and personal interviews conducted at approximately 3-month intervals (called epochs) between birth and age 4 ½. For each epoch, the child’s primary care arrangement was classified as center-based or home-based (any home-based care in the child’s own home or another person’s home). Epochs in which children were in non-maternal care for less than 10 hours per week were coded as exclusive maternal care. The two indicators of type of care were constructed included the proportion of epochs in which the child received care in a center and the proportion of epochs in a home-based setting.
Average Quality of Care was defined by the caregiver-child interaction and stimulation. Observational assessments were conducted in the primary child care arrangement at ages 6, 15, 24, 36, and 54 months. Global quality was assessed during two half-day visits scheduled within a 2-week interval at 6-36 months and one half-day visit at 54 months. Observers completed four 44-minute cycles of the Observational Record of the Caregiving Environment (ORCE) per child age through 36 months and two 44-minute ORCE cycles at 54 months. Detailed descriptions of the ORCE assessments can be found in NICHD Early Child Care Research Network (2002), including coding definitions, training procedures, and inter-observer agreement. Reliability exceeded .90 at 6 months, .86 at 15 months, .81 at 24 months, .80 at 36- months and .90 at 54 months. Complete operational and observation manuals can be found at http://secc.rti.org/.
Results
Correlations
Correlations among key analysis variables are presented in Table 12. At the zero-order level, early reading, math, cognitive, and language ability show strong relations to both achievement test scores and teacher reports of classroom achievement at first, third, and fifth grades (size of the correlations rage from .37 to .60). Of the self-regulatory behaviors examined, kindergarten teacher reports of attention problems and social skills show the strongest associations with later achievement (absolute value of correlations range from .14 to .29), followed by the two independent measures of self-regulation (from the Continuous Performance Task), impulsivity and sustained attention (absolute value of correlations range from .25 to .35). The remaining measures of emotional self-regulation, internalizing problems and aggression, show a small, negative association with later school achievement and are much smaller than the correlations between early and later achievement test scores (correlations range from -.09 to -.21).
[Insert Table 12 about here]
We regressed children’s math and language performance at fifth, third, and first grade on reading, math, cognitive, and expressive language test scores, performance on delay of gratification, impulsivity, and sustained attention laboratory tasks at age 4 ½ and teachers’ ratings of attention problems, internalizing problems, aggressive behavior, and social skills in kindergarten using the ordinary least squares method. Analysis variables have been standardized using full sample standard deviations to allow comparisons across domains and with the

Running head: School Readiness and Later Achievement DO NOT CITE OR QUOTE
28
correlations presented in Table 12. In order to maximize the sample size for the analysis, cases with missing data were flagged with a dichotomous variable, which was included in the regressions, and the mean has been imputed for independent variables with missing data. Cases that were missing more than 3 of the key independent variables were dropped from the analyses.
The multivariate models tested in this paper are presented in order of complexity, beginning with a basic model (model 1) that includes early math, reading, cognitive ability, impulsivity, and sustained attention measured prior to school entry (age 4 ½), and teacher report of attention problems, internalizing problems, aggressive behavior, and social skills measured in the fall of the kindergarten year. Model 2 adds an extensive list of child and family covariates (means and standard deviations can be found in Appendix C). Model 3 adds prior measures of school readiness including: basic knowledge, expressive and receptive vocabulary, impulsivity, and maternal ratings of internalizing and externalizing problems at age 3; this model represents change in basic skills and self-regulation over the preschool period (between age 3 and age 4.5 or the fall of kindergarten). We then tested for sub-group differences based on child gender and tested for non-linear effects using piecewise linear (spline) functions.
Basic Models
Fifth grade achievement results are displayed in Table 13. The coefficients for the age 4 ½ Woodcock-Johnson reading test decrease in size and the amount of variance accounted for increases as the models increase in complexity, particularly in the case of the achievement test score outcomes. The size of the self-regulation coefficients change little as the covariates are added, and, overall, the amount of variance accounted stays about the same across model specifications for teacher reported achievement outcomes.
Our discussion focuses on Model 3, which can be interpreted as the effect of a one-standard deviation change in a given independent variable over the course of the preschool years. High scores on the early reading and cognitive ability tests and low levels of attention problems in kindergarten were the strongest predictors of fifth grade reading test scores (net of earlier school readiness). Children with good expressive communication skills and those who were rated high on aggressive behavior by their kindergarten teachers also performed well on the reading test. Early math test scores and kindergarten teacher ratings of attention were the strongest predictors of later math achievement test scores. The effect of early reading, expressive communication, and impulsivity scores were about half as large as early math test scores.
Turning to teacher reports of achievement, a high expressive communication score at age 4 ½ was the strongest predictor of classroom reading achievement at the end of fifth grade. A set of other predictors showed nearly the same predictive power, included: high early math and reading test scores, low levels of attention problems and high levels of social skills, internalizing problems, and aggressive behavior as reported by kindergarten teachers. Kindergarten teacher ratings of attention problems show a strong, negative association with teacher reported math achievement.
The relation of teacher rated attention problems to later reading achievement is nearly as strong as that of early reading to fifth grade reading, and is a stronger predictor of math achievement than either early reading or math test scores. Interestingly, children rated high on aggressive behavior were rated high on reading and math ability (sub-group analyses revealed
Running head: School Readiness and Later Achievement DO NOT CITE OR QUOTE
29
that this was true for boys only) and children rated high on internalizing problems had high levels of classroom achievement in reading (subgroup analyses indicated that this was true only of girls). Recall that, at the zero-order level, both aggressive behavior and attention problems are negatively related to achievement (see Table 12). Results from additional analyses that did not include the cognitive self-regulation measures of impulsivity, sustained attention, and teacher-rated attention problems in the models indicated that social skills show a positive (and statistically significant) association, and aggression is unrelated to both test scores and teacher-reported achievement. This suggests a suppressor effect of attention—i.e., children with attention problems and difficulties with emotional self-regulation and social skills are worst off in terms of their achievement.
Another practical measure of school success is timely grade promotion. We calculated the marginal effects from a logistic regression predicting whether the child had ever been retained in grade over the period between kindergarten and the end of fifth grade (results not shown). Here the early self-regulation skills were better predictors of grade retention than were early academic skills. A one standard-deviation increase in teacher reported attention problems is associated with a 2.31 percentage point increase in the probability of grade repetition. An increase in impulsivity as measured by the continuous performance task (CPT) is associated with a 1.33 % reduction in grade repetition, and an increase in kindergarten teacher ratings of aggression is associated with a 1.48% reduction in grade repetition. Though none of the coefficients from the early academic skills were statistically significant at conventional levels, a marginally significant effect of the letter-word identification scale at age 4 ½ was observed. Specifically, a one standard-deviation increase in early reading ability is associated with 1.20% reduction in the probability of ever being retained in grade (p<.10).
[Insert Table 13 about here]
Third grade achievement results are presented in Table 14. Early reading test scores are the strongest predictor of third grade reading test scores, followed by cognitive ability at age 4 ½ and attention in kindergarten. The coefficients for previous math test scores, internalizing problems, and aggressive behavior are about one-third the size of the coefficient for prior reading test score. Kindergarten teacher ratings of attention, prior math test score, and prior reading scores were strong predictors of third grade math test scores. Kindergarten teacher report of internalizing problems also predicted math test scores, but the size of the coefficient was about two-thirds smaller than the other predictors in the model.
Previous math test score is the strongest predictor of third grade teacher-rated reading, followed by prior reading test score and kindergarten teacher ratings of attention, social skills, and internalizing problems. The pattern of teacher-reported math achievement results at third grade is similar to those observed at fifth grade. Children who were rated as having high levels of attention problems in kindergarten were rated low on math achievement by third grade teachers. High scores on early math and reading tests, and to a lesser extent, internalizing problems were also related to classroom achievement in math.
[Insert Table 14 about here]
First grade achievement results are presented in Table 15. A high score on the early reading test is the strongest predictor of achievement on the first grade reading test. Kindergarten

Running head: School Readiness and Later Achievement DO NOT CITE OR QUOTE
30
teacher rated attention, previous math test score, and aggressive behavior are also statistically significant predictors of reading test scores, but the size of the coefficients are about two-thirds smaller than the coefficient for prior reading test score. Prior math test score and, to a lesser extent, prior reading test score are the best predictors of third grade math test scores. Children with good expressive communication, those rated low on attention problems by their kindergarten teachers, and those with high performance on the sustained attention task at age 4 ½ also had high math test scores at first grade.
Overall, reading test scores are strongest predictors of teacher reported achievement. Children who score high on reading tests at age 4 ½ (net of earlier school readiness) are rated high on both math and reading by their first grade teachers. High math test scores at age 4 ½ predict high ratings on reading by first grade teachers, a similar pattern is observed between early math test scores and teacher rated math, but the effect is not significant at conventional levels. Tests of cognitive ability and expressive communication at age 4 ½ are unrelated to teacher ratings of math or reading in first grade. High performance on the sustained attention task at age 4 ½ and kindergarten teachers’ ratings of classroom behavior predicted first grade teacher reports of math and reading. Specifically, children who demonstrated low levels of attention problems, and high levels of aggressive behavior and social skills in kindergarten were rated high in reading and math by their first grade teachers.
[Insert Table 15 about here]
One might expect the gains in early skills matter more for children who begin school with low-levels of early skills. In order to test for non-linear effects, we ran a set of models using piecewise, linear (spline) regressions, which allowed for different coefficients for the lowest one-third and the highest two-thirds of the sample on a given independent variable (results not shown). No significant differences were found, indicating that the slopes did not differ for the low- and high-scoring groups.
Subgroup Models
Separate analyses for boys and girls are shown in Table 16. Coefficients between groups for each subgroup analysis were tested for significant differences using a standard mean difference test. Overall, the patterns of association between reading and math test scores at age 4 ½ and test performance and fifth-grade teacher ratings and were similar for boys and girls. Although not all of the coefficients for other variables were statistically significant, perhaps because of the smaller number of cases within each subgroup, many of the patterns were similar to those for the full sample.
High scores on the applied problems scale of the Woodcock-Johnson at age 4 ½ predicted teacher ratings of reading ability at fifth grade for girls but not boys. High cognitive ability scores at age 4 ½ predicted teacher ratings of reading and math achievement for boys but not girls. Kindergarten teacher reports of internalizing problems predicted high scores on the Woodcock-Johnson reading test at fifth grade for girls but not boys. Finally, kindergarten teacher reports of aggressive behavior predicted high fifth grade reading and math test scores for boys but not girls. We were unable to test for SES differences because the size of the low-income sample is too small relative to the number of independent variables in the model.
Running head: School Readiness and Later Achievement DO NOT CITE OR QUOTE
31
[Insert Table 16 about here]
Age 8 Achievement in a Low Birth Weight Sample: The Infant Health and Development Program
Sample The IHDP is an eight-site randomized clinical trial designed to evaluate the efficacy of a comprehensive early-intervention program for low birth weight (LBW) premature infants (Brooks-Gunn, Klebanov, & Liaw 1995; IHDP 1990: McCormick, Brooks-Gunn, Workman-Daniels, Turner, & Peckham,, 1992). Infants weighing 2,500 grams or less at birth were screened for eligibility if their postconceptional age between January 7, 1985 and October 9, 1985 was 37 weeks or less and if they were born in one of the eight participating medical institutions (Arkansas at Little Rock, Einstein, Harvard, Miami, Pennsylvania, Texas at Dallas, Washington, and Yale). A total of 985 infants were randomly assigned either to a medical follow-up only (FUO) or to a comprehensive early childhood intervention (INT) group immediately following neonatal hospital discharge.
Because of the higher risk associated with lower birth weights, two-thirds of the infants had birth weights 2,000 grams or less, and one-third had birth weights between 2,001 and 2,500 grams. Infants in both the INT and FUO groups participated in a pediatric follow-up program of periodic medical, developmental, and familial assessments from 40 weeks conceptional age (the age at which they would have been born if they had not been premature) to 36 months of age corrected for prematurity. The intervention program, lasting from hospital discharge until 36 months, consisted of home visits (weekly in the first year, biweekly thereafter), child care services (a minimum of 4 hours per day, 5 days per week, from 12 to 36 months), and parent group meetings (bimonthly, from 12 to 36 months). A coordinated educational curriculum of learning games and activities was used both during home visits and at the center (Ramey, Bryant, Wasik, Sparling, Fendt, & LaVange, 1992; Sparling, Lewis, Ramey, Wasik, Bryant, & LaVange, 1991; Sparling & Lewis, 1984). Home visitors also used a problem-solving curriculum with the parents (Wasik, 1984; Wasik, Bryant, Lyons, Sparling, & Ramey, 1997).
Of the 1,302 infants who met the enrollment criteria, 274 were excluded because consent was refused and 43 withdrew before entry into their assigned group. The remaining 985 infants constituted the primary analysis group. This study focuses upon a subsample of 690 children who were not born extremely low birth weight (ELBW; 1000 grams or less). ELBW children differ markedly from other LBW children in cognitive and behavioral functioning (Aylward, Pfeiffer, Wright, & Verhulst, 1989; Hoy, Bill, & Sykes, 1988; Klebanov, Brooks-Gunn, & McCormick, 1994a,b; Saigal, Szatmari, Rosenbaum, Campbell, & Kerry, 1991). Data come from a variety of sources: questionnaires, home visits, and laboratory tests.
Measures
Dependent Variables
Academic achievement at age 8 is measured by the Woodcock-Johnson Tests of Achievement-Revised (Woodcock & Johnson, 1990), focusing on the broad math and broad

Running head: School Readiness and Later Achievement DO NOT CITE OR QUOTE
32
reading scales of the Woodcock-Johnson. Reliabilities for the achievement clusters are in the .90s. These standardized tests are normed so that the mean score is 100 and the standard deviation is 15 for the Woodcock-Johnson. The means and standard deviations for our sample are provided in Table 17.
Mothers provided reports of their child’s grade retention at age 8. The grade retention variable is a dummy variable indicating whether the child ever repeated a grade.
[Insert Table 17 about here]
Key Independent Variables
Cognitive functioning at age 5 is measured by the Wechsler Preschool and Primary Scale of Intelligence (WPPSI; Wechsler, 1967), a test developed for use with children between the ages of 4 and 6 1/2 years. The reliability of verbal IQ and performance IQ is .94 and .93, respectively (Sattler, 1982). Verbal IQ assesses language expression, comprehension, listening, and problem solving ability. It consists of the information, comprehension, arithmetic, vocabulary, similarities, and sentences scales. Performance IQ assesses nonverbal problem solving, perceptual organization, speed, and visual-motor skills. Performance IQ consists of the object assembly, geometric design, block design, mazes, picture completion, and animal pegs scales.
Behavioral functioning at age 5 is measured by the Revised Child Behavior Profile (Ages 4 & 5; Achenbach & Edelbrock, 1984). The CBP/4-5 is a 120-item questionnaire that measures behavioral competence. Mothers characterize statements about their child as not true (0), often or very true (2) for behavior within the past six months. The total CBP, less the three items pertaining to attention, is used with higher scores indicating more behavior problems. The means and standard deviations for our behavior problem measures are presented in Table 17.
Attention is measured at age 5 using three items relating to attention from the Achenbach Revised Child Behavior Profile. Mothers characterize statements about their child as not true (0), often or very true (2) for behavior within the past six months. The three items are: can’t concentrate or pay attention for long, can’t sit still or restless, and can’t stand waiting/wants everything now. These items were summed to create a measure of attention problems (range=0 to 6; α =.61). Similar to the total CBP score, higher scores indicate more behavior problems. Descriptive information for our attention measures is provided in Table 17.
Covariates
At 36 months of age, cognitive functioning is measured with the Stanford-Binet Intelligence Scale Form L-M, 3rd edition (Terman & Merrill 1973). It is the most widely used intelligence test for this age group (Anastasi, 1988; Sattler, 1982). Reliability data are not available for the 3rd edition, however, for the 4th edition it is .97 (Thorndike, Hagen, & Sattler, 1986). Behavioral functioning at age 3 is measured by the Child Behavior Checklist for Ages 2-3 (CBCL/2-3; Achenbach, Edelbrock, & Howell 1987). The CBCL/2-3 is a 99-item questionnaire that measures behavioral competence. It has adequate reliability and validity (Achenbach et al. 1987). Mothers rate the degree to which statements about their child are not true (0) to very true or often true (2) within the past two months. The total CBCL score is used, with higher indicating more behavior problems.

Running head: School Readiness and Later Achievement DO NOT CITE OR QUOTE
33
Sustained attention is measured at age 3 using the test observer’s rating of the child’s behavior during the administration of the Stanford-Binet Intelligence test. These items assess the child’s attention, activity level, response time, emotional independence, persistence, and reaction to failure (1=very poor response to 5=optimal response).The sum of the eight items were used to create this measure, with higher scores indicating greater attention (α =.94).
To control for differences across the 8 study sites, seven dummy variables were created and included in our regression analyses. In addition, a number of child initial health status variables, maternal and family characteristics were controlled for.
Results
Correlations
Correlations between the different cognitive tests, presented in Table 18, reveal math and reading scores at age 8 are highly correlated with performance and verbal scores at age 5 and moderately correlated with Stanford-Binet IQ at age 3. The correlations between the behavior problem scales reveal that behavior problems at age 3 are moderately correlated with reports at age 5.
[Insert Table 18 about here]
Basic Models
Three OLS multiple linear regression models were run for our age 8 Woodcock Johnson Broad Math and Reading scores. The first model controls for cognitive test scores (WPPSI verbal and performance IQ) and Achenbach total behavior problems and attention problems measured close to the time of school entry (age 5) to assess their relative contribution to school achievement. The second model adds controls for study site and treatment status and child (birth weight, neonatal health, gender) and family variables (number of children, maternal race, maternal education, age, and marital status at birth, average family income-to-needs ratio, HOME score, maternal verbal test score [PPVT], and depressive symptoms). This model will assess whether the associations observed in the first model are accounted for by differences in children’s family environments. The third model adds controls for cognitive test (Stanford-Binet), Achenbach behavior scores prior to school entry, and observer’s ratings of attention (age 3) to examine the incremental effect of cognitive skills, behavior, and attention to school achievement. All variables have been standardized using full sample standard deviations to allow across domain comparisons. Descriptive statistics for all control variables added to Models 2 and 3 are presented in Appendix D.
Table 19 presents the results for the math and reading scores. In the first model (columns 1 and 4), both verbal and performance IQ are associated with math and reading scores. Attention problems, but not overall behavior problems, are associated with math and reading scores. When family characteristics are added to the model (columns 2 and 5), the effects of verbal and performance IQ remain basically unchanged. Attention problems remain significantly associated with math scores, but are marginally associated with reading scores. When prior controls for verbal and performance IQ, behavior, and attention are added in the third model (columns 3 and 6), the coefficients for verbal and performance IQ remain associated with math and reading scores. These results suggest that if there are two children with the same test scores at age 3, the
Running head: School Readiness and Later Achievement DO NOT CITE OR QUOTE
34
increment in test scores from age 3 to 5 persists through age 8. Attention problems remain associated with worse math achievement, but not reading achievement.
The results for grade retention reveal that verbal IQ at age 5 is a significant predictor of grade retention (Table 19 columns 7 to 9). Students one standard deviation above the mean in verbal IQ are seven percentage points less likely to have been retained by age 8. This result remains significant even when family variables and our prior controls at age 3 are entered. For these models, students one standard deviation above the mean in verbal IQ are 3 percentage points less likely to have been retained by age 8. Unlike previous models, the association between performance IQ and grade retention is not significant.
[Insert Table 19 about here]
Subgroup Models
Table 20 presents the results of our third regression model by gender, ethnicity, and SES subgroups. Coefficients for verbal and performance IQ are generally consistent across all subgroups. Verbal and performance IQ are associated with math and reading scores for boys and girls, for black and white children, and for high SES children (defined as the top 25% of the distribution) and low SES groups (defined as the bottom 25%). Only one significant interaction between our subgroups and independent variables was found. Attention problems are associated with reading scores for black children, but not for white children. The interaction between attention and ethnicity is not significant for math scores. Attention problems are not associated with math and reading scores for low SES or high SES groups. Behavior problems are not associated with math or reading scores for any of the subgroups. Further analyses examining the possibility of non-linear effects using spline regressions were not conducted because of sample size limitations. Cognitive skills were the strongest predictor of math and reading scores. Cognitive skills at the time of school entry were significantly associated with math and reading scores, even controlling for early cognitive ability and family background variables. Attention was also a predictor of math and reading scores. However, attention was more strongly correlated with math scores than with reading scores. The results for math scores were significant across our three models. The results for attention are attenuated once family level controls are entered in the regression model. Contrary to expectation, behavior problems were not associated with children’s achievement. Intercorrelations between internalizing and externalizing behavior problems and attention at both ages 3 and 5 were very high (r > .70). Multicollinearity precluded having all of these variables in our regression model. There is no evidence that cognitive skills are more predictive of math and reading scores for certain subgroups of children. Cognitive skills were significantly associated with math and reading scores of black and white children, boys and girls, and low SES and high SES children.
[Insert Table 20 about here]
Third Grade Achievement in the Montreal Longitudinal-Experimental Preschool Study Sample

Running head: School Readiness and Later Achievement DO NOT CITE OR QUOTE
35
The Montreal Longitudinal-Experimental Preschool Study comprises several consecutive cohorts launched from 1997 to 2000. The original sample of 4- and 5-year-old children (n = 1,928), representing one-third of the population invited to participate, was obtained only after a multilevel consent process involving school board officials, local school committees, and parents and teachers after informing them about the longitudinal nature of the project. Given that its final cohort (2000) does not meet all the data requirements for the research objective examined here, we limit ourselves to the sample of children beginning kindergarten in fall of 1998 and fall of 1999.
Initial and follow-up data were collected from multiple sources, including direct cognitive assessments of children, and surveys of parents and teachers. Although initial data were available for 1,369 children, the final sample for these analyses was reduced to 767 participants because of incomplete data. Students in the final sample had a valid value on any of the four outcome measures of interest (first and third grade measures of reading and math ability) and on at least four of the six socio-emotional measures. Of the 767 participants in the final sample, 439 began kindergarten in 1998 and 328 began kindergarten in the fall of 1999. Additionally, for 350 of the 767 students, initial data were collected during the fall of junior kindergarten (332 who began junior kindergarten in 1997 and 18 who began junior kindergarten in 1998). There were no significant differences between the two kindergarten cohorts (those who started in 1998 and those who started in 1999) on any of the reading or math outcome variables (all F’s < 1, ns); therefore, these two groups were combined into one for the data analyses.
Measures
Dependent Variables
Teachers rated children’s verbal skills at the end of grades 1 and 3 using four items: “How would you rate this child’s: (1) understanding in French; (2) using language effectively in French; (3) ability to chose and organize his/her ideas in order to be understood in situations of oral communication; and (4) ability to chose the appropriate way of speaking in situations of oral communication”. Each item was rated on a five-point scale ranging from 1 “Very poor” to 5 “Excellent”. These four items were summed to create an overall verbal skills measure.8 Scale reliability analysis of the four items resulted in an alpha = .95 for grade 1 and alpha = .94 for grade 3. Descriptive statistics for both first and third grade outcome measures and key independent variables are presented in Table 21.
The Number Knowledge Test (NKT) was administered at the end of grades 1 and 3. Norms were developed for children from ages 4 through 10 with both low- and middle-income children from Ontario, Massachusetts, Oregon, and California (Okamoto & Case, 1996). From a previous collaborative study with Robbie Case, we have norms for an adapted, shorter version with 6000 French-Canadian preschool and elementary school children. The versions administered increase in item complexity, testing basic skills such as number positioning, addition, and subtraction (grade 1, individually administered by a trained examiner) and computations involving multiplication, divisions, and fractions (grade 3, standardized group administration and supplemented with short-form items of the National Longitudinal Study of Children and Youth Math Computation Test). The first grade version of the test comprises 22 items, while the third grade version comprises 43-items (ordered in increasing difficulty). Scores
Running head: School Readiness and Later Achievement DO NOT CITE OR QUOTE
36
are derived by summing the number of correct responses for each student (see Table 21 for means and standard deviations).
[Insert Table 21 about here]
Key Independent Variables
The Peabody Picture Vocabulary Test (PPVT, Forms A and B, French adaptation: Échelle de vocabulaire en images Peabody) was assessed at the end of kindergarten. Administered by trained examiners, the French-version of the PPVT has been standardized by Dunn, Thériault-Whalen, & Dunn (1993). Reliability was established using the split-half method with Spearman-Brown correction for each age group and for both Forms A and B (r = .66 and .85, respectively). Test-retest reliability of the parallel forms was .72 at a one week interval. As with the original version, correlations with other French vocabulary tests and other intelligence tests are high (Dunn et al., 1993).
The Number Knowledge Test (NKT) was administered at the end of kindergarten. From ages 4 through 6, the NKT represents an individually administered assessment of children's informal knowledge of number and conceptual prerequisites of arithmetic operations (Okamoto & Case, 1996). Administered by trained examiners, the test for the youngest children measures the following conceptual prerequisites: (1) knowledge of the number sequence from one to ten; (2) knowledge of the one to one correspondence in which a sequence is mapped onto objects being counted; (3) understanding the cardinal value of each number; (4) understanding the generative rule which relates adjacent cardinal values; and (5) understanding that each successive number represents a set which contains more objects. In a recent psychometric study, the test was shown to have a higher mathematics factor loading than other available preschool tests (Robinson, Abbott, Berninger, & Busse, 1996). For junior kindergarten, the NKT consists of four complex items assessing knowledge of shapes, colors, counting, and basic concept of addition. The kindergarten version comprises 19 items that assess more advanced informal number knowledge.
At the end of kindergarten, the Social Behavior Questionnaire (SBQ, Tremblay et al., 1991) was completed by teachers. This measure assesses children's behavioral adjustment. The items on the questionnaire can be divided into the following conceptual scales: Attentive9 (4 potential items; listens attentively; easily distractible (reverse coded); unable to concentrate (reverse coded); inattentive (reverse coded) - average kindergarten alpha = .82); Prosocial (9 items: shows sympathy toward others; tries to help someone who is hurt; offers to help clean up somebody else’s accidental mess; tries to make peace if there is a conflict; offers to help someone perceived as weaker or less able; consoles a crying or upset peer; helps spontaneously to clean or pick things up; invites others to take part in play; comes to the aid of others - average kindergarten α =.92); Physically Aggressive10 (7 potential items: physical fight at least once a day; threatens others; bullies or is cruel toward others; bites, kicks, and hits; gets into many fights; if accidentally hurt, assumes it was intentional; physically attacks people - average kindergarten α =.72); Anxious (3 items: seems worried or fearful; seems anxious; is nervous or tense - average kindergarten α = .75); Depressed (2 items: seems unhappy, sad, or depressed; cries a lot - average kindergarten α = .53); Hyperactive (5 items: seems agitated and has difficulty staying in one place; keeps moving; seems impulsive; has difficulty waiting his/her turn; difficulty staying calm - average kindergarten α = .90); The SBQ represents a good
Running head: School Readiness and Later Achievement DO NOT CITE OR QUOTE
37
predictor of later psycho-social adjustment and academic failure (Dobkin, Tremblay, Mâsse, & Vitaro, 1995; Pagani, Tremblay, Vitaro, Boulerice, & McDuff, 2001). National Longitudinal Study of Children and Youth (NLSCY) norms are available from early childhood through age 12. All of the items of the SBQ were rated on a scale of 1 (often or very true) to 3 (never or not true). Items were reverse scored (except for the three negatively worded attentive items) and then summed to create each scale such that a higher value on the scale would indicate a higher degree of the scale construct. The descriptive statistics for each scale are presented in Table 21.
Covariates
At the end of kindergarten, the person-most-knowledgeable (usually the mother) provided data on child characteristics,11 parental socio-demographic factors, home environment,12 early childhood care arrangements, neighborhood characteristics, and parental aspirations and expectations regarding the target child. In order to reduce the amount of missing data, if specific data was not available for the end of kindergarten, information from a prior time point (i.e., either beginning of kindergarten or end of junior kindergarten) was used.13 Appendix D reports descriptive statistics for these variables. Finally, parts of the analytic strategy called for standardized measures of prior cognitive abilities. The timing of these assessments depended upon when the child joined the study. As such, the prior cognitive control data is either available at the end of junior kindergarten (350 cases) or at the beginning of kindergarten (417 cases). Prior cognitive control variables were generated by initially standardizing the NKT and PPVT within each time point and then combining the data from both groups to generate a final variable (comprising both time points) with the standardized score from each group.
Results
Correlations
Correlations between cognitive skills in grade 3 and the key independent variables are reported in Table 22. We observe consistent correlations between verbal and math outcomes and their specific cognitive precursors measured at the end of kindergarten. Prosocial, hyperactive, and attentive behavior are also linked with the outcome variables.
Examining the correlations with the socio-emotional behaviors, it is possible to see the positive correlation between attentive behavior and both cognitive skill outcomes in grade 3 (r’s = .30 and .31; columns 1 and 2). The remaining socio-emotional behaviors suggest moderate relations between both prosocial (positive) and hyperactive (negative) behavior and cognitive skills. The correlation patterns are very similar with respect to cognitive skills in grade 1 (columns 3 and 4) and the predictors. The inter-correlations among the socio-emotional behaviors suggest moderate significant relations, with hyperactive and attentive factors showing the highest correlation (r = -.66), but none are large enough to suggest multicollinearity in the regression models.
[Insert Table 22 about here]
Basic Models
Table 23 reports the standardized coefficients (and standard errors) from three models regressing verbal and math skills on end-of-kindergarten NKT, PPVT, and socio-emotional behaviors.14 The first model only tests these key putative indicators of school readiness. The

Running head: School Readiness and Later Achievement DO NOT CITE OR QUOTE
38
second model adds the full list of sociodemographic and family control variables (see Appendix E). The third, fully controlled model further includes prior cognitive skills (earlier PPVT and NKT scores). All of the variables were standardized by full-sample standard deviations so that coefficients across models are comparable.
Interestingly, in the first models both prior achievement variables significantly predict verbal skills (standardized coefficients of .25 and .15, respectively); however, only prior NKT scores are significantly associated with subsequent math skills (.39). The association between end-of-kindergarten NKT and verbal skills is reduced and becomes no longer significant in the fully controlled model (dropping from .15 to .07). Also, controlling for prior abilities reduces the association between end-of-kindergarten PPVT and verbal skills (dropping from .25 to .19). Including these controls also slightly reduces the coefficient between end-of-kindergarten NKT and math skills (dropping from .39 to .29), although it remains a significant predictor.
Among the end-of-kindergarten socio-emotional predictors, attentive behavior predicts higher verbal and math skills. This link remains in the fully controlled model. The positive link between attention and verbal skills is larger than that with math skills (..20 and .14, respectively). Also notable is that hyperactive behavior has a marginal, but not significant, positive effect on verbal ability (.12, p = .054) while it demonstrates a negative, significant effect on math skills (-.11) in the fully controlled models. None of the other socio-emotional behaviors reported in Table 23 have significant effects on verbal and math skills. Among the prior cognitive controls, only the NKT has a significant, positive relation with both later verbal and math skills (..19 and .17, respectively). However, the PPVT did not significantly influence either outcome.
[Insert Table 23 about here]
The results from similar models estimating the influence of end-of-kindergarten cognitive and socio-emotional measures upon first grade verbal and math skills are presented in Table 24. The coefficients represent standardized betas from the three aforementioned models. The pattern of results for the outcomes is nearly identical to those reported for third grade: End-of-kindergarten NKT and PPVT significantly predict verbal ability; whereas, only end-of-kindergarten NKT significantly predicts math skills. The magnitude of these associations is somewhat subdued upon the inclusion of both socio-demographic control variables and prior cognitive controls. Once again, end-of- kindergarten attentive behavior has a significant positive association with both verbal and math skills. However, in contrast to the third grade, the magnitude of the associations between attentive behavior and both cognitive outcomes are more similar (.15 and .13, respectively), perhaps suggesting the links with early attentive behavior become stronger over time, especially for verbal abilities. There are no other significant associations between the socio-emotional behaviors and first grade outcomes.
The prior cognitive controls are also significantly predictive of first grade outcomes. Both prior PPVT and NKT are positively associated with later verbal skills (.17 and .17, respectively). However, only prior NKT is significantly associated with later math skills (.13). Aside from the association between prior PPVT and later verbal skills, these results are similar to those for the third grade outcomes.
[Insert Table 24 about here]
Subgroup Models

Running head: School Readiness and Later Achievement DO NOT CITE OR QUOTE
39
For the subgroup analyses, the results for the fully controlled regressions are only reported for long-term cognitive outcomes (grade 3) in Table 25. Our first subgroup regression models predicting verbal and math skills were conducted separately for boys and girls.
Our second set of fully controlled subgroup analyses predicting long-term verbal and math outcomes were conducted separately by linguistic status in columns 3 (linguistic-majority, representing native French-speakers) and 4 (linguistic-minority, representing a language other than French spoken at home). The characteristics of Montreal are distinctive from other Canadian cities, in that although the country adopts a bilingual (English and French) policy, the only official language in the province of Quebec is French. For children of newcomers, this means that the language of instruction is French. There are historical and socio-cultural issues concerning the French language in Canada that parallel some of the concerns that justify racial and ethnic categories for analyses in American data sets.
The coefficients between groups for each subgroup analysis were tested for significant differences using a standard mean difference test. Between the male and female coefficients, the only significant difference was found for the effect of attentive behavior on third grade math achievement (.01 and .32, respectively): Females gain a nearly one-third increase in math achievement for every standard unit increase in attentive behavior compared to males who see no significant impact of attentive behavior on math achievement. There were no significant differences between the linguistic majority and minority group for any of the key independent variable coefficients for either outcome.
[Insert Table 25 about here]
Longer-Term School Attainment and Earnings in the British 1970 Birth Cohort Sample
Data used for the analyses in this section are drawn from the UK 1970 Birth Cohort, a nationally representative longitudinal study that has attempted to follow into adulthood all the children born in Great Britain in the week of April 5--11, 1970 (Bynner et al. 1997). The achieved sample at birth was 17,196, approximately 97% of the target birth population. Attrition has reduced the sample to 11, 200 at the last survey. Representativeness of the original birth cohort has been maintained with only slight biases in the currently participating sample towards women and towards the more educated (Ferri & Smith, 2003). However, missing data at the item response level (again maintaining broadly the representativeness of the original cohort) reduces the effective data set for most analyses to between 9,000 and 10,000 cases. At each wave, cohort members were given a battery of tests of intellectual, emotional and personal development. The full list of tests is given in the Appendix F.
Of particular value are the data collected for two sub-groups of the full sample, when the cohort members were 22 and 42 months old. The aims of the sub-sample data collection were to assess obstetric services and quality of life in the first week of life, as well as to attempt to identify fetal malnutrition and investigate its effects on brain cell proliferation and subsequent development. The sub-samples consisted of all twins in the original cohort, the small-for-dates and post-mature births as well as a 10% random sample of the original cohort.

Running head: School Readiness and Later Achievement DO NOT CITE OR QUOTE
40
Inference about the general population using the non-random components of the sub-sample are likely to be biased if fetal malnutrition is indeed linked both to the development of brain activity and so to performance in development tests, particularly since fetal malnutrition is also linked to unobserved aspects of family background. To deal with this possibility, sensitivity analysis was undertaken by conducting the analyses on the control group separately to test whether results varied from those for the whole sub-sample. The results from the change models for the random group are very similar to those for the post-mature infants. These two groups are also very similar in their mean scores at 22 and 42 months. However, the other two groups have below average scores at 42 months and for these groups externalizing behavior is more important than for the control group. While this result is interesting, these two groups each represent only about 3% of the full sample population. Therefore, we have re-weighted the data such that the random control group are given their appropriate full sample weight in the sub-sample analyses. Whereas all children in the full sample who were at risk of fetal malnutrition were selected for the 22 month sub-sample, the probability of sampling was only 10% for the control group. We have, therefore, given the control group an inverse probability weight of 10 in the weighted analyses. The results presented are from models specified on this basis.
Selection of the sub-sample groups was also subject to the important restriction that all the children in these early sub-samples were from two-parent families. This is likely to limit the representativeness of these results, particularly for those concerned with family breakdown. Nonetheless, bearing this exclusion in mind, analysis of these data still sheds light on the question of the relative explanatory power of early abilities and behaviors.
Measures
Dependent Variables
Academic achievement was defined as the cohort member’s self reported highest educational qualifications by age 30. This variable reports the academic level achieved on a 0-4 scale where 4 denotes university degrees. Since the measure is not fully continuous we undertook all regression analysis for this outcome using the ordered probit method (Greene, 1993) as well as ordinary least squares but the results are not sensitive to this methodological concern. Therefore we have reported results using ordinary least squares regression. The wage measure is the log of the cohort member’s self-reported hourly wage at age 30.
Age 10 math achievement was measured by the “Friendly Maths Test” developed by the University of Bristol, containing 72 items with a reported reliability of .93. Reading achievement was measured by the 69 item Shortened Edinburgh Reading Test.
Key Independent Variables
In the full sample at age 5, cognitive ability was assessed by a standard test of vocabulary as well as through three drawing tasks; copying designs, human figure drawing, and profile drawing. Vocabulary was examined using the English Picture Vocabulary Test (EPVT). Similar to the Peabody Picture Vocabulary Test (PPVT), the EPVT is a test of receptive vocabulary in which children are asked to identify one of four pictures which best matches the stimulus word’s meaning. The test is made up of 56 items, arranged in ascending order of difficulty. Testing is stopped after the child makes five consecutive errors.
Running head: School Readiness and Later Achievement DO NOT CITE OR QUOTE
41
In the copying designs test, children were asked to copy 8 basic designs as carefully as possible. They were given two attempts at each design but no help by the instructor. For the Human Figure Drawing test, the child is asked to draw the best picture he/she can of a whole person, not just a face or head. Instructors are not permitted to help the child in any way or make suggestions. However, once the child has finished, instructors are allowed to clarify aspects of the drawing. For the Profile Drawing test, the child is asked to complete the profile of a basic head shape given in the test booklet. Harris (1963) and Koppitz (1968) show these tests also have good properties of discrimination and reported reliability of .94. Again, instructors are not able to provide any assistance.
Externalizing and internalizing behavior problems and attentiveness were also assessed at age 5 using mother’s ratings on the Rutter Behaviour Problem Scales (Rutter, Tizard & Whitemore, 1970). The scale is comprised of three subscales: externalizing, internalizing and inattention. The reported reliabilities of these subscales are .72 externalizing, .54 internalizing and .67 inattention.
Covariates
At 42 months, health visitors administering the survey assessed children and asked them to complete a range a different, age appropriate tasks to test current development and emerging IQ. Children were given a number of tasks including measures of early cognitive ability such as counting sequential blocks and a shorter version of the copying designs test administered at age 5, again without assistance. This counting test has a reported reliability of .95, and the copying test has a reported reliability of .83. Speaking and basic vocabulary was assessed by pointing and naming picture tasks, including discrimination tests in which the child had to point to the correct picture when asked “Which one do we eat?” and “Which one swims in the water?” The speaking and vocabulary test has a reported reliability of .79.
Health visitors also reported on simple measures of observed behavior and rated the child on each of the following items: how easily distracted they were, how shy / withdrawn they were, and how cooperative they were during the assessment. These three early indicators of observed behavior parallel our age 5 mother reported problem behaviors of inattention, internalizing and externalizing behavior respectively.
At 22 months, again assessed by health visitors, fine locomotor control was assessed by a cube stacking task in which children had to build the tallest tower they could from 1 inch cubes. Language was measured by maternal responses to questions such as “Can he say ‘ma ma’?” and “Does he put two / three / four word sentences together?”, as well as interviewer observations of the child’s speech, for example, by the child pointing to their eyes, hair and nose to illustrate understanding. Responding correctly to commands to “give mummy the pencil” and “put the pencil on the table” were indicators of personal and social development. The language assessment has a reported reliability of .92. Copying tests again assessed early copying and drawing skills. Children were first allowed to scribble spontaneously on the page and then, in turn, the interviewer showed the child how to draw a circle, a vertical line and a cross and asked them to copy each design. Interviewers could show the child again if they failed to try and copy the design the first time. This copying test has a reported reliability of .46.
Running head: School Readiness and Later Achievement DO NOT CITE OR QUOTE
42
These tests together with those at 42 months were intended to indicate the general development of children based on the tests used for screening in child health clinics (Chamberlain & Davey, 1976). A pilot study found high correlation between the tests used here and similar, standard tests of development such as the Bayley Scale of Infant Behavior or the Newcastle Survey (Neligan & Prudham, 1969).
We control for a range of distal features of the family environment and for measures of parenting style, attitudes and mother’s mental health. Summary statistics for all dependent, independent and control variables can be found in Table 26.
[Insert Table 26 about here]
Results
Correlations
Bivariate correlations between all outcome and key independent variables are presented in Table 27 and are nearly all significant at p<.05. Age 30 academic attainment and log wage are strongly correlated (r = .34) as are reading and math at age 10 (r = .75). Both age 10 measures of attainment correlate highly with academic attainment by age 30 (reading, r = .46; math, r = .46), but show slightly weaker associations with age 30 wage (reading, r = .26; math, r = .32).
Within-domain associations between earlier cognitive measures and later attainment scores are stronger than the between-domain association of measures of earlier behavioral problems and later attainment. For example, children’s age 5 copying score is highly correlated with age 10 reading (r = .42) and math (r = .43) ability. The correlations of age 5 inattention with age 10 test scores however, are weaker and negatively associated with age 10 outcomes: reading (r = -.15) and math (r = -.15). For externalizing behavior the correlations are slightly higher: reading (r = -.21) and math (r = -.18). Internalizing behavior problems show even weaker relations with age 10 academic reading and math attainment. All three age 5 problem behavior measures also show negative associations with our age 30 outcomes.
[Insert Table 27 about here]
Basic Models
Turning to the results of the multiple regression analyses, Table 28 shows the regression of the age 30 outcomes, academic attainment and log wage, on the early achievement and behavioral measures. The age 5 cognitive development copying score is strongly predictive of both adult outcomes, even when all additional control sets are included in the regression model. The copying score remain strongly predictive in model 3, in which it has a change interpretation. The copying score also predicts to age 30 hourly wages (p<.01). None of the other cognitive measures are statistically significant predictors in model 3 for either of the two age 30 outcomes.
The age 5 externalizing behavior problems score predicts negatively to age 30 academic attainment (-.11). It is change in the inattention score rather than in externalizing behavior that predicts the age 30 hourly wage. A one standard deviation decrease in inattention at age 5 is associated with a 6% increase in the hourly wage at age 30 (Column 6, Table 28)
[Insert Table 28 about here]
Table 29 reports the summary results for the intermediate outcomes at age 10 and shows
Running head: School Readiness and Later Achievement DO NOT CITE OR QUOTE
43
a similar pattern of continuity across both cognitive and behavioral development. With the exception of profile drawing, all age 5 cognitive measures are substantial predictors for age 10 reading and math. This broad pattern of prediction is not altered substantially with the introduction of additional controls to the regression model.
The age 5 copying score has much larger effects on age 10 reading and math than do the other cognitive measures. It is rather striking that the age 5 copying measure also has a substantially larger effect than the age 5 vocabulary measure on age 10 reading. Inattention at age 5 carries strong negative predictions for age 10 reading and math ability (-.08 for both outcomes). There are no persistent effects of externalizing or internalizing behavior on either age 10 math or reading.
The long-term explanatory power of the copying score is striking. Change in copying ability between 42 months and 5 years is strongly associated with final educational qualifications achieved and with the log wage at age 30. It also appears to cause gains in reading and math scores at age 10. The skills involved in scoring highly in this test appear to be more productive and protective in school than the language skills assessed in the vocabulary tests.
One concern was that the copying score result might be driven by children with a very low score who had mental or physical disabilities and that the variable had no general cognitive predictive power in the rest of the distribution. To test this we relaxed the assumption of continuity in the scoring of this measure and introduced a set of dummy variable measures, indicating the exact score from 1-8 on the copying test. The estimated effect is remarkably linear.
The findings here also show a remarkable persistence of attention and externalizing behavior problems in the prediction of adult labor market outcomes. The presence of attention problems is shown as a high risk factor for reductions in adult wages earned; externalizing behavior predicts more strongly to final educational attainment. Interestingly it is inattention rather than externalizing behavior problems that predicts age 10 reading and math and yet externalizing behavior is a stronger predictor of final educational achievements. To some extent this distinction may reflect the element of choice involved in sitting and passing educational tests during adolescence.
[Insert Table 29 about here]
Subgroup Models
Table 30 presents the results for the sub-group analysis of the age 30 adult outcomes according to gender and SES. High SES is defined as those in SES groups I, II and III (non-manual) and low SES III (manual), IV and V.
The age 5 copying score strongly predicts adult academic attainment for both males and females and for both the high and low SES groups. The effect of the copying score is substantially and significantly greater for the high SES children than for the low SES group (p<.01). Conversely the effect of the human figure drawing score is stronger for the low SES group (p<.01).
The negative effect of externalizing behavior problems on educational achievement is strong for males but absent for females. This gender difference is substantive in magnitude (-.26
Running head: School Readiness and Later Achievement DO NOT CITE OR QUOTE
44
for males compared to .07 for females) and significant statistically (p<.05). There is a negative effect of the inattention score on the academic achievement measure for females and for the low SES group but these interaction effects are not significant statistically.
There are no statistically significant interaction terms for the wage outcome. It is noteworthy that the effect of the copying score on the age 30 wage is very similar across genders and SES groups and that the effect of the inattention score is apparent for both SES groups.
[Insert Table 30 about here]
Discussion
Using six data sets, we have related two key elements of school readiness -- kindergarten-entry academic skills and self-regulation -- to later achievement. Our most complete regression models control for cognitive skills and self-regulation measured prior to kindergarten entry, and in some cases show whether children’s subsequent learning is more closely linked to changes in children’s academic skills or to changes in their self-regulatory skills over the preschool years. Our analysis is designed to identify how preschool interventions instituted around the time of kindergarten entry and focused on augmenting concrete math and reading skills and self-regulation might influence children’s eventual learning.
A Meta-Analysis
To summarize our findings, we performed a meta-analysis of the estimated effects of kindergarten-entry15 achievement and self-regulation, using our full-control models. Each coefficient constituted a separate observation in this analysis. Because we had only a few estimated effects of these measures on completed schooling and earnings outcomes, we limited our analysis to test- or teacher-based reading or mathematics achievement. The 236 coefficients included in our meta-analysis are plotted in Figure 1, with square and diamond symbols indicating coefficients taken from the respective regressions of math and reading outcomes.16 Darker symbols represent statistically significant effects (p<.05); lighter symbols indicate that the coefficient fell short of statistical significance.
[Insert Figure 1 about here]
To quantify these patterns, we ran multiple regressions using these standardized coefficients as dependent variables. Independent variables consisted of: i) type of measure (e.g., math or reading test score, attention-related self-regulation, externalizing and internalizing behaviors and social skills17); ii) elapsed time (scaled in years) between measurement of kindergarten-entry characteristics and the outcome; iii) whether the outcome is math or reading achievement; iv) whether the outcome is based on a test or a teacher report; and v) a set of dummy variables indicating the study from which the given standardized coefficient was estimated. In keeping with standard meta-analytic practices, we weighted each coefficient observation by the inverse of its variance.
Results from three meta-analytic regressions are shown in Table 31. All 236 of the coefficients served as observations to produce the results shown in the first column. The second

Running head: School Readiness and Later Achievement DO NOT CITE OR QUOTE
45
and third columns show results separately for reading and math outcomes. A clear conclusion from these regressions is that only three characteristics matter for subsequent reading and math achievement: kindergarten-entry reading and math skills and measures of attention-related cognitive self-regulation. Moreover, rudimentary mathematics skills appear to matter the most, with an average standardized coefficient of .34.18 The average coefficient on school-entry reading skills was only half that large (.16), and, at .09, the average standardized coefficient for attention-related self-regulation was less than one third as large as the mean math skills coefficient. Despite the fairly high degree of precision with which the effects of the remaining characteristics were estimated, none was statistically significant. Indeed, none had a standardized coefficient that averaged more than .02 in absolute value.
Not surprisingly, results in the second and third columns show that early reading skills predicted later reading achievement better than later math achievement. Less expected is the fact that early math skills appear to matter as much for later reading achievement as for later math achievement. In fact, in the case of later reading achievement, the average standardized coefficient on early math skills was every bit as large as the average coefficient on early reading. Early reading skills matter relatively little for later math achievement. The various measures of self-regulation and social skills were equally important (or, in most cases, unimportant) for the two outcomes.
Turning to the other coefficients listed in Table 31, we see that the standardized coefficients decreased a little (.010 per year) with each additional year between kindergarten entry and the point of assessment of the math or reading outcome. The estimated annual decrements in effect sizes appeared to be larger for reading than math outcomes. On average, teacher-reported outcomes were predicted about as well as were later test scores. None of the study coefficient dummies attained statistical significance
To see if kindergarten-entry skills predicted subsequent test scores better than subsequent teacher reports of academic performance, we added interactions between the kindergarten entry skills and whether the given outcome was based on a test or a teacher report (results not shown). We found no evidence that the impact of early reading and math skills mattered more for test-based than teacher-reported outcomes. We did find one statistically significant interaction -- between the kindergarten-entry assessments of cognitive self-regulation and the mode of outcome assessment. The average coefficient on cognitive self-regulation was nearly twice as large for teacher reports of reading and math achievement (.13) as for reading and math test scores (.07).
Gender interactions with kindergarten-entry academic and self-regulation skills were also estimated for all six data sets,19 while SES interactions were estimated for all but the NICHD SECCYD and MLEPS. In the case of gender interactions, ten of 76 relevant interaction coefficients were .05 or more and statistically significant,20 but there was no consistent pattern in the direction of effects. In the case of SES interactions, only 2 of 30 interaction coefficients were .05 or more and statistically significant. All in all, our results appear to suggest that the influences of achievement and self-regulation are similar for both boys and girls and for children from both low- and high-SES families.
[Insert Table 31 about here]

Running head: School Readiness and Later Achievement DO NOT CITE OR QUOTE
46
Limitations-Real and Imagined
More than the usual number of cautions apply to our research. Our data are longitudinal rather than experimental and thus subject to omitted-variable bias. Because we were able to control for a large set of parental and family background factors as well as, in most cases, measures of the child’s pre-kindergarten cognitive ability and temperament, the remaining bias is likely to be small, but we have no convincing way of assessing the scope or even the direction of residual bias.
There are quite a number of reasons to worry that we may have stacked the deck against the self-regulation measures: i) the achievement-oriented independent and dependent variables have shared method variance; ii) self-regulatory skills may be more difficult to measure than achievement-related skills; iii) in part because parents do not observe their children in school settings, maternal reports are less predictive than teacher reports of later academic achievement; iv) the greater predictive power of early academic skills for academic achievement may merely reflect “continuity” in skills development; v) our models may overcontrol for prior family and child characteristics; vi) self-regulatory skills may matter more for important school-related outcomes such as dropout than test scores do, since dropout reflects some combination of achievement and behavior; vii) most of our outcomes are measured in middle childhood and the relative importance of school-entry factors may change as schools encourage children to become independent learners; viii) the range of the self-regulation measures is restricted relative to the range of the achievement measures; and ix) self-regulation problems may matter more for the achievement of classmates than for the problematic child. We discuss each of these potential problems in turn.
Should we worry that we find larger effects of early achievement-related skills on later achievement because both are assessed with similar tests? Our meta-analysis suggests not: there was no overall evidence of significantly larger impacts of early tests on later tests than on later teacher reports (results not shown). Looking more specifically at third grade outcomes in the ECLS-K, we find that the explanatory power of early test scores does not seem to depend on the way in which the outcomes are measured. The standardized coefficients on kindergarten-entry reading scores are .20 for third-grade reading test scores and .18 for teacher-reported reading achievement. Kindergarten-entry math coefficients are .25 for test-based and .27 for teacher-based reading outcomes. Only in the case of the predictive power of kindergarten-entry math for later mathematics achievement was the shared-variance hypothesis supported, with coefficients of .54 for the third-grade mathematics test but only .30 for teacher-reported math achievement. In no case were the coefficients on the self-regulatory measures as predictive of teacher-report achievement as were early test scores.
In the NICHD SECCYD data, on the other hand, early test scores are consistently less powerful predictors of teacher reports than test-based assessments of later achievement. The standardized coefficients on early reading test scores are .16 for fifth grade reading test scores but only .08 for teacher report of reading. Age 4 ½ math coefficients are .17 for test-based and .11 for teacher-based math outcomes at fifth grade. Several self-regulatory measures were as predictive of teacher-reported achievement as were early test scores. Given the somewhat
Running head: School Readiness and Later Achievement DO NOT CITE OR QUOTE
47
disparate pictures from these two data sets, the jury is still out on the role of shared method variance.
A second potential threat to our general conclusion is that children’s classroom behavior is more difficult to measure than their achievement. Perhaps the lower reliability or validity of the behavioral measures accounts for their weaker explanatory power. It is certainly true that school-entry tests have high internal consistency (e.g., the alphas were at least .84). But the internal consistency of most of the self-regulation measures was also fairly high, particularly in the case of teacher reports, where all were .79 or higher.
To investigate the impact of unreliability on our results, we used the reported internal consistencies in the ECLS-K and NLSY data to estimate regression models using the errors-in-variables reliability adjustment in the EIVREG procedure in Stata. To accord the behavioral measures maximum explanatory power, our regressions included kindergarten-entry academic test scores as well as family and child control variables, but only the given measure of self-regulation or social skills.
For third-grade reading outcomes and no reliability adjustments in the ECLS-K, the standardized coefficients on self-control, interpersonal skills, externalizing problems, internalizing problems and approaches to learning were .02, .02, -.03, .00 and .05, respectively. Reliability adjustments produced very similar coefficients: .02, .03, -.04, .00 and .06. Changes to the coefficients on these measures predicting math achievement were similarly modest.
For the NLSY early adolescent reading test score outcome, respective coefficients associated with hyperactivity/attention, headstrong, antisocial behavior, anxiety/depression and peer problems were -.05, -.02, -.05, -.02 and -.02. Adjusting for reliability generally increased (the absolute value of) these coefficients somewhat, to: -.08, -.03, -.08, -.03, and -.04 respectively. Changes in coefficients predicting early adolescents’ math scores following reliability adjustments were similar. Although the proportionate increases in these coefficients are substantial in some cases, none begins to rival the size of the coefficients on early reading and math.
In sum, it is unlikely that our self-regulation measures lack the explanatory power of the reading and math measures because they are less reliable. The overall validity of the self-regulation measures is much more difficult for us to assess, so there remains the possibility that low validity might lead us to underestimate their predictive power. Of course, the validity of kindergarten-level achievement tests has also been questioned (Hirsh-Pasek, Kochanoff, Newcombe, & de Villiers, 2005; Meisels & Atkins-Burnett, 2004), so validity-based bias is also an issue for the explanatory power of early achievement measures.
A third concern is that we relied on maternal reports of self-regulatory behaviors in the NLSY, IHDP and BCS data sets. Since there are important distinctions in comparative (siblings vs. classmates) and contextual (family vs. school) reference, it is possible that our reliance on maternal reports in these data sets leads to a downward bias in the estimated effects of the self-regulation measures (Gagnon & Tremblay, 1992).
To investigate the issue further, we took data from the ECLS-K, which gathered comparable ratings from parents and teachers of several components of self-regulation, and substituted parent reports for the teacher-report-based measures used in Table 3. In the case of
Running head: School Readiness and Later Achievement DO NOT CITE OR QUOTE
48
third-grade reading test outcomes, the full-control model produced respective standardized coefficients on parent reports of self-control, interpersonal skills, externalizing problems and internalizing problems of .01, .00, -.01, and .03. Substituting teacher reports changed these coefficients very little, to .01, .02, .00, and .01. In only one case did the parent or teacher report measures predict children’s later achievement, and that was for a parent rather than teacher report of externalizing problems in the math outcome regression. This suggests that our reliance on maternal reports rather than teacher reports of children’s self-regulatory skills is not likely to bias our results.
The NICHD SECCYD also gathered reports of self-regulation from both teachers and parents, while the majority of the behavior problem questions were identical, additional questions were asked of teachers. For example, teachers were asked additional questions about attention problems that affect learning in the classroom (i.e., fails to finish things, has difficulty learning, inattentive, fails to carry out assigned tasks), and teacher ratings of aggression included extra items such as disturbs other pupils and talks out of turn. Many of the questions about social skills were specific to the home or classroom setting. In particular, mothers were asked additional questions about responsibility (i.e., requests permission before leaving the house, answers the phone appropriately) that teachers were not asked.
Two consistent patterns occurred when maternal reports were substituted for teacher reports in the full-control models predicting fifth grade outcomes. Whereas maternal report of attention problems was never a significant predictor of either test scores or teacher rated achievement in reading or math (coefficients ranged from -.01 to -.03), teacher-rated attention problems did consistently predict low levels of achievement across all measures of achievement (coefficients ranged from -.11 to -.17). Second, when teacher-rated reading and math achievement is considered, mother reports of aggression (coefficients were -.01 and .00) and social skills (coefficients were -.01 and .02) were never significant predictors of teacher-rated achievement. With the exception of social skills and math achievement at fifth grade, the corresponding coefficients for teacher-reports of aggression and social skills on teacher-rated reading and math achievement were statistically significant (both coefficients were .08 for aggression, and coefficients were .11 and .06 for social skills). All told, there is mixed evidence for possible bias in the estimated influences of NLSY, IHDP and BCS maternal reports of self-regulatory behavior.
A fourth concern is that cross-time associations in cognitive skills may merely reflect “continuity” in skills. If continuity is understood to mean high inter-temporal correlations, then continuity is problematic for our conclusions only to the extent that the correlations reflect spurious rather than causal effects. A causal explanation for high inter-temporal correlations would be one in which achievement is the product of a sequential process of skill acquisition, with early skills serving as a necessary foundation for later skills (Resnick, 1989). This does not pose a problem for our conclusions, because this causal source of continuity is precisely what we have designed our analyses to uncover.
In contrast, a spurious explanation for “continuity” is one in which continuity in some omitted variable accounts for the close association between early and later achievement. For example, it could be that genetic cognitive skill endowments are omnipotent and high
Running head: School Readiness and Later Achievement DO NOT CITE OR QUOTE
49
correlations between test scores over time reflect these unchanging endowments. In this case, an early academic skills intervention would have no lasting impacts on achievement.
Since our estimates are based on non-experimental methods, they are likely to reflect some combination of causal and spurious effects. We have made every effort to eliminate sources of spurious continuity. In all but the ECLS-K data set, measures of cognitive ability prior to school-entry are included in our “full control” models and thus adjust estimates of the effects of early reading and mathematics skills for differences in basic cognitive ability. In the case of the ECLS-K and MLEPS, we showed that academic skills acquired by the spring of the kindergarten year were predictive of third-grade outcomes even when kindergarten-entry test scores were controlled.
Also arguing against a spurious continuity effect is the fact that early mathematics skills were as predictive of later reading achievement as were early reading skills, even after adjusting for pre-kindergarten cognitive ability. Continuity would lead us to expect a similar pattern to that found for mathematics, in which early math skills are more predictive of later achievement than are early reading skills. That we did not find such patterns for reading suggests that there is something about the acquisition of early mathematical skills that promotes achievement across multiple domains.
The fifth issue, overcontrol, is more subtle. Regression models estimated on most of our data sets include a wide range of control variables, such as assessments of family functioning, socioeconomic status, mental health, parenting practices, child-care influences, and, usually, antecedent measures of children's social-behavioral and cognitive functioning. By controlling for early self-regulatory and academic skills, are we not robbing the kindergarten-entry measures of some of their explanatory power?
To set ideas, suppose that self-regulation matters a great deal for later academic achievement but that its influence is exerted by enhancing children’s early language and numeracy skills. In this case, preschool controls for achievement might rob our kindergarten-entry self-regulation measure of all of its formidable explanatory power. Alternatively, suppose that self-regulation trajectories are set indelibly in infancy and early childhood, perhaps by some combination of inherent temperament and early parenting. In this case, controls for preschool self-regulation would soak up much of the explanatory power of school-entry self-regulation.
We acknowledge this consequence of our approach, but remain unapologetic in choosing it. When our pre-kindergarten controls are similar to our kindergarten-entry measures, our regression models constitute a kind of change model in which naturally-occurring changes in self-regulation and other aspects of children’s early skills and behaviors between preschool and kindergarten are related to subsequent achievement. Precisely this kind of formulation is needed to address the policy question of whether remediable aspects of preschool behavior and cognitive skills matter for later learning. Indelible trajectories will render null both our coefficients and the intervention impacts.
Two addition notes regarding overcontrol: An overcontrol argument applies equally to the cognitive as well as the self-regulatory measures, and thus cannot account for the differential explanatory power between the two kinds of measures without additional assumptions. Second, our general pattern of results holds regardless of whether prior controls are included or not. In
Running head: School Readiness and Later Achievement DO NOT CITE OR QUOTE
50
the case of third-grade reading outcomes in the ECLS-K, for example, the respective standardized coefficients on early reading and math achievement, self-control, interpersonal skills, externalizing problems, internalizing problems and approaches to learning in the full-control models were: .18, .27, .01, .02, .00, .00 and .04, respectively. In the absence of control variables, the respective coefficients were not much larger: .20, .25, -.02, .01, -.05, .01, and .06. Only in the case of externalizing problems does the coefficient become statistically significant when the controls are removed, but even then the standardized coefficient is only -.05. Surprisingly, then, despite the added explanatory power of our control variables, coefficients on our self-regulation measures changed relatively little in most of our data sets, which argues against indelible and consequential self-regulatory trajectories.21
Sixth, self-regulatory skills may matter more for school outcomes such as special education classification, drop out or criminality than for the test score and teacher-reported achievement outcomes used in our studies. The outcomes of our analyses are indeed limited, and it may well be that behavioral measures of school success are more strongly linked to children’s school-entry self-regulatory skills than to academic skills. For the British Cohort Study, externalizing behavior problems were a significant predictor high completed schooling (although not wages). In the case of the other five data sets, our efforts to test for this included only estimating models of the effects of early academic and self-regulatory skills on grade retention, an outcome that includes elements of both academic and behavioral competence. Results were quite similar to those from models with purer achievement-related outcomes.
Only the BCS has followed study participants long enough to measure their completed schooling, and it found school-entry inattention problems to be a significant predictor of school completion but not labor market success. Other achievement-related outcomes, such as work habits, classroom engagement, and motivation for learning may be associated with self-regulation. We intend to a larger number of non-achievement school outcomes in our future work.
A seventh concern is the general absence of data on children from fifth through twelfth grade. Achievement in middle and high schools involve increasingly complex reading and mathematical tasks, and it may be that general cognitive skills, particularly oral language and conceptual abilities are necessary skills for comprehension and advanced problem solving (NICHD Early Child Care Research Network, 2005a; Scarborough, 2001; Snow et al., 1998; Storch & Whitehurst, 2002; Whitehurst & Lonigan, 1998; Baroody, 2003; Ferrari & Sternberg, 1998; Hiebert & Wearne, 1996). It is also possible that, once children are past learning the “basics” in the early grades, the relative importance of early self-regulation skills increase when children are required to be independent learners, allocate their own time, and complete group work and assignments.
For a general look at the evidence about whether any of the impacts of academic or self-regulatory measures are growing over time, we reran our meta-analytic regressions including interactions between each of the kindergarten-entry measures and time between kindergarten entry and the outcome assessment. Coefficients on the interactions with early reading, early math and self-regulation were all negative and ranged from -.023 to -.039 annual decrements in effect sizes. Since most of our data comes from elementary-school tests, it remains possible that these interactions might reverse sign if outcomes were measured during middle or high school.
Running head: School Readiness and Later Achievement DO NOT CITE OR QUOTE
51
The NLSY data are most telling on this point, since they provide comparable test-score based outcomes at both ages 7/8 and age 13/14. School-entry hyperactivity retained its modest explanatory power (effect sizes around -.07) between these two points, while the explanatory power of other predictors either fell (in the case of early reading and math skills) or remained insignificant (in the case of all other self-regulatory measures). In the case of NICHD SECCYD outcomes measured in third and fifth grade, there was mixed evidence on the direction of coefficient change.
An eighth methodological threat to our conclusions is that several of the self-regulatory measures are counts of students’ problems, which restricts their range and perhaps explanatory power relative to the full-scale achievement measures. This is a reasonable concern, and our attempts to address it consisted of estimating spline regressions, which allow for effects of the self-regulation to be non-linear. In these analyses, two linear segments per measure were fit to the data. The first segment was estimated for the most problematic third of the sample distribution and the second segment was estimated for the other two-thirds. If, say, externalizing behavior problems matter a lot for the most problematic children but, owing to restricted range, much less for the others, then the slope of the line fit to the most problematic group should perhaps rival the slopes of lines on the early reading or math achievement measures.
As discussed in our results section, we found little systematic evidence that this was the case. In the ECLS-K data, there was some evidence that improving early math skills mattered more for low math achievers, while the NLSY showed that hyperactivity mattered more for children with the highest levels of it. No significant nonlinearities emerged in the analysis of NICHD SECCYD data. All in all, it does not appear that the reduced variance of some of our self-regulatory measures has biased our conclusions.
The ninth and final concern is that the impact of self-regulatory measures such as externalizing behaviors may be larger for classmates than for the problematic child. This could happen if classroom activity is disrupted to the point that teaching becomes difficult. Testing for this requires information on the behaviors of all children in the classroom, a condition met by none of the data sets we analyze. This possibility remains on the agenda for future research.
Implications
Despite studies suggesting that self-regulation skills make important, independent contributions to school success (Alexander et al., 1993; McClelland et al., 2000; Yen et al., 2004; Howse et al., 2003), we found little evidence that this was the case after taking into account preschool levels of cognitive ability and self-regulation. An important exception was that a child’s ability to sustain attention did predicted later learning consistently, although its average effect size on later reading and math achievement was only .09 per standard-deviation increase in attention. Considerably more important than any of the self-regulatory skills were school-entry academic skills such as knowing numbers and ordinality (the average effect size of beginning math skills was .34) and knowing letters, words and beginning and ending word sounds (the average effect size of beginning reading skills across our studies was .16). The average effect sizes of emotional self-regulation and social skills were essentially zero.
Running head: School Readiness and Later Achievement DO NOT CITE OR QUOTE
52
What do our results suggest about the determinants of children’s academic achievement and how learning occurs? Given the impressive predictive power of early academic skills and unimportance of self-regulatory behavior other than attention, it indeed appears that knowledge begets knowledge more than self-regulation facilitates the acquisition of knowledge. During the first three years of school children are learning the mechanics of literacy and mathematics. Developmental theory suggests that early achievement is the merger of children’s informal, intuitive knowledge of central concepts that should have been developed in early childhood and the algorithms formally taught in the elementary school curriculum (Adams et al., 1998; Tunmer & Nesdale, 1998; Griffin, Case, & Capodilupo, 1995; Baroody, 2003).
With regard to self-regulation, where possible we separated cognitive and emotional components of self-control, rather than relying on the broad construct of “externalizing problems”. The distinction between cognitive and emotional self-regulation is warranted given current theory and research on young children’s self-regulation (Eisenberg, et. al., 2005; Olson, et al., 2005; Raver, 2004; Raver, et al., 2005; Rhoades, et al., 2005). However, the indicators of cognitive self-regulation that were included in this study are limited to attention, impulsivity, or hyperactivity. None of our studies focused on the assessment of self-regulation, so we lack the detailed measures of other cognitive self-regulation skills that may be relevant to school success. Notably absent are measures of executive function, planning, “effortful” control of attention or action, and task persistence that might be important predictors of achievement. For example, attentional control, or the ability to shift attention away from distracting stimuli, may be a particularly beneficial aspect of cognitive self-regulation for learning in the classroom environment. On the other hand, the measures we were able to include are likely to be highly correlated with these more refined measures, so it is unclear whether our conclusions would change if better measures were available to us.
The striking predictive power of early mathematical skills raises important questions as to why. Through interaction with their environment, young children have the potential to develop considerable mathematical knowledge, in tandem with verbal knowledge. Why have we observed that early math is a much more powerful predictor of later reading achievement than early reading is of later math achievement? One possibility is the acquisition of algorithms in early arithmetic learning. It might be that the algorithmic nature of intuitive mathematical knowledge that children develop early on influences their spontaneous use of similar strategies during emergent literacy, especially when faced with decoding links for orthographic word forms. More specifically, decoding during beginning literacy stages could be facilitated by the intuitive algorithms associated with addition and subtraction given that orthographic representations (letters) of phonetic sounds are combined or added together to make a word unit (c + a + r). It seems even more plausible that without such natural back-up strategies, learning to read might be more difficult. For example, addition processes seem active to a child in both math (1 + 1) and reading letters for sounds (c + a + r).
Another consistent theme across our studies is that cognitive self-regulation, whether measured by attention, impulsivity, or hyperactivity is modestly but consistently associated with poor achievement outcomes. Why cognitive self-regulation rather than emotional self-regulation? Since cognitive self-regulation skills increase the time children are engaged and participating in academic endeavors, it is perhaps not surprising that they predict later success. Despite the fact that children who are skilled in emotional self-regulation can potentially profit
Running head: School Readiness and Later Achievement DO NOT CITE OR QUOTE
53
from the educational experiences provided in the classroom, it does not appear to be the case that entering school with more of these skills promotes later achievement. Although all of the studies included in these analyses draw most of their children with variations in behavior problems such as aggression and attention in the normal range, all contain at least some children falling in the clinical ranges of behavior problems. None of our attempts to estimate bigger impacts for reducing problem behavior among the most problematic children supported the idea that teachers might able to surmount most instances of problematic emotional self-regulation. It remains possible that a more focused analysis, based on samples with larger concentrations of clinical samples might reach different conclusions.
The results of this study suggest that early academic skills make a strong contribution to reading and math achievement, which suggests that reading and math should take a prominent place in the curriculum of early childhood programs. Indeed, this perspective is not new, and has been endorsed by both the National Research Council’s Committee on the Prevention of Reading Difficulties in Young Children and the joint position statement issued by the National Association for the Education of Young Children (NAEYC) and the National Council of Teachers of Mathematics (NCTM). This conclusion does not imply that “drill-and-practice” curricula are required. Play-based curricula designed with the needs of children in mind can easily foster the development of these skills in the preschool years (Hirsch-Pasek, et al., 2003). Learning games and activities that promote early literacy and math concepts and skills can be engaging and fun. Taking early math skills as an example, the Big Math for Little Kids program has been designed to capitalize on children’s interest in exploring and manipulating numbers (Greenes, Ginsburg, & Balfanz, 2004). Play-based curriculum also has the added benefit of fostering cognitive-self regulation. During play, children also spontaneously demonstrate a greater capacity for self-regulation in order to fit in with the rules and prescribed roles of the play situation (Berk, 1994).
Policy
Based on the results of our analysis, we would expect that preschool mathematics interventions would best promote both math and reading achievement and reduce early grade failure; early reading interventions would promote later reading achievement better than later math achievement; and interventions that successfully boost children’s ability to pay attention would have beneficial but more modest effects on academic achievement and grade failure. On the other hand, we would expect that interventions that succeed only in improving non-attention-related behaviors would fail to promote subsequent achievement.
A number of carefully designed pre-school intervention programs have produce cognitive and academic achievement gains, and long-term reductions in referral for special education services, grade retention, school drop-out and increases in adult educational attainment (Lazar & Darlington, 1982; Reynolds, 1994; Royce et al., 1983; Reynolds & Temple, 1998; Ramey et al., 2000; Campbell et al., 2002). But, most of these programs had a broad curriculum designed to enhance cognitive and social skills, so they do not provide tests of the relative value of academically-focused and behaviorally-oriented curricula.
Running head: School Readiness and Later Achievement DO NOT CITE OR QUOTE
54
Indeed, a key shortcoming of early childhood intervention research is that many programs provide a combination of services to children, so it is not possible to disentangle impacts of the self-regulation and academic components of the program. These programs show scattered effects on achievement and self-regulation (Love et al., 2003; U.S. Department of Health and Human Services, Administration for Children and Families, 2005), with some indication that long-term effects on grade retention and special education (Lazar & Darlington, 1982). The few behavioral interventions that also estimate impacts on later academic outcomes tend to begin after school entry (Coie & Krehbiel, 1984; Dolan et al., 1993; Tremblay et al., 1995), which leaves open the possibility that the mixed effects that they produced on achievement, grade retention, and delinquent behavior might be larger if the problems were addressed instead during the early childhood years.
In thinking about the implications of our findings for policy, it is crucial to go beyond Cohen’s (1988) rules of thumb regarding effect sizes and consider the feasibility and cost of interventions aimed at increasing self-regulatory or academic skills. It is the ratio of the effect size to the intervention’s cost that matters. Some argue that even a small effect size can be important on a population basis, since a small effect size multiplied by a large population base can add up to a large aggregate benefit. While it is certainly true that a small effect multiplied by 10 or 20 million children can add up to a large aggregate benefit, the key is still the ratio of benefits to costs. If that ratio is less than one, then the per-child cost multiplied by 10 or 20 million children is an even bigger number relative to the aggregate benefit. In other words, aggregating up a small, but costly benefit will yield a larger, but more even costly benefit.
In the case of early reading, math and self-regulatory skill interventions with identical costs and identically sized effects on their targeted skills, our results suggest that the ratio of subsequent achievement benefits relative to costs would be highest in the case of an early math intervention, next highest for a reading intervention, next highest for the attention-focused intervention, and close to zero in the case of interventions focused on emotional self-regulation. But since we know little about the comparative costs of these kinds of interventions, it is conceivable that an attention-enhancing intervention costs so much less than a math-skills-enhancing intervention that the former is preferable to the latter. Given the pattern of effects sizes, it is highly unlikely that any intervention focused solely on improving emotional self-regulation or social skills during the preschool years would have a cost-effective impact on later school achievement. It is possible that an intervention targeting children’s self-regulatory skills during infancy might yield larger benefits for children’s subsequent achievement, although our approach can neither support nor refute that hypothesis.
The design of preschool interventions need not be either/or choices if a curriculum is able to promote a variety of academic and self-regulatory skills. Indeed, as in the whole child approach, the synergy of these elements is a standard assumption in early education. Programs like Head Start have an even broader range of goals that include improving child health and the ability of parents to promote children’s learning, with early evidence from the National Head Start Study indicating scattered impacts on pre-reading, behavior problems, dental and overall health and learning-enhancing parent-child interactions (Puma et al., 2005). Given our results, it is disappointing that the National Head Start Study failed to find short-run impacts on early math skills.

Running head: School Readiness and Later Achievement DO NOT CITE OR QUOTE
55
The policy implications of our analyses are limited by our focus on achievement and early grade failure. These are certainly important outcomes. Cawley et al. (1997) demonstrate the importance of early-adolescent achievement test scores, even net of completed schooling, for later labor-market success. And given that accountability pressures are putting greater numbers of children at risk for early grade failure (Cosden, Zimmer, & Tuss, 1993; Rosenkoetter, 2001), curricular innovation aimed at improving children's potential for learning during kindergarten can help to optimize their academic performance and thus reduce the concomitants of early school failure during the elementary school years.
At the same time, we acknowledge the value of other curricular objectives such teaching children to be autonomous learners, affecting motivation to learn, teaching them to interact successfully with each other and with adults, etc. Virtually untested in our analyses is the possibility that behavioral interventions might have beneficial impacts on school-related behaviors and outcomes that combine elements of achievement and behavior, such as assignment to special education classes, drop out or suspensions. As illustrated in the High/Scope Perry Preschool intervention, it is quite possible for early interventions to have only transitory impacts on achievement but formidable life-course impacts on school- and labor-market-related success (Hohmann & Weikart, 2002; Dickens, 2005; Schweinhart, in press).
Finally, our results also have implications for the controversy over the reliability of tests given to children when they first enter school. All of our data sets suggest that tests administered around the point of kindergarten entry can be a highly reliable way of assessing early skills. Moreover, in most cases early reading and math scores are relatively powerful predictors of later achievement. At the same time, most of the variation in later school achievement cannot be attributed to kindergarten-entry factors, so the potential for productive interventions during the early school grades remains.
Ours are hardly the final words on the comparative impact of early academic and self-regulatory skills. If nothing else, though, our data challenge the common assertion that the two sets of skills are of equal importance for a child’s academic success.
Running head: School Readiness and Later Achievement DO NOT CITE OR QUOTE
56
References Achenbach, T. M. (1991). Manual for the child behavior checklist/4-18 and Profile. Burlington,
VT: University of Vermont, Department of Psychiatry.
Achenbach, T. M. (1992). Manual for the child behavior checklist / 2-3 and 1992 Profile. Burlington, VT: University of Vermont Department of Psychiatry.
Achenbach, T. M., & Edelbrock, C. S. (1984). Psychopathology of childhood. Annual Review of Psychology, 35, 227-256.
Achenbach, T. M., Edelbrock, C. S., & Howell, C. T. (1987). Empirically-based assessment of the behavioral/emotional problems of 2- and 3-year-old children. Monographs of the Society for Research in Child Development, 46.
Adams, M. J., Treiman, R., & Pressley, M. (1998). Reading, writing and literacy. In I. Sigel & A. Renninger (Eds.), Handbook of Child Psychology: Child Psychology and Practice (5th Ed., vol. 4, pp 275-355). New York: John Wiley & Sons.
Alexander, K. L., Entwisle D. R., & Dauber, S. L. (1993). First grade classroom behavior: Its short- and long-term consequences for school performance. Child Development, 64, 801-514.
Anastasi, A. (1988). Psychological testing (6th ed.). New York: Macmillan.
Aunola, K., Leskinen, E., Lerkkanen, M., & Nurmi, J. (2004). Developmental dynamics of math performance from preschool to grade 2. Journal of Educational Psychology, 96, 699-713.
Aylward, G. P., Pfeiffer, S. I., Wright, A., & Verhulst, S. J. (1989). Outcomes studies of low birth weight infants published in the last decade: A meta-analysis. Journal of Pediatrics, 115, 515-520.
Baker, P. C., Keck, C. K., Mott, F. L., & Quilan, S. V. (1993). NLSY Child Handbook, Revised Edition: A guide to the 1986-1990 NLSY child data. Columbus, Ohio: The Ohio State University, Center for Human Resource Research.
Baroody, A. J. (2003). The development of adaptive expertise and flexibility: The integration of conceptual and procedural knowledge. In A. J. Baroody & A. Dowker (Eds.), The Development of Arithmetic Concepts and Skills: Constructing Adaptive Expertise Studies. Mahwah, N.J. : Lawrence Erlbaum Associates, Inc.
Barriga, A. Q., Doran, J. W., Newell, S. B., Morrison, E. M., Barbetti V., & Robbins, B. D. (2002). Relationships between problem behaviors and academic achievement in adolescents: The unique role of attention problems. Journal of Emotional and Behavioral Disorders, 10, 233-240.
Baumeister, R.F, & Vohs, K.D. (Eds.). (2004). Handbook of Self-Regulation: Research, Theory, and Applications. New York: Guilford Press.
Becker, G. (1964). Human Capital. New York: Columbia University Press.
Berninger, V. W., & Richards, T. L. (2002). Brain literacy for educators and psychologists. San Diego, CA: Academic Press.
Running head: School Readiness and Later Achievement DO NOT CITE OR QUOTE
57
Berk, L. E. (1994). Vygotsky’s theory: The importance of make-believe play. Young Children, 50, 30-39.
Bowles, S., Gintis, H., & Osborne, M. (2001). The determinants of earnings: A behavioral approach. Journal of Economic Literature, 34, 1137-1176.
Bracken, B. A. (1984). Bracken basic concept scale. San Antonio, TX: Psychological Corporation.
Bridges, L. J., Denham, S. A., & Ganiban, J. M. (2004). Definitional issues in emotion regulation research. Child Development, 75, 340-345.
Brooks-Gunn, J., Klebanov, P. K., & Liaw, F. (1995). The learning, physical and emotional environment of the home in the context of poverty: The Infant Health and Development Program. Children and Youth Services Review, 17, 396-408.
Bush, G. W. (2002, April 3) President, Mrs. Bush Promote Early Childhood Education Initiative. Speech posted by the Office of the Press Secretary. Retrieved July 6, 2005, from http://www.whitehouse.gov/news/releases/2002/04/20020403-6.html
Byles, J., Byrne, C., Boyle, M., & Offord, D. (1988). Ontario Child Health Study – reliability and validity of the general functioning subscale of the McMaster Family Assessment Device. Family Process, 27, 97-104.
Bynner, J. Ferri, E., & Shepherd, P. (Eds.) (1997). Twenty Something in the 1990s: Getting On, Getting By, Getting Nowhere. Aldershot: Ashgate.
Caldwell, B. M., & Bradley, R. H. (1984). Home observation for measurement of the environment. Little Rock: University of Arkansas Press.
Campbell, F. A., Ramey, C., Pungello, E. P., Sparling, J. J., & Miller-Johnson, S. (2002). Early childhood education: Young adult outcomes from the Abecedarian Project. Applied Developmental Science, 6, 42-57.
Card, D. (1999) The Causal Effect of Education on Earnings. In O. Ashenfelter & D. Card (Eds.), Handbook of Labor Economics, Vol. 3A, Chapter 30, pp. 1801-1863.
Carneiro, P. & Heckman, J. (2003). Human Capital Policy. In J.J. Heckman & A.B. Krueger (Eds.), Inequality in America: What role for human capital policies? (pp. 77-239). Cambridge, MA: The MIT Press.
Case, R. (1975). Social class differences in intellectual development: A Neo-Piagetian investigation. Canadian Journal of Behavioral Sciences/Revue Canadienne des Sciences du Comportement, 7(3), 244-261.
Case, R. (1996). Reconceptualizing the nature of children’s conceptual structures and their development in middle childhood. Monographs of the Society for Research in Child Development, 61(1-2), 1-26.
Case, R., Griffin, S., & Kelly, W. M. (2001). Socioeconomic differences in children’s early cognitive development and their readiness for schooling. In S. L. Golbeck, Psychological perspectives on early childhood education. Reframing dilemmas in research and practice (pp. 37-63). London: Lawrence Erlbaum Associates.
Running head: School Readiness and Later Achievement DO NOT CITE OR QUOTE
58
Cawley, J., Heckman, J. & Vytlacil, E. (2001). Three Observations on Wages and Measured Cognitive Ability. Labor Economics, 8, 419-442.
Center for Human Resource Research (2004). A Guide to the 1979-2002: National Longitudinal Survey of Youth. Washington, DC: US Department of Labor, Bureau of Labor Statistics.
Chamberlain, R. & Davey, A. (1976). Cross-sectional study of developmental test items in children aged 94 – 97 weeks: report of the British Births Child Study. Developmental Medicine and Child Neurology, 18, 54 – 70.
Cohen, J. (1988). Statistical power analysis for the behavioral sciences (2nd ed.). Hillside, N.J.: Erlbaum.
Coie, J. & Krehbiel, G. (1984). Effects of academic tutoring on the social status of low-achieving, social rejected children. Child Development, 55, 1465-1478.
Conduct Problems Prevention Research Group, (1992). A developmental and clinical model for the prevention of conduct disorder: The FAST Track Program. Development and Psychopathology, 4, 509-527.
Conduct Problems Prevention Research Group (2002). Evaluation of the first three years of the Fast Track Prevention Trial with children at high risk for adolescent conduct problems. Journal of Abnormal Child Psychology, 30, 19-35.
Cosden, M., Zimmer, J., & Tuss, P. (1993). The impact of age, sex, and ethnicity on kindergarten entry and retention decisions. Educational Evaluation and Policy Analysis, 15(2), 209-222.
Cunha, F., Heckman, J., Lochner, L., & Masterov, D. (forthcoming) Interpreting the evidence on life cycle skill formation. In E. Hanushek & F. Welch (Eds.) Handbook of the Economics of Education, North Holland.
Dauber, S. L., Alexander, K. L., & Entwisle, D. R. (1993). Characterisitcs of retainees and early precursors of retention in grade: Who is held back? Merrill-Palmer Quarterly, 39, 326-343.
Davenport, B. M. (1976). A comparison of the Peabody Individual Achievement Test, the Metropolitan Achievement Test, and the Otis-Lennon Mental Ability Test. Psychology in the Schools, 13, 291-297.
DeRosier, M. E., & Thomas, J. M. (2003). Strengthening sociometric prediction: Scientific advances in the assessment of children’s peer relations. Child Development, 75, 1379-1392.
Dickens, W. T. (2005). Genetic differences and school readiness. The Future of Children, 15, 55-69.
Dobkin, P. L., Tremblay, R. E., Mâsse, L. C., & Vitaro, F. (1995). Individual and peer characteristics in predicting boys’ early onset of substance abuse : A 7-year longitudinal study. Child Development, 66, 1198-1214.
Dolan, L., Kellam, S., Brown, C., Werthamer-Larsson, L., Rebok, G., Mayer, L., et al. (1993). The short-term impacts of two classroom-based preventive interventions on aggressive
Running head: School Readiness and Later Achievement DO NOT CITE OR QUOTE
59
and shy behaviors and poor achievement. Journal of Applied Developmental Psychology, 14, 317-345.
Dunn, L. M., Thériault-Whalen, C. M., & Dunn, L. M. (1993). Échelle de vocabulaire en images Peabody. Adaptation française du Peabody Picture Vocabulary test-revised. Manuel pour les formes A et B. Toronto: Psycan.
Dunn, L. M., & Markwardt, F. C. Jr. (1970). Peabody Individual Achievement Test Manual. Circle Pines, MN: American Guidance System.
Eisenberg, N., Sadovsky, A., & Spinrad, T. L. (2005). The relations of problem behavior status to children’s negative emotionality, effortful control, and impulsivity: Concurrent relations and predictions of change. Developmental Psychology, 41, 193-211.
Eisenberg, N., Spinrad, T. L., & Morris, A.S. (2002). Regulation, resiliency, and quality of social functioning. Self & Identity, 1, 121-129.
Ensminger, M. E., & Slusarcick, A. L. (1992). Paths to high school graduation or drop-out: A longitudinal study of a first-grade cohort. Sociology of Education, 65, 95-113.
Epstein, N., Baldwin, L., & Bishop, D. (1983). The McMaster Family Assessment Device. Journal of Marital and Family Therapy, 9, 171-180.
Entwisle, D. R., & Alexander, K. L. (1996). Family type and children's growth in reading and math other the primary grades. Journal of Marriage and the Family, 58, 341-355.
Entwisle, D., Alexander, K., & Olson, L. (2005). First grade and educational attainment by age 22: A new story. American Journal of Sociology, 110, 1458-1502.
Farkas, G. (2003). Cognitive skills and noncognitive traits and behaviors in stratification processes. Annual Review of Sociology, 29, 541-562.
Feinstein, L., & Bynner, J. (2004). The importance of cognitive development in middle childhood for adult socioeconomic status, mental health, and problem behavior. Child Development, 75, 1329-1339.
Ferrari, M., & Sternberg, R. J. (1998). The development of mental abilities and styles. In W. Damon (Ed.), Handbook of Child Psychology: Child Psychology and Practice (5th Ed., vol. 2, pp 899-946). New York: John Wiley & Sons.
Ferri, E., & Smith, K. (2003). Family life. In E. Ferri, J. Bynner & M. Wadsworth (Eds.), Changing Britain, Changing Lives. Three generations at the turn of the century. London: Institute of Education. University of London.
Frick, P. J., Kamphaus, R. W., Lahey, B. B., Loeber, R, Christ, M. A. G., Hart, E. L., et al. (1991). Academic underachievement and the disruptive behavior disorders. Journal of Consulting and Clinical Psychology, 59, 289-294.
Gagnon, C., Vitaro, F. & Tremblay, R.E. (1992). Parent-teacher agreement on kindergarteners' behavior problems: a Research Note. Journal of Child Psychology and Psychiatry, 33, 1255-1261.
Running head: School Readiness and Later Achievement DO NOT CITE OR QUOTE
60
Gilliam, W. S. (2005). Prekindergarteners left behind: Expulsion rates in state prekindergarten programs. Accessed on 5/23/05 at http://www.fcd.us.org/PDFs/NationalPreKExpulsionPaper03.02_new.pdf
Ginsburg, H. P. Klein, A., & Starkey, P. (1998). The development of children’s mathematical thinking: Connecting research with practice. In I. Sigel & A. Renninger (Eds.), Handbook of Child Psychology: Child Psychology and Practice (5th Ed., vol. 4, pp 401-476). New York: John Wiley & Sons.
Goldsmith, A.H., Veum, J.R. & Darity, W. Jr. (1997). The impact of psychological and human capital on wages. Economic Inquiry, 35, 815-829.
Greene, W.H., (1993) Econometric Analysis. Macmillan Publishing, NY.
Gresham, F. M., & Elliott, S. N. (1990). The social skills rating system. Circle Pines, MN: American Guidance Service.
Griffin, S., Case, R., & Capodilupo, A. (1995). Teaching for understanding: The importance of the central conceptual structure in the elementary mathematics curriculum. In A. McKeough, J. Lupart, & A. Marini (Eds.), Teaching for Transfer (pp. 123-151, ch. 6). Mahwah, NJ: Lawrence Erlbaum Associates.
Griffin, S. A., Case, R., & Siegler, R. S. (1994). Rightstart: Providing the central conceptual prerequisites for first formal learning of arithmetic to students at risk for school failure. In K. McGilly (Ed.), Classroom lessons: Integrating cognitive theory and classroom practice (pp. 1-50). MIT Press/Bradford Books.
Harris, D.B. (1963). Children’s Drawings as Measures of Intellectual Maturity. New York: Harcourt, Brace & World.
Heckman, J.J., & Rubinstein , Y. (2001). The importance of noncognitive skills: Lessons from the GED Testing Program. American Economic Review, 145-149.
Hiebert, J., & Wearne, D. (1996). Instruction, understanding, and skill in multidigit addition and subtraction. Cognition and Instruction, 14, 251-283.
Hirsh-Pasek, K., Golinkoff, R. M., & Eyer, D. (2003). Einstein never used flashcards: How our children really learn and why the need to play more and memorize less. Rodale.
Hohmann, M. & Weikart, D. P. (2002) Educating young children: Active learning practices for preschool and child care programs (2nd Edition). Ypsilanti, MI: High/Scope Press.
Howse, R. B., Lange, G., Farran, D. C., & Boyles, C. D. (2003). Motivation and self-regulation as predictors of achievement in economically disadvantaged young children. The Journal of Experimental Education, 71, 151-174.
Hoy, E. A., Bill, J. M., & Sykes, D. H. (1988). Very low birth weight: A long-term development impairment? International Journal of Behavioral Development, 11, 37-67.
Infant Health and Development Program. (1990). Enhancing the outcomes of low-birthweight, premature infants. Journal of the American Medical Association, 263, 3035-3042.
Running head: School Readiness and Later Achievement DO NOT CITE OR QUOTE
61
Jencks, C., Bartlett S., Corcoran M., Crouse J., Eaglesfield D., Jackson G., et al. (1979). Who Gets Ahead? The Determinants of Economic Success in America. New York: Basic Books.
Klebanov, P. K., Brooks-Gunn, J., & McCormick, M. C. (1994a). School achievement and failure in very low birth weight children. Journal of Developmental and Behavioral Pediatrics, 15, 248-256.
Klebanov, P.K., Brooks-Gunn, J., & McCormick, M. C. (1994b). Classroom behavior of very low birth weight elementary school children. Pediatrics, 94, 700-708.
Koppitz, E.M. (1968). Psychological Evaluation of Children’s Human Figure Drawings. New York: Grure & Stratton.
Kuhn, D. (1995). Scientific thinking and knowledge acquisition. Monographs of the Society for Research in Child Development, 60(4), 152-157.
Ladd, G. W., Birch, S. H., & Buhs, E. S. (1999). Children’s social and scholastic lives in kindergarten: Related spheres of influence? Child Development, 70, 1373-1400.
LaParo, K. M., & Pianta, R.C. (2000). Predicting children's competence in the early school years. A meta-analytic review. Review of Educational Research, 70, 443-84.
Lazar, I. & Darlington, R. B. (1982). Lasting effects of early education. Monographs of the Society for Research in Child Development, 47.
Lengua, L.J. (2003). Associations among emotionality, self-regulation, adjustment problems, and positive adjustment in middle childhood. Journal of Applied Developmental Psychology, 24, 595-618.
Lewit, E.M., & Baker, L. S. (1995). School readiness. The Future of Children, 5, 128-139.
Lin, H., Lawrence, F. R., & Gorrell, J. (2003). Kindergarten teachers’ views of children’s readiness for school. Early Childhood Research Quarterly, 18, 225-237.
Love, J, M., Harrison, L., Sagi-Schwartz, A., van Ijzendoorn, M. H., Ross, C., Ungerer, J. A., et al. (2003) Child care quality matters: How conclusions may vary with context. Child Development, 74, 1021-1033.
McClelland, M. & Morrison, F. J. (2003). The emergence of learning-related social skills in preschool children. Early Childhood Research Quarterly, 18, 206-224.
McClelland, M., Morrison, F. J., & Holmes, D. L. (2000). Children at risk for early academic problems: The role of learning-related social skills. Early Childhood Research Quarterly, 15, 307-329.
McCormick, M. C., Brooks-Gunn, J., Workman-Daniels, K., Turner, J., & Peckham, G. (1992). The health and development status of very low birth weight children at school age. Journal of American Medical Association, 267, 2204-2208.
McCoy, A. R., & Reynolds, A. J. (1999). Grade retention and school performance: An extended investigation. Journal of School Psychology, 37, 273-298.

Running head: School Readiness and Later Achievement DO NOT CITE OR QUOTE
62
Meisels, S. J., & Atkins-Burnett, S. (2004). The Head Start National Reporting System: A critique. Beyond the Journal: Young Children on the Web, National Association for the Education of Young Children. Retrieved July 6, 2005, from http://journal.naeyc.org/btj/200401/meisels.pdf
Miech, R., Essex, M. J., & Goldsmith, H. (2001). Socioeconomic status and the adjustment to school: The role of self-regulation during early childhood. Sociology of Education, 74, 102-120.
Moffitt, T. E., Caspi, A., Rutter, M., & Silva, P. A. (2001). Sex differences in antisocial behavior: Conduct disorder, delinquency, and violence in the Dunedin Longitudinal Study. Cambridge UK: Cambridge University Press.
National Association for the Education of Young Children, & National Council of Teachers of Mathematics. (2002). Math experiences that count! Young Children 57, 60–62.
National Center for Education Statistics. (1993). Public school kindergarten teachers' views on children's readiness for school. Contractor report to the National Center for Education Statistics. NCES 93-410. Washington, DC: U.S. Department of Education, Office of Educational Research and Improvement.
National Center for Educational Statistics. (2001). User’s Manual for the ECLS-K Public-UseData Files and Electronic Codebook. Princeton, NJ.
National Education Goals Panel. (1997). The National Education Goals report, 1997: Building a nation of learners. Washington, DC: U.S. Government Printing Office.
Neligan, G.A. & Prudham, D. (1969). Norms for four standard development milestones by sex, social class and place in family. Developmental Medicine and Child Neurology, 11, 413.
Newcomb, A. F., Bukowski, W. M., & Pattee, L. (1993). Children's peer relations: A meta-analytical review of popular, rejected, neglected, controversial, and average sociometric status. Psychological Bulletin, 113, 99-128.
NICHD Early Child Care Research Network. (1997). Poverty and patterns of child care. In J. Brooks-Gunn & G. Duncan (Eds.), Consequences of Growing up Poor (pp. 100-131). New York: Russell-Sage.
NICHD Early Child Care Research Network (2004) Trajectories of physical aggression from toddlerhood to middle childhood: Predictors, correlates, and outcomes. Monographs of the Society of Research in Child Development, 69, Serial number 278.
NICHD Early Child Care Research Network (2005a). Pathways to reading: The role of oral language in the transition to reading. Developmental Psychology, 41, 428-442.
NICHD Early Child Care Research. (Ed.). (2005b). Child Care and Development: Results from the NICHD Study of Early Child Care and Youth Development. NY: Guilford Press.
Normandeau, S. (1998). Preschool behavior and first-grade achievement: The mediational role of cognitive self-control. Journal of Educational Psychology, 90, 111-121.
Okamoto, Y., & Case, R. (1996). Exploring the microstructure of children's central conceptual structures in the domain of number. In R. Case & Y. Okamoto (Eds.), The role of central
Running head: School Readiness and Later Achievement DO NOT CITE OR QUOTE
63
conceptual structures in the development of children's thought. Monographs of the Society for Research in Child Development, 60, 27-58.
Olson, S. L., Sameroff, A. J., Kerr, D. C. R., Lopez, N. L., & Wellman, H. M. (2005). Developmental foundations of externalizing problems in young children: The role of effortful control. Development and psychopathology, 17, 25-45.
Pagani, L. S., Japel, C., Girard, A., Farhat, A., Côte, S.,& Tremblay, R. E. (in press). Middle childhood life-course trajectories: Links between family dysfunction and children’s behavioral development. In A.C. Huston & M.N. Ripke (Eds.), Middle Childhood: Contexts of Development. New York: Cambridge University Press
Pagani, L. S., Tremblay, R. E., Vitaro, F., Boulerice, B., & McDuff, P. (2001). Effects of grade retention on academic performance and behavioral development. Development and Psychopathology, 13, 297-315.
Parker, J. G., & Asher, S. R. (1987). Peer relations and later personal adjustment: Are low-accepted children at risk? Psychological Bulletin, 86, 357-389.
Patrick, H. (1997). Social self-regulation: Exploring the relations between children's social relationships, academic self-regulation, and school performance. Educational Psychologist, 32, 209-220.
Pepper, K. L., & Hunting, R. P. (1998). Preschoolers' counting and sharing. Journal for Research in Mathematics Education, 29(2), 164-183.
Pianta, R. C. & Stuhlman, M. W. (2004). Teacher-child relationships and children’s success in the first years of school. School Psychology Review, 33, 444-458.
Radloff, L. S. (1997). The CES-D scale: A self report depression scale for research in general population. Applied Psychological Measurement, 1, 385-401.
Raffaelli, M., Crockett, L.J., & Shen, Y-L. (2005). Developmental stability and change in self-regulation from childhood to adolescence. Journal of Genetic Psychology, 166, 54-75.
Ramey, C. T., Bryant, D. B., Wasik, B. H., Sparling, J. J., Fendt, K. H., & La Vange, L. M. (1992). The Infant Health and Development Program for low birth weight, premature infants: Program elements, family participation, and child intelligence. Pediatrics, 79, 343-365.
Ramey, C. T., Campbell, F. A., Burchinal, M., Skinner, M. L., Gardner, D. M., & Ramey, S. L. (2000). Persistent effects of early childhood education on high-risk children and their mothers. Applied Developmental Science, 4, 2-14.
Raver, C. C. (2004). Placing emotional self-regulation in sociocultural and socioeconomic contexts. Child Development, 75, 346-353.
Raver, C. C., Smith-Donald, R., Hayes, T., & Jones, S. M. (2005, April). Self-regulation across differing risk and sociocultural contexts: Preliminary findings from the Chicago School Readiness Project. Paper presented at the biennial meeting of the Society for Research in Child Development, Atlanta, GA.
Running head: School Readiness and Later Achievement DO NOT CITE OR QUOTE
64
Resnick, L. B. (1989). Developing mathematical knowledge. American Psychologist, 44, 162-169.
Reynell, J. (1990). Reynell developmental language scales (U.S. Edition). Los Angeles, CA: Western Psychological Services.
Reynolds, A., & Temple, J. A. (1998). Extended early childhood intervention and school achievement: Age thirteen findings from the Chicago Longitudinal Study. Child Development, 69, 231-246.
Rhoades, B., Domitrovich, C., & Greenberg, M. (2005, April). The role of executive function I the prediction of socioemotional competence in preschoolers. Paper presented at the biennial meeting of the Society for Research in Child Development, Atlanta, GA.
Robinson, N. M., Abbott, R. D., Berninger, V. W., & Busse, J. (1996). The structure of abilities in math-precocious young children: Gender similarities and differences. Journal of Educational Psychology, 88(2), 341-352.
Rodkin, P. C., Farmer, T.W., Pearl, R., & Van Acker, R. (2000). Heterogeneity of popular boys: Antisocial and prosocial configurations. Developmental Psychology, 36, 14-24.
Rosenkoetter, S. E. (2001). Lessons for preschool language socialization from the vantage point of the first day of kindergarten. Early Education and Development, 12, 325-342.
Royce, J. M., Darlington, R. B. & Murray, H. W. (1983). “Pooled analyses: Findings across studies.” In Consortium for Longitudinal Studies (Ed.) As the Twig is Bent. Hillsdale, NJ: Lawrence Erlbaum Associates.
Rutter, M., Tizard, J., & Whitmore, K. (1970). Education, Health and Behaviour. London: Longmans
Saigal, S., Szatmari, P., Rosenbaum, P., Campbell, D., & Kerry, S. (1991). Cognitive abilities and school performance of extremely low birth weight children and matched term control children at age 8 years: A regional study. Journal of Pediatrics, 118, 751-760.
Sattler, J. M. (1982). Assessment of children's intelligence and special abilities Boston: Allyn & Bacon, Inc.
Scarborough, H. S. (2001). Connecting early language and literacy to later reading (dis)abilities: Evidence, theory, and practice. In S. B. Neuman & D. K. Dickinson (Eds.), Handbook of Early Literacy Research, New York: The Guilford Press.
Schweinhart, L. J., Montie, J., Xiang, Z., Barnett, W. S., Belfield, C. R., & Nores, M. (in press). Lifetime effects: The High/Scope Perry Preschool study through age 40. (Monographs of the High/Scope Educational Research Foundation, 14). Ypsilanti, MI: High/Scope Press.
Shonkoff, J., & Phillips, D. (Eds.). (2000) From Neurons to Neighborhoods: The Science of Early Childhood Development. Washington, D.C.: National Academy Press.
Snow, C. E., Burns, M. S., & Griffin, P. (Eds). (1998). Preventing reading difficulties in young children. Washington D.C.: National Research Council, National Academy Press.
Sparling, J. J., & Lewis, I. S. (1984). Partners for learning. Lewisville, NC: Kaplan Press.
Running head: School Readiness and Later Achievement DO NOT CITE OR QUOTE
65
Sparling, J. J., Lewis, I. S., Ramey, C. T., Wasik, B. H., Bryant, D. M., & La Vange, L. M. (1991). Partners, a curriculum to help premature, low-birth-weight infants get off to a good start. Topics in Early Childhood Special Education, 11, 36-55.
Stevenson, H. W., & Newman, R. S. (1986). Long-term prediction of achievement and attitudes in mathematics and reading. Child Development, 57, 646-659.
Storch, S. A., & Whitehurst G. J. (2002). Oral language and code-related precursors to reading: Evidence from a longitudinal structural model. Developmental Psychology, 38, 934-947.
Stormshak, E. A., Bierman, K. L., Bruschi, C., Dodge, K. A., & Coie, J.D. (1999). The relation between behavior problems and peer preference in different classroom contexts. Child Development, 70, 169-182.
Terman, L. M., & Merrill, M. A. (1973). Stanford-Binet Intelligence Scale, Manual for the third revision, Form L-M. Boston, MA: Houghton Mifflin Company.
The MTA Cooperative Group (1999). A 14-month randomized clinical trial of treatment strategies for Attention-Deficit/Hyperactivity Disorder. Archives of General Psychiatry, 56, 1073-1086.
Thorndike, R. L., Hagen, E., & Sattler, J. (1986). Stanford-Binet Intelligence Scale, Fourth Edition. Riverside Publishing: Chicago, IL.
Tremblay, R. E., Loeber, R., Gagnon, C., Charlebois, P., Larivée, S., & LeBlanc, M. (1991). Disruptive boys with stable and unstable high fighting behavior patterns during junior elementary school. Journal of Abnormal Child Psychology, 19, 285-300.
Tremblay, R., Pagani-Kurtz, L., Mâsse, L., Vitaro, F., & Pihl, R. (1995). A bimodal preventive intervention for disruptive kindergarten boys: Its impact through mid-adolescence. Journal of Consulting and Clinical Psychology, 63, 560-568.
Turkheimer, E., Haley, A., Waldron, M., D’Onofrio, B., & Gottesman, I. (2003). Socioeconomic status modifies heritability of IQ in young children. Psychological Science, 14, 623-628.
Tunmer, W.E., & Nesdale, A.R. (1985) Phonemic segmentation skill and beginning reading. Journal of Educational Psychology, 77, 417-427.
U.S. Department of Health and Human Services, Administration for Children and Families (May 2005). Head Start Impact Study: First Year Findings. Washington, DC.
Vaughn, B. E., Vollenweider, M., Bost, K. K., Azira-Evans, M. R., & Snider, J. B. (2003). Negative interactions and social competence for preschool children in two samples: Reconsidering the interpretation of aggressive behavior for young children. Merrill-Palmer Quarterly, 49, 245-278.
Wasik, B. H. (1984). Coping with parenting through effective problem solving: A handbook for professionals. Chapel Hill: University of North Carolina, Frank Porter Graham Child Development Center.
Wasik, B. H., Bryant, D. M., Lyons, C., Sparling, J. J., & Ramey, C. T. (1997). Home visiting. In R. T. Gross, D. Spiker & C. S. Haynes (Eds.), Helping low birth weight, premature
Running head: School Readiness and Later Achievement DO NOT CITE OR QUOTE
66
babies: the Infant Health and Development Program (pp. 27-41). Stanford, CA: Stanford University Press.
Wechsler, D. (1967). Wechsler Preschool and Primary Scale of Intelligence. New York: Psychological Corp.
White, H. (1980). A heteroskedasticity-consistent covariance matrix estimator and a direct test for heteroskedasticity. Econometrica, 48, 817-838.
Whitehurst, G. J., & Lonigan, C. J. (1998). Child development and emergent literacy. Child Development, 69, 848-872.
Wikoff, R. L. (1978). Correlational and factor analysis of the Peabody Individual Achievement Test and the WISC-R. (1978). Journal of Consulting and Clinical Psychology, 46, 322-325.
Woodcock, R. W. (1990). Theoretical foundations of the WJ-R measures of cognitive ability. Journal of Psychoeducational Assessment, 8, 231-258.
Woodcock, R. W., & Johnson, M.B. (1989). Woodcock-Johnson Psycho-Educational Battery- Revised. Allen, TX: DLM Teaching Resources.
Woodcock, R. W., & Johnson, M. B. (1990). Manual for the Woodcock-Johnson Tests of Achievement-Revised. Allen, Texas: RCL Enterprises.
Wynn, K. (1992). Addition and subtraction by human infants. Nature, 358, 709-750.
Yen, C., Konold, T. R., & McDermott, P. A. (2004). Does learning behavior augment cognitive ability as an indicator of academic achievement? Journal of School Psychology, 42, 157-169.
Zimmerman, I. L., Steiner, V. G., & Pond, R. E. (1979). Preschool language scale- revised edition. San Antonio, TX: The Psychological Corporation.
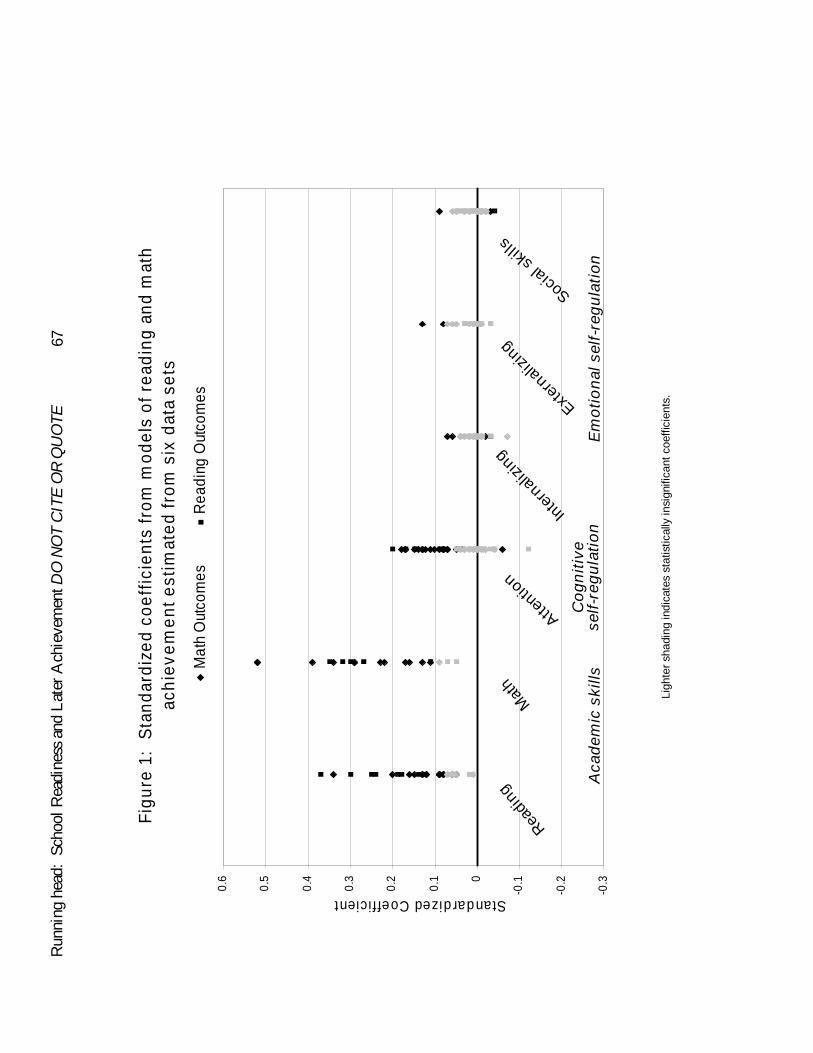
Run
ning
hea
d: S
choo
l Rea
dine
ss a
nd L
ater
Ach
ieve
men
t DO
NO
T C
ITE
OR
QU
OTE
67
Figu
re 1
: St
anda
rdiz
ed c
oeffi
cien
ts fr
om m
odel
s of
read
ing
and
mat
h ac
hiev
emen
t est
imat
ed fr
om s
ix d
ata
sets
-0.3
-0.2
-0.10
0.1
0.2
0.3
0.4
0.5
0.6
Standardized Coefficient
Mat
h O
utco
mes
Read
ing
Out
com
es
Readin
gMath
Attentio
n
Cog
nitiv
e se
lf-re
gula
tion
Social sk
ills
Extern
alizin
g
Internali
zing
Emot
iona
l sel
f-reg
ulat
ion
Ligh
ter s
hadi
ng in
dica
tes
stat
istic
ally
insi
gnifi
cant
coe
ffici
ents
.
Aca
dem
ic s
kills

Running head: School Readiness and Later Achievement DO NOT CITE OR QUOTE
68
Footnotes 1 Fall parent interviews were conducted between October 1998 and January 1999, and spring interviews were conducted between March and June of 1999. The vast majority (approximately 97%) were conducted by phone by field staff using a computer assistance program. Teacher questionnaires were administered between October and December 1998 for the fall and between March and June 1999 for the spring. 2 In the third grade dataset, eight reading and seven math IRT subscales are provided for all years in which children were tested (kindergarten, first and third grade). However, in kindergarten and first grade, only the five subscales which tested ‘earlier’ skills were administered and in third grade only the five subscales which tested ‘later’ skills were administered. Scores for all subscales were constructed by ECLS-K staff for all years using IRT so that scores on subscales could be compared across years to measure change. 3 Identical items were administered in the spring of kindergarten and are used in the change models discussed in the results section. 4 The dependent/clingy subscale is not used in these analyses. 5 A dummy variable is set equal to 1 if data are missing for a particular regressor, and 0 if the data is observed. Next, the relevant regressor is set to 0 for cases with missing data, and regressions are run with both the regressor of interest and the dummy variable included as independent variables. 6 Children who were age 5 or 6 in 1986 do not have early childhood measures of PPVT or temperament (n=345) because the maternal and child interview was not conducted at an earlier age for these children. In addition, about 20 children in the second and third cohorts are missing data for these measures. Finally, NLSY’s restriction of the measurement of sociability to children over age 4 in 1990, resulted in a large number of missing data on this measure for children in cohort 4 that were age 3 in 1990 (n=222). Restricting the sample to children with complete temperament and PPVT data does not change the reported findings. 7 Regressions using model (3) were also conducted with each behavior problem subscale entered individually. Resulting coefficients for the problem behavior subscales did not differ from those reported in Table 3 or 4. 8 Principal components analysis was initially used to evaluate the cohesiveness among the four items. For items in grades 1 and 3, the percent of variance among the items that could be explained by a single factor solution ranged between 84% and 86% (eigenvalues = 3.44 and 3.38, respectively; all other eigenvalues were less than 0.39). Factor loadings for the four items ranged between .90 and .95 (grade 1) and between .90 and .94 (grade 3). 9 For the attentive scale, different cohorts received slightly different versions of the SBQ with varying number of items. For the students who started kindergarten in 1998, the available attentive items are listens attentively, easily distractible, and inattentive; for the students who started kindergarten in 1999, the available attentive items are the last three items. In order to
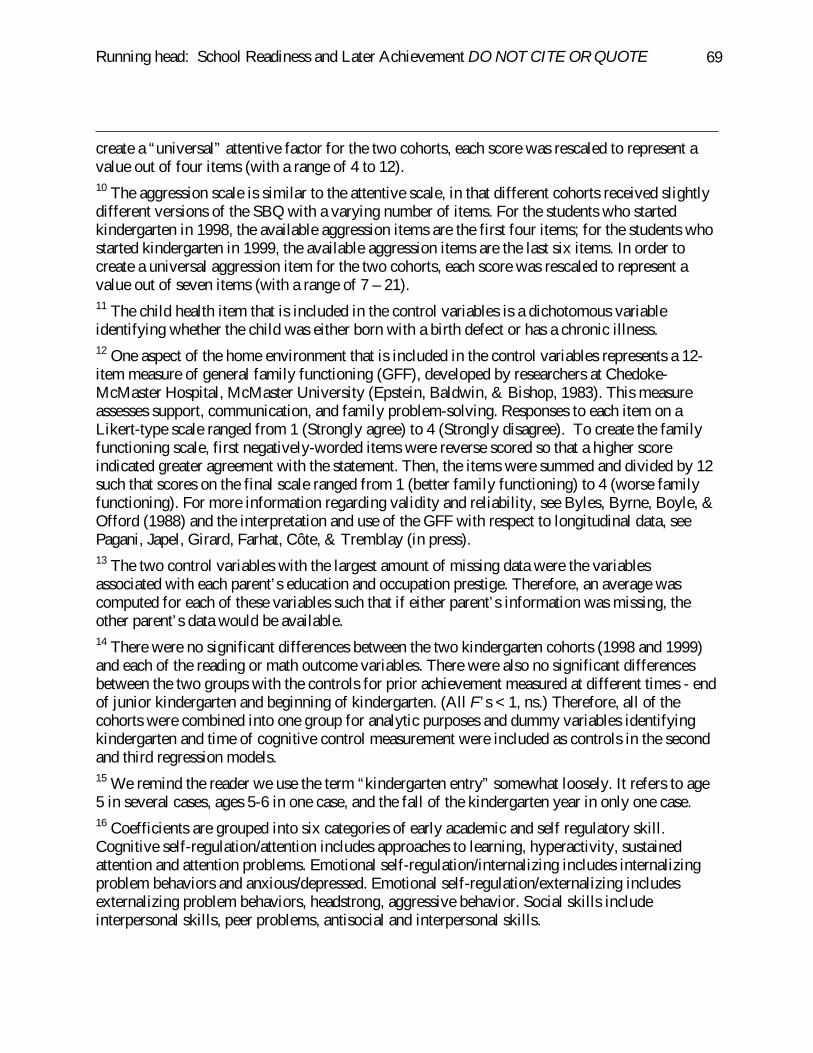
Running head: School Readiness and Later Achievement DO NOT CITE OR QUOTE
69
create a “universal” attentive factor for the two cohorts, each score was rescaled to represent a value out of four items (with a range of 4 to 12). 10 The aggression scale is similar to the attentive scale, in that different cohorts received slightly different versions of the SBQ with a varying number of items. For the students who started kindergarten in 1998, the available aggression items are the first four items; for the students who started kindergarten in 1999, the available aggression items are the last six items. In order to create a universal aggression item for the two cohorts, each score was rescaled to represent a value out of seven items (with a range of 7 – 21). 11 The child health item that is included in the control variables is a dichotomous variable identifying whether the child was either born with a birth defect or has a chronic illness. 12 One aspect of the home environment that is included in the control variables represents a 12-item measure of general family functioning (GFF), developed by researchers at Chedoke-McMaster Hospital, McMaster University (Epstein, Baldwin, & Bishop, 1983). This measure assesses support, communication, and family problem-solving. Responses to each item on a Likert-type scale ranged from 1 (Strongly agree) to 4 (Strongly disagree). To create the family functioning scale, first negatively-worded items were reverse scored so that a higher score indicated greater agreement with the statement. Then, the items were summed and divided by 12 such that scores on the final scale ranged from 1 (better family functioning) to 4 (worse family functioning). For more information regarding validity and reliability, see Byles, Byrne, Boyle, & Offord (1988) and the interpretation and use of the GFF with respect to longitudinal data, see Pagani, Japel, Girard, Farhat, Côte, & Tremblay (in press). 13 The two control variables with the largest amount of missing data were the variables associated with each parent’s education and occupation prestige. Therefore, an average was computed for each of these variables such that if either parent’s information was missing, the other parent’s data would be available. 14 There were no significant differences between the two kindergarten cohorts (1998 and 1999) and each of the reading or math outcome variables. There were also no significant differences between the two groups with the controls for prior achievement measured at different times - end of junior kindergarten and beginning of kindergarten. (All F’s < 1, ns.) Therefore, all of the cohorts were combined into one group for analytic purposes and dummy variables identifying kindergarten and time of cognitive control measurement were included as controls in the second and third regression models. 15 We remind the reader we use the term “kindergarten entry” somewhat loosely. It refers to age 5 in several cases, ages 5-6 in one case, and the fall of the kindergarten year in only one case. 16 Coefficients are grouped into six categories of early academic and self regulatory skill. Cognitive self-regulation/attention includes approaches to learning, hyperactivity, sustained attention and attention problems. Emotional self-regulation/internalizing includes internalizing problem behaviors and anxious/depressed. Emotional self-regulation/externalizing includes externalizing problem behaviors, headstrong, aggressive behavior. Social skills include interpersonal skills, peer problems, antisocial and interpersonal skills.

Running head: School Readiness and Later Achievement DO NOT CITE OR QUOTE
70
17 The decision of which type of measure should serve as the omitted dummy variable category is noteworthy, since the coefficients on the included measure categories represent differences from the omitted category. We selected internalizing behavior problem coefficients as the omitted category since their simple average was very close to zero (-.01 for reading outcomes and -.01 for math outcomes). 18 Technically speaking, the .34 coefficient reflects the regression-adjusted difference between the average school-entry math and the omitted-group internalizing problem behavior standardized coefficient. 19 In the case of the BCS we estimated gender and SES interactions for educational attainment and wage outcomes. See Table 30 for these results. BCS interactions are not included in the calculations presented here. 20 Coefficients were excluded from these calculations if their standard errors were too large to detect a difference of .15 or less. In the case of the MLEPS data, there is one significant gender interaction; however, this finding is excluded from these calculations due to the size of its standard error. 21 Yet another possibility is that early self-regulation might have an important impact on the acquisition of kindergarten-entry academic skills but modest impacts on academic skills after that. Our models are not designed to pick this up, so it remains as a possible role for early self-regulation that we have not identified.
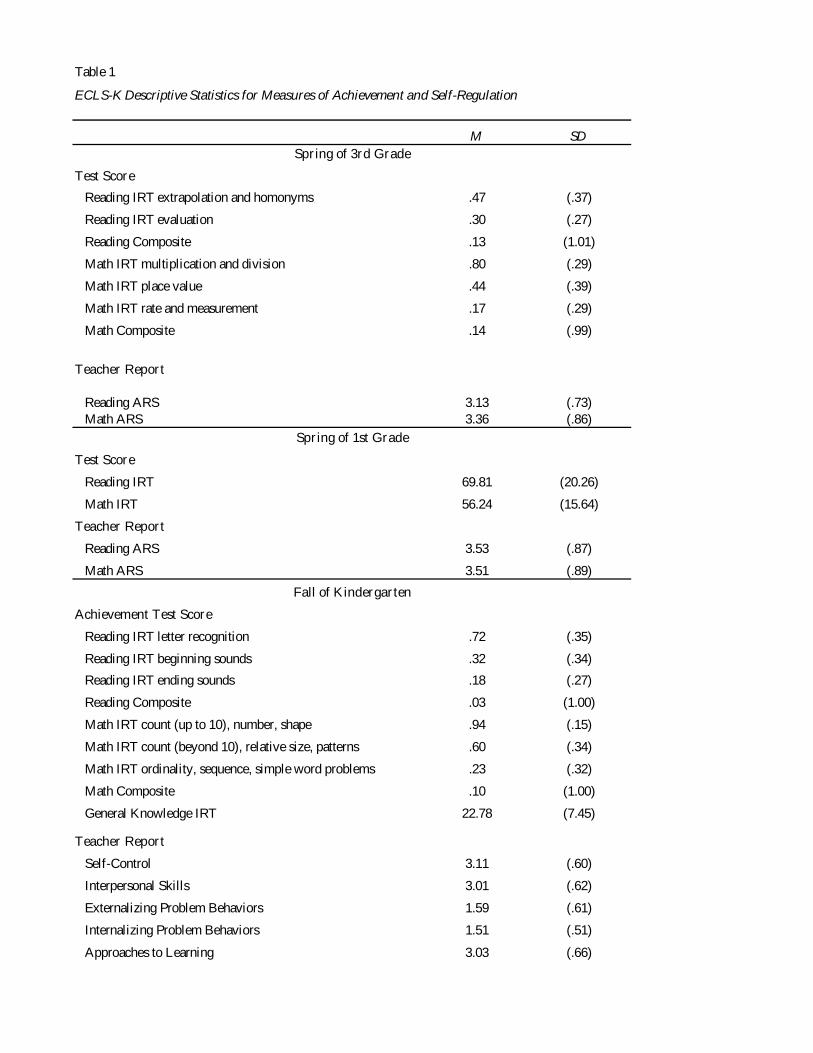
Table 1
ECLS-K Descriptive Statistics for Measures of Achievement and Self-Regulation
M SD
Test Score Reading IRT extrapolation and homonyms .47 (.37)
Reading IRT evaluation .30 (.27)
Reading Composite .13 (1.01)
Math IRT multiplication and division .80 (.29)
Math IRT place value .44 (.39)
Math IRT rate and measurement .17 (.29)
Math Composite .14 (.99)
Teacher Report
Reading ARS 3.13 (.73) Math ARS 3.36 (.86)
Test Score Reading IRT 69.81 (20.26)
Math IRT 56.24 (15.64)
Teacher Report Reading ARS 3.53 (.87)
Math ARS 3.51 (.89)
Reading IRT letter recognition .72 (.35)
Reading IRT beginning sounds .32 (.34) Reading IRT ending sounds .18 (.27)
Reading Composite .03 (1.00)
Math IRT count (up to 10), number, shape .94 (.15)
Math IRT count (beyond 10), relative size, patterns .60 (.34)
Math IRT ordinality, sequence, simple word problems .23 (.32)
Math Composite .10 (1.00)
General Knowledge IRT 22.78 (7.45)
Teacher Report Self-Control 3.11 (.60)
Interpersonal Skills 3.01 (.62)
Externalizing Problem Behaviors 1.59 (.61)
Internalizing Problem Behaviors 1.51 (.51)
Approaches to Learning 3.03 (.66)
Fall of Kindergarten
Spring of 3rd Grade
Achievement Test Score
Spring of 1st Grade
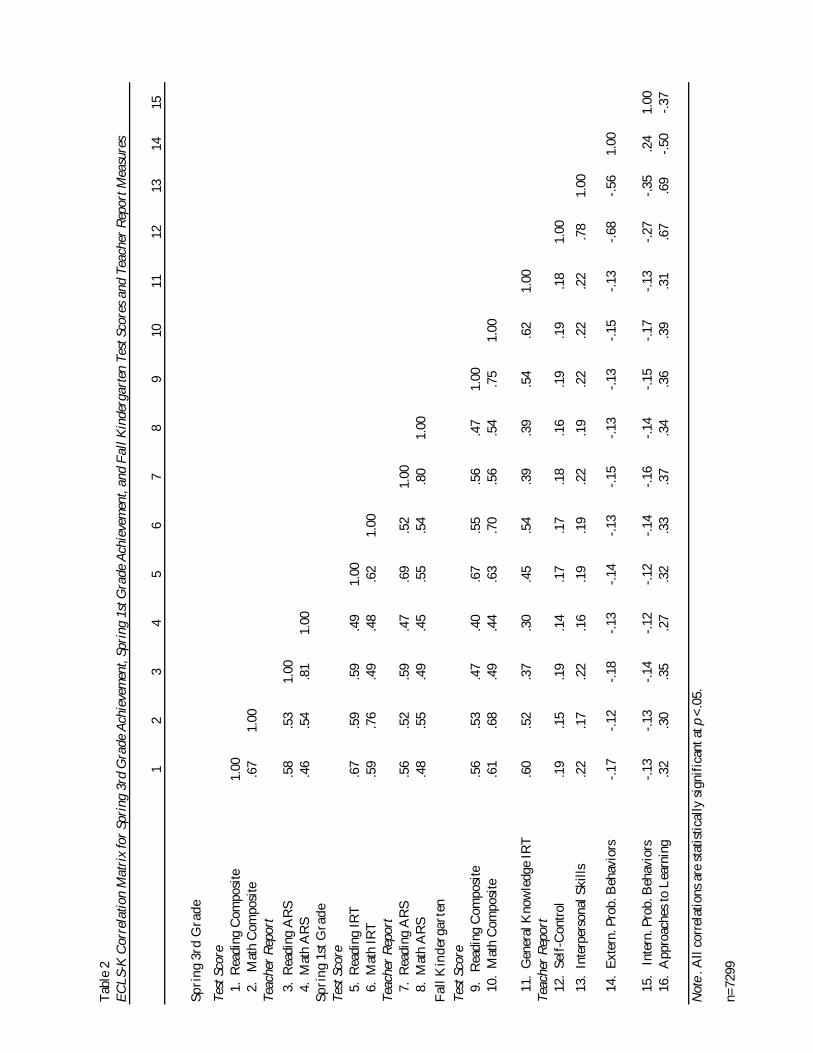
Tabl
e 2
Spri
ng 3
rd G
rade
Test
Sco
re
1. R
eadi
ng C
ompo
site
1.00
2.
M
ath
Com
posi
te.6
71.
00Te
ache
r Rep
ort
3.
Rea
ding
AR
S.5
8.5
31.
00
4. M
ath
AR
S.4
6.5
4.8
11.
00Sp
ring
1st
Gra
deTe
st S
core
5.
Rea
ding
IRT
.67
.59
.59
.49
1.00
6.
Mat
h IR
T.5
9.7
6.4
9.4
8.6
21.
00Te
ache
r Rep
ort
7.
Rea
ding
AR
S.5
6.5
2.5
9.4
7.6
9.5
21.
00
8. M
ath
AR
S.4
8.5
5.4
9.4
5.5
5.5
4.8
01.
00Fa
ll K
inde
rgar
ten
Test
Sco
re
9.
Rea
ding
Com
posi
te.5
6.5
3.4
7.4
0.6
7.5
5.5
6.4
71.
00
10.
Mat
h C
ompo
site
.61
.68
.49
.44
.63
.70
.56
.54
.75
1.00
11
. G
ener
al K
now
ledg
e IR
T.6
0.5
2.3
7.3
0.4
5.5
4.3
9.3
9.5
4.6
21.
00Te
ache
r Rep
ort
12
. Se
lf-C
ontro
l.1
9.1
5.1
9.1
4.1
7.1
7.1
8.1
6.1
9.1
9.1
81.
00
13.
Inte
rper
sona
l Ski
lls.2
2.1
7.2
2.1
6.1
9.1
9.2
2.1
9.2
2.2
2.2
2.7
81.
00
14
. Ex
tern
. Pro
b. B
ehav
iors
-.17
-.12
-.18
-.13
-.14
-.13
-.15
-.13
-.13
-.15
-.13
-.68
-.56
1.00
15
. In
tern
. Pro
b. B
ehav
iors
-.13
-.13
-.14
-.12
-.12
-.14
-.16
-.14
-.15
-.17
-.13
-.27
-.35
.24
1.00
16
. A
ppro
ache
s to
Lear
ning
.32
.30
.35
.27
.32
.33
.37
.34
.36
.39
.31
.67
.69
-.50
-.37
n=72
99
1512
1314
47
811
Not
e. A
ll co
rrel
atio
ns a
re st
atis
tical
ly si
gnifi
cant
at p
<.05
.
ECLS
-K C
orre
latio
n M
atri
x fo
r Spr
ing
3rd
Gra
de A
chie
vem
ent,
Spri
ng 1
st G
rade
Ach
ieve
men
t, an
d Fa
ll K
inde
rgar
ten
Test
Sco
res a
nd T
each
er R
epor
t Mea
sure
s
12
56
910
3
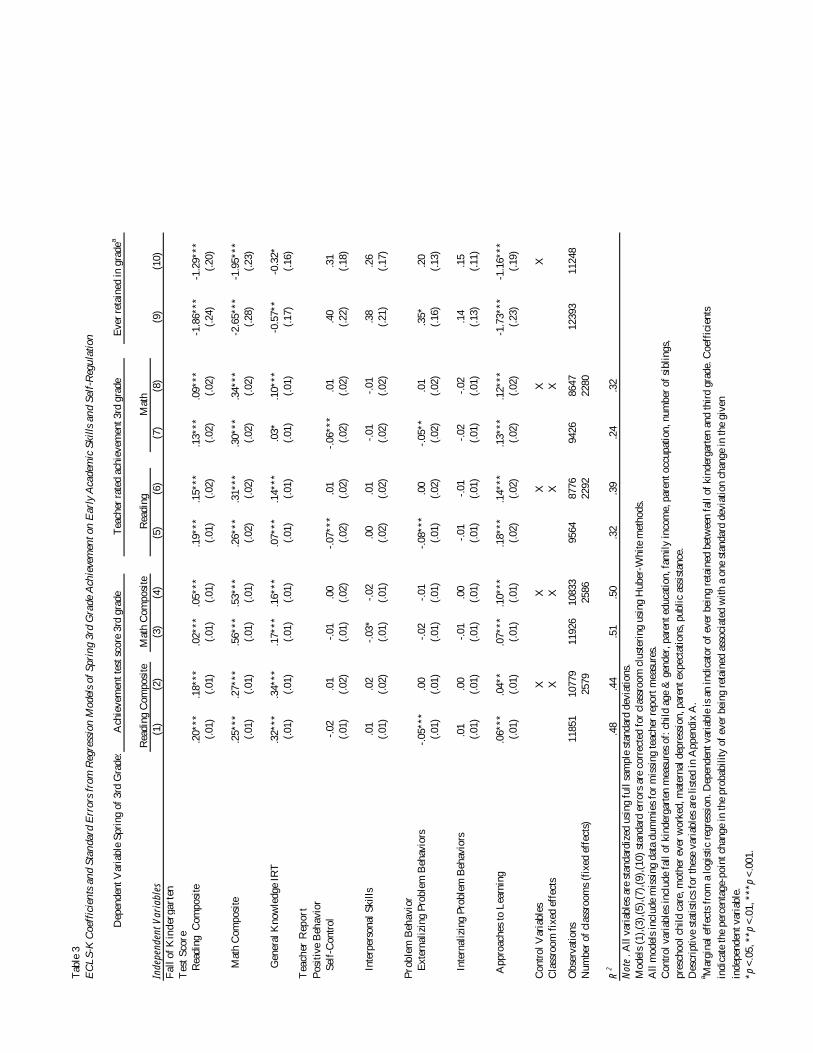
Tabl
e 3
Dep
ende
nt V
aria
ble
Sprin
g of
3rd
Gra
de:
Inde
pend
ent V
aria
bles
(1)
(2)
(3)
(4)
(5)
(6)
(7)
(8)
(9)
(10)
Fall
of K
inde
rgar
ten
Tes
t Sco
re
Rea
ding
Com
posi
te.2
0***
.18*
**.0
2***
.05*
**.1
9***
.15*
**.1
3***
.09*
**-1
.86*
**-1
.29*
**(.0
1)(.0
1)(.0
1)(.0
1)(.0
1)(.0
2)(.0
2)(.0
2)(.2
4)(.2
0)
M
ath
Com
posi
te.2
5***
.27*
**.5
6***
.53*
**.2
6***
.31*
**.3
0***
.34*
**-2
.65*
**-1
.95*
**(.0
1)(.0
1)(.0
1)(.0
1)(.0
2)(.0
2)(.0
2)(.0
2)(.2
8)(.2
3)
G
ener
al K
now
ledg
e IR
T.3
2***
.34*
**.1
7***
.16*
**.0
7***
.14*
**.0
3*.1
0***
-0.5
7**
-0.3
2*(.0
1)(.0
1)(.0
1)(.0
1)(.0
1)(.0
1)(.0
1)(.0
1)(.1
7)(.1
6)T
each
er R
epor
tPo
sitiv
e B
ehav
ior
Se
lf-C
ontro
l-.0
2.0
1-.0
1.0
0-.0
7***
.01
-.06*
**.0
1.4
0.3
1(.0
1)(.0
2)(.0
1)(.0
2)(.0
2)(.0
2)(.0
2)(.0
2)(.2
2)(.1
8)
In
terp
erso
nal S
kills
.01
.02
-.03*
-.02
.00
.01
-.01
-.01
.38
.26
(.01)
(.02)
(.01)
(.01)
(.02)
(.02)
(.02)
(.02)
(.21)
(.17)
Prob
lem
Beh
avio
r
Exte
rnal
izin
g Pr
oble
m B
ehav
iors
-.0
5***
.00
-.02
-.01
-.08*
**.0
0-.0
5**
.01
.35*
.20
(.01)
(.01)
(.01)
(.01)
(.01)
(.02)
(.02)
(.02)
(.16)
(.13)
In
tern
aliz
ing
Prob
lem
Beh
avio
rs.0
1 .0
0-.0
1.0
0-.0
1-.0
1-.0
2-.0
2.1
4.1
5(.0
1)(.0
1)(.0
1)(.0
1)(.0
1)(.0
1)(.0
1)(.0
1)(.1
3)(.1
1)
App
roac
hes t
o Le
arni
ng.0
6***
.04*
*.0
7***
.10*
**.1
8***
.14*
**.1
3***
.12*
**-1
.73*
**-1
.16*
**(.0
1)(.0
1)(.0
1)(.0
1)(.0
2)(.0
2)(.0
2)(.0
2)(.2
3)(.1
9)
Con
trol V
aria
bles
XX
XX
XC
lass
room
fixe
d ef
fect
sX
XX
X
Obs
erva
tions
1185
110
779
1192
610
833
9564
8776
9426
8647
1239
311
248
Num
ber o
f cla
ssro
oms (
fixed
eff
ects
)25
7925
8622
9222
80
R2
.48
.44
.51
.50
.32
.39
.24
.32
Not
e. A
ll va
riabl
es a
re st
anda
rdiz
ed u
sing
full
sam
ple
stan
dard
dev
iatio
ns.
Mod
els (
1),(3
),(5)
,(7),(
9),(1
0) st
anda
rd e
rror
s are
cor
rect
ed fo
r cla
ssro
om c
lust
erin
g us
ing
Hub
er-W
hite
met
hods
.A
ll m
odel
s inc
lude
mis
sing
dat
a du
mm
ies f
or m
issi
ng te
ache
r rep
ort m
easu
res.
Des
crip
tive
stat
istic
s for
thes
e va
riabl
es a
re li
sted
in A
ppen
dix
A.
inde
pend
ent v
aria
ble.
*p<.
05, *
*p<.
01, *
**p
<.00
1.
Con
trol v
aria
bles
incl
ude
fall
of k
inde
rgar
ten
mea
sure
s of:
child
age
& g
ende
r, pa
rent
edu
catio
n, fa
mily
inco
me,
par
ent o
ccup
atio
n, n
umbe
r of s
iblin
gs,
pres
choo
l chi
ld c
are,
mot
her e
ver w
orke
d, m
ater
nal d
epre
ssio
n, p
aren
t exp
ecta
tions
, pub
lic a
ssis
tanc
e.
indi
cate
the
perc
enta
ge-p
oint
cha
nge
in th
e pr
obab
ility
of e
ver b
eing
reta
ined
ass
ocia
ted
with
a o
ne st
anda
rd d
evia
tion
chan
ge in
the
give
n
ECLS
-K C
oeffi
cien
ts an
d St
anda
rd E
rror
s fro
m R
egre
ssio
n M
odel
s of S
prin
g 3r
d G
rade
Ach
ieve
men
t on
Early
Aca
dem
ic S
kills
and
Sel
f-Reg
ulat
ion Ev
er re
tain
ed in
gra
dea
Rea
ding
Com
posi
teM
ath
Com
posi
teR
eadi
ngM
ath
Ach
ieve
men
t tes
t sco
re 3
rd g
rade
Teac
her r
ated
ach
ieve
men
t 3rd
gra
de
a Mar
gina
l eff
ects
from
a lo
gist
ic re
gres
sion
. Dep
ende
nt v
aria
ble
is a
n in
dica
tor o
f eve
r bei
ng re
tain
ed b
etw
een
fall
of k
inde
rgar
ten
and
third
gra
de. C
oeff
icie
nts
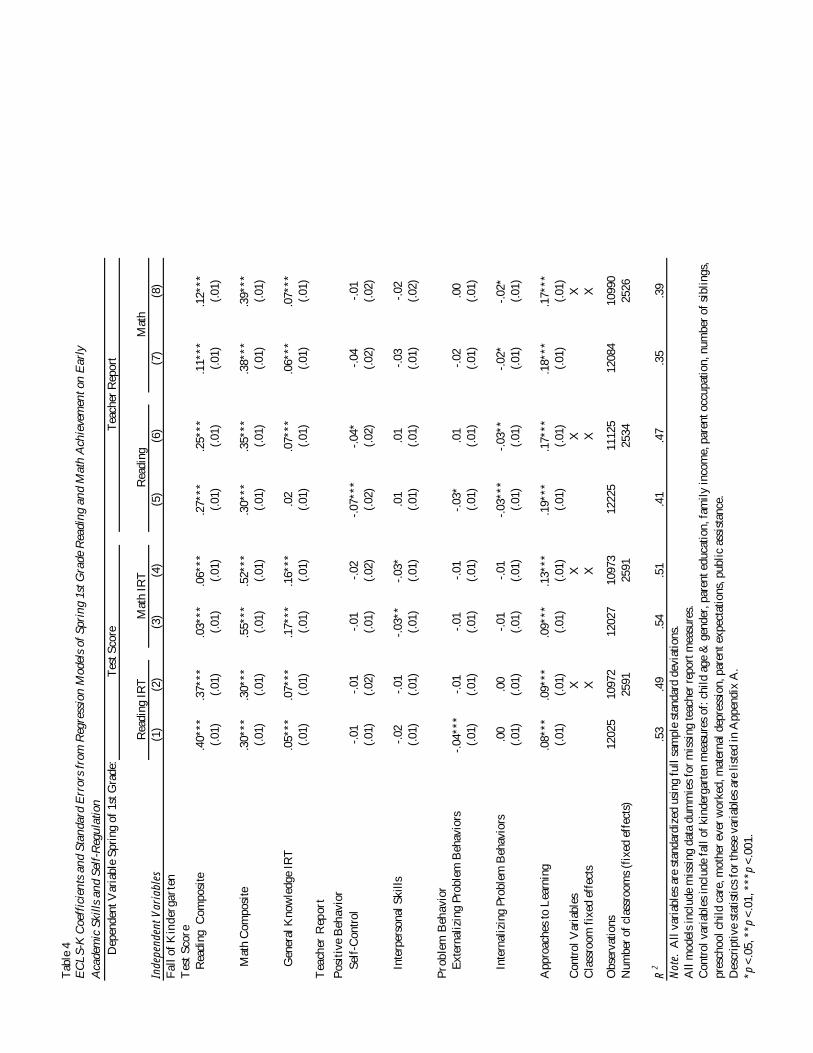
Tabl
e 4
Acad
emic
Ski
lls a
nd S
elf-R
egul
atio
nD
epen
dent
Var
iabl
e Sp
ring
of 1
st G
rade
:
Inde
pend
ent V
aria
bles
(1)
(2)
(3)
(4)
(5)
(6)
(7)
(8)
Fall
of K
inde
rgar
ten
Tes
t Sco
re
Rea
ding
Com
posi
te.4
0***
.37*
**.0
3***
.06*
**.2
7***
.25*
**.1
1***
.12*
**(.0
1)(.0
1)(.0
1)(.0
1)(.0
1)(.0
1)(.0
1)(.0
1)
M
ath
Com
posi
te.3
0***
.30*
**.5
5***
.52*
**.3
0***
.35*
**.3
8***
.39*
**(.0
1)(.0
1)(.0
1)(.0
1)(.0
1)(.0
1)(.0
1)(.0
1)
G
ener
al K
now
ledg
e IR
T.0
5***
.07*
**.1
7***
.16*
**.0
2.0
7***
.06*
**.0
7***
(.01)
(.01)
(.01)
(.01)
(.01)
(.01)
(.01)
(.01)
Tea
cher
Rep
ort
Posi
tive
Beh
avio
r
Self-
Con
trol
-.01
-.01
-.01
-.02
-.07*
**-.0
4*-.0
4-.0
1(.0
1)(.0
2)(.0
1)(.0
2)(.0
2)(.0
2)(.0
2)(.0
2)
In
terp
erso
nal S
kills
-.02
-.01
-.03*
*-.0
3*.0
1.0
1-.0
3-.0
2(.0
1)(.0
1)(.0
1)(.0
1)(.0
1)(.0
1)(.0
1)(.0
2)
Prob
lem
Beh
avio
r
Exte
rnal
izin
g Pr
oble
m B
ehav
iors
-.0
4***
-.01
-.01
-.01
-.03*
.01
-.02
.00
(.01)
(.01)
(.01)
(.01)
(.01)
(.01)
(.01)
(.01)
In
tern
aliz
ing
Prob
lem
Beh
avio
rs.0
0.0
0-.0
1-.0
1-.0
3***
-.03*
*-.0
2*-.0
2*(.0
1)(.0
1)(.0
1)(.0
1)(.0
1)(.0
1)(.0
1)(.0
1)
App
roac
hes t
o Le
arni
ng.0
8***
.09*
**.0
9***
.13*
**.1
9***
.17*
**.1
8***
.17*
**(.0
1)(.0
1)(.0
1)(.0
1)(.0
1)(.0
1)(.0
1)(.0
1)C
ontro
l Var
iabl
esX
XX
XC
lass
room
fixe
d ef
fect
sX
XX
X
Obs
erva
tions
1202
510
972
1202
710
973
1222
511
125
1208
410
990
Num
ber o
f cla
ssro
oms (
fixed
eff
ects
)25
9125
9125
3425
26
R2
.53
.49
.54
.51
.41
.47
.35
.39
Not
e. A
ll va
riabl
es a
re st
anda
rdiz
ed u
sing
full
sam
ple
stan
dard
dev
iatio
ns.
All
mod
els i
nclu
de m
issi
ng d
ata
dum
mie
s for
mis
sing
teac
her r
epor
t mea
sure
s.
Des
crip
tive
stat
istic
s for
thes
e va
riabl
es a
re li
sted
in A
ppen
dix
A.
* p<.
05, *
*p<.
01, *
**p
<.00
1.
Con
trol v
aria
bles
incl
ude
fall
of k
inde
rgar
ten
mea
sure
s of:
child
age
& g
ende
r, pa
rent
edu
catio
n, fa
mily
inco
me,
par
ent o
ccup
atio
n, n
umbe
r of s
iblin
gs,
pres
choo
l chi
ld c
are,
mot
her e
ver w
orke
d, m
ater
nal d
epre
ssio
n, p
aren
t exp
ecta
tions
, pub
lic a
ssis
tanc
e.
ECLS
-K C
oeffi
cien
ts an
d St
anda
rd E
rror
s fro
m R
egre
ssio
n M
odel
s of S
prin
g 1s
t Gra
de R
eadi
ng a
nd M
ath
Achi
evem
ent o
n Ea
rly
Test
Sco
reTe
ache
r Rep
ort
Rea
ding
IRT
Mat
h IR
TR
eadi
ngM
ath
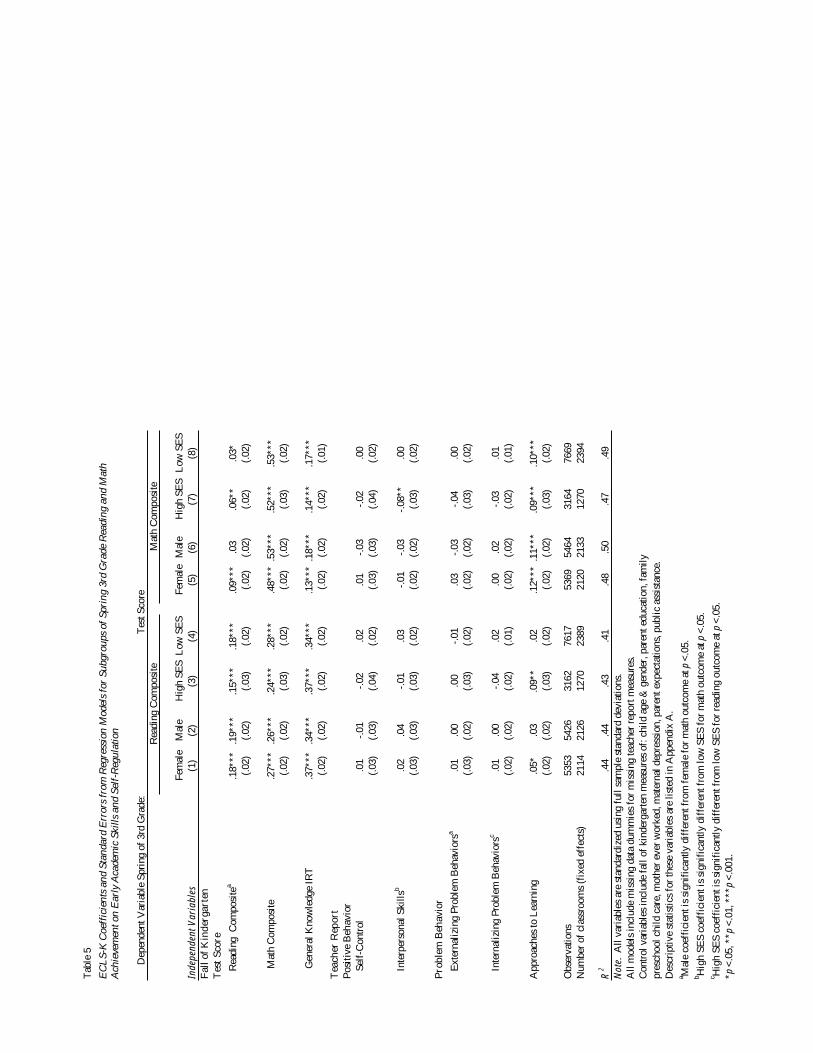
Tabl
e 5
Dep
ende
nt V
aria
ble
Sprin
g of
3rd
Gra
de:
Fem
ale
Mal
eH
igh
SES
Low
SES
Fem
ale
Mal
eH
igh
SES
Low
SES
Inde
pend
ent V
aria
bles
(1)
(2)
(3)
(4)
(5)
(6)
(7)
(8)
Fall
of K
inde
rgar
ten
Tes
t Sco
re
Rea
ding
Com
posi
tea
.18*
**.1
9***
.15*
**.1
8***
.09*
**.0
3.0
6**
.03*
(.02)
(.02)
(.03)
(.02)
(.02)
(.02)
(.02)
(.02)
M
ath
Com
posi
te.2
7***
.26*
**.2
4***
.28*
**.4
8***
.53*
**.5
2***
.53*
**(.0
2)(.0
2)(.0
3)(.0
2)(.0
2)(.0
2)(.0
3)(.0
2)
G
ener
al K
now
ledg
e IR
T.3
7***
.34*
**.3
7***
.34*
**.1
3***
.18*
**.1
4***
.17*
**(.0
2)(.0
2)(.0
2)(.0
2)(.0
2)(.0
2)(.0
2)(.0
1)T
each
er R
epor
tPo
sitiv
e B
ehav
ior
Se
lf-C
ontro
l.0
1-.0
1-.0
2.0
2.0
1-.0
3-.0
2.0
0(.0
3)(.0
3)(.0
4)(.0
2)(.0
3)(.0
3)(.0
4)(.0
2)
In
terp
erso
nal S
kills
b.0
2.0
4-.0
1.0
3-.0
1-.0
3-.0
8**
.00
(.03)
(.03)
(.03)
(.02)
(.02)
(.02)
(.03)
(.02)
Prob
lem
Beh
avio
r
Exte
rnal
izin
g Pr
oble
m B
ehav
iors
a .0
1.0
0.0
0-.0
1.0
3-.0
3-.0
4.0
0(.0
3)(.0
2)(.0
3)(.0
2)(.0
2)(.0
2)(.0
3)(.0
2)
In
tern
aliz
ing
Prob
lem
Beh
avio
rsc
.01
.00
-.04
.02
.00
.02
-.03
.01
(.02)
(.02)
(.02)
(.01)
(.02)
(.02)
(.02)
(.01)
App
roac
hes t
o Le
arni
ng.0
5*.0
3.0
9**
.02
.12*
**.1
1***
.09*
**.1
0***
(.02)
(.02)
(.03)
(.02)
(.02)
(.02)
(.03)
(.02)
Obs
erva
tions
5353
5426
3162
7617
5369
5464
3164
7669
Num
ber o
f cla
ssro
oms (
fixed
eff
ects
)21
1421
2612
7023
8921
2021
3312
7023
94
R2
.44
.44
.43
.41
.48
.50
.47
.49
Not
e. A
ll va
riabl
es a
re st
anda
rdiz
ed u
sing
full
sam
ple
stan
dard
dev
iatio
ns.
All
mod
els i
nclu
de m
issi
ng d
ata
dum
mie
s for
mis
sing
teac
her r
epor
t mea
sure
s.
Des
crip
tive
stat
istic
s for
thes
e va
riabl
es a
re li
sted
in A
ppen
dix
A.
a Mal
e co
effic
ient
is si
gnifi
cant
ly d
iffer
ent f
rom
fem
ale
for m
ath
outc
ome
at p
<.05
.b H
igh
SES
coef
ficie
nt is
sign
ifica
ntly
diff
eren
t fro
m lo
w S
ES fo
r mat
h ou
tcom
e at
p<.
05.
c Hig
h SE
S co
effic
ient
is si
gnifi
cant
ly d
iffer
ent f
rom
low
SES
for r
eadi
ng o
utco
me
at p
<.05
.*p
<.05
, **p
<.01
, ***
p<.
001.
Con
trol v
aria
bles
incl
ude
fall
of k
inde
rgar
ten
mea
sure
s of:
child
age
& g
ende
r, pa
rent
edu
catio
n, fa
mily
pr
esch
ool c
hild
car
e, m
othe
r eve
r wor
ked,
mat
erna
l dep
ress
ion,
par
ent e
xpec
tatio
ns, p
ublic
ass
ista
nce.
ECLS
-K C
oeffi
cien
ts an
d St
anda
rd E
rror
s fro
m R
egre
ssio
n M
odel
s for
Sub
grou
ps o
f Spr
ing
3rd
Gra
de R
eadi
ng a
nd M
ath
Rea
ding
Com
posi
teM
ath
Com
posi
teTe
st S
core
Achi
evem
ent o
n Ea
rly A
cade
mic
Ski
lls a
nd S
elf-R
egul
atio
n
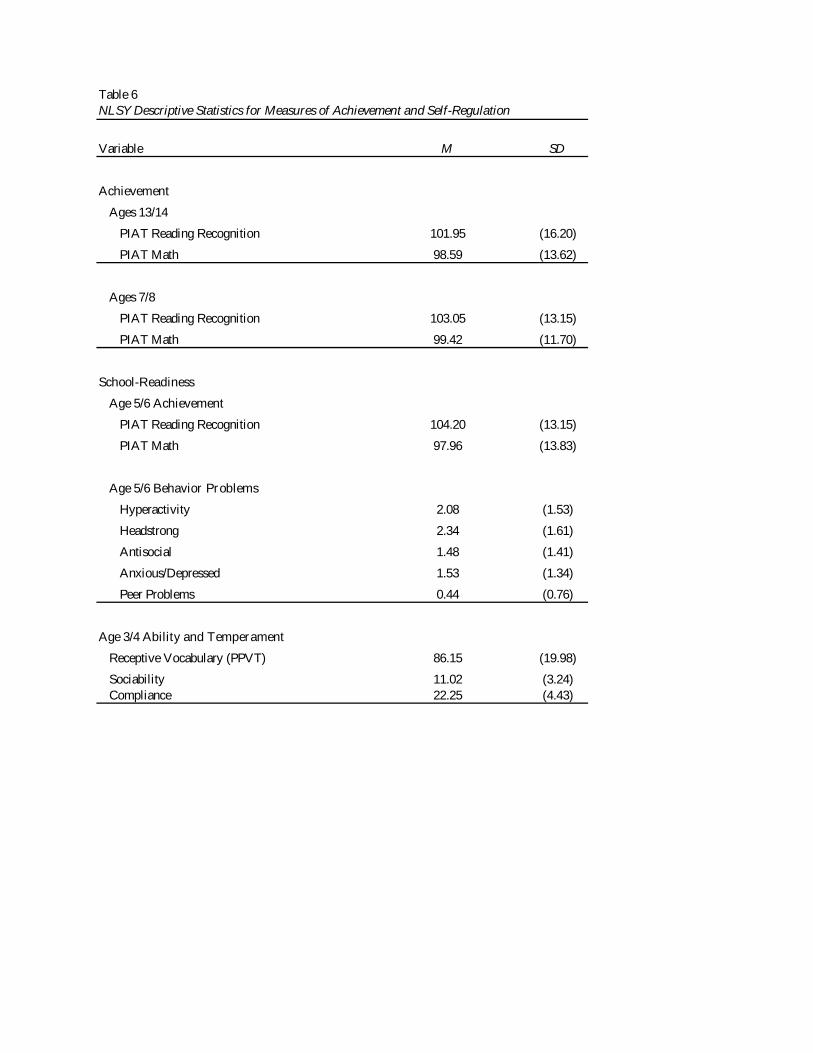
NLSY Descriptive Statistics for Measures of Achievement and Self-Regulation
Variable M SD
AchievementAges 13/14
PIAT Reading Recognition 101.95 (16.20)
PIAT Math 98.59 (13.62)
Ages 7/8PIAT Reading Recognition 103.05 (13.15)
PIAT Math 99.42 (11.70)
School-ReadinessAge 5/6 Achievement
PIAT Reading Recognition 104.20 (13.15)
PIAT Math 97.96 (13.83)
Age 5/6 Behavior ProblemsHyperactivity 2.08 (1.53)
Headstrong 2.34 (1.61)
Antisocial 1.48 (1.41)
Anxious/Depressed 1.53 (1.34)
Peer Problems 0.44 (0.76)
Receptive Vocabulary (PPVT) 86.15 (19.98)
Sociability 11.02 (3.24)Compliance 22.25 (4.43)
Table 6
Age 3/4 Ability and Temperament
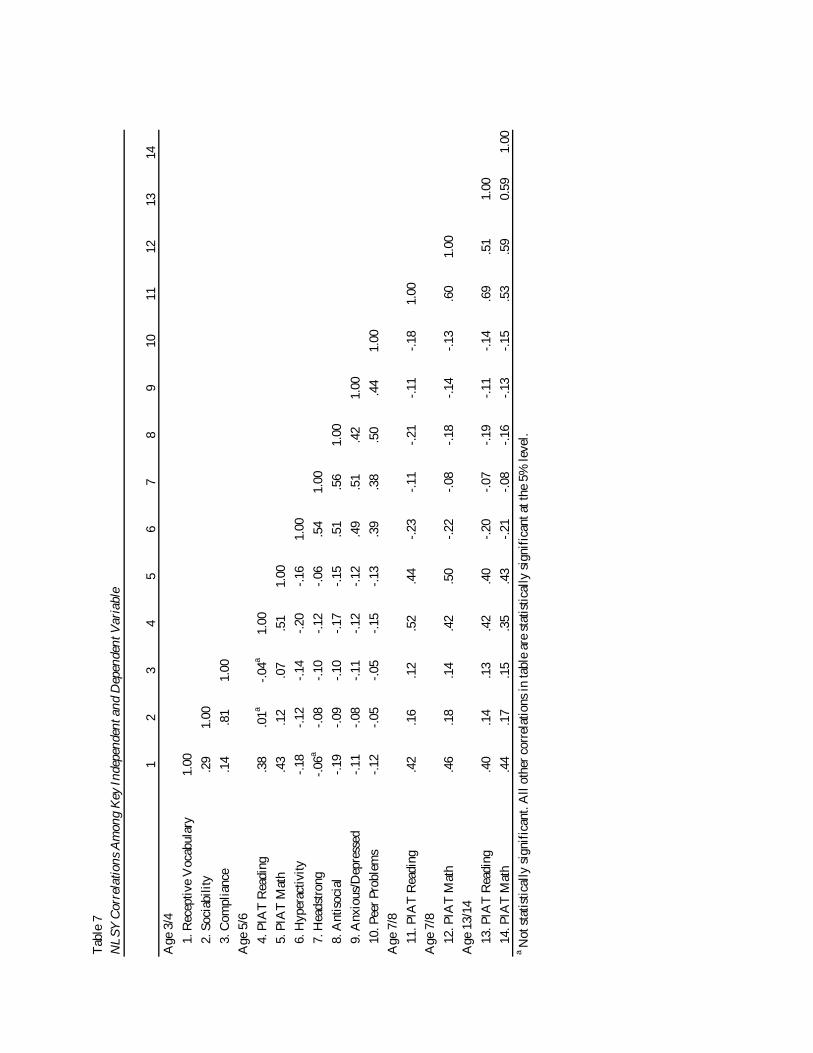
NLS
Y Co
rrel
atio
ns A
mon
g Ke
y In
depe
nden
t and
Dep
ende
nt V
aria
ble
12
34
56
78
910
1112
1314
Age
3/4
1. R
ecep
tive
Voc
abul
ary
1.00
2. S
ocia
bilit
y.2
91.
003.
Com
plia
nce
.14
.81
1.00
Age
5/6
4. P
IAT
Rea
ding
.38
.01a
-.04a
1.00
5. P
IAT
Mat
h.4
3.1
2.0
7.5
11.
006.
Hyp
erac
tivity
-.18
-.12
-.14
-.20
-.16
1.00
7. H
eads
trong
-.06a
-.08
-.10
-.12
-.06
.54
1.00
8. A
ntis
ocia
l -.1
9-.0
9-.1
0-.1
7-.1
5.5
1.5
61.
009.
Anx
ious
/Dep
ress
ed-.1
1-.0
8-.1
1-.1
2-.1
2.4
9.5
1.4
21.
0010
. Pee
r Pro
blem
s-.1
2-.0
5-.0
5-.1
5-.1
3.3
9.3
8.5
0.4
41.
00A
ge 7
/811
. PIA
T R
eadi
ng.4
2.1
6.1
2.5
2.4
4-.2
3-.1
1-.2
1-.1
1-.1
81.
00A
ge 7
/812
. PIA
T M
ath
.46
.18
.14
.42
.50
-.22
-.08
-.18
-.14
-.13
.60
1.00
Age
13/
1413
. PIA
T R
eadi
ng.4
0.1
4.1
3.4
2.4
0-.2
0-.0
7-.1
9-.1
1-.1
4.6
9.5
11.
0014
. PIA
T M
ath
.44
.17
.15
.35
.43
-.21
-.08
-.16
-.13
-.15
.53
.59
0.59
1.00
a Not
stat
istic
ally
sign
ifica
nt. A
ll ot
her c
orre
latio
ns in
tabl
e ar
e st
atis
tical
ly si
gnifi
cant
at t
he 5
% le
vel.
Tabl
e 7
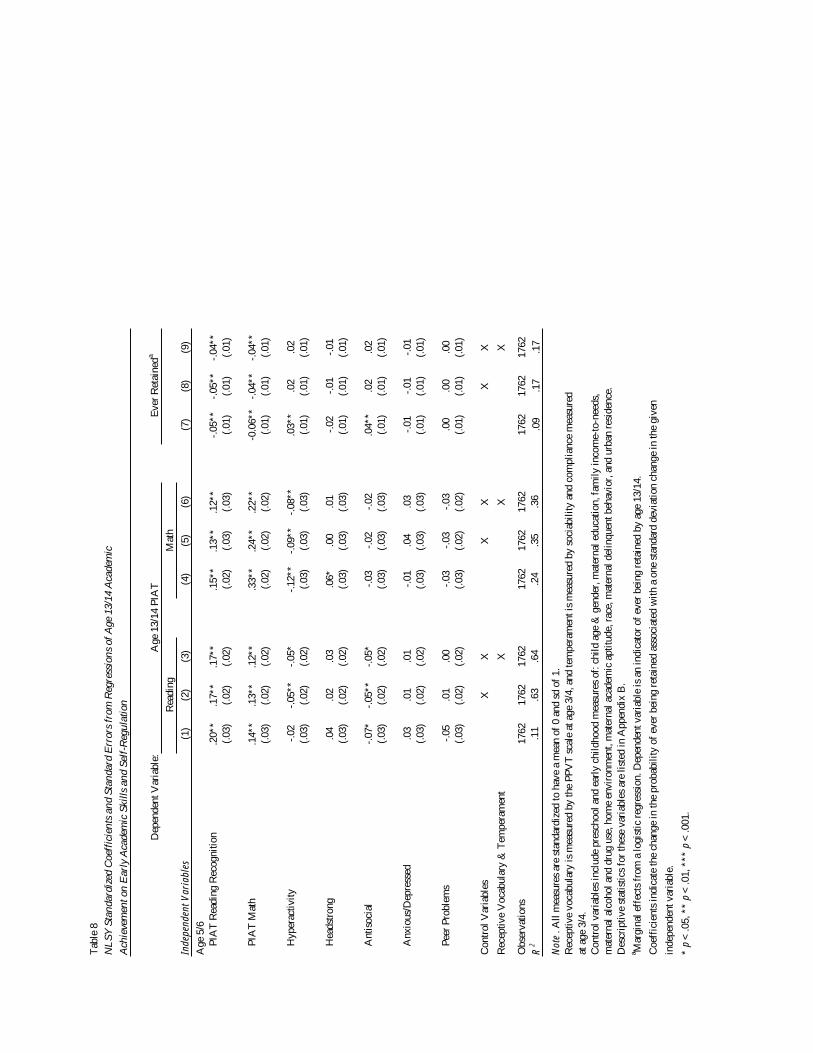
Achi
evem
ent o
n Ea
rly A
cade
mic
Ski
lls a
nd S
elf-R
egul
atio
n
Dep
ende
nt V
aria
ble:
Inde
pend
ent V
aria
bles
(1)
(2)
(3)
(4)
(5)
(6)
(7)
(8)
(9)
Age
5/6
PIA
T R
eadi
ng R
ecog
nitio
n.2
0**
.17*
*.1
7**
.15*
*.1
3**
.12*
*-.0
5**
-.05*
*-.0
4**
(.03)
(.02)
(.02)
(.02)
(.03)
(.03)
(.01)
(.01)
(.01)
PIA
T M
ath
.14*
*.1
3**
.12*
*.3
3**
.24*
*.2
2**
-0.0
6**
-.04*
*-.0
4**
(.03)
(.02)
(.02)
(.02)
(.02)
(.02)
(.01)
(.01)
(.01)
Hyp
erac
tivity
-.02
-.05*
*-.0
5*-.1
2**
-.09*
*-.0
8**
.03*
*.0
2.0
2(.0
3)(.0
2)(.0
2)(.0
3)(.0
3)(.0
3)(.0
1)(.0
1)(.0
1)
Hea
dstro
ng.0
4.0
2.0
3.0
6*.0
0.0
1-.0
2-.0
1-.0
1(.0
3)(.0
2)(.0
2)(.0
3)(.0
3)(.0
3)(.0
1)(.0
1)(.0
1)
Ant
isoc
ial
-.07*
-.05*
*-.0
5*-.0
3-.0
2-.0
2.0
4**
.02
.02
(.03)
(.02)
(.02)
(.03)
(.03)
(.03)
(.01)
(.01)
(.01)
Anx
ious
/Dep
ress
ed.0
3.0
1.0
1-.0
1.0
4.0
3-.0
1-.0
1-.0
1(.0
3)(.0
2)(.0
2)(.0
3)(.0
3)(.0
3)(.0
1)(.0
1)(.0
1)
Peer
Pro
blem
s-.0
5.0
1.0
0-.0
3-.0
3-.0
3.0
0.0
0.0
0(.0
3)(.0
2)(.0
2)(.0
3)(.0
2)(.0
2)(.0
1)(.0
1)(.0
1)
Con
trol V
aria
bles
XX
XX
XX
Rec
eptiv
e V
ocab
ular
y &
Tem
pera
men
t X
XX
Obs
erva
tions
1762
1762
1762
1762
1762
1762
1762
1762
1762
R2
.11
.63
.64
.24
.35
.36
.09
.17
.17
at a
ge 3
/4.
inde
pend
ent v
aria
ble.
* p
< .0
5, *
* p
< .0
1, *
** p
< .0
01.
Not
e. A
ll m
easu
res a
re st
anda
rdiz
ed to
hav
e a
mea
n of
0 a
nd sd
of 1
.
Tabl
e 8
Rea
ding
Age
13/
14 P
IAT
Mat
h
NLS
Y St
anda
rdize
d Co
effic
ient
s and
Sta
ndar
d Er
rors
from
Reg
ress
ions
of A
ge 1
3/14
Aca
dem
ic
Ever
Ret
aine
da
Con
trol v
aria
bles
incl
ude
pres
choo
l and
ear
ly c
hild
hood
mea
sure
s of:
child
age
& g
ende
r, m
ater
nal e
duca
tion,
fam
ily in
com
e-to
-nee
ds,
Des
crip
tive
stat
istic
s for
thes
e va
riabl
es a
re li
sted
in A
ppen
dix
B.
Rec
eptiv
e vo
cabu
lary
is m
easu
red
by th
e PP
VT
scal
e at
age
3/4
, and
tem
pera
men
t is m
easu
red
by so
ciab
ility
and
com
plia
nce
mea
sure
d
Coe
ffic
ient
s ind
icat
e th
e ch
ange
in th
e pr
obab
ility
of e
ver b
eing
reta
ined
ass
ocia
ted
with
a o
ne st
anda
rd d
evia
tion
chan
ge in
the
give
n
mat
erna
l alc
ohol
and
dru
g us
e, h
ome
envi
ronm
ent,
mat
erna
l aca
dem
ic a
ptitu
de, r
ace,
mat
erna
l del
inqu
ent b
ehav
ior,
and
urba
n re
siden
ce.
a Mar
gina
l eff
ects
from
a lo
gist
ic re
gres
sion
. Dep
ende
nt v
aria
ble
is a
n in
dica
tor o
f eve
r bei
ng re
tain
ed b
y ag
e 13
/14.
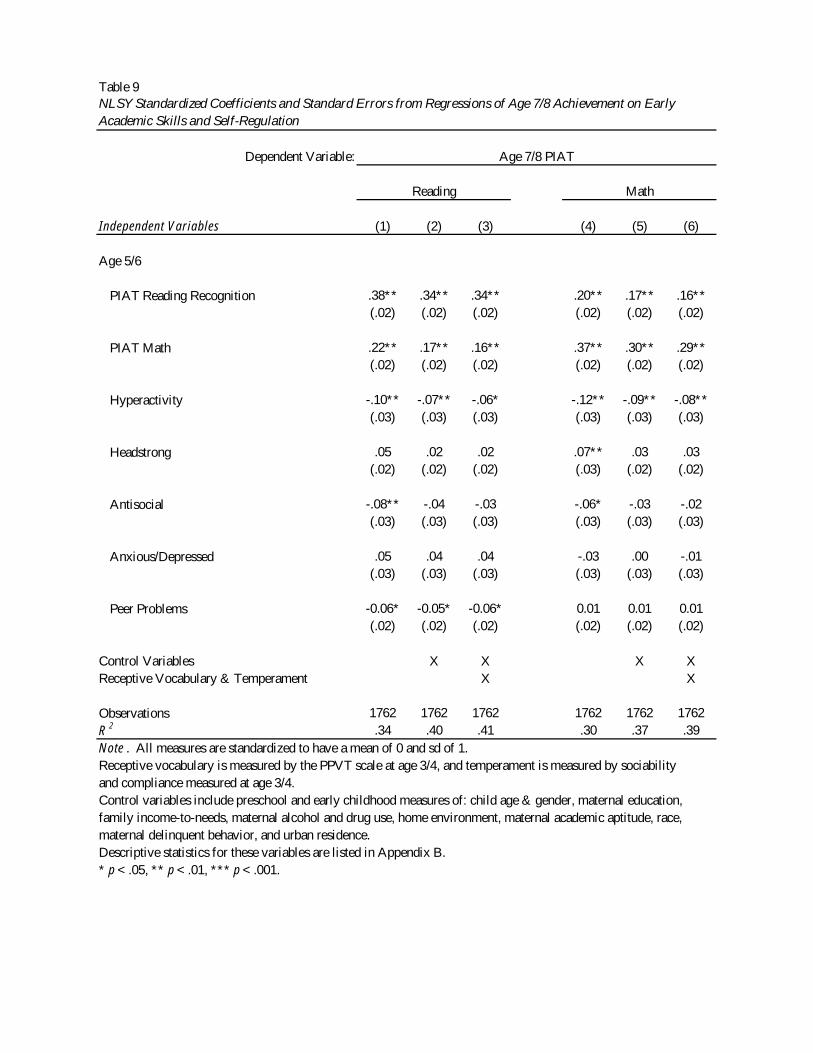
Dependent Variable:
Independent Variables (1) (2) (3) (4) (5) (6)
Age 5/6
PIAT Reading Recognition .38** .34** .34** .20** .17** .16**(.02) (.02) (.02) (.02) (.02) (.02)
PIAT Math .22** .17** .16** .37** .30** .29**(.02) (.02) (.02) (.02) (.02) (.02)
Hyperactivity -.10** -.07** -.06* -.12** -.09** -.08**(.03) (.03) (.03) (.03) (.03) (.03)
Headstrong .05 .02 .02 .07** .03 .03(.02) (.02) (.02) (.03) (.02) (.02)
Antisocial -.08** -.04 -.03 -.06* -.03 -.02(.03) (.03) (.03) (.03) (.03) (.03)
Anxious/Depressed .05 .04 .04 -.03 .00 -.01(.03) (.03) (.03) (.03) (.03) (.03)
Peer Problems -0.06* -0.05* -0.06* 0.01 0.01 0.01(.02) (.02) (.02) (.02) (.02) (.02)
Control Variables X X X XReceptive Vocabulary & Temperament X X
Observations 1762 1762 1762 1762 1762 1762R 2 .34 .40 .41 .30 .37 .39
and compliance measured at age 3/4.
* p < .05, ** p < .01, *** p < .001. Descriptive statistics for these variables are listed in Appendix B.
Academic Skills and Self-Regulation
Control variables include preschool and early childhood measures of: child age & gender, maternal education,family income-to-needs, maternal alcohol and drug use, home environment, maternal academic aptitude, race,maternal delinquent behavior, and urban residence.
Receptive vocabulary is measured by the PPVT scale at age 3/4, and temperament is measured by sociability Note . All measures are standardized to have a mean of 0 and sd of 1.
Math
Table 9
Reading
NLSY Standardized Coefficients and Standard Errors from Regressions of Age 7/8 Achievement on Early
Age 7/8 PIAT
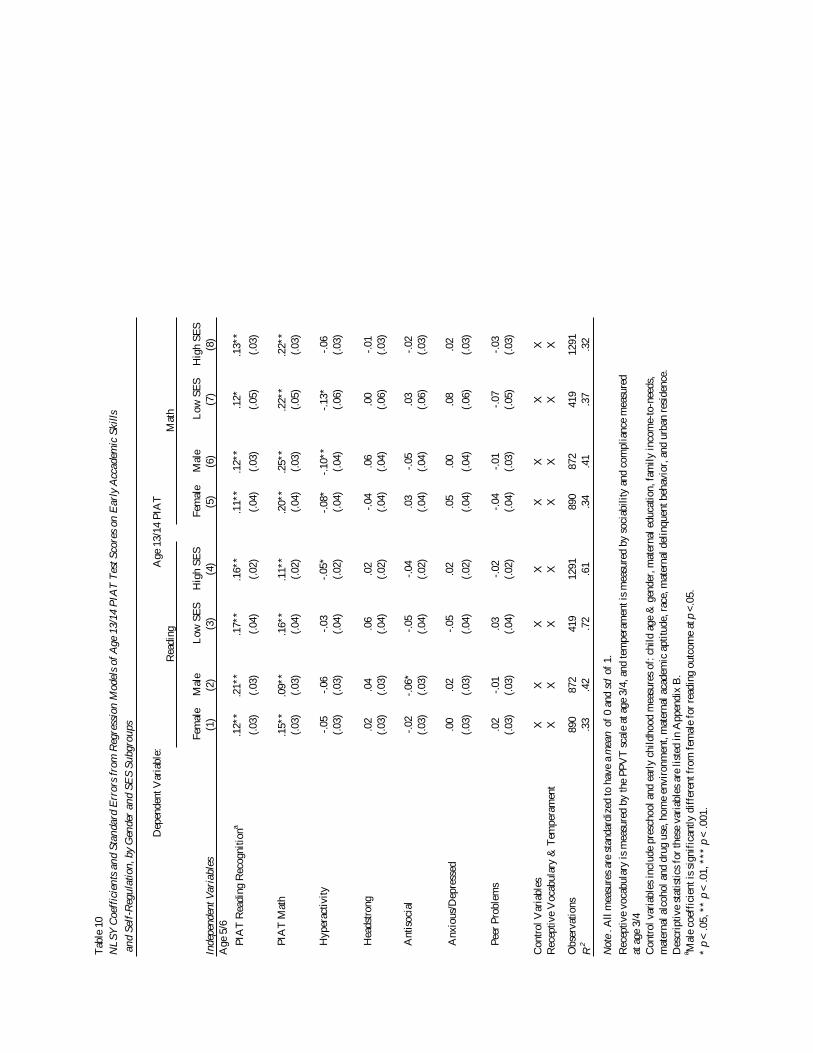
Tabl
e 10
Dep
ende
nt V
aria
ble:
Fem
ale
Mal
eLo
w S
ESH
igh
SES
Fem
ale
Mal
eLo
w S
ESH
igh
SES
Inde
pend
ent V
aria
bles
(1)
(2)
(3)
(4)
(5)
(6)
(7)
(8)
Age
5/6
PIA
T R
eadi
ng R
ecog
nitio
na.1
2**
.21*
*.1
7**
.16*
*.1
1**
.12*
*.1
2*.1
3**
(.03)
(.03)
(.04)
(.02)
(.04)
(.03)
(.05)
(.03)
PIA
T M
ath
.15*
*.0
9**
.16*
*.1
1**
.20*
*.2
5**
.22*
*.2
2**
(.03)
(.03)
(.04)
(.02)
(.04)
(.03)
(.05)
(.03)
Hyp
erac
tivity
-.05
-.06
-.03
-.05*
-.08*
-.10*
*-.1
3*-.0
6(.0
3)(.0
3)(.0
4)(.0
2)(.0
4)(.0
4)(.0
6)(.0
3)
Hea
dstro
ng.0
2.0
4.0
6.0
2-.0
4.0
6.0
0-.0
1(.0
3)(.0
3)(.0
4)(.0
2)(.0
4)(.0
4)(.0
6)(.0
3)
Ant
isoc
ial
-.02
-.06*
-.05
-.04
.03
-.05
.03
-.02
(.03)
(.03)
(.04)
(.02)
(.04)
(.04)
(.06)
(.03)
Anx
ious
/Dep
ress
ed.0
0.0
2-.0
5.0
2.0
5.0
0.0
8.0
2(.0
3)(.0
3)(.0
4)(.0
2)(.0
4)(.0
4)(.0
6)(.0
3)
Peer
Pro
blem
s.0
2-.0
1.0
3-.0
2-.0
4-.0
1-.0
7-.0
3(.0
3)(.0
3)(.0
4)(.0
2)(.0
4)(.0
3)(.0
5)(.0
3)
Con
trol V
aria
bles
XX
XX
XX
XX
Rec
eptiv
e V
ocab
ular
y &
Tem
pera
men
t X
XX
XX
XX
X
Obs
erva
tions
890
872
419
1291
890
872
419
1291
R2
.33
.42
.72
.61
.34
.41
.37
.32
* p
< .0
5, *
* p
< .0
1, *
** p
< .0
01.
a Mal
e co
effic
ient
is si
gnifi
cant
ly d
iffer
ent f
rom
fem
ale
for r
eadi
ng o
utco
me
at p
<.05
.
and
Sel
f-Reg
ulat
ion,
by
Gen
der a
nd S
ES S
ubgr
oups
at a
ge 3
/4C
ontro
l var
iabl
es in
clud
e pr
esch
ool a
nd e
arly
chi
ldho
od m
easu
res o
f: ch
ild a
ge &
gen
der,
mat
erna
l edu
catio
n, fa
mily
inco
me-
to-n
eeds
, m
ater
nal a
lcoh
ol a
nd d
rug
use,
hom
e en
viro
nmen
t, m
ater
nal a
cade
mic
apt
itude
, rac
e, m
ater
nal d
elin
quen
t beh
avio
r, an
d ur
ban
resid
ence
. D
escr
iptiv
e st
atis
tics f
or th
ese
varia
bles
are
list
ed in
App
endi
x B
.
Rec
eptiv
e vo
cabu
lary
is m
easu
red
by th
e PP
VT
scal
e at
age
3/4
, and
tem
pera
men
t is m
easu
red
by so
ciab
ility
and
com
plia
nce
mea
sure
d N
ote.
All
mea
sure
s are
stan
dard
ized
to h
ave
a m
ean
of 0
and
sd
of 1
.
NLS
Y Co
effic
ient
s and
Sta
ndar
d Er
rors
from
Reg
ress
ion
Mod
els o
f Age
13/
14 P
IAT
Test
Scor
es o
n Ea
rly A
ccad
emic
Ski
lls
Rea
ding
Mat
hA
ge 1
3/14
PIA
T
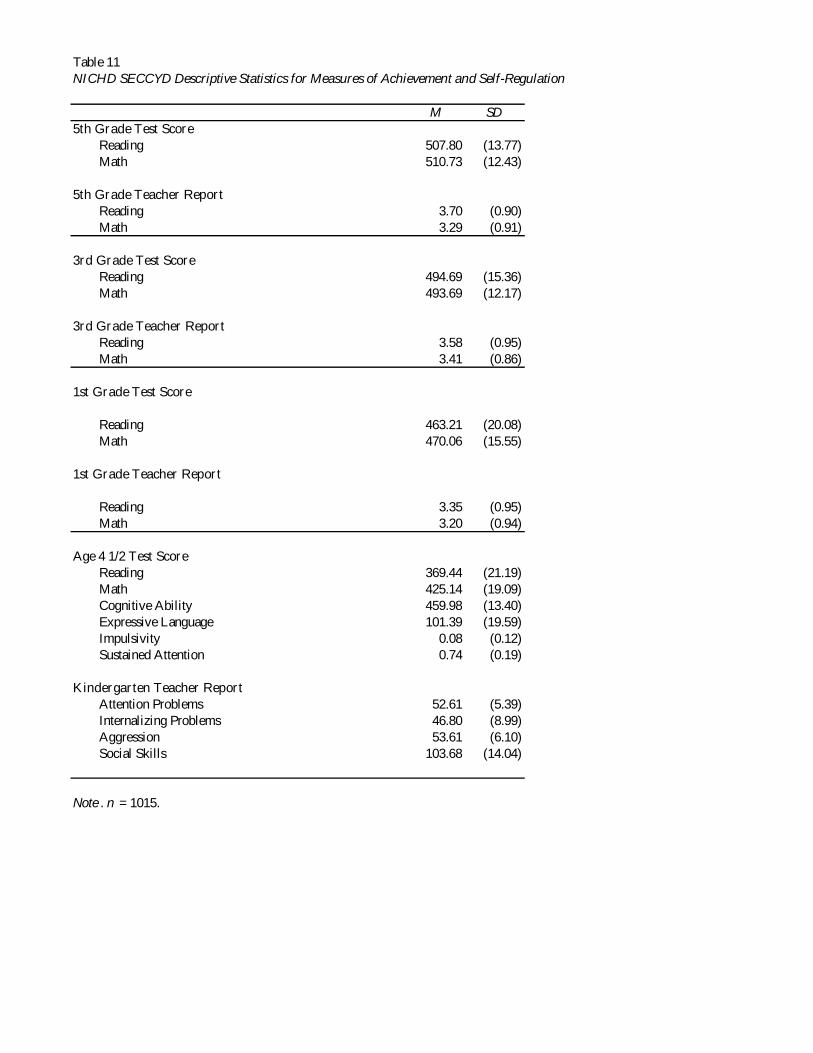
Table 11NICHD SECCYD Descriptive Statistics for Measures of Achievement and Self-Regulation
M SD5th Grade Test Score
Reading 507.80 (13.77)Math 510.73 (12.43)
5th Grade Teacher ReportReading 3.70 (0.90)Math 3.29 (0.91)
3rd Grade Test ScoreReading 494.69 (15.36)Math 493.69 (12.17)
3rd Grade Teacher ReportReading 3.58 (0.95)Math 3.41 (0.86)
1st Grade Test Score
Reading 463.21 (20.08)Math 470.06 (15.55)
1st Grade Teacher Report
Reading 3.35 (0.95)Math 3.20 (0.94)
Age 4 1/2 Test ScoreReading 369.44 (21.19)Math 425.14 (19.09)Cognitive Ability 459.98 (13.40)Expressive Language 101.39 (19.59)Impulsivity 0.08 (0.12)Sustained Attention 0.74 (0.19)
Kindergarten Teacher ReportAttention Problems 52.61 (5.39)Internalizing Problems 46.80 (8.99)Aggression 53.61 (6.10)Social Skills 103.68 (14.04)
Note . n = 1015.
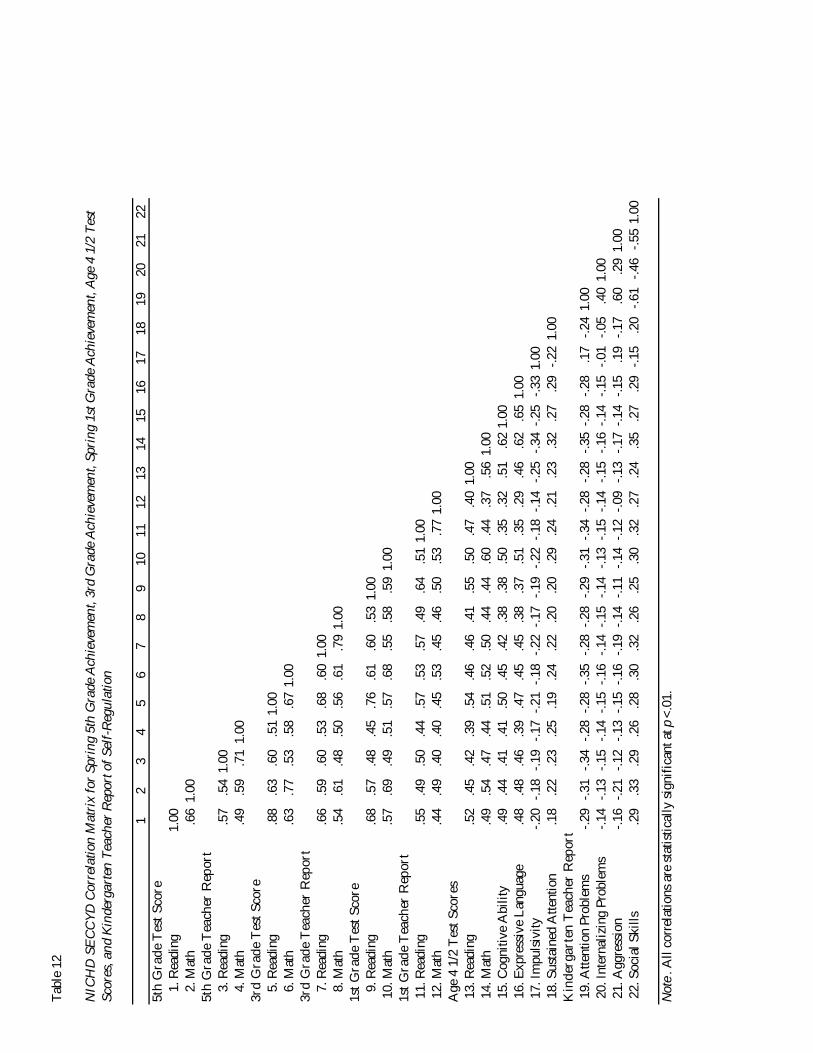
Tabl
e 12
12
34
56
78
910
1112
1314
1516
1718
1920
2122
5th
Gra
de T
est S
core
1.
Rea
ding
1.00
2.
Mat
h.6
61.
005t
h G
rade
Tea
cher
Rep
ort
3.
Rea
ding
.57
.54
1.00
4.
Mat
h.4
9.5
9.7
11.
003r
d G
rade
Tes
t Sco
re
5. R
eadi
ng.8
8.6
3.6
0.5
11.
00
6. M
ath
.63
.77
.53
.58
.67
1.00
3rd
Gra
de T
each
er R
epor
t
7. R
eadi
ng.6
6.5
9.6
0.5
3.6
8.6
01.
00
8. M
ath
.54
.61
.48
.50
.56
.61
.79
1.00
1st G
rade
Tes
t Sco
re
9. R
eadi
ng.6
8.5
7.4
8.4
5.7
6.6
1.6
0.5
31.
00 1
0. M
ath
.57
.69
.49
.51
.57
.68
.55
.58
.59
1.00
1st G
rade
Tea
cher
Rep
ort
11.
Rea
ding
.55
.49
.50
.44
.57
.53
.57
.49
.64
.51
1.00
12.
Mat
h.4
4.4
9.4
0.4
0.4
5.5
3.4
5.4
6.5
0.5
3.7
71.
00A
ge 4
1/2
Tes
t Sco
res
13.
Rea
ding
.52
.45
.42
.39
.54
.46
.46
.41
.55
.50
.47
.40
1.00
14.
Mat
h.4
9.5
4.4
7.4
4.5
1.5
2.5
0.4
4.4
4.6
0.4
4.3
7.5
61.
00 1
5. C
ogni
tive
Abi
lity
.49
.44
.41
.41
.50
.45
.42
.38
.38
.50
.35
.32
.51
.62
1.00
16.
Exp
ress
ive
Lang
uage
.48
.48
.46
.39
.47
.45
.45
.38
.37
.51
.35
.29
.46
.62
.65
1.00
17.
Impu
lsiv
ity-.2
0-.1
8-.1
9-.1
7-.2
1-.1
8-.2
2-.1
7-.1
9-.2
2-.1
8-.1
4-.2
5-.3
4-.2
5-.3
31.
00 1
8. S
usta
ined
Atte
ntio
n.1
8.2
2.2
3.2
5.1
9.2
4.2
2.2
0.2
0.2
9.2
4.2
1.2
3.3
2.2
7.2
9-.2
21.
00K
inde
rgar
ten
Tea
cher
Rep
ort
19.
Atte
ntio
n Pr
oble
ms
-.29
-.31
-.34
-.28
-.28
-.35
-.28
-.28
-.29
-.31
-.34
-.28
-.28
-.35
-.28
-.28
.17
-.24
1.00
20.
Inte
rnal
izin
g Pr
oble
ms
-.14
-.13
-.15
-.14
-.15
-.16
-.14
-.15
-.14
-.13
-.15
-.14
-.15
-.16
-.14
-.15
-.01
-.05
.40
1.00
21.
Agg
ress
ion
-.16
-.21
-.12
-.13
-.15
-.16
-.19
-.14
-.11
-.14
-.12
-.09
-.13
-.17
-.14
-.15
.19
-.17
.60
.29
1.00
22.
Soc
ial S
kills
.29
.33
.29
.26
.28
.30
.32
.26
.25
.30
.32
.27
.24
.35
.27
.29
-.15
.20
-.61
-.46
-.55
1.00
NIC
HD
SEC
CYD
Cor
rela
tion
Mat
rix fo
r Spr
ing
5th
Gra
de A
chie
vem
ent,
3rd
Gra
de A
chie
vem
ent,
Sprin
g 1s
t Gra
de A
chie
vem
ent,
Age
4 1/
2 Te
st Sc
ores
, and
Kin
derg
arte
n Te
ache
r Rep
ort o
f Sel
f-Reg
ulat
ion
Not
e. A
ll co
rrel
atio
ns a
re st
atis
tical
ly si
gnifi
cant
at p
<.01
.
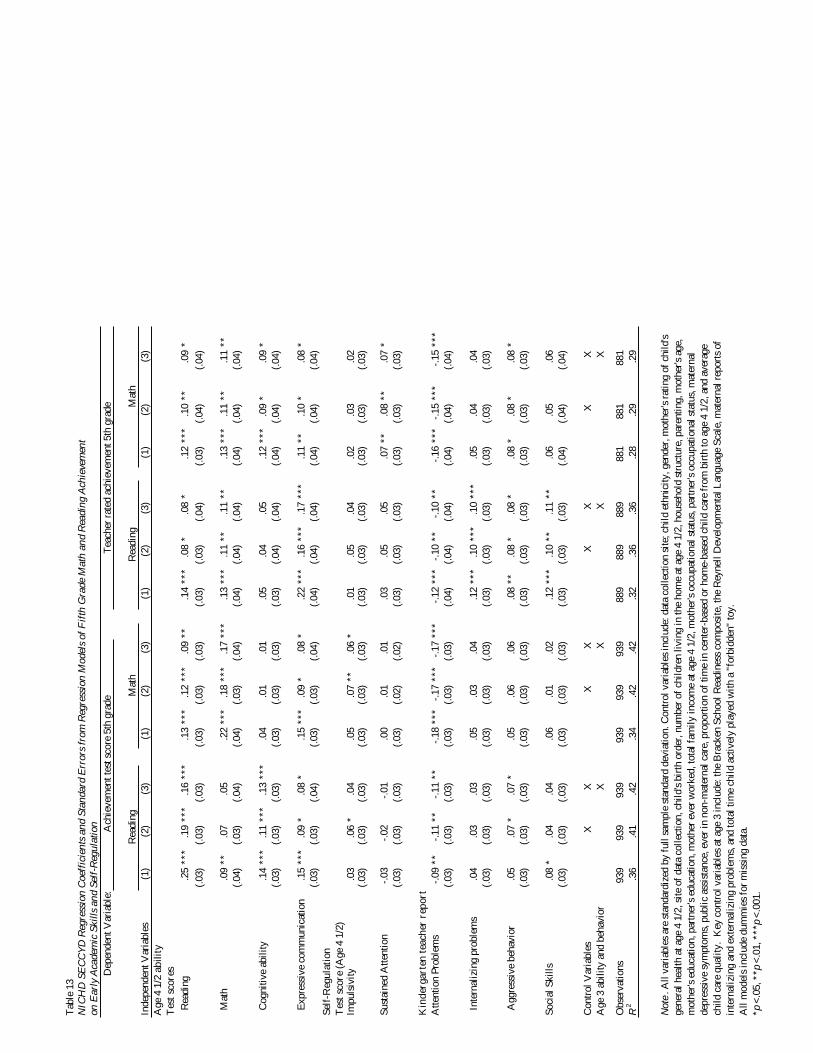
Dep
ende
nt V
aria
ble:
Inde
pend
ent V
aria
bles
(1)
(2)
(3)
(1)
(2)
(3)
(1)
(2)
(3)
(1)
(2)
(3)
Age
4 1
/2 a
bilit
yT
est s
core
s R
eadi
ng.2
5**
*.1
9**
*.1
6**
*.1
3**
*.1
2**
*.0
9**
.1
4**
*.0
8*
.0
8*
.1
2**
*.1
0**
.0
9*
(.0
3)(.0
3)(.0
3)(.0
3)(.0
3)(.0
3)(.0
3)(.0
3)(.0
4)(.0
3)(.0
4)(.0
4)
Mat
h.0
9**
.0
7
.05
.2
2**
*.1
8**
*.1
7**
*.1
3**
*.1
1**
.1
1**
.1
3**
*.1
1**
.1
1**
(.0
4)(.0
3)(.0
4)(.0
4)(.0
3)(.0
4)(.0
4)(.0
4)(.0
4)(.0
4)(.0
4)(.0
4)
Cog
nitiv
e ab
ility
.14
***
.11
***
.13
***
.04
.0
1
.01
.0
5
.04
.0
5
.12
***
.09
*
.09
*
(.03)
(.03)
(.03)
(.03)
(.03)
(.03)
(.03)
(.04)
(.04)
(.04)
(.04)
(.04)
Exp
ress
ive
com
mun
icat
ion
.15
***
.09
*
.08
*
.15
***
.09
*
.08
*
.22
***
.16
***
.17
***
.11
**
.10
*
.08
*
(.03)
(.03)
(.04)
(.03)
(.03)
(.04)
(.04)
(.04)
(.04)
(.04)
(.04)
(.04)
Self-
Reg
ulat
ion
Tes
t sco
re (A
ge 4
1/2
)Im
puls
ivity
.03
.0
6*
.0
4
.05
.0
7**
.0
6*
.0
1
.05
.0
4
.02
.0
3
.02
(.0
3)(.0
3)(.0
3)(.0
3)(.0
3)(.0
3)(.0
3)(.0
3)(.0
3)(.0
3)(.0
3)(.0
3)
Sust
aine
d A
ttent
ion
-.03
-.0
2
-.01
.0
0
.01
.0
1
.03
.0
5
.05
.0
7**
.0
8**
.0
7*
(.0
3)(.0
3)(.0
3)(.0
3)(.0
2)(.0
2)(.0
3)(.0
3)(.0
3)(.0
3)(.0
3)(.0
3)
Kin
derg
arte
n te
ache
r re
port
Atte
ntio
n Pr
oble
ms
-.09
**
-.11
**
-.11
**
-.18
***
-.17
***
-.17
***
-.12
***
-.10
**
-.10
**
-.16
***
-.15
***
-.15
***
(.03)
(.03)
(.03)
(.03)
(.03)
(.03)
(.04)
(.04)
(.04)
(.04)
(.04)
(.04)
Int
erna
lizin
g pr
oble
ms
.04
.0
3
.03
.0
5
.03
.0
4
.12
***
.10
***
.10
***
.05
.0
4
.04
(.0
3)(.0
3)(.0
3)(.0
3)(.0
3)(.0
3)(.0
3)(.0
3)(.0
3)(.0
3)(.0
3)(.0
3)
Agg
ress
ive
beha
vior
.05
.0
7*
.0
7*
.0
5
.06
.0
6
.08
**
.08
*
.08
*
.08
*
.08
*
.08
*
(.03)
(.03)
(.03)
(.03)
(.03)
(.03)
(.03)
(.03)
(.03)
(.03)
(.03)
(.03)
Soci
al S
kills
.08
*
.04
.0
4
.06
.0
1
.02
.1
2**
*.1
0**
.1
1**
.0
6
.05
.0
6
(.03)
(.03)
(.03)
(.03)
(.03)
(.03)
(.03)
(.03)
(.03)
(.04)
(.04)
(.04)
Con
trol V
aria
bles
XX
XX
XX
XX
Age
3 a
bilit
y an
d be
havi
orX
XX
X
Obs
erva
tions
939
939
939
939
939
939
889
889
889
881
881
881
R2
.36
.41
.42
.34
.42
.42
.32
.36
.36
.28
.29
.29
Not
e. A
ll va
riabl
es a
re st
anda
rdiz
ed b
y fu
ll sa
mpl
e st
anda
rd d
evia
tion.
Con
trol v
aria
bles
incl
ude:
dat
a co
llect
ion
site
; chi
ld e
thni
city
, gen
der,
mot
her's
ratin
g of
chi
ld's
gene
ral h
ealth
at a
ge 4
1/2
, site
of d
ata
colle
ctio
n, c
hild
's bi
rth o
rder
, num
ber o
f chi
ldre
n liv
ing
in th
e ho
me
at a
ge 4
1/2
, hou
seho
ld st
ruct
ure,
par
entin
g, m
othe
r's a
ge,
mot
her's
edu
catio
n, p
artn
er's
educ
atio
n, m
othe
r eve
r wor
ked,
tota
l fam
ily in
com
e at
age
4 1
/2, m
othe
r's o
ccup
atio
nal s
tatu
s, pa
rtner
's oc
cupa
tiona
l sta
tus,
mat
erna
l de
pres
sive
sym
ptom
s, pu
blic
ass
ista
nce,
eve
r in
non-
mat
erna
l car
e, p
ropo
rtion
of t
ime
in c
ente
r-ba
sed
or h
ome-
base
d ch
ild c
are
from
birt
h to
age
4 1
/2, a
nd a
vera
ge
child
car
e qu
ality
. K
ey c
ontro
l var
iabl
es a
t age
3 in
clud
e: th
e B
rack
en S
choo
l Rea
dine
ss c
ompo
site
, the
Rey
nell
Dev
elop
men
tal L
angu
age
Scal
e, m
ater
nal r
epor
ts o
f in
tern
aliz
ing
and
exte
rnal
izin
g pr
oble
ms,
and
tota
l tim
e ch
ild a
ctiv
ely
play
ed w
ith a
"fo
rbid
den"
toy.
A
ll m
odel
s inc
lude
dum
mie
s for
mis
sing
dat
a.*p
<.05
, **p
<.01
, ***
p<.
001.
Rea
ding
Mat
hR
eadi
ngM
ath
Tabl
e 13
Ach
ieve
men
t tes
t sco
re 5
th g
rade
Teac
her r
ated
ach
ieve
men
t 5th
gra
de
NIC
HD
SEC
CYD
Reg
ress
ion
Coef
ficie
nts a
nd S
tand
ard
Erro
rs fr
om R
egre
ssio
n M
odel
s of F
ifth
Gra
de M
ath
and
Read
ing
Achi
evem
ent
on E
arly
Aca
dem
ic S
kills
and
Sel
f-Reg
ulat
ion
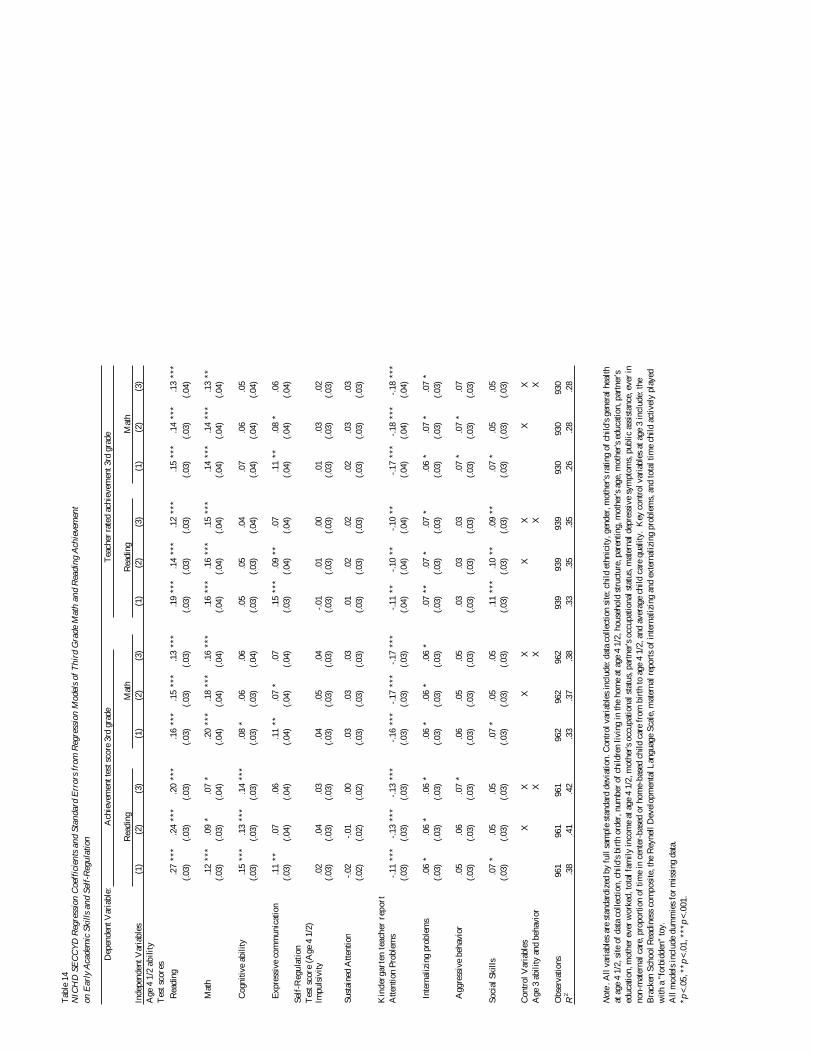
on E
arly
Aca
dem
ic S
kills
and
Sel
f-Reg
ulat
ion
Dep
ende
nt V
aria
ble:
Inde
pend
ent V
aria
bles
(1)
(2)
(3)
(1)
(2)
(3)
(1)
(2)
(3)
(1)
(2)
(3)
Age
4 1
/2 a
bilit
yT
est s
core
s R
eadi
ng.2
7**
*.2
4**
*.2
0**
*.1
6**
*.1
5**
*.1
3**
*.1
9**
*.1
4**
*.1
2**
*.1
5**
*.1
4**
*.1
3**
*(.0
3)(.0
3)(.0
3)(.0
3)(.0
3)(.0
3)(.0
3)(.0
3)(.0
3)(.0
3)(.0
3)(.0
4)
Mat
h.1
2**
*.0
9*
.0
7*
.2
0**
*.1
8**
*.1
6**
*.1
6**
*.1
6**
*.1
5**
*.1
4**
*.1
4**
*.1
3**
(.0
3)(.0
3)(.0
4)(.0
4)(.0
4)(.0
4)(.0
4)(.0
4)(.0
4)(.0
4)(.0
4)(.0
4)
Cog
nitiv
e ab
ility
.15
***
.13
***
.14
***
.08
*
.06
.0
6
.05
.0
5
.04
.0
7
.06
.0
5
(.03)
(.03)
(.03)
(.03)
(.03)
(.04)
(.03)
(.03)
(.04)
(.04)
(.04)
(.04)
Exp
ress
ive
com
mun
icat
ion
.11
**
.07
.0
6
.11
**
.07
*
.07
.1
5**
*.0
9**
.0
7
.11
**
.08
*
.06
(.0
3)(.0
4)(.0
4)(.0
4)(.0
4)(.0
4)(.0
3)(.0
4)(.0
4)(.0
4)(.0
4)(.0
4)Se
lf-R
egul
atio
nT
est s
core
(Age
4 1
/2)
Impu
lsiv
it y.0
2
.04
.0
3
.04
.0
5
.04
-.0
1
.01
.0
0
.01
.0
3
.02
(.0
3)(.0
3)(.0
3)(.0
3)(.0
3)(.0
3)(.0
3)(.0
3)(.0
3)(.0
3)(.0
3)(.0
3)
Sust
aine
d A
ttent
ion
-.02
-.0
1
.00
.0
3
.03
.0
3
.01
.0
2
.02
.0
2
.03
.0
3
(.02)
(.02)
(.02)
(.03)
(.03)
(.03)
(.03)
(.03)
(.03)
(.03)
(.03)
(.03)
Kin
derg
arte
n te
ache
r re
port
Atte
ntio
n Pr
oble
ms
-.11
***
-.13
***
-.13
***
-.16
***
-.17
***
-.17
***
-.11
**
-.10
**
-.10
**
-.17
***
-.18
***
-.18
***
(.03)
(.03)
(.03)
(.03)
(.03)
(.03)
(.04)
(.04)
(.04)
(.04)
(.04)
(.04)
Int
erna
lizin
g pr
oble
ms
.06
*
.06
*
.06
*
.06
*
.06
*
.06
*
.07
**
.07
*
.07
*
.06
*
.07
*
.07
*
(.03)
(.03)
(.03)
(.03)
(.03)
(.03)
(.03)
(.03)
(.03)
(.03)
(.03)
(.03)
Agg
ress
ive
beha
vior
.05
.0
6
.07
*
.06
.0
5
.05
.0
3
.03
.0
3
.07
*
.07
*
.07
(.0
3)(.0
3)(.0
3)(.0
3)(.0
3)(.0
3)(.0
3)(.0
3)(.0
3)(.0
3)(.0
3)(.0
3)
Soci
al S
kills
.07
*
.05
.0
5
.07
*
.05
.0
5
.11
***
.10
**
.09
**
.07
*
.05
.0
5
(.03)
(.03)
(.03)
(.03)
(.03)
(.03)
(.03)
(.03)
(.03)
(.03)
(.03)
(.03)
Con
trol V
aria
bles
XX
XX
XX
XX
Age
3 a
bilit
y an
d be
havi
orX
XX
X
Obs
erva
tions
961
961
961
962
962
962
939
939
939
930
930
930
R2
.38
.41
.42
.33
.37
.38
.33
.35
.35
.26
.28
.28
Not
e. A
ll va
riabl
es a
re st
anda
rdiz
ed b
y fu
ll sa
mpl
e st
anda
rd d
evia
tion.
Con
trol v
aria
bles
incl
ude:
dat
a co
llect
ion
site
; chi
ld e
thni
city
, gen
der,
mot
her's
ratin
g of
chi
ld's
gene
ral h
ealth
at
age
4 1
/2, s
ite o
f dat
a co
llect
ion,
chi
ld's
birth
ord
er, n
umbe
r of c
hild
ren
livin
g in
the
hom
e at
age
4 1
/2, h
ouse
hold
stru
ctur
e, p
aren
ting,
mot
her's
age
, mot
her's
edu
catio
n, p
artn
er's
educ
atio
n, m
othe
r eve
r wor
ked,
tota
l fam
ily in
com
e at
age
4 1
/2, m
othe
r's o
ccup
atio
nal s
tatu
s, pa
rtner
's oc
cupa
tiona
l sta
tus,
mat
erna
l dep
ress
ive
sym
ptom
s, pu
blic
ass
ista
nce,
eve
r in
non-
mat
erna
l car
e, p
ropo
rtion
of t
ime
in c
ente
r-ba
sed
or h
ome-
base
d ch
ild c
are
from
birt
h to
age
4 1
/2, a
nd a
vera
ge c
hild
car
e qu
ality
. K
ey c
ontro
l var
iabl
es a
t age
3 in
clud
e: th
e B
rack
en S
choo
l Rea
dine
ss c
ompo
site
, the
Rey
nell
Dev
elop
men
tal L
angu
age
Scal
e, m
ater
nal r
epor
ts o
f int
erna
lizin
g an
d ex
tern
aliz
ing
prob
lem
s, an
d to
tal t
ime
child
act
ivel
y pl
ayed
w
ith a
"fo
rbid
den"
toy.
A
ll m
odel
s inc
lude
dum
mie
s for
mis
sing
dat
a.*p
<.05
, **p
<.01
, ***
p<.
001.
Rea
ding
Mat
hR
eadi
ngM
ath
Tabl
e 14
NIC
HD
SEC
CYD
Reg
ress
ion
Coef
ficie
nts a
nd S
tand
ard
Erro
rs fr
om R
egre
ssio
n M
odel
s of T
hird
Gra
de M
ath
and
Read
ing
Achi
evem
ent
Ach
ieve
men
t tes
t sco
re 3
rd g
rade
Teac
her r
ated
ach
ieve
men
t 3rd
gra
de
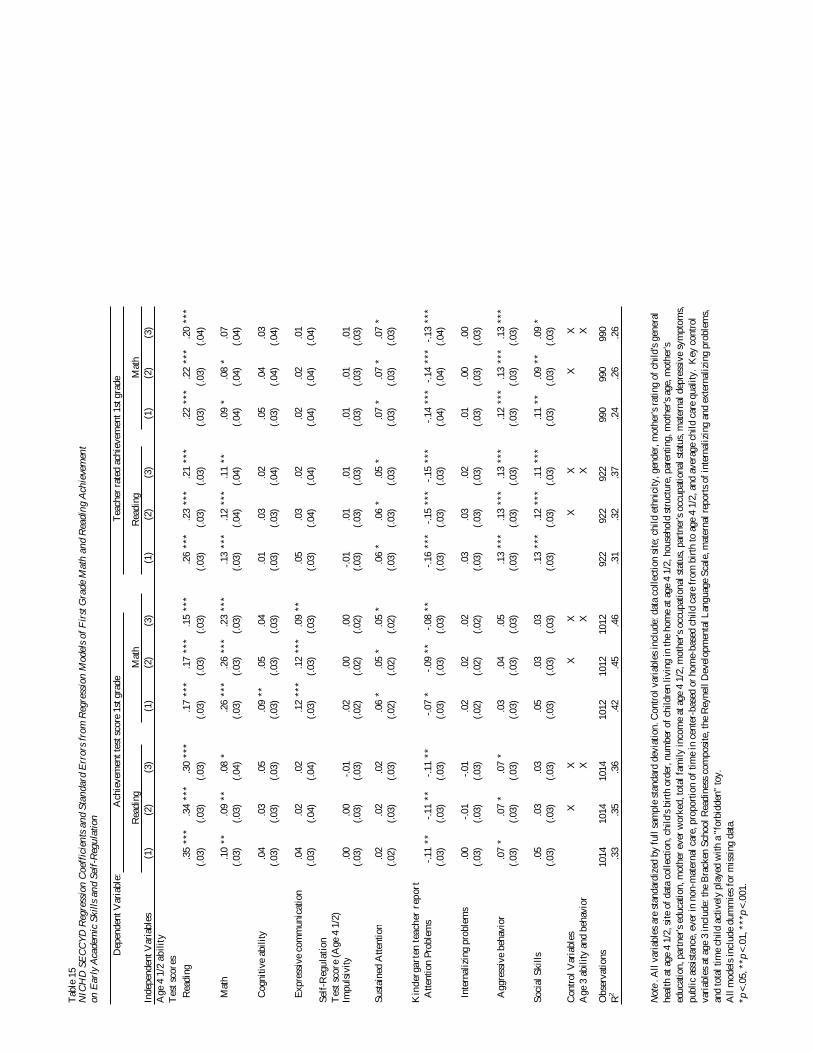
Dep
ende
nt V
aria
ble:
Inde
pend
ent V
aria
bles
(1)
(2)
(3)
(1)
(2)
(3)
(1)
(2)
(3)
(1)
(2)
(3)
Age
4 1
/2 a
bilit
yT
est s
core
s R
eadi
ng.3
5**
*.3
4**
*.3
0**
*.1
7**
*.1
7**
*.1
5**
*.2
6**
*.2
3**
*.2
1**
*.2
2**
*.2
2**
*.2
0**
*(.0
3)(.0
3)(.0
3)(.0
3)(.0
3)(.0
3)(.0
3)(.0
3)(.0
3)(.0
3)(.0
3)(.0
4)
Mat
h.1
0**
.0
9**
.0
8*
.2
6**
*.2
6**
*.2
3**
*.1
3**
*.1
2**
*.1
1**
.0
9*
.0
8*
.0
7
(.03)
(.03)
(.04)
(.03)
(.03)
(.03)
(.03)
(.04)
(.04)
(.04)
(.04)
(.04)
Cog
nitiv
e ab
ility
.04
.0
3
.05
.0
9**
.0
5
.04
.0
1
.03
.0
2
.05
.0
4
.03
(.0
3)(.0
3)(.0
3)(.0
3)(.0
3)(.0
3)(.0
3)(.0
3)(.0
4)(.0
3)(.0
4)(.0
4)
Exp
ress
ive
com
mun
icat
ion
.04
.0
2
.02
.1
2**
*.1
2**
*.0
9**
.0
5
.03
.0
2
.02
.0
2
.01
(.0
3)(.0
4)(.0
4)(.0
3)(.0
3)(.0
3)(.0
3)(.0
4)(.0
4)(.0
4)(.0
4)(.0
4)Se
lf-R
egul
atio
nT
est s
core
(Age
4 1
/2)
Impu
lsiv
it y.0
0
.00
-.0
1
.02
.0
0
.00
-.0
1
.01
.0
1
.01
.0
1
.01
(.0
3)(.0
3)(.0
3)(.0
2)(.0
2)(.0
2)(.0
3)(.0
3)(.0
3)(.0
3)(.0
3)(.0
3)
Sust
aine
d A
ttent
ion
.02
.0
2
.02
.0
6*
.0
5*
.0
5*
.0
6*
.0
6*
.0
5*
.0
7*
.0
7*
.0
7*
(.0
2)(.0
3)(.0
3)(.0
2)(.0
2)(.0
2)(.0
3)(.0
3)(.0
3)(.0
3)(.0
3)(.0
3)
Kin
derg
arte
n te
ache
r re
port
Atte
ntio
n Pr
oble
ms
-.11
**
-.11
**
-.11
**
-.07
*
-.09
**
-.08
**
-.16
***
-.15
***
-.15
***
-.14
***
-.14
***
-.13
***
(.03)
(.03)
(.03)
(.03)
(.03)
(.03)
(.03)
(.03)
(.03)
(.04)
(.04)
(.04)
Int
erna
lizin
g pr
oble
ms
.00
-.0
1
-.01
.0
2
.02
.0
2
.03
.03
.0
2
.01
.0
0
.00
(.0
3)(.0
3)(.0
3)(.0
2)(.0
2)(.0
2)(.0
3)(.0
3)(.0
3)(.0
3)(.0
3)(.0
3)
Agg
ress
ive
beha
vior
.07
*
.07
*
.07
*
.03
.0
4
.05
.1
3**
*.1
3**
*.1
3**
*.1
2**
*.1
3**
*.1
3**
*(.0
3)(.0
3)(.0
3)(.0
3)(.0
3)(.0
3)(.0
3)(.0
3)(.0
3)(.0
3)(.0
3)(.0
3)
Soci
al S
kills
.05
.0
3
.03
.0
5
.03
.0
3
.13
***
.12
***
.11
***
.11
**
.09
**
.09
*
(.03)
(.03)
(.03)
(.03)
(.03)
(.03)
(.03)
(.03)
(.03)
(.03)
(.03)
(.03)
Con
trol V
aria
bles
XX
XX
XX
XX
Age
3 a
bilit
y an
d be
havi
orX
XX
X
Obs
erva
tions
1014
1014
1014
1012
1012
1012
922
922
922
990
990
990
R2
.33
.35
.36
.42
.45
.46
.31
.32
.37
.24
.26
.26
Not
e. A
ll va
riabl
es a
re st
anda
rdiz
ed b
y fu
ll sa
mpl
e st
anda
rd d
evia
tion.
Con
trol v
aria
bles
incl
ude:
dat
a co
llect
ion
site
; chi
ld e
thni
city
, gen
der,
mot
her's
ratin
g of
chi
ld's
gene
ral
heal
th a
t age
4 1
/2, s
ite o
f dat
a co
llect
ion,
chi
ld's
birth
ord
er, n
umbe
r of c
hild
ren
livin
g in
the
hom
e at
age
4 1
/2, h
ouse
hold
stru
ctur
e, p
aren
ting,
mot
her's
age
, mot
her's
ed
ucat
ion,
par
tner
's ed
ucat
ion,
mot
her e
ver w
orke
d, to
tal f
amily
inco
me
at a
ge 4
1/2
, mot
her's
occ
upat
iona
l sta
tus,
partn
er's
occu
patio
nal s
tatu
s, m
ater
nal d
epre
ssiv
e sy
mpt
oms,
publ
ic a
ssis
tanc
e, e
ver i
n no
n-m
ater
nal c
are,
pro
porti
on o
f tim
e in
cen
ter-
base
d or
hom
e-ba
sed
child
car
e fr
om b
irth
to a
ge 4
1/2
, and
ave
rage
chi
ld c
are
qual
ity.
Key
con
trol
varia
bles
at a
ge 3
incl
ude:
the
Bra
cken
Sch
ool R
eadi
ness
com
posi
te, t
he R
eyne
ll D
evel
opm
enta
l Lan
guag
e Sc
ale,
mat
erna
l rep
orts
of i
nter
naliz
ing
and
exte
rnal
izin
g pr
oble
ms,
and
tota
l tim
e ch
ild a
ctiv
ely
play
ed w
ith a
"fo
rbid
den"
toy.
A
ll m
odel
s inc
lude
dum
mie
s for
mis
sing
dat
a.*p
<.05
, **p
<.01
, ***
p<.
001.
Rea
ding
Mat
hR
eadi
ngM
ath
Tabl
e 15
on E
arly
Aca
dem
ic S
kills
and
Sel
f-Reg
ulat
ion
Ach
ieve
men
t tes
t sco
re 1
st g
rade
Teac
her r
ated
ach
ieve
men
t 1st
gra
de
NIC
HD
SEC
CYD
Re g
ress
ion
Coef
ficie
nts a
nd S
tand
ard
Erro
rs fr
om R
egre
ssio
n M
odel
s of F
irst G
rade
Mat
h an
d Re
adin
g Ac
hiev
emen
t
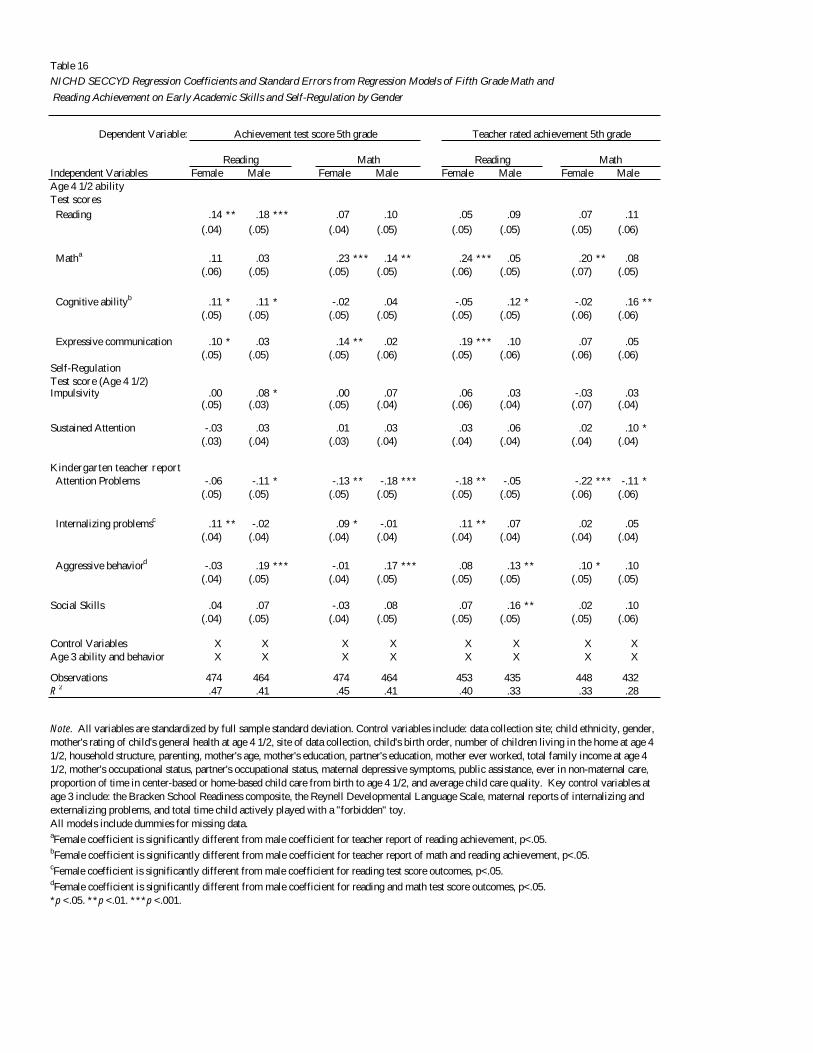
Dependent Variable:
Independent Variables Female Male Female Male Female Male Female MaleAge 4 1/2 abilityTest scores Reading .14 ** .18 *** .07 .10 .05 .09 .07 .11
(.04) (.05) (.04) (.05) (.05) (.05) (.05) (.06)
Matha .11 .03 .23 *** .14 ** .24 *** .05 .20 ** .08 (.06) (.05) (.05) (.05) (.06) (.05) (.07) (.05)
Cognitive abilityb .11 * .11 * -.02 .04 -.05 .12 * -.02 .16 ** (.05) (.05) (.05) (.05) (.05) (.05) (.06) (.06)
Expressive communication .10 * .03 .14 ** .02 .19 *** .10 .07 .05 (.05) (.05) (.05) (.06) (.05) (.06) (.06) (.06)
Self-RegulationTest score (Age 4 1/2)Impulsivity .00 .08 * .00 .07 .06 .03 -.03 .03
(.05) (.03) (.05) (.04) (.06) (.04) (.07) (.04)
Sustained Attention -.03 .03 .01 .03 .03 .06 .02 .10 * (.03) (.04) (.03) (.04) (.04) (.04) (.04) (.04)
Kindergarten teacher report Attention Problems -.06 -.11 * -.13 ** -.18 *** -.18 ** -.05 -.22 *** -.11 *
(.05) (.05) (.05) (.05) (.05) (.05) (.06) (.06)
Internalizing problemsc .11 ** -.02 .09 * -.01 .11 ** .07 .02 .05 (.04) (.04) (.04) (.04) (.04) (.04) (.04) (.04)
Aggressive behaviord -.03 .19 *** -.01 .17 *** .08 .13 ** .10 * .10 (.04) (.05) (.04) (.05) (.05) (.05) (.05) (.05)
Social Skills .04 .07 -.03 .08 .07 .16 ** .02 .10 (.04) (.05) (.04) (.05) (.05) (.05) (.05) (.06)
Control Variables X X X X X X X XAge 3 ability and behavior X X X X X X X X
Observations 474 464 474 464 453 435 448 432R 2 .47 .41 .45 .41 .40 .33 .33 .28
Table 16NICHD SECCYD Regression Coefficients and Standard Errors from Regression Models of Fifth Grade Math and
Achievement test score 5th grade Teacher rated achievement 5th grade
Reading Achievement on Early Academic Skills and Self-Regulation by Gender
Note. All variables are standardized by full sample standard deviation. Control variables include: data collection site; child ethnicity, gender, mother's rating of child's general health at age 4 1/2, site of data collection, child's birth order, number of children living in the home at age 4 1/2, household structure, parenting, mother's age, mother's education, partner's education, mother ever worked, total family income at age 4 1/2, mother's occupational status, partner's occupational status, maternal depressive symptoms, public assistance, ever in non-maternal care, proportion of time in center-based or home-based child care from birth to age 4 1/2, and average child care quality. Key control variables at age 3 include: the Bracken School Readiness composite, the Reynell Developmental Language Scale, maternal reports of internalizing and externalizing problems, and total time child actively played with a "forbidden" toy. All models include dummies for missing data.aFemale coefficient is significantly different from male coefficient for teacher report of reading achievement, p<.05.bFemale coefficient is significantly different from male coefficient for teacher report of math and reading achievement, p<.05.cFemale coefficient is significantly different from male coefficient for reading test score outcomes, p<.05. dFemale coefficient is significantly different from male coefficient for reading and math test score outcomes, p<.05. *p <.05. **p <.01. ***p <.001.
Reading Math Reading Math
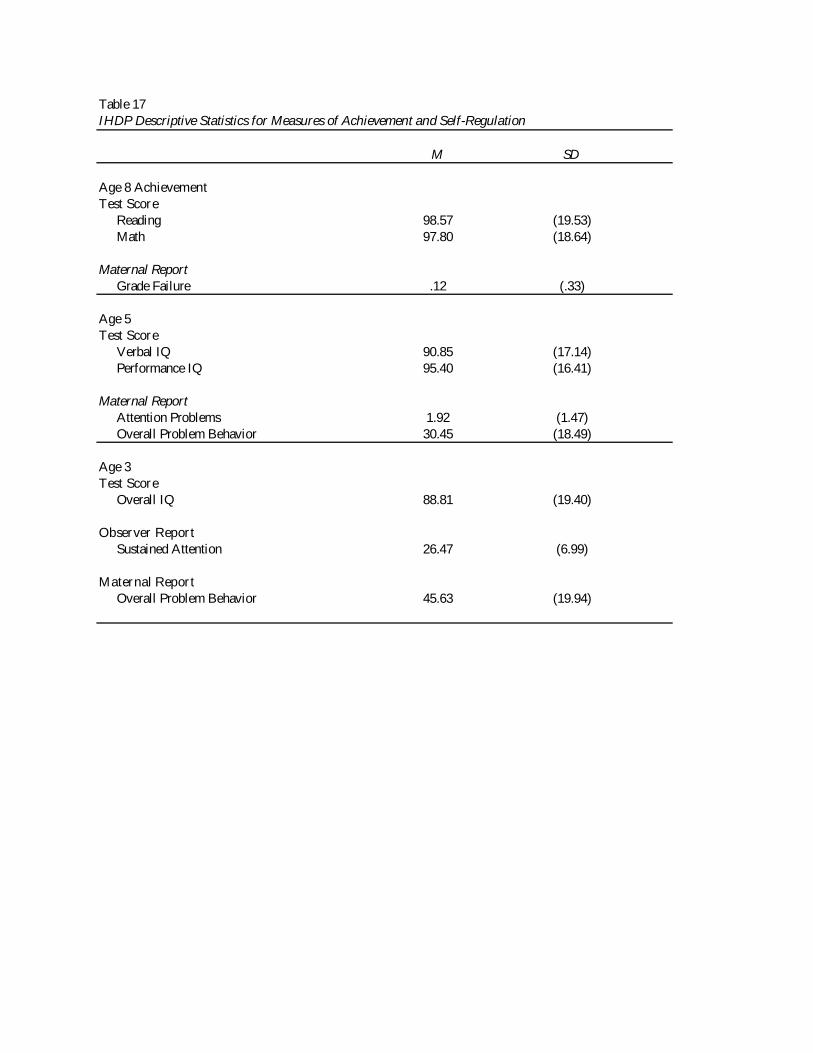
Table 17
M SD
Age 8 AchievementTest Score
Reading 98.57 (19.53)Math 97.80 (18.64)
Maternal ReportGrade Failure .12 (.33)
Age 5Test Score
Verbal IQ 90.85 (17.14)Performance IQ 95.40 (16.41)
Maternal ReportAttention Problems 1.92 (1.47)Overall Problem Behavior 30.45 (18.49)
Age 3
Overall IQ 88.81 (19.40)
Observer ReportSustained Attention 26.47 (6.99)
Maternal ReportOverall Problem Behavior 45.63 (19.94)
IHDP Descriptive Statistics for Measures of Achievement and Self-Regulation
Test Score
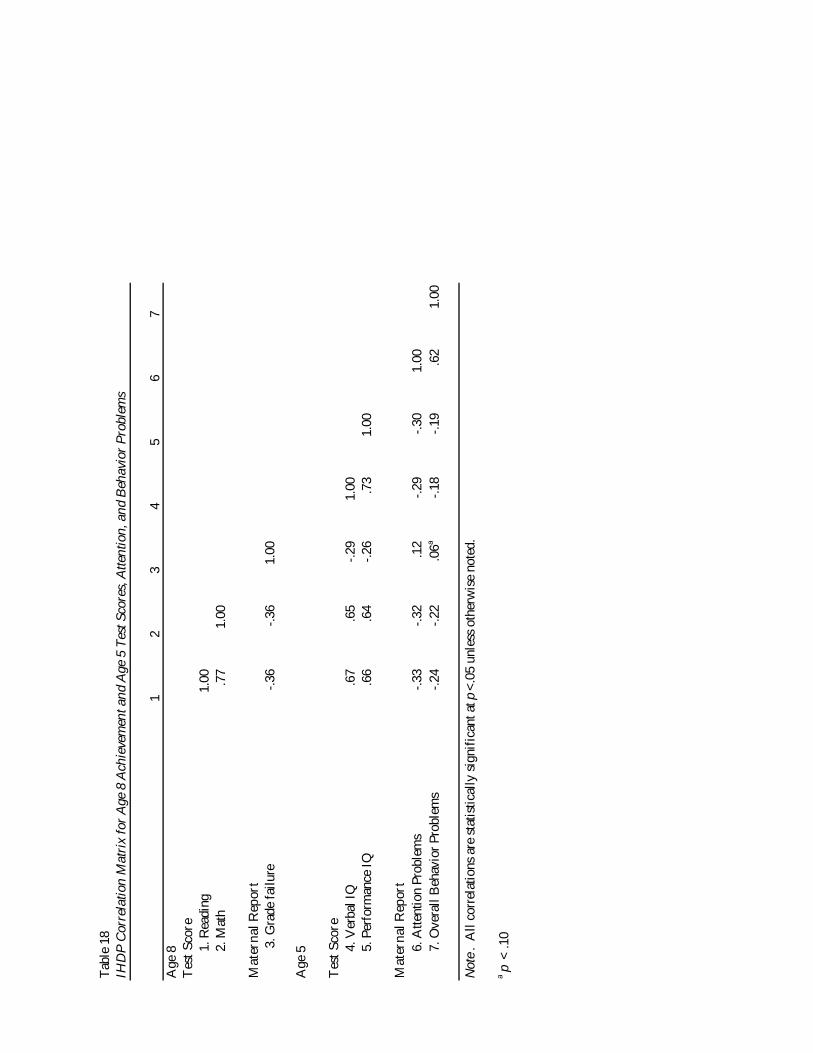
Tabl
e 18
IHD
P Co
rrel
atio
n M
atrix
for A
ge 8
Ach
ieve
men
t and
Age
5 T
est S
core
s, At
tent
ion,
and
Beh
avio
r Pro
blem
s
12
34
56
7A
ge 8 1
. Rea
ding
1.00
2. M
ath
.77
1.00
3. G
rade
failu
re-.3
6-.3
61.
00
Age
5 4. V
erba
l IQ
.67
.65
-.29
1.00
5. P
erfo
rman
ce IQ
.66
.64
-.26
.73
1.00
6. A
ttent
ion
Prob
lem
s-.3
3-.3
2.1
2-.2
9-.3
01.
00 7
. Ove
rall
Beh
avio
r Pro
blem
s-.2
4-.2
2.0
6a-.1
8-.1
9.6
21.
00
Not
e. A
ll co
rrel
atio
ns a
re st
atis
tical
ly si
gnifi
cant
at p
<.05
unl
ess o
ther
wis
e no
ted.
a p <
.10
Tes
t Sco
re
Tes
t Sco
re
Mat
erna
l Rep
ort
Mat
erna
l Rep
ort
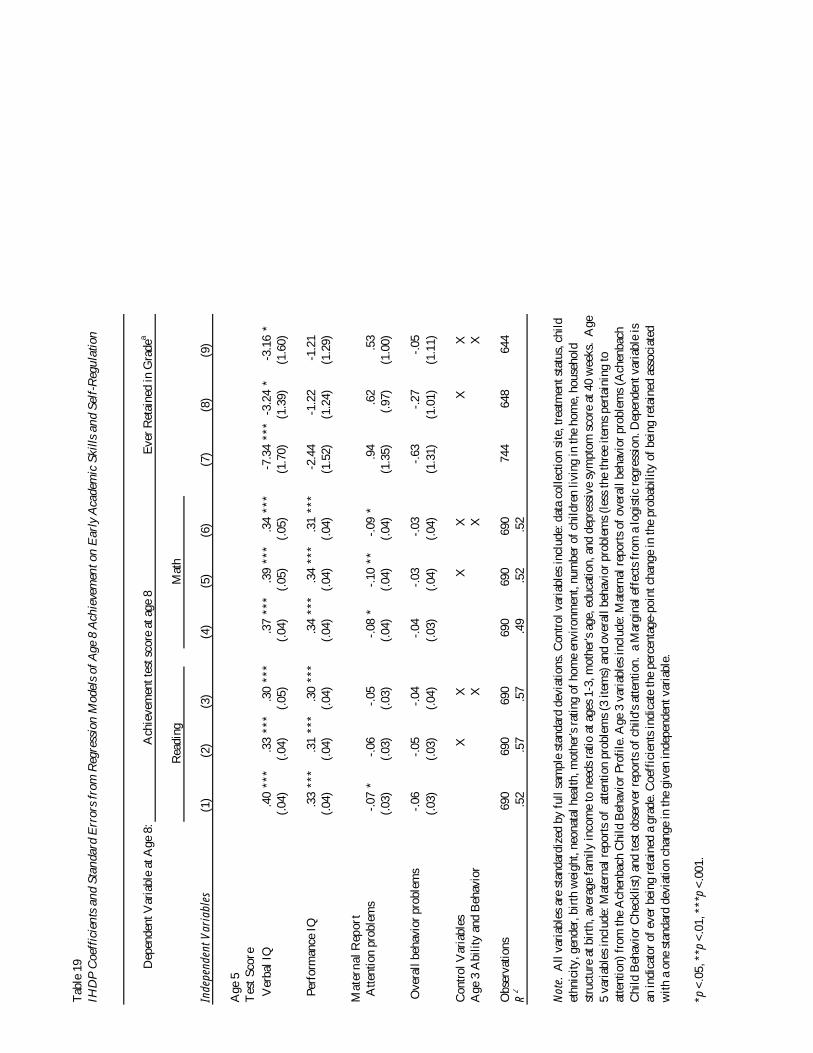
Tabl
e 19 D
epen
dent
Var
iabl
e at
Age
8:
Inde
pend
ent V
aria
bles
(1)
(2)
(3)
(4)
(5)
(6)
(7)
(8)
(9)
Age
5
Tes
t Sco
re
Ver
bal I
Q.4
0**
*.3
3**
*.3
0**
*.3
7**
*.3
9**
*.3
4**
*-7
.34
***
-3.2
4*
-3.1
6*
(.04)
(.04)
(.05)
(.04)
(.05)
(.05)
(1.7
0)(1
.39)
(1.6
0)
Per
form
ance
IQ.3
3**
*.3
1**
*.3
0**
*.3
4**
*.3
4**
*.3
1**
*-2
.44
-1.2
2-1
.21
(.04)
(.04)
(.04)
(.04)
(.04)
(.04)
(1.5
2)(1
.24)
(1.2
9)
Mat
erna
l Rep
ort
Atte
ntio
n pr
oble
ms
-.07
*-.0
6
-.05
-.0
8*
-.10
**-.0
9*
.9
4.6
2.5
3(.0
3)(.0
3)(.0
3)(.0
4)(.0
4)(.0
4)(1
.35)
(.97)
(1.0
0)
Ove
rall
beha
vior
pro
blem
s-.0
6
-.05
-.0
4
-.04
-.0
3
-.03
-.6
3-.2
7-.0
5(.0
3)(.0
3)(.0
4)(.0
3)(.0
4)(.0
4)(1
.31)
(1.0
1)(1
.11)
Con
trol V
aria
bles
XX
XX
XX
Age
3 A
bilit
y an
d B
ehav
ior
XX
X
Obs
erva
tions
690
690
690
690
690
690
744
648
644
R2
.52
.57
.57
.49
.52
.52
*p<.
05, *
*p<.
01, *
**p
<.00
1.
IHD
P Co
effic
ient
s and
Sta
ndar
d Er
rors
from
Reg
ress
ion
Mod
els o
f Age
8 A
chie
vem
ent o
n Ea
rly A
cade
mic
Ski
lls a
nd S
elf-R
egul
atio
n
Ever
Ret
aine
d in
Gra
dea
Mat
h
Ach
ieve
men
t tes
t sco
re a
t age
8
Rea
ding
Not
e. A
ll va
riabl
es a
re st
anda
rdiz
ed b
y fu
ll sa
mpl
e st
anda
rd d
evia
tions
. Con
trol v
aria
bles
incl
ude:
dat
a co
llect
ion
site
, tre
atm
ent s
tatu
s, ch
ild
ethn
icity
, gen
der,
birth
wei
ght,
neon
atal
hea
lth, m
othe
r's ra
ting
of h
ome
envi
ronm
ent,
num
ber o
f chi
ldre
n liv
ing
in th
e ho
me,
hou
seho
ld
stru
ctur
e at
birt
h, a
vera
ge fa
mily
inco
me
to n
eeds
ratio
at a
ges 1
-3, m
othe
r's a
ge, e
duca
tion,
and
dep
ress
ive
sym
ptom
scor
e at
40
wee
ks.
Age
5
varia
bles
incl
ude:
Mat
erna
l rep
orts
of
atte
ntio
n pr
oble
ms (
3 ite
ms)
and
ove
rall
beha
vior
pro
blem
s (le
ss th
e th
ree
item
s per
tain
ing
to
atte
ntio
n) fr
om th
e A
chen
bach
Chi
ld B
ehav
ior P
rofil
e. A
ge 3
var
iabl
es in
clud
e: M
ater
nal r
epor
ts o
f ove
rall
beha
vior
pro
blem
s (A
chen
bach
C
hild
Beh
avio
r Che
cklis
t) an
d te
st o
bser
ver r
epor
ts o
f chi
ld's
atte
ntio
n. a
Mar
gina
l eff
ects
from
a lo
gist
ic re
gres
sion
. Dep
ende
nt v
aria
ble
is
an in
dica
tor o
f eve
r bei
ng re
tain
ed a
gra
de. C
oeff
icie
nts i
ndic
ate
the
perc
enta
ge-p
oint
cha
nge
in th
e pr
obab
ility
of b
eing
reta
ined
ass
ocia
ted
with
a o
ne st
anda
rd d
evia
tion
chan
ge in
the
give
n in
depe
nden
t var
iabl
e.
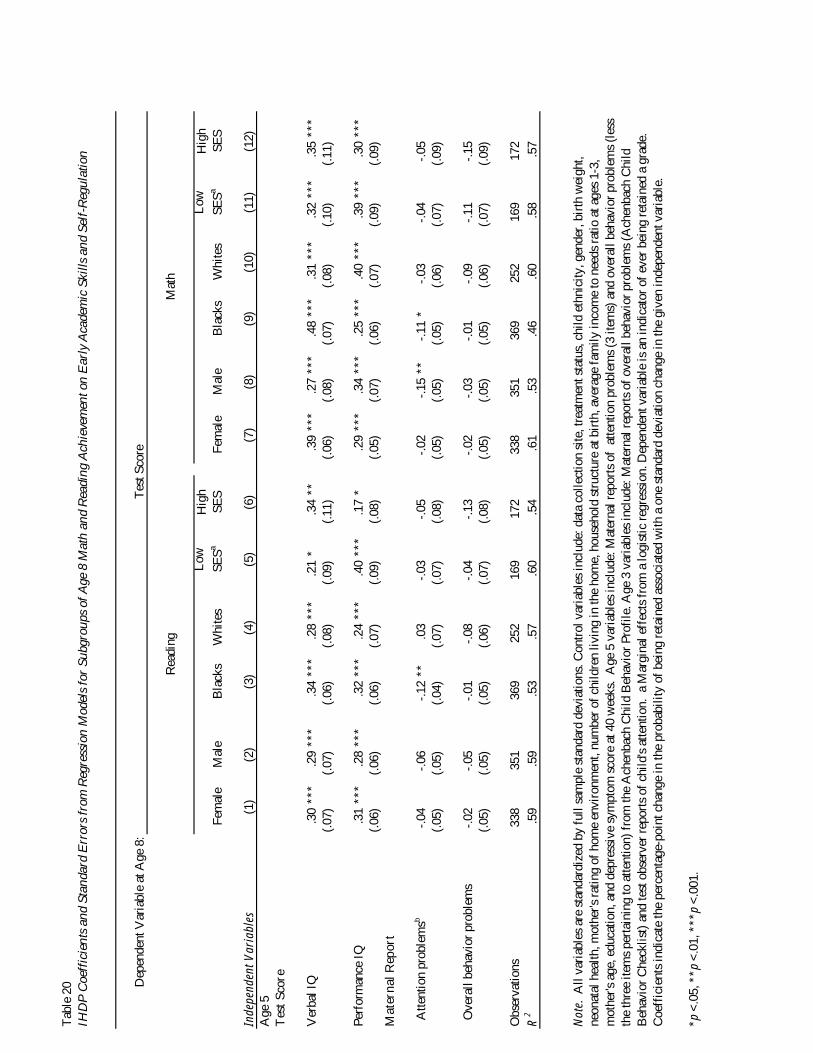
Tabl
e 20 D
epen
dent
Var
iabl
e at
Age
8:
Inde
pend
ent V
aria
bles
Age
5
Tes
t Sco
re
Ver
bal I
Q.3
0**
*.2
9**
*.3
4**
*.2
8**
*.2
1*
.34
**.3
9**
*.2
7**
*.4
8**
*.3
1**
*.3
2**
*.3
5**
*(.0
7)(.0
7)(.0
6)(.0
8)(.0
9)(.1
1)(.0
6)(.0
8)(.0
7)(.0
8)(.1
0)(.1
1)
Perf
orm
ance
IQ.3
1**
*.2
8**
*.3
2**
*.2
4**
*.4
0**
*.1
7*
.29
***
.34
***
.25
***
.40
***
.39
***
.30
***
(.06)
(.06)
(.06)
(.07)
(.09)
(.08)
(.05)
(.07)
(.06)
(.07)
(.09)
(.09)
Mat
erna
l Rep
ort
Atte
ntio
n pr
oble
msb
-.04
-.0
6
-.12
**.0
3
-.03
-.0
5
-.02
-.1
5**
-.11
*-.0
3
-.04
-.0
5
(.05)
(.05)
(.04)
(.07)
(.07)
(.08)
(.05)
(.05)
(.0
5)(.0
6)(.0
7)(.0
9)
Ove
rall
beha
vior
pro
blem
s-.0
2-.0
5-.0
1
-.08
-.0
4
-.13
-.0
2-.0
3-.0
1
-.09
-.11
-.1
5
(.05)
(.05)
(.05)
(.06)
(.07)
(.0
8)(.0
5)(.0
5)(.0
5)(.0
6)(.0
7)(.0
9)
Obs
erva
tions
338
351
369
25
216
9
172
338
351
369
252
169
17
2R
2.5
9.5
9.5
3.5
7.6
0.5
4.6
1.5
3.4
6.6
0.5
8.5
7
Mal
eM
ale
Fem
ale
(8)
(7)
(2)
(6)
(3)
(4)
(5)
IHD
P Co
effic
ient
s and
Sta
ndar
d Er
rors
from
Reg
ress
ion
Mod
els f
or S
ubgr
oups
of A
ge 8
Mat
h an
d Re
adin
g Ac
hiev
emen
t on
Early
Aca
dem
ic S
kills
and
Sel
f-Reg
ulat
ion
Bla
cks
Whi
tes
Low
SESa
Hig
hSE
SB
lack
sW
hite
sLo
wSE
SaH
igh
SES
Fem
ale
*p<.
05, *
*p<.
01, *
**p
<.00
1.
Not
e. A
ll va
riabl
es a
re st
anda
rdiz
ed b
y fu
ll sa
mpl
e st
anda
rd d
evia
tions
. Con
trol v
aria
bles
incl
ude:
dat
a co
llect
ion
site
, tre
atm
ent s
tatu
s, ch
ild e
thni
city
, gen
der,
birth
wei
ght,
neon
atal
hea
lth, m
othe
r's ra
ting
of h
ome
envi
ronm
ent,
num
ber o
f chi
ldre
n liv
ing
in th
e ho
me,
hou
seho
ld st
ruct
ure
at b
irth,
ave
rage
fam
ily in
com
e to
nee
ds ra
tio a
t age
s 1-3
, m
othe
r's a
ge, e
duca
tion,
and
dep
ress
ive
sym
ptom
scor
e at
40
wee
ks.
Age
5 v
aria
bles
incl
ude:
Mat
erna
l rep
orts
of
atte
ntio
n pr
oble
ms (
3 ite
ms)
and
ove
rall
beha
vior
pro
blem
s (le
ss
the
thre
e ite
ms p
erta
inin
g to
atte
ntio
n) fr
om th
e A
chen
bach
Chi
ld B
ehav
ior P
rofil
e. A
ge 3
var
iabl
es in
clud
e: M
ater
nal r
epor
ts o
f ove
rall
beha
vior
pro
blem
s (A
chen
bach
Chi
ld
Beh
avio
r Che
cklis
t) an
d te
st o
bser
ver r
epor
ts o
f chi
ld's
atte
ntio
n. a
Mar
gina
l eff
ects
from
a lo
gist
ic re
gres
sion
. Dep
ende
nt v
aria
ble
is a
n in
dica
tor o
f eve
r bei
ng re
tain
ed a
gra
de.
Coe
ffic
ient
s ind
icat
e th
e pe
rcen
tage
-poi
nt c
hang
e in
the
prob
abili
ty o
f bei
ng re
tain
ed a
ssoc
iate
d w
ith a
one
stan
dard
dev
iatio
n ch
ange
in th
e gi
ven
inde
pend
ent v
aria
ble.
(1)
Test
Sco
re
Rea
ding
Mat
h
(11)
(12)
(9)
(10)
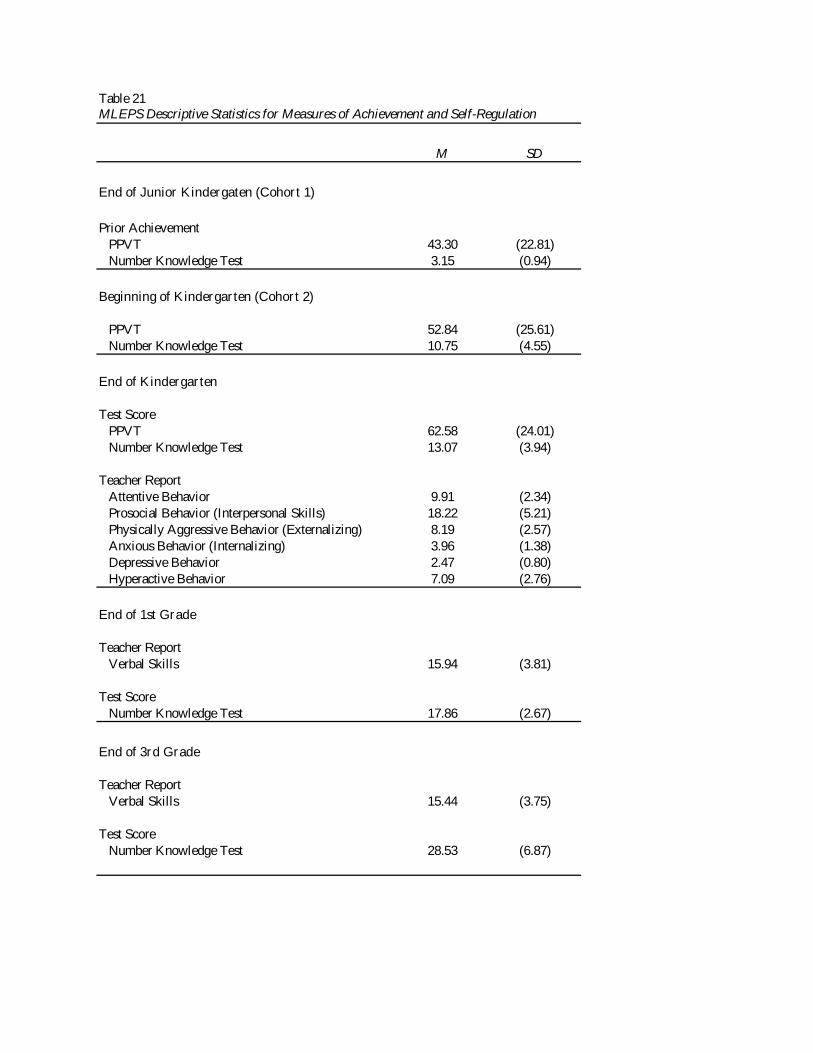
Table 21MLEPS Descriptive Statistics for Measures of Achievement and Self-Regulation
M SD
Prior Achievement PPVT 43.30 (22.81) Number Knowledge Test 3.15 (0.94)
PPVT 52.84 (25.61) Number Knowledge Test 10.75 (4.55)
Test Score PPVT 62.58 (24.01) Number Knowledge Test 13.07 (3.94)
Teacher Report Attentive Behavior 9.91 (2.34) Prosocial Behavior (Interpersonal Skills) 18.22 (5.21) Physically Aggressive Behavior (Externalizing) 8.19 (2.57) Anxious Behavior (Internalizing) 3.96 (1.38) Depressive Behavior 2.47 (0.80) Hyperactive Behavior 7.09 (2.76)
Teacher Report Verbal Skills 15.94 (3.81)
Test Score Number Knowledge Test 17.86 (2.67)
Teacher Report Verbal Skills 15.44 (3.75)
Test Score Number Knowledge Test 28.53 (6.87)
End of 3rd Grade
End of Junior Kindergaten (Cohort 1)
Beginning of Kindergarten (Cohort 2)
End of Kindergarten
End of 1st Grade
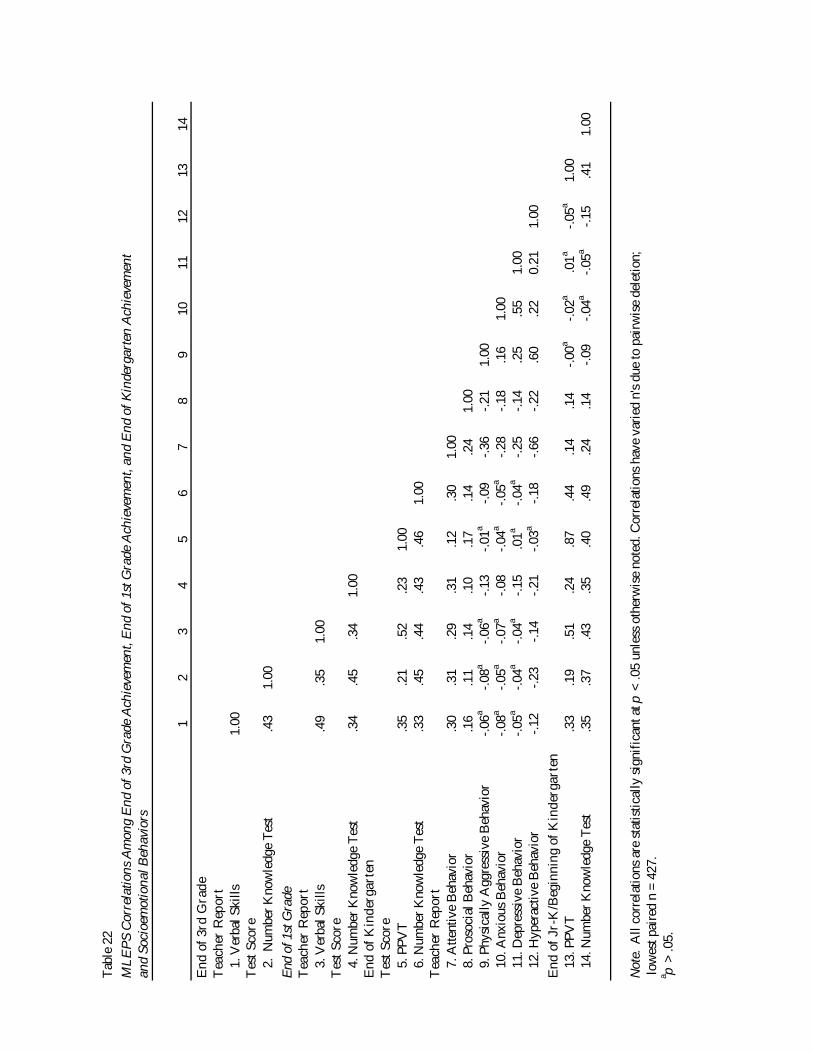
Tabl
e 22
12
34
56
78
910
1112
1314
End
of 3
rd G
rade
Tea
cher
Rep
ort
1.
Ver
bal S
kills
1.00
Tes
t Sco
re
2. N
umbe
r Kno
wle
dge
Test
.43
1.00
End
of 1
st G
rade
Tea
cher
Rep
ort
3.
Ver
bal S
kills
.49
.35
1.00
Tes
t Sco
re
4. N
umbe
r Kno
wle
dge
Test
.34
.45
.34
1.00
End
of K
inde
rgar
ten
Tes
t Sco
re
5. P
PVT
.35
.21
.52
.23
1.00
6.
Num
ber K
now
ledg
e Te
st.3
3.4
5.4
4.4
3.4
61.
00T
each
er R
epor
t
7. A
ttent
ive
Beh
avio
r.3
0.3
1.2
9.3
1.1
2.3
01.
00
8. P
roso
cial
Beh
avio
r .1
6.1
1.1
4.1
0.1
7.1
4.2
41.
00
9. P
hysi
cally
Agg
ress
ive
Beh
avio
r-.0
6a-.0
8a-.0
6a-.1
3-.0
1a-.0
9-.3
6-.2
11.
00
10. A
nxio
us B
ehav
ior
-.08a
-.05a
-.07a
-.08
-.04a
-.05a
-.28
-.18
.16
1.00
11
. Dep
ress
ive
Beh
avio
r-.0
5a-.0
4a-.0
4a-.1
5.0
1a-.0
4a-.2
5-.1
4.2
5.5
51.
00
12. H
yper
activ
e B
ehav
ior
-.12
-.23
-.14
-.21
-.03a
-.18
-.66
-.22
.60
.22
0.21
1.00
End
of J
r-K
/Beg
inni
ng o
f Kin
derg
arte
n
13. P
PVT
.33
.19
.51
.24
.87
.44
.14
.14
-.00a
-.02a
.01a
-.05a
1.00
14
. Num
ber K
now
ledg
e Te
st.3
5.3
7.4
3.3
5.4
0.4
9.2
4.1
4-.0
9-.0
4a-.0
5a-.1
5.4
11.
00
Not
e. A
ll co
rrel
atio
ns a
re st
atis
tical
ly si
gnifi
cant
at p
< .0
5 un
less
oth
erw
ise
note
d. C
orre
latio
ns h
ave
varie
d n'
s due
to p
airw
ise
dele
tion;
low
est p
aire
d n
= 42
7.a p
> .0
5.
MLE
PS C
orre
latio
ns A
mon
g En
d of
3rd
Gra
de A
chie
vem
ent,
End
of 1
st G
rade
Ach
ieve
men
t, an
d En
d of
Kin
derg
arte
n Ac
hiev
emen
t an
d So
cioe
mot
iona
l Beh
avio
rs
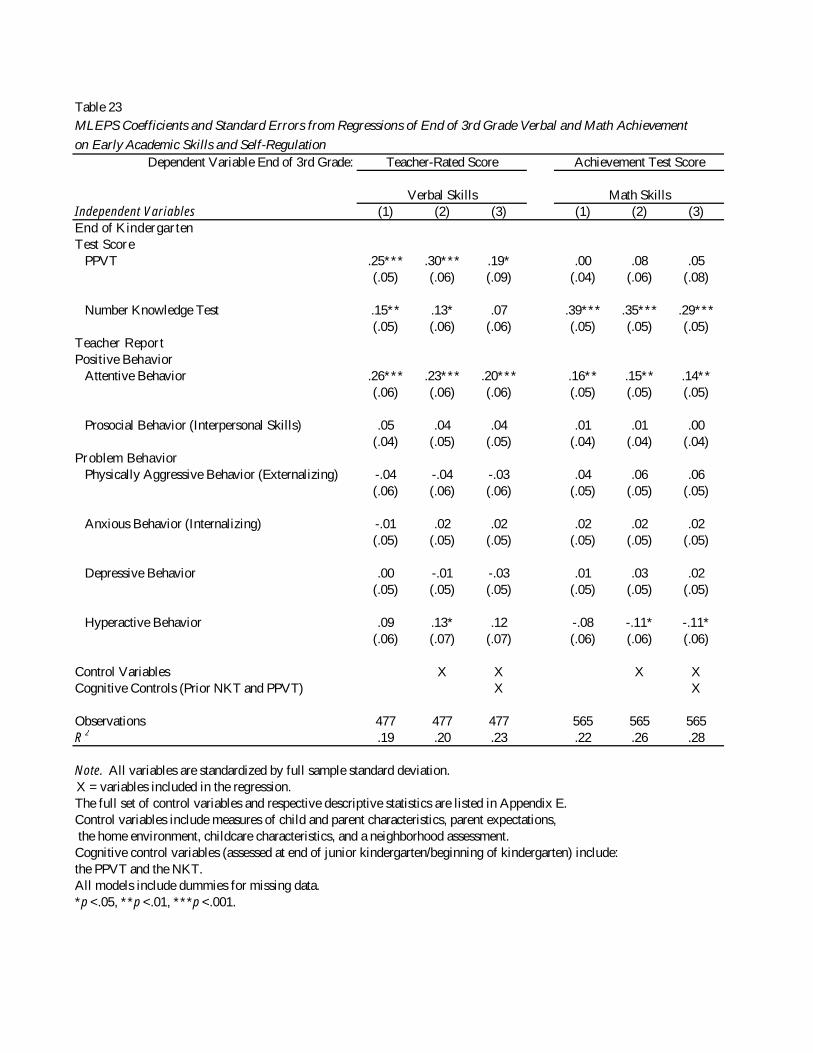
Table 23
Dependent Variable End of 3rd Grade:
Independent Variables (1) (2) (3) (1) (2) (3)End of KindergartenTest Score PPVT .25*** .30*** .19* .00 .08 .05
(.05) (.06) (.09) (.04) (.06) (.08)
Number Knowledge Test .15** .13* .07 .39*** .35*** .29***(.05) (.06) (.06) (.05) (.05) (.05)
Teacher ReportPositive Behavior Attentive Behavior .26*** .23*** .20*** .16** .15** .14**
(.06) (.06) (.06) (.05) (.05) (.05)
Prosocial Behavior (Interpersonal Skills) .05 .04 .04 .01 .01 .00(.04) (.05) (.05) (.04) (.04) (.04)
Problem Behavior Physically Aggressive Behavior (Externalizing) -.04 -.04 -.03 .04 .06 .06
(.06) (.06) (.06) (.05) (.05) (.05)
Anxious Behavior (Internalizing) -.01 .02 .02 .02 .02 .02(.05) (.05) (.05) (.05) (.05) (.05)
Depressive Behavior .00 -.01 -.03 .01 .03 .02(.05) (.05) (.05) (.05) (.05) (.05)
Hyperactive Behavior .09 .13* .12 -.08 -.11* -.11*(.06) (.07) (.07) (.06) (.06) (.06)
Control Variables X X X XCognitive Controls (Prior NKT and PPVT) X X
Observations 477 477 477 565 565 565R 2 .19 .20 .23 .22 .26 .28
the PPVT and the NKT.
MLEPS Coefficients and Standard Errors from Regressions of End of 3rd Grade Verbal and Math Achievement
Teacher-Rated Score
Verbal Skills
Achievement Test Score
Math Skills
on Early Academic Skills and Self-Regulation
Note. All variables are standardized by full sample standard deviation. X = variables included in the regression.
All models include dummies for missing data.*p <.05, **p <.01, ***p <.001.
The full set of control variables and respective descriptive statistics are listed in Appendix E.Control variables include measures of child and parent characteristics, parent expectations, the home environment, childcare characteristics, and a neighborhood assessment.Cognitive control variables (assessed at end of junior kindergarten/beginning of kindergarten) include:
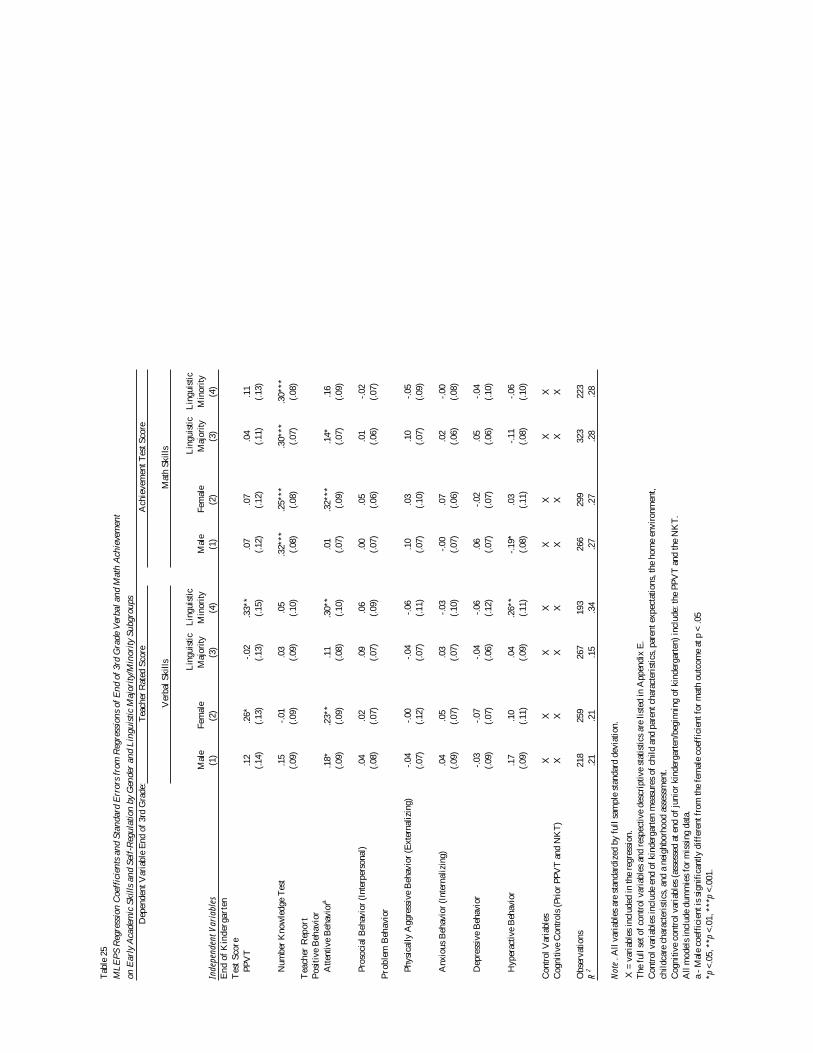
Tabl
e 25
on E
arly
Aca
dem
ic S
kills
and
Sel
f-Reg
ulat
ion
by G
ende
r and
Lin
guist
ic M
ajor
ity/M
inor
ity S
ubgr
oups
Dep
ende
nt V
aria
ble
End
of 3
rd G
rade
:
Mal
eFe
mal
eLi
ngui
stic
M
ajor
ityLi
ngui
stic
M
inor
ityM
ale
Fem
ale
Ling
uist
ic
Maj
ority
Ling
uist
ic
Min
ority
Inde
pend
ent V
aria
bles
(1)
(2)
(3)
(4)
(1)
(2)
(3)
(4)
End
of K
inde
rgar
ten
Tes
t Sco
re
PPV
T.1
2.2
6*-.0
2.3
3**
.07
.07
.04
.11
(.14)
(.13)
(.13)
(.15)
(.12)
(.12)
(.11)
(.13)
N
umbe
r Kno
wle
dge
Test
.15
-.01
.03
.05
.32*
**.2
5***
.30*
**.3
0***
(.09)
(.09)
(.09)
(.10)
(.08)
(.08)
(.07)
(.08)
Tea
cher
Rep
ort
Posi
tive
Beh
avio
r
Atte
ntiv
e B
ehav
iora
.18*
.23*
*.1
1.3
0**
.01
.32*
**.1
4*.1
6(.0
9)(.0
9)(.0
8)(.1
0)(.0
7)(.0
9)(.0
7)(.0
9)
Pr
osoc
ial B
ehav
ior (
Inte
rper
sona
l).0
4.0
2.0
9.0
6.0
0.0
5.0
1-.0
2(.0
8)(.0
7)(.0
7)(.0
9)(.0
7)(.0
6)(.0
6)(.0
7)Pr
oble
m B
ehav
ior
Ph
ysic
ally
Agg
ress
ive
Beh
avio
r (Ex
tern
aliz
ing)
-.0
4-.0
0-.0
4-.0
6.1
0.0
3.1
0-.0
5(.0
7)(.1
2)(.0
7)(.1
1)(.0
7)(.1
0)(.0
7)(.0
9)
A
nxio
us B
ehav
ior (
Inte
rnal
izin
g).0
4.0
5.0
3-.0
3-.0
0.0
7.0
2-.0
0(.0
9)(.0
7)(.0
7)(.1
0)(.0
7)(.0
6)(.0
6)(.0
8)
D
epre
ssiv
e B
ehav
ior
-.03
-.07
-.04
-.06
.06
-.02
.05
-.04
(.09)
(.07)
(.06)
(.12)
(.07)
(.07)
(.06)
(.10)
H
yper
activ
e B
ehav
ior
.17
.10
.04
.26*
*-.1
9*.0
3-.1
1-.0
6(.0
9)(.1
1)(.0
9)(.1
1)(.0
8)(.1
1)(.0
8)(.1
0)
Con
trol V
aria
bles
XX
XX
XX
XX
Cog
nitiv
e C
ontro
ls (P
rior P
PVT
and
NK
T)X
XX
XX
XX
X
Obs
erva
tions
218
259
267
193
266
299
323
223
R2
.21
.21
.15
.34
.27
.27
.28
.28
X =
var
iabl
es in
clud
ed in
the
regr
essi
on.
The
full
set o
f con
trol v
aria
bles
and
resp
ectiv
e de
scrip
tive
stat
istic
s are
list
ed in
App
endi
x E.
Con
trol v
aria
bles
incl
ude
end
of k
inde
rgar
ten
mea
sure
s of c
hild
and
par
ent c
hara
cter
istic
s, pa
rent
exp
ecta
tions
, the
hom
e en
viro
nmen
t,ch
ildca
re c
hara
cter
istic
s, an
d a
neig
hbor
hood
ass
essm
ent.
Cog
nitiv
e co
ntro
l var
iabl
es (a
sses
sed
at e
nd o
f jun
ior k
inde
rgar
ten/
begi
nnin
g of
kin
derg
arte
n) in
clud
e: th
e PP
VT
and
the
NK
T.A
ll m
odel
s inc
lude
dum
mie
s for
mis
sing
dat
a.a
- Mal
e co
effic
ient
is si
gnifi
cant
ly d
iffer
ent f
rom
the
fem
ale
coef
ficie
nt fo
r mat
h ou
tcom
e at
p <
.05
*p<.
05, *
*p<.
01, *
**p
<.00
1.
Not
e. A
ll va
riabl
es a
re st
anda
rdiz
ed b
y fu
ll sa
mpl
e st
anda
rd d
evia
tion.
MLE
PS R
egre
ssio
n Co
effic
ient
s and
Sta
ndar
d Er
rors
from
Reg
ress
ions
of E
nd o
f 3rd
Gra
de V
erba
l and
Mat
h Ac
hiev
emen
t
Teac
her R
ated
Sco
re
Ver
bal S
kills
Ach
ieve
men
t Tes
t Sco
re
Mat
h Sk
ills
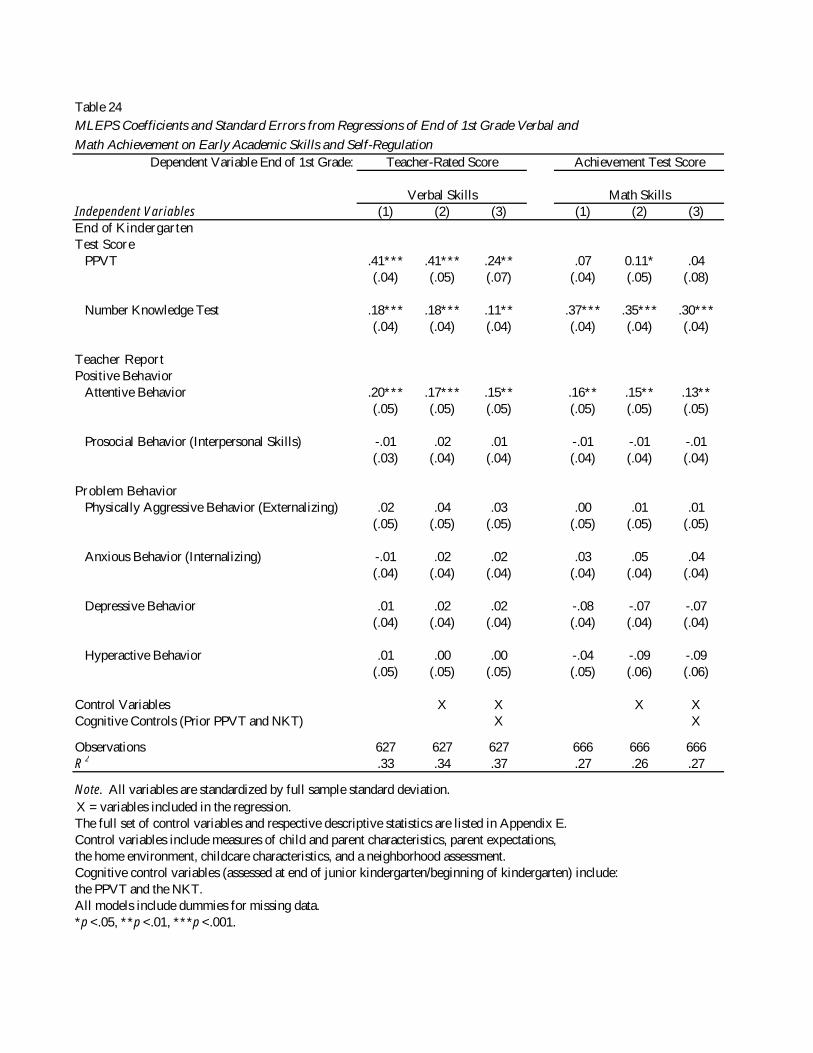
Table 24
Math Achievement on Early Academic Skills and Self-RegulationDependent Variable End of 1st Grade:
Independent Variables (1) (2) (3) (1) (2) (3)End of KindergartenTest Score PPVT .41*** .41*** .24** .07 0.11* .04
(.04) (.05) (.07) (.04) (.05) (.08)
Number Knowledge Test .18*** .18*** .11** .37*** .35*** .30***(.04) (.04) (.04) (.04) (.04) (.04)
Teacher ReportPositive Behavior Attentive Behavior .20*** .17*** .15** .16** .15** .13**
(.05) (.05) (.05) (.05) (.05) (.05)
Prosocial Behavior (Interpersonal Skills) -.01 .02 .01 -.01 -.01 -.01(.03) (.04) (.04) (.04) (.04) (.04)
Problem Behavior Physically Aggressive Behavior (Externalizing) .02 .04 .03 .00 .01 .01
(.05) (.05) (.05) (.05) (.05) (.05)
Anxious Behavior (Internalizing) -.01 .02 .02 .03 .05 .04(.04) (.04) (.04) (.04) (.04) (.04)
Depressive Behavior .01 .02 .02 -.08 -.07 -.07(.04) (.04) (.04) (.04) (.04) (.04)
Hyperactive Behavior .01 .00 .00 -.04 -.09 -.09(.05) (.05) (.05) (.05) (.06) (.06)
Control Variables X X X XCognitive Controls (Prior PPVT and NKT) X X
Observations 627 627 627 666 666 666R 2 .33 .34 .37 .27 .26 .27
X = variables included in the regression.The full set of control variables and respective descriptive statistics are listed in Appendix E.Control variables include measures of child and parent characteristics, parent expectations,the home environment, childcare characteristics, and a neighborhood assessment.Cognitive control variables (assessed at end of junior kindergarten/beginning of kindergarten) include:the PPVT and the NKT.All models include dummies for missing data.*p <.05, **p <.01, ***p <.001.
Note. All variables are standardized by full sample standard deviation.
MLEPS Coefficients and Standard Errors from Regressions of End of 1st Grade Verbal and
Math Skills
Teacher-Rated Score Achievement Test Score
Verbal Skills
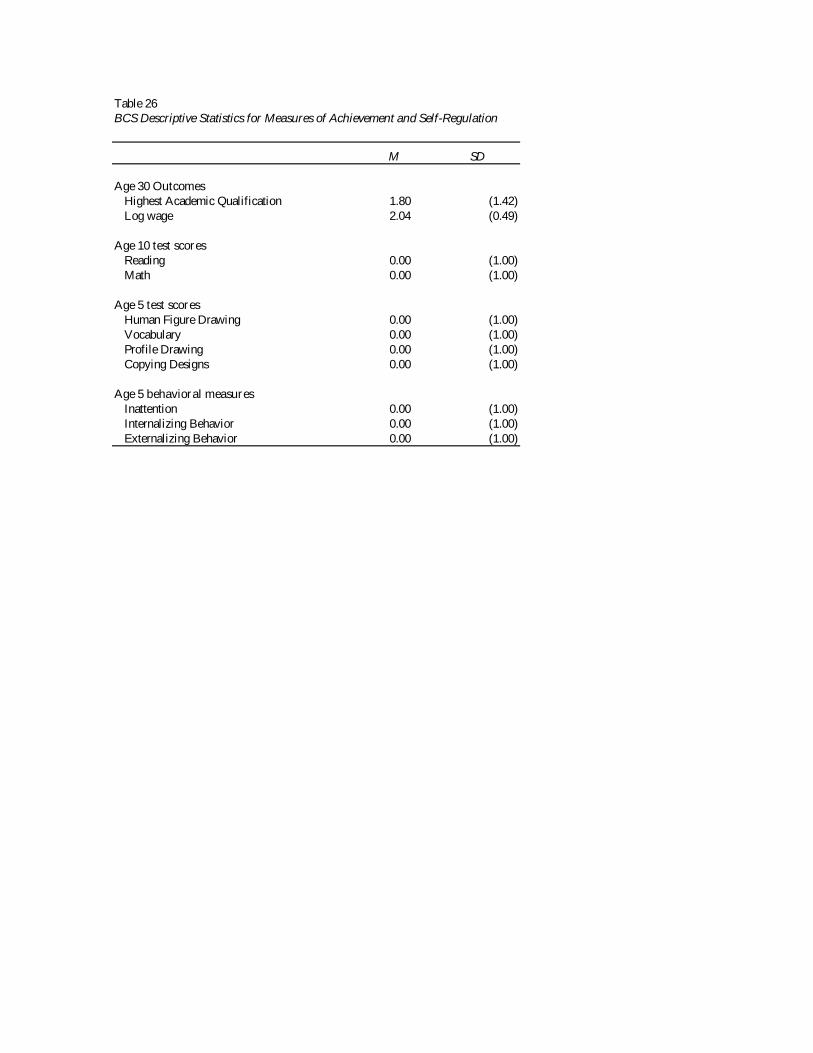
Table 26BCS Descriptive Statistics for Measures of Achievement and Self-Regulation
M SD
Age 30 OutcomesHighest Academic Qualification 1.80 (1.42)Log wage 2.04 (0.49)
Age 10 test scoresReading 0.00 (1.00)Math 0.00 (1.00)
Age 5 test scoresHuman Figure Drawing 0.00 (1.00)Vocabulary 0.00 (1.00)Profile Drawing 0.00 (1.00)Copying Designs 0.00 (1.00)
Age 5 behavioral measuresInattention 0.00 (1.00)Internalizing Behavior 0.00 (1.00)Externalizing Behavior 0.00 (1.00)
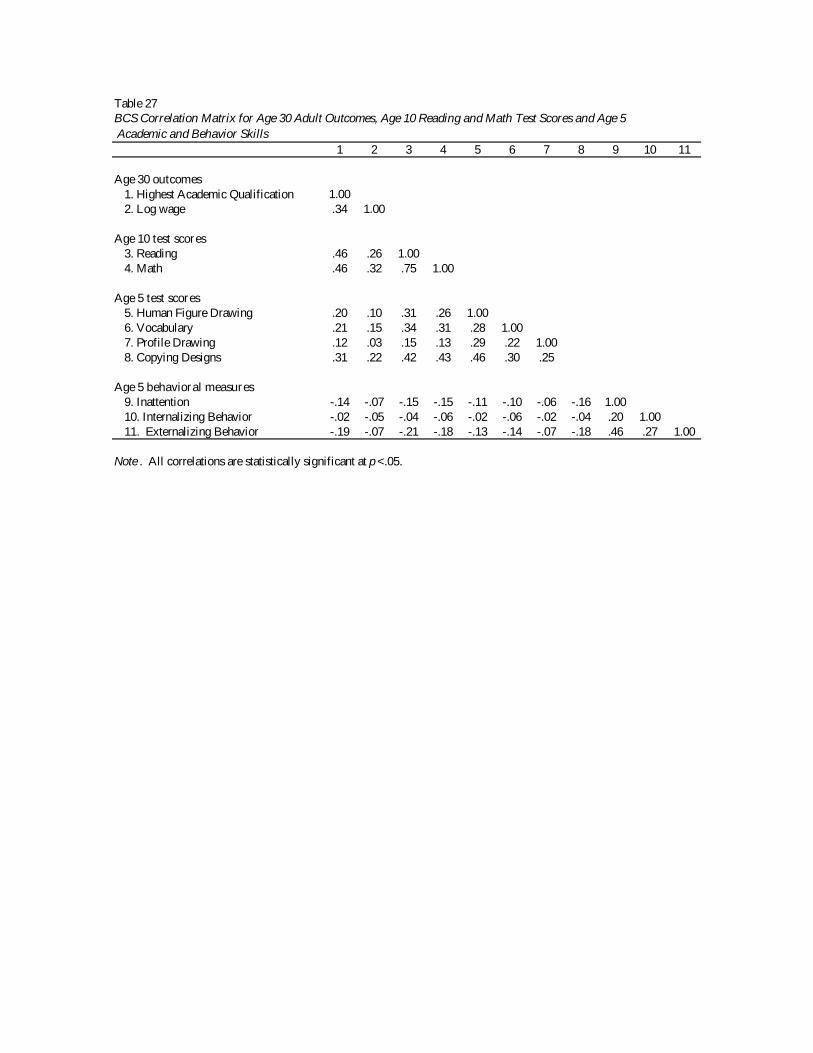
Table 27
Academic and Behavior Skills1 2 3 4 5 6 7 8 9 10 11
Age 30 outcomes1. Highest Academic Qualification 1.002. Log wage .34 1.00
Age 10 test scores3. Reading .46 .26 1.004. Math .46 .32 .75 1.00
Age 5 test scores5. Human Figure Drawing .20 .10 .31 .26 1.006. Vocabulary .21 .15 .34 .31 .28 1.007. Profile Drawing .12 .03 .15 .13 .29 .22 1.008. Copying Designs .31 .22 .42 .43 .46 .30 .25
Age 5 behavioral measures9. Inattention -.14 -.07 -.15 -.15 -.11 -.10 -.06 -.16 1.0010. Internalizing Behavior -.02 -.05 -.04 -.06 -.02 -.06 -.02 -.04 .20 1.0011. Externalizing Behavior -.19 -.07 -.21 -.18 -.13 -.14 -.07 -.18 .46 .27 1.00
Note . All correlations are statistically significant at p <.05.
BCS Correlation Matrix for Age 30 Adult Outcomes, Age 10 Reading and Math Test Scores and Age 5
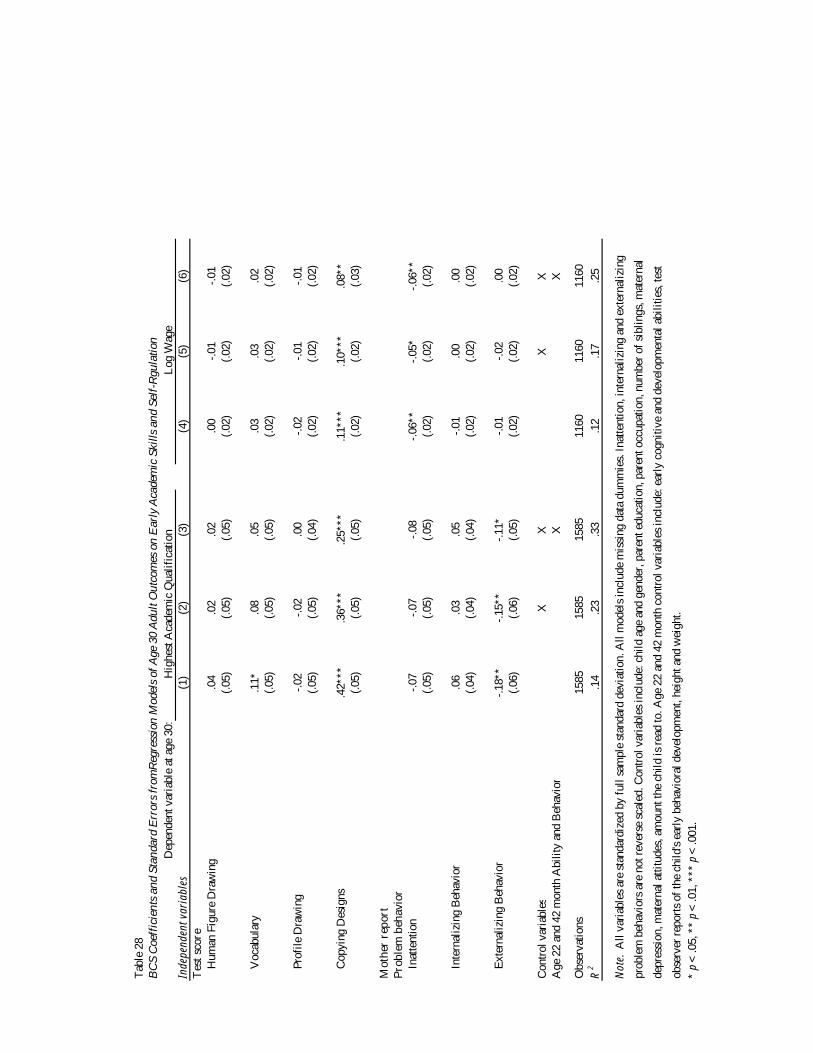
Tabl
e 28
Dep
ende
nt v
aria
ble
at a
ge 3
0:In
depe
nden
t var
iabl
es(1
)(2
)(3
)(4
)(5
)(6
)T
est s
core
Hum
an F
igur
e D
raw
ing
.04
.02
.02
.00
-.01
-.01
(.05)
(.05)
(.05)
(.02)
(.02)
(.02)
Voc
abul
ary
.11*
.08
.05
.03
.03
.02
(.05)
(.05)
(.05)
(.02)
(.02)
(.02)
Prof
ile D
raw
ing
-.02
-.02
.00
-.02
-.01
-.01
(.05)
(.05)
(.04)
(.02)
(.02)
(.02)
Cop
ying
Des
igns
.42*
**.3
6***
.25*
**.1
1***
.10*
**.0
8**
(.05)
(.05)
(.05)
(.02)
(.02)
(.03)
Mot
her
repo
rtPr
oble
m b
ehav
ior
Inat
tent
ion
-.07
-.07
-.08
-.06*
*-.0
5*-.0
6**
(.05)
(.05)
(.05)
(.02)
(.02)
(.02)
Inte
rnal
izin
g B
ehav
ior
.06
.03
.05
-.01
.00
.00
(.04)
(.04)
(.04)
(.02)
(.02)
(.02)
Exte
rnal
izin
g B
ehav
ior
-.18*
*-.1
5**
-.11*
-.01
-.02
.00
(.06)
(.06)
(.05)
(.02)
(.02)
(.02)
Con
trol v
aria
ble s
XX
XX
Age
22
and
42 m
onth
Abi
lity
and
Beh
avio
rX
X
Obs
erva
tions
1585
1585
1585
1160
1160
1160
R2
.14
.23
.33
.12
.17
.25
* p
< .0
5, *
* p
< .0
1, *
** p
< .0
01.
Not
e. A
ll va
riabl
es a
re st
anda
rdiz
ed b
y fu
ll sa
mpl
e st
anda
rd d
evia
tion.
All
mod
els i
nclu
de m
issi
ng d
ata
dum
mie
s. In
atte
ntio
n, in
tern
aliz
ing
and
exte
rnal
izin
g
prob
lem
beh
avio
rs a
re n
ot re
vers
e sc
aled
. Con
trol v
aria
bles
incl
ude:
chi
ld a
ge a
nd g
ende
r, pa
rent
edu
catio
n, p
aren
t occ
upat
ion,
num
ber o
f sib
lings
, mat
erna
l
depr
essi
on, m
ater
nal a
ttitu
des,
amou
nt th
e ch
ild is
read
to. A
ge 2
2 an
d 42
mon
th c
ontro
l var
iabl
es in
clud
e: e
arly
cog
nitiv
e an
d de
velo
pmen
tal a
bilit
ies,
test
obse
rver
repo
rts o
f the
chi
ld's
early
beh
avio
ral d
evel
opm
ent,
heig
ht a
nd w
eigh
t.
BCS
Coef
ficie
nts a
nd S
tand
ard
Erro
rs fr
omRe
gres
sion
Mod
els o
f Age
30
Adul
t Out
com
es o
n Ea
rly A
cade
mic
Ski
lls a
nd S
elf-R
gula
tion
Hig
hest
Aca
dem
ic Q
ualif
icat
ion
Log
Wag
e
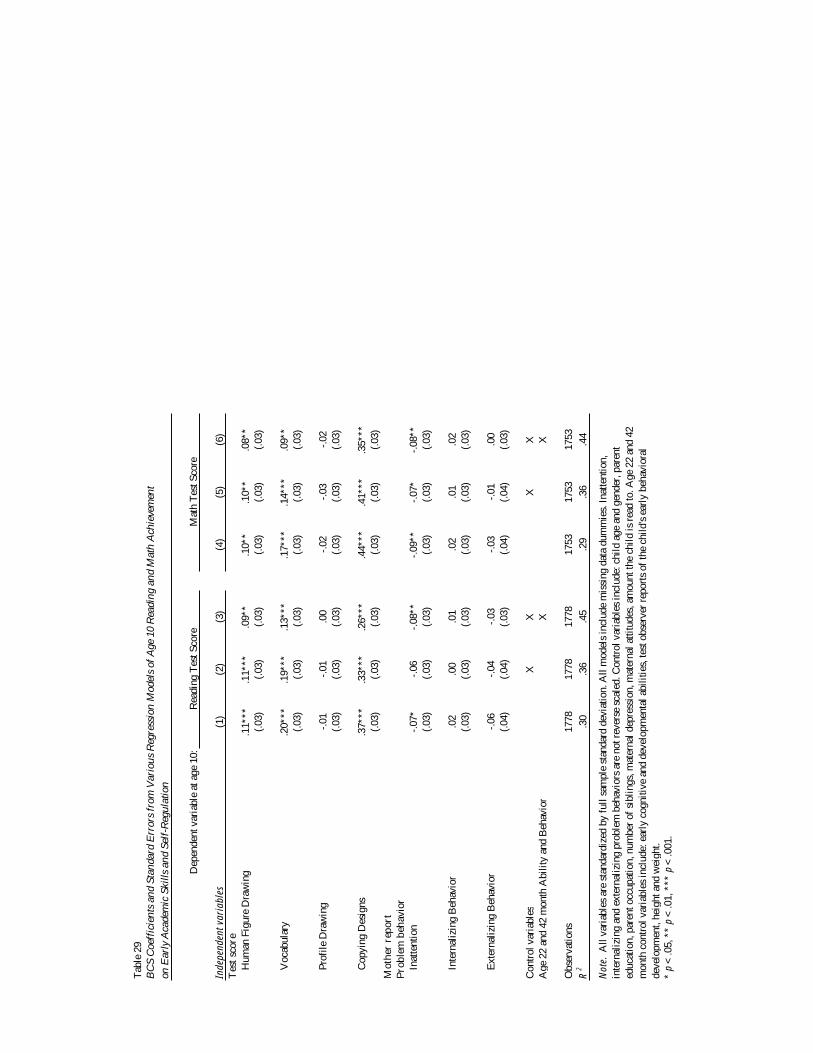
Tabl
e 29
BCS
Coef
ficie
nts a
nd S
tand
ard
Erro
rs fr
om V
ario
us R
egre
ssio
n M
odel
s of A
ge 1
0 Re
adin
g an
d M
ath
Achi
evem
ent
on E
arly
Aca
dem
ic S
kills
and
Sel
f-Reg
ulat
ion
Dep
ende
nt v
aria
ble
at a
ge 1
0:
Inde
pend
ent v
aria
bles
(1)
(2)
(3)
(4)
(5)
(6)
Tes
t sco
reH
uman
Fig
ure
Dra
win
g.1
1***
.11*
**.0
9**
.10*
*.1
0**
.08*
*(.0
3)(.0
3)(.0
3)(.0
3)(.0
3)(.0
3)
Voc
abul
ary
.20*
**.1
9***
.13*
**.1
7***
.14*
**.0
9**
(.03)
(.03)
(.03)
(.03)
(.03)
(.03)
Prof
ile D
raw
ing
-.01
-.01
.00
-.02
-.03
-.02
(.03)
(.03)
(.03)
(.03)
(.03)
(.03)
Cop
ying
Des
igns
.37*
**.3
3***
.26*
**.4
4***
.41*
**.3
5***
(.03)
(.03)
(.03)
(.03)
(.03)
(.03)
Mot
her
repo
rtPr
oble
m b
ehav
ior
Inat
tent
ion
-.07*
-.06
-.08*
*-.0
9**
-.07*
-.08*
*(.0
3)(.0
3)(.0
3)(.0
3)(.0
3)(.0
3)
Inte
rnal
izin
g B
ehav
ior
.02
.00
.01
.02
.01
.02
(.03)
(.03)
(.03)
(.03)
(.03)
(.03)
Exte
rnal
izin
g B
ehav
ior
-.06
-.04
-.03
-.03
-.01
.00
(.04)
(.04)
(.03)
(.04)
(.04)
(.03)
Con
trol v
aria
bles
XX
XX
Age
22
and
42 m
onth
Abi
lity
and
Beh
avio
rX
X
Obs
erva
tions
1778
1778
1778
1753
1753
1753
R2
.30
.36
.45
.29
.36
.44
* p
< .0
5, *
* p
< .0
1, *
** p
< .0
01.
Not
e. A
ll va
riabl
es a
re st
anda
rdiz
ed b
y fu
ll sa
mpl
e st
anda
rd d
evia
tion.
All
mod
els i
nclu
de m
issi
ng d
ata
dum
mie
s. In
atte
ntio
n,
inte
rnal
izin
g an
d ex
tern
aliz
ing
prob
lem
beh
avio
rs a
re n
ot re
vers
e sc
aled
. Con
trol v
aria
bles
incl
ude:
chi
ld a
ge a
nd g
ende
r, pa
rent
ed
ucat
ion,
par
ent o
ccup
atio
n, n
umbe
r of s
iblin
gs, m
ater
nal d
epre
ssio
n, m
ater
nal a
ttitu
des,
amou
nt th
e ch
ild is
read
to. A
ge 2
2 an
d 42
m
onth
con
trol v
aria
bles
incl
ude:
ear
ly c
ogni
tive
and
deve
lopm
enta
l abi
litie
s, te
st o
bser
ver r
epor
ts o
f the
chi
ld's
early
beh
avio
ral
deve
lopm
ent,
heig
ht a
nd w
eigh
t.
Rea
ding
Tes
t Sco
reM
ath
Test
Sco
re
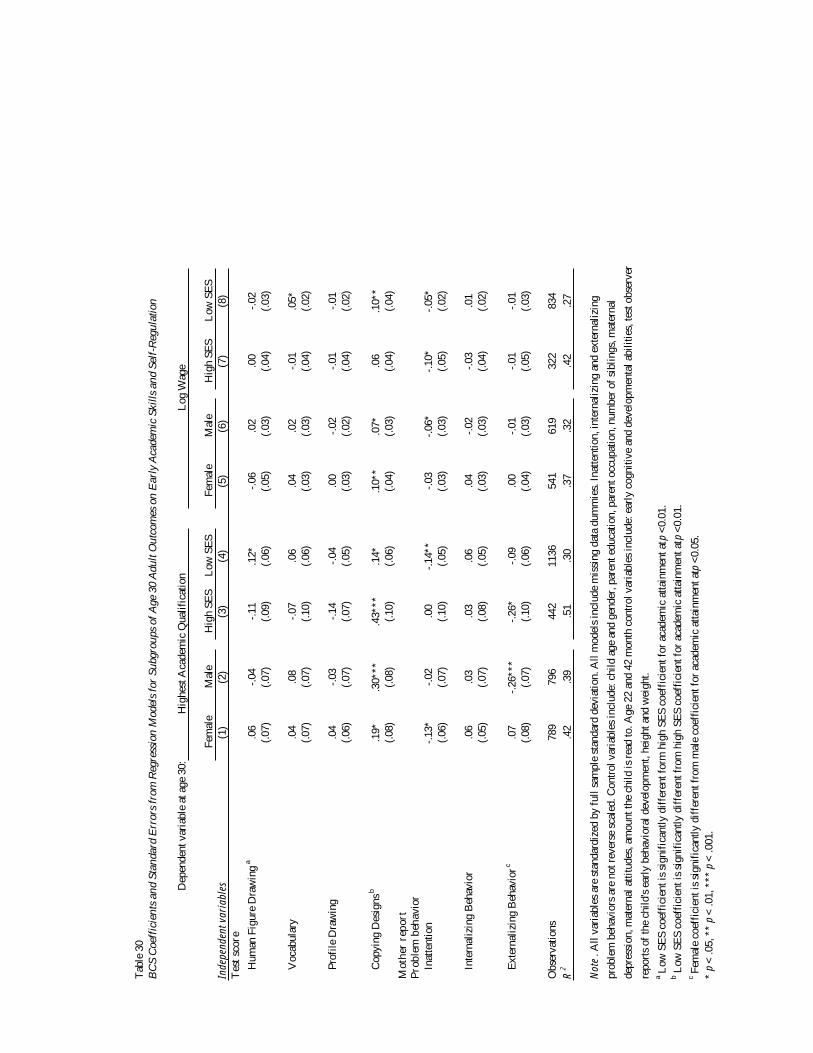
Tabl
e 30
Dep
ende
nt v
aria
ble
at a
ge 3
0:
Fem
ale
Mal
eH
igh
SES
Low
SES
Fem
ale
Mal
eH
igh
SES
Low
SES
Inde
pend
ent v
aria
bles
(1)
(2)
(3)
(4)
(5)
(6)
(7)
(8)
Tes
t sco
reH
uman
Fig
ure
Dra
win
g a
.06
-.04
-.11
.12*
-.06
.02
.00
-.02
(.07)
(.07)
(.09)
(.06)
(.05)
(.03)
(.04)
(.03)
Voc
abul
ary
.04
.08
-.07
.06
.04
.02
-.01
.05*
(.07)
(.07)
(.10)
(.06)
(.03)
(.03)
(.04)
(.02)
Prof
ile D
raw
ing
.04
-.03
-.14
-.04
.00
-.02
-.01
-.01
(.06)
(.07)
(.07)
(.05)
(.03)
(.02)
(.04)
(.02)
Cop
ying
Des
igns
b.1
9*.3
0***
.43*
**.1
4*.1
0**
.07*
.06
.10*
*(.0
8)(.0
8)(.1
0)(.0
6)(.0
4)(.0
3)(.0
4)(.0
4)M
othe
r re
port
Prob
lem
beh
avio
rIn
atte
ntio
n-.1
3*-.0
2.0
0-.1
4**
-.03
-.06*
-.10*
-.05*
(.06)
(.07)
(.10)
(.05)
(.03)
(.03)
(.05)
(.02)
Inte
rnal
izin
g B
ehav
ior
.06
.03
.03
.06
.04
-.02
-.03
.01
(.05)
(.07)
(.08)
(.05)
(.03)
(.03)
(.04)
(.02)
Exte
rnal
izin
g B
ehav
ior c
.07
-.26*
**-.2
6*-.0
9.0
0-.0
1-.0
1-.0
1(.0
8)(.0
7)(.1
0)(.0
6)(.0
4)(.0
3)(.0
5)(.0
3)
Obs
erva
tions
789
796
442
1136
541
619
322
834
R2
.42
.39
.51
.30
.37
.32
.42
.27
* p
< .0
5, *
* p
< .0
1, *
** p
< .0
01.
BCS
Coef
ficie
nts a
nd S
tand
ard
Erro
rs fr
om R
egre
ssio
n M
odel
s for
Sub
grou
ps o
f Age
30
Adul
t Out
com
es o
n Ea
rly A
cade
mic
Ski
lls a
nd S
elf-R
egul
atio
n
a Low
SES
coe
ffic
ient
is si
gnifi
cant
ly d
iffer
ent f
orm
hig
h SE
S co
effic
ient
for a
cade
mic
atta
inm
ent a
t p<0
.01.
b L
ow S
ES c
oeff
icie
nt is
sign
ifica
ntly
diff
eren
t fro
m h
igh
SES
coef
ficie
nt fo
r aca
dem
ic a
ttain
men
t at p
<0.0
1.
c Fem
ale
coef
ficie
nt is
sign
ifica
ntly
diff
eren
t fro
m m
ale
coef
ficie
nt fo
r aca
dem
ic a
ttain
men
t at p
<0.0
5.
Hig
hest
Aca
dem
ic Q
ualif
icat
ion
Log
Wag
e
Not
e. A
ll va
riabl
es a
re st
anda
rdiz
ed b
y fu
ll sa
mpl
e st
anda
rd d
evia
tion.
All
mod
els i
nclu
de m
issi
ng d
ata
dum
mie
s. In
atte
ntio
n, in
tern
aliz
ing
and
exte
rnal
izin
g pr
oble
m b
ehav
iors
are
not
reve
rse
scal
ed. C
ontro
l var
iabl
es in
clud
e: c
hild
age
and
gen
der,
pare
nt e
duca
tion,
par
ent o
ccup
atio
n, n
umbe
r of s
iblin
gs, m
ater
nal
depr
essi
on, m
ater
nal a
ttitu
des,
amou
nt th
e ch
ild is
read
to. A
ge 2
2 an
d 42
mon
th c
ontro
l var
iabl
es in
clud
e: e
arly
cog
nitiv
e an
d de
velo
pmen
tal a
bilit
ies,
test
obs
erve
r re
ports
of t
he c
hild
's ea
rly b
ehav
iora
l dev
elop
men
t, he
ight
and
wei
ght.
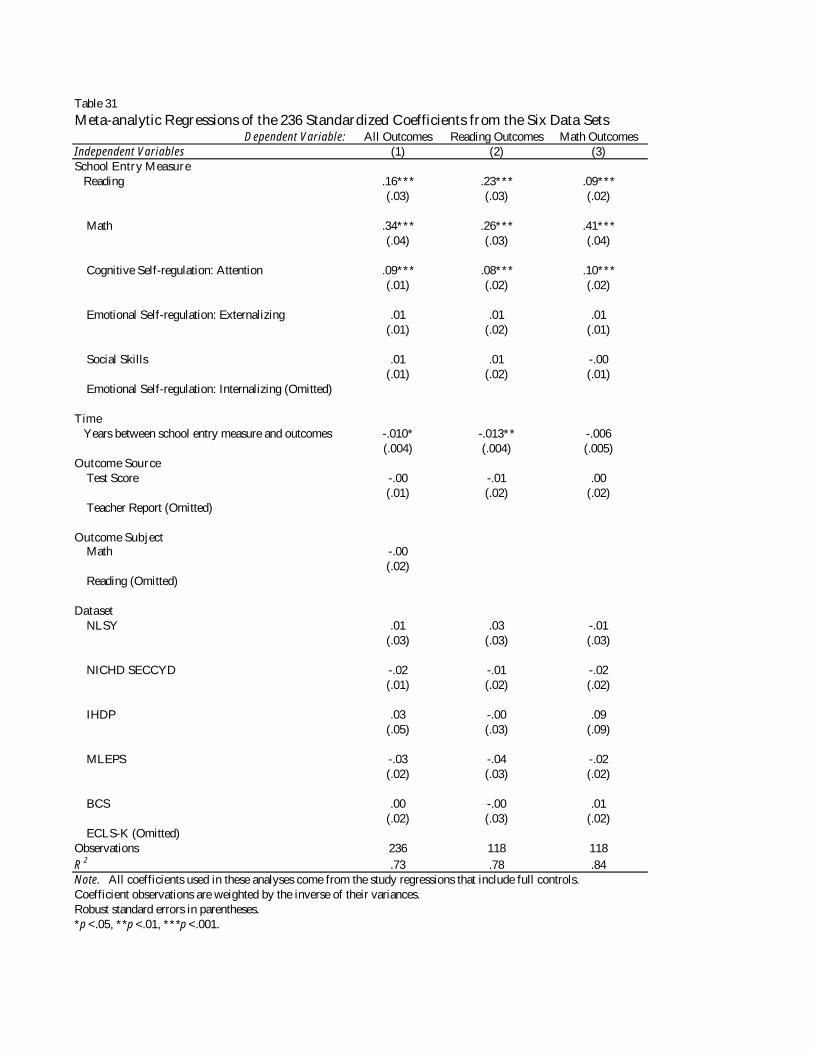
Table 31
Dependent Variable: All Outcomes Reading Outcomes Math OutcomesIndependent Variables (1) (2) (3)School Entry Measure Reading .16*** .23*** .09***
(.03) (.03) (.02)
Math .34*** .26*** .41***(.04) (.03) (.04)
Cognitive Self-regulation: Attention .09*** .08*** .10***(.01) (.02) (.02)
Emotional Self-regulation: Externalizing .01 .01 .01(.01) (.02) (.01)
Social Skills .01 .01 -.00(.01) (.02) (.01)
Emotional Self-regulation: Internalizing (Omitted)
Time Years between school entry measure and outcomes -.010* -.013** -.006
(.004) (.004) (.005)Outcome Source Test Score -.00 -.01 .00
(.01) (.02) (.02) Teacher Report (Omitted)
Outcome Subject Math -.00
(.02) Reading (Omitted)
Dataset NLSY .01 .03 -.01
(.03) (.03) (.03)
NICHD SECCYD -.02 -.01 -.02(.01) (.02) (.02)
IHDP .03 -.00 .09(.05) (.03) (.09)
MLEPS -.03 -.04 -.02(.02) (.03) (.02)
BCS .00 -.00 .01(.02) (.03) (.02)
ECLS-K (Omitted) Observations 236 118 118R 2 .73 .78 .84Note. All coefficients used in these analyses come from the study regressions that include full controls. Coefficient observations are weighted by the inverse of their variances.Robust standard errors in parentheses.*p <.05, **p <.01, ***p <.001.
Meta-analytic Regressions of the 236 Standardized Coefficients from the Six Data Sets
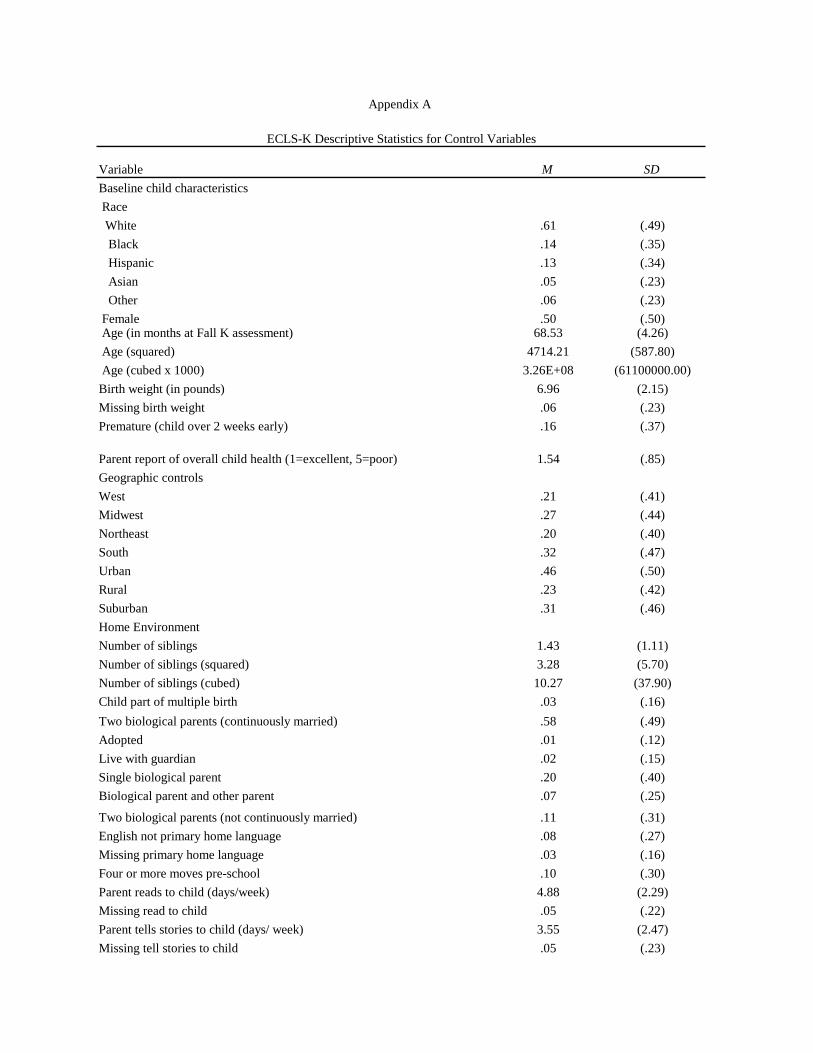
Variable M SDBaseline child characteristics Race
White .61 (.49) Black .14 (.35) Hispanic .13 (.34) Asian .05 (.23) Other .06 (.23)
Female .50 (.50) Age (in months at Fall K assessment) 68.53 (4.26) Age (squared) 4714.21 (587.80) Age (cubed x 1000) 3.26E+08 (61100000.00)Birth weight (in pounds) 6.96 (2.15)Missing birth weight .06 (.23)Premature (child over 2 weeks early) .16 (.37)
Parent report of overall child health (1=excellent, 5=poor) 1.54 (.85)Geographic controlsWest .21 (.41)Midwest .27 (.44)Northeast .20 (.40)South .32 (.47)Urban .46 (.50)Rural .23 (.42)Suburban .31 (.46)Home EnvironmentNumber of siblings 1.43 (1.11)Number of siblings (squared) 3.28 (5.70)Number of siblings (cubed) 10.27 (37.90)Child part of multiple birth .03 (.16)Two biological parents (continuously married) .58 (.49)Adopted .01 (.12)Live with guardian .02 (.15)Single biological parent .20 (.40)Biological parent and other parent .07 (.25)
Two biological parents (not continuously married) .11 (.31)English not primary home language .08 (.27)Missing primary home language .03 (.16)Four or more moves pre-school .10 (.30)Parent reads to child (days/week) 4.88 (2.29)Missing read to child .05 (.22)Parent tells stories to child (days/ week) 3.55 (2.47)Missing tell stories to child .05 (.23)
Appendix A
ECLS-K Descriptive Statistics for Control Variables
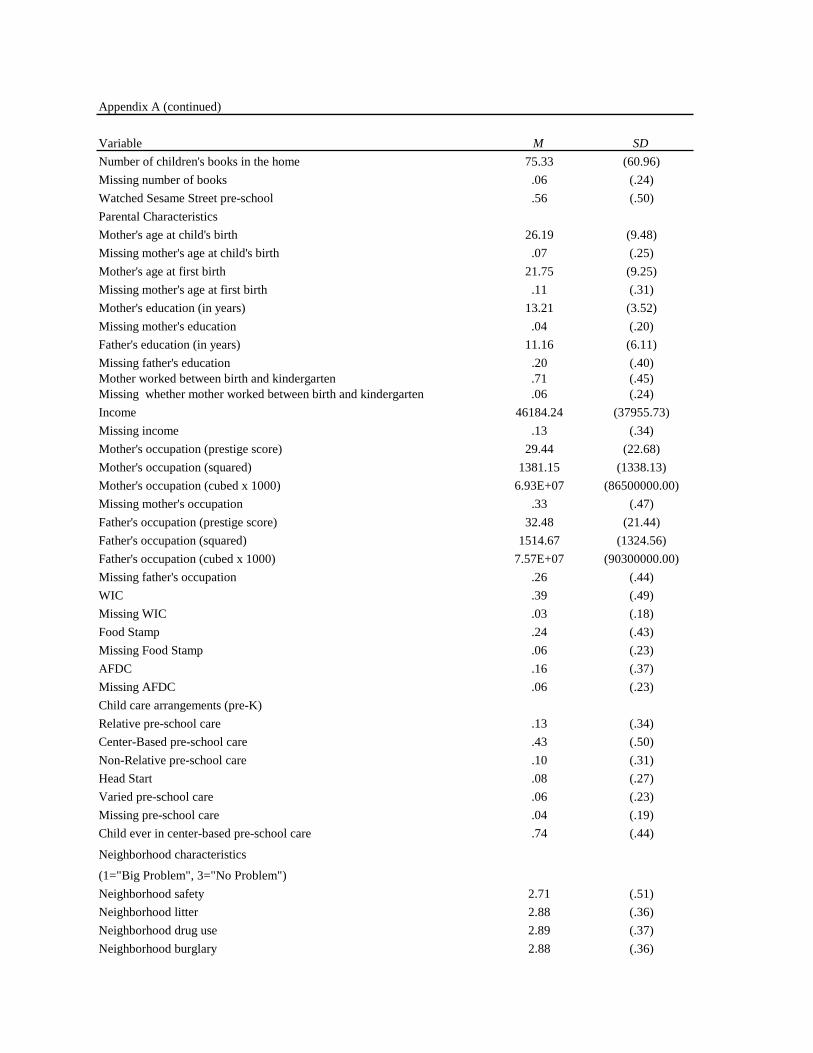
Appendix A (continued)
Variable M SDNumber of children's books in the home 75.33 (60.96)Missing number of books .06 (.24)Watched Sesame Street pre-school .56 (.50)Parental CharacteristicsMother's age at child's birth 26.19 (9.48)Missing mother's age at child's birth .07 (.25)Mother's age at first birth 21.75 (9.25)Missing mother's age at first birth .11 (.31)Mother's education (in years) 13.21 (3.52)Missing mother's education .04 (.20)Father's education (in years) 11.16 (6.11)Missing father's education .20 (.40)Mother worked between birth and kindergarten .71 (.45)Missing whether mother worked between birth and kindergarten .06 (.24)Income 46184.24 (37955.73)Missing income .13 (.34)Mother's occupation (prestige score) 29.44 (22.68)Mother's occupation (squared) 1381.15 (1338.13)Mother's occupation (cubed x 1000) 6.93E+07 (86500000.00)Missing mother's occupation .33 (.47)Father's occupation (prestige score) 32.48 (21.44)Father's occupation (squared) 1514.67 (1324.56)Father's occupation (cubed x 1000) 7.57E+07 (90300000.00)Missing father's occupation .26 (.44)WIC .39 (.49)Missing WIC .03 (.18)Food Stamp .24 (.43)Missing Food Stamp .06 (.23)AFDC .16 (.37)Missing AFDC .06 (.23)Child care arrangements (pre-K)Relative pre-school care .13 (.34)Center-Based pre-school care .43 (.50)Non-Relative pre-school care .10 (.31)Head Start .08 (.27)Varied pre-school care .06 (.23)Missing pre-school care .04 (.19)Child ever in center-based pre-school care .74 (.44)
(1="Big Problem", 3="No Problem")Neighborhood safety 2.71 (.51)Neighborhood litter 2.88 (.36)Neighborhood drug use 2.89 (.37)Neighborhood burglary 2.88 (.36)
Neighborhood characteristics
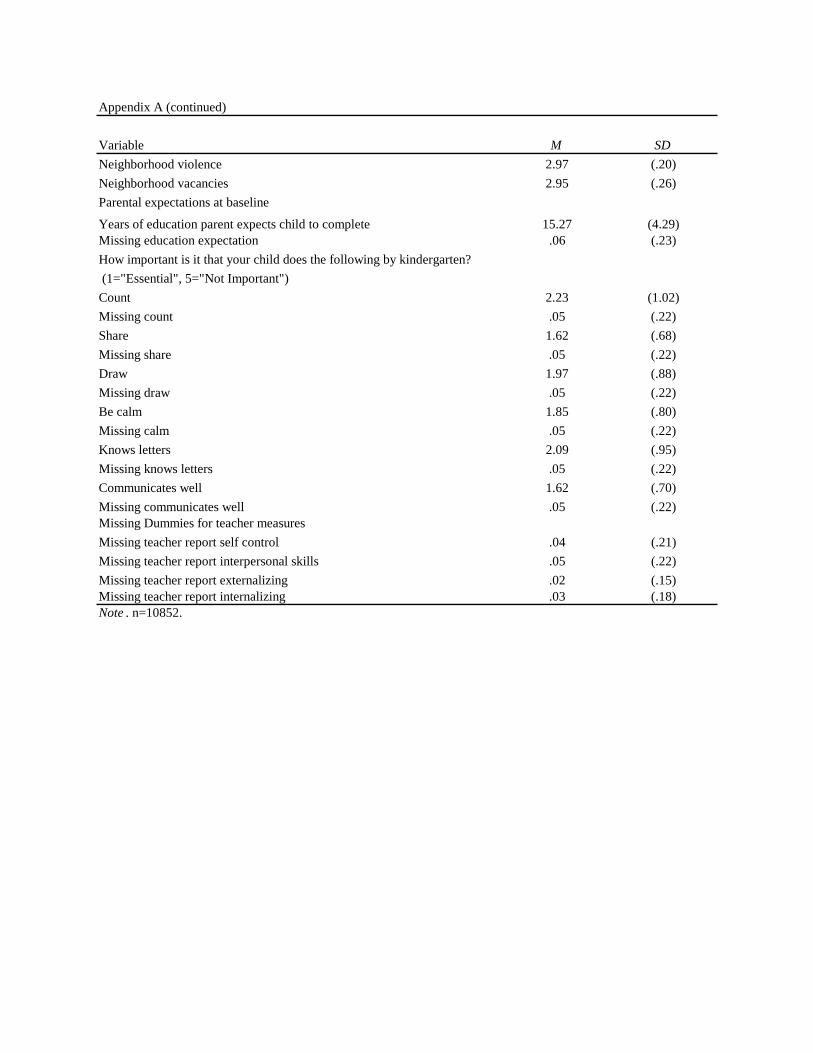
Appendix A (continued)
Variable M SDNeighborhood violence 2.97 (.20)Neighborhood vacancies 2.95 (.26)Parental expectations at baseline
Years of education parent expects child to complete 15.27 (4.29)Missing education expectation .06 (.23)How important is it that your child does the following by kindergarten? (1="Essential", 5="Not Important")Count 2.23 (1.02)Missing count .05 (.22)Share 1.62 (.68)Missing share .05 (.22)Draw 1.97 (.88)Missing draw .05 (.22)Be calm 1.85 (.80)Missing calm .05 (.22)Knows letters 2.09 (.95)Missing knows letters .05 (.22)Communicates well 1.62 (.70)Missing communicates well .05 (.22)Missing Dummies for teacher measuresMissing teacher report self control .04 (.21)Missing teacher report interpersonal skills .05 (.22)Missing teacher report externalizing .02 (.15)Missing teacher report internalizing .03 (.18)Note . n=10852.
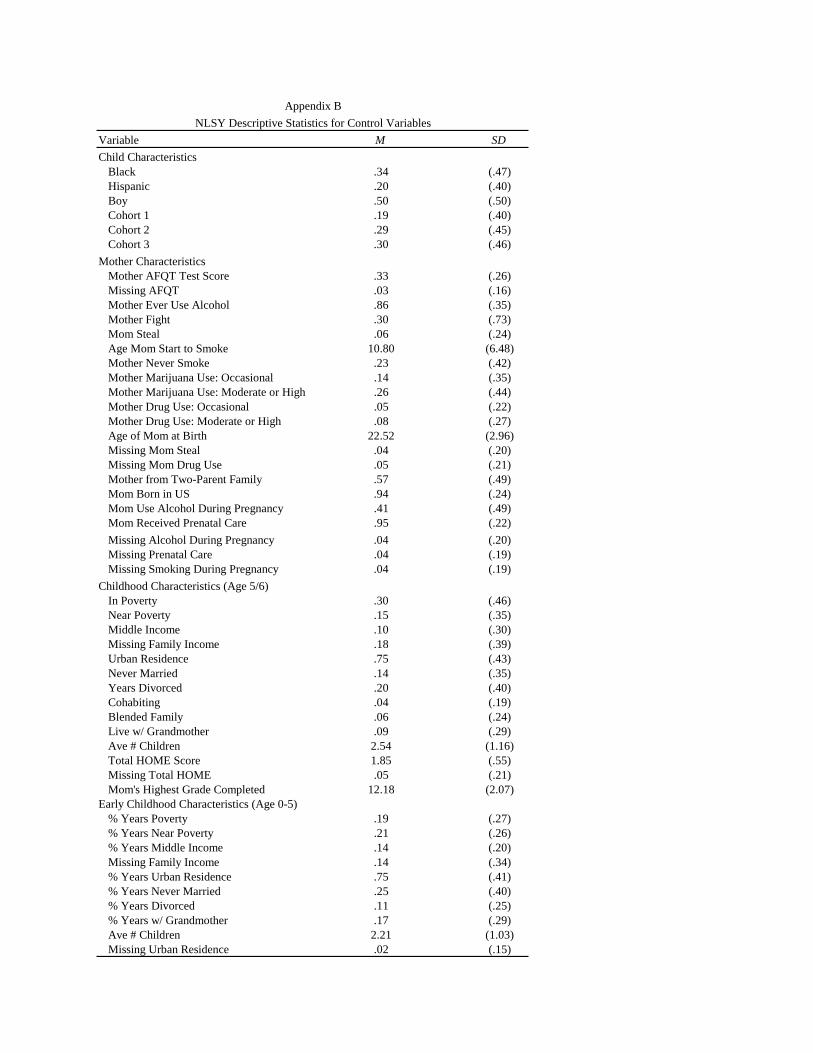
Variable M SChild Characteristics
Black .34 (.47)Hispanic .20 (.40)Boy .50 (.50)Cohort 1 .19 (.40)Cohort 2 .29 (.45)Cohort 3 .30 (.46)
Mother CharacteristicsMother AFQT Test Score .33 (.26)Missing AFQT .03 (.16)Mother Ever Use Alcohol .86 (.35)Mother Fight .30 (.73)Mom Steal .06 (.24)Age Mom Start to Smoke 10.80 (6.48)Mother Never Smoke .23 (.42)Mother Marijuana Use: Occasional .14 (.35)Mother Marijuana Use: Moderate or High .26 (.44)Mother Drug Use: Occasional .05 (.22)Mother Drug Use: Moderate or High .08 (.27)Age of Mom at Birth 22.52 (2.96)Missing Mom Steal .04 (.20)Missing Mom Drug Use .05 (.21)Mother from Two-Parent Family .57 (.49)Mom Born in US .94 (.24)Mom Use Alcohol During Pregnancy .41 (.49)Mom Received Prenatal Care .95 (.22)Missing Alcohol During Pregnancy .04 (.20)Missing Prenatal Care .04 (.19)Missing Smoking During Pregnancy .04 (.19)
Childhood Characteristics (Age 5/6)In Poverty .30 (.46)Near Poverty .15 (.35)Middle Income .10 (.30)Missing Family Income .18 (.39)Urban Residence .75 (.43)Never Married .14 (.35)Years Divorced .20 (.40)Cohabiting .04 (.19)Blended Family .06 (.24)Live w/ Grandmother .09 (.29)Ave # Children 2.54 (1.16)Total HOME Score 1.85 (.55)Missing Total HOME .05 (.21)Mom's Highest Grade Completed 12.18 (2.07)
Early Childhood Characteristics (Age 0-5)% Years Poverty .19 (.27)% Years Near Poverty .21 (.26)% Years Middle Income .14 (.20)Missing Family Income .14 (.34)% Years Urban Residence .75 (.41)% Years Never Married .25 (.40)% Years Divorced .11 (.25)% Years w/ Grandmother .17 (.29)Ave # Children 2.21 (1.03)Missing Urban Residence .02 (.15)
Appendix BNLSY Descriptive Statistics for Control Variables
D
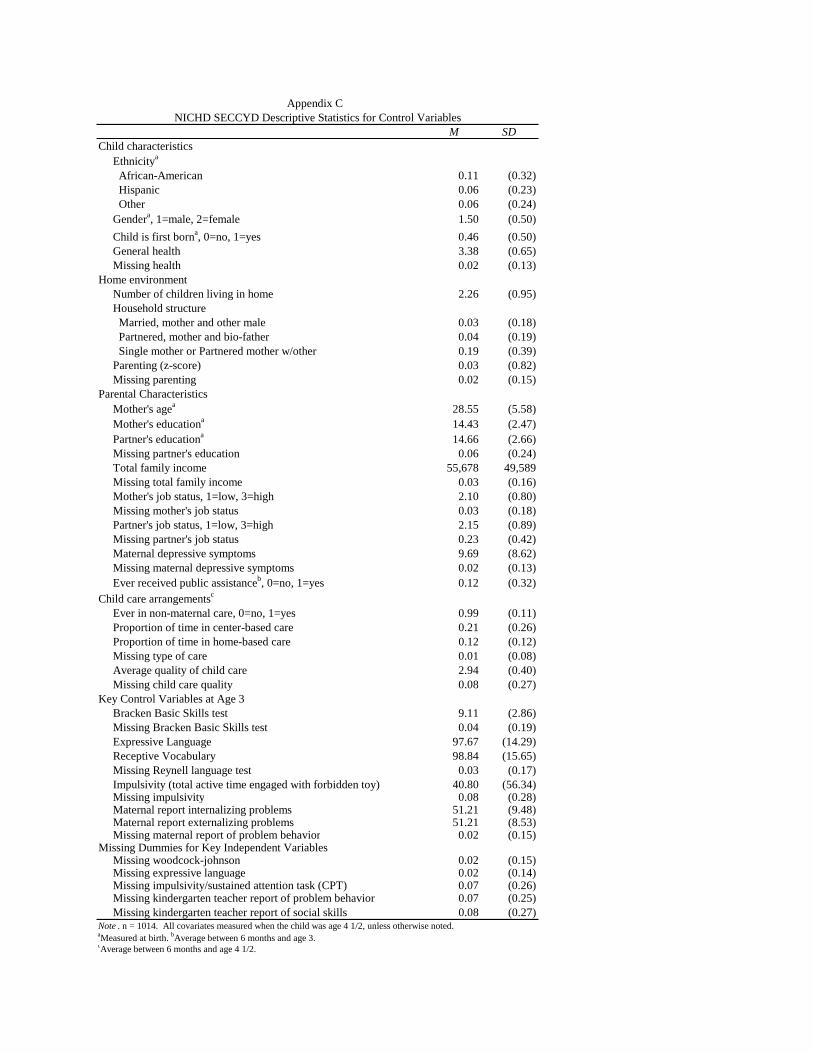
M SDChild characteristics
Ethnicitya
African-American 0.11 (0.32)Hispanic 0.06 (0.23)Other 0.06 (0.24)
Gendera, 1=male, 2=female 1.50 (0.50)Child is first borna, 0=no, 1=yes 0.46 (0.50)General health 3.38 (0.65)Missing health 0.02 (0.13)
Home environmentNumber of children living in home 2.26 (0.95)Household structure
Married, mother and other male 0.03 (0.18) Partnered, mother and bio-father 0.04 (0.19)Single mother or Partnered mother w/other 0.19 (0.39)
Parenting (z-score) 0.03 (0.82)Missing parenting 0.02 (0.15)
Parental CharacteristicsMother's agea 28.55 (5.58)Mother's educationa 14.43 (2.47)Partner's educationa 14.66 (2.66)Missing partner's education 0.06 (0.24)Total family income 55,678 49,589Missing total family income 0.03 (0.16)Mother's job status, 1=low, 3=high 2.10 (0.80)Missing mother's job status 0.03 (0.18)Partner's job status, 1=low, 3=high 2.15 (0.89)Missing partner's job status 0.23 (0.42)Maternal depressive symptoms 9.69 (8.62)Missing maternal depressive symptoms 0.02 (0.13)Ever received public assistanceb, 0=no, 1=yes 0.12 (0.32)
Child care arrangementsc
Ever in non-maternal care, 0=no, 1=yes 0.99 (0.11)Proportion of time in center-based care 0.21 (0.26)Proportion of time in home-based care 0.12 (0.12)Missing type of care 0.01 (0.08)Average quality of child care 2.94 (0.40)Missing child care quality 0.08 (0.27)
Key Control Variables at Age 3Bracken Basic Skills test 9.11 (2.86)Missing Bracken Basic Skills test 0.04 (0.19)Expressive Language 97.67 (14.29)Receptive Vocabulary 98.84 (15.65)Missing Reynell language test 0.03 (0.17)Impulsivity (total active time engaged with forbidden toy) 40.80 (56.34)Missing impulsivity 0.08 (0.28)Maternal report internalizing problems 51.21 (9.48)Maternal report externalizing problems 51.21 (8.53)Missing maternal report of problem behavior 0.02 (0.15)
Missing Dummies for Key Independent VariablesMissing woodcock-johnson 0.02 (0.15)Missing expressive language 0.02 (0.14)Missing impulsivity/sustained attention task (CPT) 0.07 (0.26)Missing kindergarten teacher report of problem behavior 0.07 (0.25)Missing kindergarten teacher report of social skills 0.08 (0.27)
Note . n = 1014. All covariates measured when the child was age 4 1/2, unless otherwise noted.
cAverage between 6 months and age 4 1/2.
Appendix CNICHD SECCYD Descriptive Statistics for Control Variables
aMeasured at birth. bAverage between 6 months and age 3.
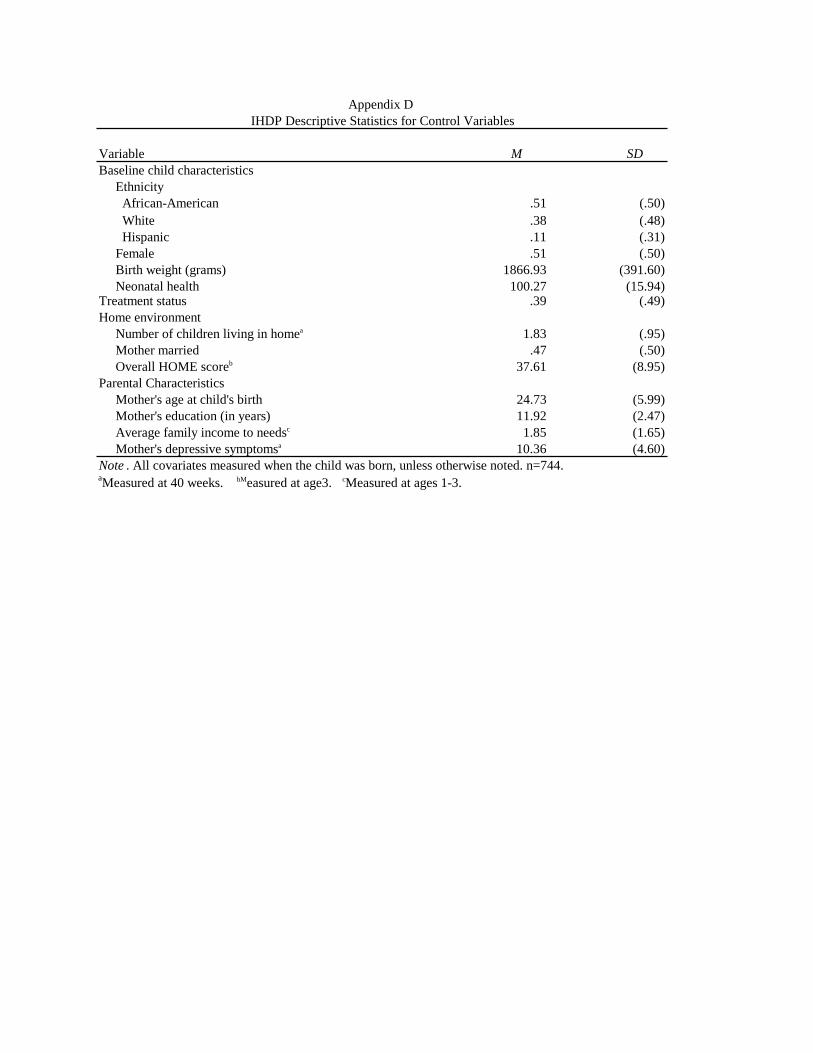
M S
Ethnicity African-American .51 (.50) White .38 (.48) Hispanic .11 (.31)Female .51 (.50)Birth weight (grams) 1866.93 (391.60)Neonatal health 100.27 (15.94)
.39 (.49)Home environment
Number of children living in homea 1.83 (.95)Mother married .47 (.50)Overall HOME scoreb 37.61 (8.95)
Parental CharacteristicsMother's age at child's birth 24.73 (5.99)Mother's education (in years) 11.92 (2.47)Average family income to needsc 1.85 (1.65)Mother's depressive symptomsa 10.36 (4.60)
Note . All covariates measured when the child was born, unless otherwise noted. n=744.aMeasured at 40 weeks. bMeasured at age3. cMeasured at ages 1-3.
Treatment status
Appendix DIHDP Descriptive Statistics for Control Variables
VariableBaseline child characteristics
D
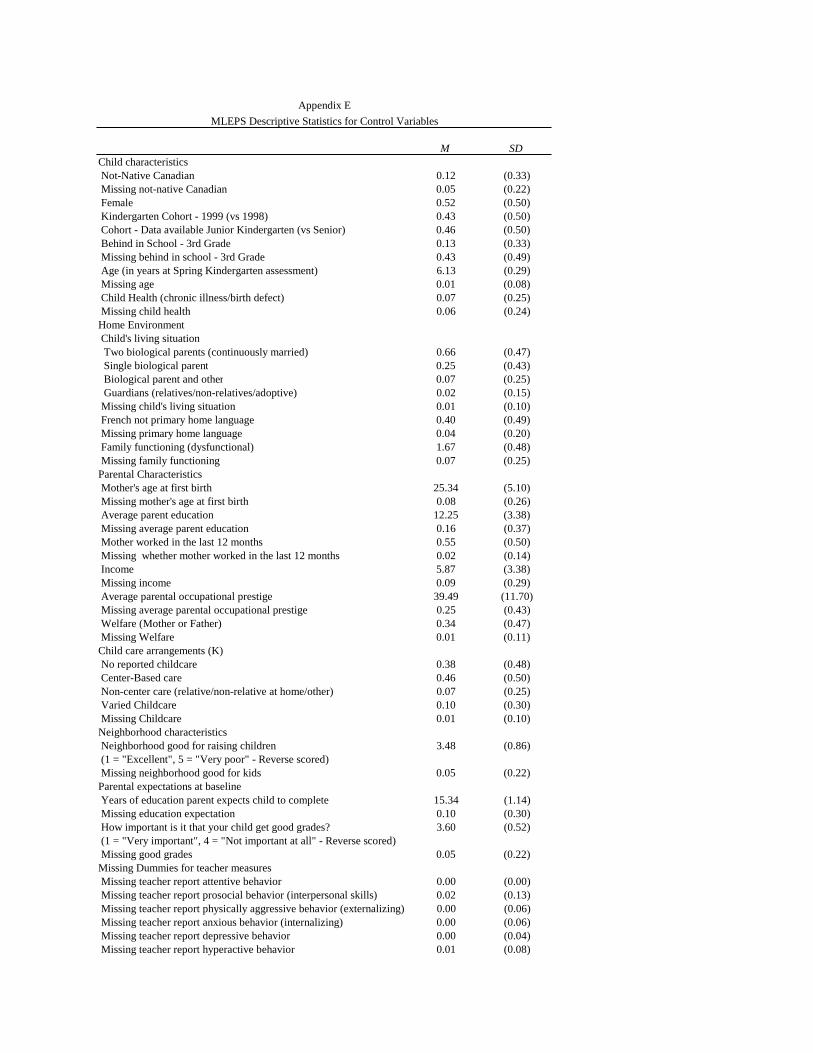
M SDChild characteristics Not-Native Canadian 0.12 (0.33) Missing not-native Canadian 0.05 (0.22) Female 0.52 (0.50) Kindergarten Cohort - 1999 (vs 1998) 0.43 (0.50) Cohort - Data available Junior Kindergarten (vs Senior) 0.46 (0.50) Behind in School - 3rd Grade 0.13 (0.33) Missing behind in school - 3rd Grade 0.43 (0.49) Age (in years at Spring Kindergarten assessment) 6.13 (0.29) Missing age 0.01 (0.08) Child Health (chronic illness/birth defect) 0.07 (0.25) Missing child health 0.06 (0.24)Home Environment Child's living situation Two biological parents (continuously married) 0.66 (0.47) Single biological parent 0.25 (0.43) Biological parent and other 0.07 (0.25) Guardians (relatives/non-relatives/adoptive) 0.02 (0.15) Missing child's living situation 0.01 (0.10) French not primary home language 0.40 (0.49) Missing primary home language 0.04 (0.20) Family functioning (dysfunctional) 1.67 (0.48) Missing family functioning 0.07 (0.25)Parental Characteristics Mother's age at first birth 25.34 (5.10) Missing mother's age at first birth 0.08 (0.26) Average parent education 12.25 (3.38) Missing average parent education 0.16 (0.37) Mother worked in the last 12 months 0.55 (0.50) Missing whether mother worked in the last 12 months 0.02 (0.14) Income 5.87 (3.38) Missing income 0.09 (0.29) Average parental occupational prestige 39.49 (11.70) Missing average parental occupational prestige 0.25 (0.43) Welfare (Mother or Father) 0.34 (0.47) Missing Welfare 0.01 (0.11)Child care arrangements (K) No reported childcare 0.38 (0.48) Center-Based care 0.46 (0.50) Non-center care (relative/non-relative at home/other) 0.07 (0.25) Varied Childcare 0.10 (0.30) Missing Childcare 0.01 (0.10)Neighborhood characteristics Neighborhood good for raising children 3.48 (0.86) (1 = "Excellent", 5 = "Very poor" - Reverse scored) Missing neighborhood good for kids 0.05 (0.22)Parental expectations at baseline Years of education parent expects child to complete 15.34 (1.14) Missing education expectation 0.10 (0.30) How important is it that your child get good grades? 3.60 (0.52) (1 = "Very important", 4 = "Not important at all" - Reverse scored) Missing good grades 0.05 (0.22)Missing Dummies for teacher measures Missing teacher report attentive behavior 0.00 (0.00) Missing teacher report prosocial behavior (interpersonal skills) 0.02 (0.13) Missing teacher report physically aggressive behavior (externalizing) 0.00 (0.06) Missing teacher report anxious behavior (internalizing) 0.00 (0.06) Missing teacher report depressive behavior 0.00 (0.04) Missing teacher report hyperactive behavior 0.01 (0.08)
MLEPS Descriptive Statistics for Control VariablesAppendix E
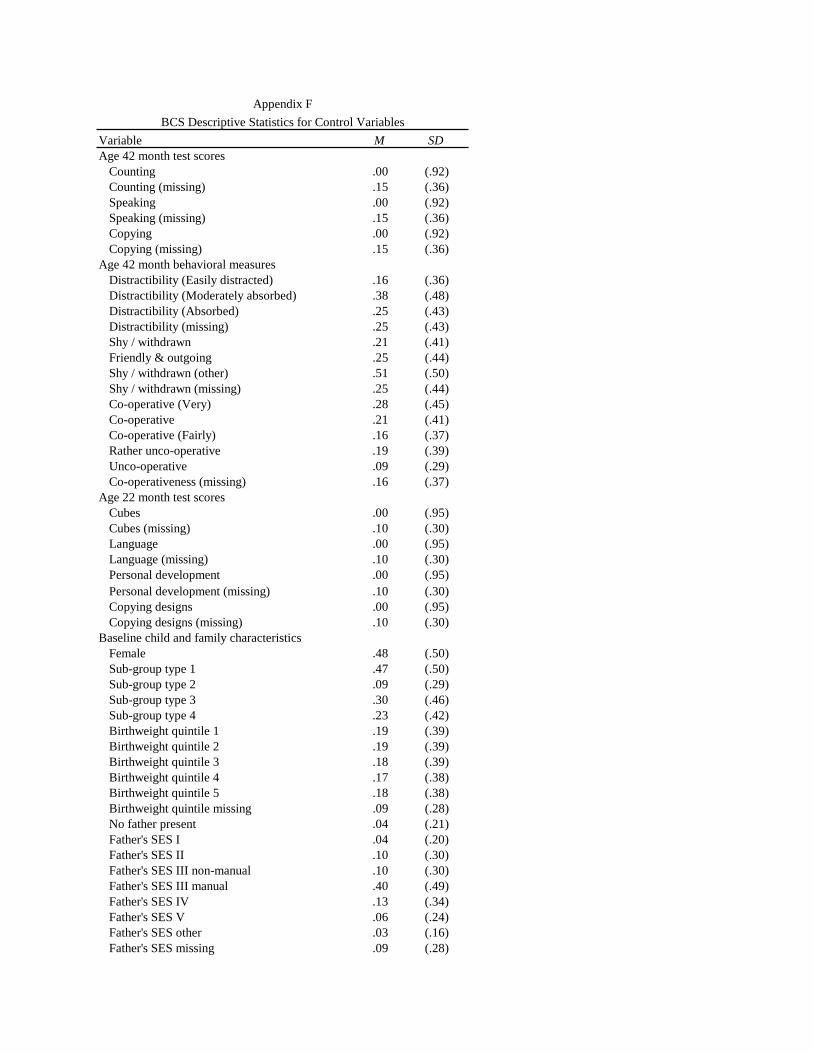
Variable M SDAge 42 month test scores
Counting .00 (.92)Counting (missing) .15 (.36)Speaking .00 (.92)Speaking (missing) .15 (.36)Copying .00 (.92)Copying (missing) .15 (.36)
Age 42 month behavioral measuresDistractibility (Easily distracted) .16 (.36)Distractibility (Moderately absorbed) .38 (.48)Distractibility (Absorbed) .25 (.43)Distractibility (missing) .25 (.43)Shy / withdrawn .21 (.41)Friendly & outgoing .25 (.44)Shy / withdrawn (other) .51 (.50)Shy / withdrawn (missing) .25 (.44)Co-operative (Very) .28 (.45)Co-operative .21 (.41)Co-operative (Fairly) .16 (.37)Rather unco-operative .19 (.39)Unco-operative .09 (.29)Co-operativeness (missing) .16 (.37)
Age 22 month test scoresCubes .00 (.95)Cubes (missing) .10 (.30)Language .00 (.95)Language (missing) .10 (.30)Personal development .00 (.95)Personal development (missing) .10 (.30)Copying designs .00 (.95)Copying designs (missing) .10 (.30)
Baseline child and family characteristicsFemale .48 (.50)Sub-group type 1 .47 (.50)Sub-group type 2 .09 (.29)Sub-group type 3 .30 (.46)Sub-group type 4 .23 (.42)Birthweight quintile 1 .19 (.39)Birthweight quintile 2 .19 (.39)Birthweight quintile 3 .18 (.39)Birthweight quintile 4 .17 (.38)Birthweight quintile 5 .18 (.38)Birthweight quintile missing .09 (.28)No father present .04 (.21)Father's SES I .04 (.20)Father's SES II .10 (.30)Father's SES III non-manual .10 (.30)Father's SES III manual .40 (.49)Father's SES IV .13 (.34)Father's SES V .06 (.24)Father's SES other .03 (.16)Father's SES missing .09 (.28)
Appendix FBCS Descriptive Statistics for Control Variables
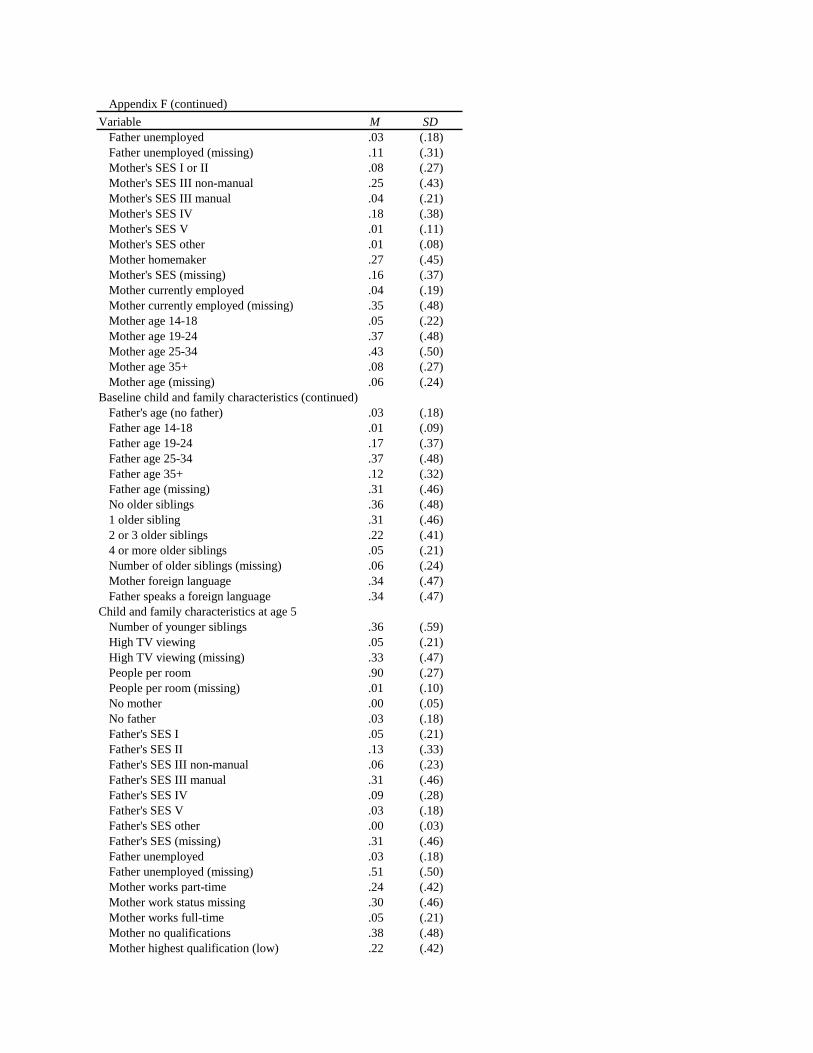
Appendix F (continued)Variable M SD
Father unemployed .03 (.18)Father unemployed (missing) .11 (.31)Mother's SES I or II .08 (.27)Mother's SES III non-manual .25 (.43)Mother's SES III manual .04 (.21)Mother's SES IV .18 (.38)Mother's SES V .01 (.11)Mother's SES other .01 (.08)Mother homemaker .27 (.45)Mother's SES (missing) .16 (.37)Mother currently employed .04 (.19)Mother currently employed (missing) .35 (.48)Mother age 14-18 .05 (.22)Mother age 19-24 .37 (.48)Mother age 25-34 .43 (.50)Mother age 35+ .08 (.27)Mother age (missing) .06 (.24)
Father's age (no father) .03 (.18)Father age 14-18 .01 (.09)Father age 19-24 .17 (.37)Father age 25-34 .37 (.48)Father age 35+ .12 (.32)Father age (missing) .31 (.46)No older siblings .36 (.48)1 older sibling .31 (.46)2 or 3 older siblings .22 (.41)4 or more older siblings .05 (.21)Number of older siblings (missing) .06 (.24)Mother foreign language .34 (.47)Father speaks a foreign language .34 (.47)
Child and family characteristics at age 5Number of younger siblings .36 (.59)High TV viewing .05 (.21)High TV viewing (missing) .33 (.47)People per room .90 (.27)People per room (missing) .01 (.10)No mother .00 (.05)No father .03 (.18)Father's SES I .05 (.21)Father's SES II .13 (.33)Father's SES III non-manual .06 (.23)Father's SES III manual .31 (.46)Father's SES IV .09 (.28)Father's SES V .03 (.18)Father's SES other .00 (.03)Father's SES (missing) .31 (.46)Father unemployed .03 (.18)Father unemployed (missing) .51 (.50)Mother works part-time .24 (.42)Mother work status missing .30 (.46)Mother works full-time .05 (.21)Mother no qualifications .38 (.48)Mother highest qualification (low) .22 (.42)
Baseline child and family characteristics (continued)
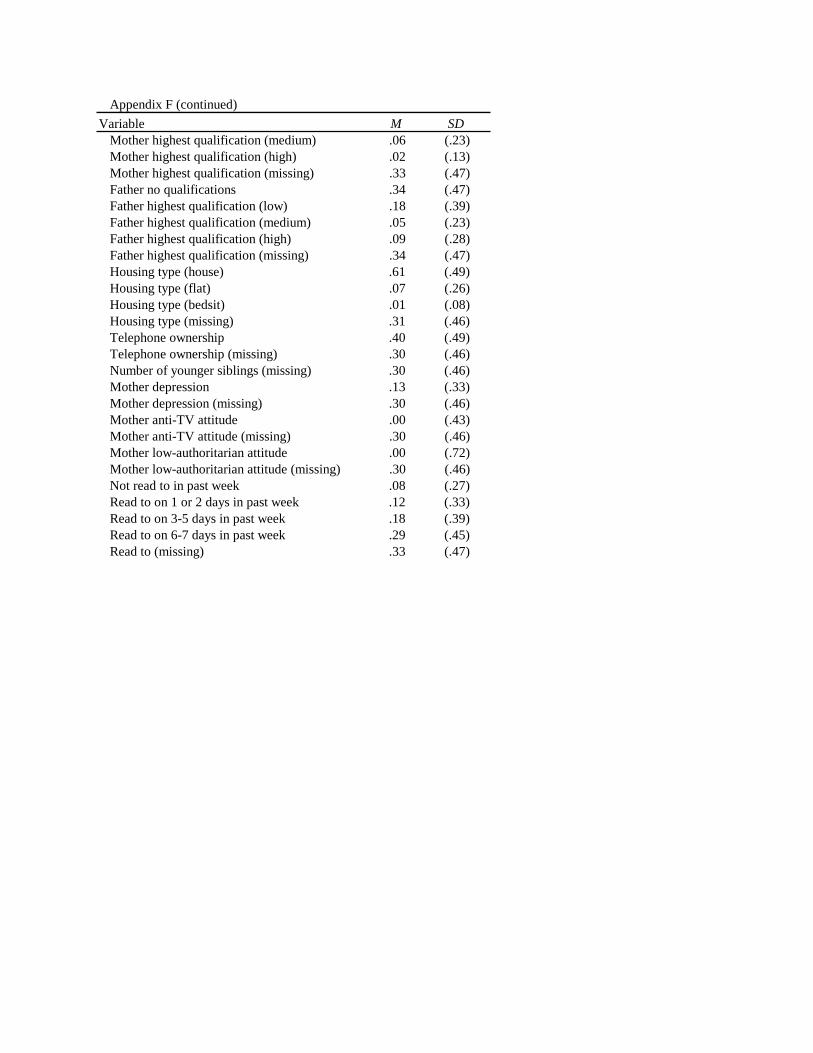
Appendix F (continued)Variable M SD
Mother highest qualification (medium) .06 (.23)Mother highest qualification (high) .02 (.13)Mother highest qualification (missing) .33 (.47)Father no qualifications .34 (.47)Father highest qualification (low) .18 (.39)Father highest qualification (medium) .05 (.23)Father highest qualification (high) .09 (.28)Father highest qualification (missing) .34 (.47)Housing type (house) .61 (.49)Housing type (flat) .07 (.26)Housing type (bedsit) .01 (.08)Housing type (missing) .31 (.46)Telephone ownership .40 (.49)Telephone ownership (missing) .30 (.46)Number of younger siblings (missing) .30 (.46)Mother depression .13 (.33)Mother depression (missing) .30 (.46)Mother anti-TV attitude .00 (.43)Mother anti-TV attitude (missing) .30 (.46)Mother low-authoritarian attitude .00 (.72)Mother low-authoritarian attitude (missing) .30 (.46)Not read to in past week .08 (.27)Read to on 1 or 2 days in past week .12 (.33)Read to on 3-5 days in past week .18 (.39)Read to on 6-7 days in past week .29 (.45)Read to (missing) .33 (.47)