school organisation plan for solihull
TRANSCRIPT
Solihull School Organisation Plan
2014

Contact us School Place Planning, Solihull Council, Manor Square, Solihull B91 3QB [email protected] 0121 704 6702

School Organisation Plan – 2014
1
1. Introduction This is the School Organisation Plan (SOP) for Solihull Council which seeks to set a baseline for school places across Solihull and consider external influences that are driving a need to change school places over the short to medium term. The Plan provides information regarding the current and future pupil population and capacity of schools in Solihull draws conclusions regarding the potential need to add school places and identifies a number of other issues that may have a significant impact on the need for school places. The aim of the School Organisation Plan is to help the Council and the wider community understand the need for school place planning and to establish future demand. It will provide the basis against which school reorganisation will be planned. The plan itself is not intended to identify individual schools for change, but to consider the future need for school places throughout the Borough.
This Plan sets out the framework within which Solihull Metropolitan Borough Council will consider the organisation of school places over the next five years. The Plan includes detailed demographic information, and identifies a number of other issues that may have a significant impact on the need for school places.
The data within this plan is based on a provisional September 2014 pupil count, and will be updated annually following the October pupil count.
1.1 National and Local Policy Context
Local Authorities are charged with the duty of ensuring there are sufficient school places within the area to meet demand. Increasingly this duty has to be carried out in a changing education environment, with increasing numbers of Academies, Free Schools and UTC’s. New guidance for School Organisation was published by the DfE in January 2014, which supports the government’s aim of increasing school autonomy and reducing bureaucracy.
The Government agenda of ensuring that all children have access to ‘good’ schools is key to the provision of additional school places, and all school reorganisation proposals must be considered against this principle.
The School Organisation Plan is part of a wider framework of policy documents that supports the Council Plan 2014/18 and the Children’s Services Business Plan for 2014-15, which sets out four strategic objectives over the next 2 – 3 years to improve the lives of children, young people and families in Solihull:
Ensuring that all children and young people have positive learning experiences, achieve success and develop the skills which will serve them well as adults
Enabling all children and young people to have a healthy start in life

School Organisation Plan – 2014
2
Protecting the most vulnerable children and young people, and securing early help for those that need it
Looking after those children whose parents are not able to The Council is a partner in developing the UK Central Hub and Interchange Growth Strategy, which will generate a range of significant benefits to the area including, additional jobs, extra economic activity, increased employment and new homes. The provision of school places in this area will need to be considered as the master plan evolves.
1.2 School Improvement
The Council is committed to school improvement and raising standards in all schools across the Borough. The Council takes the view that the provision of sufficient, suitable and well maintained accommodation, can contribute significantly to the performance of individual pupils and schools and the Solihull Schools Asset Management Plan directly addresses these issues.
Where there is a need to consider a reorganisation of schools, the performance of schools will be taken into account, along with geographical location and physical characteristics. The performance of individual schools does influence the pattern of parental preference.
Any school reorganisation proposals need to demonstrate how standards will be improved and will seek to make the best possible use of existing assets, meet the needs of parents, and optimise expenditure to help maximise performance of schools in the future.
Where a school is found to be inadequate by Ofsted, the Department for Education (DfE) will seek to convert the school into a Sponsored Academy with the sponsor being identified through the Academies Brokerage Division.
1.3 Alternative Provision
This plan takes no account of specialist provision for children with Special Educational needs or those young people that require provision other than at school. This will be considered in a separate review and reported in parallel.
1.4 Provisions for Two Year Olds
From September 2013, 20% of all 2 year olds were eligible for funded early learning places. This is intended to improve the attainment and life chances of some of the most disadvantaged children and provide support for working parents.
From September 2014, the eligibility criteria for 2 year old places will widen which will increase the number of 2 year olds eligible for a place to 40%. The DFE has set a target for the Council to fund 900 places. To date some 345 children have been offered places by registered providers. Whilst it is considered locally that the
School Organisation Plan – 2014
3
predicted eligibility will only apply to 825 children in total, that currently represents a shortfall in provision of around 500 places, Although a large proportion of these places are being provided by the Private, Voluntary and Independent Sector some places may need to be provided through school based provision. When considering school reorganisation or expansions the opportunity to provide provision for 2 year olds will need to be considered.
2. Demographic Factors
When forecasting future school rolls a range of factors need to be considered that can impact on the demand for school places.
2.1 Birth Data
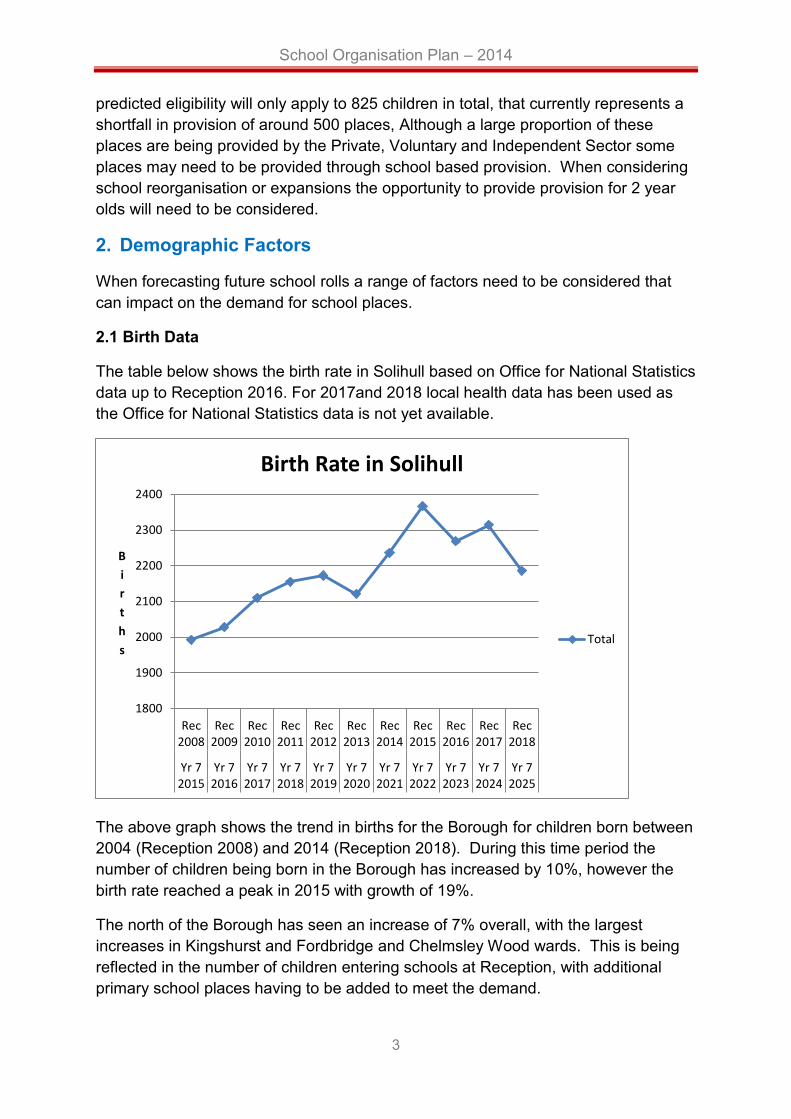
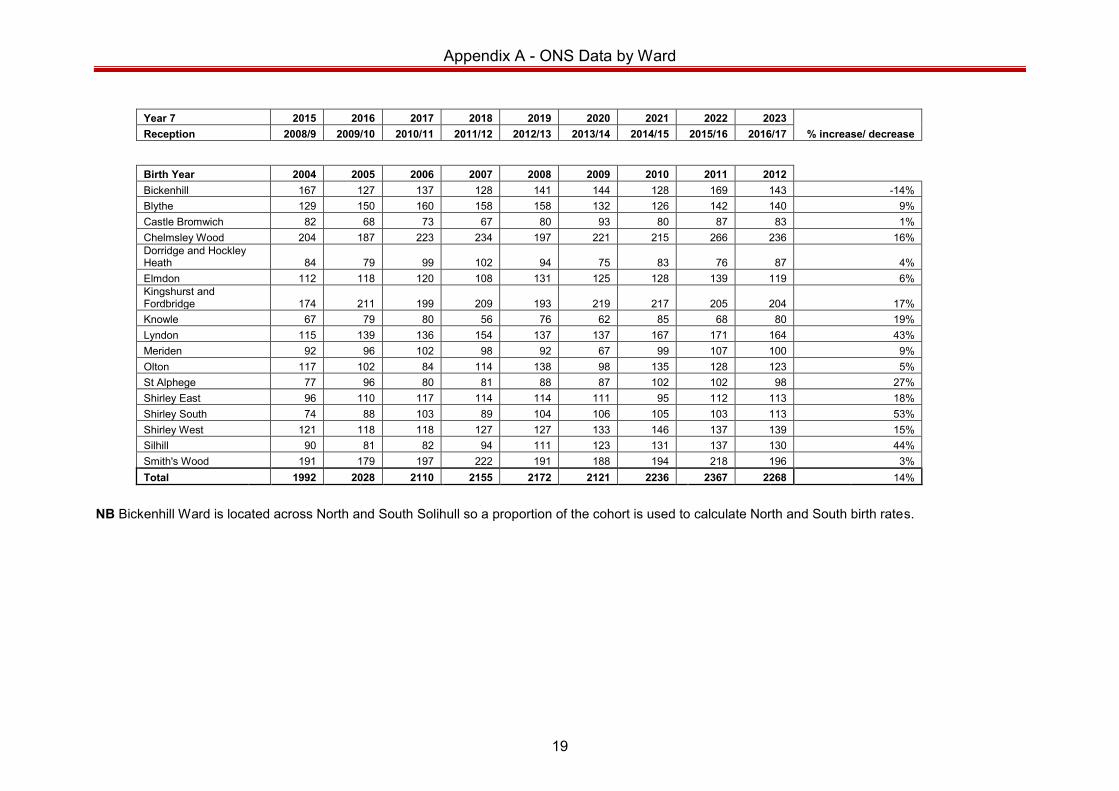
The table below shows the birth rate in Solihull based on Office for National Statistics data up to Reception 2016. For 2017and 2018 local health data has been used as the Office for National Statistics data is not yet available.
The above graph shows the trend in births for the Borough for children born between 2004 (Reception 2008) and 2014 (Reception 2018). During this time period the number of children being born in the Borough has increased by 10%, however the birth rate reached a peak in 2015 with growth of 19%.
The north of the Borough has seen an increase of 7% overall, with the largest increases in Kingshurst and Fordbridge and Chelmsley Wood wards. This is being reflected in the number of children entering schools at Reception, with additional primary school places having to be added to meet the demand.
1800
1900
2000
2100
2200
2300
2400
Rec2008
Rec2009
Rec2010
Rec2011
Rec2012
Rec2013
Rec2014
Rec2015
Rec2016
Rec2017
Rec2018
Yr 72015
Yr 72016
Yr 72017
Yr 72018
Yr 72019
Yr 72020
Yr 72021
Yr 72022
Yr 72023
Yr 72024
Yr 72025
B
i
r
t
h
s
Birth Rate in Solihull
Total
School Organisation Plan – 2014
4
The South of the Borough has seen an increase of 18% overall but across the wards there is a variable picture, with the largest increases in Shirley, Silhill and Lyndon Wards. The increase in pupil numbers is currently being met within existing school capacity, however as numbers continue to increase it is anticipated that additional school places will be required.
The actual number of births by ward can be seen in Appendix A
2.2 Children living outside of Solihull
Schools in Solihull attract children resident in neighbouring authorities. At September 2014 14% of all pupils in our primary schools were resident outside of Solihull, this rises to 33% in Secondary schools.
Neighbouring Authorities have seen a significant rise in birth rates, so the expectation is that demand from children living outside of Solihull will continue. However, as the birth rate in Solihull rises this is expected to reduce the number of pupils from other authorities who are able to access some Solihull schools and this will reduce the level of parental preference met.
2.3 Migration
When considering cohort information for school intakes it is essential that the migration of children in and out of the Borough is considered. When planning the level of school places in an area, a threshold of up to 10% has traditionally been considered appropriate to allow for migration where possible.
Reception intake cohorts are reviewed annually and the growth between the year of birth and the Reception intake year is monitored and allowed for when forecasting for future intake years. Overall, Reception cohorts grow by around 7% between birth and intake year, however this varies by area within the Borough.
With an increasing birth rate, Reception classes are filling at intake and this is rolling on year on year through key stage one. In September 2014, there were 145 places (2% of Key Stage 1 places) available across the Borough, only 20 of these places are located in Reception. This means that families moving into the area have very limited preference of primary school, and for those families with more than one child keeping the children together in one school is very difficult.
Secondary cohorts are based on children in our primary schools that are resident in Solihull. Overall numbers in primary schools do not vary significantly between Reception and Year 5, with net growth of about 1% across the Borough. This figure masks large variations in catchment cohorts. During this time period the number of children resident in some secondary school catchments increases by as much as 25% with corresponding reductions in other secondary school catchment areas. It appears that families move within the Borough to secure a particular secondary school catchment area whilst the children remain at their existing primary school.
School Organisation Plan – 2014
5
2.4 Housing
In December 2013 the Council’s Local Development Plan was approved. The plan outlines how the Council will ensure sufficient housing land supply to deliver 8,665 additional homes over the period 2012 to 2028. This will include 3,960 homes located on identified sites within the plan, as well as sites identified within the North Regeneration area. The plan is currently subject to a High Court Appeals process.
The annual housing land provision target is 500 net additional homes per year. The housing sites are phased, to ensure a continuous supply of housing provision throughout the plan period and a continuous supply of affordable housing. The plan is split into 3 five-year phases
Phase 1 2013 to 2018 Phase 2 2018 to 2023 Phase 3 2023 to 2028
In addition to the identified sites, new housing will be supported on unidentified sites in accessible locations, where they contribute towards meeting identified borough wide housing needs; this is known as windfall housing. It is expected that sites for a further 2,400 homes will still need to be found through windfall sites to meet the Council’s overall target.
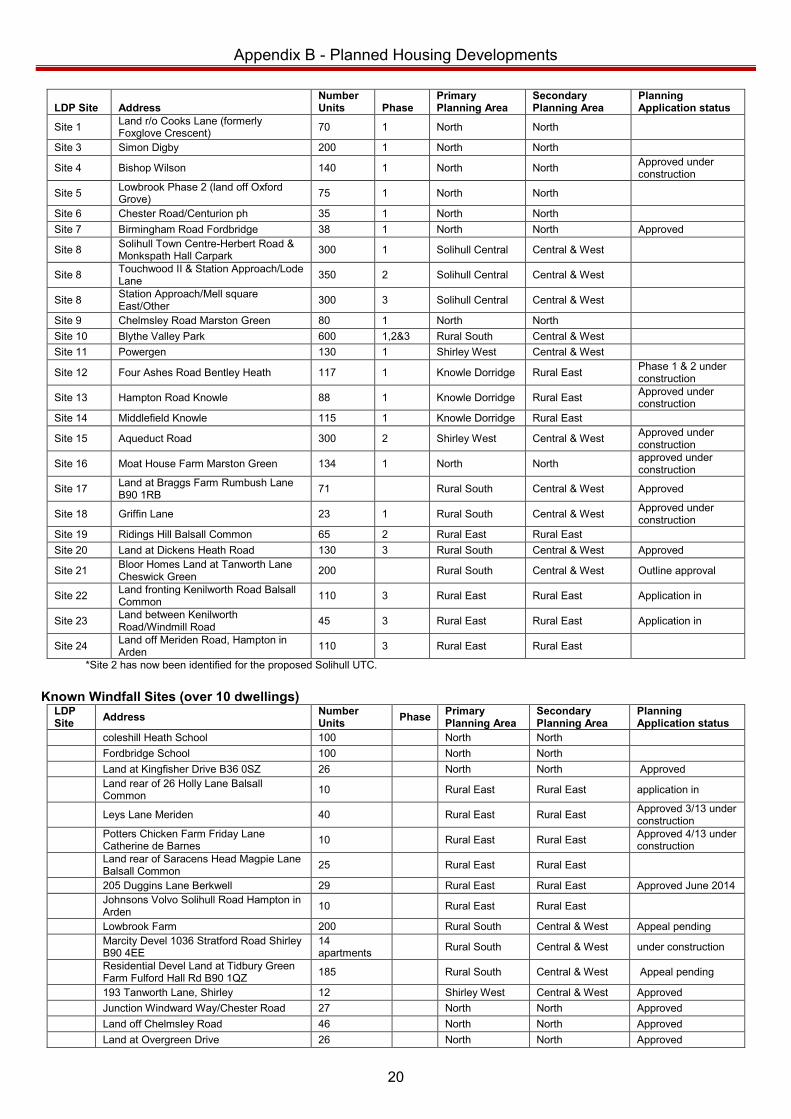
This level of housing development will significantly impact on the demographic profile of the area. A complete list of known housing sites, their local plan phasing and their estimated capacity is shown at Appendix B.
The scale and timing of housing development is subject to considerable variation depending on detailed individual planning applications for each site; this is a challenge when forecasting pupil product and the impact on school forecasts. The information outlined in Appendix B is subject to constant review, and changes may have a significant impact on the number of school places required.
Analysis of recent large scale developments, such as Wharf Lane and Dickens Heath village, have shown that the pupil product in Solihull is around 4 pupils per year group per 100 houses. However, it is important to note that this can only be used as a guide as the pupil product from individual housing developments may vary due to the nature of the housing located on the site. In addition, this calculation assumes that all children moving into a new housing development are new to the area, which is not normally the case. It is highly likely that a proportion of children moving into housing developments will already reside in the area and may continue in their existing schools or move at the end of a key stage.
Pupil product from housing developments can be planned for at Intake however, it is more difficult to plan for children of existing school age, seeking to change school mid year. These pupils could be for any year group at any time. This is especially

School Organisation Plan – 2014
6
difficult where schools in the area are full and only small numbers of vacancies exist across the wider area. Discussions will need to be held with schools, in areas affected by housing development, to consider the best way to secure school places outside of intake in response to housing development.
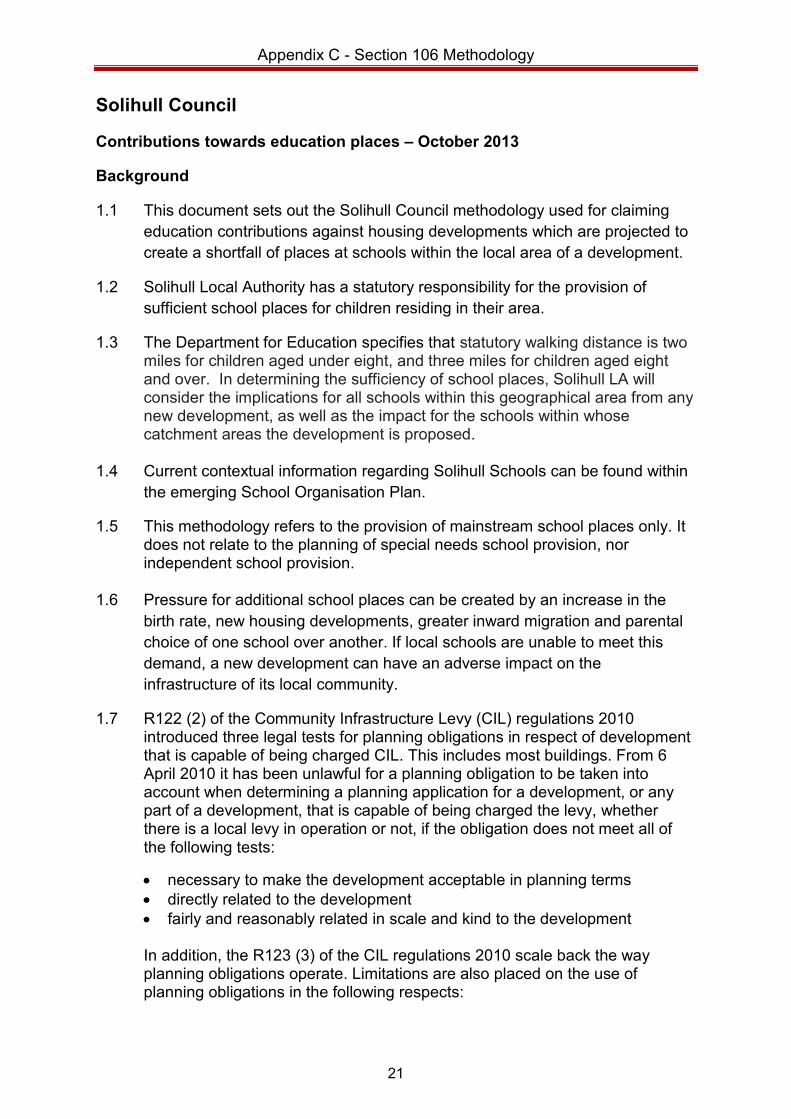
Where the Council assess that a proposed development will create a full or partial shortfall of places in primary or secondary schools, a contribution will be sought from the developer, assessed in accordance with the Council’s Section 106 methodology statement attached at Appendix C.
2.5 Parental Preference
Every address in Solihull sits within a school catchment area, for school admission purposes, for both primary and secondary phases. Generally, parents that express a preference for their catchment area school would expect to get a place, however there is no guarantee. As pupil numbers rise, there is an increasing pressure on some primary schools for catchment area places with some schools unable to meet the demand for places from within their catchment area.
The introduction of academy schools has not had an impact on the Council’s catchment area policy. All academy schools that operated a catchment area prior to conversion have chosen to continue using a catchment area within their admission arrangements.
Voluntary Aided schools operate their own admission arrangements to serve local parishes. These schools will not generally be subject to the catchment area arrangements. However, there are some exceptions in the case of some Church of England schools located in rural areas of the Borough.
For September 2014 admissions intake, 88% of applications from Solihull resident children for reception classes were offered their first preference school. For secondary schools, 81% were offered their first preference school. Two primary schools were unable to meet the demand from their catchment area.
The popularity of a school can change quite rapidly, and the desire to respond to patterns of parental preference has to be considered against a longer term view of the geographical location of schools, along with planning and accommodation constraints.
2.6 Diversity of Provision
Voluntary Aided Schools - the Council promotes a positive attitude towards diversity of provision and enjoys excellent relationships with the Church of England and the Catholic Diocese. When considering the supply and demand for school places in the area the Council will work in partnership with the Diocesan Authorities and keep under review the balance of denominational places. At September 2014
School Organisation Plan – 2014
7
30% of primary school places and 6% of secondary school places were located in church schools.
Academy and Trust Schools - at September 2014 13% of primary school places and 86% of secondary school places were located in academy and trust schools. The number of primary academies in the area is growing year on year. Academy Schools have increased responsibilities for School Admissions and are their own Admission Authority, enabling them to increase their Published Admission Number where they feel it is appropriate. When considering the level of school places available in an area the Council is committed to working with all schools, and will need to take into account the plans of good or outstanding academy schools who wish to increase in size.
Independent Schools - these are fee paying schools outside the maintained sector and beyond the scope of this Plan, although the number of Solihull resident pupils attending independent schools is monitored.
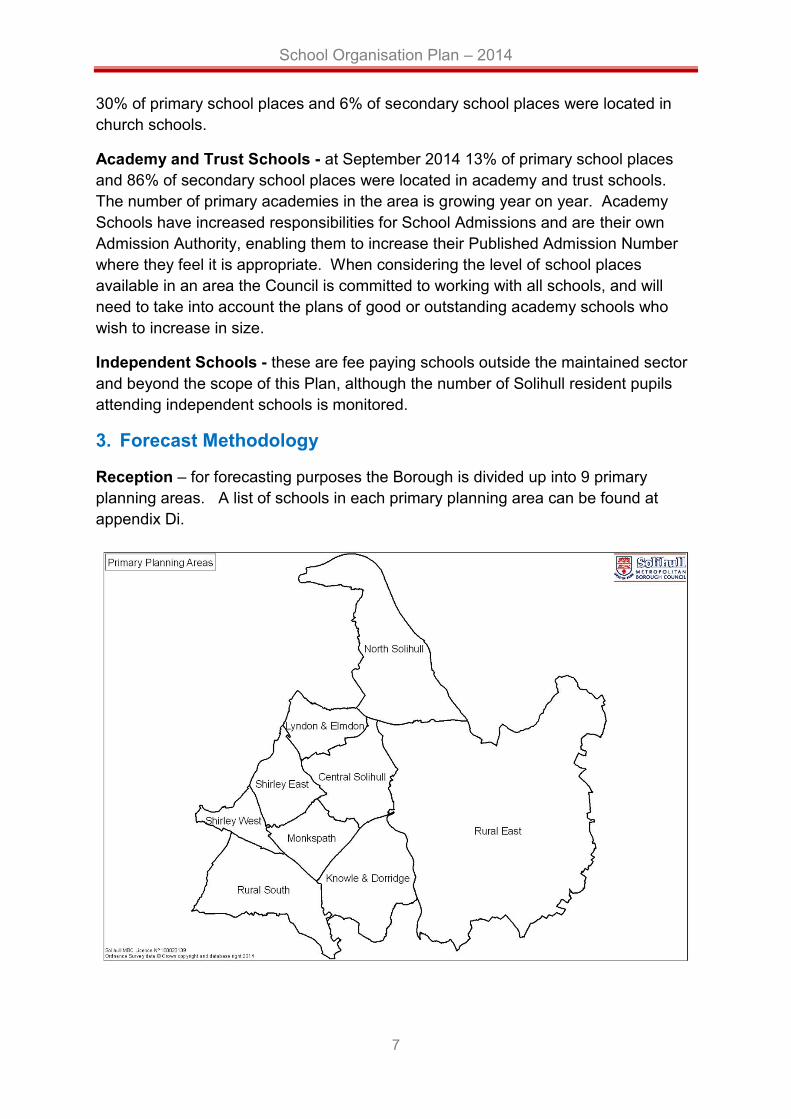
3. Forecast Methodology
Reception – for forecasting purposes the Borough is divided up into 9 primary planning areas. A list of schools in each primary planning area can be found at appendix Di.

School Organisation Plan – 2014
8
Using these smaller geographical areas enables more detailed forecasting that can take account of localised trends and parental preference.
The raw data used to forecast Reception intakes is taken from Health Authority information based on actual children born and resident in the Borough. This is then adjusted to take account of information collected through the nursery admission process and validated against the published Office of National Statistics birth data. Trends in parental preference, including applications from children living outside of the Borough, are taken in to account as are any known housing developments. This information is collated at Borough level, planning area level and at individual school level.
Junior Schools – the raw data used is the Year 2 children attending infant only schools. This is adjusted to take account of past parental preferences before developing a forecast intake for each Junior School at Year 3. Primary schools do not have a separate junior intake.
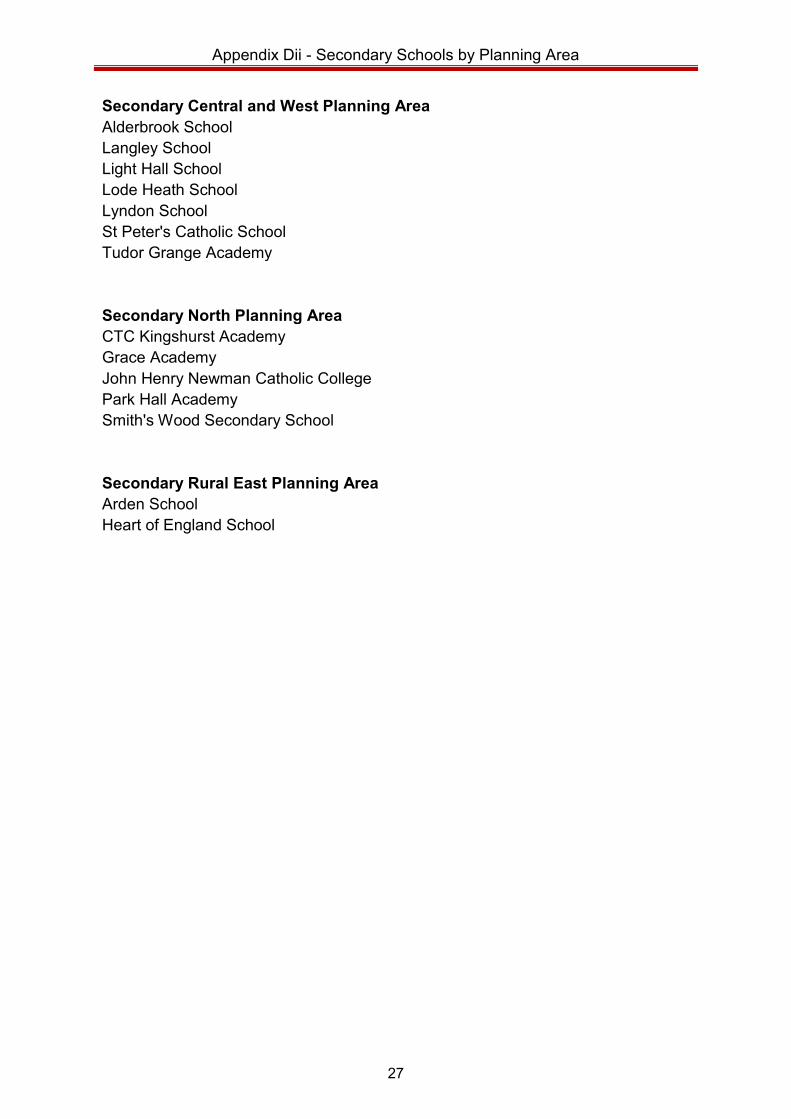
Secondary - for forecasting purposes the Borough is divided up into 3 secondary planning areas. A list of secondary schools in each planning area can be found at Appendix Dii.
The raw data used in determining forecast intake numbers for secondary schools is the home address of children attending primary schools in Solihull. These are
School Organisation Plan – 2014
9
matched with catchment area information to develop catchment cohorts. This information is then modified to allow for historical trends in parental preference, mobility, take up of places at independent schools and children living outside of the Borough.
All other year groups are assumed to roll on from the previous year. A whole school roll forecast can be calculated for each school using this information. These are aggregated up to provide forecast pupil numbers at planning area and Borough levels.
4. Primary School Places
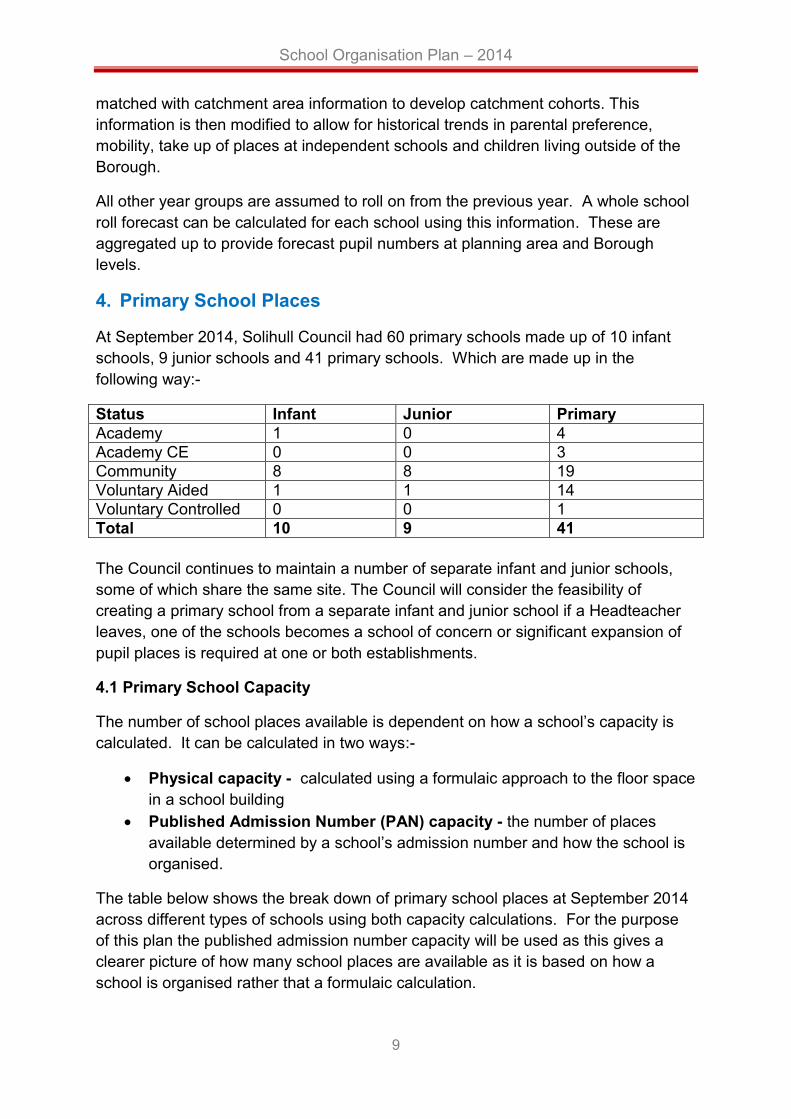
At September 2014, Solihull Council had 60 primary schools made up of 10 infant schools, 9 junior schools and 41 primary schools. Which are made up in the following way:-
Status Infant Junior Primary Academy 1 0 4 Academy CE 0 0 3 Community 8 8 19 Voluntary Aided 1 1 14 Voluntary Controlled 0 0 1 Total 10 9 41 The Council continues to maintain a number of separate infant and junior schools, some of which share the same site. The Council will consider the feasibility of creating a primary school from a separate infant and junior school if a Headteacher leaves, one of the schools becomes a school of concern or significant expansion of pupil places is required at one or both establishments.
4.1 Primary School Capacity
The number of school places available is dependent on how a school’s capacity is calculated. It can be calculated in two ways:-
Physical capacity - calculated using a formulaic approach to the floor space in a school building
Published Admission Number (PAN) capacity - the number of places available determined by a school’s admission number and how the school is organised.
The table below shows the break down of primary school places at September 2014 across different types of schools using both capacity calculations. For the purpose of this plan the published admission number capacity will be used as this gives a clearer picture of how many school places are available as it is based on how a school is organised rather that a formulaic calculation.
School Organisation Plan – 2014
10
Primary Places at September 2014
school type Number on Roll
Physical Capacity
Empty Places
% surplus
Admissions Capacity
Empty Places
% surplus
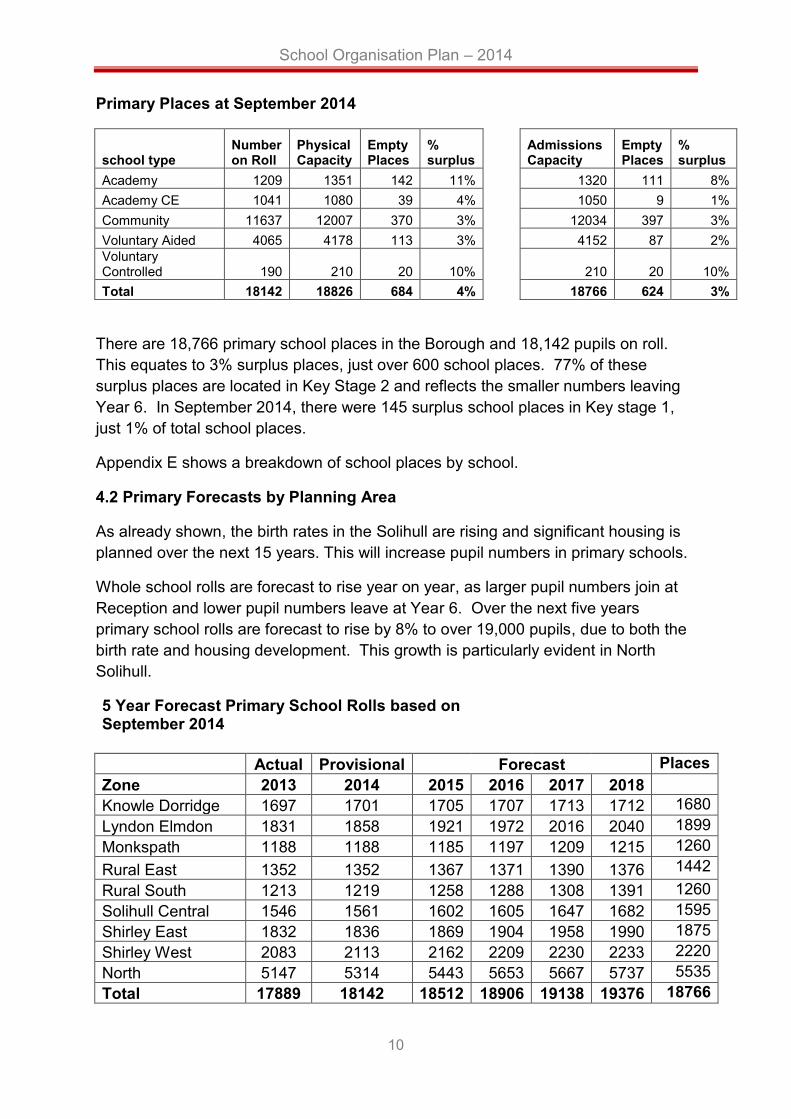
Academy 1209 1351 142 11% 1320 111 8% Academy CE 1041 1080 39 4% 1050 9 1% Community 11637 12007 370 3% 12034 397 3% Voluntary Aided 4065 4178 113 3% 4152 87 2% Voluntary Controlled 190 210 20 10% 210 20 10% Total 18142 18826 684 4% 18766 624 3%
There are 18,766 primary school places in the Borough and 18,142 pupils on roll. This equates to 3% surplus places, just over 600 school places. 77% of these surplus places are located in Key Stage 2 and reflects the smaller numbers leaving Year 6. In September 2014, there were 145 surplus school places in Key stage 1, just 1% of total school places.
Appendix E shows a breakdown of school places by school.
4.2 Primary Forecasts by Planning Area
As already shown, the birth rates in the Solihull are rising and significant housing is planned over the next 15 years. This will increase pupil numbers in primary schools.
Whole school rolls are forecast to rise year on year, as larger pupil numbers join at Reception and lower pupil numbers leave at Year 6. Over the next five years primary school rolls are forecast to rise by 8% to over 19,000 pupils, due to both the birth rate and housing development. This growth is particularly evident in North Solihull.
5 Year Forecast Primary School Rolls based on September 2014
Actual Provisional Forecast Places Zone 2013 2014 2015 2016 2017 2018 Knowle Dorridge 1697 1701 1705 1707 1713 1712 1680 Lyndon Elmdon 1831 1858 1921 1972 2016 2040 1899 Monkspath 1188 1188 1185 1197 1209 1215 1260 Rural East 1352 1352 1367 1371 1390 1376 1442 Rural South 1213 1219 1258 1288 1308 1391 1260 Solihull Central 1546 1561 1602 1605 1647 1682 1595 Shirley East 1832 1836 1869 1904 1958 1990 1875 Shirley West 2083 2113 2162 2209 2230 2233 2220 North 5147 5314 5443 5653 5667 5737 5535 Total 17889 18142 18512 18906 19138 19376 18766
School Organisation Plan – 2014
11
Based on these forecasts, compared to the number of places, 600 primary school places will need to be added by September 2018. In reality, it will need to be significantly more, as housing developments and increasing births will affect particular planning areas whilst spare places may be available in schools in other areas. In addition housing developments are phased with housing release expected at about 50 units per site per year so the impact of a housing development will continue to increase whole school rolls for a number of years post 2018.
Appendix F gives a detailed breakdown for each planning area of the impact of the rising birth rate and the known housing development on the level of school places and gives an indication whether additional primary school places will be required.
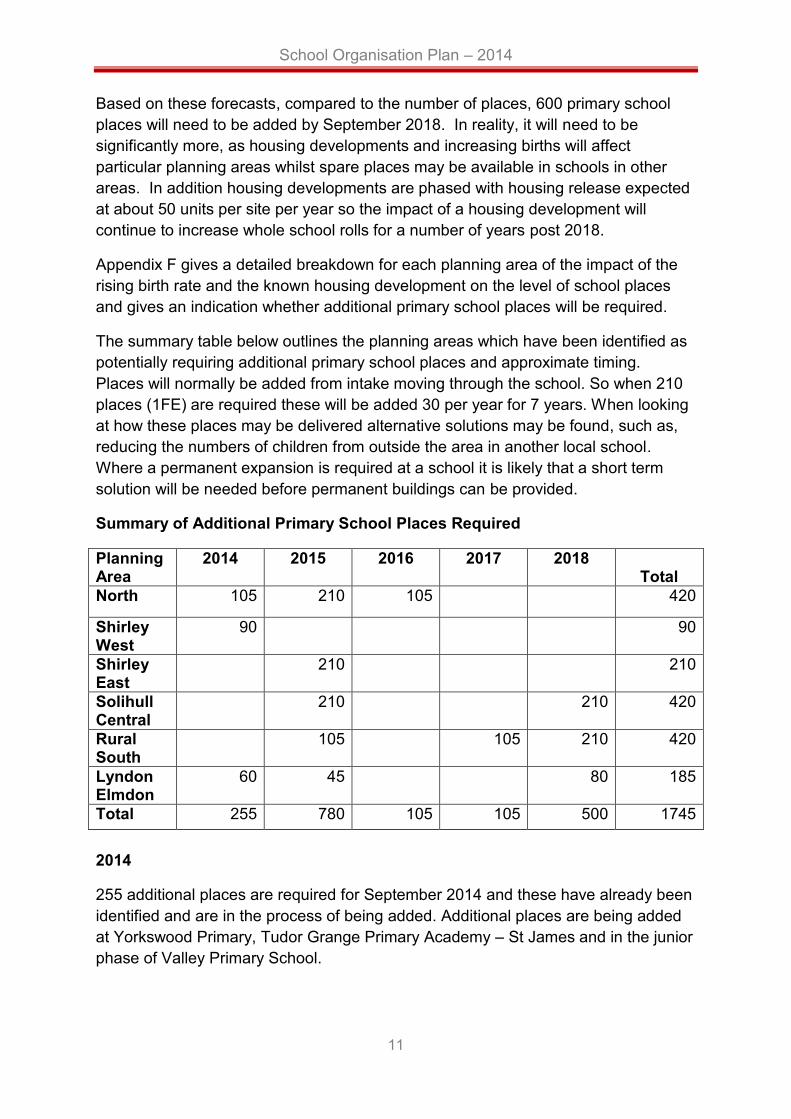
The summary table below outlines the planning areas which have been identified as potentially requiring additional primary school places and approximate timing. Places will normally be added from intake moving through the school. So when 210 places (1FE) are required these will be added 30 per year for 7 years. When looking at how these places may be delivered alternative solutions may be found, such as, reducing the numbers of children from outside the area in another local school. Where a permanent expansion is required at a school it is likely that a short term solution will be needed before permanent buildings can be provided.
Summary of Additional Primary School Places Required
Planning Area
2014 2015 2016 2017 2018 Total
North 105 210 105 420
Shirley West
90 90
Shirley East
210 210
Solihull Central
210 210 420
Rural South
105 105 210 420
Lyndon Elmdon
60 45 80 185
Total 255 780 105 105 500 1745 2014
255 additional places are required for September 2014 and these have already been identified and are in the process of being added. Additional places are being added at Yorkswood Primary, Tudor Grange Primary Academy – St James and in the junior phase of Valley Primary School.
School Organisation Plan – 2014
12
2015
A further 780 places will need to be added from September 2015, this means the addition of up to 120 Reception places (4FE). 210 (1FE) places are being added across Coleshill Heath and Fordbridge Schools through the new buildings provided as part of the North Solihull Primary Programme. The remaining places located in the South of the Borough will need to be identified through discussions with schools during the Autumn Term of 2014, or, where it is not possible to offer additional places due to timing or planning and site restrictions, then alternative solutions will need to be explored.
2016
The completion of work at Kingshurst Primary School and Yorkswood Primary School will deliver a further 105 places required in North Solihull.
2017/2018 onwards
By 2017/18 it is anticipated that sites identified in Phase One of the Council’s Local Develop Plan will have been brought forward for development and these sites will require additional primary school places. Sites are identified for Solihull Central and Rural South. Progress on the sites will be monitored carefully and discussions with schools will commence at the earliest opportunity. In addition where it is assumed that some expansions will be carried out in phases the second phase of those expansions will need to be added.
5. Secondary School Places (Years 7 to 11)
At September 2014, Solihull Council has 14 secondary schools made up of 1 community, 1 voluntary aided, 1 trust and 11 academies.
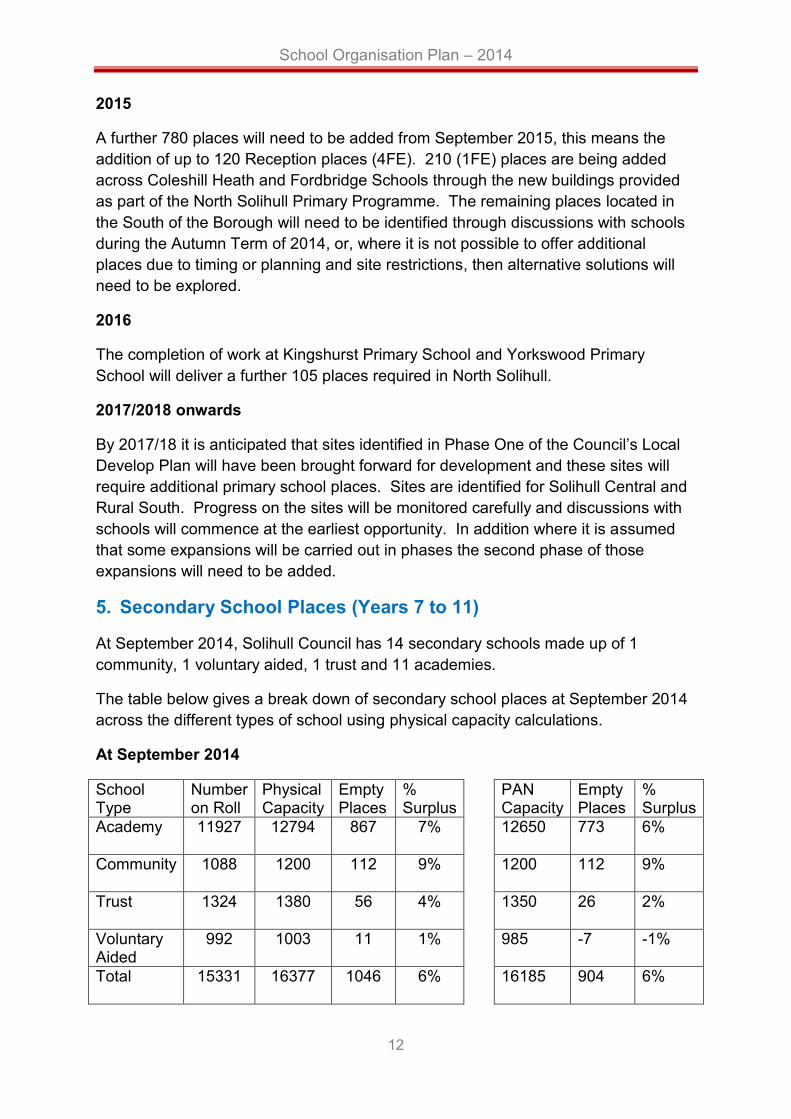
The table below gives a break down of secondary school places at September 2014 across the different types of school using physical capacity calculations.
At September 2014
School Type
Number on Roll
Physical Capacity
Empty Places
% Surplus
PAN Capacity
Empty Places
% Surplus
Academy
11927 12794 867 7% 12650 773 6%
Community
1088 1200 112 9% 1200 112 9%
Trust
1324 1380 56 4% 1350 26 2%
Voluntary Aided
992 1003 11 1% 985 -7 -1%
Total
15331 16377 1046 6% 16185 904 6%
School Organisation Plan – 2014
13
Based on the PAN capacity of secondary schools there are over 900 (6%) surplus secondary school places in Solihull, this reflects that secondary school intakes have been falling year on year until they reached their lowest point at the 2013 intake.
Secondary School Forecasts by Planning Area
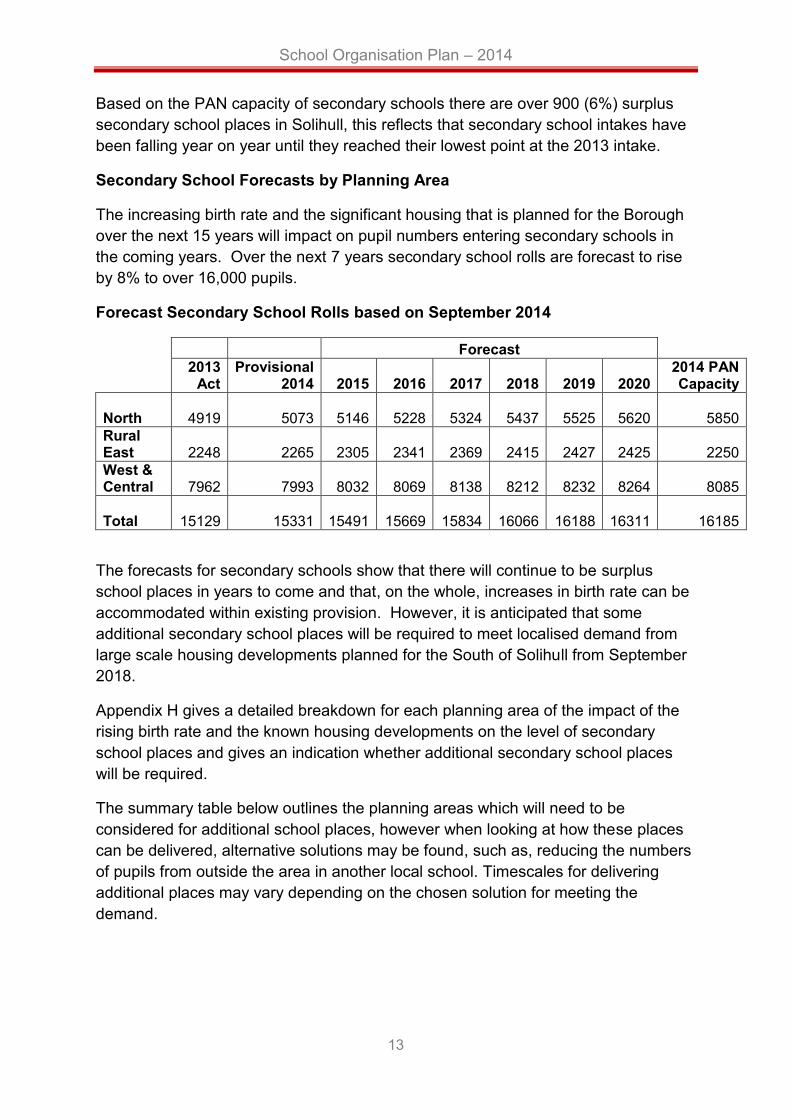
The increasing birth rate and the significant housing that is planned for the Borough over the next 15 years will impact on pupil numbers entering secondary schools in the coming years. Over the next 7 years secondary school rolls are forecast to rise by 8% to over 16,000 pupils.
Forecast Secondary School Rolls based on September 2014
Forecast
2013 Act
Provisional 2014 2015 2016 2017 2018 2019 2020
2014 PAN Capacity
North 4919 5073 5146 5228 5324 5437 5525 5620
5850 Rural East 2248 2265 2305 2341 2369 2415 2427 2425
2250
West & Central 7962 7993 8032 8069 8138 8212 8232 8264
8085
Total 15129 15331 15491 15669 15834 16066 16188 16311
16185
The forecasts for secondary schools show that there will continue to be surplus school places in years to come and that, on the whole, increases in birth rate can be accommodated within existing provision. However, it is anticipated that some additional secondary school places will be required to meet localised demand from large scale housing developments planned for the South of Solihull from September 2018.
Appendix H gives a detailed breakdown for each planning area of the impact of the rising birth rate and the known housing developments on the level of secondary school places and gives an indication whether additional secondary school places will be required.
The summary table below outlines the planning areas which will need to be considered for additional school places, however when looking at how these places can be delivered, alternative solutions may be found, such as, reducing the numbers of pupils from outside the area in another local school. Timescales for delivering additional places may vary depending on the chosen solution for meeting the demand.
School Organisation Plan – 2014
14
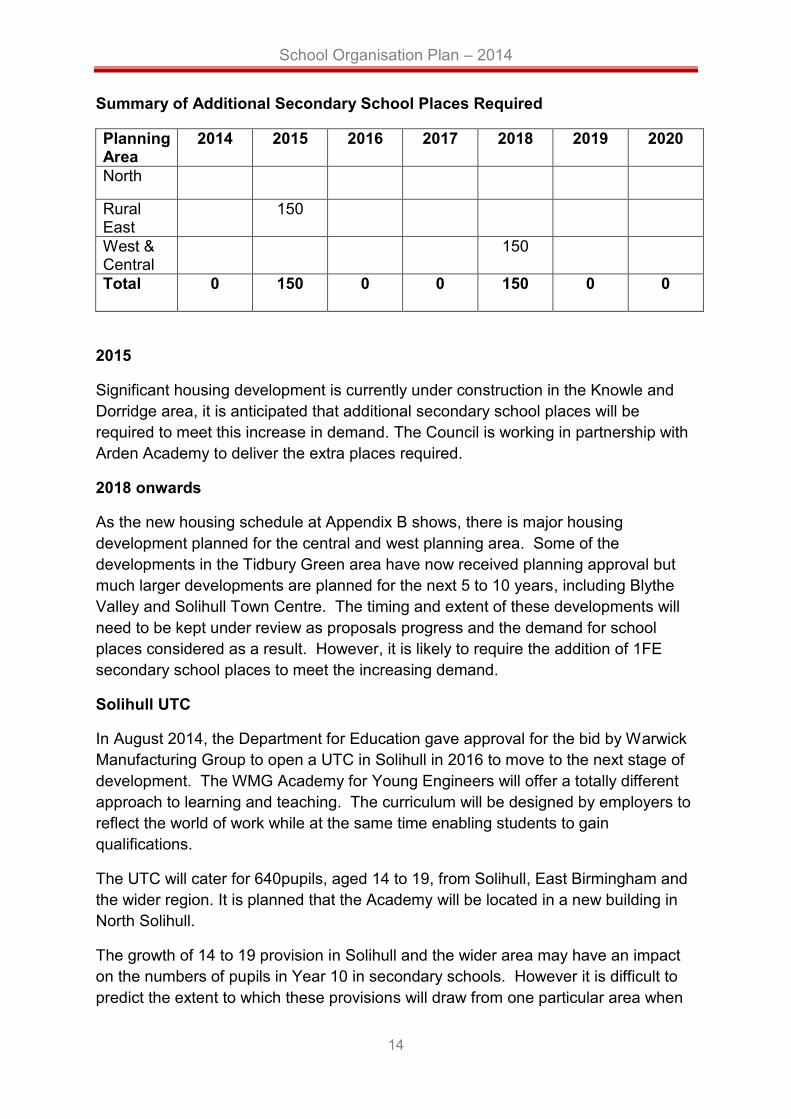
Summary of Additional Secondary School Places Required
Planning Area
2014 2015 2016 2017 2018 2019 2020
North
Rural East
150
West & Central
150
Total
0 150 0 0 150 0 0
2015
Significant housing development is currently under construction in the Knowle and Dorridge area, it is anticipated that additional secondary school places will be required to meet this increase in demand. The Council is working in partnership with Arden Academy to deliver the extra places required.
2018 onwards
As the new housing schedule at Appendix B shows, there is major housing development planned for the central and west planning area. Some of the developments in the Tidbury Green area have now received planning approval but much larger developments are planned for the next 5 to 10 years, including Blythe Valley and Solihull Town Centre. The timing and extent of these developments will need to be kept under review as proposals progress and the demand for school places considered as a result. However, it is likely to require the addition of 1FE secondary school places to meet the increasing demand.
Solihull UTC
In August 2014, the Department for Education gave approval for the bid by Warwick Manufacturing Group to open a UTC in Solihull in 2016 to move to the next stage of development. The WMG Academy for Young Engineers will offer a totally different approach to learning and teaching. The curriculum will be designed by employers to reflect the world of work while at the same time enabling students to gain qualifications.
The UTC will cater for 640pupils, aged 14 to 19, from Solihull, East Birmingham and the wider region. It is planned that the Academy will be located in a new building in North Solihull.
The growth of 14 to 19 provision in Solihull and the wider area may have an impact on the numbers of pupils in Year 10 in secondary schools. However it is difficult to predict the extent to which these provisions will draw from one particular area when
School Organisation Plan – 2014
15
their admission criteria covers a wide geographical area. Further work will be required as these provisions are established to review parental preference and demand.
Post –16 Provision
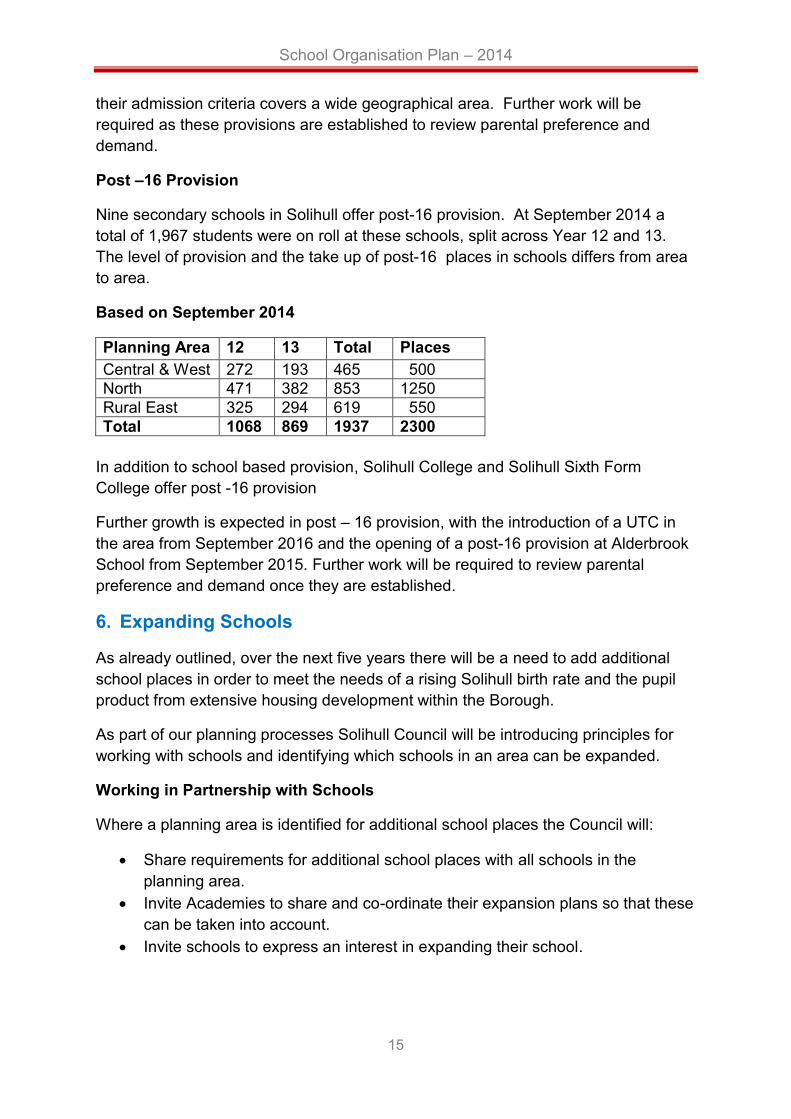
Nine secondary schools in Solihull offer post-16 provision. At September 2014 a total of 1,967 students were on roll at these schools, split across Year 12 and 13. The level of provision and the take up of post-16 places in schools differs from area to area.
Based on September 2014
Planning Area 12 13 Total Places Central & West 272 193 465 500 North 471 382 853 1250 Rural East 325 294 619 550 Total 1068 869 1937 2300
In addition to school based provision, Solihull College and Solihull Sixth Form College offer post -16 provision
Further growth is expected in post – 16 provision, with the introduction of a UTC in the area from September 2016 and the opening of a post-16 provision at Alderbrook School from September 2015. Further work will be required to review parental preference and demand once they are established.
6. Expanding Schools
As already outlined, over the next five years there will be a need to add additional school places in order to meet the needs of a rising Solihull birth rate and the pupil product from extensive housing development within the Borough.
As part of our planning processes Solihull Council will be introducing principles for working with schools and identifying which schools in an area can be expanded.
Working in Partnership with Schools
Where a planning area is identified for additional school places the Council will:
Share requirements for additional school places with all schools in the planning area.
Invite Academies to share and co-ordinate their expansion plans so that these can be taken into account.
Invite schools to express an interest in expanding their school.

School Organisation Plan – 2014
16
Criteria for Expansion
Expressions of interest in expansion from schools will be evaluated against the following key criteria:
Location in relation to demand, how well the additional places are located to meet the growth.
Standards in the school: in line with the National Agenda it is expected that schools that expand will be Outstanding or Good. Where no solution to a requirement for additional places can be found that meets this criterion, consideration will be given to expansion solutions where a school can evidence sufficient leadership capacity and standards at the school are improving towards good.
The capacity of the school to provide suitable accommodation on the site, within the context of the School’s Asset Management Plan.
Popularity of the school Potential of any expansion to create over provisions or reduce diversity of
provision in an area. The relative value for money of different options.
Impact on School Buildings
When considering school expansions careful consideration will need to be given to the capacity of a school building and site to meet the need of additional children. In line with the Solihull Schools Asset Management Plan we aim to:
Make optimum use of existing space, buildings and sites to provide sufficient, suitable and high quality additional school places where needed.
Work with Academies to meet Basic Need through their expansion plans. Allocate capital investment, through the Children’s Service Capital
Programme, effectively and efficiently to areas where the requirement for additional school places can only be met through either re-modelling, refurbishment or new build projects, ensuring that the needs of our most vulnerable young people are prioritised and capital projects make best use of existing resources.
Identify alternative funding sources and models to deliver requirements including Section 106, school contributions, bidding opportunities, LCVAP, Community Infrastructure Levy, future basic need allocations, diversion of other Capital funding.
Whenever possible, additional places to meet basic need demand, will be introduced at the start of a Phase e.g., in Reception and Year 7.

School Organisation Plan – 2014
17
Process
The School Organisation guidance (January 2014) details the steps required for proposers to make changes to schools, whether that is the Council or a school governing body.
Although there is no longer a statutory requirement to carry out consultation prior to publishing proposals, there is a strong expectation that Schools and Councils will consult with interested parties when developing proposals before determining how to proceed. The Council will continue to carry out consultation when considering making changes to schools.
Decisions that fall to the Council will be considered by the Council’s Cabinet within 2 months of the end of the statutory process.
7. Funding
The expansion of school places will require significant investment in school buildings and the Council will need to identify how these resources can be met and allocated. The Schools Asset Management Plan sets out the context for this.
Annually the Council submits a return to the DfE called the School Capacity and Projections return (SCAP). This return is used to assess the Council’s future Capital requirements for basic need funding to add additional school places. Any capital allocated will be used to fund the school expansions required to meet the increasing demand for school places. However, the Council will need to maximise alternative funding sources such as S106 funding in order to deliver the expansions required.
For revenue funding purposes, the Council holds a growth fund contingency. Criteria for accessing the growth fund have been approved by School Forum. Where additional classes are being created in a school to meet basic need, schools will be considered against the criteria for growth fund and identified for additional revenue funding. Details of payments from the growth fund will be reported to school forum annually. The criteria for accessing the growth fund can be found at Appendix I.
School Organisation Plan – 2014
18
8. Appendices
Appendix A – ONS Birth Data by Ward
Appendix B – Planned Housing Developments
Appendix C – Section 106 Methodology
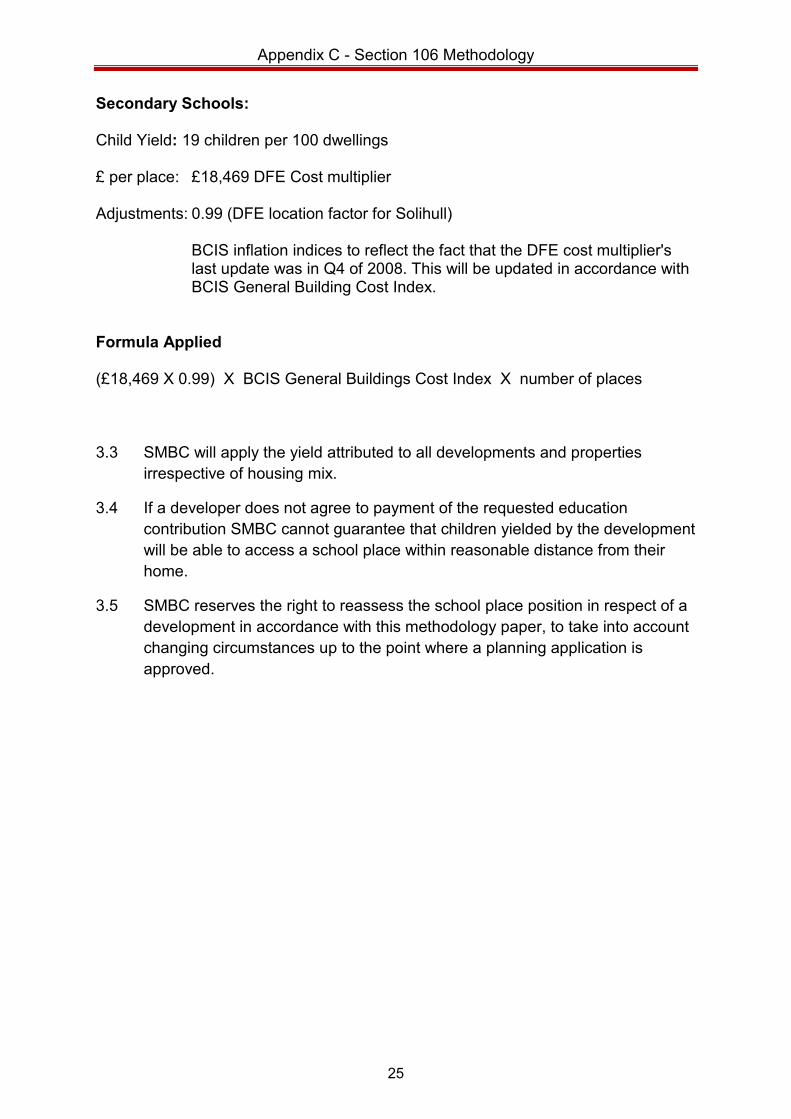
Appendix Di – Primary Schools by Planning Area
Appendix Dii – Secondary Schools by Planning Area
Appendix E – Primary School Capacity and Surplus School Places
Appendix F – Primary School Forecast School Rolls by Planning Area
Appendix G – Secondary School Capacity and Surplus School Places
Appendix H – Secondary School Forecast School Rolls by Planning Area
Appendix I – Growth Funding Criteria
Appendix A - ONS Data by Ward
19
Year 7 2015 2016 2017 2018 2019 2020 2021 2022 2023 % increase/ decrease Reception 2008/9 2009/10 2010/11 2011/12 2012/13 2013/14 2014/15 2015/16 2016/17
Birth Year 2004 2005 2006 2007 2008 2009 2010 2011 2012 Bickenhill 167 127 137 128 141 144 128 169 143 -14% Blythe 129 150 160 158 158 132 126 142 140 9% Castle Bromwich 82 68 73 67 80 93 80 87 83 1% Chelmsley Wood 204 187 223 234 197 221 215 266 236 16% Dorridge and Hockley Heath 84 79 99 102 94 75 83 76 87 4% Elmdon 112 118 120 108 131 125 128 139 119 6% Kingshurst and Fordbridge 174 211 199 209 193 219 217 205 204 17% Knowle 67 79 80 56 76 62 85 68 80 19% Lyndon 115 139 136 154 137 137 167 171 164 43% Meriden 92 96 102 98 92 67 99 107 100 9% Olton 117 102 84 114 138 98 135 128 123 5% St Alphege 77 96 80 81 88 87 102 102 98 27% Shirley East 96 110 117 114 114 111 95 112 113 18% Shirley South 74 88 103 89 104 106 105 103 113 53% Shirley West 121 118 118 127 127 133 146 137 139 15% Silhill 90 81 82 94 111 123 131 137 130 44% Smith's Wood 191 179 197 222 191 188 194 218 196 3% Total 1992 2028 2110 2155 2172 2121 2236 2367 2268 14%
NB Bickenhill Ward is located across North and South Solihull so a proportion of the cohort is used to calculate North and South birth rates.
Appendix B - Planned Housing Developments
20
LDP Site Address Number Units Phase
Primary Planning Area
Secondary Planning Area
Planning Application status
Site 1 Land r/o Cooks Lane (formerly Foxglove Crescent) 70 1 North North
Site 3 Simon Digby 200 1 North North Site 4 Bishop Wilson 140 1 North North Approved under
construction
Site 5 Lowbrook Phase 2 (land off Oxford Grove) 75 1 North North
Site 6 Chester Road/Centurion ph 35 1 North North Site 7 Birmingham Road Fordbridge 38 1 North North Approved
Site 8 Solihull Town Centre-Herbert Road & Monkspath Hall Carpark 300 1 Solihull Central Central & West
Site 8 Touchwood II & Station Approach/Lode Lane 350 2 Solihull Central Central & West
Site 8 Station Approach/Mell square East/Other 300 3 Solihull Central Central & West
Site 9 Chelmsley Road Marston Green 80 1 North North Site 10 Blythe Valley Park 600 1,2&3 Rural South Central & West Site 11 Powergen 130 1 Shirley West Central & West Site 12 Four Ashes Road Bentley Heath 117 1 Knowle Dorridge Rural East Phase 1 & 2 under
construction
Site 13 Hampton Road Knowle 88 1 Knowle Dorridge Rural East Approved under construction
Site 14 Middlefield Knowle 115 1 Knowle Dorridge Rural East Site 15 Aqueduct Road 300 2 Shirley West Central & West Approved under
construction
Site 16 Moat House Farm Marston Green 134 1 North North approved under construction
Site 17 Land at Braggs Farm Rumbush Lane B90 1RB 71 Rural South Central & West Approved
Site 18 Griffin Lane 23 1 Rural South Central & West Approved under construction
Site 19 Ridings Hill Balsall Common 65 2 Rural East Rural East Site 20 Land at Dickens Heath Road 130 3 Rural South Central & West Approved
Site 21 Bloor Homes Land at Tanworth Lane Cheswick Green 200 Rural South Central & West Outline approval
Site 22 Land fronting Kenilworth Road Balsall Common 110 3 Rural East Rural East Application in
Site 23 Land between Kenilworth Road/Windmill Road 45 3 Rural East Rural East Application in
Site 24 Land off Meriden Road, Hampton in Arden 110 3 Rural East Rural East
*Site 2 has now been identified for the proposed Solihull UTC. Known Windfall Sites (over 10 dwellings)
LDP Site Address Number
Units Phase Primary Planning Area
Secondary Planning Area
Planning Application status
coleshill Heath School 100 North North Fordbridge School 100 North North Land at Kingfisher Drive B36 0SZ 26 North North Approved
Land rear of 26 Holly Lane Balsall Common 10 Rural East Rural East application in
Leys Lane Meriden 40 Rural East Rural East Approved 3/13 under construction
Potters Chicken Farm Friday Lane Catherine de Barnes 10 Rural East Rural East Approved 4/13 under
construction
Land rear of Saracens Head Magpie Lane Balsall Common 25 Rural East Rural East
205 Duggins Lane Berkwell 29 Rural East Rural East Approved June 2014
Johnsons Volvo Solihull Road Hampton in Arden 10 Rural East Rural East
Lowbrook Farm 200 Rural South Central & West Appeal pending
Marcity Devel 1036 Stratford Road Shirley B90 4EE
14 apartments Rural South Central & West under construction
Residential Devel Land at Tidbury Green Farm Fulford Hall Rd B90 1QZ 185 Rural South Central & West Appeal pending
193 Tanworth Lane, Shirley 12 Shirley West Central & West Approved Junction Windward Way/Chester Road 27 North North Approved Land off Chelmsley Road 46 North North Approved Land at Overgreen Drive 26 North North Approved
Appendix C - Section 106 Methodology
21
Solihull Council
Contributions towards education places – October 2013
Background
1.1 This document sets out the Solihull Council methodology used for claiming education contributions against housing developments which are projected to create a shortfall of places at schools within the local area of a development.
1.2 Solihull Local Authority has a statutory responsibility for the provision of sufficient school places for children residing in their area.
1.3 The Department for Education specifies that statutory walking distance is two miles for children aged under eight, and three miles for children aged eight and over. In determining the sufficiency of school places, Solihull LA will consider the implications for all schools within this geographical area from any new development, as well as the impact for the schools within whose catchment areas the development is proposed.
1.4 Current contextual information regarding Solihull Schools can be found within
the emerging School Organisation Plan.
1.5 This methodology refers to the provision of mainstream school places only. It does not relate to the planning of special needs school provision, nor independent school provision.
1.6 Pressure for additional school places can be created by an increase in the
birth rate, new housing developments, greater inward migration and parental choice of one school over another. If local schools are unable to meet this demand, a new development can have an adverse impact on the infrastructure of its local community.
1.7 R122 (2) of the Community Infrastructure Levy (CIL) regulations 2010 introduced three legal tests for planning obligations in respect of development that is capable of being charged CIL. This includes most buildings. From 6 April 2010 it has been unlawful for a planning obligation to be taken into account when determining a planning application for a development, or any part of a development, that is capable of being charged the levy, whether there is a local levy in operation or not, if the obligation does not meet all of the following tests:
necessary to make the development acceptable in planning terms directly related to the development fairly and reasonably related in scale and kind to the development
In addition, the R123 (3) of the CIL regulations 2010 scale back the way planning obligations operate. Limitations are also placed on the use of planning obligations in the following respects:
Appendix C - Section 106 Methodology
22
Ensuring the local use of the levy and planning obligations does not overlap; and
Limiting pooled contributions from planning obligations towards infrastructure which may be funded by the levy
At the time of writing, Solihull Council has not yet adopted a CIL charging schedule.
1.8 Where SMBC assess that a proposed development will create a full or partial shortfall of places in primary or secondary schools, a contribution will be sought from the developer, assessed in accordance with the methodology below.
1.9 Quality education provision is at the heart of sustainable communities and therefore, should be a fundamental consideration in the planning of all new housing developments. Where new housing development creates a demand for school places in excess of those available, the local authority will seek a financial contribution from the developers that is proportionate to impact in order to mitigate against the effect of any new development on local infrastructure. It is critical that developers make a financial contribution to school places where a need is identified as, without one, the local authority will be unable to ensure school places are accessible and this is like to impact on the children and families that come to settle in new developments.
Methodology for assessing contributions
2.1 Section 106 contributions will be sought for education places where the catchment schools and/or Solihull primary schools within 2 miles and/or Solihull secondary schools within 3 miles of the development are;
already over-subscribed, or projected to become over-subscribed within 5 years
2.2 Where a development will result in local schools becoming oversubscribed, SMBC will seek contributions from the developer to pay towards the associated capital costs of providing the additional school places. This will be calculated in accordance with the methodology at 3.2
2.3 Whilst SMBC seeks to provide additional places in existing schools wherever possible (to maintain stability in the existing school system, provide places in a timely fashion and to achieve best value for money), it may not always be feasible to expand one or more existing school(s). In such circumstances, a new school may be required to address the shortfall of places.
Appendix C - Section 106 Methodology
23
2.4 If a major new housing development is proposed, it may not be feasible to expand one or more existing schools. However, because the significant enlargement of an existing school or the establishment of a new school both require the authority to consult interested parties before making any decision, under we cannot always predetermine where the education contribution provided by a developer will be used to provide additional places at the time of the planning application. Wherever possible, an education contribution will be used within 3 miles of the development or at the catchment school.
2.5 Section 14 of the Education Act 1996 dictates that Solihull Metropolitan
Borough Council’s statutory obligation is to ensure that every child living in the borough is able to access a mainstream school place in Solihull. Some children have Special Educational Needs for which they access school provision outside of Solihull.
2.6 Where there are a number of developments within an area, each yielding an education contribution, SMBC may decide to pool contributions to provide places, where this accords with regulation 123 (3) of the Community Infrastructure Levy Regulations 2010.
2.7 If the development is large enough to justify the possibility of a new school, the developer may be asked to contribute a suitable school site as part of the development. The size of this site would be determined in accordance with DfE guidance.
Calculation
3.1 Contributions
Contributions will be assessed as follows: The schools within the reach of the development are determined. (The
catchment school and other schools within 2 miles for primary and 3 miles for secondary schools)
An assessment is undertaken, using: The number on roll; The latest net capacity of the schools; and The latest pupil projections
These projections take into account current numbers on roll, live births, inward/ outward migration to and from schools based upon recent patterns of attendance and planned housing contained within the Council’s Local Development Framework and Housing Land Supply Documentation. If a shortfall is identified at this point, the contribution sought would be for the full potential pupil yield of the development. Should there be sufficient places at this stage or only a partial shortfall of places identified, SMBC will also need to consider approved housing

Appendix C - Section 106 Methodology
24
developments (outside of the 5 year Housing Land Supply) which will impact upon one or more of the schools in the reach of the assessed development before reaching a conclusion on the expected shortfall of school places. Once a shortfall has been identified, a contribution will be calculated in accordance with the following:
3.2 Yield The analysis on which this yield is based on includes a cross section of Solihull conurbations taking into account mix of rural, urban and city locations. The sample used takes into account a range of large developments and individual dwellings. Primary Schools Child yield : 25 children per 100 dwellings £ per place: £12,257 DFE Cost multiplier Adjustments: 0.99 (DFE location factor for Solihull
BCIS inflation indices to reflect the fact that the cost multiplier's last update was in 2008. This will be updated in accordance with BCIS General Building Cost Index.
Formula Applied (£12,257 X 0.99) X BCIS General Buildings Cost Index X number of places
Appendix C - Section 106 Methodology
25
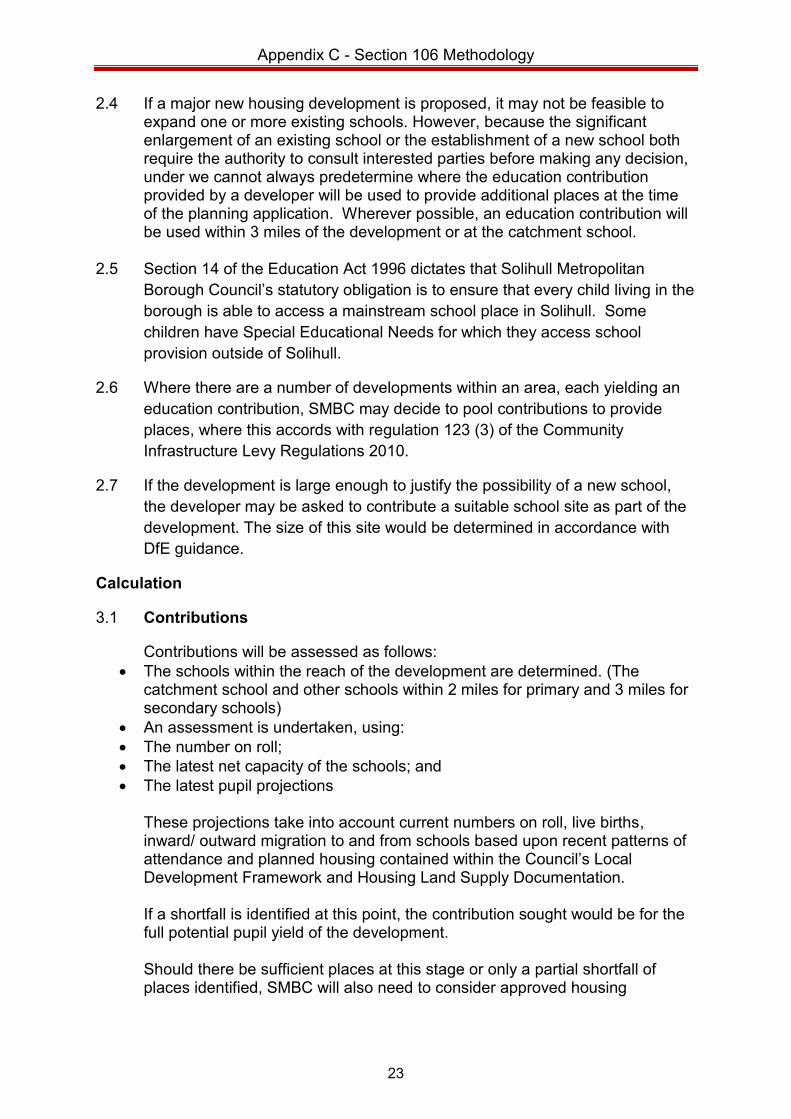
Secondary Schools: Child Yield: 19 children per 100 dwellings £ per place: £18,469 DFE Cost multiplier Adjustments: 0.99 (DFE location factor for Solihull)
BCIS inflation indices to reflect the fact that the DFE cost multiplier's last update was in Q4 of 2008. This will be updated in accordance with BCIS General Building Cost Index.
Formula Applied (£18,469 X 0.99) X BCIS General Buildings Cost Index X number of places 3.3 SMBC will apply the yield attributed to all developments and properties
irrespective of housing mix.
3.4 If a developer does not agree to payment of the requested education contribution SMBC cannot guarantee that children yielded by the development will be able to access a school place within reasonable distance from their home.
3.5 SMBC reserves the right to reassess the school place position in respect of a development in accordance with this methodology paper, to take into account changing circumstances up to the point where a planning application is approved.
Appendix Di - Primary Schools by Planning Area
26
Central Solihull Knowle and Dorridge Planning Area Coppice Junior School Bentley Heath CE Primary Damson Wood Infant School Dorridge Primary Greswold Primary School Knowle CE Primary Academy St Alphege CE Infant School St George & St Teresa Catholic School St Alphege CE Junior School Yew Tree Primary School Lyndon Elmdon Planning Area Monkspath Planning Area Chapelfields Junior School Cranmore Infant Daylesford Infant School Monkspath Primary School St Andrew's Catholic Primary School St Augustine's Catholic Primary St Margaret's CE Primary School Widney Junior School Ulverley Primary School Valley Primary School North Planning Area Rural East Planning Area Bishop Wilson CE Primary School Balsall Common Primary Castle Bromwich Infant School Berkswell CE School Castle Bromwich Junior School George Fentham Endowed School Coleshill Heath Primary School Lady Katherine Leveson CE Primary Fordbridge Primary School Meriden CE Primary Kingshurst Primary School Marston Green Infant Academy Rural South Planning Area Marston Green Junior School Cheswick Green Primary School St Anne's Catholic Primary Dickens Heath Primary School St Anthony's Catholic Primary Hockley Heath Primary School St John the Baptist Catholic Primary St Patrick's CE Primary Academy St Mary and St Margaret's CE Primary Tidbury Green Primary School Smith's Wood Primary Academy Windy Arbor Primary School Yorkswood Primary School Shirley East Planning Area Shirley West Planning Area Blossomfield Infant School Burman Infant School Kineton Green Primary School Haslucks Green Junior School Langley Primary School Mill Lodge Primary School Oak Cottage Primary School Our Lady of the Wayside Catholic School Our Lady of Compassion Catholic School Peterbrook Primary School Sharmans Cross Junior School Shirley Heath Junior School Streetsbrook Infant School Tudor Grange Primary Academy – St James Woodlands Infant School
Appendix Dii - Secondary Schools by Planning Area
27
Secondary Central and West Planning Area Alderbrook School Langley School Light Hall School Lode Heath School Lyndon School St Peter's Catholic School Tudor Grange Academy
Secondary North Planning Area
CTC Kingshurst Academy Grace Academy John Henry Newman Catholic College Park Hall Academy Smith's Wood Secondary School
Secondary Rural East Planning Area
Arden School Heart of England School
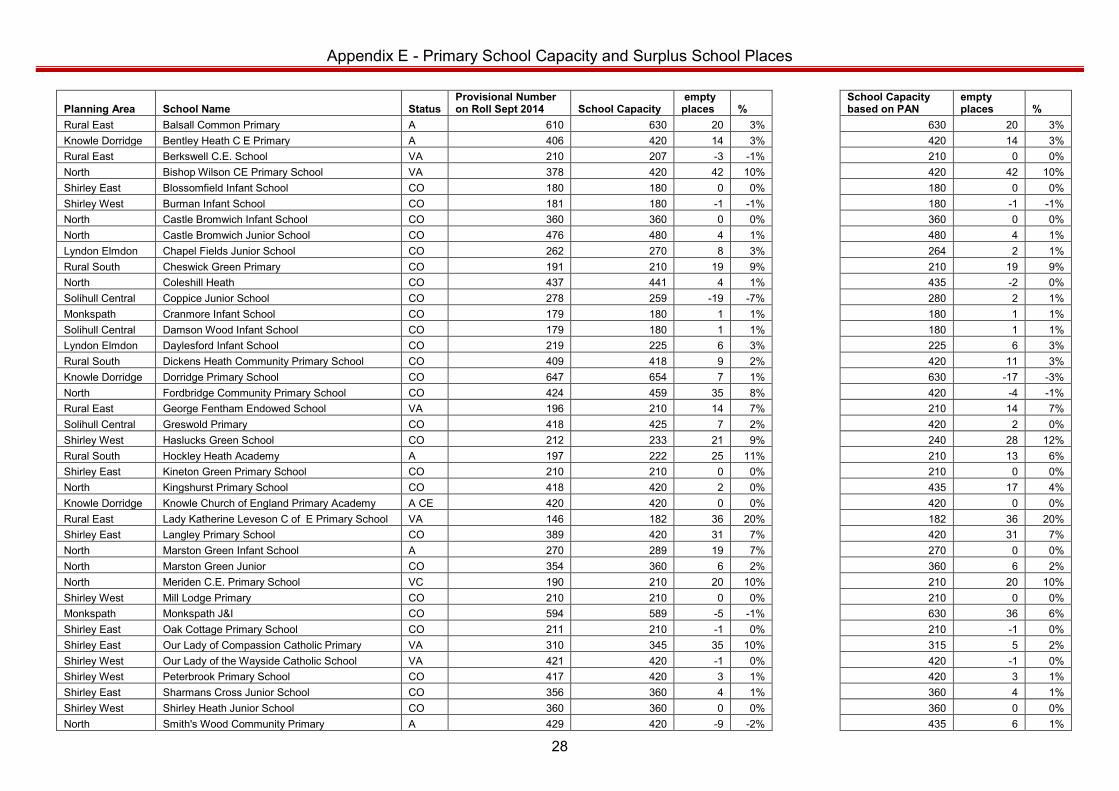
Appendix E - Primary School Capacity and Surplus School Places
28
Planning Area School Name Status Provisional Number on Roll Sept 2014 School Capacity
empty places %
School Capacity based on PAN
empty places %
Rural East Balsall Common Primary A 610 630 20 3%
630 20 3% Knowle Dorridge Bentley Heath C E Primary A 406 420 14 3%
420 14 3%
Rural East Berkswell C.E. School VA 210 207 -3 -1%
210 0 0% North Bishop Wilson CE Primary School VA 378 420 42 10%
420 42 10%
Shirley East Blossomfield Infant School CO 180 180 0 0%
180 0 0% Shirley West Burman Infant School CO 181 180 -1 -1%
180 -1 -1%
North Castle Bromwich Infant School CO 360 360 0 0%
360 0 0% North Castle Bromwich Junior School CO 476 480 4 1%
480 4 1%
Lyndon Elmdon Chapel Fields Junior School CO 262 270 8 3%
264 2 1% Rural South Cheswick Green Primary CO 191 210 19 9%
210 19 9%
North Coleshill Heath CO 437 441 4 1%
435 -2 0% Solihull Central Coppice Junior School CO 278 259 -19 -7%
280 2 1%
Monkspath Cranmore Infant School CO 179 180 1 1%
180 1 1% Solihull Central Damson Wood Infant School CO 179 180 1 1%
180 1 1%
Lyndon Elmdon Daylesford Infant School CO 219 225 6 3%
225 6 3% Rural South Dickens Heath Community Primary School CO 409 418 9 2%
420 11 3%
Knowle Dorridge Dorridge Primary School CO 647 654 7 1%
630 -17 -3% North Fordbridge Community Primary School CO 424 459 35 8%
420 -4 -1%
Rural East George Fentham Endowed School VA 196 210 14 7%
210 14 7% Solihull Central Greswold Primary CO 418 425 7 2%
420 2 0%
Shirley West Haslucks Green School CO 212 233 21 9%
240 28 12% Rural South Hockley Heath Academy A 197 222 25 11%
210 13 6%
Shirley East Kineton Green Primary School CO 210 210 0 0%
210 0 0% North Kingshurst Primary School CO 418 420 2 0%
435 17 4%
Knowle Dorridge Knowle Church of England Primary Academy A CE 420 420 0 0%
420 0 0% Rural East Lady Katherine Leveson C of E Primary School VA 146 182 36 20%
182 36 20%
Shirley East Langley Primary School CO 389 420 31 7%
420 31 7% North Marston Green Infant School A 270 289 19 7%
270 0 0%
North Marston Green Junior CO 354 360 6 2%
360 6 2% North Meriden C.E. Primary School VC 190 210 20 10%
210 20 10%
Shirley West Mill Lodge Primary CO 210 210 0 0%
210 0 0% Monkspath Monkspath J&I CO 594 589 -5 -1%
630 36 6%
Shirley East Oak Cottage Primary School CO 211 210 -1 0%
210 -1 0% Shirley East Our Lady of Compassion Catholic Primary VA 310 345 35 10%
315 5 2%
Shirley West Our Lady of the Wayside Catholic School VA 421 420 -1 0%
420 -1 0% Shirley West Peterbrook Primary School CO 417 420 3 1%
420 3 1%
Shirley East Sharmans Cross Junior School CO 356 360 4 1%
360 4 1% Shirley West Shirley Heath Junior School CO 360 360 0 0%
360 0 0%
North Smith's Wood Community Primary A 429 420 -9 -2%
435 6 1%
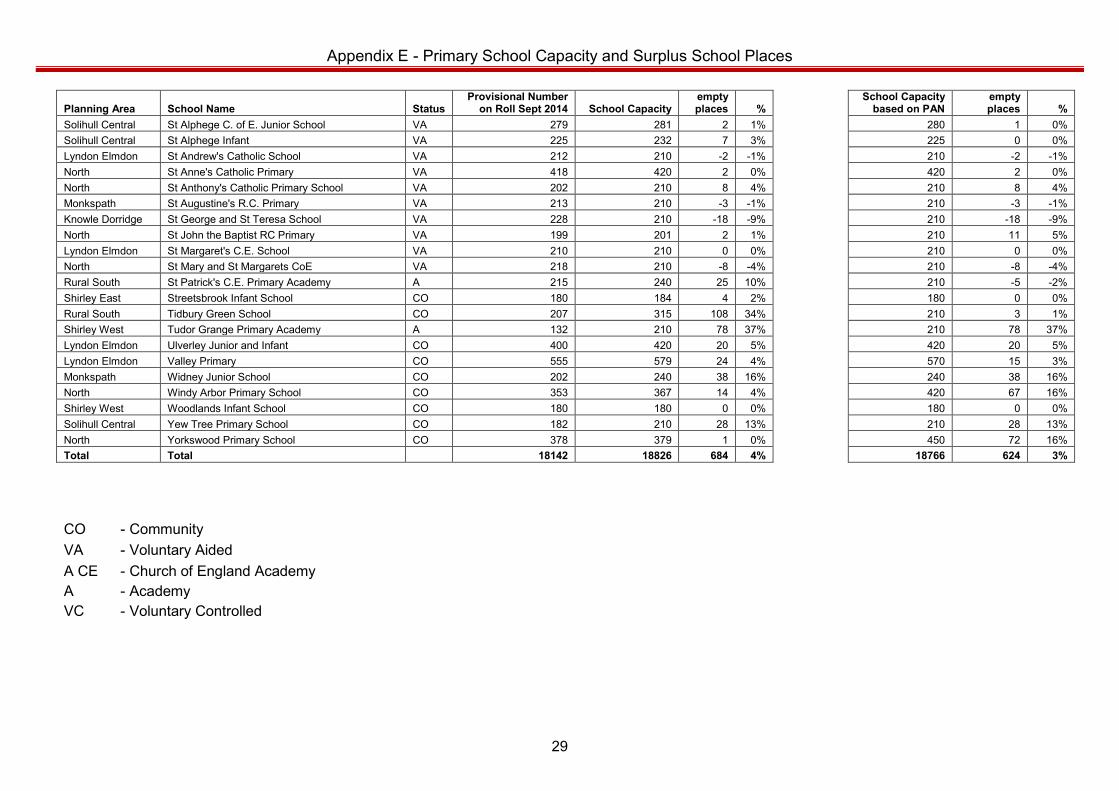
Appendix E - Primary School Capacity and Surplus School Places
29
Planning Area School Name Status Provisional Number
on Roll Sept 2014 School Capacity empty places %
School Capacity based on PAN
empty places %
Solihull Central St Alphege C. of E. Junior School VA 279 281 2 1%
280 1 0% Solihull Central St Alphege Infant VA 225 232 7 3%
225 0 0%
Lyndon Elmdon St Andrew's Catholic School VA 212 210 -2 -1%
210 -2 -1% North St Anne's Catholic Primary VA 418 420 2 0%
420 2 0%
North St Anthony's Catholic Primary School VA 202 210 8 4%
210 8 4% Monkspath St Augustine's R.C. Primary VA 213 210 -3 -1%
210 -3 -1%
Knowle Dorridge St George and St Teresa School VA 228 210 -18 -9%
210 -18 -9% North St John the Baptist RC Primary VA 199 201 2 1%
210 11 5%
Lyndon Elmdon St Margaret's C.E. School VA 210 210 0 0%
210 0 0% North St Mary and St Margarets CoE VA 218 210 -8 -4%
210 -8 -4%
Rural South St Patrick's C.E. Primary Academy A 215 240 25 10%
210 -5 -2% Shirley East Streetsbrook Infant School CO 180 184 4 2%
180 0 0%
Rural South Tidbury Green School CO 207 315 108 34%
210 3 1% Shirley West Tudor Grange Primary Academy A 132 210 78 37%
210 78 37%
Lyndon Elmdon Ulverley Junior and Infant CO 400 420 20 5%
420 20 5% Lyndon Elmdon Valley Primary CO 555 579 24 4%
570 15 3%
Monkspath Widney Junior School CO 202 240 38 16%
240 38 16% North Windy Arbor Primary School CO 353 367 14 4%
420 67 16%
Shirley West Woodlands Infant School CO 180 180 0 0%
180 0 0% Solihull Central Yew Tree Primary School CO 182 210 28 13%
210 28 13%
North Yorkswood Primary School CO 378 379 1 0%
450 72 16% Total Total 18142 18826 684 4%
18766 624 3%
CO - Community VA - Voluntary Aided A CE - Church of England Academy A - Academy VC - Voluntary Controlled
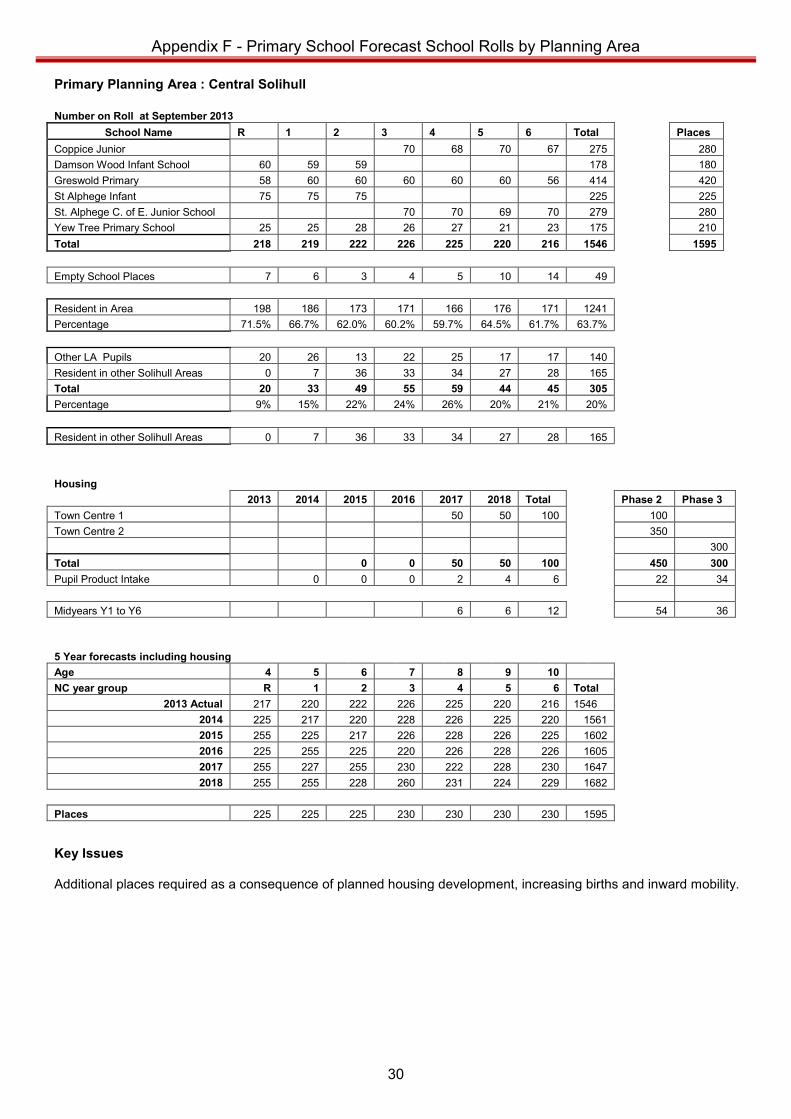
Appendix F - Primary School Forecast School Rolls by Planning Area
30
Primary Planning Area : Central Solihull
Number on Roll at September 2013 School Name R 1 2 3 4 5 6 Total Places
Coppice Junior 70 68 70 67 275 280 Damson Wood Infant School 60 59 59 178 180 Greswold Primary 58 60 60 60 60 60 56 414 420 St Alphege Infant 75 75 75 225 225 St. Alphege C. of E. Junior School 70 70 69 70 279 280 Yew Tree Primary School 25 25 28 26 27 21 23 175 210 Total 218 219 222 226 225 220 216 1546 1595
Empty School Places 7 6 3 4 5 10 14 49
Resident in Area 198 186 173 171 166 176 171 1241 Percentage 71.5% 66.7% 62.0% 60.2% 59.7% 64.5% 61.7% 63.7%
Other LA Pupils 20 26 13 22 25 17 17 140 Resident in other Solihull Areas 0 7 36 33 34 27 28 165 Total 20 33 49 55 59 44 45 305 Percentage 9% 15% 22% 24% 26% 20% 21% 20%
Resident in other Solihull Areas 0 7 36 33 34 27 28 165
Housing
2013 2014 2015 2016 2017 2018 Total
Phase 2 Phase 3
Town Centre 1 50 50 100 100 Town Centre 2
350
300 Total 0 0 50 50 100
450 300
Pupil Product Intake 0 0 0 2 4 6
22 34
Midyears Y1 to Y6
6 6 12
54 36
5 Year forecasts including housing Age 4 5 6 7 8 9 10
NC year group R 1 2 3 4 5 6 Total 2013 Actual 217 220 222 226 225 220 216 1546 2014 225 217 220 228 226 225 220 1561 2015 255 225 217 226 228 226 225 1602 2016 225 255 225 220 226 228 226 1605 2017 255 227 255 230 222 228 230 1647 2018 255 255 228 260 231 224 229 1682
Places 225 225 225 230 230 230 230 1595
Key Issues
Additional places required as a consequence of planned housing development, increasing births and inward mobility.
Appendix F - Primary School Forecast School Rolls by Planning Area
31
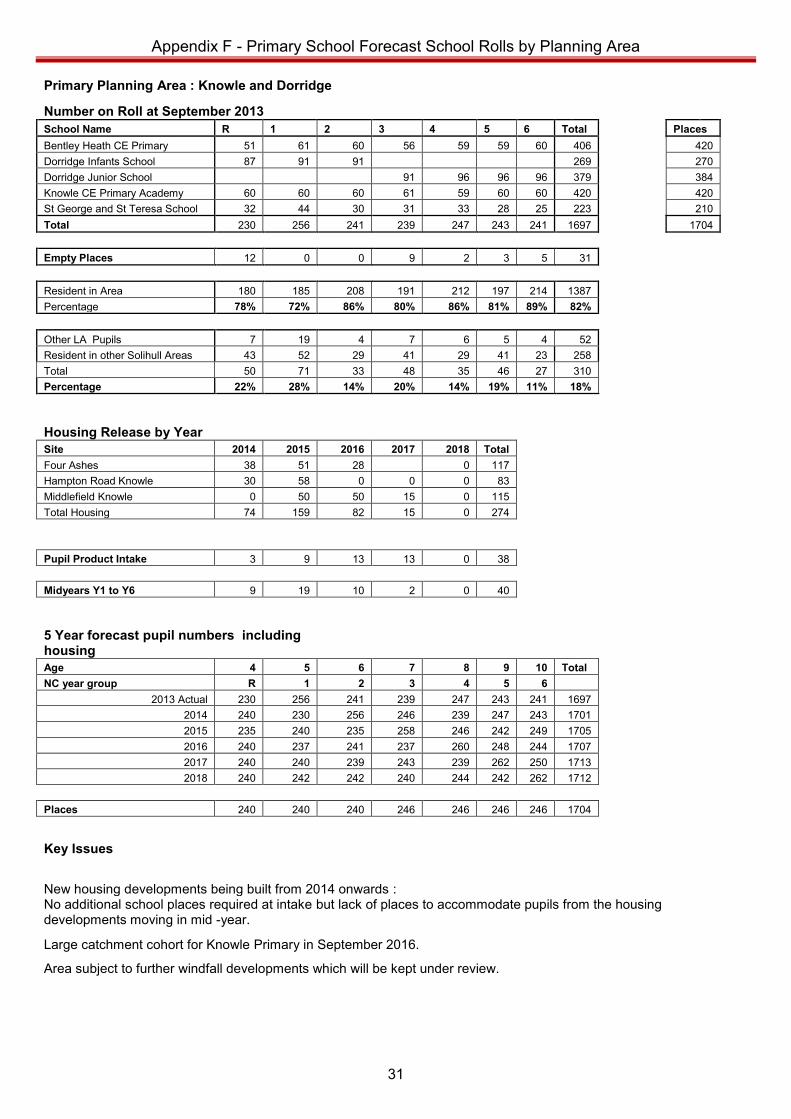
Primary Planning Area : Knowle and Dorridge
Number on Roll at September 2013
School Name R 1 2 3 4 5 6 Total
Places Bentley Heath CE Primary 51 61 60 56 59 59 60 406
420
Dorridge Infants School 87 91 91 269
270 Dorridge Junior School 91 96 96 96 379
384
Knowle CE Primary Academy 60 60 60 61 59 60 60 420
420 St George and St Teresa School 32 44 30 31 33 28 25 223
210
Total 230 256 241 239 247 243 241 1697
1704
Empty Places 12 0 0 9 2 3 5 31
Resident in Area 180 185 208 191 212 197 214 1387 Percentage 78% 72% 86% 80% 86% 81% 89% 82%
Other LA Pupils 7 19 4 7 6 5 4 52 Resident in other Solihull Areas 43 52 29 41 29 41 23 258 Total 50 71 33 48 35 46 27 310 Percentage 22% 28% 14% 20% 14% 19% 11% 18%
Housing Release by Year
Site 2014 2015 2016 2017 2018 Total Four Ashes 38 51 28 0 117 Hampton Road Knowle 30 58 0 0 0 83 Middlefield Knowle 0 50 50 15 0 115 Total Housing 74 159 82 15 0 274
Pupil Product Intake 3 9 13 13 0 38
Midyears Y1 to Y6 9 19 10 2 0 40
5 Year forecast pupil numbers including
housing Age 4 5 6 7 8 9 10 Total
NC year group R 1 2 3 4 5 6 2013 Actual 230 256 241 239 247 243 241 1697 2014 240 230 256 246 239 247 243 1701 2015 235 240 235 258 246 242 249 1705 2016 240 237 241 237 260 248 244 1707 2017 240 240 239 243 239 262 250 1713 2018 240 242 242 240 244 242 262 1712
Places 240 240 240 246 246 246 246 1704
Key Issues
New housing developments being built from 2014 onwards :
No additional school places required at intake but lack of places to accommodate pupils from the housing developments moving in mid -year.
Large catchment cohort for Knowle Primary in September 2016.
Area subject to further windfall developments which will be kept under review.
Appendix F - Primary School Forecast School Rolls by Planning Area
32
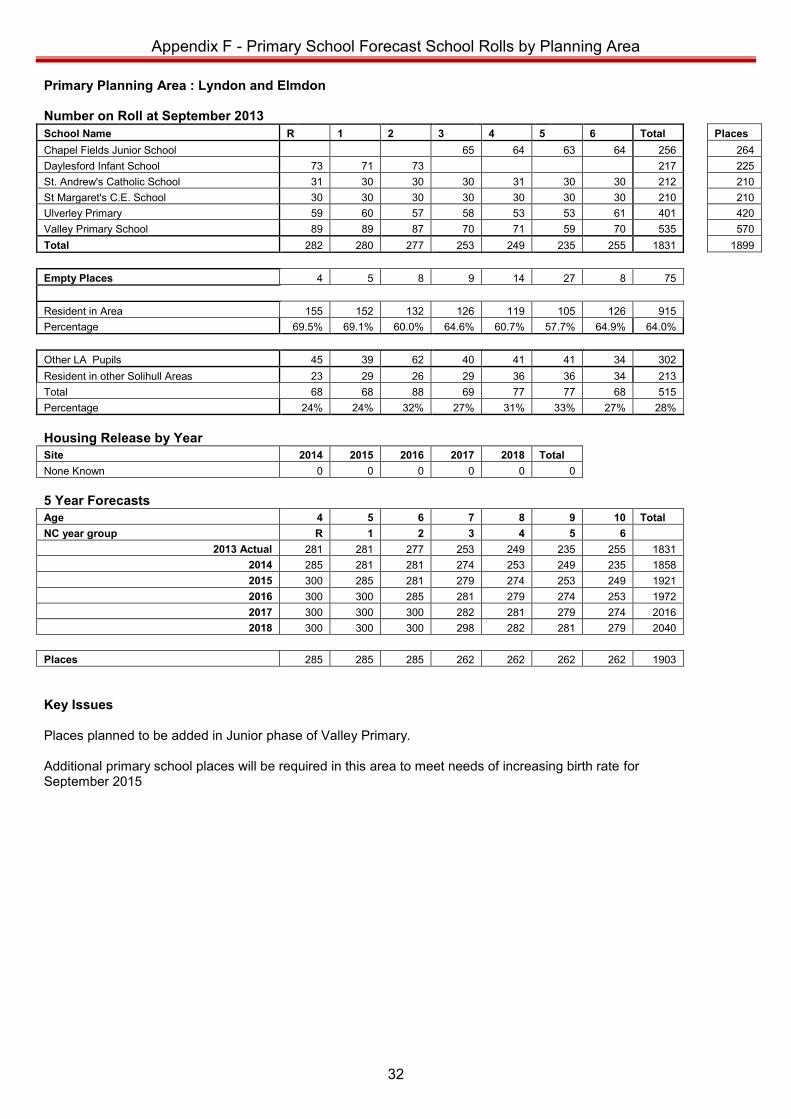
Primary Planning Area : Lyndon and Elmdon
Number on Roll at September 2013
School Name R 1 2 3 4 5 6 Total
Places Chapel Fields Junior School 65 64 63 64 256
264
Daylesford Infant School 73 71 73 217
225 St. Andrew's Catholic School 31 30 30 30 31 30 30 212
210
St Margaret's C.E. School 30 30 30 30 30 30 30 210
210 Ulverley Primary 59 60 57 58 53 53 61 401
420
Valley Primary School 89 89 87 70 71 59 70 535
570 Total 282 280 277 253 249 235 255 1831
1899
Empty Places 4 5 8 9 14 27 8 75
Resident in Area 155 152 132 126 119 105 126 915 Percentage 69.5% 69.1% 60.0% 64.6% 60.7% 57.7% 64.9% 64.0%
Other LA Pupils 45 39 62 40 41 41 34 302 Resident in other Solihull Areas 23 29 26 29 36 36 34 213 Total 68 68 88 69 77 77 68 515 Percentage 24% 24% 32% 27% 31% 33% 27% 28%
Housing Release by Year Site 2014 2015 2016 2017 2018 Total
None Known 0 0 0 0 0 0
5 Year Forecasts Age 4 5 6 7 8 9 10 Total
NC year group R 1 2 3 4 5 6 2013 Actual 281 281 277 253 249 235 255 1831 2014 285 281 281 274 253 249 235 1858 2015 300 285 281 279 274 253 249 1921 2016 300 300 285 281 279 274 253 1972 2017 300 300 300 282 281 279 274 2016 2018 300 300 300 298 282 281 279 2040
Places 285 285 285 262 262 262 262 1903
Key Issues
Places planned to be added in Junior phase of Valley Primary.
Additional primary school places will be required in this area to meet needs of increasing birth rate for
September 2015
Appendix F - Primary School Forecast School Rolls by Planning Area
33
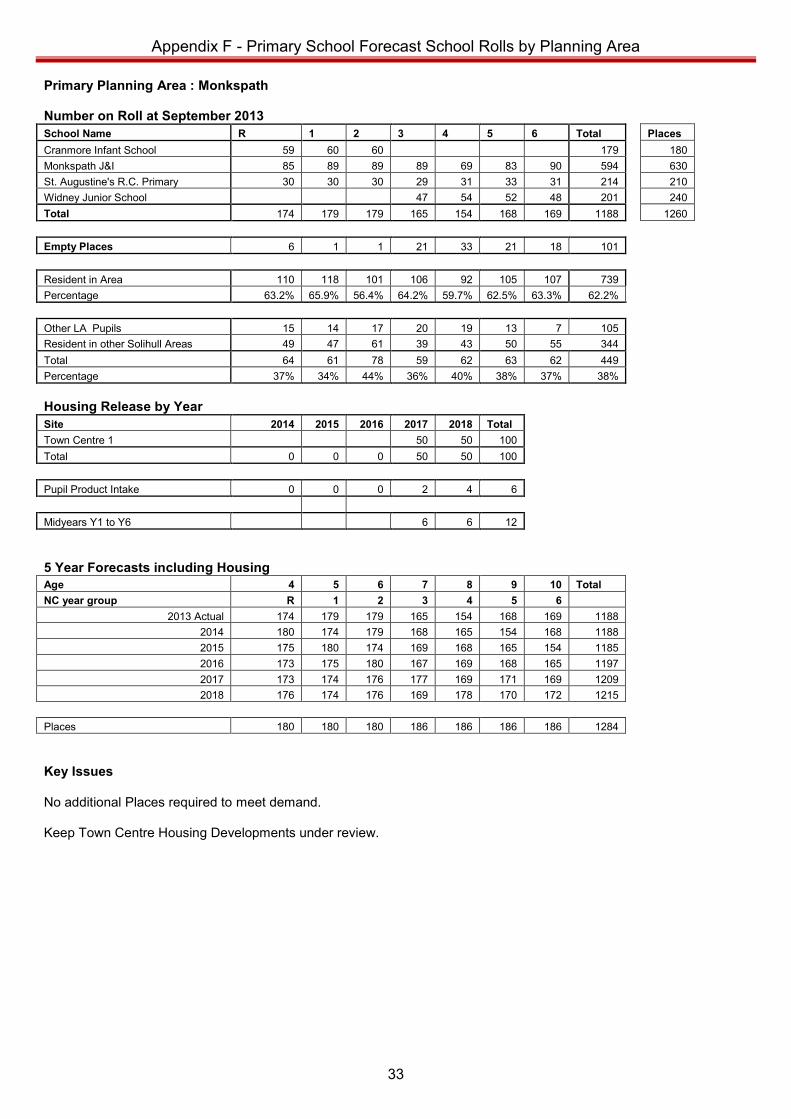
Primary Planning Area : Monkspath
Number on Roll at September 2013 School Name R 1 2 3 4 5 6 Total
Places
Cranmore Infant School 59 60 60 179
180 Monkspath J&I 85 89 89 89 69 83 90 594
630
St. Augustine's R.C. Primary 30 30 30 29 31 33 31 214
210 Widney Junior School 47 54 52 48 201
240
Total 174 179 179 165 154 168 169 1188
1260
Empty Places 6 1 1 21 33 21 18 101
Resident in Area 110 118 101 106 92 105 107 739 Percentage 63.2% 65.9% 56.4% 64.2% 59.7% 62.5% 63.3% 62.2%
Other LA Pupils 15 14 17 20 19 13 7 105 Resident in other Solihull Areas 49 47 61 39 43 50 55 344 Total 64 61 78 59 62 63 62 449 Percentage 37% 34% 44% 36% 40% 38% 37% 38%
Housing Release by Year Site 2014 2015 2016 2017 2018 Total
Town Centre 1 50 50 100 Total 0 0 0 50 50 100
Pupil Product Intake 0 0 0 2 4 6
Midyears Y1 to Y6 6 6 12
5 Year Forecasts including Housing
Age 4 5 6 7 8 9 10 Total NC year group R 1 2 3 4 5 6 2013 Actual 174 179 179 165 154 168 169 1188 2014 180 174 179 168 165 154 168 1188 2015 175 180 174 169 168 165 154 1185 2016 173 175 180 167 169 168 165 1197 2017 173 174 176 177 169 171 169 1209 2018 176 174 176 169 178 170 172 1215
Places 180 180 180 186 186 186 186 1284
Key Issues
No additional Places required to meet demand. Keep Town Centre Housing Developments under review.
Appendix F - Primary School Forecast School Rolls by Planning Area
34
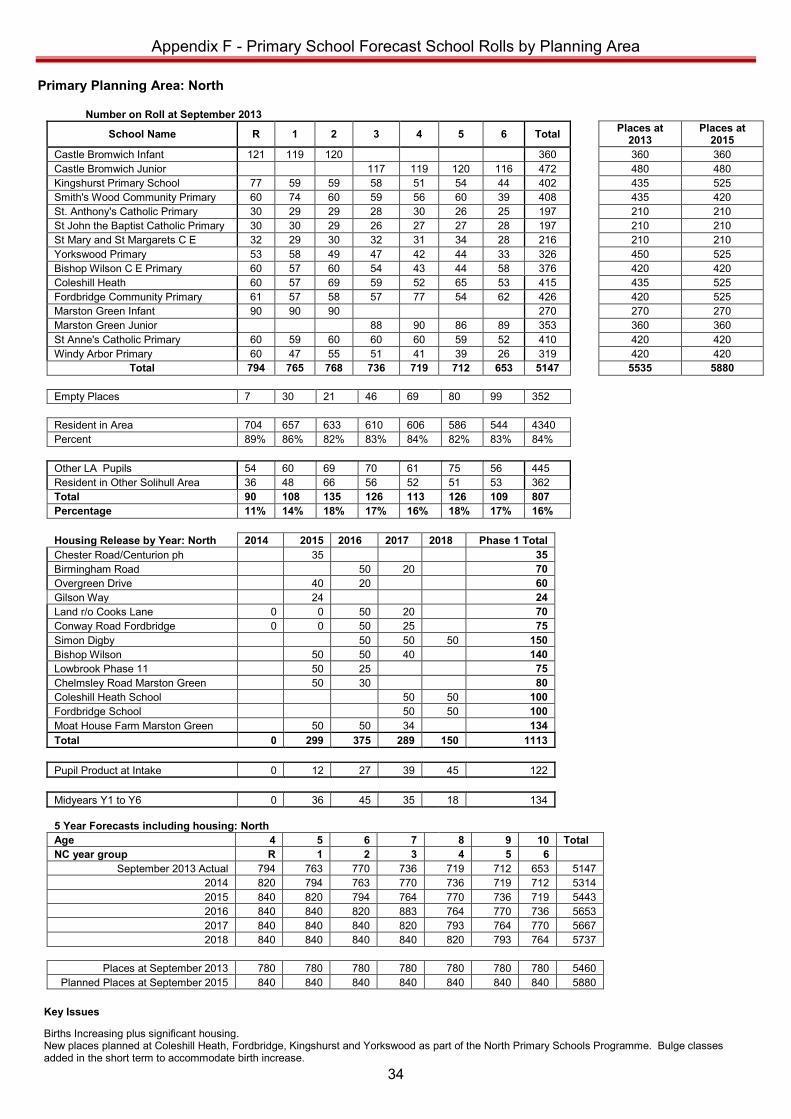
Primary Planning Area: North Number on Roll at September 2013
School Name R 1 2 3 4 5 6 Total Places at
2013 Places at
2015 Castle Bromwich Infant 121 119 120 360 360 360 Castle Bromwich Junior 117 119 120 116 472 480 480 Kingshurst Primary School 77 59 59 58 51 54 44 402 435 525 Smith's Wood Community Primary 60 74 60 59 56 60 39 408 435 420 St. Anthony's Catholic Primary 30 29 29 28 30 26 25 197 210 210 St John the Baptist Catholic Primary 30 30 29 26 27 27 28 197 210 210 St Mary and St Margarets C E 32 29 30 32 31 34 28 216 210 210 Yorkswood Primary 53 58 49 47 42 44 33 326 450 525 Bishop Wilson C E Primary 60 57 60 54 43 44 58 376 420 420 Coleshill Heath 60 57 69 59 52 65 53 415 435 525 Fordbridge Community Primary 61 57 58 57 77 54 62 426 420 525 Marston Green Infant 90 90 90 270 270 270 Marston Green Junior 88 90 86 89 353 360 360 St Anne's Catholic Primary 60 59 60 60 60 59 52 410 420 420 Windy Arbor Primary 60 47 55 51 41 39 26 319 420 420
Total 794 765 768 736 719 712 653 5147 5535 5880
Empty Places 7 30 21 46 69 80 99 352 Resident in Area 704 657 633 610 606 586 544 4340 Percent 89% 86% 82% 83% 84% 82% 83% 84% Other LA Pupils 54 60 69 70 61 75 56 445 Resident in Other Solihull Area 36 48 66 56 52 51 53 362 Total 90 108 135 126 113 126 109 807 Percentage 11% 14% 18% 17% 16% 18% 17% 16%
Housing Release by Year: North 2014 2015 2016 2017 2018 Phase 1 Total Chester Road/Centurion ph 35 35
Birmingham Road 50 20 70
Overgreen Drive 40 20 60
Gilson Way 24 24
Land r/o Cooks Lane 0 0 50 20 70
Conway Road Fordbridge 0 0 50 25 75
Simon Digby 50 50 50 150
50
Bishop Wilson 50 50 40 140
Lowbrook Phase 11 50 25 75
Chelmsley Road Marston Green 50 30 80
Coleshill Heath School 50 50 100
Fordbridge School 50 50 100
Moat House Farm Marston Green 50 50 34 134
Total 0 299 375 289 150 1113
50
Pupil Product at Intake 0 12 27 39 45 122
47
Midyears Y1 to Y6 0 36 45 35 18 134
6
5 Year Forecasts including housing: North Age 4 5 6 7 8 9 10 Total
NC year group R 1 2 3 4 5 6 September 2013 Actual 794 763 770 736 719 712 653 5147 2014 820 794 763 770 736 719 712 5314 2015 840 820 794 764 770 736 719 5443 2016 840 840 820 883 764 770 736 5653 2017 840 840 840 820 793 764 770 5667 2018 840 840 840 840 820 793 764 5737
Places at September 2013 780 780 780 780 780 780 780 5460 Planned Places at September 2015 840 840 840 840 840 840 840 5880
Key Issues
Births Increasing plus significant housing. New places planned at Coleshill Heath, Fordbridge, Kingshurst and Yorkswood as part of the North Primary Schools Programme. Bulge classes added in the short term to accommodate birth increase.
Appendix F - Primary School Forecast School Rolls by Planning Area
35
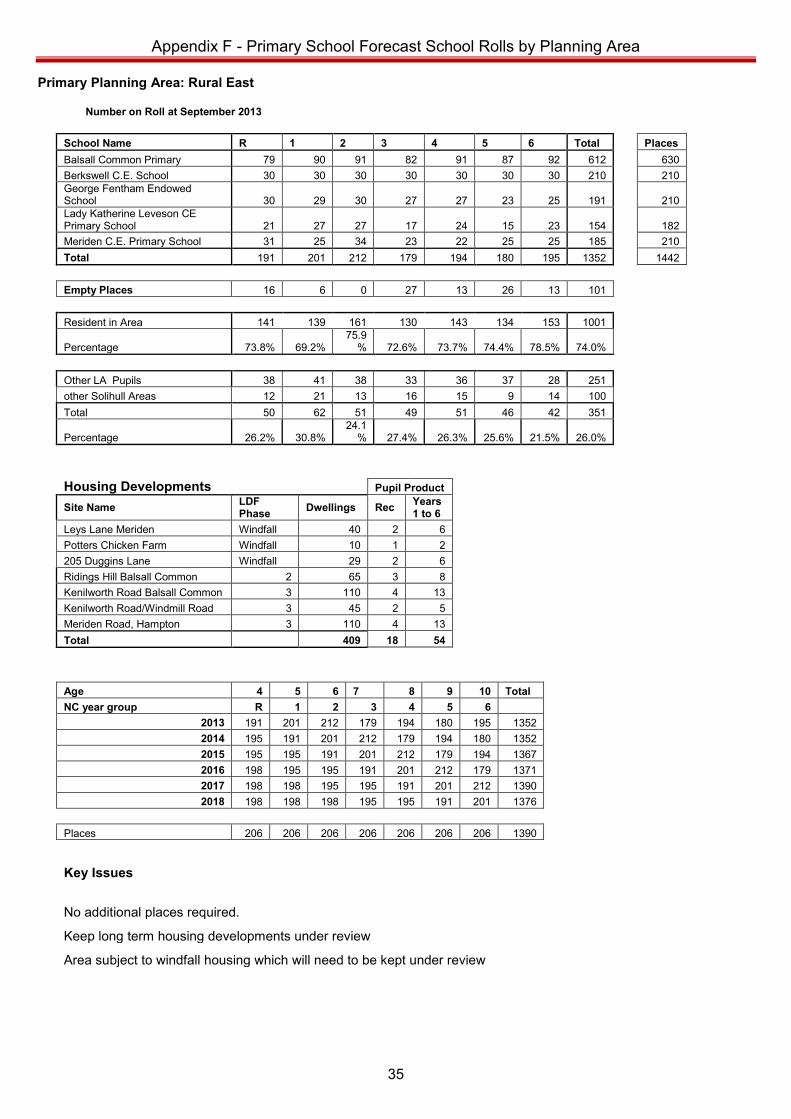
Primary Planning Area: Rural East
Number on Roll at September 2013
School Name R 1 2 3 4 5 6 Total
Places Balsall Common Primary 79 90 91 82 91 87 92 612
630
Berkswell C.E. School 30 30 30 30 30 30 30 210
210 George Fentham Endowed School 30 29 30 27 27 23 25 191
210
Lady Katherine Leveson CE Primary School 21 27 27 17 24 15 23 154
182
Meriden C.E. Primary School 31 25 34 23 22 25 25 185
210 Total 191 201 212 179 194 180 195 1352
1442
Empty Places 16 6 0 27 13 26 13 101
Resident in Area 141 139 161 130 143 134 153 1001
Percentage 73.8% 69.2% 75.9
% 72.6% 73.7% 74.4% 78.5% 74.0%
Other LA Pupils 38 41 38 33 36 37 28 251 other Solihull Areas 12 21 13 16 15 9 14 100 Total 50 62 51 49 51 46 42 351
Percentage 26.2% 30.8% 24.1
% 27.4% 26.3% 25.6% 21.5% 26.0%
Housing Developments
Pupil Product Site Name LDF
Phase Dwellings Rec Years 1 to 6
Leys Lane Meriden Windfall 40 2 6 Potters Chicken Farm Windfall 10 1 2 205 Duggins Lane Windfall 29 2 6 Ridings Hill Balsall Common 2 65 3 8
Kenilworth Road Balsall Common 3 110 4 13 Kenilworth Road/Windmill Road 3 45 2 5 Meriden Road, Hampton 3 110 4 13 Total 409 18 54
Age 4 5 6 7 8 9 10 Total NC year group R 1 2 3 4 5 6 2013 191 201 212 179 194 180 195 1352 2014 195 191 201 212 179 194 180 1352 2015 195 195 191 201 212 179 194 1367 2016 198 195 195 191 201 212 179 1371 2017 198 198 195 195 191 201 212 1390 2018 198 198 198 195 195 191 201 1376
Places 206 206 206 206 206 206 206 1390
Key Issues
No additional places required.
Keep long term housing developments under review
Area subject to windfall housing which will need to be kept under review
Appendix F - Primary School Forecast School Rolls by Planning Area
36
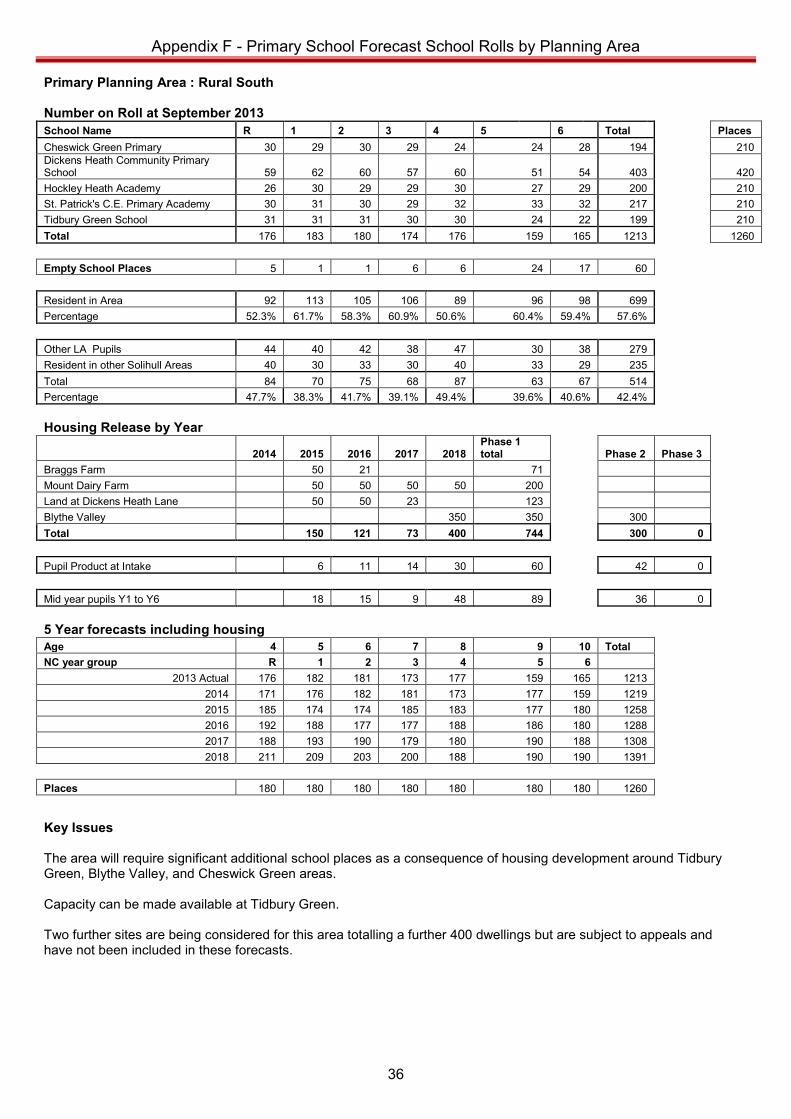
Primary Planning Area : Rural South Number on Roll at September 2013
Appendix F
School Name R 1 2 3 4 5 6 Total
Places Cheswick Green Primary 30 29 30 29 24 24 28 194
210
Dickens Heath Community Primary School 59 62 60 57 60 51 54 403
420
Hockley Heath Academy 26 30 29 29 30 27 29 200
210 St. Patrick's C.E. Primary Academy 30 31 30 29 32 33 32 217
210
Tidbury Green School 31 31 31 30 30 24 22 199
210 Total 176 183 180 174 176 159 165 1213
1260
Empty School Places 5 1 1 6 6 24 17 60
Resident in Area 92 113 105 106 89 96 98 699 Percentage 52.3% 61.7% 58.3% 60.9% 50.6% 60.4% 59.4% 57.6%
Other LA Pupils 44 40 42 38 47 30 38 279 Resident in other Solihull Areas 40 30 33 30 40 33 29 235 Total 84 70 75 68 87 63 67 514 Percentage 47.7% 38.3% 41.7% 39.1% 49.4% 39.6% 40.6% 42.4%
Housing Release by Year
2014 2015 2016 2017 2018 Phase 1 total
Phase 2 Phase 3
Braggs Farm 50 21 71
Mount Dairy Farm 50 50 50 50 200
Land at Dickens Heath Lane 50 50 23 123
Blythe Valley 350 350
300
Total 150 121 73 400 744
300 0
Pupil Product at Intake 6 11 14 30 60
42 0
Mid year pupils Y1 to Y6 18 15 9 48 89
36 0
5 Year forecasts including housing Age 4 5 6 7 8 9 10 Total
NC year group R 1 2 3 4 5 6 2013 Actual 176 182 181 173 177 159 165 1213 2014 171 176 182 181 173 177 159 1219 2015 185 174 174 185 183 177 180 1258 2016 192 188 177 177 188 186 180 1288 2017 188 193 190 179 180 190 188 1308 2018 211 209 203 200 188 190 190 1391
Places 180 180 180 180 180 180 180 1260
Key Issues
The area will require significant additional school places as a consequence of housing development around Tidbury
Green, Blythe Valley, and Cheswick Green areas. Capacity can be made available at Tidbury Green. Two further sites are being considered for this area totalling a further 400 dwellings but are subject to appeals and have not been included in these forecasts.
Appendix F - Primary School Forecast School Rolls by Planning Area
37
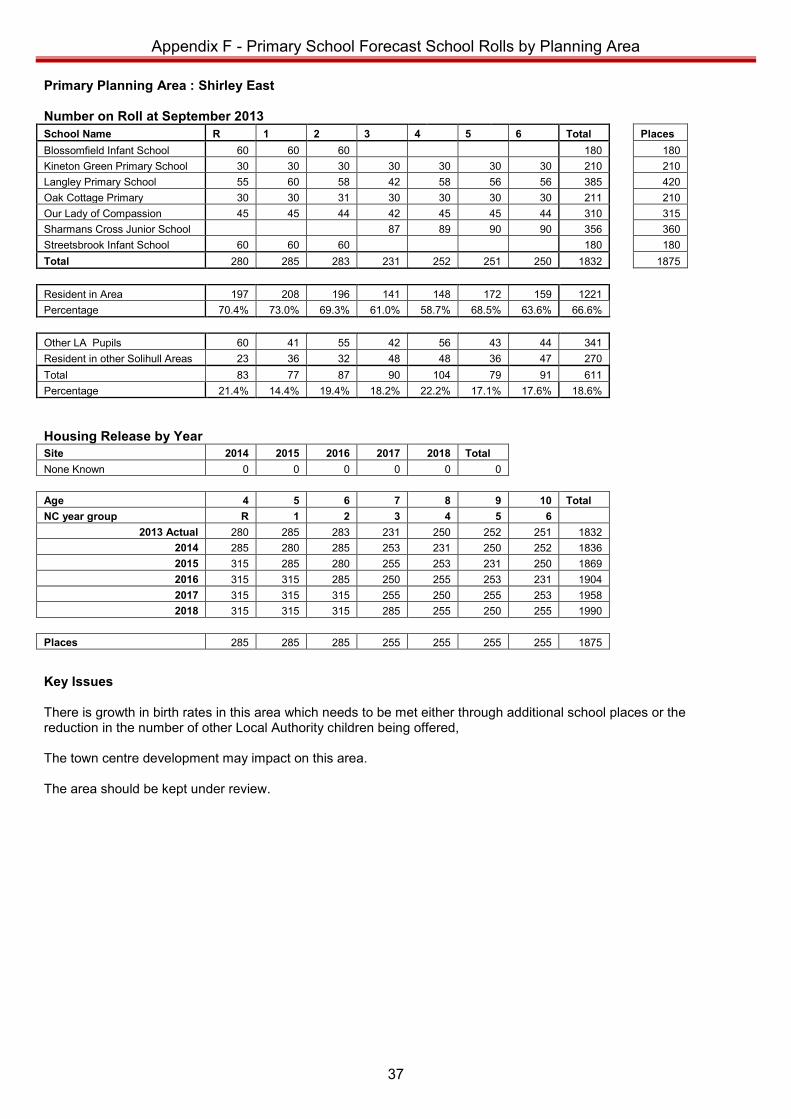
Primary Planning Area : Shirley East Number on Roll at September 2013
Appendix F
School Name R 1 2 3 4 5 6 Total
Places Blossomfield Infant School 60 60 60 180
180
Kineton Green Primary School 30 30 30 30 30 30 30 210
210 Langley Primary School 55 60 58 42 58 56 56 385
420
Oak Cottage Primary 30 30 31 30 30 30 30 211
210 Our Lady of Compassion 45 45 44 42 45 45 44 310
315
Sharmans Cross Junior School 87 89 90 90 356
360 Streetsbrook Infant School 60 60 60 180
180
Total 280 285 283 231 252 251 250 1832
1875
Resident in Area 197 208 196 141 148 172 159 1221 Percentage 70.4% 73.0% 69.3% 61.0% 58.7% 68.5% 63.6% 66.6%
Other LA Pupils 60 41 55 42 56 43 44 341 Resident in other Solihull Areas 23 36 32 48 48 36 47 270 Total 83 77 87 90 104 79 91 611 Percentage 21.4% 14.4% 19.4% 18.2% 22.2% 17.1% 17.6% 18.6%
Housing Release by Year
Site 2014 2015 2016 2017 2018 Total None Known 0 0 0 0 0 0
Age 4 5 6 7 8 9 10 Total NC year group R 1 2 3 4 5 6 2013 Actual 280 285 283 231 250 252 251 1832 2014 285 280 285 253 231 250 252 1836 2015 315 285 280 255 253 231 250 1869 2016 315 315 285 250 255 253 231 1904 2017 315 315 315 255 250 255 253 1958 2018 315 315 315 285 255 250 255 1990
Places 285 285 285 255 255 255 255 1875
Key Issues
There is growth in birth rates in this area which needs to be met either through additional school places or the
reduction in the number of other Local Authority children being offered, The town centre development may impact on this area.
The area should be kept under review.
Appendix F - Primary School Forecast School Rolls by Planning Area
38
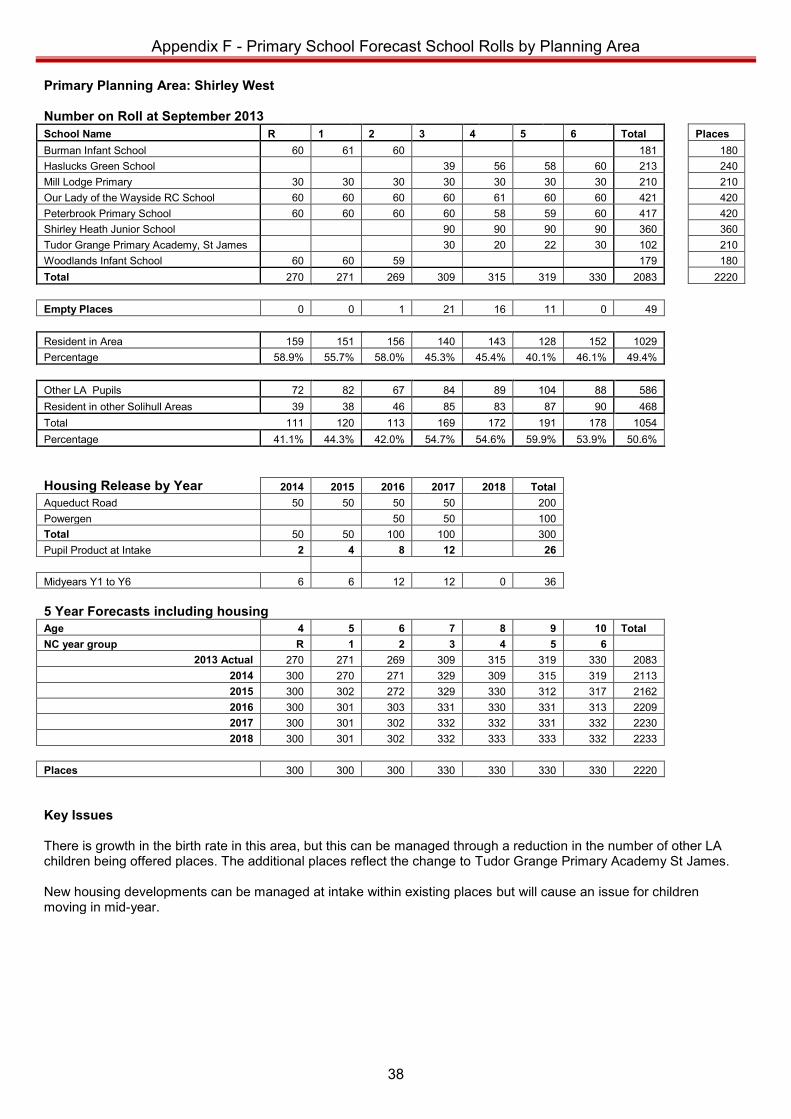
Primary Planning Area: Shirley West
Appendix F
Number on Roll at September 2013 School Name R 1 2 3 4 5 6 Total
Places
Burman Infant School 60 61 60 181
180 Haslucks Green School 39 56 58 60 213
240
Mill Lodge Primary 30 30 30 30 30 30 30 210
210 Our Lady of the Wayside RC School 60 60 60 60 61 60 60 421
420
Peterbrook Primary School 60 60 60 60 58 59 60 417
420 Shirley Heath Junior School 90 90 90 90 360
360
Tudor Grange Primary Academy, St James 30 20 22 30 102
210 Woodlands Infant School 60 60 59 179
180
Total 270 271 269 309 315 319 330 2083
2220
Empty Places 0 0 1 21 16 11 0 49
Resident in Area 159 151 156 140 143 128 152 1029 Percentage 58.9% 55.7% 58.0% 45.3% 45.4% 40.1% 46.1% 49.4%
Other LA Pupils 72 82 67 84 89 104 88 586 Resident in other Solihull Areas 39 38 46 85 83 87 90 468 Total 111 120 113 169 172 191 178 1054 Percentage 41.1% 44.3% 42.0% 54.7% 54.6% 59.9% 53.9% 50.6%
Housing Release by Year 2014 2015 2016 2017 2018 Total
Aqueduct Road 50 50 50 50 200 Powergen 50 50 100 Total 50 50 100 100 300 Pupil Product at Intake 2 4 8 12 26
Midyears Y1 to Y6 6 6 12 12 0 36
5 Year Forecasts including housing Age 4 5 6 7 8 9 10 Total
NC year group R 1 2 3 4 5 6 2013 Actual 270 271 269 309 315 319 330 2083 2014 300 270 271 329 309 315 319 2113 2015 300 302 272 329 330 312 317 2162 2016 300 301 303 331 330 331 313 2209 2017 300 301 302 332 332 331 332 2230 2018 300 301 302 332 333 333 332 2233
Places 300 300 300 330 330 330 330 2220
Key Issues
There is growth in the birth rate in this area, but this can be managed through a reduction in the number of other LA children being offered places. The additional places reflect the change to Tudor Grange Primary Academy St James.
New housing developments can be managed at intake within existing places but will cause an issue for children moving in mid-year.
Appendix G - Secondary School Capacity and Surplus School Places
39
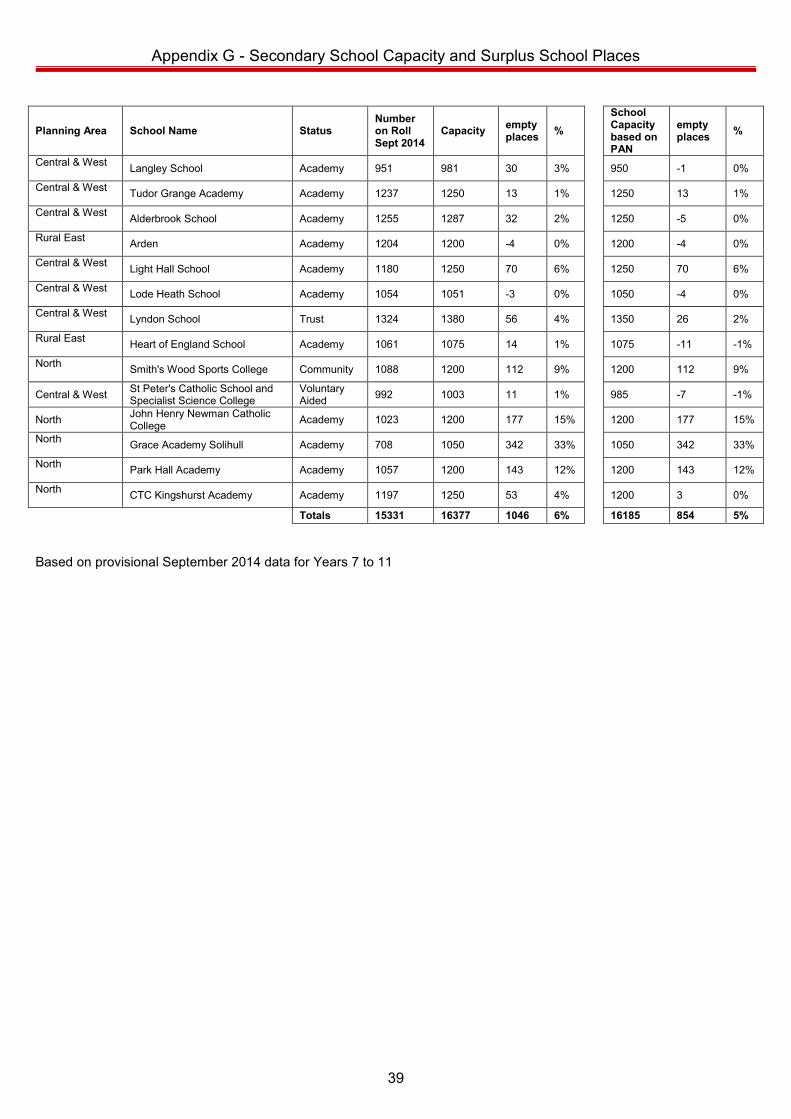
Planning Area School Name Status Number on Roll Sept 2014
Capacity empty places %
School Capacity based on PAN
empty places %
Central & West Langley School Academy 951 981 30 3% 950 -1 0%
Central & West Tudor Grange Academy Academy 1237 1250 13 1% 1250 13 1%
Central & West Alderbrook School Academy 1255 1287 32 2% 1250 -5 0%
Rural East Arden Academy 1204 1200 -4 0% 1200 -4 0%
Central & West Light Hall School Academy 1180 1250 70 6% 1250 70 6%
Central & West Lode Heath School Academy 1054 1051 -3 0% 1050 -4 0%
Central & West Lyndon School Trust 1324 1380 56 4% 1350 26 2%
Rural East Heart of England School Academy 1061 1075 14 1% 1075 -11 -1%
North Smith's Wood Sports College Community 1088 1200 112 9% 1200 112 9%
Central & West St Peter's Catholic School and Specialist Science College
Voluntary Aided 992 1003 11 1% 985 -7 -1%
North John Henry Newman Catholic College Academy 1023 1200 177 15% 1200 177 15%
North Grace Academy Solihull Academy 708 1050 342 33% 1050 342 33%
North Park Hall Academy Academy 1057 1200 143 12% 1200 143 12%
North CTC Kingshurst Academy Academy 1197 1250 53 4% 1200 3 0%
Totals 15331 16377 1046 6% 16185 854 5%
Based on provisional September 2014 data for Years 7 to 11
Appendix H - Secondary School Forecast School Rolls by Planning Area
40
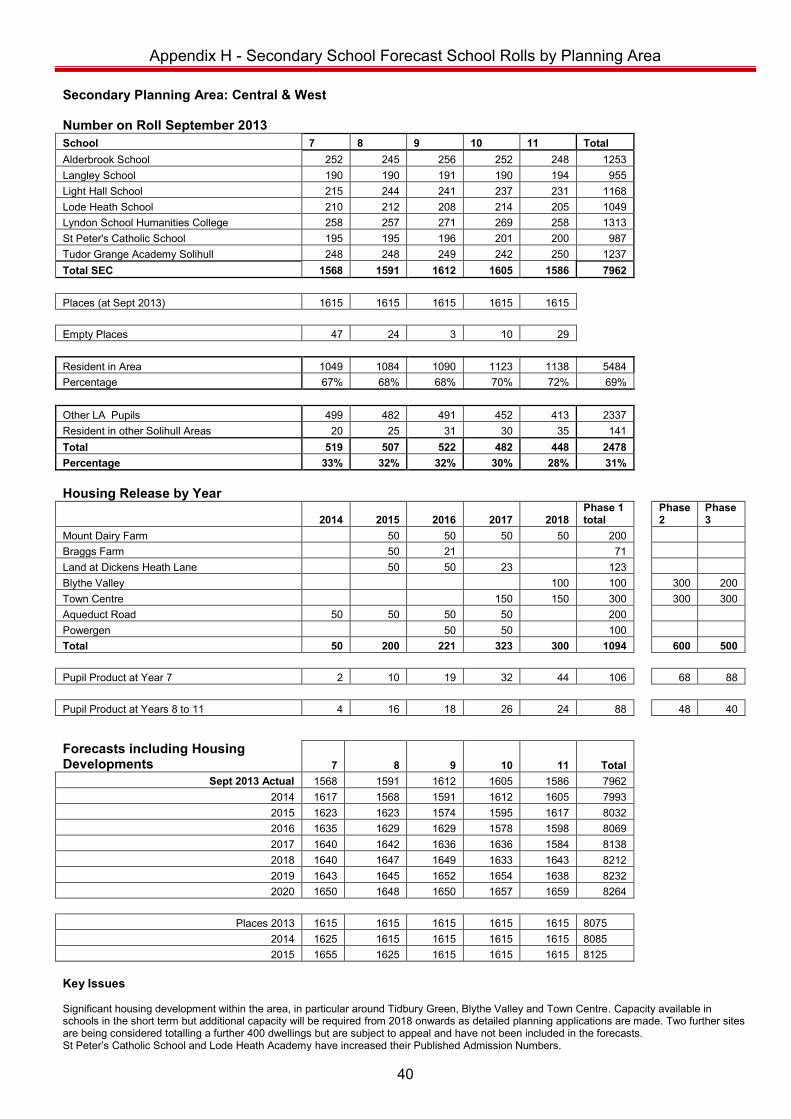
Secondary Planning Area: Central & West
Number on Roll September 2013
School 7 8 9 10 11 Total Alderbrook School 252 245 256 252 248 1253 Langley School 190 190 191 190 194 955 Light Hall School 215 244 241 237 231 1168 Lode Heath School 210 212 208 214 205 1049 Lyndon School Humanities College 258 257 271 269 258 1313 St Peter's Catholic School 195 195 196 201 200 987 Tudor Grange Academy Solihull 248 248 249 242 250 1237 Total SEC 1568 1591 1612 1605 1586 7962
Places (at Sept 2013) 1615 1615 1615 1615 1615
Empty Places 47 24 3 10 29
Resident in Area 1049 1084 1090 1123 1138 5484 Percentage 67% 68% 68% 70% 72% 69%
Other LA Pupils 499 482 491 452 413 2337 Resident in other Solihull Areas 20 25 31 30 35 141 Total 519 507 522 482 448 2478 Percentage 33% 32% 32% 30% 28% 31%
Housing Release by Year
2014 2015 2016 2017 2018 Phase 1 total
Phase 2
Phase 3
Mount Dairy Farm 50 50 50 50 200
Braggs Farm 50 21 71
Land at Dickens Heath Lane 50 50 23 123
Blythe Valley 100 100
300 200
Town Centre 150 150 300
300 300 Aqueduct Road 50 50 50 50 200
Powergen 50 50 100
Total 50 200 221 323 300 1094
600 500
Pupil Product at Year 7 2 10 19 32 44 106
68 88
Pupil Product at Years 8 to 11 4 16 18 26 24 88
48 40
Forecasts including Housing Developments 7 8 9 10 11 Total
Sept 2013 Actual 1568 1591 1612 1605 1586 7962 2014 1617 1568 1591 1612 1605 7993 2015 1623 1623 1574 1595 1617 8032 2016 1635 1629 1629 1578 1598 8069 2017 1640 1642 1636 1636 1584 8138 2018 1640 1647 1649 1633 1643 8212 2019 1643 1645 1652 1654 1638 8232 2020 1650 1648 1650 1657 1659 8264
Places 2013 1615 1615 1615 1615 1615 8075 2014 1625 1615 1615 1615 1615 8085 2015 1655 1625 1615 1615 1615 8125
Key Issues
Significant housing development within the area, in particular around Tidbury Green, Blythe Valley and Town Centre. Capacity available in schools in the short term but additional capacity will be required from 2018 onwards as detailed planning applications are made. Two further sites are being considered totalling a further 400 dwellings but are subject to appeal and have not been included in the forecasts. St Peter’s Catholic School and Lode Heath Academy have increased their Published Admission Numbers.
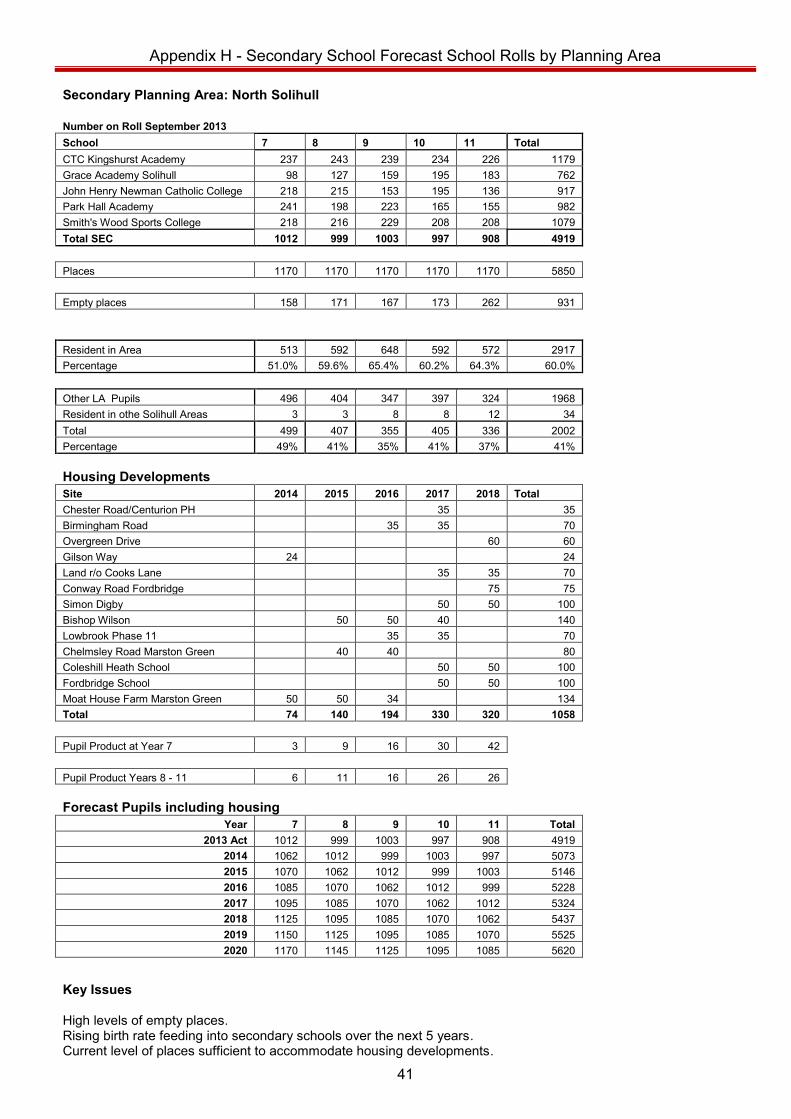
Appendix H - Secondary School Forecast School Rolls by Planning Area
41
Secondary Planning Area: North Solihull
Number on Roll September 2013 School 7 8 9 10 11 Total
CTC Kingshurst Academy 237 243 239 234 226 1179 Grace Academy Solihull 98 127 159 195 183 762 John Henry Newman Catholic College 218 215 153 195 136 917 Park Hall Academy 241 198 223 165 155 982 Smith's Wood Sports College 218 216 229 208 208 1079 Total SEC 1012 999 1003 997 908 4919
Places 1170 1170 1170 1170 1170 5850
Empty places 158 171 167 173 262 931
Resident in Area 513 592 648 592 572 2917
Percentage 51.0% 59.6% 65.4% 60.2% 64.3% 60.0%
Other LA Pupils 496 404 347 397 324 1968 Resident in othe Solihull Areas 3 3 8 8 12 34 Total 499 407 355 405 336 2002 Percentage 49% 41% 35% 41% 37% 41%
Housing Developments Site 2014 2015 2016 2017 2018 Total
Chester Road/Centurion PH 35 35 Birmingham Road 35 35 70 Overgreen Drive 60 60 Gilson Way 24 24 Land r/o Cooks Lane 35 35 70 Conway Road Fordbridge 75 75 Simon Digby 50 50 100 Bishop Wilson 50 50 40 140 Lowbrook Phase 11 35 35 70 Chelmsley Road Marston Green 40 40 80 Coleshill Heath School 50 50 100 Fordbridge School 50 50 100 Moat House Farm Marston Green 50 50 34 134 Total 74 140 194 330 320 1058
Pupil Product at Year 7 3 9 16 30 42
Pupil Product Years 8 - 11 6 11 16 26 26
Forecast Pupils including housing Year 7 8 9 10 11 Total
2013 Act 1012 999 1003 997 908 4919 2014 1062 1012 999 1003 997 5073 2015 1070 1062 1012 999 1003 5146 2016 1085 1070 1062 1012 999 5228 2017 1095 1085 1070 1062 1012 5324 2018 1125 1095 1085 1070 1062 5437 2019 1150 1125 1095 1085 1070 5525 2020 1170 1145 1125 1095 1085 5620
Key Issues
High levels of empty places.
Rising birth rate feeding into secondary schools over the next 5 years. Current level of places sufficient to accommodate housing developments.
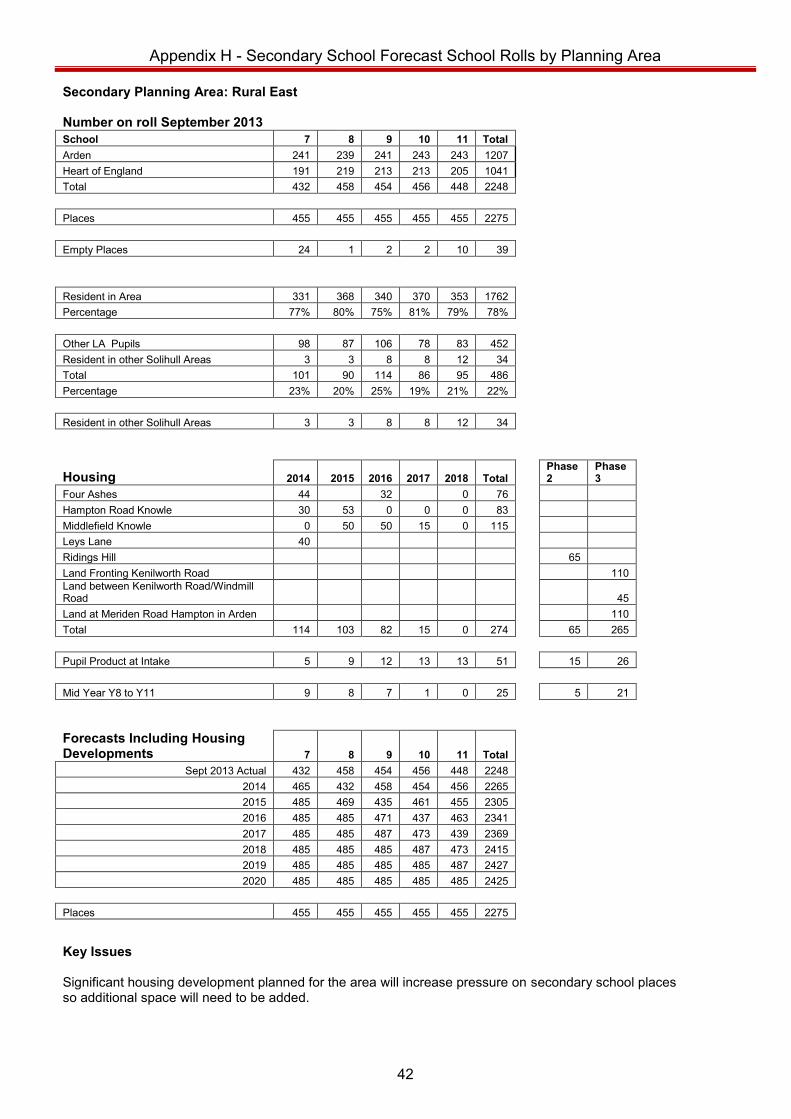
Appendix H - Secondary School Forecast School Rolls by Planning Area
42
Secondary Planning Area: Rural East
Number on roll September 2013
School 7 8 9 10 11 Total Arden 241 239 241 243 243 1207 Heart of England 191 219 213 213 205 1041 Total 432 458 454 456 448 2248
Places 455 455 455 455 455 2275
Empty Places 24 1 2 2 10 39
Resident in Area 331 368 340 370 353 1762
Percentage 77% 80% 75% 81% 79% 78%
Other LA Pupils 98 87 106 78 83 452 Resident in other Solihull Areas 3 3 8 8 12 34 Total 101 90 114 86 95 486 Percentage 23% 20% 25% 19% 21% 22%
Resident in other Solihull Areas 3 3 8 8 12 34
Housing 2014 2015 2016 2017 2018 Total
Phase 2
Phase 3
Four Ashes 44 32 0 76
Hampton Road Knowle 30 53 0 0 0 83
Middlefield Knowle 0 50 50 15 0 115
Leys Lane 40
Ridings Hill
65 Land Fronting Kenilworth Road
110
Land between Kenilworth Road/Windmill Road
45
Land at Meriden Road Hampton in Arden
110 Total 114 103 82 15 0 274
65 265
Pupil Product at Intake 5 9 12 13 13 51
15 26
Mid Year Y8 to Y11 9 8 7 1 0 25
5 21
Forecasts Including Housing Developments 7 8 9 10 11 Total
Sept 2013 Actual 432 458 454 456 448 2248 2014 465 432 458 454 456 2265 2015 485 469 435 461 455 2305 2016 485 485 471 437 463 2341 2017 485 485 487 473 439 2369 2018 485 485 485 487 473 2415 2019 485 485 485 485 487 2427 2020 485 485 485 485 485 2425
Places 455 455 455 455 455 2275
Key Issues
Significant housing development planned for the area will increase pressure on secondary school places so additional space will need to be added.
Appendix I - Growth Funding Criteria
43
Principles for qualification for growth contingency funding Qualification for funding through the scheme is based upon a set of principles as follows:- 1. Additional funding will be made available to schools and academies in
circumstances where:-
The Council carries out a formal consultation and approves to increase the capacity of a school.
A school/academy carries out a formal consultation at either the request of the Council or supported by the Council.
The Council requests a school/academy to increase their PAN to meet localised demand.
A school/academy admits a significant increase in pupils to meet demand from new housing developments at the request of the Council.
2. Additional funding will be made in relation to the number of additional pupils
taken or the number of agreed places purchased. Reference may be made to the number of classes required and may include consideration of the number of pupils leaving the school in that year.
3. Any allocation will be based on the teacher element of the AWPU, and will
reflect the period September to March only (as additional funding will then flow through the October pupil count) for maintained schools and September to August for academy schools (as additional funding does not flow through until the start of the next academic year). Additional funding may be made available for pupil resources where the provision is a significant expansion of provision, particularly where a new key stage is being provided.
4. No allocation will be made to a school/academy where the school/academy:
Has surplus places and then takes additional children up to the PAN Admits over PAN at their own choice. Admits extra pupils where those pupils have a reasonable alternative school
place. Is directed and/or requested to admit additional pupils as a result of errors,
appeals, fair access protocol, SEN, LAC etc as these numbers will be extremely low on an individual school basis.
Provides an additional infant class to meet class size legislation 5. Any unspent funds at 31 March will be allocated to all primary and special
schools on a straight per pupil basis. All allocations from the fund will be reported to the School Forum Finance Group.

Appendix I - Growth Funding Criteria
44
School funding reform: Arrangements for 2013-14 (Extract – DfE 29-06-2012) Supporting schools with significant growth in pupil numbers 19. In March, we said that maintained schools facing significant pupil number growth could be supported through de-delegated contingency funding, but that local authorities would not be able to top-slice to build a contingency budget for this purpose. As autonomous institutions, Academies would be expected to manage pupil growth from within their own budgets in the first instance but could work with the EFA if exceptional budget pressure arose. 20. Under this arrangement, there is a risk of uncoordinated growth provision. To mitigate this risk we are introducing an alternative arrangement. Local authorities will now be able to create a growth fund from the DSG in advance of allocating school budget shares. Eligible expenditure on growth can include funding schools and Academies where very limited pupil growth nevertheless requires an additional class, as required by class size regulations. The growth fund will need to be ring-fenced so that it is only used for the purposes of supporting growth in pupil numbers to meet basic need and will be for the benefit of both maintained schools and Academies. Any funds remaining at the end of the financial year must be added to the following year’s DSG and reallocated to maintained schools and Academies through the local formula. 21. Importantly, local authorities will be required to produce criteria on which any growth funding is to be allocated. These should provide a transparent and consistent basis (with differences permitted between phases) for the allocation of all growth funding. The criteria should both set out the circumstances in which a payment could be made and provide a basis for calculating the sum to be paid. 22. Local authorities will need to propose the criteria to the Schools Forum and gain its agreement before growth funding is allocated. The local authority will also need to consult the Schools Forum on the total sum to be top-sliced from each phase and must regularly update the Schools Forum on the use of the funding. It is essential that the use of the growth fund is entirely transparent and solely for the purposes of supporting growth in pupil numbers.

Appendix I - Growth Funding Criteria
45
Case Studies for Contingency Growth Case Study 1 A school has a PAN of 66 and is asked to admit 90 children by the Council to accommodate all of the children from its link infant school year on year. The school needs to create an additional class to manage this request. School would be funded through the growth contingency for a teacher, 5/12 if maintained, 12/12 if academy. Additional funding if necessary, for example if some minor adaptations required or for additional resources if additional classes required year after year. Case Study 2 A school is significantly undersubscribed but admits a large number of pupils taking its classes up to its PAN, no additional class is required however whole school roll is significantly increased. No additional funding through the growth contingency. If a school in this scenario did have to create an extra class, there would be no automatic entitlement to access to the fund, but the LA would have a dialogue with the school and take a holistic look at the school’s financial situation, e.g. levels of reserves, scope for a licensed deficit. Case Study 3 The Council asks a school to admit additional children at Reception due to a shortage of school places. The school normally admits 60 children but for one year agrees to admit up to 75 children. The additional places are required to ensure that all children in the area have access to a school place at Reception. School would be funded through the growth contingency for a teacher, 5/12 if maintained, 12/12 if academy. Additional funding if necessary, for example, if some minor adaptations required. Case Study 4 A school publishes school organisation proposals to extend the age range of the school and to add an additional key stage. The proposal is supported by the Council and under-goes full school organisation proposals and consultation which is approved. School would be funded through contingency. School would be funded through the growth contingency for a teacher, 5/12 if maintained, 12/12 if academy. Funding for additional resources (non-capital). Capital adaptations & building expansion would not be funded from this contingency fund. Case Study 5 An outstanding voluntary aided school wishes to expand to admit additional faith children; however all the children have a reasonable, albeit not faith, school place. No funding through contingency. If however year on year demand can be demonstrated and the proposal is supported by the relevant Diocesan Authority and the Council, then School would be funded through the growth contingency.

SOP
S o l i h u l l S c h o o l O r g a n i s a t i o n P l a n 2014