school governance, teacher incentives, and pupil-teacher
TRANSCRIPT
School Governance, Teacher Incentives, and Pupil-Teacher Ratios: Experimental Evidence from Kenyan Primary Schools
Esther Duflo*, Pascaline Dupas†, and Michael Kremer‡, §
June 26, 2012
Some education policymakers focus on bringing down pupil-teacher ratios. Others argue that resources will have limited impact without systematic reforms to education governance, teacher incentives, and pedagogy. We examine a program under which Kenyan Parent-Teacher Associations (PTAs) at randomly selected schools were funded to hire an additional teacher on a renewable contract, outside normal Ministry of Education civil-service channels, at one-quarter normal compensation levels. For students randomly assigned to stay with existing classes, test scores did not increase significantly, despite a reduction in class size from 82 to 44. In contrast, scores increased for students assigned to be taught by locally-hired contract teachers. One reason may be that contract teachers had low absence rates, while centrally-hired civil-service teachers in schools randomly assigned PTA contract teachers endogenously reduced their effort. Civil-service teachers also captured rents for their families, with approximately 1/3 of contract teacher positions going to relatives of existing teachers. A governance program that empowered parents within PTAs reduced both forms of capture. The best contract teachers obtained civil service jobs over time, and we estimate large potential dynamic benefits from supplementing a civil service system with locally-hired contract teachers brought in on a probationary basis and granted tenure conditional on performance.
JEL Codes: D71, I21, M51, O15 Keywords: contract teachers, PTA, School-Based Management, teacher effort, test score gain, nepotism, corruption, decentralization, institutions.
* Massachusetts Institute of Technology, BREAD, NBER, and CEPR ([email protected]). † Stanford University, BREAD, NBER, and CEPR ([email protected]). ‡ Harvard University, Brookings, CGD, BREAD, and NBER ([email protected]). § We thank Josh Angrist, Paul Glewwe, Alaka Holla, Victor Lavy, Karthik Muralidharan, Naercio Menezes-Filho, and seminar participants at the Harris School, Harvard, UC Santa Barbara, the World Bank, Dartmouth College, NEUDC and Itau International Seminar for helpful comments and discussions. We thank the Kenya Ministry of Education, International Child Support Africa, and Matthew Jukes for their collaboration. We thank Willa Friedman, Jessica Morgan, Nicolas Studer, Ian Tomb, and Paul Wang for excellent research assistance. We are grateful to Grace Makana and her field team for collecting the data. We thank the World Bank and the Government of the Netherlands for the grant that made this study possible.
1. Introduction
Social service delivery in developing countries is often of very low quality. Patients frequently do not
receive correct diagnosis and treatment (Amin, Das and Goldstein, 2007), and students score very
low on internationally comparable tests (Hanushek and Woessman, 2010). Some policymakers
seeking to address this problem focus on hiring more providers, while others focus on systemic
reforms designed to improve governance, provider incentives, and interactions between providers
and clients.
In education, one puzzle is that while several studies in developed country contexts have found
that reducing class size can increase test scores,1 the randomized trials that have been conducted in
low-income countries consistently have failed to find an effect of pupil-teacher ratio on test scores,
across a range of geographic contexts, starting with very different initial levels of class size.2 One
hypothesis is that weak governance institutions reduce the impact of additional education
expenditure. Indeed, the highly-centralized governance structures in many developing country
education systems are seen as producing weak teacher incentives (Chaudhury et al., 2006) and a
pedagogical approach that does not match student needs (Glewwe et al., 2009).
Several different approaches have been advocated to improve governance, teacher incentives,
and pedagogy. Many countries have experimented with supplementing the civil-service teacher
workforce with additional teachers hired and managed locally, on short-term contracts, rather than
centrally, under civil-service rules.3 Typically, some contract teachers eventually transition into the
civil-service system. Another, related approach is School-Based Management reforms to empower
local decision makers.4 While some applaud these programs, others are concerned that the
abandonment of civil-service hiring rules may create the potential for capture by local elites and
favoritism in hiring. Finally, a variety of pedagogical reforms have been advocated to make teaching
better focused on the needs and achievement level of the child, rather than focused on an official
1 For positive effects at the primary school level see Krueger and Whitmore (2002) in the US, Angrist and Lavy (1999) in Israel, Piketty (2004) in France. Hoxby (2000) finds no significant effect in the US. Bandiera et al. (2010) find evidence of non-linear class-size effects at the university level. 2 See Banerjee, Jacob, and Kremer (2005), Banerjee et al. (2007), and, for a well-identified non-experimental study, Urquiola and Verhoogen (2009). 3 Contract teachers have been used in Benin, Burkina Faso, Cambodia, Cameroon, Chad, Congo, Côte d’Ivoire, Guinea, India, Indonesia, Madagascar, Mali, Nicaragua, Niger, Senegal, and Togo. See Duthilleul (2005) for a review, and Kumar et al. (2005). 4 School-Based Management programs have been implemented in Argentina, Australia, Bangladesh, Canada, Guatemala, Honduras, Hong Kong, India, Lebanon, Lesotho, Macedonia, Madagascar, Mexico, Nicaragua, the Philippines, Senegal, Serbia, Sri Lanka, The Gambia, the United Kingdom, and the United States. See Bruns et al. (2011) for a review.
2
curriculum that may be distant from the child’s level of preparation (see Banerjee et al., 2007,
Glewwe et al., 2009, and Duflo et al., 2011).
We evaluate the Extra Teacher Program (ETP) in Kenya that provided 70 randomly selected
schools with money to locally hire and manage teachers for two years. Locally hired teachers were
paid about a quarter of the regular teacher salary, and placed on short-term contracts under the
authority of PTA committees composed primarily of parents. These contracts were renewable after
one year. About half of the teachers eventually obtained civil-service positions, in which case they
were typically assigned to new postings, outside our sample. Contract teachers followed the same
curriculum as civil-service teachers, but rather than focusing on particular subjects, and rotating
across grades, as many civil-service teachers do, the newly-hired teachers were assigned to work with
a fixed group of first-grade students, potentially allowing them to better understand those students'
needs.
Students were randomly assigned to be taught either in existing classes or by the teachers hired
under the ETP program, with its associated governance, incentives, and pedagogy. Despite a
dramatic reduction in the pupil teacher ratio for grade 1 from 82 to 44, the program generated little
improvement in test scores for students who remained within the standard system. Our results
suggest a potential explanation – civil-service teachers were 13 percentage points less likely to be
found in class teaching if their school received funding to hire a contract teacher. The endogenous
behavioral responses that we observe under weak governance institutions may help explain why
studies in developing countries typically find little learning improvement from hiring additional
teachers.5
In contrast, the program increased test scores by 28% of a standard deviation for students
assigned to the PTA contract teachers. We find strongly suggestive evidence that these locally hired
and monitored teachers had better incentives: they were 15 percentage points more likely to be
found in class teaching during unannounced spot checks than civil-service teachers in comparison
schools.6
In addition to reducing effort, civil-service teachers captured some of the benefits of the
program for their family – about a third of the PTA contract teachers hired through the program
5 In contemporaneous work, Muralidharan and Sundaramanan (2010) also find that teachers reduce effort in response to hiring additional teachers. Das et al. (2004, 2011) find that parents respond endogenously to provision of non-teacher inputs by cutting back their own investments in these inputs. 6 The incentive effect is potentially confounded both by the lower experience of the contract teacher, and by the fact that, unlike the regular teachers, who usually teach a specific subject (math, language) and rotate across classrooms, the program imposed that the PTA contract teacher be exclusively in charge of teaching all subjects to one specific grade 1 class.
3
were relatives of existing civil-service teachers in the school, and students of these teachers appear to
have learned less than students of other contract teachers.
However, capture can be reduced by promoting parental involvement and control at the local
level. In a (randomly selected) subset of schools participating in the contract teacher program,
parents and the PTA committee received a short School-Based Management (SBM) empowerment
training (90 minutes) on how to interview and select job applicants, monitor and assess teachers’
effort and performance, and perform a formal review of the contract teacher’s performance to
decide whether to renew her contract. The SBM empowerment program reduced by half the
tendency for civil service teachers to cut effort in response to the introduction of a contract teacher.
Point estimates suggest that empowering parents also cut by half civil-servant teachers’ ability to
secure the contract teacher position for a relative, and eliminated the test score differential
associated with relatives of civil-service teachers, but reduced hiring of women. However, standard
errors are large with our modest sample, so we cannot draw definitive conclusions on how SBM
affects hiring. The overall impact of the extra-teacher program on learning at endline was a
significant 19% of a standard deviation in schools with SBM, compared to an insignificant 13% of
standard deviation in schools without SBM.
Contract teachers whose students scored well were more likely to be hired as civil servants,
creating a dynamic that could potentially improve the quality of the teacher workforce (as in
Gordon, Kane and Staiger, 2006). A calibration exercise suggests that if teachers started their
careers by working for three years on contract for PTAs that received SBM training and then were
hired into the civil-service according to the process observed over the duration of our study, the
steady state gain in test scores for the Kenyan education system as a whole would be 18% of a
standard deviation.
Our results suggest that there may be important interactions between the impact of resources
and the governance, incentive, and pedagogy systems and indeed across different elements of these
systems. This may help explain why recent randomized evaluations of education find more
heterogeneity in producer than consumer behavior across contexts (Kremer and Holla, 2009).
Complementarities between different components of the governance and incentive system and
between this system and resources could help reconcile the very large differences in test scores
across countries (on the order of a standard deviation) with the typically smaller estimated impacts
of specific educational interventions. This is consistent with Lavy (2010), who finds greater
4
productivity of instructional time in countries with greater school accountability and school
autonomy in hiring and firing teachers.
Our results also contribute to the literature on institutions in developing countries. Much of this
literature focuses on property rights institutions, but institutions for the provision of human capital
may also be important for long-run economic development. The appropriate governance roles of
formal state institutions and local informal institutions in these countries have been hotly debated
(Mamdani, 1996). Whereas social service delivery in the United States and some other developed
countries historically grew out of a system of locally governed institutions (Goldin, 1999), many
developing countries adopted centralized state control over social service delivery at independence.
Recently, many developing countries, including Kenya, India, and Indonesia, have changed their
constitutions to decentralize authority and incorporate a role for locally elected bodies.
The remainder of this paper is organized as follows: Section 2 provides background on central
government and local community institutions for school governance in Kenya. Section 3 describes
the Extra Teacher Program, the experimental design, and the data. Section 4 presents the impact of
the program on test scores and teacher behavior. Section 5 discusses the potential dynamic impact
of contract teacher hiring on the teacher workforce, based on evidence about how contract teachers’
performance affects their likelihood of being hired as civil-service teachers and how school
committees select contract teachers. Section 6 draws conclusions and discusses evidence on related
programs.
2. Education Governance in Kenya
Many developing countries adopted highly centralized education systems at much lower levels of
development than did some of today’s developed countries. Newly independent states adopted
central control in part to rapidly expand education levels from a low base and in part as an element
in nation-building, designed to unify diverse segments of society. Civil-service rules were seen as an
important bulwark against politicization, ethnic favoritism, and nepotism in hiring and in favor of
professionalism.7
7 Debates over community vs. central control of education have had an important ethnic dimension in the United States as well, for example with the racially charged contention between community activists and the teachers union after New York State experimented with community control in the 1960s (Schiff, 1976).
5
Kenya has had an evolving mixture of local, informal education governance and governance by
the central state, but over time the role of the central state has grown, while that of local institutions
has shrunk. During the colonial period, churches and local communities started many independent
schools. While the Harambee movement in the late 60s and 70s encouraged local communities to
start schools and retained representation of parents, the local community, and founding churches on
school committees, overall the post-independence government adopted a fairly centralized education
system. Civil-service headmasters and teachers were sent to take over successful Harambee schools
and school committees were de facto relegated to fundraising rather than teacher governance. The
Ministry of Education sought to professionalize and standardize teacher training, hiring, and
discipline. A strong teachers union strengthened the emphasis on formal educational qualifications
and on accountability to professional norms rather than to local parents.
2.1 TSC and PTA teachers
Historically, Kenyan schools have had two types of teachers: those hired as civil servants through
the Teachers Service Commission (TSC) of the Ministry of Education, and Parent-Teacher
Association (PTA) teachers hired locally and informally by local school committees. For civil-service
teachers, who have long constituted the vast majority of teachers, promotions, transfers, and
disciplinary measures are decided through the TSC, rather than by more locally accountable bodies.
Hiring and promotions are based heavily on formal, objective criteria, such as educational
qualifications and experience. These teachers are represented by a strong union, have civil-service
protection, and receive wages and benefits considerably above market-clearing levels. Disciplinary
issues are addressed by the TSC through formal legalistic procedures with adjudication by panels
dominated by professional educators. Graduates of teacher training colleges typically have to queue
for civil-service jobs, often undergoing many years of unemployment before they are hired.
PTA teachers are hired by PTA committees at each school. PTA committees are primarily
composed of parent representatives, elected for each class. Thus, a particular parent member is
responsible for representing the interests of parents of children in grade 1, another represents
parents of children in grade 2, etc. School committees also include some additional ex officio
members, including the headmaster or a member appointed by the founding church. There is
considerable variance in the de facto relative strength of the headmaster and parents in the PTA.
Some school committees are dominated by the headmaster, but in others parents or other
6
community members play a very influential role. Hiring and supervision of PTA teachers is quite
informal, with much left to the discretion of the school committee or headmaster.
PTA teachers are typically paid much less than their TSC counterparts. In the area of study, in
2004, PTA teachers received compensation in the range of 2,000 Kenyan shillings, or US$ 25 per
month. In comparison, the average civil service teacher received around US$ 120 per month plus
benefits, including housing allowances, provisions for retirement, and medical coverage (Glewwe et
al., 2010). PTA teachers are effectively at will employees of the school committee. Despite the low
pay and lack of job security, PTA positions are actively sought after by unemployed teachers, in part
because teaching experience helps them obtain a formal civil-service teaching position.
2.2 National Politics, Free Primary Education, and Local Governance
In the Kenyan political context, national politics has been about assembling coalitions of local ethnic
leaders, with politicians competing largely on their ability to deliver resources to their constituencies.
National political leaders placed in charge of a Ministry therefore had more incentive to focus their
energies on delivering resources to their home areas than on transferring value from teachers
nationally to parents nationally, such as through enforcement of rules prohibiting unauthorized
teacher absence. Their constituents would gain only a small fraction of any benefits from tougher
enforcement. The shifting pattern of coalitions among local leaders meant there was little discipline
from a national political party interested in building a reputation for delivering services.
School committees were a means for a local role in school governance, but, as argued elsewhere
(Kremer et al., 2003), their structure tilted towards representation of local elites, so they typically
favored higher levels of fees and enforcement of rules (requiring uniforms, for example) than the
median voter in Kenya would have preferred. There were also at times tensions between parent
representatives and the often more educated teachers and headmasters.
With Kenya’s first fully competitive election in 2002, politicians with national ambitions were
incentivized to appeal directly to the typical voter rather than to rely as exclusively on the previous
pattern of assembling coalitions of local leaders. They promised free primary education, thus
appealing to voters of lower socio-economic status than those who typically serve on school
committees.
After primary school fees were abolished in 2003, enrollment rose nearly 30 percent. Since
parents were no longer required to pay fees, local school committees were generally unable to raise
the funds necessary to hire PTA teachers. They received grants from the central government, but the
7
grants had to be spent on physical inputs, not hiring teachers locally, so de facto the introduction of
truly competitive national elections and free primary education strengthened the role of the central
ministries in teacher governance at the expense of parents and local elites. Many parents exited the
public system, turning to informal private schools, which have grown dramatically since the
introduction of free primary education (Lucas and Mbiti, 2011). A survey we conducted with over
300 primary schools in 2004 showed that 80 percent had no locally-hired teachers. Average class size
in first grade in 2005 was 83, and median class size was 74; 28 percent of grade 1 classes had more
than 100 pupils.8
3. The Extra Teacher Program and Study Design
3.1 Program Description
Extra Teacher Program
The Extra Teacher Program (ETP), implemented in 2005 and 2006, provided funds to school
committees to hire one PTA teacher to supplement TSC teachers teaching in lower grades. The
program was implemented by the non-governmental organization International Child Support (ICS),
with funding from the World Bank, in a random subset of schools in three districts of Western
Kenya. ICS staff met with the headmaster, the civil-service teachers assigned to the lower grades,
and the parents of students in grade 1 to explain how the program worked and ask if they wanted to
participate. To qualify for ICS funding, the PTA teacher hired under the ETP contract had to have
the same academic qualifications as civil-service teachers, and schools participating in the program
had to create an additional section in first grade and randomly assign students and the ETP contract
teacher across sections. (The randomization was carried out by ICS staff with support from the
research team.) Other inputs, such as classroom facilities, were also supposed to be equally allocated
across sections.9
If the PTA teacher hired under the Extra Teacher Program left the school (to take on a TSC
position, or for any other reason) or was fired by the school, the school was allowed (and in fact
encouraged) to replace the PTA teacher as quickly as possible. 8 Kremer, Moulin, and Namunyu (2003) argued that class sizes in the upper grades were often inefficiently small in Kenya prior to the institution of free primary education. Since then, free primary education has led to an explosion in enrollment not matched by teacher recruitment, which has led to a dramatic increase in class size, especially in lower grades. 9 In practice, established civil-service teachers may have pulled rank and obtained better physical classroom infrastructure. We do not have data to estimate how common this was, but in any case, it would tend to bias downwards estimates of the contract teacher effect and bias upwards estimates of the effectiveness of class-size reductions.
8
Importantly, PTA teachers hired under ETP focused on a specific class (one of the sections in
first grade), in contrast to TSC teachers who most often focused on a particular subject. In addition
to its potential pedagogical benefits, this setup mirrored the organization of school committees and
made it easier for parents to hold teachers accountable. For example, if a parent learned that their
child spent a lot of the day unsupervised, they would know who is responsible if a single teacher is
assigned to the class. When the program continued the following school year, school committees
were free to replace or keep the ETP contract teacher, but they were asked to move the teacher to
second grade with the same group of students.10
The monthly allowance for teachers under the Extra Teacher Program was 2,500 Kenyan
shillings (around US$35), putting it at the top of the range of what is typically paid to locally-hired
contract teachers by school committees in Kenya, but at only one quarter of the typical TSC
teachers’ salaries, and a smaller fraction of their compensation, since civil-service teachers also
receive benefits including pensions and housing allowances.
The Extra Teacher Program represents a shift in the balance between local parent control and
formal professional control, central standards, and the role of the state, but it should be seen as
augmenting, rather than replacing, the role of the central state. Likewise, it does not replace the
current system where teachers have tenure, but rather augments it with a probationary period.
Eligibility for the program was restricted to graduates of teacher training colleges, and ETP contract
teachers reported to centrally appointed headmasters. As mentioned above, headmasters typically
have considerable influence within school committees. Contract teachers hired under ETP were
likely motivated in part by the prospect that they would eventually obtain civil-service jobs.
School-Based Management Training (SBM)
The School-Based Management (SBM) training, implemented by a trained ICS officer in a random
subset of ETP schools, was designed to empower PTA committee members (in particular, the
parents, as opposed to only the headmaster) to monitor teacher performance. The training lasted
about 90 minutes, and immediately followed the meeting that ICS held with parents to inform them
of the Extra-Teacher Program. All parents were welcome to stay for the SBM training if they so
wished.11 During the training, PTA committee members were encouraged to supervise the recruiting
10 Students enrolled in grade 2 in 2005 and who repeated grade 2 in 2006 were randomly assigned to either the contract teacher or the civil service teachers in 2006. 11 This training took place before students had been randomized into the class taught by the contract teacher or a regular class, and therefore involved all grade 1 parents.
9
of the extra-teacher, taught how to conduct interviews, and taught techniques for soliciting input
from other parents and checking teacher attendance. Two parents of grade 1 students were asked to
volunteer to perform attendance checks on the teachers on a regular basis, and were given a
notebook to record attendance. A formal sub-committee of first grade parents was formed to
evaluate the contract teacher and deliver a performance report at the end of the first year. Finally,
the PTA committees were asked to hold a formal review meeting at the end of the first school year
of the program to assess the contract teacher’s performance and decide whether to renew the
teacher’s contract or replace the teacher.
Although the SBM training focused on empowering parents to actively monitor the contract
teacher, the encouragement and advice it provided on how to measure teacher performance may
have helped parents to notice, and act on, the greater issue of absenteeism among civil-service
teachers, and in particular to make sure the contract teacher was effectively used to increase
resources available to grade 1 pupils, rather than to reduce workload for the other teachers.
Tracking
A separate set of schools were chosen for an alternative Extra Teacher Program. In those schools,
the first-grade class was divided into two sections by initial achievement (“tracking”), and the ETP
contract teacher was randomly assigned to one of these sections. This program is discussed in a
companion paper (Duflo et al. 2011) and, since the pedagogy and classroom organizations changed
significantly in those schools, data for the schools participating in that program is not part of the
sample analyzed in this paper.
3.2 Experimental Design
Background data on enrollment, pupil-teacher ratios, and number of grade 1 sections was collected
in 210 primary schools in Kenya’s Western Province in 2004. Of these, 70 were randomly assigned
to the tracking program and are not the focus of this paper. The remaining 140 schools were
stratified by administrative division and number of grade 1 sections and randomly divided into a
comparison group, and an Extra Teacher Program (ETP) group, each with 70 schools. Thirty four
of the 70 ETP schools were randomly chosen to be offered the opportunity to participate in SBM
training. ICS held its school meetings to explain the program to parents and teachers in March 2005.
All schools offered the opportunity to participate in the ETP and SBM programs chose to do so.
10
Schools selected for the Extra Teacher Program generally had teachers in place by early May 2005,
the start of the second of the three school terms in Kenya’s academic year.
Table 1 presents summary statistics. Panel A shows no significant differences in observable
characteristics at baseline. Panel B suggests that the program was successful at reducing pupil-
teacher ratios over two years. While average class size in grade 1 in 2005 in the comparison schools
was 82, it was only 44 in ETP schools.12 This class size gap was somewhat attenuated the following
year in second grade: in 2006, average class size in second grade was 68 in comparison schools and
42 in ETP schools. The class size gap fell over time because students assigned to the contract
teacher in ETP schools were much more likely to be promoted to grade 2 than students in
comparison schools (consistent with their better performance, which we discuss in section 4).13
Students typically attended their assigned section when both teachers were present, but when
teachers were absent, sections were sometimes combined. On average across four unannounced
school visits, 94% of students were found in their assigned section (conditional on the two sections
being taught separately), and there was no significant difference between schools with and without
SBM training. Sections were found pooled in only 10.7% of visits. The rate at which classes were
pooled was not affected by the SBM training.14
Finally, and interestingly, a number of ETP schools decided that the students not assigned to
the PTA teacher would be assigned to one exclusive TSC teacher: the likelihood of class-based
rather than subject-based assignment of TSC teachers was 18% in ETP schools compared to only
5% in control schools. We see no statistically significant difference in test scores of students taught
by a single TSC teacher and students taught by rotating TSC teachers, however.
3.3 Study Sample
Summary statistics about the students and teachers in the study are shown in Table 1. The student
sampling frame is the cohort of approximately 13,500 children enrolled in first grade at the end of
the first school term of 2005. Students averaged 7.7 years old at the outset of the program (with a
standard deviation of 0.5 years), but ages ranged from 5 to 14. Baseline data on students’ initial
achievement was collected from the school records at the onset of the study. This data is not based 12 Class size did not fall by exactly 50% since some schools already had two grade 1 sections at baseline. In these schools, the introduction of the Extra Teacher Program reduced class size by only one third. 13 The repetition rate is relatively high in Kenya. In year 2 of the program, the population in grade 2 thus included both those sampled students who had been promoted and did not transfer to another school, and grade 2 repeaters. 14 Analysis of the determinants of class pooling shows that absence of TSC teachers is a main driver of pooling, but contract teacher absence is not. This suggests that contract teachers covered for TSC teachers when TSC teachers were absent, but TSC teachers did not cover for contract teachers when those were absent.
11
on a common scale across schools, and thus can only be used for within-school comparisons.
Random assignment of students to teachers in ETP schools led to sections with comparable average
baseline scores.
A total of 754 teachers taught lessons in first grade in 2005, in second grade in 2006, or both.
Of those, 653 were centrally hired civil-service teachers, while 101 contract teachers were hired
through the program by the 70 ETP schools over the five school terms (corresponding to 15
months of instruction) it operated. Average age was 42 for civil-service teachers and 27 for contract
teachers, and contract teachers had 14 fewer years of experience than their TSC counterparts on
average. Contract teachers were also much less likely to be females than TSC teachers in our sample
(47% versus 66%). This is in part due to the fact that TSC teachers in our sample are those assigned
to lower grades, and female teachers are disproportionately assigned to lower grades. The share of
females in the entire TSC teacher body is on average 55% in our sample of schools, statistically
indistinguishable from the percentage among contract teachers.
3.4 Data
Test Scores and Attrition
Standardized tests covering math and literacy questions ranging from identifying numbers and letters
to subtracting two-digit numbers and writing words were administered in all schools after 5 school
terms (19 months total, but only 15 months of instruction), just before the program ended
(November 2006). The same tests were administered again during a follow-up one year after the
program ended (November 2007). Tests were administered by trained enumerators and graded
blindly by a separate team of enumerators. In each school, 60 students were randomly drawn from
the baseline sample to participate in the tests, for a total of around 8,000 students across all schools.
To limit attrition, enumerators were instructed to go to the homes of students who had dropped
out or were absent on the day of the test and to bring them to school for the test. Not all students
were found and tested, however. Overall, the attrition rate was 18 percent for the endline test, and
23 percent for the long-run follow-up test.
Appendix Table A1 presents estimates of attrition by treatment groups. At endline, attrition
was lower in ETP schools, especially for students assigned to the contract teachers. Low
achievement students were significantly less likely to attrit from SBM schools, and less likely to attrit
if they had been assigned to the contract teacher (although, surprisingly, if they were assigned to the
contract teacher in an SBM school, they were not significantly less likely to attrit). This suggests that
12
the differential attrition will bias downwards the estimates of the impact of SBM on students
assigned to regular teachers, and bias downwards the estimates of the short-run impact of contract
teachers in non-SBM schools. The interaction between being in an SBM school and being taught by
the contract teacher led to significantly lower attrition among higher-achieving students, however.
Estimates of the effect of the combination of SBM and contract teacher may thus be upward biased.
The patterns of attrition are roughly similar in the long-run follow-up. Given the substantial
evidence of differential attrition, when estimating impacts on test scores below we estimate lower
bounds, correcting for attrition à la Lee.
Teacher Effort
Over the course of the program, four unannounced school visits were made by the research team to
measure teacher effort. Teacher effort was measured by the teacher’s presence in school and by
whether she was in class teaching when the observers entered the school compound. Data on
pedagogy was collected through classroom observations and structured interviews with teachers.
Hiring, Retention, and Regularization of Contract Teachers
In the school term that followed the start of the program, data was collected on the contract-
teachers hired through the program, including their demographic characteristics, past experience,
relationship to the school (i.e., whether they are related to a teacher or a pupil), and the hiring
process. Demographic data was also collected on civil-service teachers. In the school term that
followed the end of the program, headmasters of program schools were interviewed about the status
of the contract-teacher, and whether the school committee had taken over the extra-teacher
program after the ICS subsidy ended.
4. Results: Program Impacts
This section estimates the program impacts on pupil test scores (Subsection 4.1) and teacher
behavior (Subsection 4.2).
4.1 Learning Outcomes
We use the following reduced form equation to estimate the effects of each program component on
student outcomes:
13
Yij = a1ETPj + a2ETPj × SBMj + a3ETPj × CTij + a4ETPj × CTij × SBMj + Xij’a5 + εij1 (1)
where Yij is the endline test score of student i in school j (expressed in standard deviations of the
distribution of scores in the comparison schools),15 ETPj is a dummy equal to 1 if school j
participated in the Extra Teacher Program, SBMj is a dummy equal to 1 if school j participated in the
School-Based Management training, CTij is a dummy equal to 1 if student i was assigned to the
contract teacher, and Xij is a vector of student and teacher control variables.
The results are presented in Table 2. We present the results of three specifications that vary in
the content of the Xij vector. The first specification includes no controls at all. The second
specification includes the following school-level controls: school size, the share of females among
TSC teachers in lower grades and the average experience of TSC teachers in lower grades; and the
following student-level controls: gender, standardized test score at baseline, age at the time of the
test, and date of the test. Finally, the third specification further controls for whether the teacher is
“novice,” that is, has less than 1 year of experience (this is the case for less than 1% of the civil
service teachers but 24% of the contract teachers). Appendix Table A2 shows the estimated lower
bounds for these specifications accounting for attrition, using the approach first proposed in Lee
(2008).16
In equation (1), a1 is the effect of being in a reduced pupil-teacher ratio environment, for
students assigned to civil-service teachers in non-SBM schools. This effect is small (0.074 standard
deviations in column 2 of Table 2, the specification with the full set of control variables) and
insignificantly different from zero (standard error: 0.088). The 95% confidence interval excludes
gains of even one-quarter of a standard deviation for a decline in class size of almost 50%.
The coefficient a2 is the difference between test scores of students in SBM and non-SBM
schools for students assigned to the civil-service teachers in ETP schools. The difference is sizeable:
students assigned to the civil-service teacher score approximately 0.13 standard deviations higher in
SBM schools, relative to non-SBM schools. The difference is not significant for overall test scores,
but is significant at the 10% level for math at approximately 0.18 standard deviations. This very
cheap intervention more than doubles the effectiveness of the Extra Teacher Program, and makes it
significantly positive, controlling for teacher experience: overall, students assigned to the civil-service
15 An alternative specification of the endline test score for math, using item response theory, yields similar results (available from the authors). The format of the language score was not appropriate for this exercise. 16 The method amounts to the following: for each treatment group, we identify the “attrition deficit” (e.g., the excess proportion of students who did not attrit compared to the comparison group), and then “trimming” the upper tail of the test score distribution by this proportion, yielding a worst-case scenario bound. To refine the bound, we use two baseline covariates (gender and age above/below median) and, within each treatment group, use different trimming proportions for each gender-age category. Overall, this procedure trims 3.1% of the 3,223 students in ETP schools.
14
teachers in schools that receive the Extra Teacher Program with the SBM empowerment training do
significantly better (0.204 standard deviations with a p-value of 0.036, Table 2 column 2, row 14)
than students in comparison schools. This result appears relatively robust in controlling for attrition,
even with strict assumptions: the lower bound estimate for this effect, presented in column 1, row
14 of Table A2, is 0.143 (with a p-value of 0.129).
Coefficient a3 in equation (1) is the difference between test scores of students assigned to civil-
service teachers and those assigned to contract teachers, in schools without SBM. Students’ scores
are 0.228 standard deviations higher if they are assigned to the contract teacher rather than to civil-
service teachers (Table 2, column 2, row 3). The lower Manski-Lee bound of this difference
estimated in Table A2 remains high and significant at conventional levels. Note that this large effect
of the contract teacher on test scores should not be interpreted as the effect of the contract alone.
Recall that contract teachers were instructed to spend all day with one specific section/class, and to
teach all subjects to this class, while in most schools civil-service teachers rotate across
sections/classes, teaching one subject to many classes. This could change teacher effort, for example
if teachers focused on a single grade are more accountable or develop stronger bonds with their
pupils. Furthermore, there could be pedagogical effects of being taught by a single teacher
throughout the day, holding teacher effort constant.
The SBM training program partly bridges the gap between children assigned to the civil-service
teachers and those assigned to the contract teacher: the difference is lower in SBM schools
(coefficient a4, Table 2, row 4). We cannot reject the null that the total effect of being assigned to a
contract teacher is the same in SBM and non-SBM schools (the total effects computed in rows 15
and 16 are statistically indistinguishable from each other).
As noted above, roughly one-quarter of contract teachers are novices, and when one controls for
this, the estimated contract teacher effect grows to 0.241 standard deviations (row 3, column 3).17
The coefficient estimate on the novice teacher dummy is -0.065 with a standard error of 0.091
(Table 2, column 3, row 11). Of course, the coefficient on novice teachers in the regression is based
on non-experimental variation and may not represent the causal impact of being a novice teacher, so
this estimate should be interpreted with caution. 18
The breakdown by subjects in columns 4 to 7 suggests that all the effects are stronger in math
17 Novice teachers typically have lower value added (Kane et al., 2008; Rockoff and Staiger, 2010). Since all teachers will have to be novices for one year of their careers under any institutional arrangement, in calculating the impact of the PTA contract teacher program, it is conceptually appropriate to net out the novice teacher effect. 18 We note however that our point estimate of -0.065 is very similar to those observed in the US. Rockoff and Staiger (2010) estimate novice effects of -0.07 in Los Angeles and -0.06 to -0.08 in New York City.
15
than in literacy. Both the SBM effect and the contract teacher effect are more than double for math
than for literacy.
Appendix Table A3 presents the long-run impacts. A year after the program ended, program
effects remained significant only for students in schools with SBM training. The fact that fadeout is
less pronounced among this subgroup of schools is consistent with the fact that, as we will discuss
below in section 5.2, schools with SBM training were significantly more likely to retain the contract
teacher over the year that followed the end of the subsidized Extra Teacher Program. The long-run
effect on test scores in SBM schools is only significant at the 10% level for math, and it loses
significance when we estimate the lower Lee bound correcting for attrition.
4.2 Teacher Effort and Pedagogy
Table 3 estimates program impact on teacher effort and on pedagogy using data from unannounced
spot checks, classroom observations conducted with a subset of teachers, and surveys administered
to teachers.
Contract teachers were 27.8 percentage points more likely to be found in a classroom and
teaching during a random visit than civil-service teachers in comparison schools (the mean for the
civil-service teachers in the comparison group was 57.9%, see Table 3, column 1, row 10). Civil-
service teachers in ETP schools were 12.9 percentage points less likely to be found in class teaching
during a school visit than their counterparts in comparison schools. This effect is significant at the
1% level (Table 3, Column 1) and corresponds to a 22 percent decrease in teacher presence in class
compared to comparison schools. This suggests that civil-service teachers took advantage of the
presence of the contract teachers to work less. Contract teachers might not have been in a position
to refuse teaching combined classes when civil-service teachers were absent.
However, there is evidence that this reduction in effort by civil-service teachers was largely
mitigated through community empowerment. Civil-service teachers in schools that received the
Extra Teacher Program with SBM training were 7.5 percentage points more likely to be found in
class teaching than those in schools that received the Extra Teacher Program alone (Table 3, Row 2,
Column 1; the standard error is 0.043). It seems likely that SBM directly affected civil-service
teachers, rather than influencing them by reducing the likelihood PTA teachers would cover classes
for them, since we find no effect of SBM training on the likelihood that contract teachers were
covering classes for civil-service teachers during unscheduled school visits (results available upon
request).
16
The SBM program did not affect teacher presence on the school compound, but increased the
likelihood that teachers were in class teaching (Table 3, Columns 2 and 3). While teachers who are
present but not teaching might sometimes be grading or performing some other duty for the school,
in the great majority of the cases we observed teachers were drinking tea with other teachers or
reading a newspaper, and therefore we are confident that the increase in classroom time we observe
among TSC teachers in the SBM schools corresponds to an increase in effort, not to a reallocation
of total effort towards grade 1 specific effort. Note that it seems easier for teachers to adjust on this
margin. It is also easier for parents to observe and enforce along this margin. That is because
teachers who are absent from the school compound might claim that their absence was work-related
(e.g., in-service training, proctoring, committee work), and parents would not be able to verify such
claims without the assistance of the headmaster.
It is impossible for us to determine the extent to which the gain in test scores can be attributed
to changes in teacher effort as opposed to changes in pedagogy associated with the focus on a single
class or the fact that contract teachers were typically younger. That said, there is little evidence of
changes in pedagogy other than those associated with changes in teacher effort.
We measured changes in pedagogy through direct observation of lessons and structured
interviews with teachers about classroom processes. Students in ETP schools were more likely to be
called to the blackboard and to be called on to answer questions. Teachers in those schools (whether
civil servants or contract teachers) also report having more time to provide individual attention to
children. However, SBM training did not seem to affect other measures of pedagogy (Table 3,
Columns 4 to 9.) A smaller share of students of novice teachers report answering questions and
novice teachers report difficulty paying attention to slow learners.
One might expect a bigger impact of moving from rotation to a system in which students are
taught by a single teacher in schools where more teachers share the first-grade class. We therefore
estimated how the ETP teacher effect varied with the number of civil-service teachers rotating in the
non-ETP section. This test has low power, but we do not find any indication that the ETP teacher
effect is greater in schools where more teachers share classes.
While we see relatively large learning effects in the years contract teachers are present, these
effects appear to fade out once students are reassigned to regular classes. One year after the program
ended and students had gone back to being taught by rotating civil service teachers in large classes,
most of the effects were no longer statistically significant. Such fade-out is not out of line with the
decay in test scores observed for other early interventions, including India (e.g. Banerjee et al, 2007)
17
and the US (see Cascio and Staiger, 2011, for a review), and with rates of fade out estimated in
developing countries (Andrabi et al. (2011) find that only a fifth to a half of learning persists
between grades), but contrasts with the more persistent effects of tracking that we observed in the
same context (Duflo et al, 2011). Also note that decay in test score effects does not necessarily imply
a comparable decay in non-cognitive impacts (see Chetty et al. (2010) for evidence of long-run
effects on earnings of an early intervention that had only short-run effects on test scores). Note
that if there were no long-run effect, hiring teachers on a contract basis would still be attractive on
cost grounds relative to the alternative of hiring an equivalent number of civil-service teachers. 19
It should also be noted that, while we find positive and significant effects of SBM training on
test scores in the context of the main Extra Teacher Program, the estimated effects were smaller and
not statistically significant in the tracking program (results are available upon request). This may
merely reflect the more limited scope for improvement under that program: the tracking program
already increases teacher effort (at least in the top track), probably leaving little scope to further
increase effort and test scores.
As previously noted, our results should be interpreted as the impact of supplementing a civil
service system with locally-hired contract teachers, brought in on a probationary basis, with the
expectation of eventually obtaining a civil-service position, not as the impact of replacing a civil
service teacher system with a system based entirely on local hiring of contract teachers. The contract
teachers we study likely worked hard in part because they believed this would help them obtain a
civil-service position, and, as discussed in the next section, about half of the contract teachers in our
study eventually obtained civil-service positions by the end of our study period, with better-
performing teachers more likely to obtain these positions.20
19 The estimates in section 4.1 and 4.2 could potentially be combined to disentangle the possible gains of decreasing class size (keeping effort constant) and the impact of effort (proxied by teacher’s time in class). In an earlier draft of the paper, we considered two different IV estimates, with different exclusion restrictions. First, we assumed that, conditional on teacher’s sex and experience (which are observed), the only difference between contract teachers and civil-service teachers is that contract teachers have stronger incentives. Under this assumption, the experimental design provides four instruments for class size and effort: whether the student is in an ETP school, whether the student is in an SBM school, whether the student was assigned to a contract teacher, and the interaction between being assigned to a contract teacher and being in an SBM school. The second IV estimate did not use being assigned to a contract teacher as an excluded instrument, thus allowing for an effect of assigning a single teacher to a class. The results suggested that a negative but modest (significant) effect of class size on test scores, and a positive and large significant effect of teacher effort on test scores. Given that the exclusion restriction for SBM as an instrument for effort is questionable (in particular, because SBM could have had a direct effort on parental involvement), those IV results should be considered illustrative rather than definitive. 20 Given these incentives, it is impossible to say what would happen if TSC teachers were phased out and replaced by contract teachers without any prospect of tenure.
18
5. Dynamic Effects of Local Contract Teacher Hiring
The results in section 4 suggest that in the short run, moving from a system of education in which
teachers are immediately given tenure and managed solely through centralized state-run institutions,
to a system in which teachers are initially hired locally on temporary contracts before becoming
eligible for TSC positions and local PTAs are trained in how to recruit and monitor teachers, would
not only save roughly 75% on teacher salaries during this initial phase but also significantly
strengthen incentives for teachers and produce better learning outcomes.
However, the long-run impact of adding a new phase to the career of teachers in which they are
hired locally on short-run contracts before obtaining civil-service positions depends not only on the
relative performance of civil-service teachers and contract teachers at a given point in time, but also
on how local hiring of contract teachers affects the teacher workforce over time. Understanding this
requires an analysis of which contract teachers transition to civil-service jobs and how PTA
committees select and retain contract teachers. One concern is that decentralization may lead to
nepotism – for example, Durante et al. (2011) find that a 1998 reform that increased autonomy by
local university officials in Italy resulted, in some areas, in a significant increase in the incidence of
nepotism towards relatives.
In this section, we first present evidence that contract teachers whose students performed well
were more likely to be hired as civil-service teachers, suggesting potential dynamic benefits from a
local contract teacher hiring program.21 However, maximizing these benefits requires selecting the
best contract teachers. Teachers on PTA hiring committees may wish to transfer rents toward
relatives by offering them contract teacher positions, which may lead to civil-service positions paid
above market-clearing wages; those relatives may perform less well once they have obtained a
position, both because of weaker selection and because of weaker incentives. Since the central
government typically posts new civil-service hires to schools other than the school where they
worked as contract teachers, schools hiring contract teachers do not bear the long-run consequences
of hiring relatives with low motivation or talent for teaching. In fact, many PTA committees hired
relatives of existing teachers, particularly in schools with a high proportion of male teachers. These
relatives were present and teaching less often than other contract teachers, and their students scored
lower on tests. Point estimates suggest that SBM training, which was designed to empower parents,
reduced hiring of teacher relatives, and that those relatives hired under SBM were present and 21 We had no contact with the TSC during the study, but we conducted interviews with school headmasters at the end of the program, and those interviews suggest that headmasters can recommend contract teachers to the TSC hiring commission.
19
teaching in class more often and their students learned more, compared to teacher relatives hired
without SBM.
5.1 Potential Dynamic Impact of Contract Teachers on Teacher Workforce
To see the potential of contract teacher programs in channeling good teachers into civil-service
positions, note that by the beginning of year 3, the year after the program ended, 47% of the initial
contract teachers had been hired by the TSC (Table 4, Column 7).22 Experience (a proxy for cohort)
was an important driver in TSC hiring. But holding experience and school quality constant, contract
teachers whose students had good scores were more likely to be hired by the TSC. A one standard
deviation increase in student performance increases the likelihood that the ETP teacher was
absorbed by the TSC by 34 percentage points (Table 4, column 7). Students of contract teachers
hired by the TSC scored 0.32 standard deviations greater than their counterparts who had teachers
who were not hired by the TSC.23 This 0.32 standard deviations can plausibly be considered a lower
bound on the difference in teacher value added between those hired by the TSC and those not hired,
since students of teachers hired by the TSC presumably experienced some disruption from changing
teachers and the replacement teachers were presumably typically of lower skill than those hired by
the TSC.24
It seems likely that benchmark competition between contract teachers and existing civil service
teachers was responsible for the tendency for teachers with better scores to obtain TSC positions.
Indeed, there was no relationship between student test scores and teacher hiring by the TSC in the
schools where students were tracked by initial performance, which presumably made it more
difficult to measure contract teacher performance.
Gordon, Kane, and Staiger (2006) estimate that in Los Angeles, dropping the bottom quartile of
teachers after their first year of teaching would increase the average impact of retained teachers by
1.5 percentile points. This would be partially offset by the need to increase the flow of new teachers
into the system and thus the increased proportion of novice teachers, so the net increase in student
22 Data on the contract teacher are missing for 2 of 70 program schools. 23 This estimate was obtained through an OLS regression run on the subset of students assigned to the ETP contact teacher. We regress students’ endline scores on a dummy equal to 1 if the ETP teacher was hired by TSC within 2 years of the program start, controlling for the same student and school level controls as in column 3 of Table 2. The coefficient is 0.32 and the standard error is 0.11. 24 Among contract teachers hired by the TSC, 40% were hired in the course of their first year as ETP teachers, 35% were hired in the course of their second ETP year, and 25% were hired right after they completed their second ETP year. This means that we have little power to examine the difference in test scores between students of teachers who were hired by the TSC after the endline test and students of teachers who were never hired by the TSC, but we cannot reject the hypothesis that this difference is also 0.32 standard deviations.
20
test score gains would be 1.2 percentile points per year. In our context, the potential benefits of a
system in which new teachers initially work as contract teachers are far greater, for two reasons.
First, the gap in teacher effectiveness appears larger – as discussed above, the gap we observe in our
data between the students of the roughly 50% of ETP teachers that were hired into the TSC and the
students of those not hired is 0.32 standard deviations, even though performance was not the only
criterion used by TSC when hiring. Second, the negative novice teacher effect is counteracted by a
positive contract teacher effect, as seen in Section 4.
To get a sense of how big the total effect might be, suppose teachers work for 27 years. (The
standard retirement age for civil servants in Kenya is 55 and contract teachers in our sample are 27
years old on average.) If new entrants to the profession worked three years as a contract teacher and
half were subsequently hired as civil service teachers, then 20% of the teaching force would be made
up of contract teachers in steady state. The proportion of novices in the system would double from
1 in 30 to 2 in 30, bringing down average scores by 0.065/30 or 0.0022 standard deviations.
Assuming that students of experienced contract teachers score 0.275 standard deviations more than
students of their civil-service teacher counterparts (Column 3 of Table 4, row 16), this effect would
boost average test scores by 0.275 x 0.2 – 0.0022 = 0.0523 standard deviations. (Note that this
includes the impact of any class size reduction due to the additional contract teachers.) The 80% of
the teacher workforce made up of civil service teachers would have scored, while on contract, 0.32
standard deviations more than their counterparts who were not hired into the civil service. If we
assume that only half of this effect persists once they become civil-service teachers,25 students of
teachers hired into the civil service would in the long run score 0.16 standard deviations more than
those who were not hired into the TSC. Since 80% of teachers would be TSC teachers, the gain in
test scores among students overall from improved quality of the TSC workforce is 0.16 X 0.8 = 0.13
standard deviations. Overall, the gain would be approximately 0.052+ 0.13 = 0.182 standard
deviations.26
The analysis above assumes that the entire gain in student performance documented in section
4 for contract teachers is due to their exerting higher effort in response to stronger incentives and
therefore does not persist once they become civil servants. However, it could also reflect positive
25 The literature on the inter-temporal stability of teacher effectiveness is mostly based on US data. Raw correlations are around 0.3-0.4. See McCaffrey et al. (2009) and Goldhaber and Hansen (2008). Using multiple years of data to reduce the noise coming from variation in students, McCaffrey et al. (2009) estimate within-teacher correlation in value added ranging from 0.5 in elementary grades to 0.8 in middle grades. 26 Note that this calculation interprets the novice teacher effect as causal. The true novice teacher effect could be different but this would have a relatively minor effect on the overall calculation.
21
selection among those initially hired as contract teachers compared to civil servants, which would
mean some of the effect would persist, in which case our 0.182 standard deviation estimate above
should be interpreted as a lower bound. To obtain an upper bound of the possible effect, if the
entire test score gain in section 4 were due to selection rather than incentives, then in steady state
rather than only roughly 20% of the teaching workforce generating the test score gain we observe
among students of ETP teachers, 100% would, increasing the estimated effect by an additional 0.22
standard deviations, for a total gain of approximately 0.4 standard deviation.27
Of course we cannot measure all potential channels of dynamic impact. Incentives to become a
teacher could potentially either increase or decrease under a system in which teachers initially were
hired on a contract basis by local PTAs. As discussed earlier, under the current system, civil-service
teacher wages are held far above market clearing levels by the politically powerful teacher union.
This motivates many to train as teachers. Jobs are rationed by queuing, so those entering teacher
training college currently can expect several years of unemployment. Replacing a period of
unemployment with a period of contract teaching at low wages could potentially increase the net
present value of becoming a teacher. On the other hand, entering teacher training college will be less
attractive to the extent prospective teacher training students fear that they will perform badly as
contract teachers and therefore will not eventually obtain civil-service positions.28
It is also possible that there is complementarity or substitutability between teacher value added
and the incentive system, so the gap in performance between teachers under civil-service contracts
could be either smaller or larger than under short-term contracts.
5.2 Selection and Retention of Contract Teachers: Teacher Rent Seeking and Parents’ Empowerment
Realizing the full dynamic benefit of contract teacher programs requires hiring and retaining good
contract teachers and getting rid of bad teachers. As noted above, when civil-service positions open
up, contract teachers typically have to switch schools to obtain them. To the extent that it reveals
27 Note that another reason this figure should be considered an upper bound is that it is based on comparing contract teachers to civil-service teachers who teach the lower grades and thus may not be representative of civil-service teachers as a whole. 28 While in general equilibrium if programs to fund PTAs to hire locally on temporary contracts were expanded to cover all of the schools in the area, the pool of potential contract teachers would be somewhat reduced, this effect is likely small, as two thirds of schools in the area were provided funds to hire contract teachers either through this program or through the tracking program described in Duflo et al. (2011), and contract teachers in the program were drawn from the local area.
22
information, hiring and retaining a good contract teacher thus potentially generates positive
externalities for other schools. However, since contract teachers often become civil-service teachers,
hiring contract teachers may provide opportunities to allocate rents.
As background, in Kenya, those with formal sector jobs often face strong pressure from
members of their extended families to help them obtain such jobs as well. This pressure may be
particularly strong for males, because Kenya is a patrilocal society and contract teachers are
overwhelmingly hired from the local area, so a greater proportion of male teachers will be local to
the area of the school and will have relatives from the area interested in applying for the job.29
Moreover, women are considered to have fewer obligations towards their birth family when they
marry into a new family.
To understand the factors influencing hiring and retention of contract teachers it is useful to
consider the following framework. Suppose PTA hiring committees can be motivated both by a
desire to obtain rents for relatives and a desire to improve student performance. We assume that
among the members of the PTA, parents put relatively more weight on maximizing student
performance, while teachers (particularly male teachers) put more weight on delivering rents to their
relatives. Insofar as SBM training empowers parents within the PTA committee, it will reduce the
weight PTA committees place on delivering rents to relatives of teachers.
Suppose that PTA hiring committees receive applications and can obtain observable
information such as sex, education, and experience along with an imperfect signal of teacher quality.
Suppose also that teachers can supply additional information on their relatives creating a force
leading to a potentially positive impact of hiring relatives. Once teachers have been hired, school
committees obtain additional information on their performance and decide whether to renew their
contract and, more generally, how to manage them, and civil-service teachers may continue to
deliver rents to relatives. Relatives choose effort levels knowing this.
The combined effects of information and rent seeking on aggregate hiring of relatives and on the
relative test scores of students of relatives of existing civil-service teachers are ambiguous, but this
framework suggests that SBM should unambiguously reduce hiring of teacher relatives, particularly
those hired due to rent-seeking motives as opposed to those hired based on positive information
provided by teachers working at the school. Moreover, if it is politically more difficult for teachers
on PTA committees to fire teacher relatives, then in equilibrium we might see lower effort among
those relatives (due to lower incentives), but may increase equilibrium effort among teacher relatives 29 While TSC teachers are initially posted outside of their home area, they become eligible to choose their location as they gain seniority, and it is very common for seasoned TSC teachers to be in posts in their home area.
23

working as contract teachers. Test scores of students of relatives should be higher under SBM than
without it. We have limited power to test these predictions due to the small sample size, but the
evidence we do have is consistent with the predictions.
Hiring of Relatives
In ETP schools without SBM, 31% of contract teachers hired were relatives of existing civil-service
teachers, while in SBM schools the share of relatives among contract teachers was about half that, at
16% (Table 4, column 5; the t-statistic on the SBM effect is only 1.5 due to the limited sample size,
but a similar SBM effect was observed in tracking schools, suggesting this is not coincidence.)
One frequent concern with local empowerment programs is the risk of local capture:
empowering parents within PTA might merely lead to a bias towards locals, perhaps with a strong
ethnic component. However, there is no evidence that the SBM program led to a shift in favoritism
from relatives of teachers to locals. On the contrary, point estimates suggest SBM schools were 12
percentage points less likely to hire contract teachers from the local area, although the difference is
not significant given the small sample size (see Column 4, Table 4.).30 More generally, it seems that
SBM training increased the transparency of the contract-teacher recruiting process. SBM schools
advertised for the position more broadly and interviewed more candidates (results available upon
request).
Another concern is that teachers may be more influenced by professional qualifications, while
parents may be influenced by cultural factors, such as preferences for men. Point estimates suggest
the possibility that empowering local parents reduced hiring of women as contract teachers, but
effects are far from significant in our small sample (Table 4, column 1). Students of female teachers
score better (see Table 2, column 2, row 6), and thus the impact of SBM on contract teacher gender
seems to have counteracted the impact of SBM on hiring relatives. Overall, we cannot reject the
hypothesis that students of contract teachers perform equally well with and without SBM (see Table
2, rows 15 and 16).
Performance-based Retention
As we noted (and is clear from Table 4, column 7), teachers who performed well were more likely to
be absorbed by the TSC. We also see that PTAs were more likely to retain more effective teachers
30 SBM schools were also less likely to hire someone related to a pupil or parent (data not shown).
24
(among those who were not hired by the TSC).31 Overall, 19% of contract teachers left their school
(for reasons other than having obtained a TSC position) before the end of the program and had to
be replaced. Teachers whose students’ had poor endline performance were more likely to leave, with
a one standard deviation reduction in test scores associated with a 24 percentage point increase in
the chance of early departure (Table 4, column 6). Note however that the low performance of the
students may have been caused by the early departure, rather than the other way around.
Even more telling is what happened at the end of the program. The funds for the program
stopped, but PTAs could raise their own funds to continue it. Schools with the SBM program
(which increased the overall learning impact of the Extra Teacher Program) were more likely to
retain contract teachers into year 3. While 25% of the non-SBM schools in which the contract
teacher was not absorbed by the TSC kept the contract teacher on board after the ICS subsidy
ended, this figure was 48% among SBM schools (see Table 4, column 8). The finding that parents
were twice as likely to pay to continue employment of the contract teacher when they had stronger
governance rights is dramatic. We cannot distinguish the direct channel of parents being more
willing to raise funds for a program because they felt they had a greater role in governance from the
indirect channel of governance improving program performance and this in turn increasing
willingness to pay.
Finally, among teachers not hired by the TSC, PTAs were more likely to retain good teachers: a
one standard deviation increase in student scores is associated with a 43 percentage point higher
likelihood of retention as a PTA teacher for teachers who were not hired by the TSC in year 3
(Table 4, column 9). Interestingly, this correlation entirely disappears for teachers who are relatives
of the teachers in the schools, consistent with the lower incentives they face (results available upon
request). Column 9 in Table 4 shows that relatives are not less likely to be retained, despite worse
performance, so conditional on performance, relatives are more likely to be retained.
Teacher effort and student performance
The framework above suggests that teacher relatives hired under SBM should perform better than
teacher relatives hired in the absence of SBM, both because SBM should reduce rent seeking while
continuing to allow information flows and thus should improve selection of teachers, and because
SBM schools may be better able to monitor and incentivize those relatives of existing civil-service
teachers who are hired. Looking at student tests scores in column 1 of Table 5, we estimate both the
31 School committees never explicitly voted against renewing a contract.
25
main effect of being taught by an ETP teacher who is a relative of an existing teacher, and an
interaction between SBM and this variable. We do find that relatives perform less well than non-
relatives: the point estimate of the “teacher relative” effect on test scores is – 0.339 in non-SBM
schools (significant at the 10% level). This indicates that hiring relatives must to some extent be a
way to share rents, and is inefficient from society’s point of view. The SBM program entirely undoes
this effect however: the interaction is +0.385 standard deviations (significant at the 5% level). Taken
together, these numbers imply that in SBM schools the total “teacher relative effect” is statistically
undistinguishable from zero, consistent with the hypothesis that SBM undoes the tendency either to
select weak relatives or to let relatives get away with low effort.
Similarly, the point estimates in column 4 of Table 5 suggest that while contract teachers who
are relatives of civil-service teachers are less likely to be in class teaching, this tendency is mitigated
by the SBM program. Coefficients are large in magnitude and are significant at the 10% level.
The framework also suggests that if existing civil-service teachers are female, rent seeking will
be lower but information channels should still operate, leading to better performance of relatives of
females. The data is consistent with this: fewer teacher relatives were hired in schools with a higher
fraction of females among civil-service teachers in lower grades (Table 4, column 5), and students of
relatives hired as ETP teachers learned more in those schools (Table 5, column 1, significant at the
10% level). Point estimates suggest they were present and teaching in class more often (Table 5,
column 4).
5.3 Discussion
Hiring new teachers by local school committees on temporary contracts and then promoting them
to civil service positions based on performance has the potential not only to reduce salary costs, but
also to improve learning both in the short run and in the long run, by improving the teacher
workforce. However, to achieve the full benefits of such a program, it will be important to combine
it with SBM training, to empower parents and reduce rent seeking on behalf of existing teachers
(who, in our experiment, reduced the effect of the program by reducing their own effort in the
schools were there was no SBM training), and to limit the extent to which (possibly) weak relatives
of existing (male) teachers are hired and promoted regardless of their performance. From a
methodological standpoint, our analysis suggests a way to measure disproportionate hiring of
relatives. While there are legitimate reasons to hire relatives, comparing hiring and performance of
relatives hired under different institutions provides a way to measure this form of corruption.
26
6. Conclusion
Efforts to improve education in developing countries often focus either on providing additional
resources, typically by hiring more teachers to bring down class size, or on governance reform. We
examine two popular approaches: decentralized hiring of contract teachers, meant to decrease pupil-
teacher ratios at low cost while at the same time strengthening teacher incentives through local
control; and School-Based Management training programs, designed to empower parents. We
examine these two types of programs in Kenya, and find that they can work as complements. In the
absence of parents’ empowerment, the additional resources brought about by a contract teacher
program are partly captured by the existing civil-service teachers in two ways. First, civil-service
teachers reduce effort, which undoes the positive impact of class size reduction for their students.
Second, they seek to capture rents by hiring relatives, whose students perform less well than
students of other contract teachers. Empowering parents through a short training session mitigates
both these negative effects. First, in schools with SBM training, civil-service teachers were more
likely to be present in class and teaching; second, in those schools, relatives of civil-service teachers
were less likely to be hired as contract teachers; third, those relatives who were hired anyway
performed as well as non-relatives (which could come from better selection of the remaining
relatives, or stronger incentives).
Our results suggest that in the presence of weak institutions, increases in resources may be
undermined by the behavioral responses of existing providers. However, local governance offers
the potential to translate increased resources into better outcomes. In particular, programs
devolving authority to hire teachers on short-term contracts have potential both to improve test
scores in the short run and to improve the quality of the teaching labor force in the long run. But
details matter: small differences in program design (e.g., a few hours of SBM training) can
substantially affect outcomes.
In this light it is worth considering two related studies. A large-scale randomized study carried
out across Andhra Pradesh (AP) State in India contemporary to ours (Muralidharan and
Sundararaman, 2010) examines a program in which most contract teachers were not teacher training
college graduates and thus were not eligible to become civil-service teachers. They find average test
score gains very similar to those we observe, as well as reductions in civil-service teacher presence,
suggesting that very similar forces may be at play in a different geographic and institutional context.
Although the AP experiment did not include random assignment of students to contract and civil-
service teachers so cannot estimate the causal impact of reductions in pupil-teacher ratios within the
27
existing institutions, the authors observe that the correlation between class size and test score gains
declines at higher grades, suggesting heterogeneous returns to pupil-teacher ratio reductions as the
mechanism for the larger effect of the contract teacher program on lower grades.
The fact that similar effects were found in a context in which most contract teachers were not
eligible to become civil-service teachers suggests that contract teachers may perform well even with
less formal training and even without the incentive to perform well created by the possibility of a
formal sector job. Of course, on the other hand, structuring a program without opportunity for
contract teachers to become civil servants eliminates the potential discussed in Section 5 of this
paper for positive selection of better-performing contract teachers to raise the quality of the civil-
service workforce over time. The AP experiment did not include an interaction with SBM
empowerment training.
Preliminary results from a study following up on ours (Bold et al., 2012), also in Kenya, suggest
that the impact of contract teacher hiring is indeed sensitive to the institutional context and whether
the program is executed as designed. A contract teacher program in which administration was
contracted out to an NGO which made payments to school committees to hire teachers yielded
learning gains similar to those we found. But in a variant in which payments to schools were made
through the district offices of the Ministry of Education (a separate institution from the TSC, which
normally handles payments to civil-service teachers), contract teacher positions were less likely to be
filled, monthly payments to teachers were often seriously late (the average delay was 2.33 months
and 10% of teachers waited 10 months to be paid), and the program did not significantly improve
test scores. Bold et al. (2012) argue that part but not all of the difference is accounted for by the
unfilled vacancies and the late salary payments.
A classic objection to decentralization and local control is that it may lead to capture by local
elites. We indeed find evidence of such capture, but in our context, capture is not by local gentry or
high caste landowners, but rather by the local representatives of the central state itself. Kenya has
long had efforts to devolve control, for example through district-based planning. However, these
have taken place within the context of a centralized state without local, elected legislatures. Our
analysis suggests that unless such initiatives are combined with institutional reforms to allow
democratic control at the local level, local agents of the state may use devolution to capture rents.
Kenya's new constitution, overwhelmingly approved by voters, combines decentralization with the
creation of elected legislatures at the local level. We do see some potential indication, although far
from statistically significant, that empowerment of parents leads to selection of fewer female
28
teachers, so it may be worth considering combining decentralization initiatives with centrally-
enforced safeguards for women and other groups that may be discriminated against at a local level,
such as minority communities.
Methodologically, our results also have implications for the literature on corruption, governance,
and ethnic conflict. Much of the recent literature in economics on corruption focuses on financial
corruption – taking bribes or stealing state funds, for example. Yet we would argue that obligations
to relatives often conflict with obligations to the state, or to employers more generally, and that
favoring relatives is a widespread form of corruption.
It is also a form of corruption that interacts closely with ethnic politics. When civil servants
receive rents in the form of above-market wages, enjoy civil-service protection and thus long-term
employment, and can in turn influence the hiring of other civil servants, favoritism toward relatives
can launch a dynamic process of growth of a network of coethnics within the state. Our analysis
suggests that altruism towards those family members (or greater ability to enforce reciprocity within
the family) could be one reason why politics in much of Africa is often defined by ethnic cleavage,
rather than any other arbitrary variable (such as religion or class). Since marriage in the society we
study is primarily within ethnic group, relatives will overwhelmingly be coethnics, and since the
society is patrilineal, relatives of males will be coethnics. In societies in which only a minority have
the educational qualifications required for most civil-service jobs, networks of coethnics with
sufficient education to qualify for these jobs may be tight enough that individuals benefit indirectly
from hiring of unrelated coethnics.
What are the political prospects for local hiring of contract teachers? While teachers unions are
likely to resist efforts to reduce their members’ wages, they may be willing to compromise on a
system in which existing members are protected, but new entrants to the teaching profession are
first hired on short-term contracts at lower pay, and then are eventually brought in as civil-service
employees. Under some standard models of union bargaining, in which unions can set or negotiate
wages and benefits but the government controls total hiring of new civil-service teachers, some
teacher training college graduates who are willing to work at less than the government’s reservation
value will not be hired. One possible solution would be for the government to hire these teachers
outside union rules at a lower wage. Ex post, this would be statically efficient. One problem, from
the union’s point of view, is that the government may not be able to commit not to use the fact that
it expects to hire teachers on this basis in its wage negotiations with the teachers union. Moreover,
the government could simply replace TSC teachers with PTA teachers over time. To avoid this, the
29
government would have to commit to limiting the number of contract teachers hired over time. One
way to do this would be through an “up or out” system in which the workers outside the union
bargaining agreement have to be either hired as civil servants or fired after a certain time. A key issue
would be to ensure that the selection process maintains the positive correlation with student
performance found in our sample.
“Up or Out” systems are of course common in the higher education labor market in the United
States. Short-term contracts prior to long-term jobs have also been a feature of some European
labor market reforms. It is possible that such arrangements could be part of reforms of education
markets in developing countries with strong unions. Pritchett and Murgai (2006) proposed
essentially such a system for India.
Subsequent to our study, the Kenyan government, which had long had a freeze on hiring of new
civil-service teachers, hired 18,000 contract teachers. Initial plans included no guarantee of civil-
service employment afterwards. However, the Kenyan National Union of Teachers opposed the
initial plans and under the eventual agreement, contract teachers were hired at much higher salaries
than in the program we study. Hiring was done under civil-service rules heavily weighting the cohort
in which applicants graduated from teacher training college rather than the judgment of local school
committees, and contract teachers hired under the program were promised civil-service positions.
Our analysis suggests that these features could potentially undermine both the incentive and
selection effects of local hiring of contract teachers by PTAs. Understanding the selection and
incentive impacts of this program, and of potential program variants, is an important topic for
future research.
30
References
Amin, Samia, Jishnu Das and Markus Goldstein (edited) (2007). Are you Being Served? New Tools for Measuring Service Delivery. World Bank, Washington DC.
Andrabi, Tahir, Jishnu Das, Asim Ijaz Khwaja, and Tristan Zajonc (2011). “Do Value-Added Estimates Add Value? Accounting for Learning Dynamics” American Economic Journal: Applied Economics, 3(3): 29–54.
Angrist, Josh, and Victor Lavy (1999). “Using Maimonides’ Rule to Estimate the Effect of Class Size on Scholastic Achievement.” Quarterly Journal of Economics 114, 533-575.
Bandiera Oriana, Valentino Larcinese and Imran Rasul (2010). "Heterogeneous Class Size Effects: New Evidence from a Panel of University Students," Economic Journal 120(549): 1365-1398.
Banerjee, Abhijit, Shawn Cole, Esther Duflo and Leigh Linden (2007). “Remedying Education: Evidence from Two Randomized Experiments in India.” Quarterly Journal of Economics, 122, No. 3, Pages 1235-1264.
Banerjee, Abhijit, Brian Jacob and Michael Kremer (2005), with J. Lanjouw and P. Lanjouw, “Moving to Universal Education! Costs and Tradeoffs,” MIT mimeo.
Bold, Tessa, Mwangi Kimenyi, Germano Mwabu, Alice Ng'ang'a and Justin Sandefur (2012). “Pitfalls of Scaling-up Proven Education Interventions: Evidence from an RCT in Kenya”. Work in progress.
Bruns, Barbara, Deon Filmer, and Harry A. Patrinos (2011). Making Schools Work. New Evidence on Accountability Reforms. The World Bank, Washington D.C.
Cascio, Elizabeth, and Douglas Staiger (2011). “Skill, Standardized Tests, and Fadeout in Educational Interventions”. Mimeo.
Chetty, Raj, John N. Friedman, Nathaniel Hilger, Emmanuel Saez, Diane Whitmore Schanzenbach, and Danny Yagan (2010). “How Does Your Kindergarten Classroom Affect Your Earnings? Evidence from Project STAR.” Quarterly Journal of Economics 126(4): 1593-1660, 2011
Chaudhury, Nazmul, Jeffrey Hammer, Michael Kremer, Karthik Muralidharan, and F. Hasley Rogers (2006). “Missing in Action: Teacher and Health Worker Absence in Developing Countries,” Journal of Economic Perspectives 20 (1): 91-116
Das, Jishnu, Stephane Dercon, James Habyarimana, and Pramila Krishnan (2004). “When Can School Inputs Improve Test Scores?” Policy Research Working Paper 3217, World Bank, Washington DC.
Das, Jishnu, Stephane Dercon, James Habyarimana, Pramila Krishnan, Karthik Muralidharan and Venkatesh Sundararaman (2011). “School Inputs, Household Substitution, and Test Scores.” NBER Working Paper 16830.
De Laat, Joost, and Emiliana Vegas (2003). “Do Differences in Teacher Contracts Affect Student Performance? Evidence from Togo.” World Development Report 2004: Making Services Work For Poor People, Background Paper, 26 June 2003.
Duflo, Esther, Pascaline Dupas and Michael Kremer (2011). “Peer Effects, Teacher Incentives, and the Impact of Tracking: Evidence from a Randomized Evaluation in Kenya”. American Economic Review 101 (5): 1739-74.
31
Duthilleul, Yael (2005) Lessons Learnt in the Use of “Contract” Teachers. Synthesis Report International Institute for Educational Planning (IIEP) UNESCO; Paris.
Durante, Ruben, Giovanna Labartino and Roberto Perotti (2011). “Academic Dynasties: Decentralization and Familism in the Italian Academia,” CEPR Discussion Paper 8645.
Glewwe, Paul, Naumam Ilias and Michael Kremer (2010). “Teachers Incentives.” American Economic Journal: Applied Economics, 2(3): 205-27
Glewwe, Paul, Michael Kremer and Sylvie Moulin (2009). “Many Children Left Behind? Textbooks and Test Scores in Kenya.” American Economic Journal: Applied Economics, 1(1): 112-35.
Goldhaber, D., and Hansen, M. (2008). “Is It Just a Bad Class? Assessing the Stability of Measured Teacher Performance”. CRPE Working Paper# 2008-5. Available online at www. crpe.org.
Goldin, Claudia (1999). "A Brief History of Education in the United States". NBER Working Paper, Historical Series no. 119.
Gordon, Robert, Thomas J. Kane, Douglas O. Staiger (2006). “Identifying Effective Teachers Using Performance on the Job” The Hamilton Project, Washington, DC: Brookings Institute.
Hanushek, Eric A., and Ludger Woessmann (2010). "The Economics of International Differences in Educational Achievement", in Eric A. Hanushek, Stephen Machin, and Ludger Woessmann (ed.), Handbook of the Economics of Education, Vol. 3. Amsterdam: North Holland.
Hoxby, Caroline M. (2000). “The Effects of Class Size on Student Achievement: New Evidence from Population Variation,” Quarterly Journal of Economics, 115.4.
Kane, Thomas J., Jonah E. Rockoff, and Douglas O. Staiger (2008) “What Does Certification Tell Us about Teacher Effectiveness? Evidence from New York City.” Economics of Education Review
27: 615–631. Kremer, Michael, and Alaka Holla (2009). “Improving Education in the Developing World: What
Have We Learned from Randomized Evaluations?” Annual Review of Economics Vol. 1: 513-542. Kremer, Michael, Moulin, Sylvie, and Robert Namunyu. (2003)"Decentralization: A Cautionary
Tale," Working Paper Harvard University. Krueger, Alan and Diane Whitmore (2002). “Would Smaller Classes Help Close the Black-White
Achievement Gap?” In John E. Chubb and Tom Loveless, eds., Bridging the Achievement Gap. Washington: Brookings Institution Press.
Kumar, K., M. Priyam, And S. Saxena (2005): "The Trouble with Para-Teachers," Frontline, 18. Lavy, Victor (2010). “Do Differences in School’s Instruction Time Explain International
Achievement Gaps in Math, Science, and Reading? Evidence from Developed and Developing Countries”. NBER Working Paper w16227.
Lee, David (2008). “Training, Wages, and Sample Selection: Estimating Sharp Bounds on Treatment Effects”, Review of Economic Studies, 76(3) 1071-1102.
Lucas, Adrienne and Isaac Mbiti (2011). “The Effect of Free Primary Education on Student participation, stratification and achievement: evidence from Kenya”
Mamdani, Mahmood (1996).tizen and Subject: Contemporary Africa and the Legacy of Late Colonialism Princeton: Princeton University Press.
McCaffrey, D., Sass, T., Lockwood, J., & Mihaly, K. (2009). “The intertemporal variability of teacher effect estimates.” Education Finance and Policy, 4(4), 572-606.
32
Muralidharan, Karthik, and Venkatesh Sundararaman (2010). “Contract Teachers: Experimental Evidence from India”. Mimeo, UC San Diego.
Piketty, Thomas (2004). “L'Impact de la taille des classes et de la ségrégation sociale sur la réussite scolaire dans les écoles françaises: une estimation à partir du panel primaire 1997.” Mimeo, PSE.
Pritchett, Lant, and Rinku Murgai (2006). “Teacher Compensation: Can Decentralization to Local Bodies Take India from the Perfect Storm Through Troubled Waters to Clear Sailing?” India Policy Forum, Global Economy and Development Program, The Brookings Institution, vol. 3(1), pages 123-177.
Rockoff, Jonah E. and Douglas O. Staiger (2010). “Searching for the Effective Teachers with Imperfect Information.” Journal of Economic Perspectives, 24(3): 97-118.
Schiff, Martin (1976). “The Educational Failure of Community Control in Inner-City New York”. The Phi Delta Kappan, Vol. 57, No. 6, pp. 375-378 .
Urquiola, Miguel and Eric Verhoogen (2009). “Class size caps, sorting, and the regression discontinuity design.” American Economic Review, 99(1), 179-215.
33
p-value( 1) = (2)
p-value( 1) = (3)
p-value( 2) = (3)
Panel A. School Characteristics Prior to Program Inception Mean Std. Dev.
Mean Std. Dev.
Mean Std. Dev.
Primary School Exit exam score (out of 400) 260 29 258 26 260 34 0.719 0.930 0.702Total student enrollment, 2004 598 241 646 266 574 221 0.344 0.635 0.221Number of TSC teachers, 2004 12 4 12 4 12 4 0.649 0.582 0.928School-level pupil/teacher ratio, 2004 43 12 46 16 42 12 0.168 0.821 0.167Average enrollment in grade 1, March 2005 95 41 93 34 96 39 0.807 0.962 0.802Proportion of female grade 1 students, March 2005 0.51 0.06 0.49 0.06 0.49 0.06 0.203 0.324 0.810Average enrollment in grade 2, March 2005 97 43 98 37 99 42 0.907 0.762 0.870
Class-based (rather than subject-based) assignment of TSC teachersa 0.03 0.18 0.03 0.17 0.06 0.25 0.963 0.481 0.510Proportion of female teachers among TSC teachers, March 2005 0.71 0.46 0.69 0.46 0.65 0.48 0.803 0.320 0.513Years of experience among TSC teachers, March 2005 17.04 9.26 15.03 8.97 16.77 10.22 0.076* 0.817 0.190Average age among TSC teachers, March 2005 43.17 8.49 41.84 8.81 42.42 9.45 0.214 0.489 0.647
Panel B. After Program InceptionAverage class size in grade 1, October 2005 81.5 27.1 42.1 15.3 44.6 20.8 0*** 0*** 0.664Class-based (rather than subject-based) assignment of TSC teachers 0.05 0.22 0.18 0.39 0.19 0.40 0.055* 0.047** 0.943If subject-based assignment: number of TSC teachers for grade 1 3.53 1.07 3.63 1.21 3.50 1.03 0.684 0.922 0.668
Average class size in grade 2, March 2006 67.8 25.5 41.4 17.2 41.6 16.3 0*** 0*** 0.965Number of classes in grade 2, March 2006 1.4 0.6 2.3 0.6 2.3 0.6 0*** 0*** 0.731Number of classes in grade 1, March 2006 1.0 0.2 1.0 0.0 1.0 0.0 0.250 0.255 1.000
Panel C. Comparability of Grade 1 Sections (ETP schools only)p-value(4 ) = (5)
Proportion of female teachers (Average over program period) 0.47 0.50 0.66 0.47 0.01**Teachers' Age (Average over program period) 27.21 4.04 42.02 9.05 0***Teachers' Years of experience (Average over program period) 1.90 3.47 15.54 9.46 0***Proportion of female grade 1 students 0.49 0.07 0.49 0.08 0.841Students' age 7.68 0.50 7.64 0.48 0.639Standardized baseline score (Mean 0, SD 1 at school level) 0.01 0.11 0.03 0.10 0.355Standardized endline score (Mean 0, SD 1 at school level) 0.08 0.22 -0.07 0.20 0***Notes: Data from 70 comparison schools, 36 ETP Only schools and 34 ETP + SBM schools. Standard deviations in italics.a Under "class-based assignment" of teachers, each teacher is assigned a specific class for which she teaches all subjects (math, reading, etc.). Under "subject-based assignment" of teachers, each teacher is assigned a specific subset of subjects and teaches those subjects in multiple classes and/or grades.
Table 1. Schools, Teachers and Students Characteristics, by Treatment Group, Pre- and Post-Program
ComparisonSchools
ETP Only Schools
(4)Section Assigned to ETP Contract
Teacher
(1) (2) (3)ETP + SBM
Schools
(5) Section Assigned to
TSC Teachers
34

Table 2. Endline Test Scores(1) (2) (3) (4) (5) (6) (7)
(1) ETP school 0.087 0.074 0.073 0.051 0.015 0.102 0.111(0.098) (0.088) (0.088) (0.078) (0.073) (0.111) (0.096)
(2) ETP school x SBM 0.125 0.130 0.130 0.182 0.186 0.050 0.055(0.118) (0.106) (0.106) (0.093)* (0.086)** (0.133) (0.117)
(3) ETP school x assigned to ETP contract teacher 0.207 0.228 0.241 0.251 0.260 0.128 0.178(0.064)*** (0.058)*** (0.066)*** (0.058)*** (0.062)*** (0.070)* (0.069)**
(4) -0.156 -0.174 -0.169 -0.213 -0.224 -0.076 -0.088(0.095) (0.085)** (0.083)** (0.095)** (0.087)** (0.095) (0.085)
(5) School size (/100) -0.055 -0.051 -0.201 0.089(0.088) (0.088) (0.075)*** (0.096)
(6) Share female among TSC teachers 0.502 0.497 0.307 0.567(0.104)*** (0.104)*** (0.093)*** (0.107)***
(7) Average years of experience (/10) among TSC teachers 0.021 0.020 -0.017 0.049(0.067) (0.068) (0.058) (0.070)
(8) Girl 0.056 0.056 -0.013 0.106(0.023)** (0.023)** (0.021) (0.026)***
(9) Age -0.043 -0.043 -0.007 -0.065(0.012)*** (0.012)*** (0.011) (0.013)***
(10) Baseline score 0.498 0.498 0.497 0.401(0.018)*** (0.018)*** (0.015)*** (0.022)***
(11) Teacher has <1 year of experience -0.065 -0.012 -0.100(0.091) (0.085) (0.107)
(12) Observations 6531 6531 6531 6531 6531 6534 6534(13) R-squared 0.030 0.250 0.250 0.030 0.250 0.030 0.180
(14) Total effect: ETP school+SBM 0.212 0.204 0.203 0.233 0.201 0.152 0.166p-val (ETP School + SBM = 0 ) 0.056* 0.036** 0.036** 0.01** 0.016** 0.204 0.110
(15) Total effect: ETP school+contract teacher 0.294 0.302 0.314 0.302 0.275 0.230 0.289p-val (ETP school +contact teacher = 0 ) 0.006*** 0.002*** 0.003*** 0.001*** 0.003*** 0.045** 0.009***
(16) Total effect: ETP school+SBM+contract teacher 0.263 0.258 0.275 0.271 0.237 0.204 0.256p-val (ETP school +SBM +contract teacher = 0 ) 0.007*** 0.005*** 0.007*** 0.001*** 0.007*** 0.048** 0.019**
Notes: OLS regressions. Endline test was administered after the program had been in place for five school terms. Scores are normalized suchthat the mean and standard deviation of the comparison group are zero and one, respectively. Robust standard errors clustered at the schoollevel in parentheses. ***, **, * indicate significance at the 1%, 5%, and 10% levels respectively. There are only 139 schools/clusters becausetests could not be administered in one of the ETP schools. Region and date of test dummies were included in all regressions but are not shown.
Total Score Math Score Literacy Score
ETP school x SBM x assigned to ETP contract teacher
35
Table 3. Teacher Effort and Pedagogy(1) (2) (3) (4) (5) (6) (7) (8) (9) (10)
Data Source:
(1) (2) (3) (4) (5) (6) (7) (8) (9) (10)(1) ETP school -0.129 -0.009 -0.145 0.033 0.155 -0.025 0.073 -0.238 -0.224 -0.145
(0.040)*** (0.025) (0.042)*** (0.015)** (0.081)* (0.018) (0.123) (0.128)* (0.124)* (0.132)(2) ETP school x SBM 0.075 0.001 0.093 -0.001 0.016 -0.013 -0.089 0.098 -0.008 -0.033
(0.043)* (0.029) (0.050)* (0.029) (0.087) (0.012) (0.141) (0.143) (0.141) (0.149)(3) ETP school x ETP contract teacher 0.278 0.057 0.294 -0.032 -0.015 0.001 0.165 -0.078 -0.356 -0.165
(0.047)*** (0.043) (0.050)*** (0.028) (0.080) (0.016) (0.131) (0.133) (0.111)*** (0.146)(4) ETP school x ETP contract teacher x SBM 0.029 0.092 -0.063 -0.006 -0.035 -0.001 -0.024 -0.032 0.157 0.149
(0.065) (0.049)* (0.073) (0.042) (0.113) (0.017) (0.165) (0.188) (0.149) (0.196)(5) Years of experience teaching 0.002 0.002 0.001 -0.001 0.002 -0.001 -0.002 0.000 0.001 -0.002
(0.001) (0.001)* (0.002) (0.001) (0.002) (0.001) (0.006) (0.005) (0.005) (0.005)(6) < 1 year of experience teaching 0.001 -0.067 0.065 0.117 -0.050 -0.009 -0.187 -0.009 -0.059 0.109
(0.074) (0.046) (0.064) (0.091) (0.081) (0.014) (0.157) (0.170) (0.179) (0.170)(7) Female 0.054 0.004 0.066 -0.037 0.004 0.016 0.093 0.043 0.127 0.096
(0.028)* (0.021) (0.029)** (0.026) (0.045) (0.010) (0.079) (0.089) (0.079) (0.086)(8) Log # of teachers involved in the grade -0.016 -0.136 0.105
(0.040) (0.041)*** (0.046)**(9) Observations 1957 1957 1636 168 168 168 165 166 165 165
(10) Mean in comparison schools 0.579 0.840 0.688 0.012 0.154 0.044 0.597 0.742 0.726 0.677
(11) Total effect: ETP school+SBM -0.054 -0.008 -0.052 0.032 0.171 -0.038 -0.016 -0.140 -0.232 -0.178p-val (ETP School + SBM = 0 ) 0.182 0.772 0.283 0.241 0.002*** 0.127 0.894 0.203 0.041** 0.126
(12) Total effect: ETP school+contract teacher 0.149 0.048 0.149 0.001 0.140 -0.024 0.238 -0.316 -0.580 -0.310p-val (ETP school +contact teacher = 0 ) 0.007*** 0.234 0.008*** 0.966 0.014** 0.364 0.064* 0.024** 0*** 0.015**
(13) Total effect: ETP school+SBM+contract tea 0.253 0.141 0.179 -0.006 0.121 -0.038 0.125 -0.250 -0.431 -0.194p-val (ETP school +SBM +contract teach 0*** 0*** 0.002*** 0.819 0.048** 0.136 0.395 0.135 0.002*** 0.189
Notes: Standard errors clustered at school level. Region and date of visit dummies included in all regressions but not shown. ***, **, * indicate significance at the 1%, 5%, and 10%levels respectively.Columns 1-3: Linear probability model regressions. Multiple observations per teacher. Columns 4-10: In each school, two or three grade 1 teachers (including the ETP teacher in ETP schools) were selected for classroom observation and for an interview. OLS regressionsin columns 4-6 and LPM regressions in columns 7-10.
Teacher had a lesson plan
prepared for the class
Unannounced Spot Checks Classroom Observations
Teacher Found in
Class Teaching
Teacher Present at
School
If Present at School:
Found in Class
Teaching
Share of Students
Who Went to
Blackboard to Write an
Answer
Share of Students
Who Answered a
Question
Share of Students
Who Asked a Question
Teacher Interviews
Teacher did not have
time to mark individual work for children
Teacher reports not having time
to help children
individually
Teacher reports not
having time to pay attention to
slow learners
36
Table 4. Contract Teacher Selection, Retention and Promotion(1) (2) (3) (4) (5) (6) (7) (8) (9)
Female<1 year of experience
Previously PTA
teacher at the school
Born or married locally
Relative of a teacher in the school
Left (not for TSC) and had to be replaced
Hired by TSC during or shortly after ETP program
Employed by school by beginning of
year 3
If not hired by TSC:
Employed by school by beginning of
year 3SBM -0.16 0.15 -0.02 -0.12 -0.15 0.02 -0.18 0.23 0.07
(0.13) (0.10) (0.10) (0.12) (0.10) (0.10) (0.11) (0.12)* (0.19)Female 0.17 0.04 -0.06 -0.05
(0.09)* (0.11) (0.12) (0.18)Years of experience 0.05 0.11 -0.19 -0.16
(0.05) (0.06)* (0.06)*** (0.09)*Relative of a teacher in the school -0.08 -0.07 0.18 0.05
(0.13) (0.15) (0.16) (0.25)Average presence -0.51 0.24 -0.1 -0.11
(0.19)*** (0.22) (0.24) (0.34)Mean score of students at endline -0.24 0.34 0.03 0.43
(0.11)** (0.12)*** (0.14) (0.25)*Prop. TSC teachers female -0.14 -0.06 -0.01 -0.25 -0.48 -0.16 -0.11 0.11 0.1
(0.20) (0.17) (0.16) (0.19) (0.15)*** (0.16) (0.19) (0.20) (0.33)Average experience among TSC teachers 0.00 -0.01 -0.01 -0.02 0.02 -0.01 0.03 -0.02 -0.02
(0.01) (0.01) (0.01) (0.01)* (0.01)* (0.01) (0.01)*** (0.01)* (0.02)School performance on 2004 national exam 0.02 0.03 -0.02 -0.01 -0.02 0.11 -0.07 -0.05 -0.06
(0.08) (0.07) (0.07) (0.08) (0.06) (0.06)* (0.07) (0.08) (0.12)School Size (/100) -0.04 0.02 0.03 0.00 0.08 0.02 0.01 -0.04 -0.02
(0.04) (0.04) (0.03) (0.04) (0.03)** (0.03) (0.04) (0.04) (0.06)Number of teachers assigned to lower grades 0.02 -0.04 -0.01 0.03 0.03 -0.02 0.01 0.03 0.03
(0.04) (0.03) (0.03) (0.04) (0.03) (0.03) (0.03) (0.04) (0.05)School had at least one PTA teacher in 2004 -0.02 -0.26 -0.04 -0.06 -0.17 0.03 0.13 0.18 0.25
(0.15) (0.12)** (0.12) (0.14) (0.11) (0.11) (0.13) (0.14) (0.20)
Observations 70 70 68 68 68 68 68 68 42R-Squared 0.09 0.17 0.06 0.10 0.07 0.35 0.44 0.28 0.31Mean in schools without SBM 0.53 0.17 0.20 0.74 0.31 0.19 0.47 0.25 0.47Notes: Sample restricted to the 70 schools sampled for the Extra-Teacher Program. Linear probability model regressions with standard errors presented in parentheses.***, **, * indicate significance at the 1%, 5%, and 10% levels respectively.
Characteristics of ETP Contract Teacher hired by the PTA What happened to the ETP Contract Teacher?
37
(1) (2) (3) (4)
Student Performance
Standardized Endline Score for Students assigned to ETP
teacherTeacher Present
at School
If Present at School: Found in Class Teaching
Teacher Found in Class Teaching
School based management (SBM) -0.065 0.019 0.000 0.020(0.131) (0.042) (0.063) (0.067)
(a) ETP contract teacher is the relative of a TSC teacher -0.339 -0.071 -0.285 -0.277(0.175)* (0.103) (0.203) (0.143)*
(b) 0.385 0.199 0.124 0.242(0.165)** (0.096)** (0.173) (0.131)*
Proportion of females among TSC teachers 0.141 0.152 -0.166 -0.019(0.173) (0.070)** (0.093)* (0.098)
Proportion of females among TSC teachers 0.507 -0.035 0.325 0.237 x ETP contract teacher is the relative of a TSC teacher (0.261)* (0.117) (0.192)* (0.178)ETP contract teacher has < 1 year of experience -0.159 -0.055 0.039 -0.017
(0.092)* (0.051) (0.061) (0.076)
Observations 1548 217 192 217
p-val a+b=0 0.770 0.181 0.204 0.794
Mean in schools without SBM 0.236 0.845 0.816 0.690
Unit of Observation Student Teacher-Day Teacher-Day Teacher-Day
ETP Contract Teacher's Effort
Notes: Standard errors in parentheses. ***, **, * indicate significance at the 1%, 5%, and 10% levels respectively.Column 1: OLS. Sample restricted to students assigned to ETP contract teachers in ETP schools. Data source: endline test administered by research team. Columns 2-4: LPM. Sample restricted to ETP contract teachers in ETP schools. Up to 5 observations per teacher. Data source: Five unannounced spot checks.
SBM x ETP contract teacher is the relative of a TSC teacher
Table 5. "Relative" effect: Performance of ETP Contract Teachers related to existing TSC teachers
38
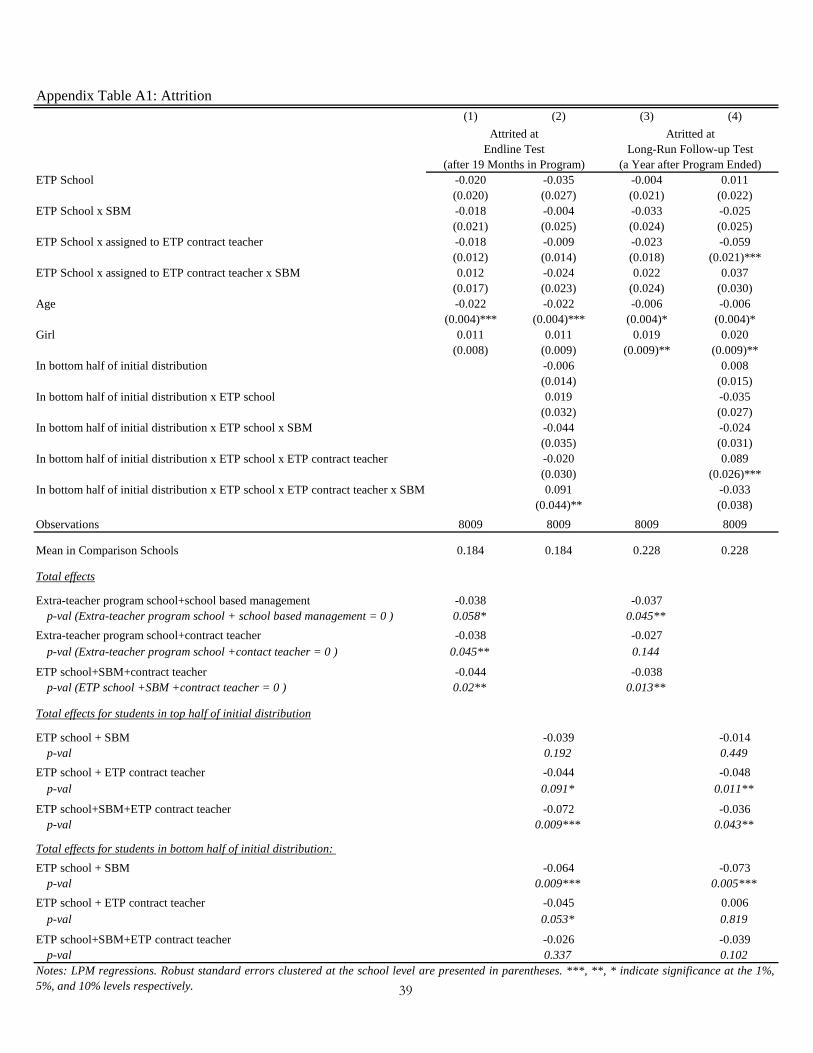
Appendix Table A1: Attrition(1) (2) (3) (4)
ETP School -0.020 -0.035 -0.004 0.011(0.020) (0.027) (0.021) (0.022)
ETP School x SBM -0.018 -0.004 -0.033 -0.025(0.021) (0.025) (0.024) (0.025)
ETP School x assigned to ETP contract teacher -0.018 -0.009 -0.023 -0.059(0.012) (0.014) (0.018) (0.021)***
ETP School x assigned to ETP contract teacher x SBM 0.012 -0.024 0.022 0.037(0.017) (0.023) (0.024) (0.030)
Age -0.022 -0.022 -0.006 -0.006(0.004)*** (0.004)*** (0.004)* (0.004)*
Girl 0.011 0.011 0.019 0.020(0.008) (0.009) (0.009)** (0.009)**
In bottom half of initial distribution -0.006 0.008(0.014) (0.015)
In bottom half of initial distribution x ETP school 0.019 -0.035(0.032) (0.027)
In bottom half of initial distribution x ETP school x SBM -0.044 -0.024(0.035) (0.031)
In bottom half of initial distribution x ETP school x ETP contract teacher -0.020 0.089(0.030) (0.026)***
In bottom half of initial distribution x ETP school x ETP contract teacher x SBM 0.091 -0.033(0.044)** (0.038)
Observations 8009 8009 8009 8009
Mean in Comparison Schools 0.184 0.184 0.228 0.228
Total effects
Extra-teacher program school+school based management -0.038 -0.037p-val (Extra-teacher program school + school based management = 0 ) 0.058* 0.045**
Extra-teacher program school+contract teacher -0.038 -0.027p-val (Extra-teacher program school +contact teacher = 0 ) 0.045** 0.144
ETP school+SBM+contract teacher -0.044 -0.038p-val (ETP school +SBM +contract teacher = 0 ) 0.02** 0.013**
Total effects for students in top half of initial distribution
ETP school + SBM -0.039 -0.014p-val 0.192 0.449
ETP school + ETP contract teacher -0.044 -0.048p-val 0.091* 0.011**
ETP school+SBM+ETP contract teacher -0.072 -0.036p-val 0.009*** 0.043**
Total effects for students in bottom half of initial distribution: ETP school + SBM -0.064 -0.073
p-val 0.009*** 0.005***ETP school + ETP contract teacher -0.045 0.006
p-val 0.053* 0.819
ETP school+SBM+ETP contract teacher -0.026 -0.039p-val 0.337 0.102
Notes: LPM regressions. Robust standard errors clustered at the school level are presented in parentheses. ***, **, * indicate significance at the 1%,5%, and 10% levels respectively.
Attrited at Endline Test
(after 19 Months in Program)
Atritted at Long-Run Follow-up Test
(a Year after Program Ended)
39
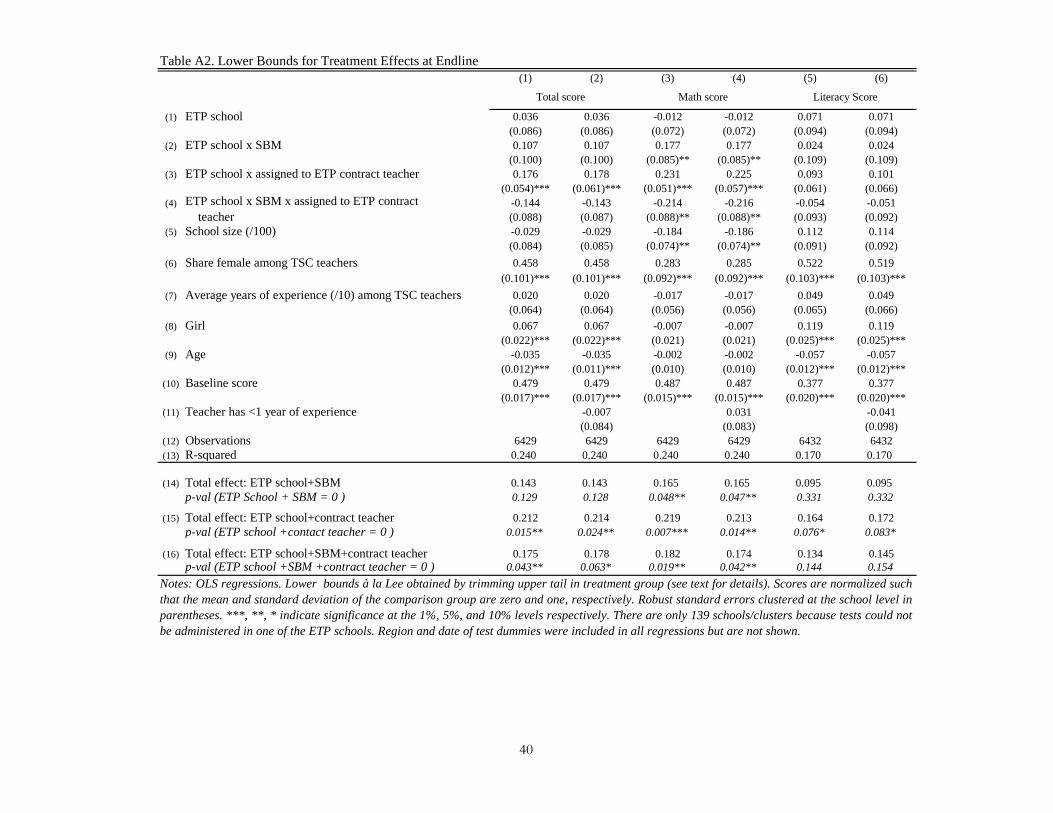
Table A2. Lower Bounds for Treatment Effects at Endline(1) (2) (3) (4) (5) (6)
(1) ETP school 0.036 0.036 -0.012 -0.012 0.071 0.071(0.086) (0.086) (0.072) (0.072) (0.094) (0.094)
(2) ETP school x SBM 0.107 0.107 0.177 0.177 0.024 0.024(0.100) (0.100) (0.085)** (0.085)** (0.109) (0.109)
(3) ETP school x assigned to ETP contract teacher 0.176 0.178 0.231 0.225 0.093 0.101(0.054)*** (0.061)*** (0.051)*** (0.057)*** (0.061) (0.066)
(4) -0.144 -0.143 -0.214 -0.216 -0.054 -0.051(0.088) (0.087) (0.088)** (0.088)** (0.093) (0.092)
(5) School size (/100) -0.029 -0.029 -0.184 -0.186 0.112 0.114(0.084) (0.085) (0.074)** (0.074)** (0.091) (0.092)
(6) Share female among TSC teachers 0.458 0.458 0.283 0.285 0.522 0.519(0.101)*** (0.101)*** (0.092)*** (0.092)*** (0.103)*** (0.103)***
(7) Average years of experience (/10) among TSC teachers 0.020 0.020 -0.017 -0.017 0.049 0.049(0.064) (0.064) (0.056) (0.056) (0.065) (0.066)
(8) Girl 0.067 0.067 -0.007 -0.007 0.119 0.119(0.022)*** (0.022)*** (0.021) (0.021) (0.025)*** (0.025)***
(9) Age -0.035 -0.035 -0.002 -0.002 -0.057 -0.057(0.012)*** (0.011)*** (0.010) (0.010) (0.012)*** (0.012)***
(10) Baseline score 0.479 0.479 0.487 0.487 0.377 0.377(0.017)*** (0.017)*** (0.015)*** (0.015)*** (0.020)*** (0.020)***
(11) Teacher has <1 year of experience -0.007 0.031 -0.041(0.084) (0.083) (0.098)
(12) Observations 6429 6429 6429 6429 6432 6432(13) R-squared 0.240 0.240 0.240 0.240 0.170 0.170
(14) Total effect: ETP school+SBM 0.143 0.143 0.165 0.165 0.095 0.095p-val (ETP School + SBM = 0 ) 0.129 0.128 0.048** 0.047** 0.331 0.332
(15) Total effect: ETP school+contract teacher 0.212 0.214 0.219 0.213 0.164 0.172p-val (ETP school +contact teacher = 0 ) 0.015** 0.024** 0.007*** 0.014** 0.076* 0.083*
(16) Total effect: ETP school+SBM+contract teacher 0.175 0.178 0.182 0.174 0.134 0.145p-val (ETP school +SBM +contract teacher = 0 ) 0.043** 0.063* 0.019** 0.042** 0.144 0.154
Literacy Score
Notes: OLS regressions. Lower bounds à la Lee obtained by trimming upper tail in treatment group (see text for details). Scores are normalized suchthat the mean and standard deviation of the comparison group are zero and one, respectively. Robust standard errors clustered at the school level inparentheses. ***, **, * indicate significance at the 1%, 5%, and 10% levels respectively. There are only 139 schools/clusters because tests could notbe administered in one of the ETP schools. Region and date of test dummies were included in all regressions but are not shown.
ETP school x SBM x assigned to ETP contract teacher
Total score Math score
40
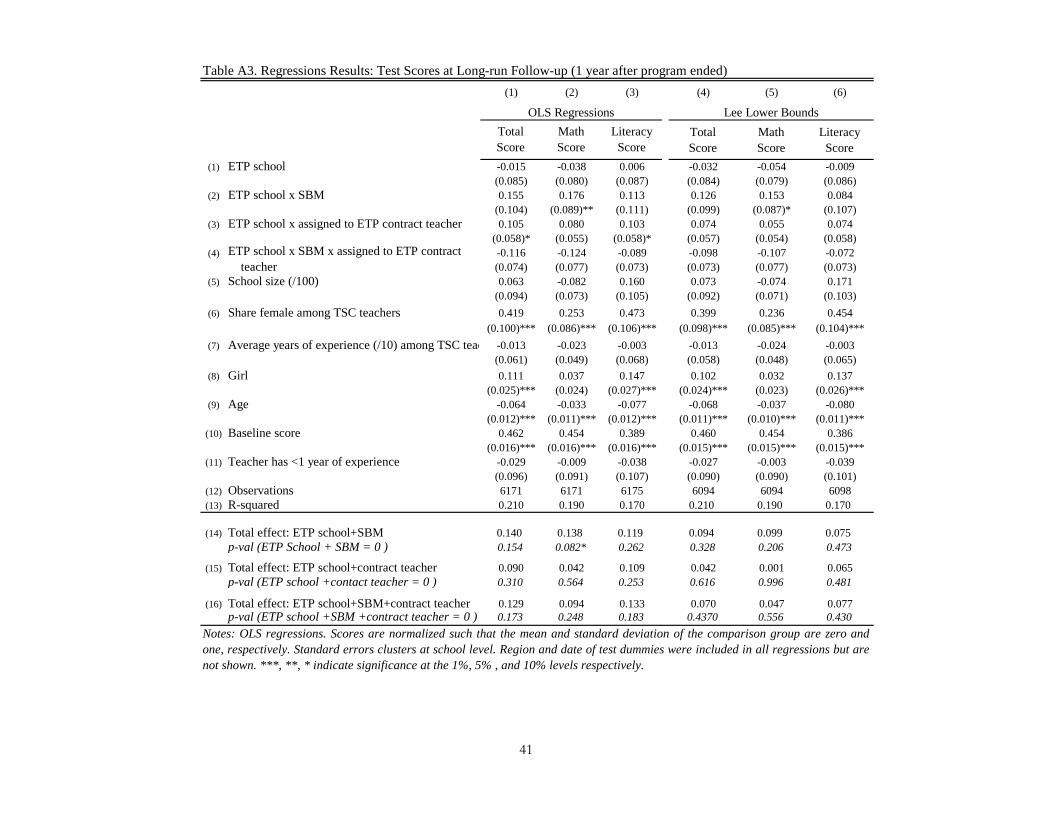
(1) (2) (3) (4) (5) (6)
Total Score
Math Score
Literacy Score
(1) ETP school -0.015 -0.038 0.006 -0.032 -0.054 -0.009(0.085) (0.080) (0.087) (0.084) (0.079) (0.086)
(2) ETP school x SBM 0.155 0.176 0.113 0.126 0.153 0.084(0.104) (0.089)** (0.111) (0.099) (0.087)* (0.107)
(3) ETP school x assigned to ETP contract teacher 0.105 0.080 0.103 0.074 0.055 0.074(0.058)* (0.055) (0.058)* (0.057) (0.054) (0.058)
(4) -0.116 -0.124 -0.089 -0.098 -0.107 -0.072(0.074) (0.077) (0.073) (0.073) (0.077) (0.073)
(5) School size (/100) 0.063 -0.082 0.160 0.073 -0.074 0.171(0.094) (0.073) (0.105) (0.092) (0.071) (0.103)
(6) Share female among TSC teachers 0.419 0.253 0.473 0.399 0.236 0.454(0.100)*** (0.086)*** (0.106)*** (0.098)*** (0.085)*** (0.104)***
(7) Average years of experience (/10) among TSC teac -0.013 -0.023 -0.003 -0.013 -0.024 -0.003(0.061) (0.049) (0.068) (0.058) (0.048) (0.065)
(8) Girl 0.111 0.037 0.147 0.102 0.032 0.137(0.025)*** (0.024) (0.027)*** (0.024)*** (0.023) (0.026)***
(9) Age -0.064 -0.033 -0.077 -0.068 -0.037 -0.080(0.012)*** (0.011)*** (0.012)*** (0.011)*** (0.010)*** (0.011)***
(10) Baseline score 0.462 0.454 0.389 0.460 0.454 0.386(0.016)*** (0.016)*** (0.016)*** (0.015)*** (0.015)*** (0.015)***
(11) Teacher has <1 year of experience -0.029 -0.009 -0.038 -0.027 -0.003 -0.039(0.096) (0.091) (0.107) (0.090) (0.090) (0.101)
(12) Observations 6171 6171 6175 6094 6094 6098(13) R-squared 0.210 0.190 0.170 0.210 0.190 0.170
(14) Total effect: ETP school+SBM 0.140 0.138 0.119 0.094 0.099 0.075p-val (ETP School + SBM = 0 ) 0.154 0.082* 0.262 0.328 0.206 0.473
(15) Total effect: ETP school+contract teacher 0.090 0.042 0.109 0.042 0.001 0.065p-val (ETP school +contact teacher = 0 ) 0.310 0.564 0.253 0.616 0.996 0.481
(16) Total effect: ETP school+SBM+contract teacher 0.129 0.094 0.133 0.070 0.047 0.077p-val (ETP school +SBM +contract teacher = 0 ) 0.173 0.248 0.183 0.4370 0.556 0.430
Table A3. Regressions Results: Test Scores at Long-run Follow-up (1 year after program ended)
OLS Regressions
Notes: OLS regressions. Scores are normalized such that the mean and standard deviation of the comparison group are zero andone, respectively. Standard errors clusters at school level. Region and date of test dummies were included in all regressions but arenot shown. ***, **, * indicate significance at the 1%, 5% , and 10% levels respectively.
Lee Lower BoundsTotal Score
Math Score
Literacy Score
ETP school x SBM x assigned to ETP contract teacher
41