school accountability in the digital age - eric accountability in the digital age research and...
TRANSCRIPT

School Accountability in the Digital Age
Research and writing by
John Watson and Larry PapeEvergreen Education Group
FEB 2015 Policy BRiEF
A closer look at state accountability systems and online schools, with a focus on student mobility and graduation rates
About the Evergreen Education GroupThe Evergreen Education Group is a digital learning research and advisory company and has been widely recognized as a leading authority for market and policy intelligence in the K–12 digital learning field. We have been the publishers of the annual report Keeping Pace with K–12 Digital Learning for eleven years. We deliver digital learning-related insight and produce a variety of research reports on the digital learning landscape, covering key industry topics, and national and state-level reports. Evergreen is a valuable partner to legislators, state boards of education, state education agencies, non-profit organizations, publishers and companies serving the K–12 education field.
About Keeping Pace with K–12 Digital LearningFor eleven years Keeping Pace has been tracking, reporting on and providing insight to the digital learning policy and practice landscape across all 50 states. Keeping Pace findings have been quoted in numerous national, state, and regional reports examining online and blended learning. The report’s findings and authors have been quoted in publications such as Education Week, The New York Times, Wall Street Journal, USA Today, and the Christian Science Monitor. Keeping Pace sponsors include state education agencies, state virtual schools, non-profit organizations, and companies, all of whom share a vision of using digital learning to expand high-quality educational options.
About the Keeping Pace Policy Brief SeriesSchool Accountability in the Digital Age is the second in a series of policy briefs from the Evergreen Education Group’s Keeping Pace research team. Reports from this series of policy briefs are published from time to time and released separately from the annual Keeping Pace with K–12 Digital Learning report.
2014 Keeping Pace sponsors include:
School Accountability in the Digital Age
2

Executive SummaryPublic schools in the United States operate under state accountability systems that vary by state
and are meant to measure individual school performance against criteria determined by state
policymakers. The purpose of these systems is to hold each school accountable for increasing
student performance. However, it has become clear that a single system does not accurately
measure all schools. Among the problems is that these systems do not adequately assess schools
with high rates of student mobility or a high number of students who enter as over-age or under-
credited. Although online schools most commonly face these issues, these concerns also have
ramifications for blended schools (those combining digital and face-to-face instruction) and many
traditional physical schools as well.
The ways in which fully online schools are held accountable vary based on how they are overseen, and by state. Online schools fall into one of several categories, and accountability structures differ based on the categories.
• Online charter schools are overseen by charter school authorizers, which may be school districts or other entities.
• District-run online schools that are not charter schools are overseen by local education agencies.
• Schools-within-a-school are held accountable as part of the larger school in which they reside.
Online charter schools and district-run online schools also fall under the state accountability system and receive performance grades based on the state. Schools-within-a-school do not directly fall under the state accountability system as their results are included in the outcomes of the larger school within which they reside.
Accountability systems are not designed to measure online schools. For example, because online schools have high rates of student mobility, and many of the students changing schools are disadvantaged, at-risk, or under-credited, conventional graduation rate calculations may not be providing an accurate picture of the school. This creates a situation in which state policymakers are challenged to determine which schools are successfully moving students ahead towards graduation—even if they are not graduating in four years—and which may actually be contributing to the students failure to graduate.
Among the shortcomings of the current graduation calculations for all schools are:
• Schools receive no recognition towards graduation rate calculations for a student who is on track while at the school, but leaves prior to graduating.
• If a student starts high school elsewhere and enters the school behind on credits, the new school gets no additional recognition for helping the student catch up.
• A school’s four-year graduation rate will be decreased by enrolling a student who is far behind, even if the school helps that student catch up and graduate in five or six years.
3
KEEPING PACE WITH K-12 DIGITAL LEARNING

Policy changes that would help address some of the current accountability system issues include the following:
1. Credit schools with graduating students in five or six years. Schools should receive some points towards their state report card for graduating students in five and six years. How the credit is allotted would depend on the specifics of each state’s school performance framework.
2. Measure students’ progress towards graduation, especially for situations in which students switch schools. The specific calculation would vary by state. Key factors in this approach include defining how a student is determined to be behind, on track, or ahead of pace, at time of enrollment; determining what is appropriate progress towards graduation; and determining incentives to schools for working with students who were behind at time of enrollment and getting them on track to graduate.
3. Change funding mechanisms to systems that minimize the impact of high student mobility. Although funding is often perceived as an issue separate from accountability, funding and accountability are tied together in many ways. In particular, issues of student mobility are exacerbated when funding is based on a limited number of count days.
4. Publish data on student mobility for all schools, and consider creating a designation specific to schools with high rates of student mobility, regardless of other student demographic factors. Student mobility data should include the number and percentage of students who enroll in the school after the start of the school year, as well as the number of students who start beyond certain dates based on a standard methodology. States that create this designation would need to consider whether they would change how the performance rating would be calculated for such schools.
5. Require separate reporting on online programs so that online student outcomes can be tracked. An educational program that is serving a significant number of students with a distinct mode of instruction—as with an online school—should report on online student programs and usage separately from any other school.
6. Calibrate performance penalties for schools that miss targets for the percentage of students who take state assessments. States have a compelling interest in ensuring that a high percentage of students take state assessments, but penalties should be calibrated to different levels of participation, instead of being based on missing a single target.
7. When students change schools, require that the sending school transfer complete student information to the receiving school quickly. When a student changes schools, the new school should quickly have access to data such as attendance, state test results, and other important academic information about the individual student.
School Accountability in the Digital Age
4
8. End counting by cohorts, and determine where students go after leaving an online school. State reporting is too often based on total student counts; instead they should be based on the educational trajectory of each individual student. For example, states should determine where students go after leaving an online school, in categories including students who transfer into another school, those who earn a GED, those who drop out, and those who move out of state and then make sure those designations are appropriately reflected in the calculation of graduation rate.
State accountability systems are meant to measure and report on how well schools are serving students, in ways that can be understood by policymakers, parents, students, and other stakeholders. These accountability systems tend not to measure schools well when certain factors are present, including when the school has a student population with a high rate of mobility, and when the school has a student population that has entered the school behind in terms of credits accumulated towards graduation. Situations in which students maintain progress towards their academic goals should be seen as successful, and should be distinguished from situations where students fall behind.
Implementation of the policy changes outlined above would help address these shortcomings. It would also help ensure that all schools are held accountable for advancing students during their time at the school, whether that time comprises the student’s entire education, or is a very short stop along their educational path.
5
KEEPING PACE WITH K-12 DIGITAL LEARNING

IntroductionPublic schools in the United States operate under state accountability systems that vary from state to state. Many of them are evolving. They are also perceived to contain significant problems in their current forms, which create issues for teachers, administrators, students, parents, school boards, and many other stakeholders.1
This policy brief focuses on the application of school accountability systems to online schools and the students who attend these schools. It explores the ways in which high rates of student mobility in online schools, and the high number of students who enter these schools over-age or under-credited, challenge state accountability systems. These atypical student populations create problems for policymakers and other stakeholders who seek to distinguish schools that are serving these students well from schools that may actually be contributing to the students’ failure to graduate. The issues raised by the presence of these online schools have ramifications for blended schools (those combining digital and face-to-face instruction) and many traditional physical schools as well.2
A brief history of accountability systems and performance frameworksSchool accountability has evolved over the last century, as shown in Figure 1, from first being based on accreditation of inputs, then to the creation of academic standards, and subsequently to state assessments, graduation rates, and other measures of outcomes. As of early 2015 state accountability systems continue to evolve in response to the requirements of No Child Left Behind (NCLB) and the waivers to NCLB being provided by the U.S. Department of Education.3 In addition, the adoption by many states of the Common Core State Standards, and implementation of new state or national assessments (PARCC, Smarter Balanced, and new state assessments), are changing state performance frameworks as well. Although NCLB and other federal regulations create a set of requirements for state accountability systems, these systems vary significantly across different states.
Given this long background and accelerating evolution, a reminder of the goals of accountability is useful. The Center for Reinventing Public Education suggests that accountability
“is about making sure children … learn what they need to be independent adults and contributors to their communities … In modern America, this means graduating from high school able to choose between entering college without the need for remediation, or taking a career-ladder job that will support a family. It also means having the analytical capacity and free time to be an informed voter and an engaged citizen.”4
1 Criticisms about the current set of state accountability requirements that exist under the federal regulatory framework are not limited to a small number of stakeholders or to one side of the political spectrum. See, for example, the National Education Association’s positions on No Child Left Behind (the law that creates the current federal regulatory framework) at http://www.nea.org/home/NoChildLeftBehindAct.html, and a conservative critique of NCLB, The Trouble with No Child Left Behind, at http://mises.org/library/trouble-no-child-left-behind. For a critique of school report cards see Howe, K.R. & Murray, K. (2015). Why School Report Cards Merit a Failing Grade. Boulder, CO: National Education Policy Center. Retrieved January 28, 2015 from http://nepc.colorado.edu/publication/why-school-report-cards-fail.2 This policy brief is focused on schools in which students enroll, not on supplemental online course providers.3 See http://www2.ed.gov/policy/elsec/guid/esea-flexibility/index.html for more information about waivers being provided by the U.S. Department of Education to the requirements of NCLB.4 Center for Reinventing Public Education and Thomas B. Fordham Institute, An Open Letter On School Accountability To State Superintendents of Education and Governors, September 24, 2014
School Accountability in the Digital Age
6

Each state defines accountability in its own way, with a focus on its chosen metrics. For example, the Massachusetts School and District Accountability system is “designed to measure the progress schools and districts are making toward helping all students reach high levels of achievement. A district or school’s Accountability and Assistance Level is used to appropriately target interventions and supports, and recognize or reward excellence.”6
In practice, creating a robust structure that measures complex school systems (many of which differ in important ways), and reports easily understood outcomes, is highly demanding. In its review of state reporting on schools, the Education Commission of the States found that:
… calculations used by states to reach a school’s final grade or rating are rarely simple, often relying on algebraic equations and other mathematical formulas. While this may be necessary to ensure numerous indicators are represented and to create the most accurate ratings, such formulas can be difficult to communicate clearly to the public … Weights and proportions matter. States can measure carefully selected indicators of quality but if the indicators are weighted incorrectly—at least, according to some observers—the result can be a grade or rating that some members of the public see as
5 Marga Mikulecky and Kathy Christie. 2014. Rating States, Grading Schools: What Parents and Experts say States Should Consider to Make School Accountability Systems Meaningful. Denver, CO: Education Commission of the States.6 Retrieved January 3, 2015, from http://www.doe.mass.edu/apa/accountability/default.html
Figure 1: Evolution of accountability in U.S. public schools. Source: Education Commission of the States.5
Accountability Efforts: A National Evolutionby the Education Commission of the states
State school accountability systems, and their goals have evolved over the years:
Accountability 1.0 (1900-80) Accreditation
Initially based on inputs such as staff degrees and numbers of library books, this version evolves in the 1980’s into a focus on performance.
Accountability 2.0 (1990-2001)
Standards-based Accountability
State lawmakers set academic standards and begin state testing, sometimes with rewards and/or sanctions. Florida launches the fi rst state school report cards, grading from A to F.
Accountability 3.0 (2001-10)
No Child Left Behind
Federal lawmakers mandate state testing and outline incentives and consequences with an unprecedented level of detail. Parents in some states receive report cards with two sets of ratings, state and federal.
Accountability 4.0 (2010-Present) Race to the Top
With the renewal of NCLB stalled in congress, President Obama entices states to implement reforms, such as linking students test scores to teacher evaluations, with Race to the Top grants.
Accountability 5.0 (2013-Present)
Standards, Round 2
States adopting standards such as the Common Core are fi guring out new assessments and tweaking accountability systems to measure and report results.
7
KEEPING PACE WITH K-12 DIGITAL LEARNING

inaccurate and, worse, intentionally so … Creating a robust, valid and easy-to-understand report card is harder than it sounds. State legislatures and departments of education have worked years to create such report cards—only to be rewarded with a cacophony of criticism from their constituents.7
In this policy brief, we intend not to add to the “cacophony of criticism,” but to help illuminate accountability issues that relate to online schools, and suggest some changes that may help students, parents, schools, and policymakers better understand and measures these schools. Some of these changes might also benefit districts that have characteristics similar to online schools, including those with high rates of student mobility.
In subsequent sections this paper:
1. Provides background information regarding online schools,
2. Reviews the ways in which these schools are held accountable,
3. Examines issues with the accountability systems related to characteristics of online schools, including serving students with high mobility rates, and
4. Recommends changes aimed at improving accountability, ensuring that students are well served and that schools that are performing well are recognized for doing so, while schools that are functioning poorly face sanctions or other measures to improve or be shut down.
7 Mikulecky and Christie, page 4.
School Accountability in the Digital Age
8

Background on online schoolsFully online schools, also called cyberschools or virtual schools, work with students who are enrolled primarily and usually only8 in the online school. Cyberschools typically are responsible for ensuring their students take state assessments, are responsible for their students’ scores on those assessments, and are graded on the state’s performance framework. These schools may serve students within one district, in multiple districts, or statewide.
Schools serving students only within their own district are usually very small and often designed to serve students who might otherwise drop out of school, or have a medical reason that keeps them from attending a brick-and-mortar school. Such programs may use district teachers who spend most of their time teaching in traditional schools to teach the online courses (as opposed to teachers hired just for the online school).
Multiple district and statewide online schools are able to draw from a larger geographical area, and as a result are able, and more likely, to serve a larger number of students. States that allow schools to serve out-of-district students typically have a separate authorization process those schools must go through, and often require additional reporting.
In many cases online schools operating statewide are charter schools. Charter school regulations often give schools more flexibility than traditional schools, such as allowing for methods of calculating attendance that do not rely on seat time. As is discussed below, charter schools are held accountable by authorizers, who usually set performance expectations in a charter contract. The performance goals often include measures based on state assessments or other state metrics that are used by other schools, and also frequently contain goals that are specific to the online school’s mission or student population.
Some of the fully online schools are district-run, non-charter schools. Of the non-charter online schools operating across multiple districts, most operate in ways that are not evidently different than charter schools because state policies have been put into place that provide for the flexibility from some regulations required by fully online schools. Non-charter schools are held accountable via a district approval process that is overseen by the district school board.
State performance measures and federal regulations create the final layers of oversight and accountability for all online schools, whether charter schools or districts schools.
Fully online schools that attract students from across entire states operate in 30 states9 and will serve about 325,000 students during school year 2014-15.10 (See Figure 2.) In addition, an unknown—but significantly smaller—number of students attend fully online schools run by their district of residence. The largest of these statewide online schools serve many thousands of students. Examples include the Georgia Cyber Academy (13,300 students), Pennsylvania Cyber Charter School (10,389 students), Ohio Virtual Academy (13,147 students), and the Electronic High School of Tomorrow (also in Ohio, with 13,537 students). However, even in the states with large numbers of fully online students, fully online schools typically serve less than 2% of the state’s K–12 student population (see column on right side of Figure 2). Some states may have only a handful of multi-district fully online schools serving students statewide, while other states, including Arizona, California, Pennsylvania, and Ohio, have a dozen or more.
8 Some online schools in a few states such as Arizona provide online courses to students who are primarily enrolled in a physical school.9 Schools in California are restricted to serving students in contiguous counties, but for this policy brief we consider California among the states that have statewide online schools for two reasons: some national management companies support multiple schools in California, and most students in the state have access to at least one online school.10 The estimate for students in fully online schools in school year 2014-15 is based on the count from school year 2013-14 in Keeping Pace with K-12 Digital Learning 2014 Annual Report, available at kpk12.com.
9
KEEPING PACE WITH K-12 DIGITAL LEARNING

A significant portion of all online students attend schools that are supported by education service providers (ESPs). The two largest of the ESPs operating online schools are K12, Inc. (NYSE: LRN) and Connections Education, a wholly owned subsidiary of Pearson®, a United Kingdom-based education company. The ESPs typically provide educational products and services such as the online content, teachers, technology platforms, technical support, and services related to special education. A board of directors that contracts with the ESP oversees the schools. Other online schools don’t use an ESP but often contract with one or more vendors to provide a variety of services.
Figure 2: States with statewide online schools, and the percentage of each state’s student population that is attending statewide online schools. Online schools in California are restricted to operating within contiguous counties, but most students in California have access to online schools. Source: Keeping Pace with K–12 Digital Learning (2014)
AZ
CA
OH
PA
GA
CO
FL
TX
NV
MN
SC
IN
WI
OR
OK
MI
WA
KS
ID
UT
LA
TN
WY
AR
NM
IA
MA
NH
DC
AK
ME
4.48%1
0.64%2,3
2.24%4
2.07%5
1.07%
1.90%5
0.50%
0.21%
2.27%2
1.14%
1.22%
0.73%
0.83%
1.26%
1.05%
0.43%
0.50%6
1.06%
1.81%
0.58%
0.43%
0.29%
1.87%7
0.28%
0.29%
0.11%
0.05%
0.08%
0.16%
0.06%
N/A
40,000
39,044
36,596
48,358
18,035
13,455
16,215
10,258
10,000
9,563
8,877
7,603
7,188
7,172
7,010
6,737
5,200
5,136
5,079
3,491
3,026
2,927
1,689
1,334
977
539
454
162
120
76
New in SY 2014-15
Number of Enrollments in SY 2013–14% of state K–12
population* State
States with Statewide Fully Online Schools FIGURE 2: NUMBER OF STUDENT ENROLLMENTS BY STATE AND PERCENTAGE OF STATE'S K–12 POPULATION
2014
01k2.5k
45k47.5k50k 5005k10,00020,00030,00040,000
1 AZ is a unique count of PT and FT students for SY 2012–13.
2 CA and NV are estimates based on SY 2012–13.
3 In CA fully online schools are limited to drawing students from contiguous counties, but online schools are available to most students in the state.
4 OH: Students counted are those in internet- or computer-based community schools (eschools); the state has no definition for "fully online."
5 CO's SY 2012–13 number is an estimate, likely high.
6 WA: Enrollment numbers from SY 2012–13.
7 WY: Includes both PT and FT students.
* Source for K–12 population: http://nces.ed.gov/programs/stateprofiles/.
MI
AR
TN
IA
OR
CA
AL
NC
MS
MT ND
SD
IL
KY
WV
MO
NE
NY
ME
VA
HI
RICT
VT
MD
NH
DEDC
NJ
MA
GA
FL
SC
LA
CO
WYWI
TX
NM
ID
UT
WA
NV
AZ
KS
OK
IN
PA
AK
MN
OH
Fully online schools
Fully online schools with restrictions
States with neither
States with Statewide Fully Online Schools
School Accountability in the Digital Age
10
Oversight of online schoolsThe ways in which fully online schools are held accountable vary based on the type of school, and also differ by state. The vast majority of students attending fully online schools fall into one of the following three categories:
• Online charter schools.
• District-run online schools that are not charter schools.
• A school-within-a-school.
The accountability structures for these schools differ:
• Charter school authorizers oversee online charter schools. Authorizers may be school districts or other entities, some of which may be created solely as charter school authorizers.
• School districts or other local education agencies most often oversee other online schools that are not charter schools.
• Both types of schools ultimately fall under the state accountability system, and receive performance grades based on the state.
• Schools within schools are held accountable as part of the larger school in which it resides. As a result, the online school does not receive a report or grade that is about its performance alone; its results are included in the outcomes of the larger school within which it resides.
Oversight of online schools by charter school authorizersThe ways in which a charter school authorizer oversees an online charter school differs based on two variables: state requirements, and oversight that is developed and implemented by the authorizer.
State requirements of charter school authorizers generally include school approval and monitoring responsibilities that are both academic and non-academic. The Pennsylvania Department of Education, for example, has published a toolkit of resources for authorizers and charter schools. It provides guidance to authorizers in three primary areas: the charter school application process, charter operations, and charter renewal/non-renewals. It references the specific laws guiding each section of the relationship and notes requirements, including an annual assessment of whether or not a charter school is meeting its goals, and a comprehensive review of the charter prior to granting a 5-year renewal. It also details the process for charter schools to follow when its charter is revoked.11
11 Pennsylvania Department of Education, Authorizer Toolkit, http://www.portal.state.pa.us/portal/server.pt/community/charter_school_authorizer_toolkit/18759/kit/700175
Authorizers And Approvers
online schools may be charter schools or non-charter district-run schools. A formal charter school authorizer oversees charter schools. The state charter school law designates types of authorizers, which may include school districts.
When online schools are not charter schools, a district is typically responsible for their oversight. in this report we refer to such districts as “approving” online schools or as “approvers” to distinguish from “authorizers”—because “authorizer” typically refers to the entity overseeing a charter school.
11
KEEPING PACE WITH K-12 DIGITAL LEARNING
State requirements are often fairly general, and an effective authorizer plays a critical role in ensuring school quality by outlining performance standards in the school contract, and monitoring performance throughout the length of the contract. According to guidance on charter school accountability from the Minnesota Association of Charter Schools:
“The relationship between an authorizer and a school development group begins before the school is granted a charter … the authorizer and school enter into a legally binding written charter contract that outlines the agreed upon goals and performance of the school. Throughout the course of the charter contract, the authorizer monitors and evaluates the performance of the school and, at the end of the contract, makes a decision on whether to renew the charter with the school.”12
The relationship between the authorizer and the charter school is particularly important when the charter school is unusual in its mode of instruction (as with online schools), or when the school is serving students who are not representative of the state population as a whole.
The National Association for Charter School Authorizers (NACSA) has published Principles and Standards for Quality Charter School Authorizing in 201213 and Core Performance Framework and Guidance: Academic, Financial, and Organizational Frameworks for Charter School Accountability,14 both of which provide direction to charter school authorizers. A key element that the NACSA documents explore is performance contracting. A main responsibility of authorizers is to set performance expectations in three areas for each school in its charter contract: academic, financial, and organizational performance. Academic performance standards include expectations for student achievement, academic growth, and postsecondary readiness that incorporate state and federal accountability systems and allow for mission-specific performance measures. These guidelines allow schools and authorizers to set performance measures that work for each school based on its mission and the profile of the students it is serving, and may allow for some flexibility in designing alternative forms of assessment that are valid, reliable, and rigorous.
The Core Performance Framework notes “a quality authorizer maintains high standards and manages charter school performance—not by dictating inputs or controlling processes—but by setting expectations and holding schools accountable for results.” It notes that some authorizers may be restricted by state performance guidelines, while others may have more flexibility in choosing measures of accountability, or in how those measures are weighted. While there are benefits to aligning performance contracts with state performance standards, there are also advantages to including measures in the performance contract that don’t directly align with the state system, including:
• Distinguishing between the lower- and higher-performing schools within given ranges of a state’s accountability system.
• Maintaining continuity if a state’s accountability framework changes.
• Developing a more comprehensive evaluation system that includes student growth measures and postsecondary readiness in states where those measures are not in use.15
12 Minnesota Association of Charter Schools, Authorizing, http://www.mncharterschools.org/iqa-initiatives/authorizing.php13 Principles & Standards for Quality Charter School Authorizing (2012). National Association of Charter School Authorizers; retrieved December 8, 2014 from http://www.qualitycharters.org/assets/files/images/stories/publications/Principles.Standards.2012_pub.pdf. As of January 2015, no organization has published authorizer standards specific to virtual schools.14 Core Performance Framework and Guidance: Academic, Financial, and Organizational Frameworks for Charter School Accountability (2013). National Association of Charter School Authorizers. Retrieved December 8, 2014 from http://www.ccsso.org/Documents/2013/NACSA_Core_Performance_Framework_Guidance_10-3-2013.pdf15 See page 11 of the NACSA Core Performance Framework Guidance document.
School Accountability in the Digital Age
12

Charter authorizers may benefit from more flexibility in measuring performance in a manner consistent with the charter’s mission and the goals described in the charter application—which is exactly what many charter authorizers do in their contracts with online charter schools.
Taken together, these elements indicate that charter authorizers would benefit from measuring performance in a manner consistent with the charter’s mission and the goals described in the charter application—which is exactly what many charter authorizers do in their contracts with online charter schools. Charter school applications should clearly articulate goals based on the specific situation of the school, and the application should become part of the charter contract.
Expectations of charter schools are laid out in extensive contracts with authorizers. Examples include:
• The application from the Pennsylvania Academy Cyber Charter School to the Charter School Office of the Pennsylvania Department of Education includes academic goals tied to state standards and assessments, as well as a goal that “85% of seniors will show evidence of matriculation” into “2 or 4 year college, military, technical, or job training programs based on their individual student success plan.” The Pennsylvania charter application is quite specific, including statements such as “80% of students taking the Keystone Algebra 1 Exam will score proficient or advanced and in each consecutive year student proficiency will increase by 5%.”16
• The contract between Central Michigan University (the authorizer) and the Great Lakes Cyber Academy (the charter high school) sets educational goals for students that include target scores on the ACT and other assessments. Because of issues related to student mobility (explored in the next section), the contract sets targets primarily for students who have been enrolled in the school for three years or more.17
• Because of the complexity of contracts, and the latitude that exists in some contracts, high quality authorizers will create annual progress reports that they share with the school’s governing board, principal, and other key stakeholders, reviewing progress towards key educational, financial, operational, and other metrics.18
Oversight of non-charter online schoolsIn states with fully online schools that are not charter schools, online schools are usually approved by local education agencies that may include school districts, intermediate school districts, or BOCES. The schools and approving entities may have to go through a state reporting and/or approval process as well, although whether such a process exists varies by state.
For example, in Colorado online schools that are approved by LEAs must apply to serve out-of-district students under a state certification process that also applies to online charter schools. All programs wishing to serve students in two or more districts, and more than 10 out-of-district students, must apply for specific certification from the Unit of Online and Blended Learning,19 although final approval for those schools to
16 Revised Application for Provost Academy Cyber Charter School. April 22, 2014. Retrieved December 7, 2014 from www.portal.state.pa.us%2Fportal%2Fserver.pt%2Fdocument%2F1422318%2Fprovost_academy_cyber_charter_school_part_1_pdf&ei=_CSFVMawK9DmoASW_oKYAQ&usg=AFQjCNEi6cyv9Ih8-2zYgxupnrUYrkIyfg&bvm=bv.81449611,d.cGU17 A CONTRACT TO CHARTER A SCHOOL OF EXCELLENCE AND RELATED DOCUMENTS ISSUED TO GREAT LAKES CYBER SCHOOL BY THE CENTRAL MICHIGAN UNIVERSITY BOARD OF TRUSTEES (AUTHORIZING BODY). MARCH 28, 2013. Retrieved Dec 7, 2014, from http://www.thecenterforcharters.org/schools/contracts/MI-33914.pdf18 Personal communication with Jamie Davies O’Leary, Chief Communications & Advocacy Officer, Ohio Council of Community Schools, November 19, 2014.19 Colorado Department of Education Unit of Online and Blended Learning, Technical Assistance, http://www.cde.state.co.us/onlinelearning/events.asp
13
KEEPING PACE WITH K-12 DIGITAL LEARNING

operate rests with the authorizer (for charter schools) or approver (for district schools).20 The certification process is based on three criteria:
1. The authorizer/approver has the resources and capacity to oversee the online school,
2. The authorizer/approver has documented and verified that the online school meets an acceptable level of compliance with the Quality Standards for Online Schools, and
3. The authorizer/approver and the multi-district online school have agreed on a plan for operating the online school.21
Each fully online school—whether charter or not—is held accountable via the state School Performance Framework (SPF); each school’s SPF report is easily available.22 The online schools that are charter schools also have charter contracts with the charter authorizers. The online schools that are not charter schools, and are approved by districts, often do not have a formal contract with the district. Those online schools report to the district board of education in the same ways as other district schools. If, however, the online school uses courses, instruction, or other services from an education service provider, as is the case for example with Edison Academy,23 the district will have a contract with the provider.
Other states follow a variety of approaches that differ in how much oversight the state applies. States such as Arizona, Minnesota, and Kansas apply approval and/or reporting requirements to online schools that are in addition to those that apply to non-online schools. Other states, including Alaska and California, have little state oversight of online schools that is different then the accountability measures applied to all schools. In all of these states it is the local school district, or other approving entity, that is primarily responsible for the online school.
Oversight of online schools that operate within another schoolFinally, in cases where fully online programs are not independent schools, but rather programs within existing schools, accountability takes a different shape. Students in these online programs are still required to participate in state assessments, but their assessment results, dropout rates, and graduation rates all roll into the existing brick-and-mortar school’s performance framework. Accountability for the online program rests with the host school or district, but whether or not outside observers can determine results from the online school separate from the district depends on whether the district separately publishes results of the online program. In most cases, the district does not.
Because of the lack of reporting of these types of online programs, their numbers, and the number of students attending them, is unknown. It appears, however, that the number of fully online schools that are providing a full education to students, but operate from within another school, is quite small.
20 Note that although “authorizer” is a standard term for charter schools, “approver” for a non-charter online school is not standard language. We use it in this policy brief for simplicity.21 As of January 2015 a task force is considering recommendations for changes in Colorado laws pertaining to online schools, and the regulatory framework described here may change in 2015.22 http://www.cde.state.co.us/onlinelearning/schools23 http://www.cde.state.co.us/onlinelearning/schools#edison
School Accountability in the Digital Age
14

Key challenges in accountability systemsWe believe accountability systems don’t measure online schools as well as they should. There are several contributing reasons. For example, the Final Report of the Illinois Charter School Commission Report on Virtual Schools found that “characteristics of virtual schools also complicate student assessment. The existing schedule and protocols of state and school district assessments don’t match up with the more fluid virtual school environment where students enroll throughout the year and complete courses at their own pace. Annual state tests administered on specific days in the spring are not an effective way to measure growth for students who may be studying material that doesn’t match what is being tested.”24
Among the various issues highlighted in the Illinois report, one fundamental area in which online schools challenge accountability systems is in graduation rate calculations and associated issues. Although graduation rate is just one area that states consider in their performance frameworks, in many states the graduation rate is a major component of the overall score, accounting for as much as 30%.25
Graduation rates and state accountability ratingsPrior to 2010, a standard approach for calculating high school graduation rates across states did not exist. Some states used a National Center for Education Statistics (NCES) method of counting the number of graduates divided by the number of graduates plus dropouts, while some states relied on estimates, and others calculated the rate based on the number of students who entered 12th grade the previous fall.
Federal regulations issued in 200826 addressed those concerns by standardizing how graduation rates are calculated in each state. Beginning with school year 2010-11, all states were required to report a “four-year adjusted cohort graduation rate.” The rate counts all students who graduate within four years of entering high school, adjusting for students who transfer in and out of school. The adjustment is made by adding any students who transfer into the cohort, and subtracting any students who transfer out by enrolling in another educational program, emigrating to another country, or dying during the years covered by the rate. States must report the four-year cohort rate for each school, as well as for student subgroups within each school including race/ethnicity, gender, students with disabilities, economically disadvantaged students, English language learners, and talented and gifted students. States may also choose to use an extended-year cohort graduation rate, such as a 5-year rate, alongside the 4-year rate in its accountability systems. These are the only two graduation rate calculations that can be used for Title I accountability requirements.27
NCLB waivers add a level of complexity to graduation rates.28 While all states still must calculate and report the 4-year cohort graduation rate, they are not required to use that rate in their state accountability systems. States can choose the extent to which graduation rate counts in calculations, and they can choose to use additional graduation rate calculations as well.29 Many states have chosen to also include a 5-year
24 Richmond, G. (2014) Final Report of the Illinois Charter School Commission Report on Virtual Schools, Approved on February 21, 2014. Illinois State Charter School Commission. Retrieved May 21, 2014, http://www.isbe.state.il.us/SCSC/pdf/vsag-final-report.pdf 25 See, for example, the Nevada points breakdown at http://nspf.doe.nv.gov/Home/AboutHS, and the explanation for South Carolina at https://ed.sc.gov/data/esea/2013/docs/ESEA_2013_Brief_Technical_Document.pdf26 U.S. Department of Education, High School Graduation Rate Non-Regulatory Guidance, December 2008, http://www2.ed.gov/policy/elsec/guid/hsgrguidance.pdf27 State graduation rate calculations vary, and are complex. For example, see Minnesota’s graduation rate calculation explanation at “How to Understand Graduation Rate Calculation”, retrieved January 6, 2015 from http://education.state.mn.us/MDE/Welcome/OfficeCom/Super/WeekSuptMail/05430628 US Department of Education, Graduation Rates and ESEA Flexibility, http://www2.ed.gov/policy/elsec/guid/esea-flexibility/gradrate/index.html29 Young, K. NCLB Waivers and Accountability: The Graduation Rate Balancing Act. Jobs for the Future. (2013).
15
KEEPING PACE WITH K-12 DIGITAL LEARNING

graduation rate in their accountability systems, as students who do not graduate in four years are counted as non-graduates under the 4-year rate, but the school / state can get credit for those students graduating in five years if they also do a 5-year cohort graduation rate calculation. The 5-year calculation may not be used only for particular subgroups, but must be calculated for the whole school and all subgroups.
Graduation rates are then used as part of school ratings. Minnesota, for example, uses four measures: proficiency, growth, achievement gap reduction and graduation rates.30 It began using the federally required adjusted cohort graduation rate model in 2012. This model follows students in a group, or a “cohort,” throughout high school and determines if they graduate within four, five or six years. All schools that serve 12th grade students receive a four-, five- and six-year graduation rate, including traditional high schools and alternative high schools. Schools must have at least 40 students in the graduating cohort to receive a graduation rate and have it displayed publicly.
Other states are taking similar approaches to calculating graduation rates. In many cases methods for calculating the rates are explained in detailed guidance documents.31
The cohort calculation works fairly well if the following are true:
• Most students enter the high school at the beginning of the freshman year, or, if they enter later, are on track towards graduation when they enter.
• For students who leave the school, the state has accurate information on where the students go so that they are accurately counted as going into another school or dropping out of the school system.
These calculation methods, however, often do not work well for online schools that have high rates of student mobility. Many of the students changing schools are disadvantaged, at-risk, or under-credited. For example, analysis of student data from 24 online schools served by the two leading outsource service organizations showed that 35% of students who entered those schools in grades 10, 11, or 12 were behind in credits at the time of enrollment.
This creates a situation in which state policymakers are challenged to determine which schools are successfully moving students ahead towards graduation—even if they are not graduating in four years—and which may actually be contributing to the students failure to graduate.
For all schools, whether they are online, or brick-and-mortar:
• They receive no credit towards graduation for a student who is on track while at the school, but leaves prior to graduating.
• If a student starts high school elsewhere and enters the school behind on credits, the new school gets no additional credit for helping students catch up.
• A school’s four-year graduation rate will be decreased by enrolling a student who is far behind, even if the school helps that student catch up and graduate in five or six years.
30 http://www.education.state.mn.us/MDE/SchSup/ESEAFlex/MMR/index.html31 See, for example, the explanation from the Ohio Department of Education at https://education.ohio.gov/getattachment/Topics/Data/Report-Card/2012-2013-Technical-Documentation-Graduation-Rate-Measure.pdf.aspx
School Accountability in the Digital Age
16

Student mobility ratesHigh rates of student mobility are known to present challenges to students and schools, whether online or physical. A report from the U.S. Government Accountability Office (GAO) finds that “Schools face a range of challenges in meeting the academic, social, and emotional needs of students who change schools.” Although some of these challenges are due to the circumstances that lead to high mobility rates, such as students living in poverty, other challenges are specific to the act of changing schools. “Students who change schools often face challenges due to differences in what is taught and how it is taught. Students may arrive without records or with incomplete records, making it difficult for teachers to make placement decisions and identify special education needs.”32 Similarly, a meta-analysis found that “mobility was consistently associated with lower achievement and higher rates of high school dropout. Findings were larger, more consistent, and of greater practical significance for school dropout than for achievement.”33
Policymakers need to find a way to discern the difference between situations in which a student switching schools is a success, and those in which a student leaving school is a failure.
The GAO characterizes high mobility schools as those in which more than 10% of the student population leaves before the end of the school year. Many online schools work with student populations that have far higher rates of student mobility. For example, a Minnesota study found that “online students as a group are more mobile than the general student population.”34 In Colorado, “online schools have some of the highest mobility rates in the state” and as a whole the online school mobility rates have been found to be twice as high as the statewide average.35 Unlike most situations in physical schools, however, families often enroll students in online schools with the expectation that the student’s time in the online school will be temporary and that the student will return to a traditional school.
Data from the two leading outsource service organizations for online schools found not only high rates of student mobility in between school years, but also students often entering or leaving its online schools during the school year—which is even more disruptive for students. An analysis of just over 180,000 student enrollments across online schools in school year 2013-14 found that 52% of students enrolled after the start of the school year, and 33% of students enrolled four weeks or more after the start of the school year.36
Data from specific schools show additional details. At the Arizona Virtual Academy (AZVA), for example:
• 78% of enrolled high school students were enrolled for 2 years or less.
• More than half of those students (58%) were enrolled for one year or less.
• Of the students who were enrolled for one year or less, 75% were enrolled for six months or less.
• 79% who were enrolled for one year or less also withdrew during the same academic year.
32 United States Government Accountability Office. 2010. Many Challenges Arise in Educating Students Who Change Schools Frequently. GAO-11-40. Retrieved December 3, 2014 from http://www.gao.gov/new.items/d1140.pdf33 Arthur J. Reynolds, Chin-Chih Chen, and Janette E. Herbers. 2009. School Mobility and Educational Success: A Research Synthesis and Evidence on Prevention. University of Minnesota. Retrieved December 3, 2014 from http://www.iom.edu/~/media/Files/Activity%20Files/Children/ChildMobility/Reynolds%20Chen%20and%20Herbers.pdf34 Minnesota Office of the Legislative Auditor, Program Evaluation Division. (2011). Evaluation Report. K–12 online learning. Retrieved January 8, 2015 from http://www.auditor.leg.state.mn.us/ped/pedrep/k12oll.pdf35 Amanda Heiney, Dianne Lefly and Amy Anderson. 2012. Characteristics of Colorado’s Online Students. Colorado Department of Education Office of Online & Blended Learning. Retrieved December 3, 2014 from http://www.cde.state.co.us/sites/default/files/documents/onlinelearning/download/ol_research_final.pdf36 These numbers and the numbers for the Arizona Virtual Academy below are based on unpublished numbers provided by the schools in the study.
17
KEEPING PACE WITH K-12 DIGITAL LEARNING

These high rates of student mobility also directly affect graduation rates. For the class of 2014, across 14 high schools supported by Connections Academy, 30% of the enrollments were new for the student’s senior year. For graduation rate calculations, these students’ performance is attributed to the school in which they are enrolled four years after they begin high school. Whether or not those students graduated on time, it does not make sense to give credit, or blame, to the school that taught those students for less than 25% or less of their total high school time.
What happens when students leave?When a student leaves an online school, the departure may be a positive, negative, or neutral event. If the student leaves because she graduates, that is positive. If the student intended to be in the online school temporarily, stays on track towards graduation, and then leaves the online school to go back to his physical school, that is a positive event as well. If instead the student drops out of the school system entirely, or is expelled, that is clearly a negative outcome. In addition, other events might be considered neutral, in part because the final educational outcome is unknown. Examples in this category include a student moving to another state.
States often have exit codes that are used for calculating high school graduation rates.37 These codes guide the school and state in whether a student is considered to be part of the cohort for calculation purposes, is considered a dropout, or is dropped from the calculation entirely. Understanding of school performance would be improved in many states by taking into account the outcomes of more students as part of a school’s accountability rating instead of (in many cases currently) the students simply being dropped from the cohort calculation when they leave the school without graduating or dropping out.
37 See, for example, Exit Codes and HS Completion, Utah State Office of Education, retrieved January 11, 2015, from http://schools.utah.gov/data/News/ExitCodesHighSchool.aspx; District of Columbia Standard Student Entry and Exit Code Guidance, retrieved January 11, 2015 from http://osse.dc.gov/sites/default/files/dc/sites/osse/publication/attachments/OSSE_Entry_Exit_Guidance_FINAL_20140726.pdf; and California state exit codes, retrieved January 11, 2015 from http://www.sandi.net/cms/lib/CA01001235/Centricity/Domain/121/research/Exits/StateExitCodes.pdf
School Accountability in the Digital Age
18
RecommendationsOur recommendations fall into two categories: those related to how schools are held accountable, and those related to data collection, reporting, and transparency. Several of the recommendations extend the current shift from reliance on student proficiency to a greater focus on student growth, and apply these concepts to graduation rates. Some of the recommendations require improvements and changes to the data-gathering and management systems that support them.
1. Credit schools with graduating students in five or six years. In an ideal system that is based on understanding each student’s status towards graduation, schools would receive credit for students gaining credits towards graduation at an appropriate rate at any point in their high school years. In the absence of such a system, schools should receive some points towards their state report card for graduating students in five and six years. How the credit would be allotted would depend on the specifics of each state’s school performance framework. For some states, this would require adding a formal count of five-year and six-year graduation rates to the normal four-year count. Some states are already doing this, and giving partial credit for five year and six year graduations.
2. Measure students’ progress towards graduation, especially for situations in which students switch schools.The specific calculation would be determined by the state. Key factors that should be taken into account when this approach is put into place include:
• Defining how a student is determined to be behind, on track, or ahead of pace, at time of enrollment.
• Determining what is appropriate progress towards graduation. This includes defining the relationship between progress during a school year and the student’s status at the end of the year in cases in which a student earns more or fewer than the standard number of credits. For example, how should a situation be handled in which a student earns fewer than the standard number of credits for a year but still is on track towards graduation at the end of the year because in a previous year he had earned more than the standard number of credits? In addition, the definition should take into account situations in which a student enrolls or withdraws from a school in the middle of the school year, especially in the middle of a term before credits would typically be awarded.
• Determining incentives to schools for working with students who were behind at time of enrollment and getting them on track to graduate.
3. Change funding mechanisms to systems that minimize the impact of high student mobility. Although funding is often perceived as an issue separate from accountability, funding and accountability are tied together in many ways. In particular, issues of student mobility are exacerbated when funding is based on a limited number of count days.
School funding methodologies vary by state. Most states broadly use one of the following funding calculation methods:
• Single count day: Students are counted on a single day each year.
• Multiple count days or count period: Students are counted on a single day or short periods during multiple times throughout the year.
• Average daily attendance (ADA): Students are counted based on the average actual daily attendance.
19
KEEPING PACE WITH K-12 DIGITAL LEARNING

• Average daily membership (ADM): Students are counted based on the average actual daily enrollment.38
• Achievement-based: Funding is based on demonstrated achievement metrics of student outcomes.
We believe there is a predictable relationship between these funding schemes and accountability methodology. A single annual count day will be the least desirable for both funding and accountability effectiveness, whereas the achievement-based model will be the most effective and equitable for both funding and accountability. As Figure 3 below shows, states would improve their funding mechanisms by moving up and to the right along the continuum, and in doing so would alleviate some of the ways in which poor funding mechanisms exacerbate student mobility issues.
Only a few states have achieved funding that is truly based on competency. New Hampshire’s funding of the Virtual Learning Academy Charter School (VLACS) is an excellent example, because VLACS creates competencies for each course, and receives funding from the state based on students demonstrating achievement of the competencies.39 This is a different approach than is taken by most other states that fund
38 Funding definitions (except for achievement-based funding) are based on Education Commission of the States. 2012. Understanding State School Funding. The Progress of Education Reform, Vol. 13, No. 3. June 2012. Retrieved January 25, 2015 from http://www.ecs.org/clearinghouse/01/02/86/10286.pdf.39 For more information on the VLACS funding model see Competency Moves Beyond Courses September 16, 2013, retrieved January 18, 2015 from http://www.competencyworks.org/reflections/competency-moves-beyond-courses/40 This diagram shows a linear and equal difference in value between each level and is used for illustrative purposes only to show the progression through the methods. We recognize there are non-linear differences between these levels, both in terms of funding and accountability.
Figure 3: There is a
predictable relationship between the effectiveness and equitability of funding
and accountability approaches40
Achievement-based
Average daily Membership
Average daily Attendance
Multiple count days
Single count day
ACCOUNTABILITY
Increasingly effective and equitable
Incr
easi
ngly
effe
ctiv
e an
d eq
uita
ble
FUN
DIN
G
Funding Mechanisms Infl uence Accountability
School Accountability in the Digital Age
20

based on performance, because in most cases “performance” is defined as passing a course. Only a few states, including New Hampshire (for VLACS) and Wyoming,41 allow funding based on a unit of learning that is smaller than a course. Having the performance funding be based on a smaller unit of learning is vital for achievement-based funding to be a viable option.
4. Publish data on student mobility for all schools, and consider creating a designation specific to schools with high rates of student mobility, regardless of other student demographic factors.Student mobility data should include the number and percentage of students who enroll in the school after the start of the school year, as well as the number of students who start beyond certain dates based on a standard methodology. These might, for example, include students who begin school more than two weeks after the start date, and those who begin more than a month after the start date. The exact categories are not critical, but they should reflect that there is an important difference between a student who, for example, begins a day late and one who begins a month late.42
As discussed earlier in this report, evidence suggests that high rates of mobility are in themselves a risk factor. For schools with student populations that have high mobility rates, these factors should be considered in the context of appropriate school performance expectations. States that create this designation would need to consider whether they would change how the performance rating would be calculated for such schools.
5. Require separate reporting for online programs so that online school outcomes can be tracked.An educational program that is serving a significant number of students with a distinct mode of instruction—as with an online school—should report on online student programs and usage separately from any other school. Requiring such programs to report separately would ensure that the state, parents, students, and other stakeholders would be able to determine how well the online program is serving students.
6. Calibrate performance penalties for schools that miss targets for the percentage of students who take state assessments.States have a compelling interest in ensuring that a high percentage of students take state assessments, to ensure that schools do not have an incentive to deter any students from taking the tests. Many states reduce the school score by one letter grade for missing the 95% target participation rate. Some states, however, take an approach that acknowledges challenges for some schools in meeting the target—which is especially true for online schools attracting students from wide geographic areas, and which have high mobility rates. Arizona, for example, has a system with increasing penalties for schools that miss the 95% target, based on the school’s actual participation rate. If the school has a rate between 85% and 94%, it can receive no better than a B from the state. If it receives between 75% and 84%, it can receive no better than a C. In this way, schools have an incentive to have as many students take state assessments as possible, and the state system accounts for the difference between a 94% participation rate and a rate that is far lower.43
41 Wyoming distance education rules specify the creation of “milestones” for students that are used in several ways, including as “attendance and membership equivalency within the student’s distance learning plan.” Retrieved January 7, 2015 from http://soswy.state.wy.us/Rules/RULES/8279.pdf.42 Some states are already publishing mobility rates, although not at a fine level of detail. Texas is an example; see http://ritter.tea.state.tx.us/perfreport/src/2014/campus.srch.html. Resulting reports include mobility rates. 43 For details on Arizona’s system regarding participation rates in state assessments, see page 12 of the 2013 A-F Letter Grade Accountability System. Retrieved Dec 14, 2014, from http://www.azed.gov/research-evaluation/files/2013/11/2013-a-f-technical-manual.pdf
21
KEEPING PACE WITH K-12 DIGITAL LEARNING

7. When students change schools, require that the sending school transfer complete student information to the receiving school quickly, preferably via standardized electronic means.The number of states with student choice options (charter schools, course choice, alternative education) is increasing. With more options for students, it is likely that students are changing schools more often. Certainly student mobility rates in online schools are higher than in physical schools. When a student changes schools, the new school should quickly have access to data such as attendance, state test results, and other important academic information about the individual student.
8. End counting by cohorts, and determine where students go after leaving an online school.State reporting is too often based on total student counts, instead of being based on the educational trajectory of each individual student. Examples given earlier in this brief are mostly about graduation rate calculations, but cohorts are used in other instances as well. For example, a Tennessee report on virtual schools calculates attrition as follows: “Attrition rate is the number of students who transferred (enter minus exit school after October 1) divided by the total number of students enrolled at the beginning of school. For example, if 100 kids were enrolled at the start of the year and 15 kids entered and 5 exited, the student attrition rate would be 10%.”44 The resulting calculation yields a negative attrition rate for three of the eight online schools in Tennessee. A negative attrition rate tells us that the school had more students at the end of the year than at the start.
Tennessee’s approach is not unusual; the cohort method is commonly used, and it works fairly well when few students change schools. But for schools that have high rates of student mobility, policymakers must be able to discern the difference between situations in which a student switching schools is a success, and those in which a student leaving school is a failure.
States should determine where students go after leaving an online school, including (but not limited to) the following categories:
• Students who transfer into a physical school
• Students who transfer into another online school
• Students who move out of state
• Students who leave the school system and get a GED
• Students who leave the school system and do not get a GED
Students in these categories should be counted and the results incorporated into school ratings.
44 Tennessee Department of Education. Virtual Education Report. July 2014. Retrieved December 8, 2014 from http://www.tn.gov/education/data/doc/virtual_education_report_2014.pdf.
School Accountability in the Digital Age
22

ConclusionState accountability systems are meant to measure and report on how well schools are serving students, in ways that can be understood by policymakers, parents, students, and other stakeholders. These accountability systems tend not to measure schools well when certain factors are present, including when the school has a student population with a high rate of mobility, and when the school has a student population that has entered the school behind in terms of credits accumulated towards graduation. Current accountability measures do not account for the way in which many families consider enrollment in an online school as a solution to a temporary problem, and intend to return to a physical school once the problem is resolved. Situations in which students maintain progress towards their academic goals should be seen as successful, and should be distinguished from situations where students fall behind. In addition, under current accountability systems it is often difficult or impossible to distinguish between the schools that are serving students well by helping them graduate (whether this is on-time or in five or six years), and those schools that may actually be contributing to the students’ failure to graduate.
Implementation of the policy changes detailed above would help address these shortcomings. It would also help ensure that all schools are held accountable for advancing students during their time at the school, whether that time comprises the student’s entire education, or is a very short stop along their educational path.
23
KEEPING PACE WITH K-12 DIGITAL LEARNING
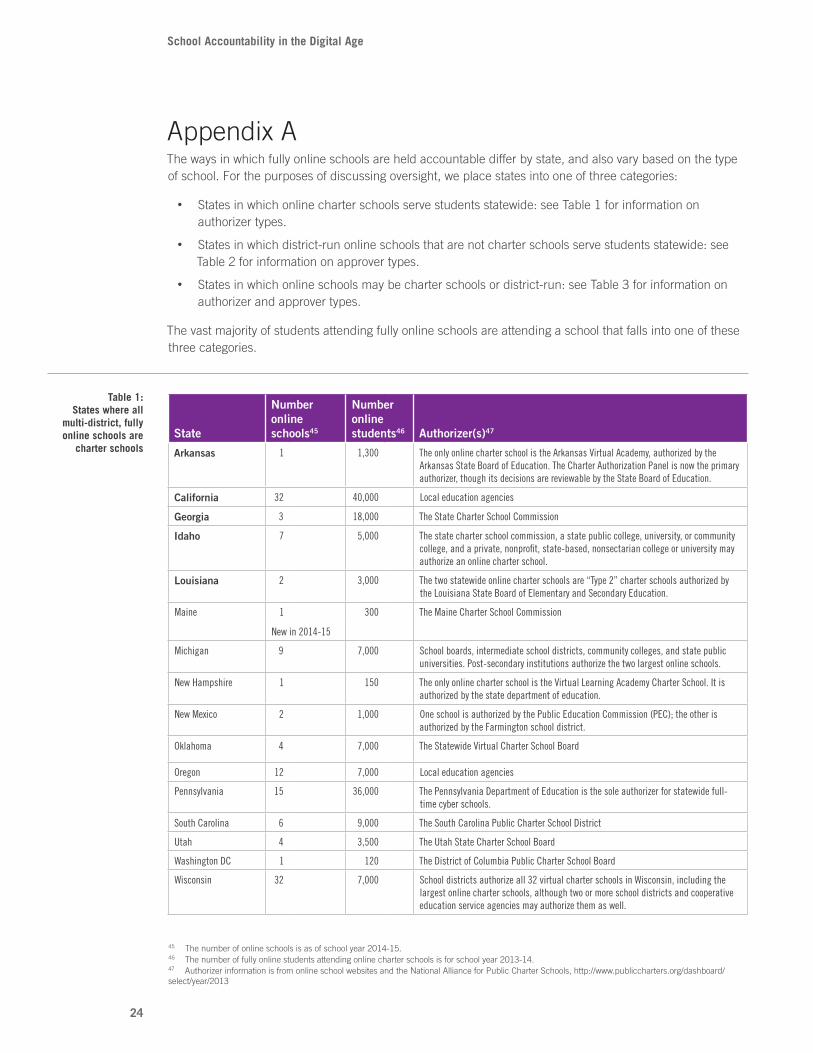
Appendix AThe ways in which fully online schools are held accountable differ by state, and also vary based on the type of school. For the purposes of discussing oversight, we place states into one of three categories:
• States in which online charter schools serve students statewide: see Table 1 for information on authorizer types.
• States in which district-run online schools that are not charter schools serve students statewide: see Table 2 for information on approver types.
• States in which online schools may be charter schools or district-run: see Table 3 for information on authorizer and approver types.
The vast majority of students attending fully online schools are attending a school that falls into one of these three categories.
State
Number online schools45
Number online students46 Authorizer(s)47
Arkansas 1 1,300 The only online charter school is the Arkansas Virtual Academy, authorized by the Arkansas State Board of Education. The Charter Authorization Panel is now the primary authorizer, though its decisions are reviewable by the State Board of Education.
California 32 40,000 Local education agencies
Georgia 3 18,000 The State Charter School Commission
Idaho 7 5,000 The state charter school commission, a state public college, university, or community college, and a private, nonprofit, state-based, nonsectarian college or university may authorize an online charter school.
Louisiana 2 3,000 The two statewide online charter schools are “Type 2” charter schools authorized by the Louisiana State Board of Elementary and Secondary Education.
Maine 1 300 The Maine Charter School Commission
New in 2014-15
Michigan 9 7,000 School boards, intermediate school districts, community colleges, and state public universities. Post-secondary institutions authorize the two largest online schools.
New Hampshire 1 150 The only online charter school is the Virtual Learning Academy Charter School. It is authorized by the state department of education.
New Mexico 2 1,000 One school is authorized by the Public Education Commission (PEC); the other is authorized by the Farmington school district.
Oklahoma 4 7,000 The Statewide Virtual Charter School Board
Oregon 12 7,000 Local education agencies
Pennsylvania 15 36,000 The Pennsylvania Department of Education is the sole authorizer for statewide full-time cyber schools.
South Carolina 6 9,000 The South Carolina Public Charter School District
Utah 4 3,500 The Utah State Charter School Board
Washington DC 1 120 The District of Columbia Public Charter School Board
Wisconsin 32 7,000 School districts authorize all 32 virtual charter schools in Wisconsin, including the largest online charter schools, although two or more school districts and cooperative education service agencies may authorize them as well.
45 The number of online schools is as of school year 2014-15.46 The number of fully online students attending online charter schools is for school year 2013-14.47 Authorizer information is from online school websites and the National Alliance for Public Charter Schools, http://www.publiccharters.org/dashboard/select/year/2013
Table 1: States where all
multi-district, fully online schools are
charter schools
School Accountability in the Digital Age
24
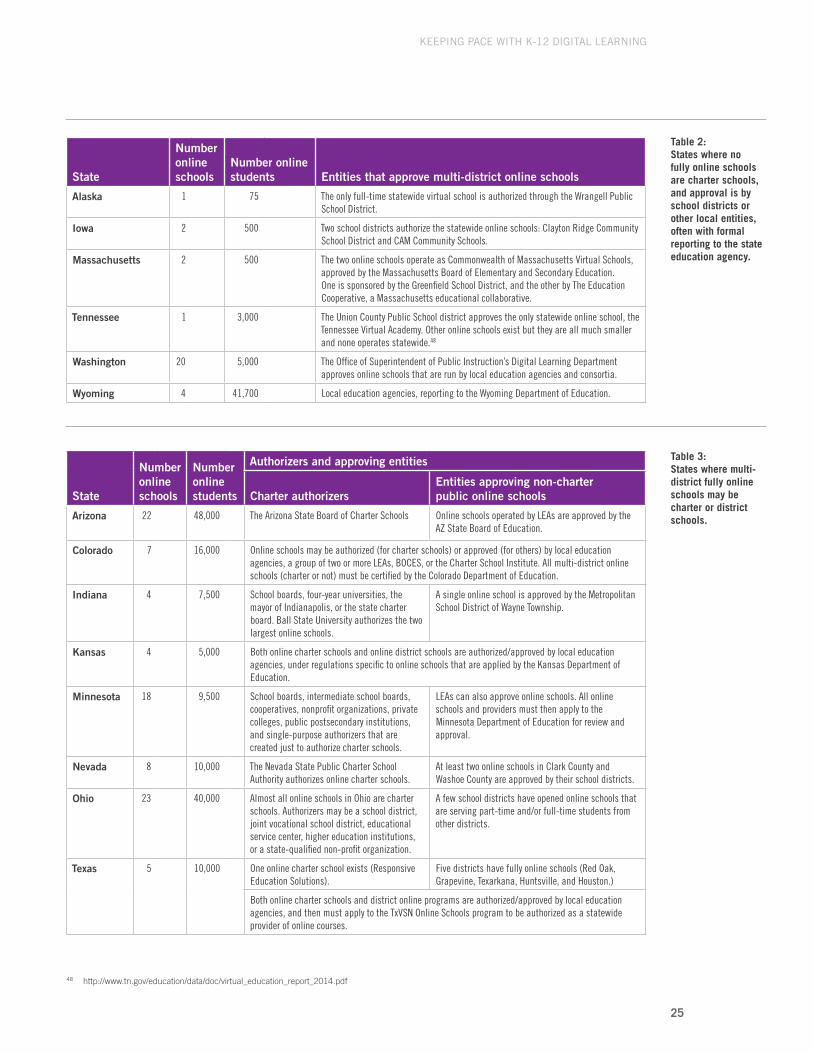
State
Number online schools
Number online students Entities that approve multi-district online schools
Alaska 1 75 The only full-time statewide virtual school is authorized through the Wrangell Public School District.
Iowa 2 500 Two school districts authorize the statewide online schools: Clayton Ridge Community School District and CAM Community Schools.
Massachusetts 2 500 The two online schools operate as Commonwealth of Massachusetts Virtual Schools, approved by the Massachusetts Board of Elementary and Secondary Education. One is sponsored by the Greenfield School District, and the other by The Education Cooperative, a Massachusetts educational collaborative.
Tennessee 1 3,000 The Union County Public School district approves the only statewide online school, the Tennessee Virtual Academy. Other online schools exist but they are all much smaller and none operates statewide.48
Washington 20 5,000 The Office of Superintendent of Public Instruction’s Digital Learning Department approves online schools that are run by local education agencies and consortia.
Wyoming 4 41,700 Local education agencies, reporting to the Wyoming Department of Education.
State
Number online schools
Number online students
Authorizers and approving entities
Charter authorizersEntities approving non-charter public online schools
Arizona 22 48,000 The Arizona State Board of Charter Schools Online schools operated by LEAs are approved by the AZ State Board of Education.
Colorado 7 16,000 Online schools may be authorized (for charter schools) or approved (for others) by local education agencies, a group of two or more LEAs, BOCES, or the Charter School Institute. All multi-district online schools (charter or not) must be certified by the Colorado Department of Education.
Indiana 4 7,500 School boards, four-year universities, the mayor of Indianapolis, or the state charter board. Ball State University authorizes the two largest online schools.
A single online school is approved by the Metropolitan School District of Wayne Township.
Kansas 4 5,000 Both online charter schools and online district schools are authorized/approved by local education agencies, under regulations specific to online schools that are applied by the Kansas Department of Education.
Minnesota 18 9,500 School boards, intermediate school boards, cooperatives, nonprofit organizations, private colleges, public postsecondary institutions, and single-purpose authorizers that are created just to authorize charter schools.
LEAs can also approve online schools. All online schools and providers must then apply to the Minnesota Department of Education for review and approval.
Nevada 8 10,000 The Nevada State Public Charter School Authority authorizes online charter schools.
At least two online schools in Clark County and Washoe County are approved by their school districts.
Ohio 23 40,000 Almost all online schools in Ohio are charter schools. Authorizers may be a school district, joint vocational school district, educational service center, higher education institutions, or a state-qualified non-profit organization.
A few school districts have opened online schools that are serving part-time and/or full-time students from other districts.
Texas 5 10,000 One online charter school exists (Responsive Education Solutions).
Five districts have fully online schools (Red Oak, Grapevine, Texarkana, Huntsville, and Houston.)
Both online charter schools and district online programs are authorized/approved by local education agencies, and then must apply to the TxVSN Online Schools program to be authorized as a statewide provider of online courses.
48 http://www.tn.gov/education/data/doc/virtual_education_report_2014.pdf
Table 2: States where no fully online schools are charter schools, and approval is by school districts or other local entities, often with formal reporting to the state education agency.
Table 3: States where multi-district fully online schools may be charter or district schools.
25
KEEPING PACE WITH K-12 DIGITAL LEARNING

evergreenedgroup.com | kpk12.com