schneider electric infrastructure limited · schneider electric infrastructure limited – investor...
TRANSCRIPT
Schneider Electric Infrastructure Limited – Investor Presentation
Schneider Electric Infrastructure
Limited
Q3 FY 2019-20
7th Feb 2020
1
Schneider Electric Infrastructure Limited – Investor Presentation 2
Disclaimer
All forward-looking statements are Schneider Electric Infrastructure Limited (India) management’s present
expectations of future events and are subject to a number of factors and uncertainties that could cause actual
results to differ materially from those described in the forward-looking statements.
.
This presentation includes information pertaining to the our markets and our competitive positions therein. Such
information is based on market data and our actual sales in those markets for the relevant periods. We obtained
this market information from various third party sources (industry publications, surveys and forecasts) and our own
internal estimates. We have not independently verified these third party sources and cannot guarantee their
accuracy or completeness and our internal surveys and estimates have not been verified by independent experts or
other independent sources.

Schneider Electric Infrastructure Limited – Investor Presentation
Page 3Confidential Property of Schneider Electric |
Real GDP Growth Rate 1
Steady recovery expected in GDP growth rate from 2020; Faster than China
CAPEX investment trend 2
Segments - Transport, Healthcare, WWW, Comm. Real Estate expected to drive recovery
Composite Index 3
Stable growth of ~ 5.3% - 6.4% projected for the period 2020 -2021
4.5%
2018 2020
(P)
5.0%
2019
(P)
7%-7.5%
2021
(P)
4.8%
6.8%
+ + +
2019
(P)
6.8%
3.6%
2018
5.4%
6.4%
2020
(P)
2021
(P)H1’18 H2’18 H1’19 H2’19
India Emerging Eco
6% - 6.5%
1 Source: IMF & MOSPI for actuals & forecasts2 Source: CMIE for actuals & forecasts3 CI: Composite Index source is Oxford Economics. Figures updated as per Jan’20 release
Actuals Forecast
After a tough 2019, 2020 expected to be better; But we need
to proceed with caution
8.9
5.7
4.4
6.1
Announced Investment (INR Tn)
3
Schneider Electric Infrastructure Limited – Investor Presentation
CPI - Inflation
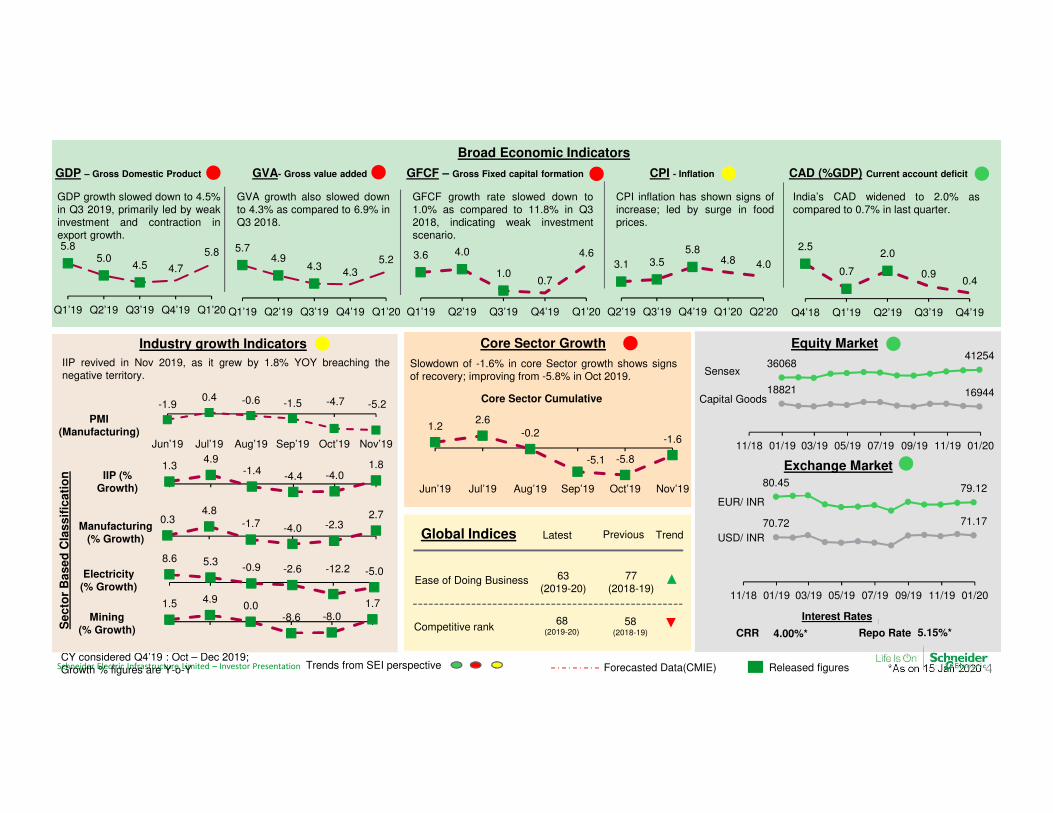
India’s CAD widened to 2.0% ascompared to 0.7% in last quarter.
CPI inflation has shown signs ofincrease; led by surge in foodprices.
CAD (%GDP) Current account deficitGFCF – Gross Fixed capital formationGVA- Gross value addedGDP – Gross Domestic Product
GVA growth also slowed downto 4.3% as compared to 6.9% inQ3 2018.
GFCF growth rate slowed down to1.0% as compared to 11.8% in Q32018, indicating weak investmentscenario.
5.85.0
4.7
Q1’19 Q2’19
4.5
Q3’19 Q4’19
5.8
Q1’20
3.6 4.0
1.00.7
4.6
Q1’19 Q3’19Q2’19 Q4’19 Q1’20
Ease of Doing Business
Competitive rank
Latest Previous TrendGlobal Indices
Broad Economic Indicators
Trends from SEI perspective
2.5
0.7
2.0
0.90.4
Q4’18 Q2’19Q1’19 Q4’19Q3’19
Core Sector Growth
Core Sector Cumulative
Equity Market
Interest Rates
4.00%* 5.15%*CRR Repo Rate
Capital Goods
Sensex
Forecasted Data(CMIE)
GDP growth slowed down to 4.5%in Q3 2019, primarily led by weakinvestment and contraction inexport growth.
Released figures *As on 15 Jan 2020
63(2019-20)
77(2018-19)
68(2019-20)
1.22.6
-0.2
-5.1 -5.8
-1.6
Nov’19Jul’19Jun’19 Aug’19 Sep’19 Oct’19
CY considered Q4’19 : Oct – Dec 2019; Growth % figures are Y-o-Y
Industry growth Indicators
8.6 5.3-0.9 -2.6 -12.2 -5.0Electricity
(% Growth)
Se
cto
r B
as
ed
Cla
ss
ific
ati
on
1.34.9
-1.4-4.4 -4.0
1.8
Manufacturing (% Growth)
IIP (% Growth)
IIP revived in Nov 2019, as it grew by 1.8% YOY breaching thenegative territory.
0.34.8
-1.7 -4.0 -2.32.7
Mining (% Growth)
PMI (Manufacturing)
-1.90.4 -0.6 -1.5 -4.7 -5.2
Aug’19Jun’19 Jul’19 Nov’19Sep’19 Oct’19
1.5 4.90.0
-8.6 -8.0
1.7
3606841254
18821 16944
11/18 03/19 09/1901/19 05/19 07/19 11/19 01/20
Exchange Market
58(2018-19)
4.95.7
Q1’19 Q4’19Q2’19
4.3
Q3’19
4.35.2
Q1’20
80.4579.12
70.72 71.17
01/2011/18 01/19 03/19 05/19 07/19 09/19 11/19
EUR/ INR
USD/ INR
3.1 3.55.8
4.8 4.0
Q2’19 Q1’20Q4’19Q3’19 Q2’20
Slowdown of -1.6% in core Sector growth shows signsof recovery; improving from -5.8% in Oct 2019.
4
Page 5Confidential Property of Schneider Electric |
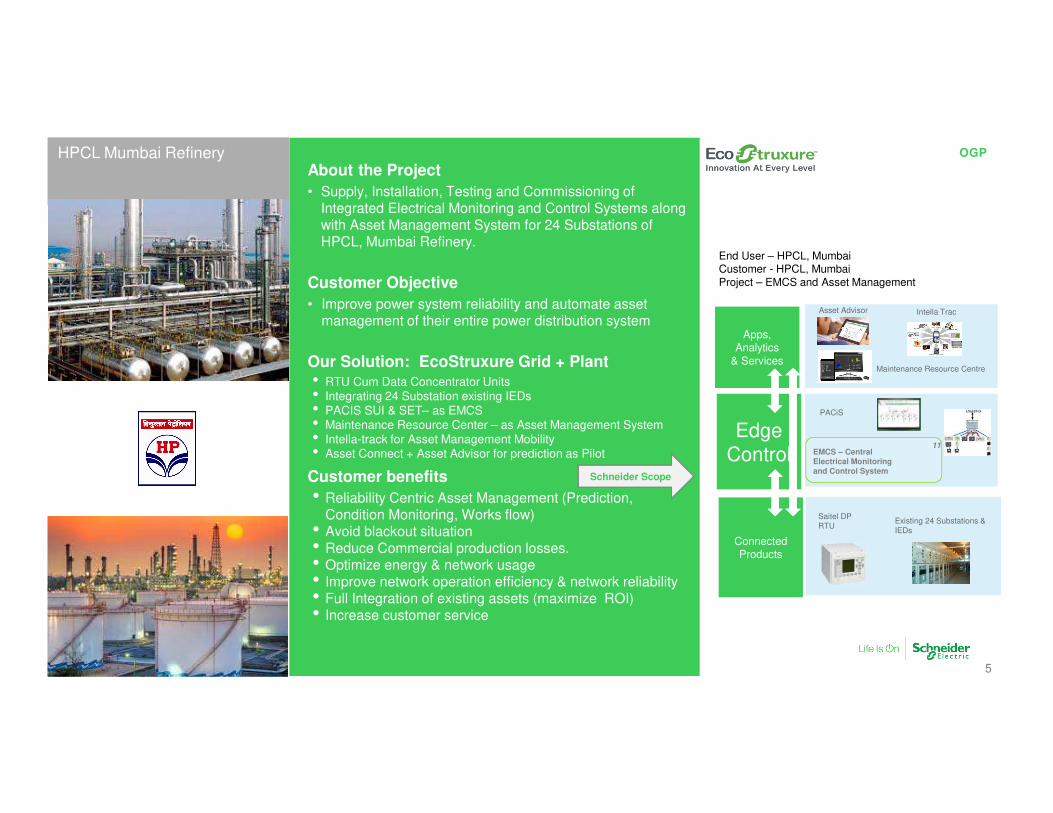
OGPHPCL Mumbai Refinery About the Project
• Supply, Installation, Testing and Commissioning of Integrated Electrical Monitoring and Control Systems along with Asset Management System for 24 Substations of HPCL, Mumbai Refinery.
Customer Objective
• Improve power system reliability and automate asset management of their entire power distribution system
Our Solution: EcoStruxure Grid + Plant • RTU Cum Data Concentrator Units
• Integrating 24 Substation existing IEDs
• PACIS SUI & SET– as EMCS
• Maintenance Resource Center – as Asset Management System
• Intella-track for Asset Management Mobility
• Asset Connect + Asset Advisor for prediction as Pilot
Customer benefits
• Reliability Centric Asset Management (Prediction, Condition Monitoring, Works flow)
• Avoid blackout situation• Reduce Commercial production losses.• Optimize energy & network usage• Improve network operation efficiency & network reliability• Full Integration of existing assets (maximize ROI) • Increase customer service
Schneider Scope
End User – HPCL, MumbaiCustomer - HPCL, Mumbai
Project – EMCS and Asset Management
Apps, Analytics
& Services
Edge
Control
Connected Products
Saitel DP
RTUExisting 24 Substations &
IEDs
EMCS – Central
Electrical Monitoring
and Control System
11
PACiS
Asset Advisor Intella Trac
Maintenance Resource Centre
5
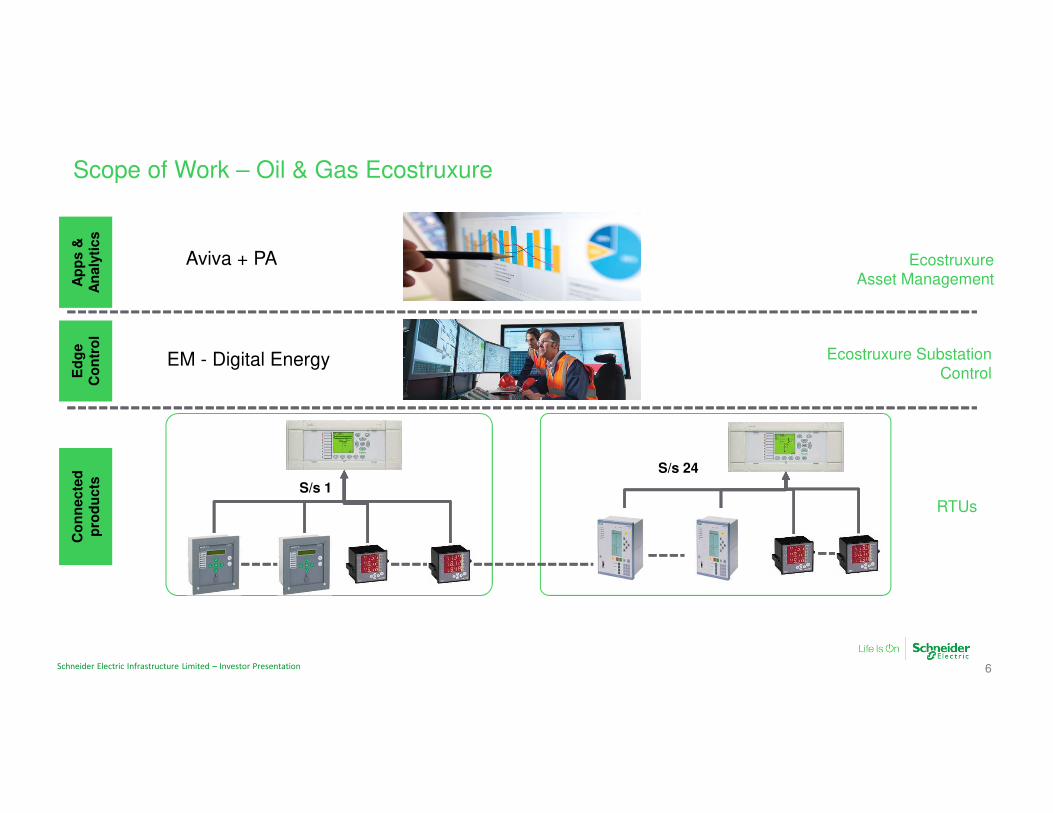
Scope of Work – Oil & Gas Ecostruxure
S/s 1
S/s 24
Co
nn
ec
ted
p
rod
uc
tsE
dg
e
Co
ntr
ol
Ap
ps
&
An
aly
tic
s
Ecostruxure Substation
Control
RTUs
Ecostruxure
Asset Management
Aviva + PA
EM - Digital Energy
Schneider Electric Infrastructure Limited – Investor Presentation 6
Schneider Electric Infrastructure Limited – Investor Presentation
In the past 3 months
We observed a general economic slow down , which has slightly affected our order intake
Services and Energy Automation Orders have confirmed their rebound in Q3 , while MV orders werestill dynamic .
After the flood in Baroda that affected our Q2 Sales level , Q3 Sales level was very high .
We observe an overall tension on our customers cash situation , burdening our own finance costs ,even though we continue collecting more cash than our Sales ; but also delaying our Sales ( projectsfrozen , cancelled , delayed , …)
We have done further progress on our licenses and core component partner programs , with 1 newoffer launched in December (PIX MV license offer ) , 2 licenses cases validated in Q3 and ready forcontract signature (both on FBX RMUs ) , and 2 licensed prototypes validated ( for packagedsubstations PSS ) .
7

Financial Update
Page 8
8Schneider Electric Infrastructure Limited – Investor Presentation
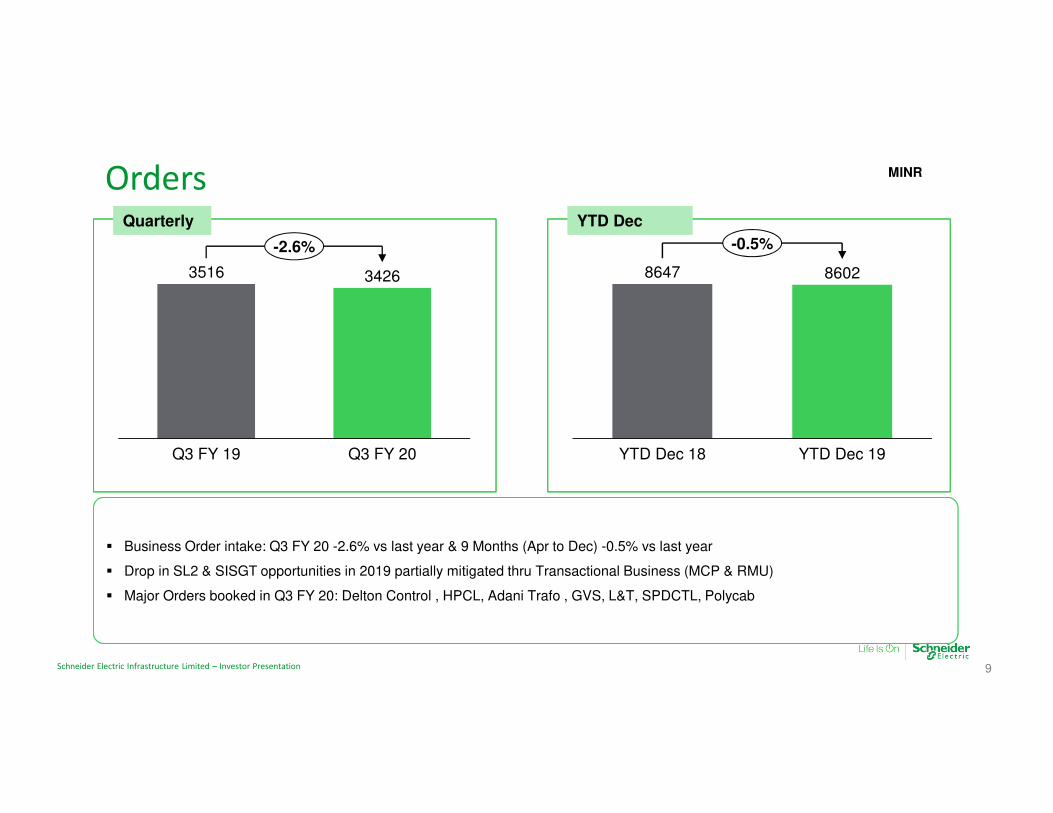
Business Order intake: Q3 FY 20 -2.6% vs last year & 9 Months (Apr to Dec) -0.5% vs last year
Drop in SL2 & SISGT opportunities in 2019 partially mitigated thru Transactional Business (MCP & RMU)
Major Orders booked in Q3 FY 20: Delton Control , HPCL, Adani Trafo , GVS, L&T, SPDCTL, Polycab
9
OrdersQuarterly
MINR
3516 3426
Q3 FY 19 Q3 FY 20
-2.6%
YTD Dec
8647 8602
YTD Dec 18 YTD Dec 19
-0.5%
Schneider Electric Infrastructure Limited – Investor Presentation
10
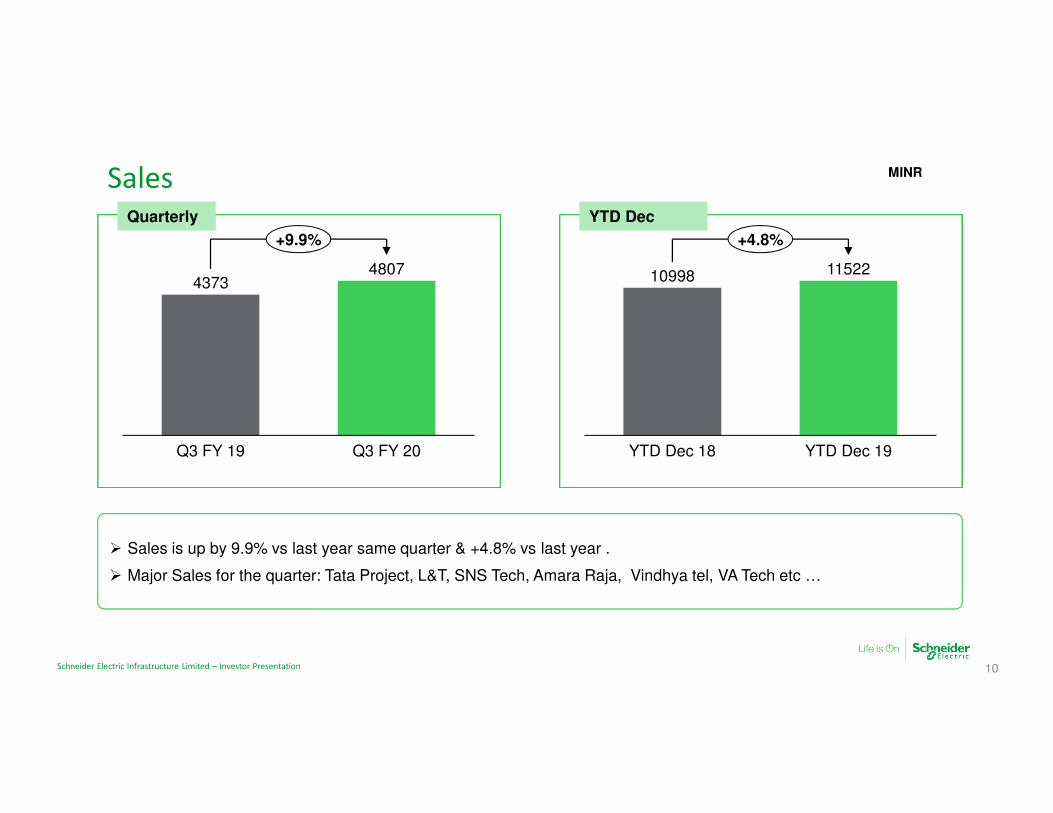
Sales MINR
Sales is up by 9.9% vs last year same quarter & +4.8% vs last year .
Major Sales for the quarter: Tata Project, L&T, SNS Tech, Amara Raja, Vindhya tel, VA Tech etc …
Quarterly
43734807
Q3 FY 19 Q3 FY 20
+9.9%
YTD Dec
10998 11522
YTD Dec 18 YTD Dec 19
+4.8%
Schneider Electric Infrastructure Limited – Investor Presentation
11
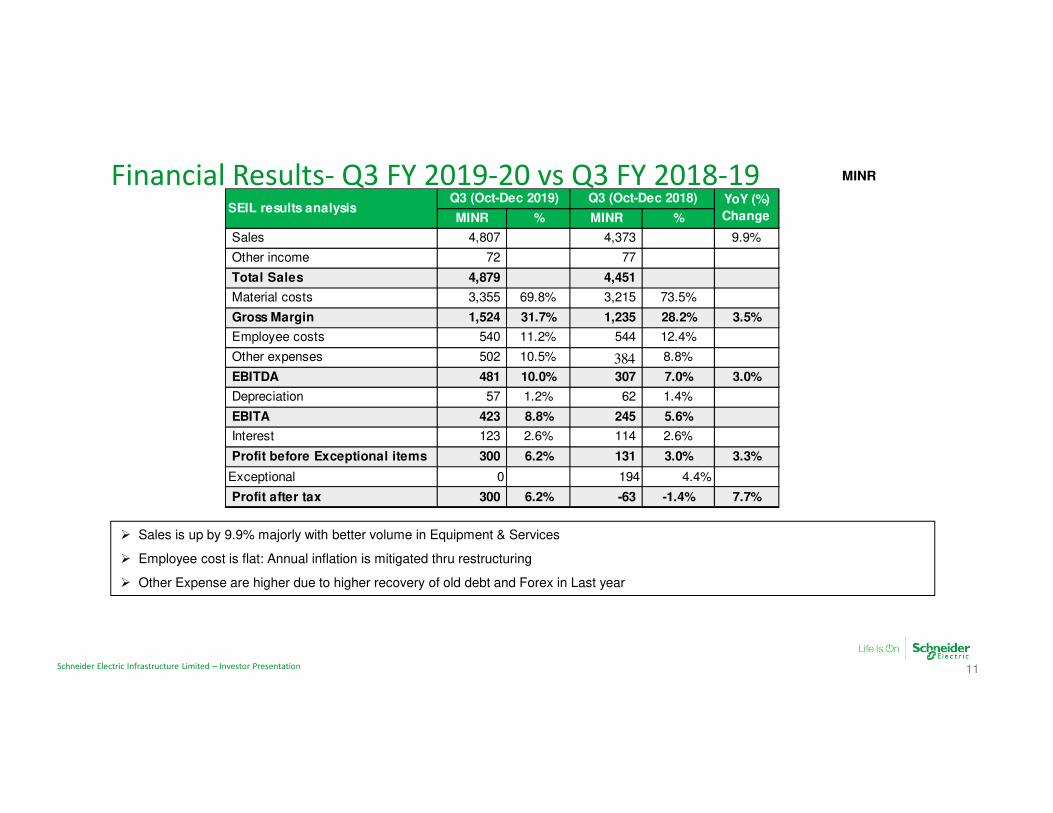
Financial Results- Q3 FY 2019-20 vs Q3 FY 2018-19 MINR
Sales is up by 9.9% majorly with better volume in Equipment & Services
Employee cost is flat: Annual inflation is mitigated thru restructuring
Other Expense are higher due to higher recovery of old debt and Forex in Last year
MINR % MINR %
Sales 4,807 4,373 9.9%
Other income 72 77
Total Sales 4,879 4,451
Material costs 3,355 69.8% 3,215 73.5%
Gross Margin 1,524 31.7% 1,235 28.2% 3.5%
Employee costs 540 11.2% 544 12.4%
Other expenses 502 10.5% 384 8.8%
EBITDA 481 10.0% 307 7.0% 3.0%
Depreciation 57 1.2% 62 1.4%
EBITA 423 8.8% 245 5.6%
Interest 123 2.6% 114 2.6%
Profit before Exceptional items 300 6.2% 131 3.0% 3.3%
Exceptional 0 194 4.4%
Profit after tax 300 6.2% -63 -1.4% 7.7%
SEIL results analysisQ3 (Oct-Dec 2019) Q3 (Oct-Dec 2018) YoY (%)
Change
Schneider Electric Infrastructure Limited – Investor Presentation
12
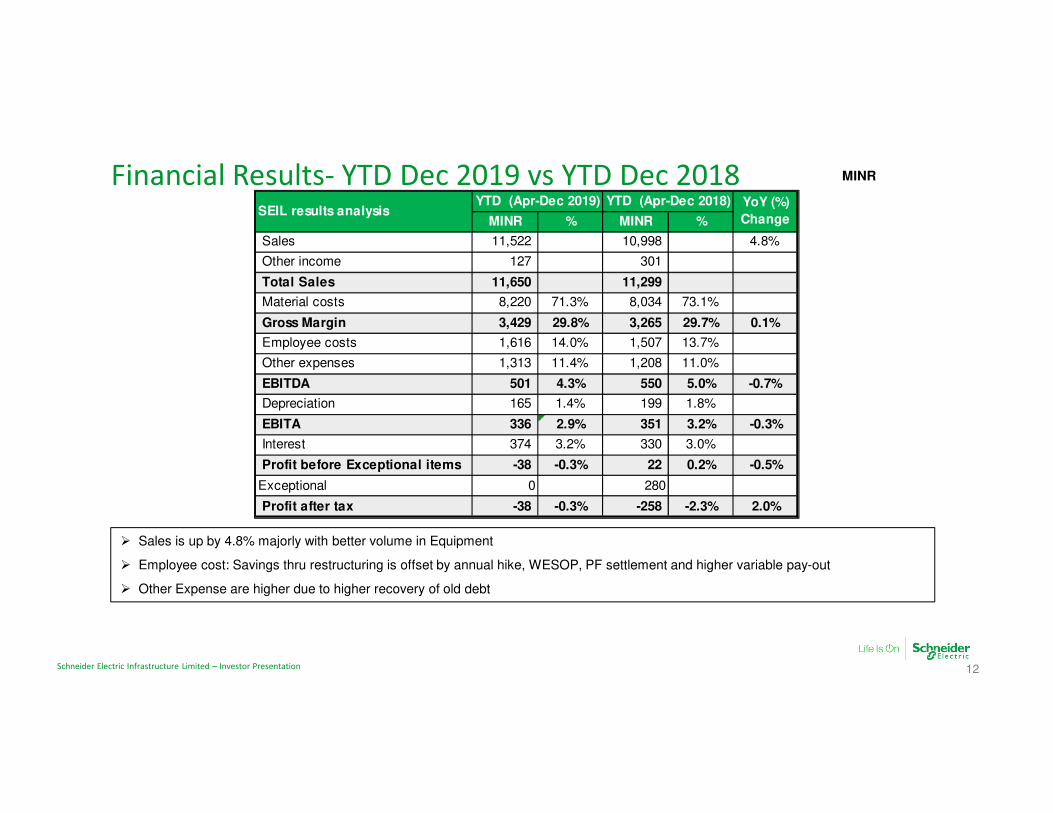
Financial Results- YTD Dec 2019 vs YTD Dec 2018 MINR
Sales is up by 4.8% majorly with better volume in Equipment
Employee cost: Savings thru restructuring is offset by annual hike, WESOP, PF settlement and higher variable pay-out
Other Expense are higher due to higher recovery of old debt
MINR % MINR %
Sales 11,522 10,998 4.8%
Other income 127 301
Total Sales 11,650 11,299
Material costs 8,220 71.3% 8,034 73.1%
Gross Margin 3,429 29.8% 3,265 29.7% 0.1%
Employee costs 1,616 14.0% 1,507 13.7%
Other expenses 1,313 11.4% 1,208 11.0%
EBITDA 501 4.3% 550 5.0% -0.7%
Depreciation 165 1.4% 199 1.8%
EBITA 336 2.9% 351 3.2% -0.3%
Interest 374 3.2% 330 3.0%
Profit before Exceptional items -38 -0.3% 22 0.2% -0.5%
Exceptional 0 280
Profit after tax -38 -0.3% -258 -2.3% 2.0%
SEIL results analysisYTD (Apr-Dec 2019) YTD (Apr-Dec 2018) YoY (%)
Change
Schneider Electric Infrastructure Limited – Investor Presentation

13
Balance Sheet as at Dec 19 Sep 19 FY2019
Equity and liabilities
Shareholders’ fundsShare capital 478 478 478
Reserves and surplus -182 (630) (244) Annual results
296 -152 234
Non-current liabilities
Long-term provisions 270 284 216
Deferred revenue 9 11 28
Long-term borrowings 3,658 1,232 1,160
3,936 1,528 1,404
Current liabilitiesShort-term borrowings 1,241 4,493 3,362
Trade payables 4,851 4,327 4,720
Others 223 214 178
Other current liabilities 727 659 742
Short-term provisions 1,180 1,092 1,169
8,223 10,785 10,171
12,454 12,161 11,809
Assets
Non-current assets
Tangible assets 3,091 3,046 3,031
- Intangible assets 38 41 54
Capital work-in-progress 35 67 57
Deferred tax assets (net) 254 248 223
Other financial assets 98 107 37
Other non-current assets 712 720 686
4,227 4,229 4,087
Current assetsInventories 1,777 2,422 2,421
Trade receivables 5,606 4,328 4,137 Liquidity issues in market- Lower collection & High sales
Cash and Bank Balances 221 174 184
Others 56 129 13
Other current assets 568 878 966 Unbilled Contract Revenue.
8,227 7,932 7,722
12,454 12,161 11,809
Positive Networth with Better
profitability in the quarter
Current assets are higher
than Current Liabilities
Balance Sheet MINR
Schneider Electric Infrastructure Limited – Investor Presentation

Schneider Electric Infrastructure Limited – Investor Presentation 14