scenarios guide
TRANSCRIPT
Developing Scenarios to Assess Ecosystem Service Tradeoffs:Guidance and Case Studies for InVEST Users
Emily McKenzie, Amy Rosenthal, Joey Bernhardt, Evan Girvetz, Kent Kovacs, Nasser Olwero and Jodie Toft
THIS guIde HAS BeeN deVeLOPed THROugH THe NATuRAL CAPITAL PROJeCT, WHICH IS A PARTNeRSHIP AMONg
CreditsPhotosFront cover Women walking along the road that borders Udzungwa Mountains National Park, the largest remnant of the Eastern Arc forest, Tanzania © Edward Parker/WWF/Canon
Page v Mary Ruckelshaus © Annie Marie Musselman
Page 1 Toba Lake, Sumatra, Indonesia © Alain Compost/WWF/Canon
Page 4 Tofino, Vancouver Island, British Columbia, Canada © Jarrett Corke/WWF/Canon
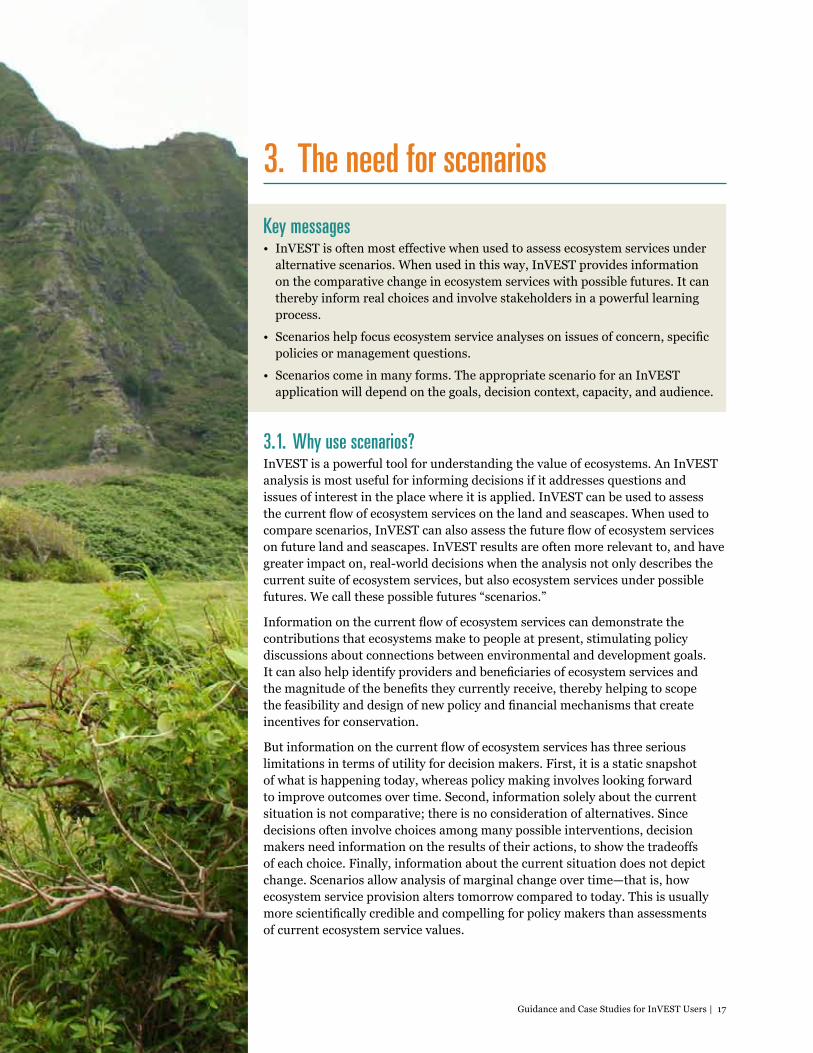
Page 16 Oahu, Hawaii © Shunyu Fan /istock.com
Page 19 A scientist measures the slope of Salmon Beach, Vancouver Island, British Columbia, Canada © Jodie Toft
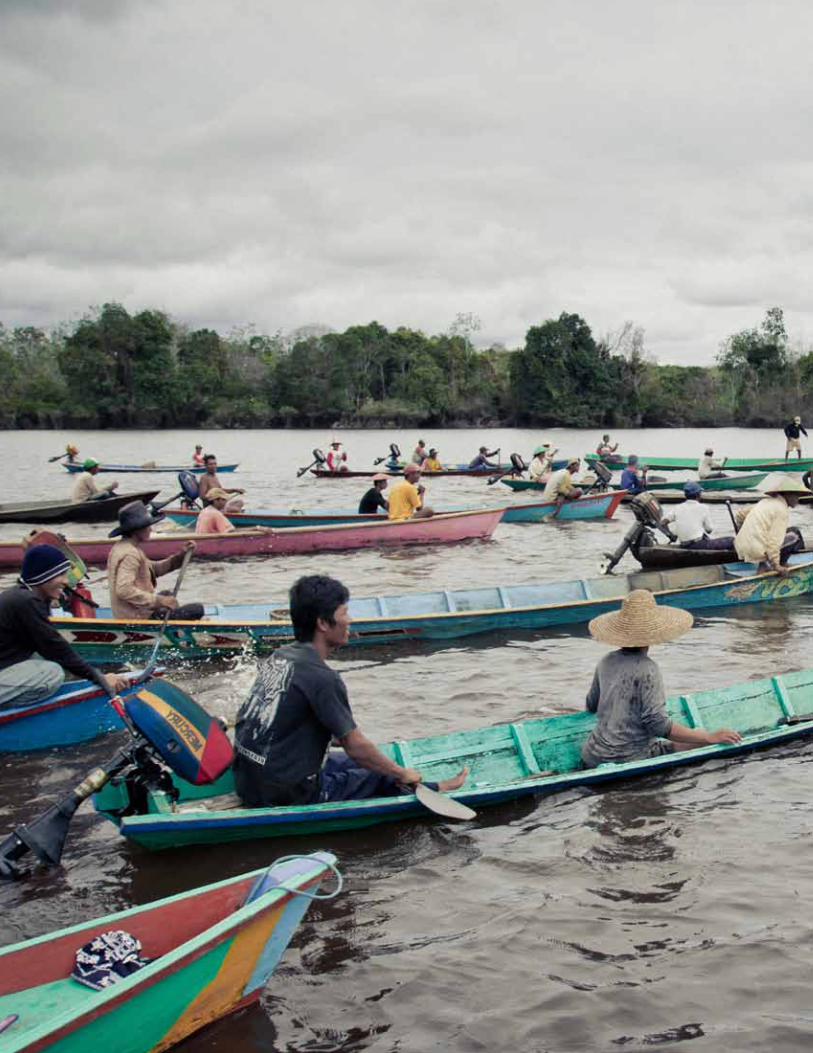
Page 22 Fishermen, Borneo, Indonesia © Jonne Seijdel/WWF-Netherlands
Page 34 Woman fishing, Sumatra, Indonesia © Mark Edwards/WWF-Canon
Page 38 Willamette River tugboat, Portland, Oregon © GarysFRP/istock.com
Page 56 Udzungwa Mountains, Tanzania © WWF-US/Deborah Gainer
Page 60 Mahakam River, Borneo, Indonesia © WWF-Canon/Simon Rawles
Page 62 Rice fields, Sumatra, Indonesia © Mauri Rautkari/WWF/Canon
Page 112 Vancouver Island, B.C., Canada © Gregory Verutes
Page 123 Columbia, © Rocio Ortiz
Back cover Water source in the Eastern Arc Mountains, Tanzania © Taylor Ricketts
© 2012 WWF. All rights reserved by World Wildlife Fund, Inc. 7-12
Published by World Wildlife FundWorld Wildlife Fund1250 24th Street, NWWashington, DC 20037USA
For 50 years, World Wildlife Fund has been protecting the future of nature. The world’s leading conservation organization, WWF works in 100 countries and is supported by 1.2 million members in the United States and close to 5 million globally. WWF’s unique way of working combines global reach with a foundation in science, involves action at every level from local to global, and ensures the delivery of innovative solutions that meet the needs of both people and nature.
The Natural Capital Project is an innovative partnership among World Wildlife Fund, Stanford University, The Nature Conservancy, and University of Minnesota. The Natural Capital Project’s vision is a world in which people and institutions incorporate the values of natural capital into decision making. The Natural Capital Project works to develop practical ecosystem services concepts and tools, apply these tools around the world to demonstrate the impact of ecosystem service approaches in decisions, and engage thought leaders to advance change in policy and practice.
Recommended reference: McKenzie, E., A. Rosenthal et al. 2012. Developing scenarios to assess ecosystem service tradeoffs: Guidance and case studies for InVEST users. World Wildlife Fund, Washington, D.C.
Further materials are available on the scenarios page at naturalcapitalproject.org

Acknowledgments ................................................................................................................. iv
Foreword ...................................................................................................................................v
1. An introduction to this guide .......................................................................................... 11.1. Motivations and objectives ............................................................................................11.2. What is included? .......................................................................................................... 2
2. An introduction to scenarios .......................................................................................... 52.1. What are scenarios? ...................................................................................................... 52.2. Types of scenarios ......................................................................................................... 62.3. What makes an effective scenario? ..............................................................................122.4. Common challenges .....................................................................................................14
3. The need for scenarios .................................................................................................. 173.1. Why use scenarios? ......................................................................................................173.2. Examples of scenarios in action ..................................................................................18
4. Selecting the right scenario approach .......................................................................234.1. What is the goal of applying InVEST? Some examples from the field....................... 234.2. The requirements of scenarios for use in InVEST ..................................................... 274.3. The process: Reasons for engaging stakeholders ....................................................... 304.4. The product: How quantitative should scenarios be? ................................................ 324.5. The number and scale of scenarios............................................................................. 35
5. Developing scenario storylines ...................................................................................395.1. Drivers of change ........................................................................................................ 395.2. Participatory and qualitative approaches ...................................................................405.3. Technical and quantitative approaches .......................................................................415.4. Common methods by scenario type ........................................................................... 445.5. A special note on climate scenarios ............................................................................ 495.6. Finding and accessing data ......................................................................................... 53
6. Creating scenario maps .................................................................................................576.1. Drawing maps ..............................................................................................................576.2. Trend analysis ............................................................................................................. 586.3. Rule-based approaches .............................................................................................. 58
7. Case studies: Using scenarios with InVEST to make better decisions ........................................ 63
7.1. Sumatra, Indonesia ..................................................................................................... 637.2. Hawaii, USA ................................................................................................................ 707.3. Borneo, Indonesia ....................................................................................................... 797.4. Eastern Arc Mountains, Tanzania .............................................................................. 877.5. Oregon, USA ................................................................................................................ 967.6. Vancouver Island, Canada .........................................................................................103
8. Fitting it all together: A simple, combined, iterative approach to scenarios .......................................... 113
Contents

Figures1. Steps when developing scenarios for InVEST .................................................................... 22. Steps for water fund scenarios .......................................................................................... 253. Conceptual model for comparing scenarios using InVEST .............................................. 284. Spatial scenarios in Tanzania ............................................................................................ 295. Scenarios of mining development in Cesar, Colombia ..................................................... 466. Study area in Central Sumatra .......................................................................................... 647. Forests and plantations under the current situation and two scenarios in Sumatra ...... 658. Gains and losses in carbon stocks from 2008 to 2058 in Central Sumatra under two scenarios ..................................................................................................................... 679. Different land uses in Kawailoa, Oahu, Hawaii .................................................................7110. Spatially defined alternative scenarios in Hawaii ..............................................................7311. Ecosystem service tradeoffs under alternative scenarios in Hawaii ................................ 7612. Water yield in 2009 and under business-as-usual and green economy scenarios in Borneo ...........................................................................................................................8313. Interactions among sectors and land-cover change under an optimistic scenario in Tanzania .........................................................................................................................9114. Changes in the spatial distribution of carbon storage under scenarios in Tanzania ....... 9315. Spatial scenarios in Willamette, Oregon ........................................................................... 9716. Scenarios process applied in the Willamette River Basin, Oregon .................................. 9817. Planning Units designated by West Coast Aquatic ..........................................................10518. Three alternative management scenarios for Lemmens Inlet, British Columbia .......... 10619. Output from InVEST Tier O Coastal Vulnerability model ...............................................10720. A sample scenario map developed with the Toquaht First Nation for Toquart Bay ...... 108
Tables1. Categories of scenario types .................................................................................................72. Examples of intervention scenarios .....................................................................................73. Surprises in scenarios .......................................................................................................... 94. The role of scenarios in addressing policy questions with InVEST...................................215. Scenarios for different stages of the policy cycle ...............................................................276. Advantages and disadvantages of participatory approaches to scenarios ........................317. Using objectives to select scenario time frames and spatial scales ...................................37 8. Common drivers of change in scenarios ...........................................................................409. Approaches and experiences with stakeholder engagement in InVEST scenario case studies ........................................................................................................................ 4210. Methods for developing scenario storylines ..................................................................... 4811. Sources of data for scenarios ............................................................................................. 5412. Matrix of probabilities of land-cover transitions .............................................................. 5913. Types and examples of rules for converting land-cover changes ......................................6114. Interpreting comparisons of scenarios in Sumatra .......................................................... 6715. Rules for business-as-usual scenario in Borneo ................................................................8116. Rules for green economy scenario in Borneo ................................................................... 8217. Rules determining the location of agricultural expansion ............................................... 9218. Stakeholder engagement approaches used in Willamette Basin scenarios ..................... 99
Appendices1. Questions to consider when planning to develop scenarios for InVEST ........................ 1142. Further resources and reading ......................................................................................... 1153. References ......................................................................................................................... 116
iv | Developing Scenarios
AcknowledgmentsWe are deeply grateful to those who helped develop this guide. This document draws on the knowledge and experiences of Naikoa Aguilar-Amuchastegui, Katie Arkema, Thomas Barano, Elena Bennett, Joey Bernhardt, Nirmal Bhagabati, Greg Bratman, Neil Burgess, Giorgio Caldarone, Marc Conte, Peter Cutter, Gretchen Daily, Andy Dean, Ka’eo Duarte, Brendan Fisher, Eddie Game, Josh Goldstein, Greg Guannel, Anne Guerry, Neil Hannahs, David Hulse, Choong-Ki Kim, Michael Mascia, John Morrison, Erik Nelson, Nasser Olwero, Maria Jose Pacha, Steve Polasky, Taylor Ricketts, Mary Ruckelshaus, Vanessa Schweizer, Rich Sharp, César Freddy Suarez Pacheco, Agus Salim, Ruth Swetnam, Heather Tallis, Jodie Toft, Anna Van Paddenburg, Gregory Verutes, Simon Willcock, Angela Wilkinson, Spencer Wood, Guy Ziv and Monika Zurek. We would also like to thank Chris Conner for his help in finalizing the guide.
We would also like to thank the following case study authors for sharing their experiences from applications around the world. Their insights form the foundation of this guide.
Sumatra, IndonesiaEmily McKenzie, Amy Rosenthal, Nirmal Bhagabati, Thomas Barano
Hawaii, USAJosh Goldstein, Giorgio Caldarone, Gretchen Daily, Ka’eo Duarte, Neil Hannahs, Emily McKenzie
Borneo, IndonesiaAndy Dean, Thomas Barano, Nirmal Bhagabati, Emily McKenzie, Anna Van Paddenburg, Amy Rosenthal, Agus Salim
Eastern Arc Mountains, TanzaniaBrendan Fisher, Ruth Swetnam, Neil Burgess, Emily McKenzie, Simon Willcock
Oregon, USAEmily McKenzie, David Hulse, Erik Nelson
Vancouver Island, CanadaJoey Bernhardt, Anne Guerry, Emily McKenzie, Jodie Toft, Spencer Wood
Guidance and Case Studies for InVEST Users | v
Ample theory and a growing body of practice tell us that scenarios can be a critically useful part of science-policy processes designed to inform decisions for and about nature and people. Even in their most basic form, scenarios describe what the future could look like and help crystallize the key biophysical or social features or functions people care about most.
A well-executed approach to elicit scenarios helps clearly demarcate the separate roles played by scientists and stakeholders—including government or NGO planners, investors, interested public, etc.—in a decision-making process. The stakeholders articulate their objectives and any ground rules or principles by which alternatives are generated and evaluated. The scientists analyze the alternatives, generating estimated outcomes for ecosystems and the values they hold for people. Clear translation is needed from both sides, so that the visions and values (held by the stakeholders) are appropriately reflected in the assessments (conducted by the scientists) and all understand the implications of results.
The Natural Capital Project aims to integrate ecosystem services approaches into all major resource decisions that affect Earth’s natural resources. Our ultimate objective is to improve the state of biodiversity and human well-being by motivating greater and more cost-effective investments in both. Our experiences working with partners in terrestrial and marine systems around the world have convinced us that the best outcomes for nature and people will come in cases where an active dialogue exists between the stakeholders and the scientists who bring information and rigor to decision-making processes.
In this primer, we take the reader beyond conceptual frameworks and theory about scenarios, and share lessons we have learned in using scenarios as the first step in an ecosystem services approach to informing decisions. We hope that government, NGO, and private sector practitioners and scientists will use the scenario stories and tools to help guide their work together to secure and improve the many benefits nature provides.
Mary RuckelshausManaging Director The Natural Capital Project
Foreword
vi | Developing Scenarios

Guidance and Case Studies for InVEST Users | 1
1.1. Motivations and objectives Scenarios are storylines that describe possible futures. The ecosystem service outcomes of scenarios can be assessed using InVEST (Integrated Valuation of Ecosystem Services and Tradeoffs). InVEST is a software tool for assessing how the location, quantity and value of ecosystem services change under different scenarios. InVEST uses scenarios expressed as maps of land cover or coastal and marine uses.
Many InVEST users have found the tool is most effective when used to assess alternative scenarios. When used in this way, InVEST provides information about the comparative change in ecosystem services with different possible futures. It can thereby inform real choices and involve stakeholders in a powerful learning process. Assessing scenarios with InVEST can help to
• compare the delivery of ecosystem services under plausible alternative futures
• identify the potential ecosystem service tradeoffs of alternative interventions and policies
• evaluate whether policies help secure the provision of ecosystem services if the future changes unexpectedly
• consider new ecosystem service policy ideas
• identify conflicts and develop consensus around a shared vision for the future
• craft and communicate compelling stories
This guide draws on lessons from InVEST users to provide simple guidelines for developing scenarios. In so doing, we aim to
• facilitate the use of scenarios with InVEST
• improve the quality and effectiveness of scenario development and analysis by InVEST users
• establish a common understanding of scenario types, goals, processes and methods among InVEST users
• reduce the time and resources required to develop scenarios for InVEST, particularly for those with limited capacity and data
This guide can help InVEST users select the most appropriate types of scenarios and methods to use, decide how to engage stakeholders, and learn how to make scenario maps. The guidance draws heavily on case experiences where the provision of ecosystem services under alternative scenarios was evaluated using InVEST. We highlight key issues and questions for reflection and provide tools, references and resources for readers who want to learn more.
1. An introduction to this guide
2 | Developing Scenarios
1.2. What is included?After reading this guide, users should feel comfortable creating a plan to develop scenarios for an InVEST application. By delving into the further references and resources, readers can prepare to develop scenarios themselves.
This guide focuses on lessons learned while developing scenarios for InVEST, but much of the content is generally applicable to developing scenarios that are visualized using other spatially explicit ecosystem service assessment tools.
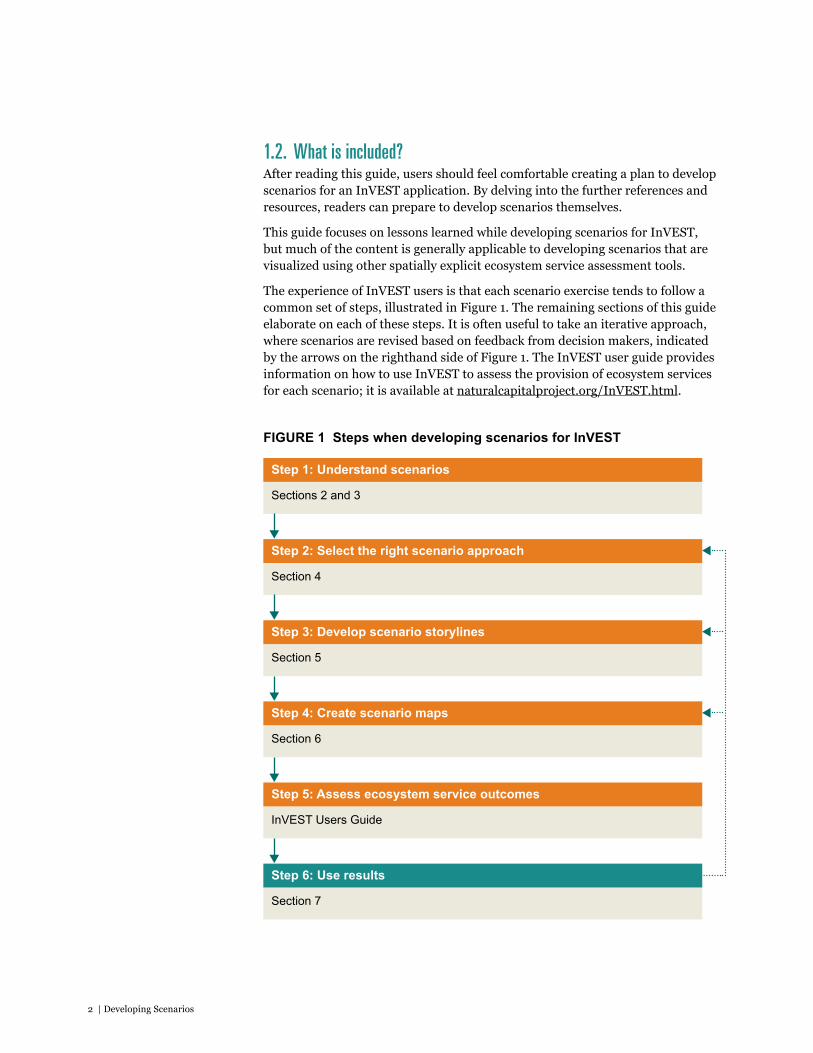
The experience of InVEST users is that each scenario exercise tends to follow a common set of steps, illustrated in Figure 1. The remaining sections of this guide elaborate on each of these steps. It is often useful to take an iterative approach, where scenarios are revised based on feedback from decision makers, indicated by the arrows on the righthand side of Figure 1. The InVEST user guide provides information on how to use InVEST to assess the provision of ecosystem services for each scenario; it is available at naturalcapitalproject.org/InVEST.html.
FIgURE 1 Steps when developing scenarios for InVEST
Step 1: Understand scenarios
Sections 2 and 3
Step 2: Select the right scenario approach
Section 4
Step 3: Develop scenario storylines
Section 5
Step 4: Create scenario maps
Section 6
Step 5: Assess ecosystem service outcomes
InVeST users guide
Step 6: Use results
Section 7
t
tt
t
t
t
t
t

Guidance and Case Studies for InVEST Users | 3
An introduction to InVEST
InVEST (Integrated Valuation of Ecosystem Services and Tradeoffs) is a suite of ecosystem service models, developed by the Natural Capital Project, for mapping the quantity and value of ecosystem services (Tallis et al. 2012). InVEST is designed to help decision makers incorporate ecosystem services into policy and planning contexts at a range of scales, including spatial planning and strategic environmental assessments, in terrestrial, freshwater and marine ecosystems.
In terrestrial and freshwater ecosystems, as of mid-2012, InVEST can be used to model the benefits of carbon storage and sequestration, water yield for hydropower, water purification, erosion control, crop pollination, timber production, and non-timber forest products. In coastal and marine systems, InVEST can be used to model the benefits of food from fisheries, food from aquaculture, coastal vulnerability and protection, renewable energy from waves, aesthetic views and recreation. InVEST also models the risks posed by human activities to marine habitats. New ecosystem service models are added and revised over time.
InVEST models are based on production functions that define how an ecosystem’s structure and function affect the flows and values of ecosystem services. The models account for both supply (e.g., living habitats that buffer storm waves) and demand (e.g., location of people and infrastructure potentially affected by coastal storms) of the services.
InVEST is spatially explicit, with mapped outputs indicating where ecosystem services are provided and how much is available to beneficiaries. It can provide biophysical results (e.g., meters of shoreline retained due to presence of natural habitats) and economic values (e.g., avoided cost of damage to property). A relative index of habitat quality (terrestrial only) is also provided as an indicator of the status of biodiversity, but is not assigned an economic value.
Since data are often scarce, InVEST offers relatively simple models with few input requirements. These models are best suited for identifying patterns in the provision and value of ecosystem services. With calibration, these models can also provide useful estimates of the magnitude and value of services. The Natural Capital Project is developing more complex, data-intensive models for informing policies that require more certainty and specificity in results.
For more on InVEST: naturalcapitalproject.org

4 | Developing Scenarios
Guidance and Case Studies for InVEST Users | 5
Key messages• Scenarios are stories that describe possible futures. They can take many
forms, such as explorations of unexpected events, idealized visions of the future, or alternative interventions such as policies, projects and plans, and predictions.
• We describe four types of scenarios commonly used with InVEST: interventions, explorations, visions and future projections. These types of scenarios can be used separately, in conjunction with one another, or blended together.
• To create effective scenarios, many have found it helpful to consider whether scenarios are relevant, legitimate, plausible, understandable, distinct, credible, comprehensive and surprising, and whether the process for developing the scenarios was participatory and iterative.
• The process of scenario development and analysis can have as much— or more—impact on decision makers as the final results.
2.1. What are scenarios?Scenarios are storylines that describe possible futures. They explore aspects of, and choices about, the future that are uncertain. To tell the story, scenarios can include qualitative descriptions of changes (i.e., a narrative) and quantitative representations (i.e., numbers). For an InVEST analysis, the majority of scenario elements are depicted spatially (i.e., a map of land use and land cover and marine and ocean uses). Scenarios can be developed using participatory methods or by technical experts. Most commonly, scenarios are developed through a combination of both.
A variety of scenario types can provide the inputs for an InVEST analysis, including
• alternative designs for policies, plans, projects or payment schemes
• explorations of possible futures, which depict how events might unfold
• idealized visions of the future reflecting the desires of stakeholders, communities or organizations
• optimized landscapes or seascapes designed to meet particular goals
• projections that describe business as usual, such as predictions based on historical trends1
2. An introduction to scenarios
1 Although scenarios are often defined as different from predictions, we include predictions here. InVEST users often wish to understand the ecosystem service impacts of an expected future, to provide a baseline for comparison.
6 | Developing Scenarios
Our definition of scenarios is purposefully broader than what is usually found in the scenarios literature,2 to embrace all approaches that can be useful for informing decisions with InVEST results. We cover many types of scenarios. In general they all
• describe a possible future
• reflect important and uncertain future developments or choices
• are plausible, internally consistent, and relevant to the questions being addressed
• have a spatially explicit component or can include one
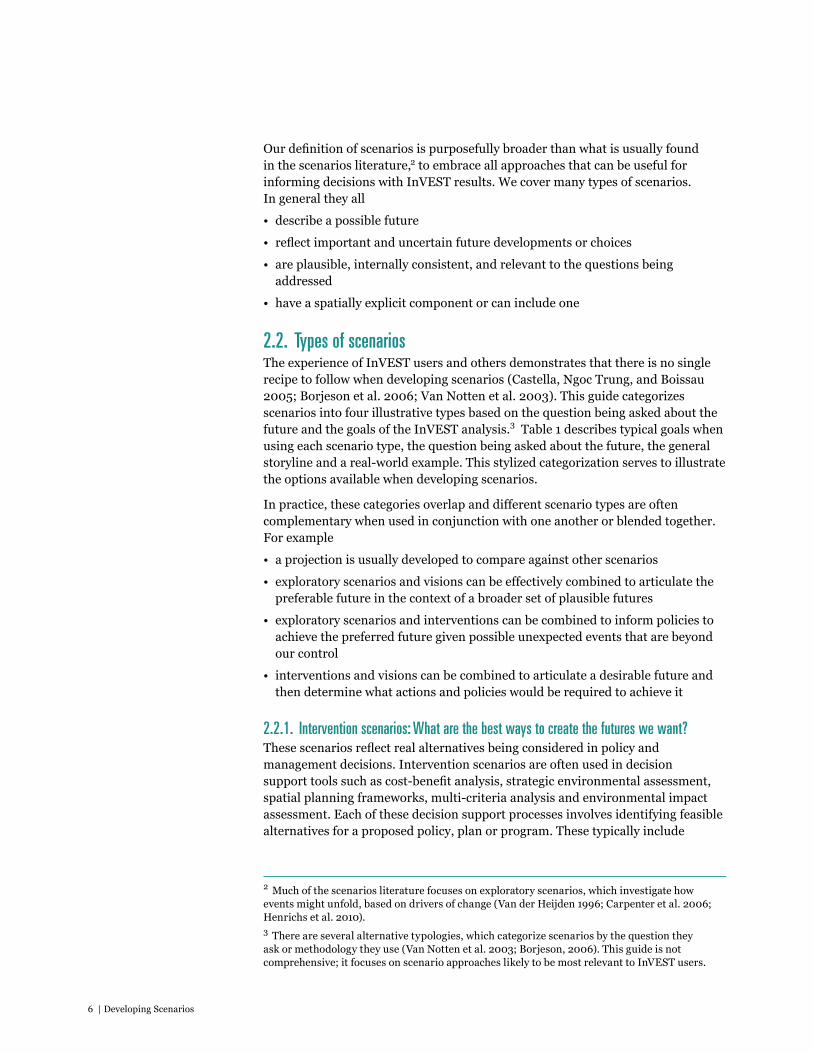
2.2. Types of scenariosThe experience of InVEST users and others demonstrates that there is no single recipe to follow when developing scenarios (Castella, Ngoc Trung, and Boissau 2005; Borjeson et al. 2006; Van Notten et al. 2003). This guide categorizes scenarios into four illustrative types based on the question being asked about the future and the goals of the InVEST analysis.3 Table 1 describes typical goals when using each scenario type, the question being asked about the future, the general storyline and a real-world example. This stylized categorization serves to illustrate the options available when developing scenarios.
In practice, these categories overlap and different scenario types are often complementary when used in conjunction with one another or blended together. For example
• a projection is usually developed to compare against other scenarios
• exploratory scenarios and visions can be effectively combined to articulate the preferable future in the context of a broader set of plausible futures
• exploratory scenarios and interventions can be combined to inform policies to achieve the preferred future given possible unexpected events that are beyond our control
• interventions and visions can be combined to articulate a desirable future and then determine what actions and policies would be required to achieve it
2.2.1. Intervention scenarios: What are the best ways to create the futures we want?These scenarios reflect real alternatives being considered in policy and management decisions. Intervention scenarios are often used in decision support tools such as cost-benefit analysis, strategic environmental assessment, spatial planning frameworks, multi-criteria analysis and environmental impact assessment. Each of these decision support processes involves identifying feasible alternatives for a proposed policy, plan or program. These typically include
2 Much of the scenarios literature focuses on exploratory scenarios, which investigate how events might unfold, based on drivers of change (Van der Heijden 1996; Carpenter et al. 2006; Henrichs et al. 2010).3 There are several alternative typologies, which categorize scenarios by the question they ask or methodology they use (Van Notten et al. 2003; Borjeson, 2006). This guide is not comprehensive; it focuses on scenario approaches likely to be most relevant to InVEST users.
Guidance and Case Studies for InVEST Users | 7
TABlE 1 Categories of scenario types
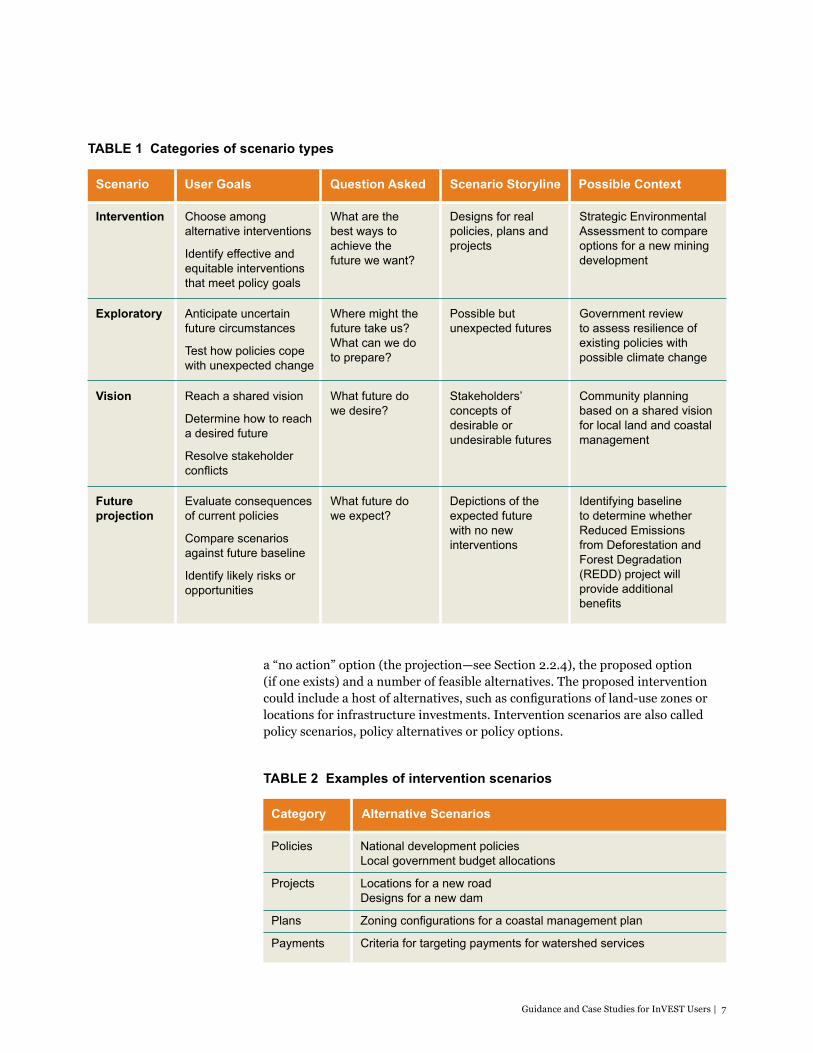
a “no action” option (the projection—see Section 2.2.4), the proposed option (if one exists) and a number of feasible alternatives. The proposed intervention could include a host of alternatives, such as configurations of land-use zones or locations for infrastructure investments. Intervention scenarios are also called policy scenarios, policy alternatives or policy options.
TABlE 2 Examples of intervention scenarios
User goals Question AskedScenario Scenario Storyline
Intervention
Exploratory
Vision
Future projection
Possible Context
Choose among alternative interventions
Identify effective and equitable interventions that meet policy goals
Anticipate uncertain future circumstances
Test how policies cope with unexpected change
Reach a shared vision
determine how to reach a desired future
Resolve stakeholder conflicts
evaluate consequences of current policies
Compare scenarios against future baseline
Identify likely risks or opportunities
What are the best ways to achieve the future we want?
Where might the future take us? What can we do to prepare?
What future do we desire?
What future do we expect?
designs for real policies, plans and projects
Possible but unexpected futures
Stakeholders’ concepts of desirable or undesirable futures
depictions of the expected future with no new interventions
Strategic environmental Assessment to compare options for a new mining development
government review to assess resilience of existing policies with possible climate change
Community planning based on a shared vision for local land and coastal management
Identifying baseline to determine whether Reduced emissions from deforestation and Forest degradation (Redd) project will provide additional benefits
Category
National development policiesLocal government budget allocations
Locations for a new roaddesigns for a new dam
Zoning configurations for a coastal management plan
Criteria for targeting payments for watershed services
Alternative Scenarios
Policies
Projects
Plans
Payments
8 | Developing Scenarios
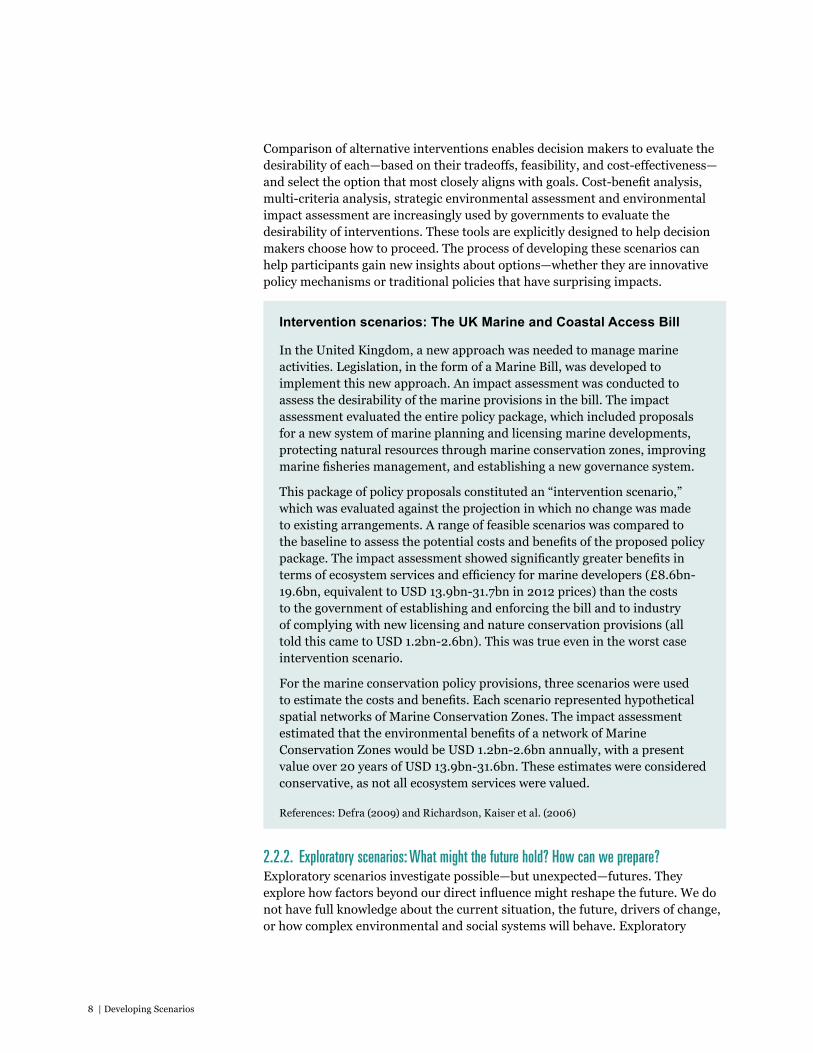
Comparison of alternative interventions enables decision makers to evaluate the desirability of each—based on their tradeoffs, feasibility, and cost-effectiveness—and select the option that most closely aligns with goals. Cost-benefit analysis, multi-criteria analysis, strategic environmental assessment and environmental impact assessment are increasingly used by governments to evaluate the desirability of interventions. These tools are explicitly designed to help decision makers choose how to proceed. The process of developing these scenarios can help participants gain new insights about options—whether they are innovative policy mechanisms or traditional policies that have surprising impacts.
Intervention scenarios: The UK Marine and Coastal Access Bill
In the United Kingdom, a new approach was needed to manage marine activities. Legislation, in the form of a Marine Bill, was developed to implement this new approach. An impact assessment was conducted to assess the desirability of the marine provisions in the bill. The impact assessment evaluated the entire policy package, which included proposals for a new system of marine planning and licensing marine developments, protecting natural resources through marine conservation zones, improving marine fisheries management, and establishing a new governance system.
This package of policy proposals constituted an “intervention scenario,” which was evaluated against the projection in which no change was made to existing arrangements. A range of feasible scenarios was compared to the baseline to assess the potential costs and benefits of the proposed policy package. The impact assessment showed significantly greater benefits in terms of ecosystem services and efficiency for marine developers (£8.6bn-19.6bn, equivalent to USD 13.9bn-31.7bn in 2012 prices) than the costs to the government of establishing and enforcing the bill and to industry of complying with new licensing and nature conservation provisions (all told this came to USD 1.2bn-2.6bn). This was true even in the worst case intervention scenario.
For the marine conservation policy provisions, three scenarios were used to estimate the costs and benefits. Each scenario represented hypothetical spatial networks of Marine Conservation Zones. The impact assessment estimated that the environmental benefits of a network of Marine Conservation Zones would be USD 1.2bn-2.6bn annually, with a present value over 20 years of USD 13.9bn-31.6bn. These estimates were considered conservative, as not all ecosystem services were valued.
References: Defra (2009) and Richardson, Kaiser et al. (2006)
2.2.2. Exploratory scenarios: What might the future hold? How can we prepare?Exploratory scenarios investigate possible—but unexpected—futures. They explore how factors beyond our direct influence might reshape the future. We do not have full knowledge about the current situation, the future, drivers of change, or how complex environmental and social systems will behave. Exploratory
Guidance and Case Studies for InVEST Users | 9
scenarios offer a structured way to investigate these uncertain, unknowable and complex futures. This category most closely relates to what is covered in the scenarios literature (Bohensky, Reyers, and van Jaarsveld 2006; Bennett, Peterson, and Levitt 2005; Alcamo 2008b; Van der Heijden 1996; Carpenter, Bennett, and Peterson 2006; Henrichs et al. 2010). Exploratory scenarios are also called possible futures or “what-if” scenarios.
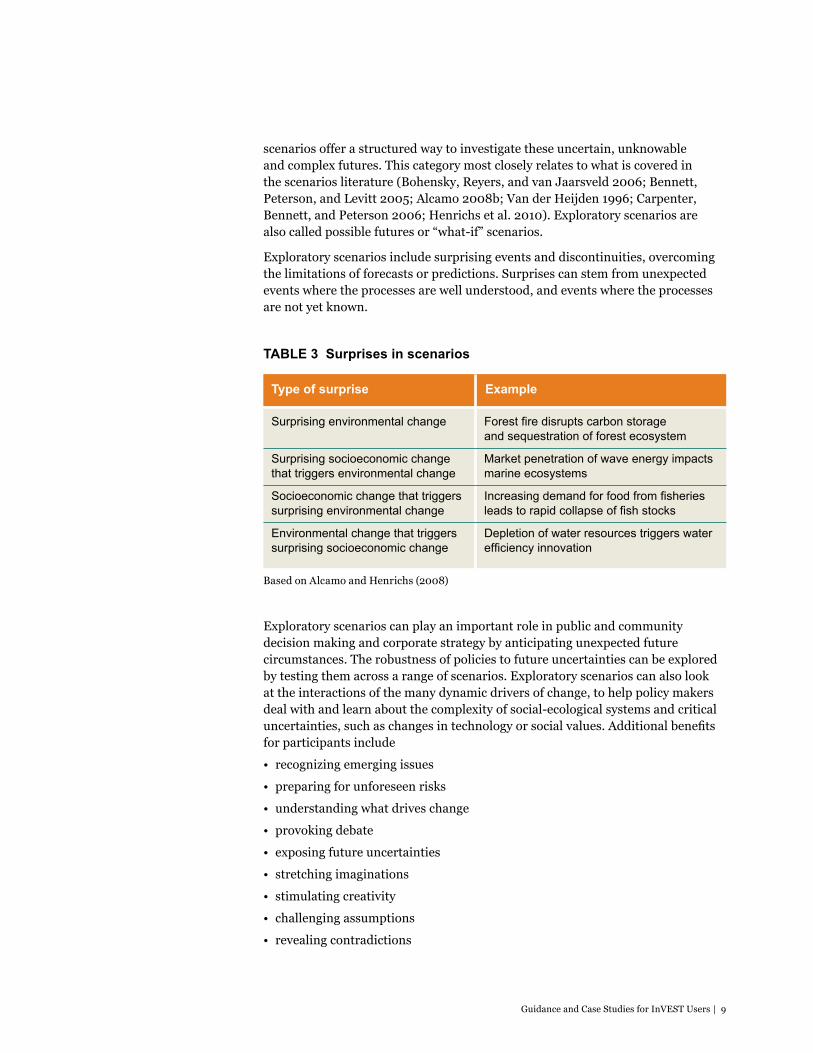
Exploratory scenarios include surprising events and discontinuities, overcoming the limitations of forecasts or predictions. Surprises can stem from unexpected events where the processes are well understood, and events where the processes are not yet known.
TABlE 3 Surprises in scenarios
Type of surprise
Forest fire disrupts carbon storage and sequestration of forest ecosystem
Market penetration of wave energy impacts marine ecosystems
Increasing demand for food from fisheries leads to rapid collapse of fish stocks
depletion of water resources triggers water efficiency innovation
Example
Surprising environmental change
Surprising socioeconomic change that triggers environmental change
Socioeconomic change that triggers surprising environmental change
environmental change that triggers surprising socioeconomic change
Based on Alcamo and Henrichs (2008)
Exploratory scenarios can play an important role in public and community decision making and corporate strategy by anticipating unexpected future circumstances. The robustness of policies to future uncertainties can be explored by testing them across a range of scenarios. Exploratory scenarios can also look at the interactions of the many dynamic drivers of change, to help policy makers deal with and learn about the complexity of social-ecological systems and critical uncertainties, such as changes in technology or social values. Additional benefits for participants include
• recognizing emerging issues
• preparing for unforeseen risks
• understanding what drives change
• provoking debate
• exposing future uncertainties
• stretching imaginations
• stimulating creativity
• challenging assumptions
• revealing contradictions
10 | Developing Scenarios
Exploratory scenarios: In Wisconsin
The Northern Highlands Lake District of Wisconsin is in transition. It was once sparsely settled but is increasingly densely populated. The changes offer benefits to residents but also threaten to degrade the ecosystem services from which they benefit.
Exploratory scenarios were developed to help the community deal with uncertain futures, avoid risks and seize potential opportunities. Using the framework of the Millennium Ecosystem Assessment, three alternative scenarios were developed for the year 2025. These scenarios contained several surprises and portrayed contrasting alternative futures and the impacts on the provision of ecosystem services.
The study team defined the social-ecological system and characterized its history and current condition. They then focused on potential futures of the region’s most important freshwater ecosystem services: water quality and fish populations. This process involved data collection, analysis and synthesis, as well as discussion with experts familiar with northern Wisconsin. Following this process, the team identified two key uncertainties to explore: human migration and ecological vulnerability. These uncertainties were made the focus of a set of scenarios that described the outcomes for freshwater ecosystem services. From these initial scenarios, the team drafted and repeatedly revised a set of scenarios of the future of northern Wisconsin.
Each of the three scenarios explored surprises and their consequences. In the Walleye Commons scenario, fish disease occurs due to environmental change and fish stocking. In the Northwoods.com scenario, there is a rapid political shift driven by development in the river valley. In the Lake Mosaic scenario, social interactions fray due to suburban buildup at the lake shore. The ecosystem service impacts of each scenario helped to identify the risks and opportunities the future might bring.
Reference: Peterson, Beard Jr., et al. (2003)
2.2.3. Visions: What are desirable futures?Vision scenarios describe explicitly desirable or undesirable futures (Berkhout and Hertin 2002; Evans et al. 2006; Raskin et al. 2005). They can represent a perspective on what constitutes the best or worst case. Different scenarios may reflect the goals of each stakeholder or stakeholder group, or reflect a single negotiated compromise that balances everyone’s goals. Visions may be more narrowly defined to achieve a specific target—e.g., an 80 percent reduction in CO2 emissions by 2050.
Visioning is often combined with a back-casting approach, describing an ideal or nightmarish future and working backwards to the present, identifying milestones and actions for reaching or avoiding that future (Van Notten et al. 2003). Visions are also called normative scenarios, because they involve a value judgment about
Guidance and Case Studies for InVEST Users | 11
what is good. Through the process of discussing goals and visions for the future, stakeholders can develop shared perceptions of possible futures, learn about others’ perspectives, create platforms for negotiation and determine actions required (Wollenberg, Edmunds, and Buck 2000b; Wollenberg, Edmunds, and Buck 2000a).
Vision scenarios: In Ukupseni, Panama
Developing future visions usually requires that community members collaborate to share goals and come to a consensus. In Ukupseni in Panama, cultural norms prevented men, women and youth from coming together to share their visions.
The community devised an alternative scenario planning method to facilitate learning among decision makers about community needs and perspectives. Instead of using one workshop for community-wide collaboration and creating one vision through consensus, this study used individual interviews to explore possible futures, and conducted exercises with six community groups to develop visions. They then created a matrix to compare the visions of the different community groups. The study found that women and youth, the most marginalized members, had convergent visions that were very different from the visions of the men, whose perspectives were more often included in decision making in Ukupseni.
Reference: Rawluk and Godber (2011)
2.2.4. Future projections: What future is expected?Projections are typically forecasts of what is likely or expected to happen in the future. Projections depict a situation without the interventions or changes considered in other scenarios. They can be based on historical trends or stakeholder expectations. If a very simple approach is taken, it is possible to establish a baseline that depicts the current situation, under the assumption that there will be no future change. Projections are sometimes referred to as status quo, business as usual, reference, benchmark or non-intervention scenarios.
Projections are necessary for most InVEST applications as they portray a situation without the interventions or changes considered in other scenarios, thereby providing a standard or baseline to compare against. Some InVEST users may choose to assess only the future projection if, for example, they want to evaluate the expected consequences of current policies, and identify likely risks and opportunities. Future projections have proved particularly important (and controversial) in policies for Reducing Emissions from Deforestation and Forest Degradation (REDD—see Scenarios for REDD, p. 52).
12 | Developing Scenarios
Future projections: global land-use change and ecosystem services
As the global human population grows and its consumption patterns change, additional land will be needed for living space and agricultural production. A critical question facing society is how to meet growing demands for living space, food, fuel and fiber, while sustaining ecosystem services and biodiversity. This requires a clear understanding of how ecosystem services and habitat might change over time.
Nelson et al. (2010) developed two versions of business-as-usual scenarios for 2015 that reflect expected changes in urban land and cropland. Expectations for land-use change were based on projections from well-calibrated models. Country-level urbanization projections for 2015 were based on urban population expansion estimates from the United Nations. The study used two different projections of cropland areal change. The first projection of change is generated by extrapolating the rate of country-level change from 1985 to 2000 out to the 2000 to 2015 time period (the country scenario). In the other cropland change scenario (the regional scenario), the authors use the Organisation for Economic Co-operation and Development (OECD) and Food and Agriculture Organization (FAO) Agricultural Outlook trade model to estimate 2015 cropland area targets at the regional level.
The team spatially allocated the expected land-use/land-cover (LULC) change using a cellular process guided by maps that describe how well suited each grid cell is to a particular land use. InVEST was then used to measure the impact of this change on ecosystem services and biodiversity. These projections provide one option for establishing a projection of deforestation to set eligibility and cap requirements in a global REDD-like program instead of relying on historical deforestation rates.
Reference: Nelson et al. (2010)
2.3. What makes an effective scenario?The features that make scenarios effective vary depending on the context. We outline here a set of characteristics that have proved helpful in the experiences of InVEST users (see case studies in Section 7). These attributes are often intimately related, and efforts to enhance one characteristic can adversely affect others (Cash 2000; Clark et al. 2002). Bearing this caveat in mind, when developing scenarios it can be useful to consider the following 10 questions:
Relevant: Do the scenarios align with the problems and questions of interest to stakeholders and decision makers? InVEST is intended for use in making decisions. Scenarios that address salient issues are more likely to have an impact on policies, management choices and investments under consideration (Cash 2000; McNie 2007).
Participatory: Are stakeholders meaningfully involved in the process of developing scenarios and assessing their ecosystem service impacts? The process of scenario development and analysis can have as much—or more—impact on decision makers as the final results. Stakeholder engagement can build understanding,
Guidance and Case Studies for InVEST Users | 13
identify conflicts, help develop consensus, build broad ownership of results, facilitate negotiations, provide a platform for dialogue among differing interests, and ensure results are seen as legitimate (Cash 2000; McNie 2007).
legitimate: Does the scenario development process include diverse stakeholder views and beliefs? If the aim is to build consensus and collaborate around a plan, it can be helpful if scenarios present varied and competing views, to help stakeholders appreciate others’ perspectives and reevaluate their own assumptions and values (Xiang and Clarke 2003).
Plausible: Do the scenarios tell coherent stories that could conceivably happen? Scenarios may contain surprising or unexpected events, but need to be viewed by stakeholders as plausible.
Understandable: Are the scenarios accessible to the target audience? One of the main benefits of scenarios is that they tell compelling stories that can communicate ecosystem service results from InVEST in powerful ways.
Distinct: Are the scenarios sufficiently dissimilar to show contrasting ecosystem service impacts? To show clear tradeoffs, scenarios need to be distinct, particularly in terms of the spatial configurations for marine or land use.
Scientifically credible: Are scenario storylines and maps scientifically robust and credible? In particular, scenarios are strengthened by being internally consistent. This means that different assumptions about drivers and resulting change are not in conflict. Similarly, spatial change in each scenario should be credible, with all resulting land-cover change summing to no more and no less than 100 percent of the landscape area.
Comprehensive: Do the scenarios consider all relevant drivers? Exogenous global drivers—such as demographic transformation, climate change, and economic growth—are beyond the control of decision makers, but are increasingly having impacts at regional and local scales. Consideration of these driving forces helps reflect the uncontrollable, unpredictable and complex context in which decision making occurs (Biggs et al. 2007; Carpenter 2009). It may also help to consider endogenous drivers that are within the decision makers’ control. Hybrid approaches to scenarios that combine these considerations often work best.
Iterative: Are the scenarios refined and revised on the basis of stakeholder input and emerging trends? The scenario set can be expanded or contracted, and the scenarios themselves updated over time. An iterative scenario development process can improve the quality of the final scenarios, as well as cultivate understanding, trust and more detailed discussions between decision makers and the InVEST modeling team. This can be useful as stakeholders learn more about the scenarios, and as knowledge, trends and issues emerge. The process of developing the scenarios can help determine which outcomes need to be quantified, and which models or visualization methods are most appropriate.
Surprising: Do the scenarios challenge assumptions and broaden perspectives about unexpected developments? Scenarios can provoke creative thinking, challenge current views about the future, inform people about the implications of uncertainty, and uncover the equity impacts of alternative futures—i.e., how different regions or communities may benefit from or be harmed by different futures.
14 | Developing Scenarios
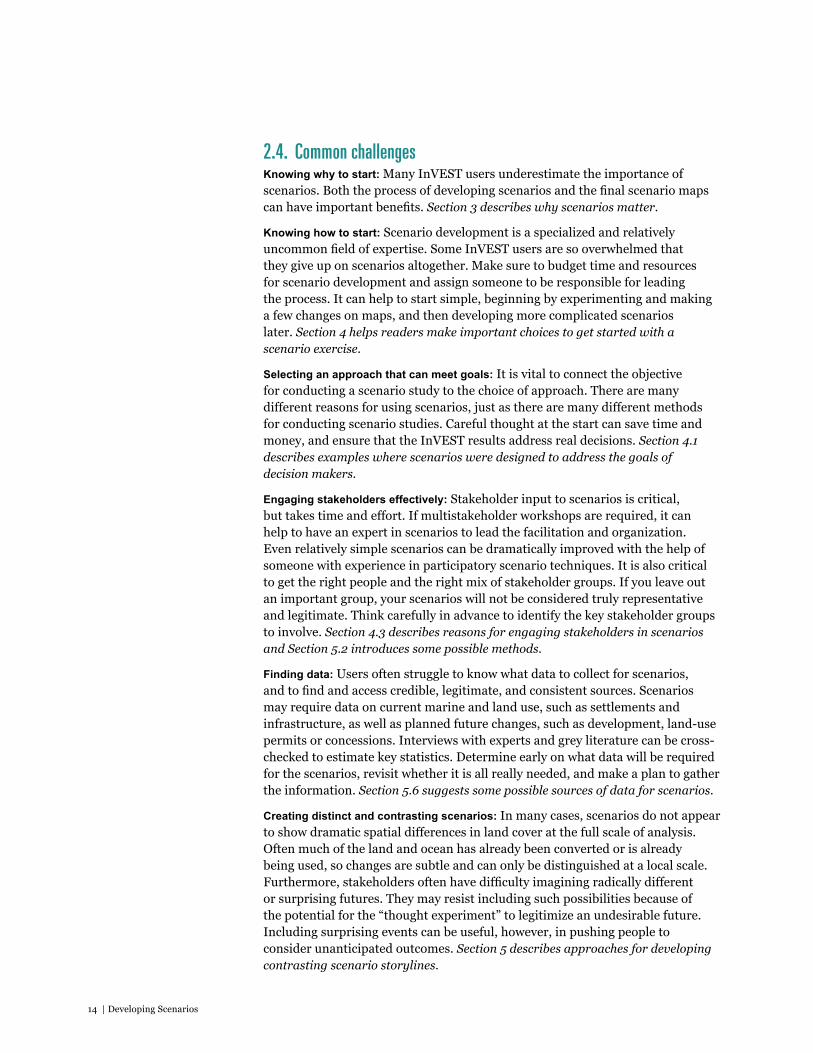
2.4. Common challenges Knowing why to start: Many InVEST users underestimate the importance of scenarios. Both the process of developing scenarios and the final scenario maps can have important benefits. Section 3 describes why scenarios matter.
Knowing how to start: Scenario development is a specialized and relatively uncommon field of expertise. Some InVEST users are so overwhelmed that they give up on scenarios altogether. Make sure to budget time and resources for scenario development and assign someone to be responsible for leading the process. It can help to start simple, beginning by experimenting and making a few changes on maps, and then developing more complicated scenarios later. Section 4 helps readers make important choices to get started with a scenario exercise.
Selecting an approach that can meet goals: It is vital to connect the objective for conducting a scenario study to the choice of approach. There are many different reasons for using scenarios, just as there are many different methods for conducting scenario studies. Careful thought at the start can save time and money, and ensure that the InVEST results address real decisions. Section 4.1 describes examples where scenarios were designed to address the goals of decision makers.
Engaging stakeholders effectively: Stakeholder input to scenarios is critical, but takes time and effort. If multistakeholder workshops are required, it can help to have an expert in scenarios to lead the facilitation and organization. Even relatively simple scenarios can be dramatically improved with the help of someone with experience in participatory scenario techniques. It is also critical to get the right people and the right mix of stakeholder groups. If you leave out an important group, your scenarios will not be considered truly representative and legitimate. Think carefully in advance to identify the key stakeholder groups to involve. Section 4.3 describes reasons for engaging stakeholders in scenarios and Section 5.2 introduces some possible methods.
Finding data: Users often struggle to know what data to collect for scenarios, and to find and access credible, legitimate, and consistent sources. Scenarios may require data on current marine and land use, such as settlements and infrastructure, as well as planned future changes, such as development, land-use permits or concessions. Interviews with experts and grey literature can be cross-checked to estimate key statistics. Determine early on what data will be required for the scenarios, revisit whether it is all really needed, and make a plan to gather the information. Section 5.6 suggests some possible sources of data for scenarios.
Creating distinct and contrasting scenarios: In many cases, scenarios do not appear to show dramatic spatial differences in land cover at the full scale of analysis. Often much of the land and ocean has already been converted or is already being used, so changes are subtle and can only be distinguished at a local scale. Furthermore, stakeholders often have difficulty imagining radically different or surprising futures. They may resist including such possibilities because of the potential for the “thought experiment” to legitimize an undesirable future. Including surprising events can be useful, however, in pushing people to consider unanticipated outcomes. Section 5 describes approaches for developing contrasting scenario storylines.
Guidance and Case Studies for InVEST Users | 15
Combining automated scenario tools with InVEST: Many technical scenario approaches work best with only a few land-cover datasets. In contrast, InVEST works best with a rich set of land-cover categories in order to create detailed information on ecosystem service provision. This means that, when using quantitative scenario tools, changes within one particular sector—which might change land cover or land use from one type of agriculture to another, for example—may not be reflected in the scenarios. One way to address this challenge is to combine automated scenario generation tools with spatial plan data and rule-based approaches that can include a larger set of land-cover classes. Section 5.3 introduces some technical approaches for developing scenarios and Section 6.3 describes rule-based methods for making scenario maps that can be used with InVEST.
Settling with compromise: Scenario development is as much art as science. There are many options available and—as demonstrated in the case studies here—each has strengths and drawbacks. More complex scenarios are hard to develop, take time and resources, and may be difficult for stakeholders to understand or agree upon. Developing simpler scenarios reduces these challenges, but the scenarios may be deemed insufficiently nuanced to reflect the complex world we live in and futures we face. It helps to accept that there are no perfect scenarios; they will always be a compromise. The most important consideration is developing scenarios that fit the context and will yield information that advances decision making. Section 7 provides case studies where scenarios were developed and ecosystem services assessed with InVEST to address real challenges.
16 | Developing Scenarios
Guidance and Case Studies for InVEST Users | 17
Key messages• InVEST is often most effective when used to assess ecosystem services under
alternative scenarios. When used in this way, InVEST provides information on the comparative change in ecosystem services with possible futures. It can thereby inform real choices and involve stakeholders in a powerful learning process.
• Scenarios help focus ecosystem service analyses on issues of concern, specific policies or management questions.
• Scenarios come in many forms. The appropriate scenario for an InVEST application will depend on the goals, decision context, capacity, and audience.
3.1. Why use scenarios?InVEST is a powerful tool for understanding the value of ecosystems. An InVEST analysis is most useful for informing decisions if it addresses questions and issues of interest in the place where it is applied. InVEST can be used to assess the current flow of ecosystem services on the land and seascapes. When used to compare scenarios, InVEST can also assess the future flow of ecosystem services on future land and seascapes. InVEST results are often more relevant to, and have greater impact on, real-world decisions when the analysis not only describes the current suite of ecosystem services, but also ecosystem services under possible futures. We call these possible futures “scenarios.”
Information on the current flow of ecosystem services can demonstrate the contributions that ecosystems make to people at present, stimulating policy discussions about connections between environmental and development goals. It can also help identify providers and beneficiaries of ecosystem services and the magnitude of the benefits they currently receive, thereby helping to scope the feasibility and design of new policy and financial mechanisms that create incentives for conservation.
But information on the current flow of ecosystem services has three serious limitations in terms of utility for decision makers. First, it is a static snapshot of what is happening today, whereas policy making involves looking forward to improve outcomes over time. Second, information solely about the current situation is not comparative; there is no consideration of alternatives. Since decisions often involve choices among many possible interventions, decision makers need information on the results of their actions, to show the tradeoffs of each choice. Finally, information about the current situation does not depict change. Scenarios allow analysis of marginal change over time—that is, how ecosystem service provision alters tomorrow compared to today. This is usually more scientifically credible and compelling for policy makers than assessments of current ecosystem service values.
3. The need for scenarios

18 | Developing Scenarios
InVEST users have found that scenarios can help address these issues and ensure that InVEST is used to tell compelling stories. By framing InVEST to show the ecosystem service impacts of possible futures, scenarios can engage people’s imaginations and encourage more informed decision making.
Additionally, when scenarios are developed with meaningful participation by stakeholders, the process of creating scenarios may itself foster learning (Wollenberg, Edmunds, and Buck 2000b; Van der Kerkhof and Wieczorek 2005). Participatory development of scenarios can bring new insights, expose surprising findings, and lead to consensus or new options being considered. Participation in scenario development can also foster ownership of InVEST results, bring in valuable local expertise, and ensure that the assessment is relevant to decision makers (Section 4.3 describes in more detail the benefits of engaging stakeholders in scenarios).
In summary, both the product of the final scenarios and the process of developing the future storylines and maps can add value to an InVEST analysis.
3.2. Examples of scenarios in actionScenarios often ensure that ecosystem service maps and valuation results help answer a specific policy or management question. Here we provide some examples of real cases where InVEST has been applied, describing the goal for the analysis and how scenarios shaped the results for real-world relevance. More detail on these case studies is provided in Section 7.
Central Sumatra, Indonesia: Provincial and district governments sought to establish ecosystem-based land-use planning to protect the natural capital that supports human well-being. They asked: Is sustainable land-use planning worthwhile? How can sustainable spatial planning be implemented and financed?
InVEST was used to map and quantify the provision of ecosystem services in the current landscape and in two alternative scenarios—one that represented the existing government spatial plans (i.e., business as usual), and another that represented an ecosystem-based spatial plan (i.e., sustainable land-use). Comparing the results helped demonstrate the ecosystem service and biodiversity tradeoffs between the two scenarios (Bhagabati et al. 2012). The use of mapped scenarios also facilitated spatial targeting of ecosystem service policy mechanisms, such as forest carbon projects, by highlighting areas where substantial gains in ecosystem services could be achieved under the sustainable land-use scenario relative to the business-as-usual scenario, avoiding unacceptable tradeoffs. An assessment was also undertaken to identify opportunity costs relative to ecosystem service benefits.
North Shore of Oahu, Hawaii, USA: Hawaii’s largest private landowner, Kamehameha Schools, designed a land-use plan for its region’s agricultural lands in partnership with local communities. They sought to achieve a desired balance of environmental, economic, cultural, educational, and community values, and contribute to statewide policy initiatives. They asked: What are the values that could be achieved through alternative land-use plans?

Guidance and Case Studies for InVEST Users | 19

20 | Developing Scenarios
Kamehameha Schools faced a critical management decision: whether or not to allocate funds to improve the region’s aging irrigation system to sustain and enhance agricultural production. They used InVEST to assess ecosystem service impacts of seven scenarios that represented plausible future land-use options on agricultural lands, such as biofuel crops or agroforestry (Goldstein et al. 2012). The scenarios enabled them to assess the best use of the largely abandoned agricultural lands to meet the needs of the local community and those of the broader public, while also generating positive financial return for Kamehameha Schools. An examination of the tradeoffs among the scenario alternatives helped them prioritize a land-use plan involving diversified agriculture and forestry.
West Coast Vancouver Island, Canada: The West Coast Aquatic Management Board (WCA) was tasked with creating an integrated marine spatial plan for a region on the west coast of Vancouver Island, British Columbia. Their challenge was to balance the interests and activities of multiple stakeholders, including First Nations and industries such as commercial fishing, shipping and forestry. They asked: Which regions are suitable for different activities? How would alternative spatial plans affect a range of ecosystem services? What marine use conflicts are likely to arise from alternative spatial plans? How could they be avoided or minimized?
WCA used InVEST to understand the ecosystem service tradeoffs of different scenarios of marine use and thereby identify where different uses should occur, articulate connections between human activities that are often considered in isolation, and align diverse stakeholders around common goals. By using InVEST models, WCA marine planners were able to bring science to help resolve conflicts among different interests and make implicit decisions explicit. Ecosystem service modeling results have informed early iterations of the marine spatial plan and will contribute to the creation of the final plan in 2012 (Guerry et al. 2012).
Eastern Arc Mountains, Tanzania: A major research project called “Valuing the Arc” set out to develop new insights into the contribution ecosystem services make to the well-being of poor, rural communities in the region. They asked: What are the values of ecosystem services? How might those values change in the future? Where are projects for forest carbon and payments for watershed services feasible?
Scenarios were developed to contrast how different policy trajectories could impact the quantity, value and location of ecosystem services in Tanzania over 15 years. The study team built scenarios that were grounded in policy and practical realities and seemed plausible to Tanzanian stakeholders. The scenarios represented business as usual (kama kawaida in Swahili) and an optimistic future where progress is made toward sustainable development goals (matazamio). Scenarios created a framework for exploring how drivers such as policy shifts, climate change and population growth might change in the future. Researchers broke new ground by developing a process to move from narrative scenario storylines to quantitative, spatially explicit scenario maps, with stakeholder participation at every step. The carbon sequestration maps in the Kama Kawaida scenario provided a useful baseline against which to assess the additional carbon sequestered by REDD and voluntary carbon projects.

Guidance and Case Studies for InVEST Users | 21
National and local governments are creating an integrated spatial plan with stakeholder input
A local water authority is deciding how to reduce water treatment costs in a river basin
A wood products company wants to identify complementary sources of revenue, beyond timber extraction
A regional energy authority is deciding where to site wind and wave energy facilities offshore
A multilateral development bank is deciding whether to fund a major road development
A local community is concerned about upstream deforestation that is affecting their water supply
An environmental authority must decide which mining projects to grant permits to, and how to mitigate unavoidable impacts
A planning authority needs to make a marine spatial plan that will effectively sustain habitats and ecosystem services while allowing multiple human activities and generating revenue
A water utility and a beverage company want to ensure that the payments they provide to upstream land managers to ensure a clean, regular supply of water are cost-effective
An NgO wants to convey to a regional government the dangers of not implementing and upholding laws that protect forests
Learn about the ecosystem service impacts of alternative spatial plans that reflect the preferences of stakeholders in order to create an integrated spatial plan that balances the goals of multiple groups
evaluate how alternative land management options can purify water and retain sediment, reducing water treatment costs downstream
Assess the impacts of alternative plantation management plans on potential revenues from carbon storage and sequestration, non-timber forest products and tourism
Assess the net present value of returns and the tradeoffs with ecosystem services of alternative locations that could feasibly host energy facilities
Assess the impacts of land-cover changes likely to result from alternative designs for the new road on ecosystem services that are important to poor communities
Assess the ecosystem service impacts of alternative levels of deforestation to communicate concerns to upstream land managers
Assess the biodiversity and ecosystem service impacts of alternative levels of mining development in proposed project areas and identify areas for conservation that would return the same benefits to the same people affected by mining
Assess the impacts on marine habitats and ecosystem services of alternative levels of desired development—such as offshore oil and gas, fisheries and aquaculture—in alternative locations
Assess the impacts on hydrological services of alternative criteria for targeting payments to scope the feasibility and design of a payments for watershed services scheme
Assess the impacts on ecosystem services of business as usual deforestation and illegal practices compared to implementation and enforcement of laws protecting forests
TABlE 4 The role of scenarios in addressing policy questions with InVEST
Evaluating scenarios with InVEST allows users toExample
Beyond the contexts illustrated in these four cases, scenarios can help InVEST users to address a variety of decisions. Some examples are given in Table 4 (scenarios are highlighted in italics).
22 | Developing Scenarios
Guidance and Case Studies for InVEST Users | 23
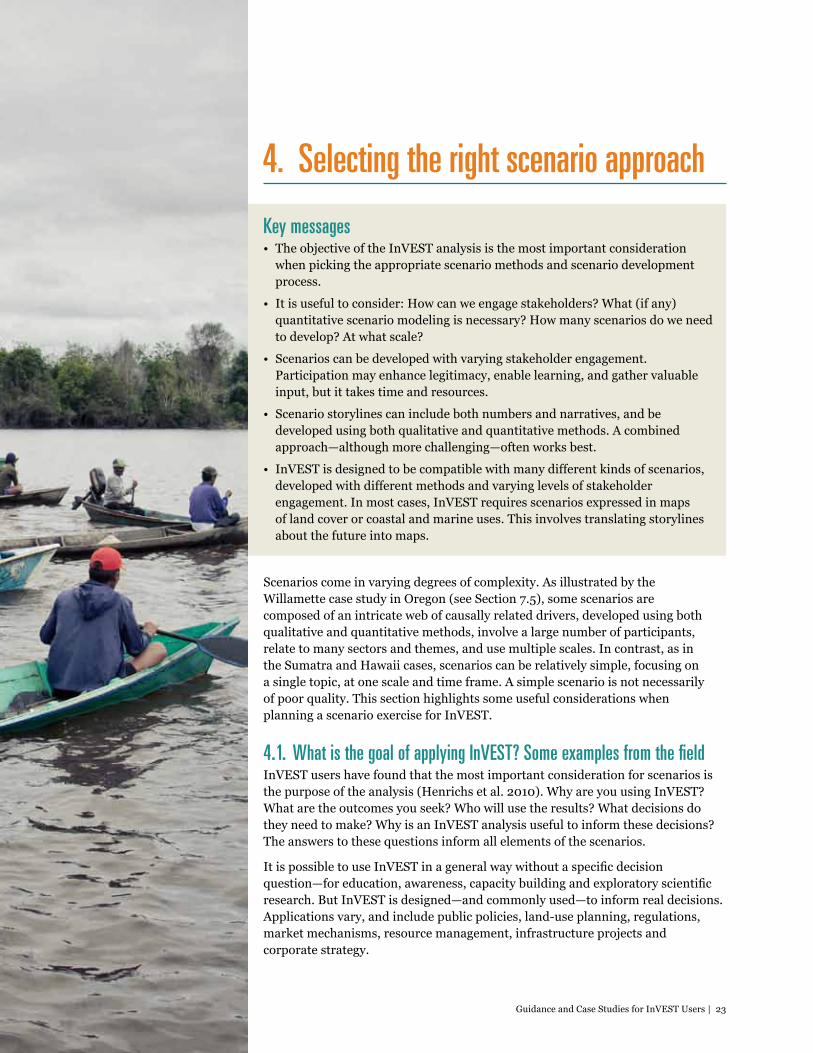
Key messages• The objective of the InVEST analysis is the most important consideration
when picking the appropriate scenario methods and scenario development process.
• It is useful to consider: How can we engage stakeholders? What (if any) quantitative scenario modeling is necessary? How many scenarios do we need to develop? At what scale?
• Scenarios can be developed with varying stakeholder engagement. Participation may enhance legitimacy, enable learning, and gather valuable input, but it takes time and resources.
• Scenario storylines can include both numbers and narratives, and be developed using both qualitative and quantitative methods. A combined approach—although more challenging—often works best.
• InVEST is designed to be compatible with many different kinds of scenarios, developed with different methods and varying levels of stakeholder engagement. In most cases, InVEST requires scenarios expressed in maps of land cover or coastal and marine uses. This involves translating storylines about the future into maps.
Scenarios come in varying degrees of complexity. As illustrated by the Willamette case study in Oregon (see Section 7.5), some scenarios are composed of an intricate web of causally related drivers, developed using both qualitative and quantitative methods, involve a large number of participants, relate to many sectors and themes, and use multiple scales. In contrast, as in the Sumatra and Hawaii cases, scenarios can be relatively simple, focusing on a single topic, at one scale and time frame. A simple scenario is not necessarily of poor quality. This section highlights some useful considerations when planning a scenario exercise for InVEST.
4.1. What is the goal of applying InVEST? Some examples from the fieldInVEST users have found that the most important consideration for scenarios is the purpose of the analysis (Henrichs et al. 2010). Why are you using InVEST? What are the outcomes you seek? Who will use the results? What decisions do they need to make? Why is an InVEST analysis useful to inform these decisions? The answers to these questions inform all elements of the scenarios.
It is possible to use InVEST in a general way without a specific decision question—for education, awareness, capacity building and exploratory scientific research. But InVEST is designed—and commonly used—to inform real decisions. Applications vary, and include public policies, land-use planning, regulations, market mechanisms, resource management, infrastructure projects and corporate strategy.
4. Selecting the right scenario approach
24 | Developing Scenarios
When developing scenarios to compare using InVEST, users often have one or several of the following goals:
• identify effective and equitable interventions that meet policy goals
• anticipate and explore uncertain future circumstances
• test how policies cope with unexpected change
• reach a shared vision and determine how to reach that desired future
• resolve stakeholder conflicts
• identify likely risks or opportunities of current policies
Here we give three examples where scenarios have been developed by InVEST users to address the goals and choices facing decision makers.
Example 1. A permitting guidance regulation is being developed for a mining policy in Colombia. The policy aims to maximize the economic and social benefits of mining operations, while avoiding, minimizing, and offsetting environmental impacts. Policy makers need to know the expected impacts of alternative options on ecosystem services and possible areas for equitable mitigation actions.
Three scenarios were developed for InVEST to inform these policy objectives. Each scenario reflected changes to land-use and management that would occur with different levels and locations of mining activity: (1) existing permitted mining concessions, (2) existing and proposed permits, and (3) all delineated mining concessions. InVEST was used to assess the provision of two ecosystem services—sediment retention and nutrient regulation—for each scenario. The results were compared to the current landscape, to show how the ecosystem service supply and affected populations are expected to change under each scenario.
These scenarios gave policy makers two important pieces of information: (1) how increasing the number of mining permits (to include proposed mines or all possible locations) would affect ecosystem services, and (2) the location of potential sites for mitigating the unavoidable adverse impacts from mining— that is, areas where conservation and restoration would supply the same amount of each ecosystem service to the same settlement.
Example 2. In the East Cauca Valley of Colombia, sugarcane producers and others who depend on watershed services have formed a water fund that invests in conservation activities. The water fund needs to determine where to invest to reduce sedimentation and ensure a regular flow of water cost-effectively.
Developing scenarios for the water fund objectives involved five steps, illustrated in Figure 2:
1. Select activity and assign to the landscape. Conservation activities (protection, restoration, reforestation, fencing or silvopastoral practices) were assigned to the landscape based on the past behavior of landowners, previous successful investments by the water fund, opportunity costs and landowners’ willingness to change activities.

Guidance and Case Studies for InVEST Users | 25
2. Rank the landscape impact. The landscape was ranked to highlight the places where possible conservation investments were likely to provide the greatest improvements in terrestrial biodiversity, annual water yield, dry season baseflow, and erosion control, based on factors known to affect these processes. A simple ranking approach was used in this step, rather than quantitative InVEST modeling. This allowed inclusion of more objectives and was more technically feasible since using InVEST for optimization across multiple objectives is currently time intensive.
3. Identify activity costs. Data from historical conservation investments in each watershed were used to estimate how much the proposed conservation activity in each location would cost.
4. Combine rank and cost to identify investments. Combining the landscape ranking and cost information enabled selection of the highest-ranked locations for each activity. Costs were tallied until the target budget level was met. The resulting selected activities formed the water fund investment portfolio. This investment portfolio was then embedded in the current landscape and assessed as a scenario with InVEST models to estimate returns in erosion control and annual water yield relative to the current landscape.
5. Compare returns at different budget levels. Finally, this process was repeated for five budgets, ranging from the level of investment currently committed by the fund (USD 12 million) to a doubling of that investment (USD 24 million). These investment portfolios formed the scenarios of future management that were compared in the InVEST analysis. With the quantitative estimates of ecosystem service returns, it was possible to identify the most efficient investment portfolio for each watershed in the fund for a variety of budgets. For example, the estimates show where in a sub-watershed the water fund should reforest or restore vegetation and where it would be more cost effective to fence off areas or engage in silvopastoral practices.
FIgURE 2 Steps for water fund scenarios
t
t
t
t
Step 1: Select an activity and assign to the landscape
Step 2: Rank the landscape impact
Step 3: Identify activity costs
Step 4: Combine rank and cost to identify investments
Step 5: Compare returns at different budget levels
26 | Developing Scenarios
Example 3. The governments of Malaysia, Indonesia and Brunei are working together in Borneo to improve human well-being and social equity, while significantly reducing environmental risks. Policy makers aim to showcase how to develop a “green economy” in Borneo where policies, spatial plans and sustainable finance mechanisms reflect the value of natural capital.
Two future scenarios were developed for Borneo: one that represented business as usual, and the other a model green economy where ecosystem services are valued in policy and decision making. The team used the IDRISI Land Change Modeler—a quantitative scenario generation modeling tool developed by Clark Labs—to predict land-cover change based on a range of variables including past change observed between 2000 and 2009. Some further manual adjustments were made to the scenarios to make them more distinct and reflect important changes in land cover and management practices, such as logging concessions.
These two scenarios enabled policy makers to see the impacts on ecosystem services of two contrasting futures: business as usual and a green economy. This provided a scientific basis for policy commitments to make the vision of a green future a reality, and for investments by multilateral and bilateral donors to help put these policies into practice.
Discussion of ExamplesEach of these examples illustrates how, by starting with the goals of decision makers, scenarios were developed to allow the InVEST analysis to address the most relevant ecosystem service impacts and tradeoffs.
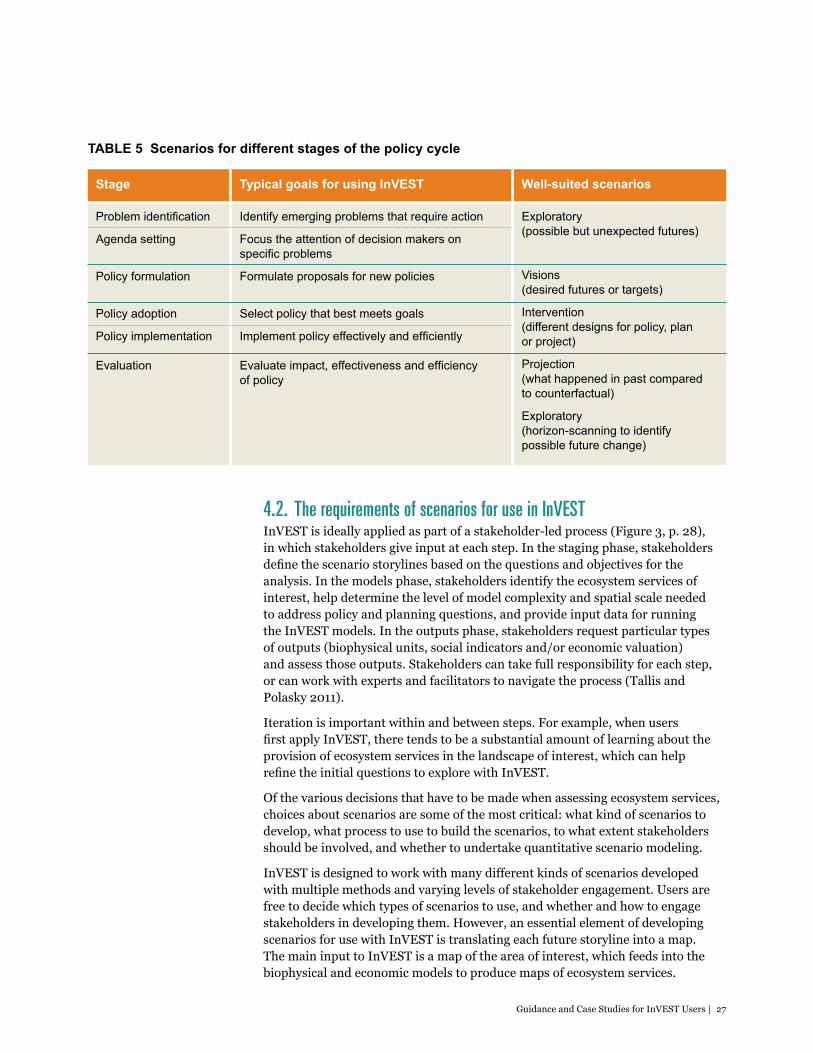
It is difficult to draw specific recommendations for which scenarios fit best in particular contexts; there are exceptions to every rule and different scenarios are often blended together. One general observation is that particular types of scenarios are well-suited to informing specific stages of the policy cycle (see Table 5).
Exploratory scenarios have proven well-suited to early stages of the policy cycle, when emerging problems are identified and decision makers are determining which problems deserve their attention (this was the case in Tanzania). Vision scenarios have proved useful when formulating policies. For example, in Borneo stakeholders were brought together for the purpose of developing the green economy scenario. This helped them develop a shared vision for the future and scope ideas for policies to achieve that future.
Intervention scenarios are often useful at the stages of deciding which policies to adopt and how to implement them, as they allow InVEST to look at the ecosystem service impacts of alternative policy designs. This was the case in the examples from Colombia, when InVEST was used to inform decisions about (1) where the water fund should direct payments and (2) where mitigation activities could take place to offset adverse impacts from mining.
Guidance and Case Studies for InVEST Users | 27
TABlE 5 Scenarios for different stages of the policy cycle
Typical goals for using InVESTStage
Problem identification
Agenda setting
Policy formulation
Policy adoption
Policy implementation
evaluation
Identify emerging problems that require action
Focus the attention of decision makers on specific problems
Formulate proposals for new policies
Select policy that best meets goals
Implement policy effectively and efficiently
Evaluate impact, effectiveness and efficiency of policy
Well-suited scenarios
exploratory (possible but unexpected futures)
Visions (desired futures or targets)
Intervention (different designs for policy, plan or project)
Projection (what happened in past compared to counterfactual)
exploratory (horizon-scanning to identify possible future change)
4.2. The requirements of scenarios for use in InVESTInVEST is ideally applied as part of a stakeholder-led process (Figure 3, p. 28), in which stakeholders give input at each step. In the staging phase, stakeholders define the scenario storylines based on the questions and objectives for the analysis. In the models phase, stakeholders identify the ecosystem services of interest, help determine the level of model complexity and spatial scale needed to address policy and planning questions, and provide input data for running the InVEST models. In the outputs phase, stakeholders request particular types of outputs (biophysical units, social indicators and/or economic valuation) and assess those outputs. Stakeholders can take full responsibility for each step, or can work with experts and facilitators to navigate the process (Tallis and Polasky 2011).
Iteration is important within and between steps. For example, when users first apply InVEST, there tends to be a substantial amount of learning about the provision of ecosystem services in the landscape of interest, which can help refine the initial questions to explore with InVEST.
Of the various decisions that have to be made when assessing ecosystem services, choices about scenarios are some of the most critical: what kind of scenarios to develop, what process to use to build the scenarios, to what extent stakeholders should be involved, and whether to undertake quantitative scenario modeling.
InVEST is designed to work with many different kinds of scenarios developed with multiple methods and varying levels of stakeholder engagement. Users are free to decide which types of scenarios to use, and whether and how to engage stakeholders in developing them. However, an essential element of developing scenarios for use with InVEST is translating each future storyline into a map. The main input to InVEST is a map of the area of interest, which feeds into the biophysical and economic models to produce maps of ecosystem services.
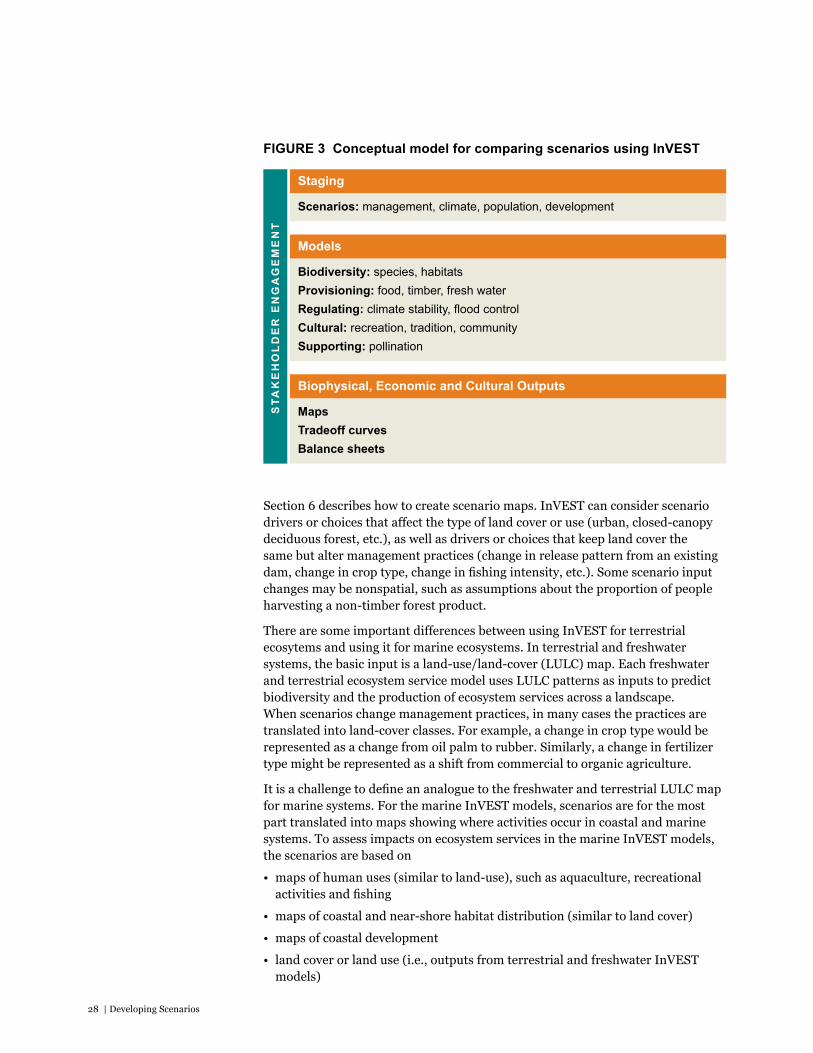
28 | Developing Scenarios
Staging
Scenarios: management, climate, population, development
Models
Biodiversity: species, habitatsProvisioning: food, timber, fresh waterRegulating: climate stability, flood controlCultural: recreation, tradition, communitySupporting: pollination
Biophysical, Economic and Cultural Outputs
MapsTradeoff curvesBalance sheets
FIgURE 3 Conceptual model for comparing scenarios using InVEST
STA
KE
HO
lD
ER
EN
gA
gE
ME
NT
Section 6 describes how to create scenario maps. InVEST can consider scenario drivers or choices that affect the type of land cover or use (urban, closed-canopy deciduous forest, etc.), as well as drivers or choices that keep land cover the same but alter management practices (change in release pattern from an existing dam, change in crop type, change in fishing intensity, etc.). Some scenario input changes may be nonspatial, such as assumptions about the proportion of people harvesting a non-timber forest product.
There are some important differences between using InVEST for terrestrial ecosytems and using it for marine ecosystems. In terrestrial and freshwater systems, the basic input is a land-use/land-cover (LULC) map. Each freshwater and terrestrial ecosystem service model uses LULC patterns as inputs to predict biodiversity and the production of ecosystem services across a landscape. When scenarios change management practices, in many cases the practices are translated into land-cover classes. For example, a change in crop type would be represented as a change from oil palm to rubber. Similarly, a change in fertilizer type might be represented as a shift from commercial to organic agriculture.
It is a challenge to define an analogue to the freshwater and terrestrial LULC map for marine systems. For the marine InVEST models, scenarios are for the most part translated into maps showing where activities occur in coastal and marine systems. To assess impacts on ecosystem services in the marine InVEST models, the scenarios are based on
• maps of human uses (similar to land-use), such as aquaculture, recreational activities and fishing
• maps of coastal and near-shore habitat distribution (similar to land cover)
• maps of coastal development
• land cover or land use (i.e., outputs from terrestrial and freshwater InVEST models)
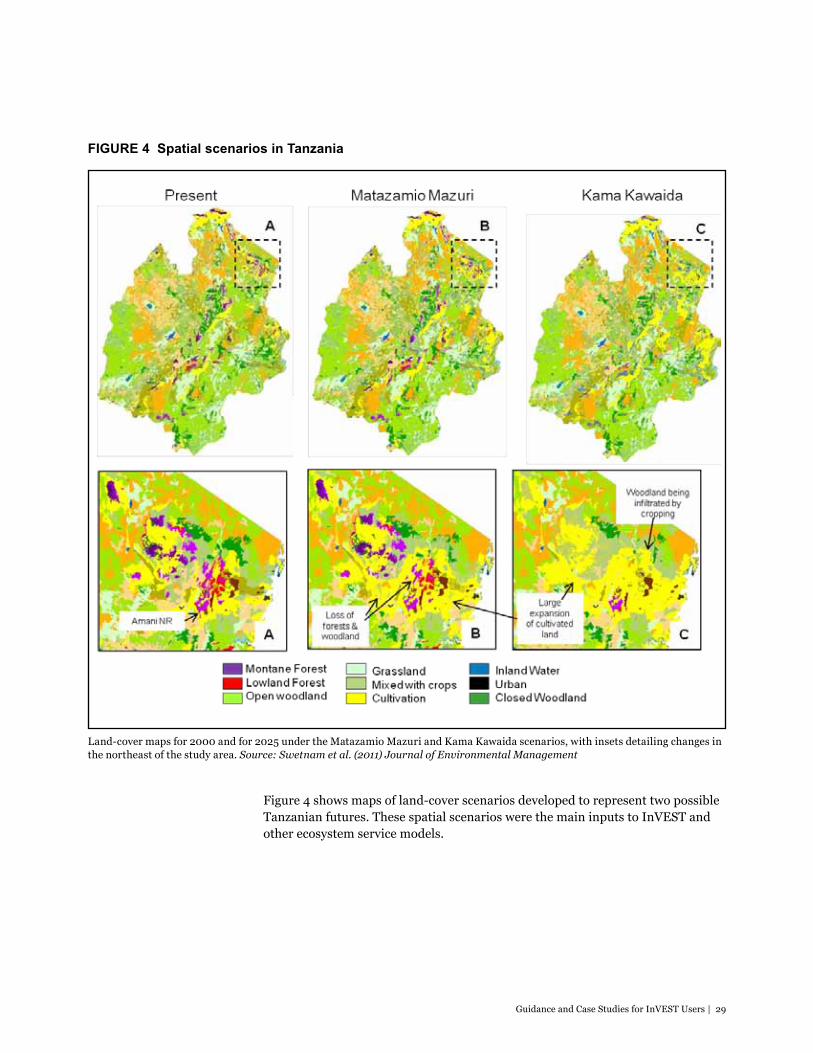
Guidance and Case Studies for InVEST Users | 29
Figure 4 shows maps of land-cover scenarios developed to represent two possible Tanzanian futures. These spatial scenarios were the main inputs to InVEST and other ecosystem service models.
Land-cover maps for 2000 and for 2025 under the Matazamio Mazuri and Kama Kawaida scenarios, with insets detailing changes in the northeast of the study area. Source: Swetnam et al. (2011) Journal of Environmental Management
FIgURE 4 Spatial scenarios in Tanzania
30 | Developing Scenarios
4.3. The process: Reasons for engaging stakeholdersScenarios can be developed with varying levels and types of participation by stakeholders. Several decisions need to be made: whether to involve stakeholders, whom to involve, how to involve them, and when to get their input. Ideally, stakeholders are deeply engaged at every stage of the process—defining the storylines, determining the most important drivers of change, translating scenarios into maps, and adjusting the analysis iteratively.
It is conceivable for scenarios to be developed by a technical team with limited stakeholder input. However, there is strong evidence that for plans, policies and strategies to be effectively implemented, those with a stake in the social and environmental problems under scrutiny need to be actively engaged in finding the solution (Lee 1993; Yankelovich 1991). InVEST is designed to be applied as part of a stakeholder-led process. There is a tradeoff between the resources required for extensive participation and the buy-in and input that are likely to be gained.
Stakeholder participation in scenario development can have a number of benefits, as described in Table 6 (Alcamo and Henrichs 2008; Wollenberg, Edmunds, and Buck 2000b; van den Belt 2004; Lebel et al. 2005; Berkhout and Hertin 2002; Patel, Kok, and Rothman 2007). Here we discuss four that have proved particularly important to InVEST users.
First, stakeholder engagement can help ensure that ecosystem service analyses are relevant to the questions facing decision makers. With stakeholder input, it is less likely that time and energy will be wasted running scenarios that are not plausible given political realities and cultural and social preferences.
Second, stakeholder participation in scenario development can enhance the perceived legitimacy of InVEST results. Participation may allow stakeholders—including policy makers—to judge that their concerns were properly accounted for in the way the scenarios set up the InVEST analysis. Meaningful involvement can also give stakeholders a sense of ownership of the process and results. This increases the likelihood that stakeholders will use the results.
Third, stakeholders can learn from contributing to scenario development (Van der Kerkhof and Wieczorek 2005). Exploratory scenarios enable stakeholders to share conceptions of what future conditions might be and learn about how drivers evolve and interact over time. Intervention scenarios enable participants to learn about policy mechanisms and payment schemes, and how they could operate most effectively. Vision scenarios teach stakeholders about others’ perspectives and goals for desirable futures. By creating shared understandings, participatory scenarios may build networks of individuals linked by common concerns.
Fourth, scenario development requires knowledge of local policies and drivers and how they operate spatially. Participatory approaches can draw in stakeholder knowledge that is essential for reflecting these factors accurately. A requirement for InVEST scenarios is turning each storyline into a map. This typically requires local expert knowledge about how and where changes are likely to play out across the landscape or seascape. Some of the case studies in Section 7 describe innovative approaches to engaging stakeholders when developing scenarios and converting them into mapped inputs for InVEST.
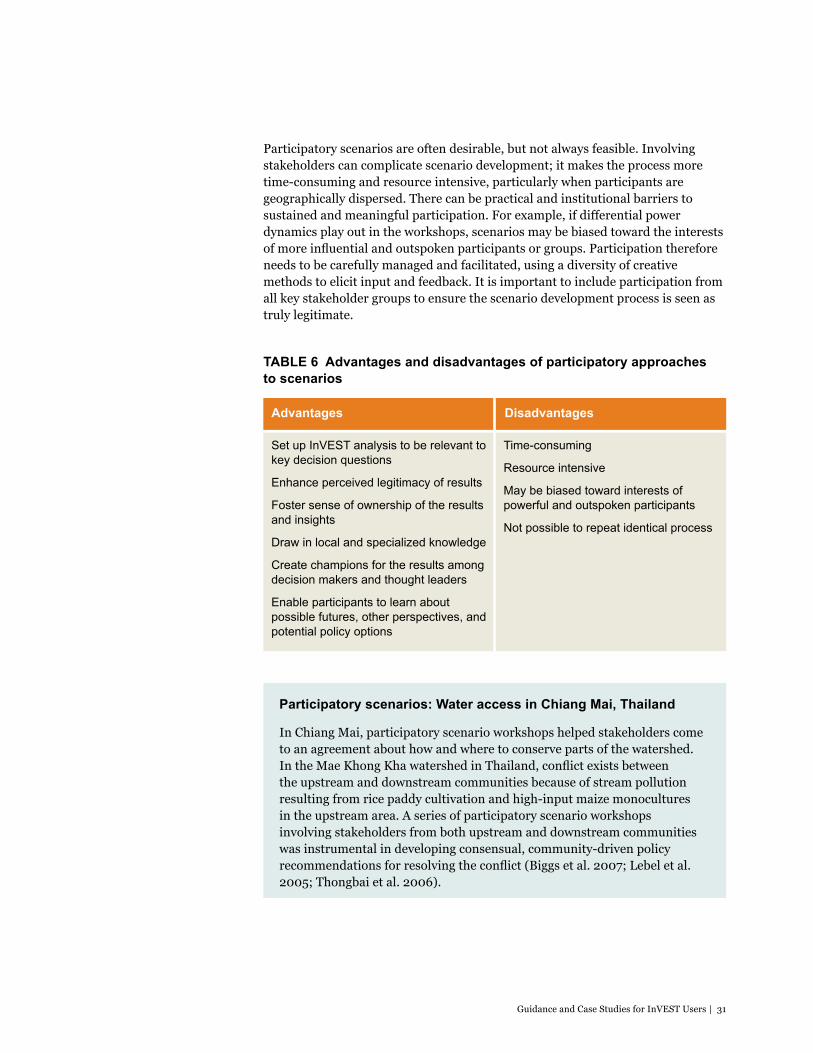
Guidance and Case Studies for InVEST Users | 31
Participatory scenarios are often desirable, but not always feasible. Involving stakeholders can complicate scenario development; it makes the process more time-consuming and resource intensive, particularly when participants are geographically dispersed. There can be practical and institutional barriers to sustained and meaningful participation. For example, if differential power dynamics play out in the workshops, scenarios may be biased toward the interests of more influential and outspoken participants or groups. Participation therefore needs to be carefully managed and facilitated, using a diversity of creative methods to elicit input and feedback. It is important to include participation from all key stakeholder groups to ensure the scenario development process is seen as truly legitimate.
TABlE 6 Advantages and disadvantages of participatory approaches to scenarios
Participatory scenarios: Water access in Chiang Mai, Thailand
In Chiang Mai, participatory scenario workshops helped stakeholders come to an agreement about how and where to conserve parts of the watershed. In the Mae Khong Kha watershed in Thailand, conflict exists between the upstream and downstream communities because of stream pollution resulting from rice paddy cultivation and high-input maize monocultures in the upstream area. A series of participatory scenario workshops involving stakeholders from both upstream and downstream communities was instrumental in developing consensual, community-driven policy recommendations for resolving the conflict (Biggs et al. 2007; Lebel et al. 2005; Thongbai et al. 2006).
Advantages
Time-consuming
Resource intensive
May be biased toward interests of powerful and outspoken participants
Not possible to repeat identical process
Disadvantages
Set up InVeST analysis to be relevant to key decision questions
enhance perceived legitimacy of results
Foster sense of ownership of the results and insights
draw in local and specialized knowledge
Create champions for the results among decision makers and thought leaders
enable participants to learn about possible futures, other perspectives, and potential policy options

32 | Developing Scenarios
4.4. The product: How quantitative should scenarios be?Scenarios can include both qualitative descriptions (i.e., a narrative—see “Matazamio” story below for an example) and quantitative representations (i.e., numbers) to illustrate and support the storyline. Both qualitative and quantitative scenario storylines can be drawn on maps to represent where things would change.
Narrative scenarios: Matazamio in Tanzania
Annual GDP growth in Tanzania is 6 percent. Per capita GDP in the country is now over USD 1500 (PPP), with agriculture being the largest employer, and the tourism and mining sectors continuing to grow fast. Population growth has slowed to 2 percent per year due to child mortality and falling fertility rates. The population in 2025 will be about 55 million. Growth occurs mainly in regional and coastal cities due to migration.
Government and private investment greatly increase the marketing, processing and transportation of agricultural goods, including livestock products (milk and meat). There is a large increase in irrigated agriculture and water storage schemes. On-farm technology improves. The percentage of area under medium- and large-scale farming doubles. Global commodity prices rise, increasing total exports and export crops.
The population with access to electricity increases from 12 percent to 40 percent. The additional generation comes from increased gas and coal plants and increasing hydroelectric capacity. Catchment management is deemed important for this sector and resources for this have been available. Biomass-derived energy is used mainly for cooking, but more efficient stoves and waste residue fuels reduce the demand.
A growing global market for biofuels encourages plantations of sugarcane, oil palm and jatropha. International payments for carbon credits (REDD) and national investments in payments for watershed services schemes are growing and facilitating improved catchment management. There is more capacity to monitor forest reserves for encroachment and timber extraction.
There are a number of statistical and simulation modeling tools for scenario development, which provide quantitative indicators for each scenario. These methods are covered in some detail in Section 5.3. Prominent examples of scenario models include Metronamica, PoleStar, IMAGE, WaterGAP, AIM, T21, GLOBIOM, Mirage, CLUE, GTAP/MAGNET, LandSHIFT and the International Futures Model. The models most commonly used by past InVEST users include IDRISI Land Change Modeler, Marxan, Dinamica and GEOMOD.
Many scenarios for InVEST combine both qualitative and quantitative approaches, drawing on the strengths of each (Rijsberman 2000); a combination of both elements can make a scenario more robust and consistent. A quantitative scenario can be enriched with qualitative information. A qualitative scenario can be tested for plausibility and consistency through quantification.

Guidance and Case Studies for InVEST Users | 33
Quantitative scenarios: Conservation payments in Oregon
In the Willamette Basin in Oregon, InVEST was used to assess the provision of carbon sequestration and species conservation under five scenarios. The study aimed to assess the degree to which payment schemes to convert private land to conserved land could generate efficient outcomes. Each scenario offered payments for land conservation to landowners; what differed across scenarios was the criteria that determined which lands would be eligible for payments. All other conditions were held constant. The criteria for conservation payments in each scenario were similar to targeting schemes used in incentive programs of the U.S. Department of Agriculture, such as the Conservation Reserve Program:
All: any land parcel is eligible for a conservation contract
Rare habitat: only parcels that could convert to rare natural habitat are eligible
Carbon: only parcels that could convert to conserved forest are eligible
Riparian: only parcels with significant stream density are eligible
Species conservation: only parcels important for vertebrate species conservation are eligible
Integrated models were used to predict private land-use decisions in response to the incentives in each scenario. The analysis showed that policies aimed at increasing the provision of carbon sequestration do not necessarily increase species conservation, and that highly targeted policies are not necessarily as effective as more general policies.
Based on Nelson, Polasky et al. (2008)
When considering what combination of methods to use, it can be helpful—in the context of the study goals and decision of interest—to consider these questions:
• Do you need to predict general trends?
• Do you need to simulate specific potential policies?
• Do you need to simulate surprises and uncertain events?
• Do you need to replicate the scenario development process elsewhere?
• Do you need to be very transparent about assumptions—e.g., drivers of change and how they interact?
• Do you have plenty of data and capacity for quantitative scenario modeling?
• Do you want to generate very detailed maps of expected change or just describe patterns that might emerge in the landscape of interest?
If the answer to one or more of these questions is yes, you may want to consider using a quantitative approach to scenarios. For further discussion on quantitative approaches to scenarios, see Section 5.3 and also Jaeger et al. (2007) and Coreau et al. (2009).
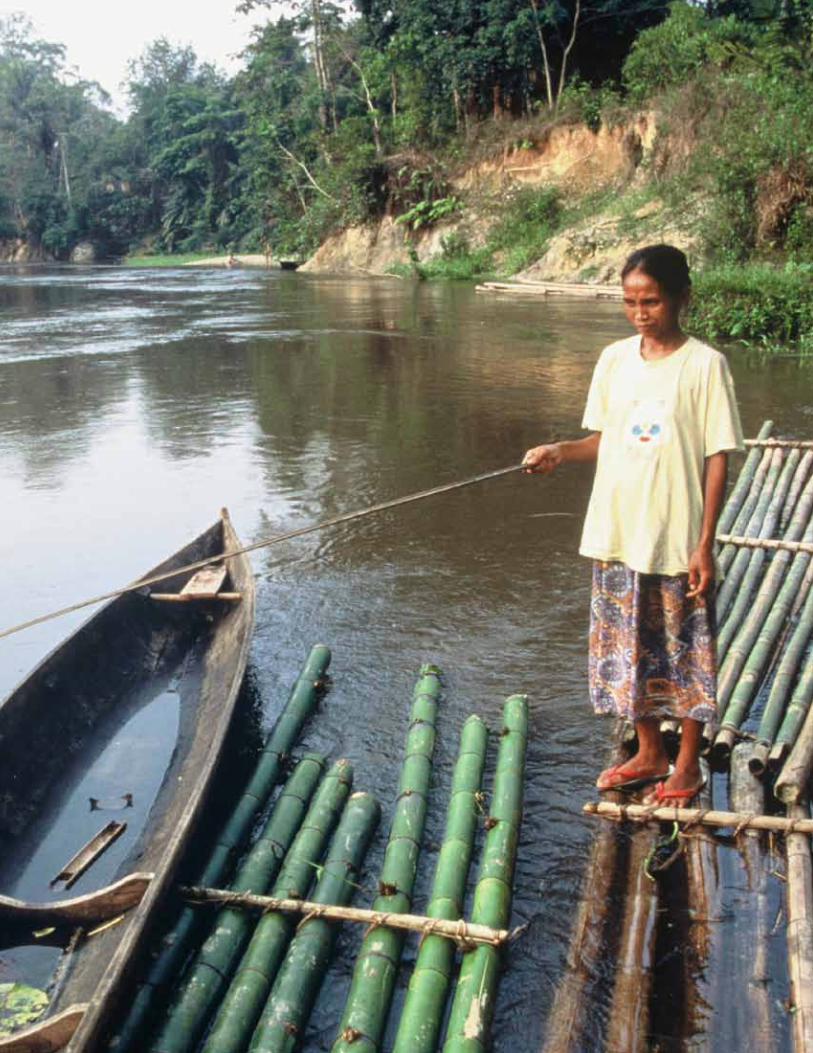
34 | Developing Scenarios
Guidance and Case Studies for InVEST Users | 35
It is worth considering that limiting future scenarios to predictive models may limit consideration of surprises. Scenarios that explore unexpected futures can help reveal and test the conditions under which a predictive model is no longer valid.
4.5. The number and scale of scenariosThe choice of scenarios can affect which potential futures and policy options are considered, debated and realized. InVEST case studies vary in how many scenarios are developed, from one to more than five.
Developing only one scenario does not allow comparison of alternatives and their tradeoffs, although it does enable identification of change from the current to the future situation. In some circumstances, it might be all that is needed to stimulate ideas and considerations about the future. For example, InVEST has been used in some locations, such as China, to assess how ecosystem services are likely to change from the current situation to one future projection scenario, given existing trends in population, development and climate.
Developing two scenarios enables comparison of the ecosystem service impacts of alternatives and elucidation of tradeoffs, stimulating debate about the benefits and costs of different futures. However, looking at only two scenarios may not adequately represent the complexity and nuance needed. Experience has shown that two scenarios often represent polarized extremes (e.g., conservation vs. development), and fail to consider moderate action or balanced compromises.
Developing three or more scenarios enables InVEST users to assess multiple options and associated tradeoffs, stimulating wider debate about a range of futures and policy responses. However, with three scenarios, the middle scenario can automatically be mistakenly interpreted as “most likely” or “preferred.” With an even number of scenarios, stakeholders may be more likely to look at the full range of options.
With five or more scenarios, they can be tailored to very specific locations and stakeholder interests. With more scenarios, it becomes increasingly challenging to compare the differences and to construct scenarios that are sufficiently contrasting. It can also become overwhelming for stakeholders to compare and understand the results. As you add scenarios, more time and resources are needed.
Scenarios vary in their spatial scale—they can represent local, regional, national or global future storylines (Biggs et al. 2007; Alcamo 2008a). As with other scenario scoping decisions, the appropriate scale will be determined by the goal of applying InVEST. Goals could be at a large spatial scale and broadly defined—for example, reconsidering the role of the environment in national development policies. Policy goals could also be at local scales to inform more tactical land or coastal management decisions, such as determining the right location for riparian buffers in a local land-holding (Polasky et al. 2011).
The scenarios need to be relevant to these scales, but this does not necessarily mean they have to be at these scales. For example, in the Sumatra case the targeted land-use decisions are made by provinces and district governments, but the scenarios were developed for the entire area of Central Sumatra to ensure

36 | Developing Scenarios
that a number of biophysical linkages were considered (see Section 7.1). This approach ensured that recommendations for individual districts took into account the effects of regional drivers of change and the influence of district- and province-level decisions.
Scenarios can be developed at multiple scales to expand discussions with stakeholders or assess tradeoffs and interactions between scales. In the Vancouver Island case, local-scale scenarios were stitched together to the bigger scale of entire sounds, with the introduction of new marine uses that occur at regional scale, in order to address larger-scale spatial planning questions. Multi-scale scenarios can be challenging, requiring more time and resources and often sacrificing detail and credibility at one or more scales (Biggs et al. 2007; Kok, Biggs, and Zurek 2007).
The scale of scenarios: global environmental scenarios
Scenarios have been used to consider future changes at scales from local to global (Alcamo 2001; Biggs et al. 2007). Local- and regional-scale land-use scenarios are more relevant for applications of InVEST, but there have recently been a number of global environmental scenarios that may also be of interest to InVEST users. Global environmental scenarios tend to be exploratory and quantitative, involving large, complex models that quantify drivers of change. They typically have a coarse grain and level of detail; cover a time period long into the future; and are expert-driven, involving stakeholders in the review or a formal dialogue process, rather than in developing the scenarios themselves (Biggs et al. 2007).
The Limits to Growth report, exploring future world resource consumption, was one of the earliest efforts to apply scenarios to global environmental issues (Meadows et al. 1972). Since then, a range of global environmental assessments have used scenarios, including the Millennium Ecosystem Assessment, the IPCC’s Special Report on Emissions Scenarios (SRES), the World Water Vision and UNEP’s Environmental Outlook (GEO) (MA 2005; Navicenovic and Swart 2000; United Nations Environment Programme 2007; Rijsberman 2000). These reports describe possible future scenarios, including a depiction of business as usual and of several future worlds that differ in the extent of imagined drivers, such as consumption patterns and political movements. The aim of these global environmental scenarios is usually to enable the public and decision makers to conceptualize actions needed to achieve a sustainable future (Gallopin et al. 1997). The IPCC’s SRES scenarios describe alternative paths for global greenhouse gas emissions, and are now widely used by governments and NGOs to assess possible future implications and risks associated with climate change.
These global scenarios can be part of multi-scale scenarios, to frame storylines at the local, national or regional scale where InVEST is being applied.

Guidance and Case Studies for InVEST Users | 37
Scenarios also vary in their time frame, from short term to long term—a storyline can describe a future in a few years or a century or more away. They also vary in their temporal nature: a scenario can be a snapshot of a future end-state or a chain of changes over progressive time periods. In published studies, snapshots of the future are often referred to as “alternative futures.” Some things to consider when determining the time frame for InVEST scenarios are summarized in Table 7. As time frames for the scenarios extend further into the future there is increased uncertainty about what will occur.
TABlE 7 Using objectives to select scenario time frames and spatial scales
Appropriate spatial scale
Local, regional or global
Local, regional or global
depends on the political or social boundaries of the entity making the decision or plan
Appropriate time frame
50–100 years
Long time frame (e.g., 30–50 years, to address forest regrowth)
Short time frame (e.g., 5–15 years)
Aim for InVEST analysis
Assess the impacts of climate change
Assess carbon sequestration impacts
Assess immediate impacts of a decision or plan
In some cases when using scenarios with InVEST, it can be helpful to develop multiple, successive scenarios to understand the effects of linked activities or phenomena. For example, to understand deforestation and reforestation dynamics, it may be helpful to create scenarios in five-year time steps over a 50-year time frame. Deforestation may occur in the first five years and again in the last five years. InVEST can capture these changes in carbon sequestration and emissions when the chain of actions is made explicit. If these temporal dynamics are not of interest, a single 50-year time frame and a static endpoint may be best.

38 | Developing Scenarios

Guidance and Case Studies for InVEST Users | 39
Key messages• Both qualitative and quantitative methods exist for developing scenario
storylines; there is no single recipe. A combined approach often works best.
• When developing scenarios, InVEST users have often found it easiest to start with a simple approach and then build upon that with more sophisticated methods if the time and technical capacity are available.
• Drivers are the foundation of scenarios; they shape the direction, magnitude and rate of future change.
In this section, we introduce methods for developing scenario storylines. Once the storylines are developed, further analysis may be required to define the scenarios spatially so they can be used in InVEST (methods for this are covered in Section 6).
5.1. Drivers of changeAll scenarios, either implicitly or explicitly, have to make assumptions about the factors that drive future change. We refer to these forces of change as “drivers,” which shape the direction, magnitude and rate of change in landscapes and seascapes. All the methods described here are based on the interactions of a set of drivers.
The Millennium Ecosystem Assessment defines drivers as any natural or human-induced factor that directly or indirectly causes a change in an ecosystem (MA 2003). Table 8 (p. 40) summarizes common drivers of change in the use and management of landscapes and seascapes (Lambin et al. 2001; Raskin et al. 2005; Bennett 2005). These drivers may influence decision makers but be beyond their control, such as international prices (exogenous drivers). Or they may be within decision makers’ sphere of influence, such as local government designation of zoning boundaries (endogenous drivers).
For more insight into drivers, we refer readers to the Millennium Ecosystem Assessment Framework (2003). Here we simply highlight four key questions about drivers that InVEST users typically face:
• Which drivers should we consider explicitly when developing scenarios?
• How many drivers and interactions should we consider?
• What scale of drivers should we consider? The common mismatch between the scale at which many drivers are operating and the scales at which management decisions are being made may make it useful to consider drivers at multiple scales.
• Should we consider drivers that are both within and beyond the decision makers’ control? Even when decision makers cannot directly influence drivers, it can be useful to consider those drivers in scenarios to assess how to mitigate or prepare for unforeseen impacts (Evans et al. 2006).
5. Developing scenario storylines
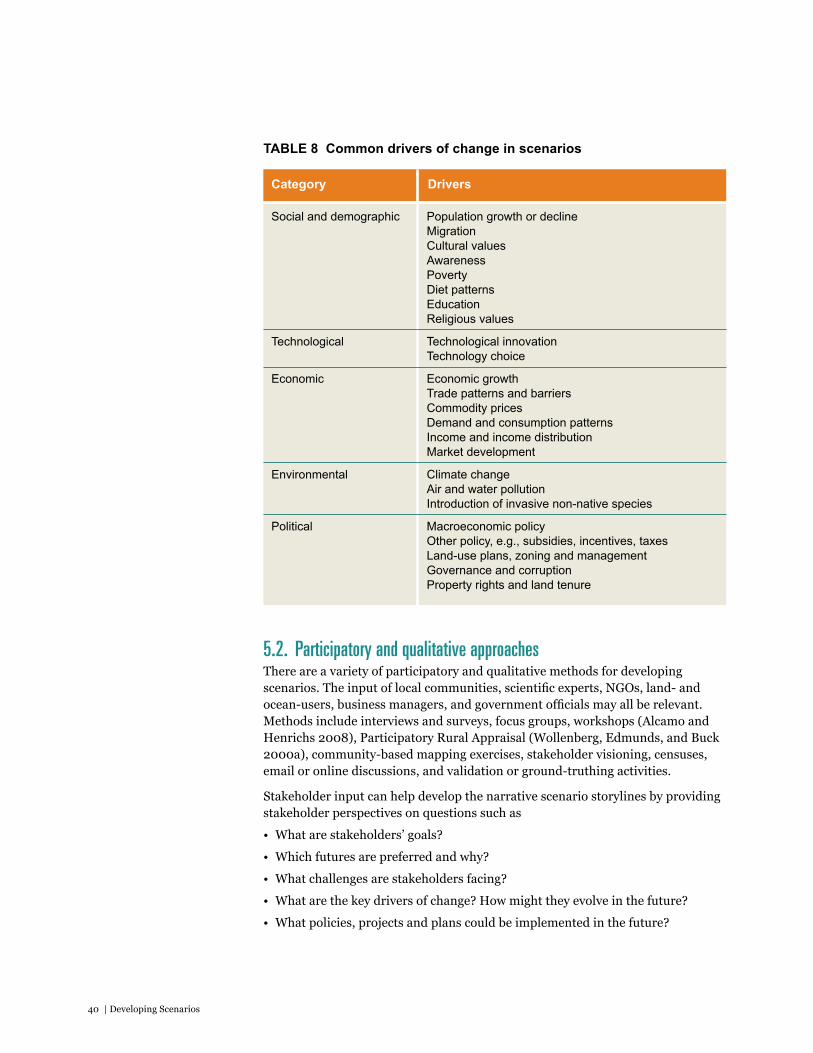
40 | Developing Scenarios
Category
Population growth or declineMigrationCultural valuesAwarenessPovertydiet patternseducationReligious values
Technological innovationTechnology choice
economic growth Trade patterns and barriersCommodity pricesdemand and consumption patternsIncome and income distributionMarket development
Climate changeAir and water pollutionIntroduction of invasive non-native species
Macroeconomic policyOther policy, e.g., subsidies, incentives, taxesLand-use plans, zoning and managementgovernance and corruptionProperty rights and land tenure
Drivers
Social and demographic
Technological
economic
environmental
Political
TABlE 8 Common drivers of change in scenarios
5.2. Participatory and qualitative approaches There are a variety of participatory and qualitative methods for developing scenarios. The input of local communities, scientific experts, NGOs, land- and ocean-users, business managers, and government officials may all be relevant. Methods include interviews and surveys, focus groups, workshops (Alcamo and Henrichs 2008), Participatory Rural Appraisal (Wollenberg, Edmunds, and Buck 2000a), community-based mapping exercises, stakeholder visioning, censuses, email or online discussions, and validation or ground-truthing activities.
Stakeholder input can help develop the narrative scenario storylines by providing stakeholder perspectives on questions such as
• What are stakeholders’ goals?
• Which futures are preferred and why?
• What challenges are stakeholders facing?
• What are the key drivers of change? How might they evolve in the future?
• What policies, projects and plans could be implemented in the future?

Guidance and Case Studies for InVEST Users | 41
• What are the most pressing policy questions facing decision makers?
• What are the implications of the scenarios? For whom?
Some of the participatory methods and insights from stakeholder engagement in InVEST case studies are summarized in Table 9 (p. 42).
5.3. Technical and quantitative approaches A variety of quantitative models can be used to predict or simulate how landowners and resource managers would react or landscapes would change, given changes in drivers—e.g., crop prices or climate (Nelson et al. 2010). Technical approaches can complement participatory and qualitative approaches (Kemp-Benedict 2004) using techniques such as the Story and Simulation approach (Alcamo 2008c). Here we give a brief overview of prominent modeling approaches that have proved helpful to InVEST users, along with references for readers who want to learn more. Some of these techniques and tools have been used jointly to create scenarios for ecosystem service analysis (Nelson et al. 2010).
When using general equilibrium simulation techniques, relevant drivers from scenario storylines are put into simulation models that cover different aspects of the economic and natural system. The simulation models translate the driver trajectories into future land-use for the study area. This approach was used for the Millennium Ecosystem Assessment (MA). The MA team developed four plausible descriptions of the Earth’s future. Each scenario was defined by regional population, economic and technological growth, and projections for food and energy demands. Using a set of climate, agricultural, water supply and use, and land-use/land-cover (LULC) change models, the MA team used the general equilibrium model IMAGE to translate these expected regional change and demand trajectories into global grid cell-level LULC maps for the years 2050 and 2100 (Alcamo et al. 2005; MA 2005).
With agent-based modeling, the extent and pattern of LULC change is generated by simulating the decision making of actors on the landscape. Agents (e.g., households, firms, government agencies, etc.) are assumed to make management decisions about the landscape that maximize their preferences given policy constraints and their neighbors’ decisions. Once agents make a decision, a policy or management outcome modifies site attributes resulting in landscape change. Policies may be constrained to operate only with certain agents, such as home owners or farmers with streams flowing through their property (Hulse et al. 2009; Parker et al. 2003; Guzy et al. 2008). A challenge of agent-based modeling is selecting appropriate rules to guide agent behavior. The ENVISION model gives users the capacity to implement agent-based modeling on a landscape (envision.bioe.orst.edu).
Previous land-use change behavior can be extrapolated into the future using one of several statistical techniques. These techniques estimate transition probabilities from one land-use to another at different scales, such as the land parcel or county. The transition probabilities are then used to reassign land-use (Geoghegan et al. 2001; Nelson et al. 2008; Radeloff et al. In press). Software tools, such as IDRISI Land Change Modeler, exist to help implement these techniques (Clark Labs 2009). The limitation of this approach is that conditions in the past may not persist into the future.
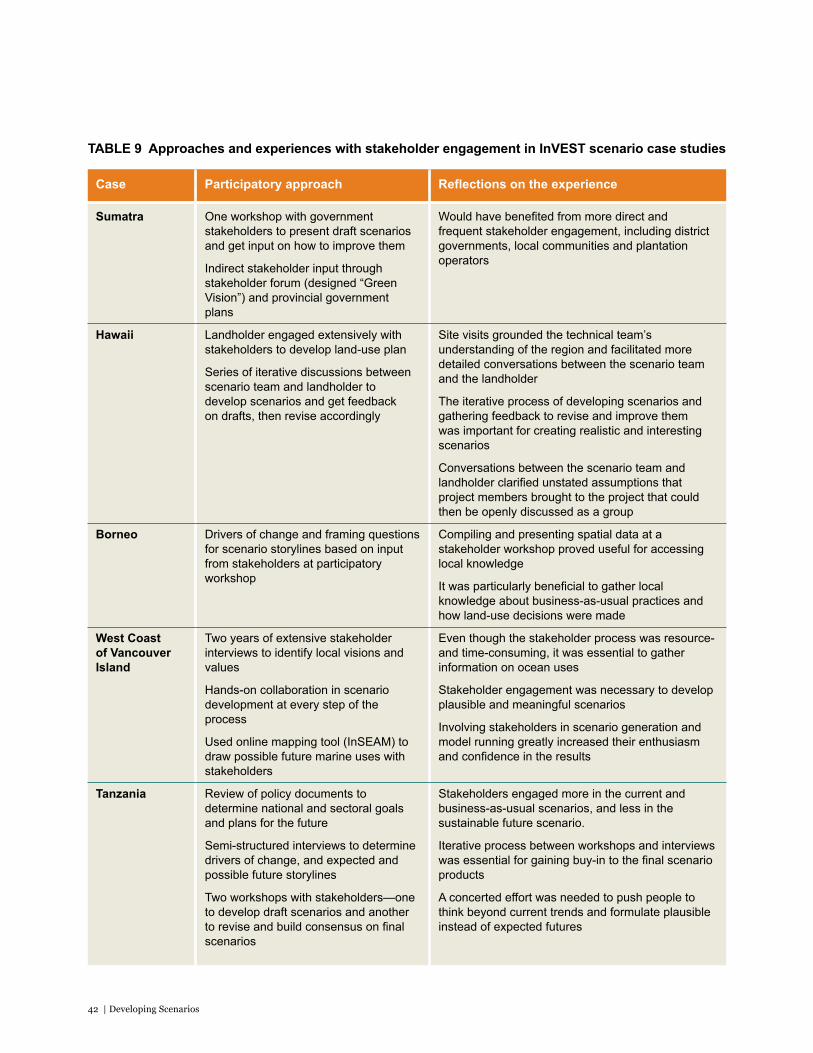
42 | Developing Scenarios
TABlE 9 Approaches and experiences with stakeholder engagement in InVEST scenario case studies
Reflections on the experience
Would have benefited from more direct and frequent stakeholder engagement, including district governments, local communities and plantation operators
Site visits grounded the technical team’s understanding of the region and facilitated more detailed conversations between the scenario team and the landholder
The iterative process of developing scenarios and gathering feedback to revise and improve them was important for creating realistic and interesting scenarios
Conversations between the scenario team and landholder clarified unstated assumptions that project members brought to the project that could then be openly discussed as a group
Compiling and presenting spatial data at a stakeholder workshop proved useful for accessing local knowledge
It was particularly beneficial to gather local knowledge about business-as-usual practices and how land-use decisions were made
even though the stakeholder process was resource- and time-consuming, it was essential to gather information on ocean uses
Stakeholder engagement was necessary to develop plausible and meaningful scenarios
Involving stakeholders in scenario generation and model running greatly increased their enthusiasm and confidence in the results
Stakeholders engaged more in the current and business-as-usual scenarios, and less in the sustainable future scenario.
Iterative process between workshops and interviews was essential for gaining buy-in to the final scenario products
A concerted effort was needed to push people to think beyond current trends and formulate plausible instead of expected futures
Participatory approach
One workshop with government stakeholders to present draft scenarios and get input on how to improve them
Indirect stakeholder input through stakeholder forum (designed “green Vision”) and provincial government plans
Landholder engaged extensively with stakeholders to develop land-use plan
Series of iterative discussions between scenario team and landholder to develop scenarios and get feedback on drafts, then revise accordingly
drivers of change and framing questions for scenario storylines based on input from stakeholders at participatory workshop
Two years of extensive stakeholder interviews to identify local visions and values
Hands-on collaboration in scenario development at every step of the process
used online mapping tool (InSeAM) to draw possible future marine uses with stakeholders
Review of policy documents to determine national and sectoral goals and plans for the future
Semi-structured interviews to determine drivers of change, and expected and possible future storylines
Two workshops with stakeholders—one to develop draft scenarios and another to revise and build consensus on final scenarios
Case
Sumatra
Hawaii
Borneo
West Coast of Vancouver Island
Tanzania
Guidance and Case Studies for InVEST Users | 43
In Markov-cellular automata models, the mathematical process known as the Markov chain process controls temporal dynamics among the land-uses based on transition probabilities, while the spatial dynamics are controlled by local rules determined by suitability maps. Biophysical and socioeconomic data can be used to define initial conditions, parameterize the Markov-cellular automata model, calculate transition probabilities and determine the neighborhood rules for the suitability maps (Myint and Wang 2006; Kamusoko et al. 2009).
landscape optimizations illustrate how a specific target can be reached or a specific threat avoided most efficiently. When undertaken spatially, they show landscape configurations that maximize the provision of a particular ecosystem service, or a combination of services subject to an economic or biophysical constraint (Newburn, Berck, and Merenlender 2006; Polasky et al. 2008). These scenarios can be useful for exploring what is possible on a landscape at least cost, including economic or environmental costs. Optimizations of landscape configurations have been used extensively to determine the pattern of conserved habitat that would do the most to satisfy some biodiversity conservation objective at least economic cost.
Combining scenario approaches: Challenges in Switzerland
Walz et al. (2007) examined future changes in agriculture in the Alpine region of Davos, Switzerland. The study attempted to develop scenarios that combined stakeholder participation with numerical simulation. The participatory process was intended to support the elaboration of regional scenarios, which were quantitatively simulated through an Input–Output Model, a Resource Flux Model, a Land-use Allocation Model, and models to assess impacts on ecosystem services.
The researchers created impact tables to allow stakeholders to define the impact of drivers on important economic and environmental variables. For example, the stakeholders could rank how an increase in the number of visitors to ski resorts would affect local farm products. From these impact tables, they used simple mechanistic models to estimate impacts on ecosystem services.
In practice, the participatory process raised interest among the local participants. However, it could not contribute to the development of simulated scenarios as much as expected. This was due to
1. limitations in the models—the complexity of the system and the range of possible scenarios had to be reduced for scenario simulation
2. difficulty combining qualitative and quantitative data
3. a shift in priorities for the participatory process toward capacity-building, which hindered the detailed elaboration of scenarios for input in the mechanistic models
Reference: Walz, Lardelli et al. (2007)

44 | Developing Scenarios
5.4. Common methods by scenario type As noted earlier, there is no single recipe for developing storylines for each of the four scenario types. For illustrative purposes, we describe here a common process and typical methods for each, summarized in Table 10 (p. 48). Because scenario types are often combined, this should only be used as a general guideline, and InVEST users should draw on the full menu of qualitative and quantitative approaches described above.
5.4.1. Common methods for intervention scenarios Intervention scenarios reflect real alternatives being considered in policy and management decisions. Common activities for developing intervention scenarios include
• assess key aspects of current situation
• identify intervention (policy, project or plan) under consideration
• clarify goals and scope of intervention through stakeholder consultation
• identify possible alternatives for designing or implementing the intervention (e.g., configurations of spatial plans) through review of existing policy and planning documents and/or literature on similar interventions in relevant contexts
• undertake a quantitative analysis (if appropriate)
In many intervention scenarios, all other conditions and future drivers are held constant to keep the analysis simple and comparable. If other drivers are considered, approaches for developing exploratory scenarios are often also used.
5.4.2. Common methods for exploratory scenariosExploratory scenarios investigate possible—but unexpected—futures. There are many different approaches that can be taken to develop exploratory scenarios. Because so many of the benefits relate to raising awareness and building understanding, the process of developing exploratory scenarios is often as important as the final product. Development therefore often involves interviewing or hosting workshops with stakeholders. The scenarios developed based on stakeholders’ intuition can be translated into numbers and refined using quantitative models.
Common activities for developing exploratory scenarios include
• determine policy goal, issue or decision challenge of importance for the future
• identify relevant drivers of change
• discuss possible trends for each driver
• select critical uncertainties for the future
• create a scenario framework that explores these uncertainties and drivers
• elaborate scenario narratives that cluster these into possible futures
• undertake a quantitative analysis (if appropriate)
Guidance and Case Studies for InVEST Users | 45
Scenarios for permitting and mitigation: Cesar Department, Colombia
Cesar Department is the leading coal-producing region in Colombia. The Ministry of Environment, Mines and Territorial Development has developed a strong set of principles for offsetting the impacts of coal mining on biodiversity and habitat. This mitigation framework can also be used to avoid, minimize and offset the impacts of mining on the ecosystem services on which the people of Cesar rely.
The most important, measurable ecosystem services affected by coal mining are water quality (affected by nutrient pollution) and silt control (affected by erosion of sediments into rivers). As seen in Figure 5 (p. 46), InVEST was used to map these two services for current conditions (B), and three scenarios that represented full build out of existing permitted mines (C), full build out of mine permits currently requested (D), and full build out of all possible mining permits. These scenarios were based on existing documents and maps at the ministry.
For the two services, “servicesheds” were defined as the watershed that delivered clean, clear water to a population center. Relevant beneficiaries for offsets were identified as population centers downstream of existing, planned, and proposed mines. The amount of nutrient pollution and sedimentation expected from coal mining was calculated by subtracting the amount of water quality and silt control likely to be provided by the serviceshed after mining expansion (for each scenario) from the current amount of ecosystem services provided. Each mine was ranked according to likely environmental impact, or disruption to ecosystem services, and management activities were proposed to avoid, minimize, reduce or mitigate those impacts over time.
References: Rosenthal, Tallis et al. (In press) and Tallis and Wolny (2010)
Exploratory scenarios are inherently complex, which can make it hard to keep track of all the drivers and interactions among them and to ensure that they are internally consistent. Quantitative models can help to organize the drivers and uncertainties. Choosing a spectrum with a high- and low-end for the drivers is a way to organize the scenarios. This is one of the reasons that exploratory scenarios often involve quantitative analysis.
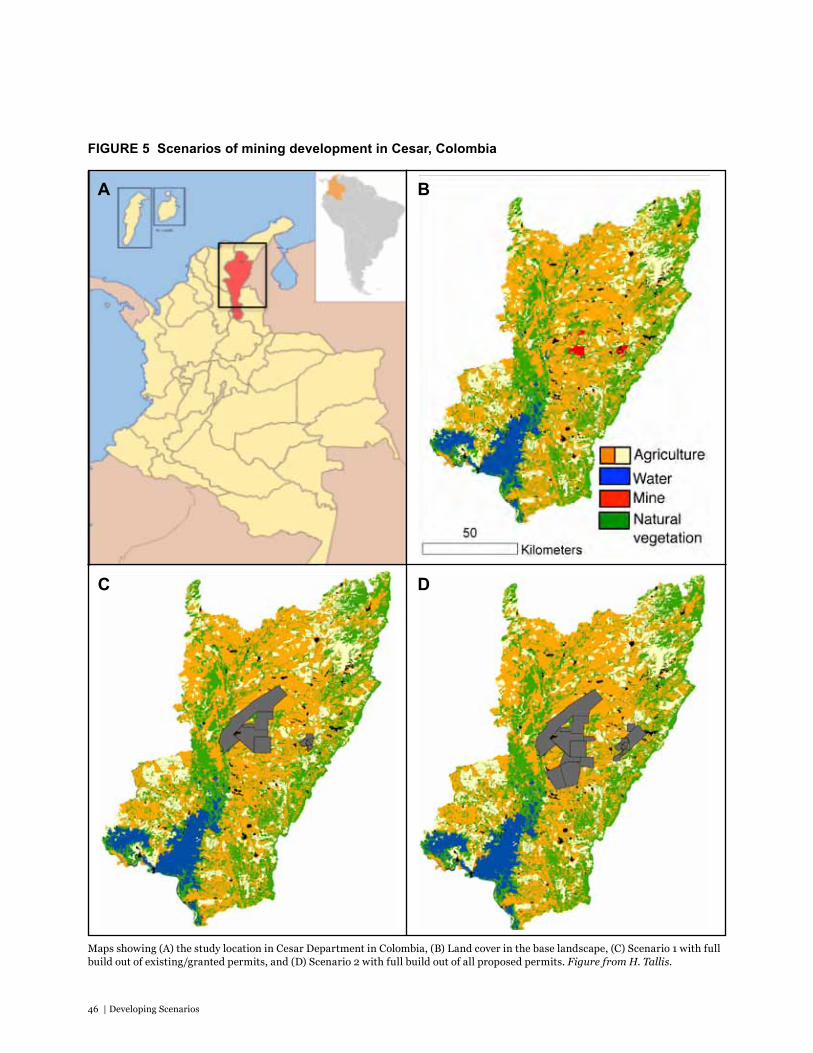
46 | Developing Scenarios
FIgURE 5 Scenarios of mining development in Cesar, Colombia
Maps showing (A) the study location in Cesar Department in Colombia, (B) Land cover in the base landscape, (C) Scenario 1 with full build out of existing/granted permits, and (D) Scenario 2 with full build out of all proposed permits. Figure from H. Tallis.
BA
DC
Guidance and Case Studies for InVEST Users | 47
5.4.3. Common methods for vision scenariosVision scenarios describe explicitly desirable or undesirable futures (Berkhout and Hertin 2002; Evans et al. 2006; Raskin et al. 2005). Visioning typically involves bringing community members or stakeholders together to share and discuss their fears, hopes, and dreams for the future and collectively formulate commonly desired scenarios. Visioning usually requires discussions among stakeholders to share goals and reach consensus (Evans, de John, and Cronkleton 2008; Evans et al. 2006). This is typically done through workshops, but can also take place through interactive websites or interviews with individual stakeholders or groups of stakeholders that share particular interests.
Common activities for vision scenarios include
• reflect on desired future and share individual visions among participants
• identify and evaluate similarities and differences between individual visions
• define one or several scenarios that integrate these individual visions
• analyze the capacities, actions and resources necessary to achieve that vision
In some cases, cultural norms and power relations in communities mean that one group or voice may dominate discussions. Alternative methods have been developed to enable equitable participation and learning in scenario development, such as meeting separately with different community groups (Rawluk and Godber 2011).
5.4.4. Common methods for future projectionsProjections are typically forecasts of what is likely or expected to happen in the future. Projections can be developed using a range of quantitative and participatory methods. If a quantitative approach is taken, a range of integrated assessment models can be used, drawing on statistical or simulation analysis of past trends to predict the future. Standard integrated assessment models generate outputs by linking demographic, economic and ecological dynamics via explicit assumptions about cause-effect connections, typically based on established trends and theoretically grounded relationships between variables. Such models are limited in their ability to incorporate complexity and indeterminacy (Berkhout and Hertin 2002) and are restricted to using knowledge that is sufficient to support meaningful quantification (Wehrmeyer, Clayton, and Lum 2002).
Simple participatory approaches can also be taken to develop future projections, where stakeholders reflect on what they expect the future would look like if current trends continue (Nemarundwe, De Jong, and Cronkleton 2003). Methods such as workshops, surveys, interviews and focus groups can help.
Common activities for developing projections include
• assess key aspects of current situation
• collect data on historical trends and/or future forecasts
• use participatory and/or quantitative methods to predict expected future change
Statistical techniques rely on access to reliable historical data. Simulation techniques rely on identifying all the relevant drivers and weighting their importance and function appropriately.
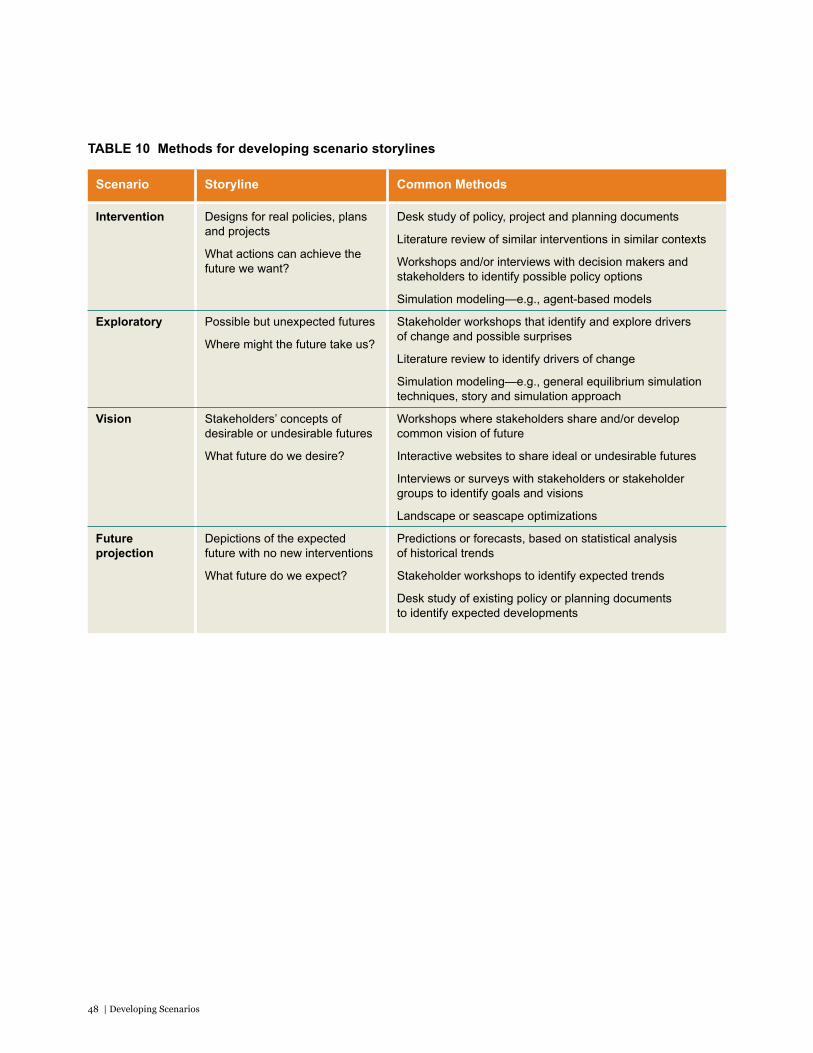
48 | Developing Scenarios
TABlE 10 Methods for developing scenario storylines
Common Methods
desk study of policy, project and planning documents
Literature review of similar interventions in similar contexts
Workshops and/or interviews with decision makers and stakeholders to identify possible policy options
Simulation modeling—e.g., agent-based models
Stakeholder workshops that identify and explore drivers of change and possible surprises
Literature review to identify drivers of change
Simulation modeling—e.g., general equilibrium simulation techniques, story and simulation approach
Workshops where stakeholders share and/or develop common vision of future
Interactive websites to share ideal or undesirable futures
Interviews or surveys with stakeholders or stakeholder groups to identify goals and visions
Landscape or seascape optimizations
Predictions or forecasts, based on statistical analysis of historical trends
Stakeholder workshops to identify expected trends
desk study of existing policy or planning documents to identify expected developments
Storyline
designs for real policies, plans and projects
What actions can achieve the future we want?
Possible but unexpected futures
Where might the future take us?
Stakeholders’ concepts of desirable or undesirable futures
What future do we desire?
depictions of the expected future with no new interventions
What future do we expect?
Scenario
Intervention
Exploratory
Vision
Future projection
Guidance and Case Studies for InVEST Users | 49
5.5. A special note on climate scenariosMany InVEST users compare the ecosystem service outcomes of climate scenarios to inform climate adaptation planning or climate mitigation policy such as forest carbon projects. This section is therefore devoted to some of the approaches available to develop climate scenarios. We refer readers to the extensive literature on climate scenarios for more information (Mearns et al. 2001).
Future climate scenarios represent how increasing greenhouse gases emitted into the atmosphere are projected to change climate patterns globally. Methods include incremental scenarios for sensitivity studies, temporal and spatial analogues, climate model-based approaches, and expert judgment.
Incremental scenarios involve changing particular climatic elements incrementally by plausible but arbitrary amounts, such as a +1, +2, +3, or +4°C change in average temperature. They are commonly applied to study the sensitivity of an ecosystem service (or other impact) to a wide range of variations in climate. They are also used to identify critical thresholds of ecosystem service response to a changing climate. However, these approaches have the drawback of not including geographically specific information about the spatial patterns of climate change.
Analogue scenarios are constructed by identifying recorded climate regimes that resemble the expected future climate in a given region. Both spatial and temporal analogues have been used in constructing climate scenarios by selecting either regions or past time periods with a climate analogous to that anticipated in the study region in the future (Williams, Jackson, and Kutzbacht 2007). Spatial analogues are often used to validate the extrapolation of impact models. It is also possible to extrapolate ongoing trends in climate that have been observed in a region and that appear to be consistent with model-based projections of climate change in that same region. Temporal analogues are useful for relating past climate variability to future climate change, particularly for extreme events (e.g., droughts, floods).
A variety of climate model-based approaches are also available for developing scenarios at different spatial scales and levels of complexity. General Circulation Models (GCMs, also known as Global Climate Models) and various simple models can produce information at the global scale. GCMs are the most advanced tools currently available for simulating the response of the global climate system to changing atmospheric composition (IPCC 2007). Global climate models are developed at very coarse spatial resolution (~200–300 km resolution), but there are several methods for bringing the models to finer spatial scales (e.g., 1–50 km) (Wood et al. 2004). These include statistical (empirical) downscaling based on historic observations of climate (Maurer et al. 2007) and regional climate models (dynamic downscaling) that run fine-scale regional climate modeling informed by the GCMs (Gutowski et al. 2010) (e.g., http://narccap.ucar.edu/).
Climate scenarios can also be developed based on expert judgments of future climate change. Often these expert estimates are sampled to obtain probability density functions of future change (Gay and Estrada 2010). Expert opinion is useful for combining the multiple aspects described above.
50 | Developing Scenarios
A few automated tools for developing climate scenarios exist. A particularly useful tool that can be employed to develop spatial climate scenarios for use with InVEST is the Climate Wizard, developed by The Nature Conservancy and partners. The Climate Wizard (climatewizard.org) provides a wide variety of statistically downscaled GCMs, and guidance on how to use them (Girvetz et al. 2009). The Climate Wizard enables users to view and download climate change maps that both reflect how climate has changed over time and project future changes—in terms of temperature, rainfall, and other climate variables—that are predicted to occur in a given area. The predictions are based on the emissions scenarios in the IPCC Fourth Assessment Report (Nakicenovic et al. 2000). The Climate Wizard does not provide climate scenarios for marine environments.
Other resources for accessing downscaled climate data include
• World Bank Climate Change Knowledge Portal (sdwebx.worldbank.org/climateportal/)
• SERVIR (servir.net/en/)
• International Centre for Tropical Agriculture Climate downscaled GCM portal (ccafs-climate.org/)
• UNDP Climate Change Country Profiles (country-profiles.geog.ox.ac.uk/).
Climate scenarios: The Colombian Amazon
Immigration and a growing population in the upper reaches of the Putumayo River in Colombia are leading to conversion of rain forest to agriculture and cattle ranching. There is growing demand for the ecosystem services that agriculture relies on, such as fertile soils, flood control, and water for irrigation. At the same time, the Upper Putumayo is beginning to experience longer and hotter dry seasons and variability in rainfall in the rainy season. These consequences of climate change are expected to increase in the future, which is likely to affect ranchers, farmers, and communities in the Amazon piedmont in Colombia.
World Wildlife Fund (WWF) in Colombia assessed ecosystem services under climate change scenarios to help natural resource agencies and communities prepare for future changes. The study aimed to evaluate the most extreme, yet feasible, future changes in climate, to inform policies related to risk and economic development. WWF used a regional climate model called PRECIS (MAE and INSMET 2008) to assess changes in precipitation and temperature through 2099. The results were put into InVEST to understand how these changes were likely to affect water supply and erosion.
First, WWF ran the PRECIS model data using two IPCC greenhouse gas emissions scenarios: the relatively moderate B2 and the more pessimistic A2. Next, WWF compared the PRECIS results to local data. Using monthly observations from the Michoacan meteorological station, WWF calculated annual averages for precipitation and temperature from 1975 to 2007. Observed contemporary trends in temperature (0.025° C annual increase) are more similar to the modeled results of B2 (0.031° C) than A2 (0.04° C);
Guidance and Case Studies for InVEST Users | 51
however, B2 showed stronger variation in precipitation than A2. The B2 emissions scenario was used for the ecosystem service analysis.
The analysis took two periods over the next century with the greatest projected rainfall (2055–2060) and the lowest (2040–2045) and compared them to current conditions, assuming land-use and management remain the same as today. The climate scenario characteristics of temperature and precipitation changes were then put into InVEST models, along with corresponding changes in the intensity of rainfall.
The results showed that during the driest period, 2040–2045, a 55 percent decrease in rainfall leads to a 40.5 tons per hectare reduction in soil erosion annually. Under the same conditions, flows in major rivers decrease by 45 percent, endangering the region’s water supply. Similarly, a 100 percent increase in rainfall during the wettest years, 2055–2060, increases yearly soil erosion by 93 tons per hectare. At the same time, flows in major rivers almost double, significantly increasing the risk of flooding in the region. The economic implications of these changes include damage to irrigation systems (by sediment accumulation), higher operation costs, crop failure and reduced harvests, and difficulty sustaining ranching operations.
WWF-Colombia is sharing these findings with local stakeholders in regional dialogues through the “conversatorio for citizen action” (Springer and Studd 2009). Their aim is to foster discussion about how conversion to silvopastoral systems, payment for ecosystem services, and other benefit-sharing mechanisms can be used to mitigate potential threats to livelihoods and enhance critical services, such as erosion control. Enhancing and restoring ecosystem services can increase resiliency in ecosystems, which can help communities adapt to the effects of climate change.
Reference: WWF-Colombia and CorpoAmazonia (2011)
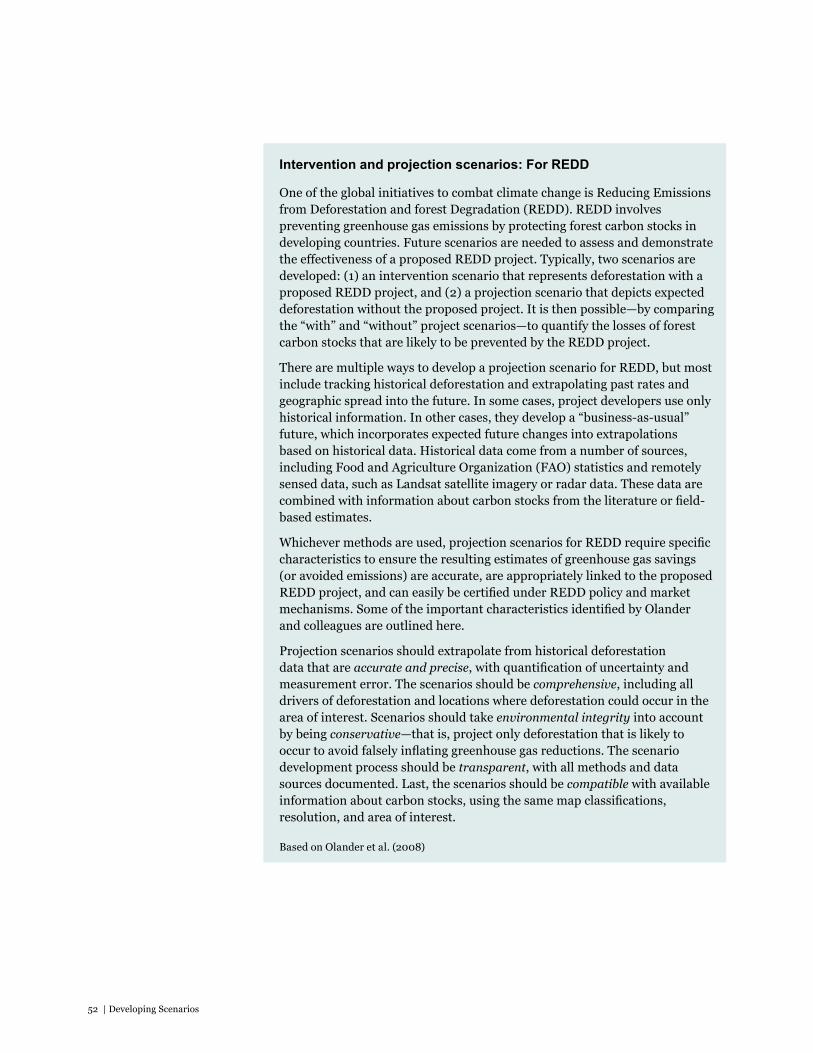
52 | Developing Scenarios
Intervention and projection scenarios: For REDD
One of the global initiatives to combat climate change is Reducing Emissions from Deforestation and forest Degradation (REDD). REDD involves preventing greenhouse gas emissions by protecting forest carbon stocks in developing countries. Future scenarios are needed to assess and demonstrate the effectiveness of a proposed REDD project. Typically, two scenarios are developed: (1) an intervention scenario that represents deforestation with a proposed REDD project, and (2) a projection scenario that depicts expected deforestation without the proposed project. It is then possible—by comparing the “with” and “without” project scenarios—to quantify the losses of forest carbon stocks that are likely to be prevented by the REDD project.
There are multiple ways to develop a projection scenario for REDD, but most include tracking historical deforestation and extrapolating past rates and geographic spread into the future. In some cases, project developers use only historical information. In other cases, they develop a “business-as-usual” future, which incorporates expected future changes into extrapolations based on historical data. Historical data come from a number of sources, including Food and Agriculture Organization (FAO) statistics and remotely sensed data, such as Landsat satellite imagery or radar data. These data are combined with information about carbon stocks from the literature or field-based estimates.
Whichever methods are used, projection scenarios for REDD require specific characteristics to ensure the resulting estimates of greenhouse gas savings (or avoided emissions) are accurate, are appropriately linked to the proposed REDD project, and can easily be certified under REDD policy and market mechanisms. Some of the important characteristics identified by Olander and colleagues are outlined here.
Projection scenarios should extrapolate from historical deforestation data that are accurate and precise, with quantification of uncertainty and measurement error. The scenarios should be comprehensive, including all drivers of deforestation and locations where deforestation could occur in the area of interest. Scenarios should take environmental integrity into account by being conservative—that is, project only deforestation that is likely to occur to avoid falsely inflating greenhouse gas reductions. The scenario development process should be transparent, with all methods and data sources documented. Last, the scenarios should be compatible with available information about carbon stocks, using the same map classifications, resolution, and area of interest.
Based on Olander et al. (2008)
Guidance and Case Studies for InVEST Users | 53
5.6. Finding and accessing dataScenario development requires data about the current situation, drivers of future change and possible futures. InVEST users have collected data using a variety of approaches, such as reviewing existing policies, programs and plans; drawing on projections created by other organizations; and collecting stakeholder input through surveys, interviews and workshops.
Most scenarios begin by understanding the current situation. Scenario development can be facilitated by collecting data and local knowledge on current marine and land uses and presenting this to stakeholders as they think about possible future changes. This may require data on land use and land cover; marine use; population and human settlements; land management; existing infrastructure such as roads, ports and dams, and political borders; land tenure; and governance (i.e., the enforcement of existing rules). Data on the current situation can often be obtained from national government agencies, international research institutions, universities, United Nations programs, stakeholders and field study. It can be hard to find information on the marine environment, particularly how the ocean space is currently used. This often requires collection of fragmented local knowledge through workshops and interviews.
To develop a projection that predicts the expected future based on past trends, it is necessary to collect historical data. Trends and drivers of interest may include changes in land and marine use and cover, infrastructure development, population and demographics, climate and weather patterns, trade, prices and governance (Bennett 2005). Historical information is often available from centers for statistics and research, planning agencies, and international agencies. Forecasts are produced by many national and international agencies and some independent research institutes, which predict changes in factors such as exchange rates, climate, agricultural yields and consumption. These forecasts often come in the form of descriptive statistics, rather than spatial allocations of land and marine uses, but can feed into some of the approaches for making scenario maps, described in Section 6.
For other scenario types, the data required depends on the context. Very simple intervention scenarios may only need information about the new policy, project or plan under consideration. More complex scenario approaches require information about drivers of change on the landscape, such as new policies, demographic change, infrastructure development, climate change, rare extreme weather events, and international markets.
Table 11 (p. 54) identifies some potential sources of information for scenario development. Many of these are global datasets of coarse resolution appropriate for multi-country assessment, first-estimates or analysis in data-sparse regions. In some places, these may be the only data available. In better-studied regions, local and regional data may be available. These can often be obtained from local universities and researchers, district governments, stakeholders, and field study. National information often can be located through planning agencies, other government ministries or departments, census bureaus, weather centers, national science councils or academies, and national space or geologic agencies. Additional information can be obtained through peer-reviewed research publications and accompanying datasets.
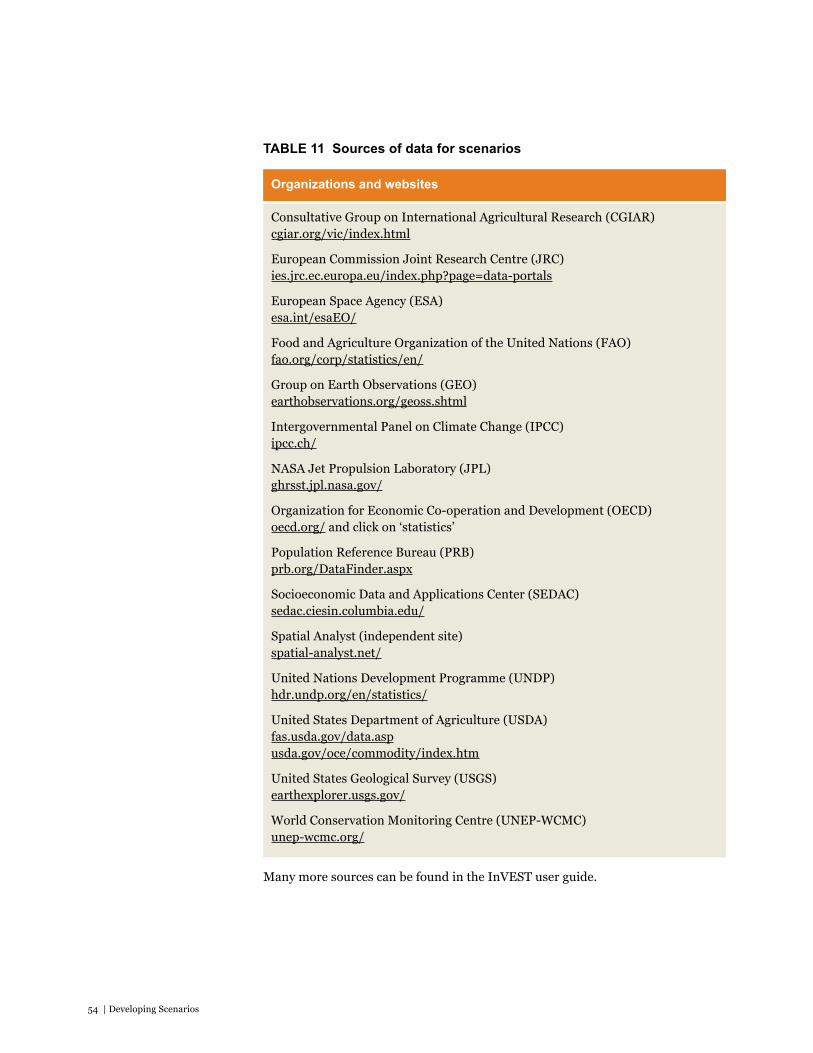
54 | Developing Scenarios
TABlE 11 Sources of data for scenarios
Consultative Group on International Agricultural Research (CGIAR)cgiar.org/vic/index.html
European Commission Joint Research Centre (JRC)ies.jrc.ec.europa.eu/index.php?page=data-portals
European Space Agency (ESA)esa.int/esaEO/
Food and Agriculture Organization of the United Nations (FAO)fao.org/corp/statistics/en/
Group on Earth Observations (GEO)earthobservations.org/geoss.shtml
Intergovernmental Panel on Climate Change (IPCC)ipcc.ch/
NASA Jet Propulsion Laboratory (JPL)ghrsst.jpl.nasa.gov/
Organization for Economic Co-operation and Development (OECD) oecd.org/ and click on ‘statistics’
Population Reference Bureau (PRB)prb.org/DataFinder.aspx
Socioeconomic Data and Applications Center (SEDAC)sedac.ciesin.columbia.edu/
Spatial Analyst (independent site)spatial-analyst.net/
United Nations Development Programme (UNDP)hdr.undp.org/en/statistics/
United States Department of Agriculture (USDA)fas.usda.gov/data.aspusda.gov/oce/commodity/index.htm
United States Geological Survey (USGS)earthexplorer.usgs.gov/
World Conservation Monitoring Centre (UNEP-WCMC)unep-wcmc.org/
Organizations and websites
Many more sources can be found in the InVEST user guide.
Guidance and Case Studies for InVEST Users | 55
local input for scenarios: Belize
The 1998 Coastal Zone Management Act established the Coastal Zone Management Authority and Institute (CZMAI) in Belize and called for the new agency to create the nation’s first national coastal zone management plan. Part of CZMAI’s mandate is to integrate stakeholder input into the national plan. Stakeholders provide input through coastal advisory committees in nine regional planning units, with representation from government, business, fishing cooperatives, and local communities. To draw out recommendations from the coastal advisory committees and the citizenry, CZMAI took several actions.
First, CZMAI participated in multiple committee meetings to establish the most critical issues for coastal zoning. Many of the issues identified were local or regional in scope, such as subsistence and commercial fishing, tourism, coastal development, and risks of inundation from tropical storms. To understand stakeholder expectations and goals for the future, CZMAI disseminated a short survey at committee meetings. Respondents identified multiple drivers of future change: climate change, real estate speculation, expansion of tourism, and declining fisheries. The survey also established that many stakeholders wished to limit development, particularly on barrier islands. It confirmed that most stakeholders relied on tourism and fishing for their livelihood.
These data helped CZMAI develop a baseline and two scenarios representing alternative coastal zoning plans. From these options, CZMAI will work with government, industry and civil society stakeholders to select a preferred marine and coastal zoning plan that provides for the current and future needs of Belizeans.
Reference: Clarke et al. (2012)
56 | Developing Scenarios
Guidance and Case Studies for InVEST Users | 57
Key messages• InVEST requires spatial scenarios, which means that scenarios must
ultimately be converted into maps of land cover and ocean and land uses. There are a number of approaches for converting scenario storylines into maps, which vary in sophistication.
• The easiest approach is to work with stakeholders to draw a map for each scenario using paper maps or digital or online mapping tools.
• A sophisticated approach is to use past experience to predict where change is most likely to occur on the landscape or seascape, using statistical methods. This requires representative reference maps from two time periods in the past, in order to determine trends and factors affecting those trends.
• Scenarios can also be made spatial using rules based on social, economic or biophysical principles that define which areas are likely to be most suitable for particular uses or activities.
InVEST requires scenarios to be depicted as maps of land cover and/or coastal and marine habitats and uses. There are a number of approaches for making scenarios spatially explicit. Here we give an overview of three types of method, which vary in complexity and resource requirements: drawing maps with stakeholders, statistical techniques and rule-based approaches.
6.1. Drawing mapsA relatively easy option is to work with stakeholders to draw maps showing where different land and marine uses and development activities would occur for each scenario. This can involve drawing lines and shapes on a paper, digital or online map. Paper maps may be more convenient in remote locations, but must eventually be translated into a Geographic Information System (GIS) by scanning and digitizing or using a digitizing board. For example, in the InVEST application in Hawaii, maps were made for each scenario by changing the land-use type for the study area on the basis of stakeholders’ views about what would occur. These choices were made within the bounds of what was practical and of interest to Kamehameha Schools and the community. A GIS expert helped to translate the paper scenario maps into digital land use/land cover GIS maps to facilitate the InVEST analysis.
If computers are available at the workshop or stakeholders have online access, collaborative map annotation tools exist that enable users to draw and save changes to an online map. For example, the Natural Capital Project has developed an online interactive mapping tool called InSEAM. This tool can be used to survey stakeholders about spatially explicit information and allows users to compare possible changes to the land or seascape. Stakeholders can add new elements to a basic Google map, such as lines, polygons and points, to signify biophysical changes or management and development activities in particular places.
6. Creating scenario maps
58 | Developing Scenarios
These elements can be tagged for one or multiple future scenarios. An explorer view makes it possible to see everything that has been added to the map for that survey. This view updates automatically as users add shapes, which can be helpful in interactive sessions with remote stakeholders. InSEAM can be customized with shapes and information that orient the user to the particular site. In the future, it will also be possible to run simplified versions of InVEST models directly on the map. You can learn more about InSEAM at naturalcapitalproject.org.
6.2. Trend analysis Based on past experience, it is possible to predict where change is most likely to occur on a land or seascape using statistical methods. These methods require at least two maps from two distinct points in time. By analyzing the change from one time point to another, it is possible to identify causal factors, determine the contribution of each factor, and model the probability of change associated with each. Collecting the relevant data and obtaining the two reference maps can be challenging. However, tools and models are available to help users do this, such as the IDRISI Land Change Modeler developed by Clark Labs (Clark Labs 2009). In the future, InVEST will be available as part of the Land Change Modeler platform.
A map of the likelihood of change on a land or seascape alone is not enough to produce a scenario map. The amount of change on the land or seascape also has to be determined. This can be done with the quantitative and qualitative approaches outlined in Section 5. An example of a quantitative approach is to draw randomly from a probability distribution for each location on the likelihood map to determine if change occurs.
6.3. Rule-based approachesIt is also possible to make scenarios spatial using a set of rules based on socioeconomic or biophysical principles that define which areas are likely to be most suitable for particular uses or activities. For example, future growth in urban areas may be strongly associated with slope suitability and population density, while future growth in agricultural land may be associated with rainfall, soil type, and irrigation and fertilizer use (McDonald, Kareiva, and Formana 2008; Baker et al. 2004; Nelson et al. 2010). These methods tend to be simpler and more transparent than general equilibrium scenario analysis (used by the Millennium Ecosystem Assessment), agent-based modeling, or statistical analyses. Focus groups of experts and decision makers can codify the socioeconomic, policy, and biophysical forces that drive land-use/land-cover (LULC) change across a region (Swetnam et al. 2011).
It is important to note that these approaches do not verify that the resulting spatial patterns of LULC change are compatible with projected global or regional demands for food, energy, and other services, or that the projected patterns of change are consistent with past behavior. Nevertheless, it is a relatively straightforward method for converting scenario storylines into LULC maps.
The rules can be developed using technical approaches such as simulation models (Landis 1994), or with focus groups of appropriate experts, decision makers and stakeholders (Swetnam et al. 2011; Baker et al. 2004). UPlan is a GIS model that allows users to specify future population levels, demographic characteristics,

Guidance and Case Studies for InVEST Users | 59
and land-use density parameters. Given these inputs, UPlan determines the area needed for each land use and then spatially allocates according to user-defined or default land-use suitability maps.
Here we walk through the rule-based approach for a hypothetical terrestrial system, drawing strongly on the experiences in Tanzania, where there was extensive stakeholder participation in developing the scenarios and rules for making them spatially explicit (Swetnam et al. 2011).
The first step is to determine the area devoted to each land use in the scenario, either through a stakeholder process or more technical approach, such as an integrated assessment model. The second step is to develop an aggregate suitability layer, which guides where land-cover change occurs based on important biophysical and socioeconomic factors. Land parcels that are most suitable have the highest probability of being converted to a different land cover in the scenario. Constraints or toggle rules can also be applied to reflect situations where parcels may be suitable, but will not be converted—e.g., if they are areas effectively protected by law. The suitability layer can be built in many different ways. The simplest—but most subjective—way is to draw on local and expert knowledge. Experts build a matrix that indicates the relative probability of land-cover transitions (see Table 12). In this matrix, users enter a number between 0 and 10, with 10 indicating the highest probability of land-cover transition from one land-cover class (by row) to another land-cover class (by column). Zero indicates no possibility of transition. The last column represents the total change expected for that land-cover type; negative percentage change indicates a transformation from that cover type to another, while a positive percentage change indicates conversion to that land cover.
Forest grassland Agriculture Shrubs Woodland Urban % change
Forest 0 6 4 2 1 1 -30
grassland 0 0 1 0 0 2 -10
Agriculture 0 0 0 0 0 0 20
Shrubs 0 0 5 0 0 1 -20
Woodland 0 0 6 1 0 1 -10
urban 0 0 0 0 0 0 5
TABlE 12 Matrix of probabilities of land-cover transitions
A suitability layer provides a first cut. However, it improves results to identify rules that affect the suitability of a land parcel to transition from one land-cover class to another. These rules need to be specific enough to be converted to spatial data. One process for developing appropriate rules involves moving from general qualitative rules (e.g., “agriculture expands where land is near a road”) to specific quantitative rules (e.g., “agriculture expands where distance to road ≤ 20km”).
60 | Developing Scenarios
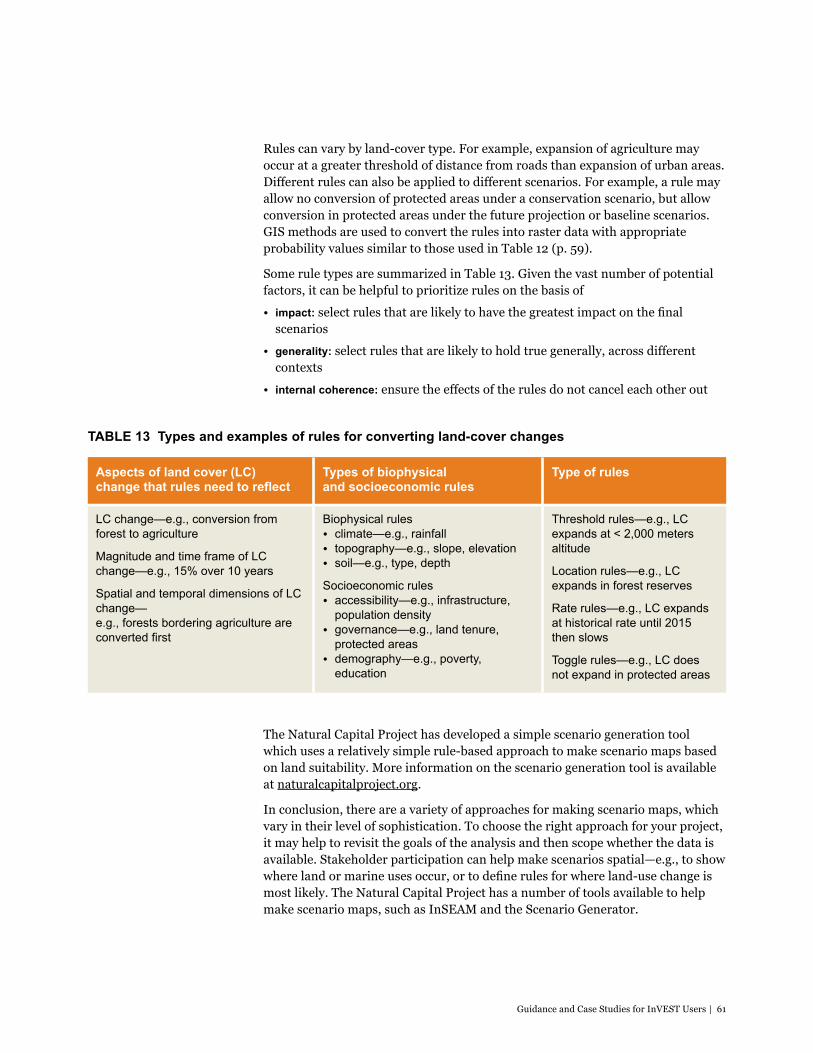
Guidance and Case Studies for InVEST Users | 61
Rules can vary by land-cover type. For example, expansion of agriculture may occur at a greater threshold of distance from roads than expansion of urban areas. Different rules can also be applied to different scenarios. For example, a rule may allow no conversion of protected areas under a conservation scenario, but allow conversion in protected areas under the future projection or baseline scenarios. GIS methods are used to convert the rules into raster data with appropriate probability values similar to those used in Table 12 (p. 59).
Some rule types are summarized in Table 13. Given the vast number of potential factors, it can be helpful to prioritize rules on the basis of
• impact: select rules that are likely to have the greatest impact on the final scenarios
• generality: select rules that are likely to hold true generally, across different contexts
• internal coherence: ensure the effects of the rules do not cancel each other out
The Natural Capital Project has developed a simple scenario generation tool which uses a relatively simple rule-based approach to make scenario maps based on land suitability. More information on the scenario generation tool is available at naturalcapitalproject.org.
In conclusion, there are a variety of approaches for making scenario maps, which vary in their level of sophistication. To choose the right approach for your project, it may help to revisit the goals of the analysis and then scope whether the data is available. Stakeholder participation can help make scenarios spatial—e.g., to show where land or marine uses occur, or to define rules for where land-use change is most likely. The Natural Capital Project has a number of tools available to help make scenario maps, such as InSEAM and the Scenario Generator.
TABlE 13 Types and examples of rules for converting land-cover changes
Type of rules
Threshold rules—e.g., LC expands at < 2,000 meters altitude
Location rules—e.g., LC expands in forest reserves
Rate rules—e.g., LC expands at historical rate until 2015 then slows
Toggle rules—e.g., LC does not expand in protected areas
Types of biophysical and socioeconomic rules
Biophysical rules• climate—e.g., rainfall • topography—e.g., slope, elevation • soil—e.g., type, depth
Socioeconomic rules• accessibility—e.g., infrastructure, population density • governance—e.g., land tenure, protected areas • demography—e.g., poverty, education
Aspects of land cover (lC) change that rules need to reflect
LC change—e.g., conversion from forest to agriculture
Magnitude and time frame of LC change—e.g., 15% over 10 years
Spatial and temporal dimensions of LC change— e.g., forests bordering agriculture are converted first

62 | Developing Scenarios

Guidance and Case Studies for InVEST Users | 63
Comparing scenarios with InVEST does not end with the production of results. To inform decisions, the InVEST results for each scenario must be actively communicated and used. This section describes case studies where scenarios were developed, ecosystem service impacts were assessed using InVEST, and the results were used to inform decisions. The case studies represent various policy contexts and scenario approaches. Each case study offers background on the policy context and goals, and then delves deeply into the experience with scenarios and draws out lessons.
7.1. Sumatra, IndonesiaEmily McKenzie, Nirmal Bhagabati, Amy Rosenthal, Thomas Barano
BackgroundIn Indonesia, the government creates land-use plans every five years that dictate which land uses are permitted, such as timber harvest, plantation development and conservation. The Indonesian government creates spatial plans at national, island, province and district scales, but influential decisions, such as the granting of plantation concessions, are increasingly devolved to the province and district level. Ten provincial governors in Sumatra committed in 2008 to “save the Sumatra ecosystem” (WWF 2008). Spatial planning was deemed a critical policy instrument to achieve this ambitious goal. When the InVEST analysis began in 2009, provinces and districts in Sumatra were beginning to develop their spatial plans.
The national government agreed to establish ecosystem-based land-use planning in Sumatra; restore critical areas to protect ecosystem services; and protect areas with high conservation value to protect ecosystem services, biodiversity, and the global climate. Despite these ambitious goals, support for sustainable spatial planning was not unanimous among the district governments. With high revenues from palm oil and timber harvest, increasing the area of land conserved had limited appeal for some districts.
Five policy programs—including market-based mechanisms that could potentially provide alternative revenues from sustainable land uses—were approved by the Indonesian national government for implementing and financing ecosystem-based spatial planning: forest carbon payments, payments and programs for watershed services, forest restoration, best management practices for forestry, and best management practices for plantations. However, there was limited understanding of whether and where such policy programs might be feasible.
7. Case Studies: Using scenarios with InVEST to make better decisions
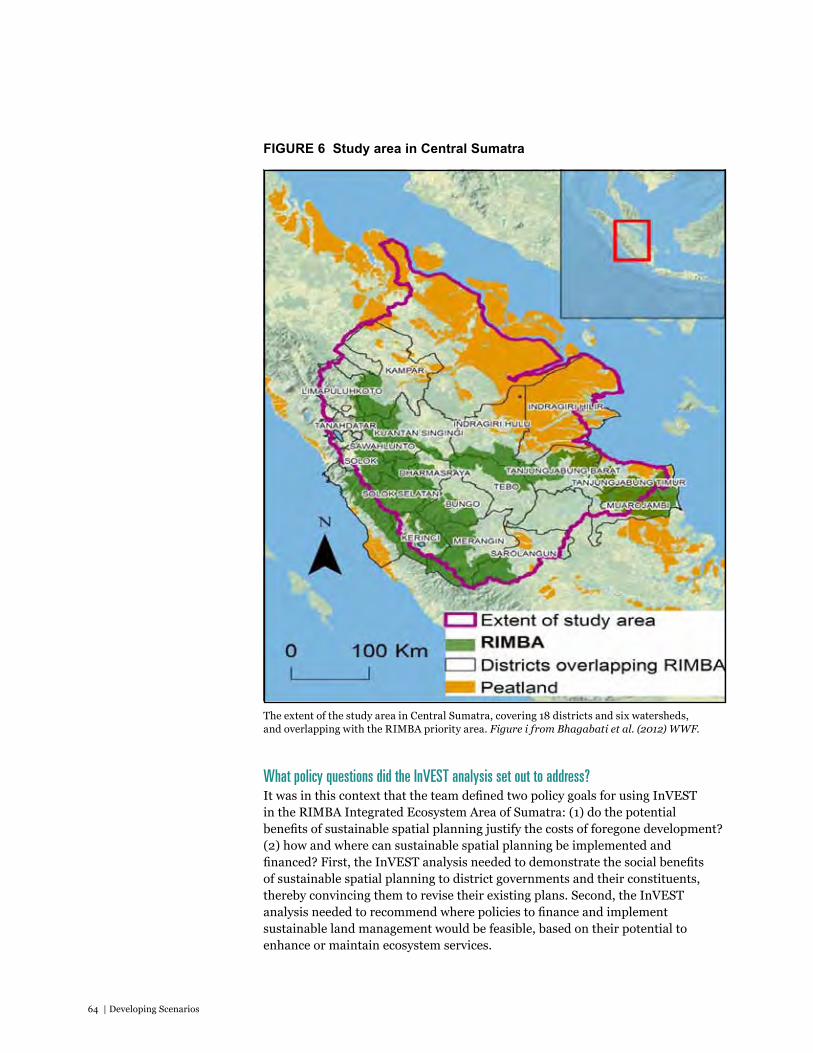
64 | Developing Scenarios
FIgURE 6 Study area in Central Sumatra
The extent of the study area in Central Sumatra, covering 18 districts and six watersheds, and overlapping with the RIMBA priority area. Figure i from Bhagabati et al. (2012) WWF.
What policy questions did the InVEST analysis set out to address?It was in this context that the team defined two policy goals for using InVEST in the RIMBA Integrated Ecosystem Area of Sumatra: (1) do the potential benefits of sustainable spatial planning justify the costs of foregone development? (2) how and where can sustainable spatial planning be implemented and financed? First, the InVEST analysis needed to demonstrate the social benefits of sustainable spatial planning to district governments and their constituents, thereby convincing them to revise their existing plans. Second, the InVEST analysis needed to recommend where policies to finance and implement sustainable land management would be feasible, based on their potential to enhance or maintain ecosystem services.

Guidance and Case Studies for InVEST Users | 65
What scenarios were selected?Scenarios were needed to highlight the implications of alternative future development trajectories on the provision of ecosystem services. At the time of the InVEST analysis, an ecosystem-based spatial plan—the Sumatra Ecosystem Vision—had already been developed by national government agencies and a coalition of NGOs and government departments called ForTRUST (Roosita et al. 2010). This vision was based on conservation priorities for species and habitats of concern. Provincial governments also had their own spatial plans which were extensions of past plans with no explicit consideration of ecosystem priorities.
Given this policy context, the study team decided to use InVEST to assess the current situation (as of 2008) and two scenarios:
• government plan: This scenario reflects the existing spatial plans of provincial governments, which are similar to past plans. Although the government plans call for some habitat restoration, most currently existing plantations will remain, expand, or convert to other non-forest use.
• Sumatra Vision: This scenario represents an ecosystem-based spatial plan for sustainable land-use, based on the Sumatra Ecosystem Vision for 2020. This Vision prioritizes habitat restoration and high value conservation areas, but includes some economic development and oil palm plantation expansion.
• Baseline: The team also assessed the current situation—using the most recent land-use/land-cover information from 2008—to provide a baseline for comparison.
Distribution of forests and plantations in 2008 (A), and under two alternative future scenarios of land use that represent the Sumatra government spatial plans (B) and the Sumatra ecosystem vision (C). Both scenarios have more forest cover than in 2008—the government plan scenario has 59% more forest area than 2008, while the vision scenario has 132% more than 2008. The increase in forests in the government plan is driven primarily by an increase in production forests, where logging and conversion can take place. Figure 1.4 in Bhagabati et al. (2012) WWF.
aaA
aaC
aaB
FIgURE 7 Forests and plantations under the current situation and two scenarios in Sumatra

66 | Developing Scenarios
How were scenarios developed?The scenarios selected for the Sumatra InVEST analysis were based on existing spatial plans and stakeholder vision maps. The scenarios did not consider exogenous drivers of land-use and land-cover change that could not be directly influenced by district governments. The scenarios also did not consider surprising or unexpected events, or climate change impacts. The scenario outputs were therefore neither narrative descriptions nor quantitative model outputs, but mapped depictions of existing policy documents. This made the process of developing scenarios relatively simple. This was, in part, a tactical decision by the study team, who had limited time and resources for scenario development.
The scenarios were selected by the study lead, who was well connected with the policy questions facing the Indonesian government at all levels and was familiar with the capacities of InVEST. There was no direct stakeholder engagement in the initial scenario development phase. However, the Sumatra Ecosystem Vision was based on a vision for the future developed by ForTRUST. The 2008 LULC map was based on interpretation by a consultant of Landsat TM images from 2007 for Riau and 2008 for Jambi and West Sumatra.
How were scenarios translated into land-cover maps? Both the government plan and the Sumatra Vision were already depicted as land-use maps following zoning designations. These maps defined what land use would be allowed to occur in any given area. This made the process of developing scenarios for input into InVEST relatively simple. All that had to be done was to translate land-use categories into appropriate land-cover classifications (i.e., the inputs required for InVEST). Roads were assumed to be the same across all three scenarios.
A workshop was held with government stakeholders to demonstrate the results of an initial InVEST analysis comparing the two scenarios. Beyond this workshop, there was no additional review of the land-cover scenarios to check that they accurately reflected the Sumatra Vision and the government plan or to ensure they made sense in the local context.
How did the scenarios shape the final results for policy makers?InVEST was used to map the amount of high-quality wildlife habitat, carbon storage and sequestration, annual water yield, erosion control, and water purification (for both nitrogen and phosphorus) provided by the two scenarios and the 2008 baseline. Maps were developed showing the difference in ecosystem services between the two scenarios, and between each scenario and 2008 (see Figure 8). These “change maps” show the gain or loss in ecosystem services or wildlife habitat quality from implementing the Sumatra Vision as compared to the government plan. Much of the analysis looked at the differences in changes from the baseline to the Sumatra Vision as compared to the changes from the baseline to the government plan.
Based on the differences in the amounts and location of ecosystem services associated with each scenario, InVEST could show which land management policies are likely to provide ecological and economic benefits, and clarify the tradeoffs of implementing the government plan as compared to the Sumatra
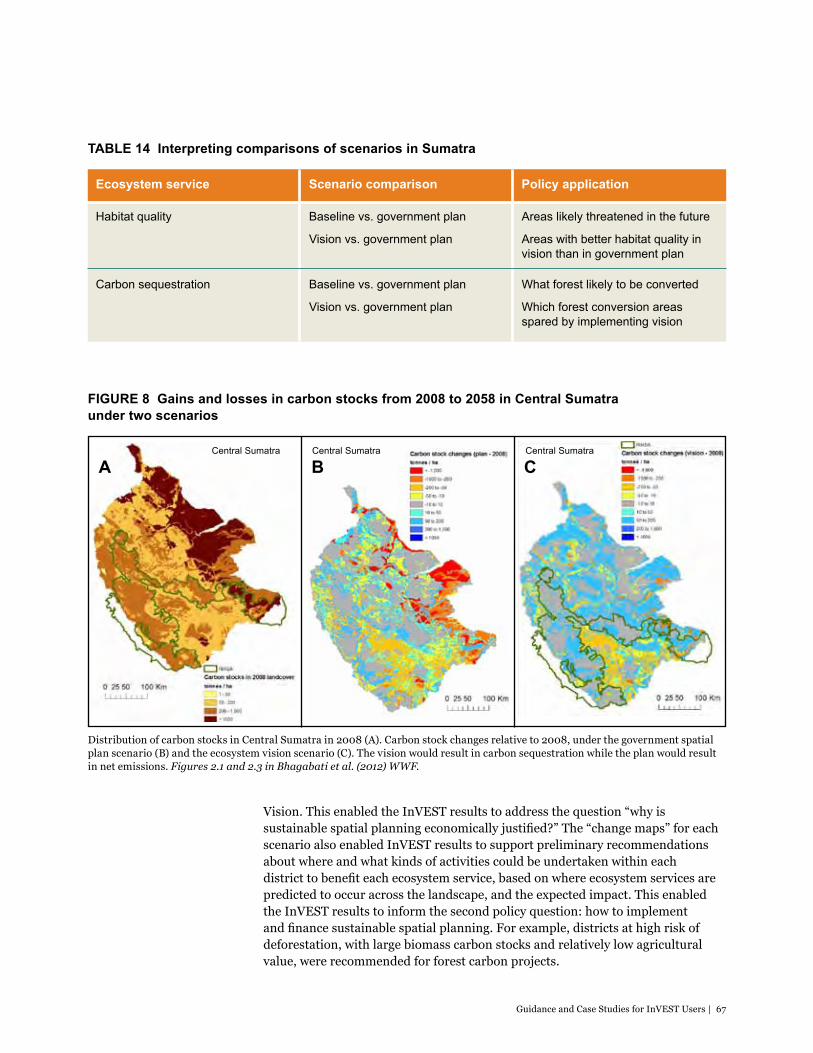
Guidance and Case Studies for InVEST Users | 67
Policy application
Areas likely threatened in the future
Areas with better habitat quality in vision than in government plan
What forest likely to be converted
Which forest conversion areas spared by implementing vision
Scenario comparison
Baseline vs. government plan
Vision vs. government plan
Baseline vs. government plan
Vision vs. government plan
Ecosystem service
Habitat quality
Carbon sequestration
aaA
aaC
aaB
Distribution of carbon stocks in Central Sumatra in 2008 (A). Carbon stock changes relative to 2008, under the government spatial plan scenario (B) and the ecosystem vision scenario (C). The vision would result in carbon sequestration while the plan would result in net emissions. Figures 2.1 and 2.3 in Bhagabati et al. (2012) WWF.
Central Sumatra Central SumatraCentral Sumatra
Vision. This enabled the InVEST results to address the question “why is sustainable spatial planning economically justified?” The “change maps” for each scenario also enabled InVEST results to support preliminary recommendations about where and what kinds of activities could be undertaken within each district to benefit each ecosystem service, based on where ecosystem services are predicted to occur across the landscape, and the expected impact. This enabled the InVEST results to inform the second policy question: how to implement and finance sustainable spatial planning. For example, districts at high risk of deforestation, with large biomass carbon stocks and relatively low agricultural value, were recommended for forest carbon projects.
TABlE 14 Interpreting comparisons of scenarios in Sumatra
FIgURE 8 gains and losses in carbon stocks from 2008 to 2058 in Central Sumatra under two scenarios
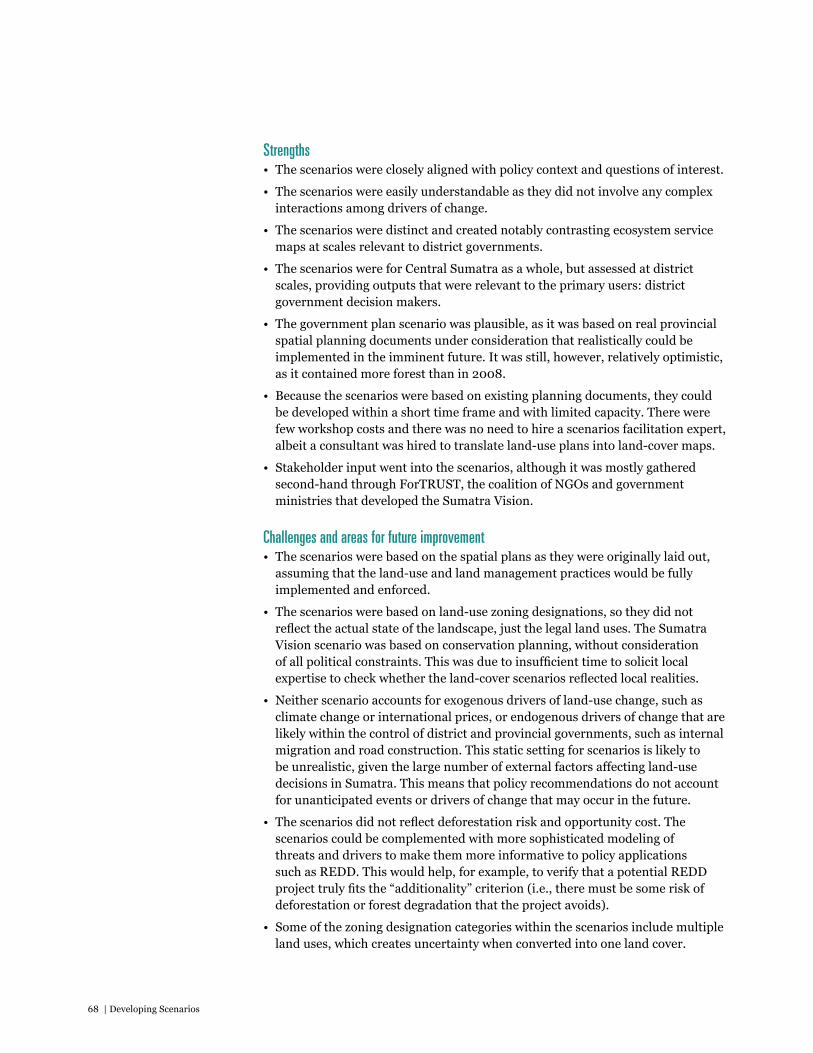
68 | Developing Scenarios
Strengths • The scenarios were closely aligned with policy context and questions of interest.
• The scenarios were easily understandable as they did not involve any complex interactions among drivers of change.
• The scenarios were distinct and created notably contrasting ecosystem service maps at scales relevant to district governments.
• The scenarios were for Central Sumatra as a whole, but assessed at district scales, providing outputs that were relevant to the primary users: district government decision makers.
• The government plan scenario was plausible, as it was based on real provincial spatial planning documents under consideration that realistically could be implemented in the imminent future. It was still, however, relatively optimistic, as it contained more forest than in 2008.
• Because the scenarios were based on existing planning documents, they could be developed within a short time frame and with limited capacity. There were few workshop costs and there was no need to hire a scenarios facilitation expert, albeit a consultant was hired to translate land-use plans into land-cover maps.
• Stakeholder input went into the scenarios, although it was mostly gathered second-hand through ForTRUST, the coalition of NGOs and government ministries that developed the Sumatra Vision.
Challenges and areas for future improvement• The scenarios were based on the spatial plans as they were originally laid out,
assuming that the land-use and land management practices would be fully implemented and enforced.
• The scenarios were based on land-use zoning designations, so they did not reflect the actual state of the landscape, just the legal land uses. The Sumatra Vision scenario was based on conservation planning, without consideration of all political constraints. This was due to insufficient time to solicit local expertise to check whether the land-cover scenarios reflected local realities.
• Neither scenario accounts for exogenous drivers of land-use change, such as climate change or international prices, or endogenous drivers of change that are likely within the control of district and provincial governments, such as internal migration and road construction. This static setting for scenarios is likely to be unrealistic, given the large number of external factors affecting land-use decisions in Sumatra. This means that policy recommendations do not account for unanticipated events or drivers of change that may occur in the future.
• The scenarios did not reflect deforestation risk and opportunity cost. The scenarios could be complemented with more sophisticated modeling of threats and drivers to make them more informative to policy applications such as REDD. This would help, for example, to verify that a potential REDD project truly fits the “additionality” criterion (i.e., there must be some risk of deforestation or forest degradation that the project avoids).
• Some of the zoning designation categories within the scenarios include multiple land uses, which creates uncertainty when converted into one land cover.
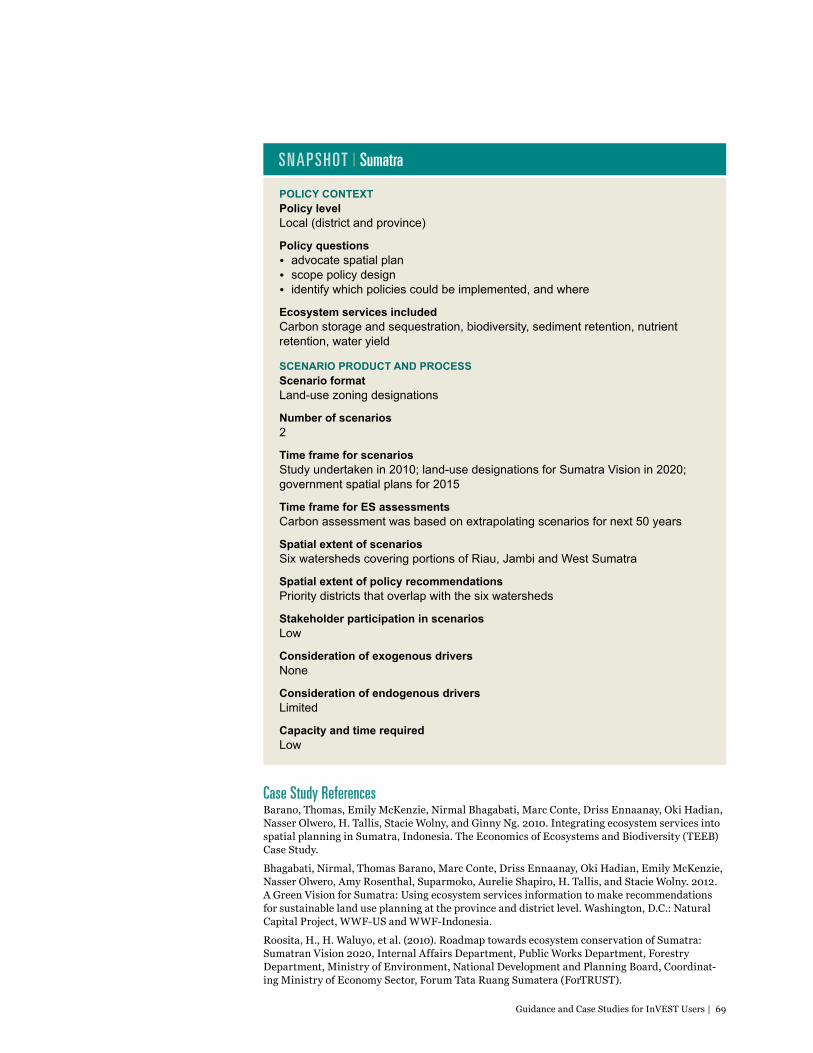
Guidance and Case Studies for InVEST Users | 69
Case Study ReferencesBarano, Thomas, Emily McKenzie, Nirmal Bhagabati, Marc Conte, Driss Ennaanay, Oki Hadian, Nasser Olwero, H. Tallis, Stacie Wolny, and Ginny Ng. 2010. Integrating ecosystem services into spatial planning in Sumatra, Indonesia. The Economics of Ecosystems and Biodiversity (TEEB) Case Study.
Bhagabati, Nirmal, Thomas Barano, Marc Conte, Driss Ennaanay, Oki Hadian, Emily McKenzie, Nasser Olwero, Amy Rosenthal, Suparmoko, Aurelie Shapiro, H. Tallis, and Stacie Wolny. 2012. A Green Vision for Sumatra: Using ecosystem services information to make recommendations for sustainable land use planning at the province and district level. Washington, D.C.: Natural Capital Project, WWF-US and WWF-Indonesia.
Roosita, H., H. Waluyo, et al. (2010). Roadmap towards ecosystem conservation of Sumatra: Sumatran Vision 2020, Internal Affairs Department, Public Works Department, Forestry Department, Ministry of Environment, National Development and Planning Board, Coordinat-ing Ministry of Economy Sector, Forum Tata Ruang Sumatera (ForTRUST).
SNAPSHOT | Sumatra
POlICy CONTExT Policy level Local (district and province)
Policy questions • advocate spatial plan• scope policy design • identify which policies could be implemented, and where
Ecosystem services includedCarbon storage and sequestration, biodiversity, sediment retention, nutrient retention, water yield
SCENARIO PRODUCT AND PROCESS Scenario format Land-use zoning designations
Number of scenarios 2
Time frame for scenariosStudy undertaken in 2010; land-use designations for Sumatra Vision in 2020; government spatial plans for 2015
Time frame for ES assessments Carbon assessment was based on extrapolating scenarios for next 50 years
Spatial extent of scenariosSix watersheds covering portions of Riau, Jambi and West Sumatra
Spatial extent of policy recommendationsPriority districts that overlap with the six watersheds
Stakeholder participation in scenariosLow
Consideration of exogenous driversNone
Consideration of endogenous driversLimited
Capacity and time requiredLow
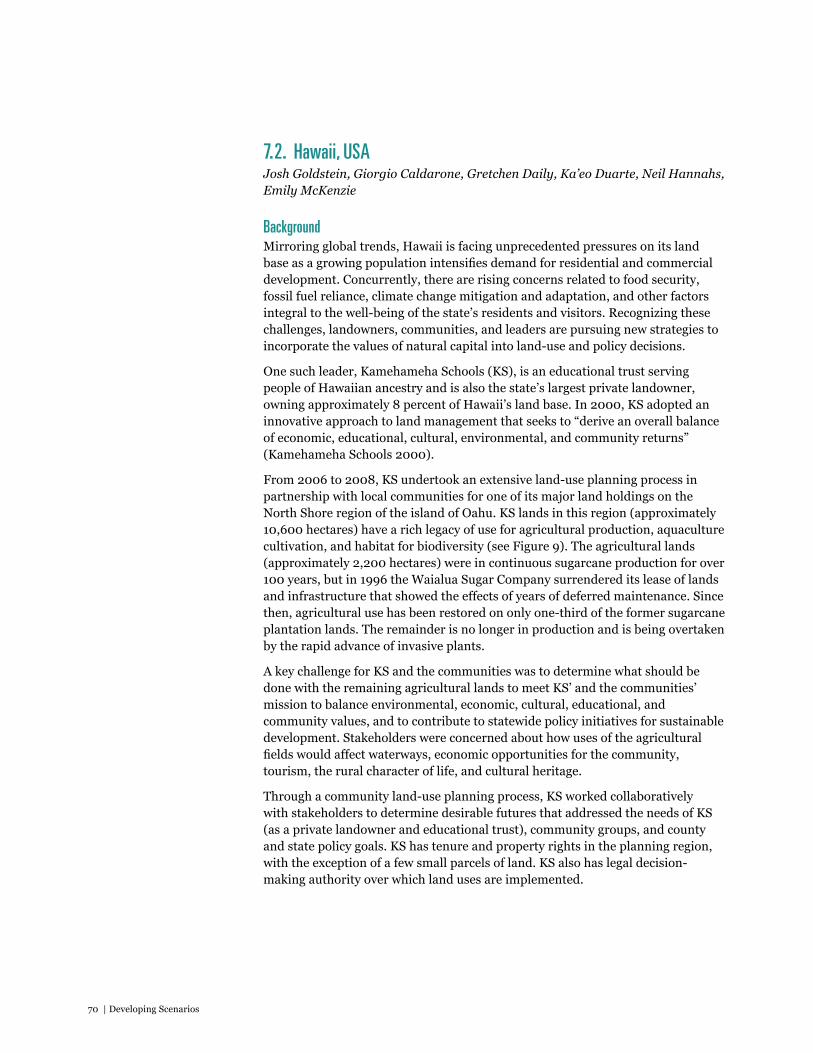
70 | Developing Scenarios
7.2. Hawaii, USAJosh Goldstein, Giorgio Caldarone, Gretchen Daily, Ka’eo Duarte, Neil Hannahs, Emily McKenzie
BackgroundMirroring global trends, Hawaii is facing unprecedented pressures on its land base as a growing population intensifies demand for residential and commercial development. Concurrently, there are rising concerns related to food security, fossil fuel reliance, climate change mitigation and adaptation, and other factors integral to the well-being of the state’s residents and visitors. Recognizing these challenges, landowners, communities, and leaders are pursuing new strategies to incorporate the values of natural capital into land-use and policy decisions.
One such leader, Kamehameha Schools (KS), is an educational trust serving people of Hawaiian ancestry and is also the state’s largest private landowner, owning approximately 8 percent of Hawaii’s land base. In 2000, KS adopted an innovative approach to land management that seeks to “derive an overall balance of economic, educational, cultural, environmental, and community returns” (Kamehameha Schools 2000).
From 2006 to 2008, KS undertook an extensive land-use planning process in partnership with local communities for one of its major land holdings on the North Shore region of the island of Oahu. KS lands in this region (approximately 10,600 hectares) have a rich legacy of use for agricultural production, aquaculture cultivation, and habitat for biodiversity (see Figure 9). The agricultural lands (approximately 2,200 hectares) were in continuous sugarcane production for over 100 years, but in 1996 the Waialua Sugar Company surrendered its lease of lands and infrastructure that showed the effects of years of deferred maintenance. Since then, agricultural use has been restored on only one-third of the former sugarcane plantation lands. The remainder is no longer in production and is being overtaken by the rapid advance of invasive plants.
A key challenge for KS and the communities was to determine what should be done with the remaining agricultural lands to meet KS’ and the communities’ mission to balance environmental, economic, cultural, educational, and community values, and to contribute to statewide policy initiatives for sustainable development. Stakeholders were concerned about how uses of the agricultural fields would affect waterways, economic opportunities for the community, tourism, the rural character of life, and cultural heritage.
Through a community land-use planning process, KS worked collaboratively with stakeholders to determine desirable futures that addressed the needs of KS (as a private landowner and educational trust), community groups, and county and state policy goals. KS has tenure and property rights in the planning region, with the exception of a few small parcels of land. KS also has legal decision-making authority over which land uses are implemented.
Guidance and Case Studies for InVEST Users | 71
Using InVEST to help assess management options for (A) a land-holding of Kamehameha Schools (Kawailoa, Oahu). This 26,000- acre (10,500 hectares) parcel has (B) prime undeveloped coastline, (C) an ancient fishpond and other important cultural assets, (D) a highly productive agricultural belt with water resources, (E) biodiverse native upland forest, and (F) commercial and residential areas. Figure 4 in Daily et al. (2009), Frontiers in Ecology and the Environment.
A B
C D
E F
FIgURE 9 Different land uses in Kawailoa, Oahu, Hawaii
72 | Developing Scenarios
What policy questions did the analysis set out to address?The aim of the InVEST application in Hawaii was to help design a land-use plan for the North Shore region of Oahu that would achieve a balance of environmental, economic, cultural, educational, and community goals, and contribute to statewide policy initiatives (Goldstein et al. In press). The analysis focused particularly on the agricultural portion of the study region and addressed two guiding questions: (1) what is the best use of the largely abandoned agricultural lands to meet the needs of the local community and those of the broader public (related particularly to policy initiatives for climate, food, and energy security), while also generating positive financial return for KS? (2) do alternative land uses result in win-win outcomes or tradeoffs for ecosystem services and financial return relative to a business-as-usual scenario? In summary, the InVEST analysis had to provide an objective, scientific framework for exploring how alternative land uses would affect ecosystem service tradeoffs—and hence KS’s goals—in different ways.
What scenarios were selected?The Hawaii study assessed the impacts on ecosystem services that would arise from a set of scenarios that represented plausible future land-use options for KS and the region. InVEST was used in the context of contrasting scenarios to demonstrate the tradeoffs of pursuing different plans and policies. Drawing on local community input to the existing land-use planning process, KS and the InVEST research team developed seven spatially explicit and contrasting scenarios. These scenarios included one future projection scenario representing the status quo, five intervention scenarios representing actual planning options, and one exploratory scenario representing an unlikely but possible future that has occurred elsewhere across the state. The scenarios were set within the context of a critical management decision facing KS regarding whether or not to allocate funds to improve the region’s aging irrigation system to sustain and enhance agricultural production or instead to pursue other options. In this context, KS had three overarching decision alternatives within which the seven scenarios were situated (see Figure 10):
No improvements to the irrigation system1. “Status Quo”: maintain current land uses into the future
2. “Pasture”: convert all fields to cattle-grazing pasture
Make improvements to the irrigation system 3. Food Crops & Forestry: use the lower irrigated fields for diversified food crops
with forestry plantings on the upper fields
4. Biofuels: return the agricultural lands to sugarcane to produce an energy feedstock
5. Food Crops & Forestry with Field Buffers: add vegetation buffers to scenario #3 to reduce nutrient and sediment runoff on fields adjacent to streams
6. Biofuels with Field Buffers: add vegetation buffers to scenario #4 to reduce nutrient and sediment runoff on fields adjacent to streams

Guidance and Case Studies for InVEST Users | 73
Sell land 7. Residential Development: sell the agricultural lands for a housing
development. While neither KS nor the community was disposed to pursue this last option, it represented a development pattern that has occurred repeatedly on former agricultural lands across the state, which motivated its inclusion in the analysis.
FIgURE 10 Spatially defined alternative scenarios in Hawaii
Land-use scenarios for the North Shore of Oahu, Hawaii, planning region. Figure in Goldstein et al. (In press) Proceedings of the National Academy of Sciences.

74 | Developing Scenarios
How were scenarios developed?KS engaged extensively with stakeholders to develop the North Shore strategic plan. Beginning in July 2006, representatives of Kamehameha Schools conducted a series of discussions with the North Shore community regarding their future desires for the lands. The community visioning and input was incorporated into the guiding vision for the plan. Stakeholder concerns and issues were considered in the development of the specific projects.
The scenarios used for the InVEST analysis were based on real opportunities and priorities for using the agricultural lands, as identified by KS and local communities through this participatory visioning and planning process. The InVEST modelers worked closely with KS to develop the scenarios based on the issues identified by stakeholders. KS picked a few options that characterized real choices in terms of how to manage the agricultural lands: biofuel feedstock (sugarcane), diversified agriculture and forestry, and grazing pasture. A residential build-out option was also considered, given that elsewhere in the state this land conversion from agriculture to residential has occurred, even though it was not supported in this planning process. The scenario developers depicted these options spatially, in close consultation with KS, to determine what each option implied in terms of land use for the agricultural region covering ~2,200 ha of the larger 10,600 ha planning region.
The scenarios were developed iteratively. An initial set of scenarios that considered a wider set of possible options was developed and presented with model outputs to KS. Feedback was used to eliminate scenarios that were deemed not useful or plausible, and also to identify scenarios for which additional options and a finer level of detail should be considered. Initially, changes across the entire 10,600 ha planning region were included in the scenarios, with a decision to focus specifically on the agricultural portion for the refined scenarios arising from discussions between KS and the InVEST modeling team. This decision was driven by the sense that InVEST was best positioned to analyze changes in this region, and also that this level of detail would be most helpful to KS.
The time frame for the scenarios was not explicitly defined, but was considered to be roughly 5 years, which was the approximate transition time required for the improvements to the irrigation system and related land-use transitions in the scenarios.
How were scenarios translated into land-cover maps?Maps were made for each scenario by changing the land-use type for each agricultural field on the basis of KS’s views about what could occur. For example, KS gave feedback to the scenario developers that under the biofuel scenario, a set of agricultural fields planted with sugarcane would receive irrigation water while others would be dependent upon precipitation. These choices were made within the bounds of what was practical and of possible interest to KS and the community.
A GIS expert helped to translate the paper map scenarios into digital GIS maps. Two GIS layers were essential in this process: first, a land-cover map from the Hawaii Gap Analysis Project that provided current land-cover types from the early 2000s, and second, a polygon shapefile provided by KS delineating

Guidance and Case Studies for InVEST Users | 75
Project members look at a map of the North Shore region during a field trip to discuss scenario development in October 2007. Photo: Josh Goldstein
the boundaries of each agricultural field. To code the scenarios, the agricultural fields were divided into three groups with each group being assigned a designated land use: (1) low elevation fields currently receiving irrigation water, (2) mid-elevation fields that could receive irrigation water if infrastructure improvements were made, and (3) upper-elevation fields that would remain dependent upon precipitation.
The scenario team worked with KS to determine what land-cover type would realistically occur in each area under each scenario they wanted to explore. This occurred through conversations between KS and the technical team, who were both developing the scenarios and running InVEST models. For example, for the biofuels scenario, the team took the current LULC layer, overlaid the three agricultural field group boundaries in GIS, and then assigned each field type a new land-cover classification (e.g., irrigated sugarcane, non-irrigated sugarcane) that reflected likely changes if biofuels were introduced as a significant part of the North Shore strategic plan. These changes were based on expert input from KS staff.
How did the scenarios shape the final results for policy makers?KS used InVEST to evaluate the impacts of each scenario for the agricultural lands on carbon sequestration and storage (to mitigate climate change), water quality (to meet current and future needs of the community), and financial return (to support KS’s educational activities).
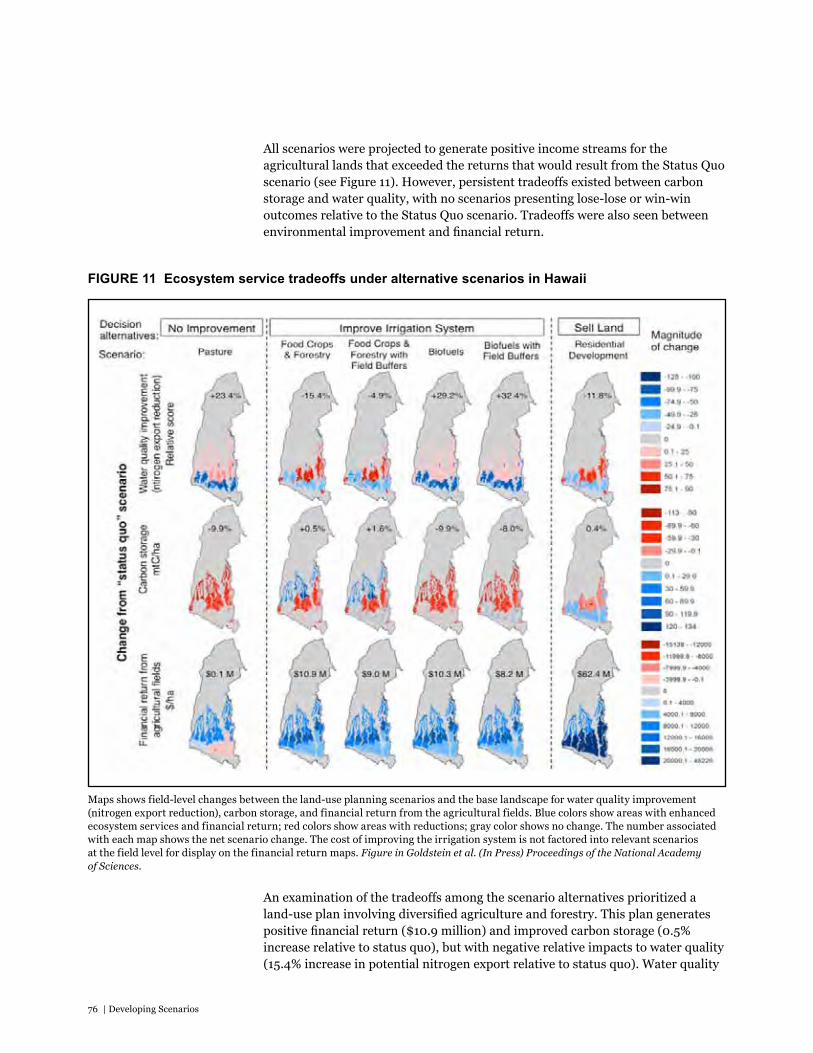
76 | Developing Scenarios
All scenarios were projected to generate positive income streams for the agricultural lands that exceeded the returns that would result from the Status Quo scenario (see Figure 11). However, persistent tradeoffs existed between carbon storage and water quality, with no scenarios presenting lose-lose or win-win outcomes relative to the Status Quo scenario. Tradeoffs were also seen between environmental improvement and financial return.
FIgURE 11 Ecosystem service tradeoffs under alternative scenarios in Hawaii
Maps shows field-level changes between the land-use planning scenarios and the base landscape for water quality improvement (nitrogen export reduction), carbon storage, and financial return from the agricultural fields. Blue colors show areas with enhanced ecosystem services and financial return; red colors show areas with reductions; gray color shows no change. The number associated with each map shows the net scenario change. The cost of improving the irrigation system is not factored into relevant scenarios at the field level for display on the financial return maps. Figure in Goldstein et al. (In Press) Proceedings of the National Academy of Sciences.
An examination of the tradeoffs among the scenario alternatives prioritized a land-use plan involving diversified agriculture and forestry. This plan generates positive financial return ($10.9 million) and improved carbon storage (0.5% increase relative to status quo), but with negative relative impacts to water quality (15.4% increase in potential nitrogen export relative to status quo). Water quality
Guidance and Case Studies for InVEST Users | 77
impacts could be partially mitigated (reduced to 4.9% increase in potential nitrogen export) by establishing vegetation buffers on agricultural fields.
Informed by the strengths and drawbacks of each alternative, KS is working with the communities to implement a mixed land-use plan to deliver the desired balance of ecosystem services, while also having potential to contribute to statewide policy initiatives for climate change mitigation, food security, and diversifying rural economic opportunities. In this context, biofuel feedstock may be incorporated along with diversified agriculture and forestry, and possibly other compatible uses. KS and the communities will be aware of the benefits and tradeoffs inherent in their decision, enabling them to mitigate negative impacts where necessary.
Strengths • Scenarios were selected on the basis of their relevance to the interests of KS
and local communities and to the impending decisions facing KS.
• The original set of scenarios included some extreme possibilities. For example, one scenario considered what would happen if all the upland forest was cut down and converted to grassland. Although this was subsequently removed from the scenario set as unrealistic, it sparked interesting discussions as a thought experiment.
• The relative simplicity of the scenarios meant they were transparent and easily understandable in terms of what was being explored and contrasted.
• The process of discussing which scenarios and ecosystem services to consider helped KS to clarify what they were trying to achieve in the planning region with their new approach to managing land assets for economic, environmental, cultural, community and educational values.
• The scenario development was not too demanding in terms of capacity, time and resources.
• Stakeholders were broadly and deeply engaged in KS’s land-use planning process, which enabled them to feed their goals and visions for the future into the scenarios. KS worked closely with the InVEST modeling team to develop plausible and relevant scenarios.
Challenges and areas for future improvement• The scenarios represented static and discrete changes, with no temporal
dynamics. It would have been valuable to consider the timing of decisions and implementation of changes to the agricultural fields explicitly, to represent how things would unfold over time in a sequence. However, this did not seem necessary for understanding the questions facing stakeholders.
• The scenarios did not consider external drivers explicitly, such as market demand and prices for sugarcane ethanol. This may have made the scenarios unrealistic or inconsistent.
• The scenarios did not have a transparent methodology for how land-uses were allocated across the landscape as a function of drivers and rules.
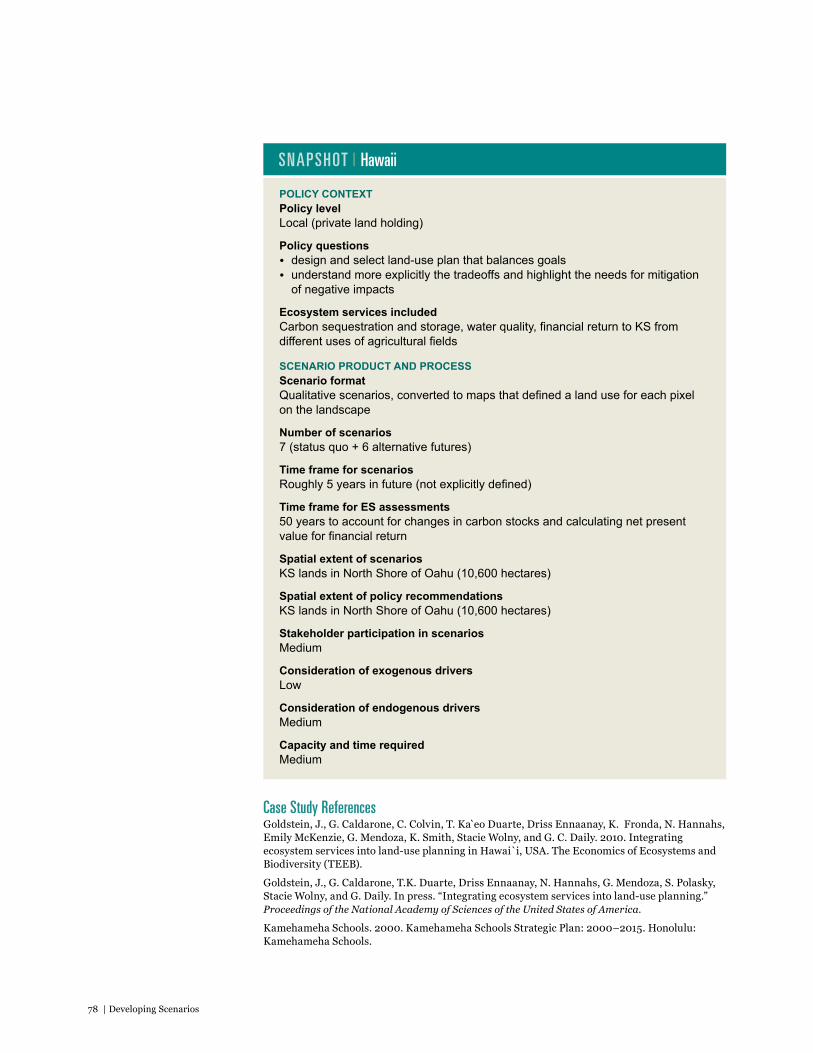
78 | Developing Scenarios
POlICy CONTExT Policy level Local (private land holding)
Policy questions • design and select land-use plan that balances goals• understand more explicitly the tradeoffs and highlight the needs for mitigation of negative impacts
Ecosystem services includedCarbon sequestration and storage, water quality, financial return to KS from different uses of agricultural fields
SCENARIO PRODUCT AND PROCESS Scenario format Qualitative scenarios, converted to maps that defined a land use for each pixel on the landscape
Number of scenarios 7 (status quo + 6 alternative futures)
Time frame for scenariosRoughly 5 years in future (not explicitly defined)
Time frame for ES assessments 50 years to account for changes in carbon stocks and calculating net present value for financial return
Spatial extent of scenariosKS lands in North Shore of Oahu (10,600 hectares)
Spatial extent of policy recommendationsKS lands in North Shore of Oahu (10,600 hectares)
Stakeholder participation in scenariosMedium
Consideration of exogenous driversLow
Consideration of endogenous driversMedium
Capacity and time requiredMedium
Case Study References Goldstein, J., G. Caldarone, C. Colvin, T. Ka eo Duarte, Driss Ennaanay, K. Fronda, N. Hannahs, Emily McKenzie, G. Mendoza, K. Smith, Stacie Wolny, and G. C. Daily. 2010. Integrating ecosystem services into land-use planning in Hawai`i, USA. The Economics of Ecosystems and Biodiversity (TEEB).
Goldstein, J., G. Caldarone, T.K. Duarte, Driss Ennaanay, N. Hannahs, G. Mendoza, S. Polasky, Stacie Wolny, and G. Daily. In press. “Integrating ecosystem services into land-use planning.” Proceedings of the National Academy of Sciences of the United States of America.
Kamehameha Schools. 2000. Kamehameha Schools Strategic Plan: 2000–2015. Honolulu: Kamehameha Schools.
SNAPSHOT | Hawaii
Guidance and Case Studies for InVEST Users | 79
7.3. Borneo, IndonesiaAndy Dean, Thomas Barano, Nirmal Bhagabati, Emily McKenzie, Anna Van Paddenburg, Amy Rosenthal, Agus Salim
BackgroundThe tropical rain forest of Borneo is one of the most important and biologically diverse ecosystems on Earth, providing natural habitats for a diverse range of species, and containing forests, rivers and watersheds that supply ecosystem services to millions of people. These resources are at risk due to rapid economic development, including unsustainable practices for mining and timber extraction, and land conversion for palm oil, pulp and paper plantations, and agriculture. Recognizing the importance of this region as a life-support system for climate, biodiversity, food and water security, and peoples’ livelihoods, the governments of Indonesia, Malaysia and Brunei Darussalam jointly committed in 2007 to sustainably manage central Borneo’s forest ecosystems. WWF supported the three governments in a transboundary “Heart of Borneo” initiative to develop a green economy, where governments, business and communities value ecosystem services, stop conversion of natural forests, reduce greenhouse gas emissions and generate equitable livelihoods. This initiative is supported by ecosystem-based spatial planning, and linked to fiscal policy and diversified and equitable incentives that reward local communities, business and governments for conservation and sustainable practices.
The three governments are implementing national action plans to make these commitments a reality. However, implementation is proving challenging. Current economic plans are not aligned with the goals for the Heart of Borneo, and do not integrate conservation or sustainable land management at the scale required. Revenues from economic sectors such as mining and palm oil are far greater than revenues from standing forests; the opportunity costs of conservation are significant, with few local incentives to implement the commitments made at the national level. Policy and finance mechanisms that reward provision of ecosystem services—such as carbon sequestration, reduced carbon emissions and payments for watershed protection—are emerging, but not yet at sufficient scale. A shift in the economy to ensure equitable growth, reduce poverty, and support environmental sustainability is critical.
WWF and its partners carried out a climate, ecosystem and economic assessment using InVEST and other software and modeling tools to highlight the role of the Heart of Borneo in a green economy (Van Paddenburg et al. 2012).
What policy questions did the InVEST analysis set out to address?The two main goals for using InVEST were (1) to demonstrate how investing in natural capital supports sustainable economic growth and a prosperous society, and (2) to identify where sustainable finance mechanisms for ecosystem services may be feasible. To achieve these goals, InVEST was used to map several ecosystem services, assessing service values where possible, and identifying where services originated and were used.
80 | Developing Scenarios
What scenarios were selected?The team developed two scenarios for Kalimantan (the Indonesian area of the island of Borneo) that represent business as usual and a green economy:
• Business as usual (BAU): This scenario represents the next 20 years, assuming development follows its current trajectory, with weak governance and no financial incentives for sustainable development.
• green Economy (gE): This scenario represents the next 20 years, assuming implementation of a spatial plan proposed to establish the Heart of Borneo as a Strategic National Area (KSN),4 reform of tax laws, improved policies and legislation, strong law enforcement, adoption of environmental standards, and performance-based incentives. A green economy is defined as one that recognizes the value of natural capital, reflected in local actions.
How were scenarios developed?The scenarios were developed using a combination of a spatially explicit land-use and cover change (LUCC) model and information on land-use plans and permits. This approach aimed to combine information on historical trends in land-cover change with available spatial planning data.
IDRISI Land Change Modeler (LCM)—an integrated software application for land change analysis and prediction (Clark Labs, 2011)—was used to predict land cover based on past change observed between 2000 and 2009. Predictive modeling of future scenarios based on historical data was deemed to be appropriate for Kalimantan because significant land-cover change is occurring that does not adhere to the zones designated in government spatial plans. This scenario approach contrasts with the approach used in the Sumatra case study, where the scenarios reflected the spatial plans developed by government and a coalition of NGOs, without considering how drivers of land use might create futures that differ from those plans. However, because of the complexity of land-cover change in Kalimantan, IDRISI LCM was limited to modeling change in natural forest.
For the business-as-usual scenario, the team ran IDRISI LCM, predicting future forest cover based on historical drivers of land-cover change between 2000 and 2009. Additional drivers included existing roads, fire distribution, slope, elevation, and settlement. Some constraints were introduced that reflect the possibility of specific land uses (see Table 15). Spatial data on plans for mining, palm oil, and forestry were also integrated.
The green economy scenario also reflected predicted change based on historical change in land cover between 2000 and 2009, but there were additional constraints (see Table 16, p. 82). The rules increased protection of areas with high biodiversity, carbon stocks, and watersheds. This assumed that under the green economy scenario there would be improved governance, adherence to spatial plans and implementation of sustainable finance mechanisms.
4 KSN refers to regulation, under presidential decree, to protect the Heart of Borneo Strategic National Area for its natural capital value. A spatial plan is in development to guide conservation and development efforts in this area.
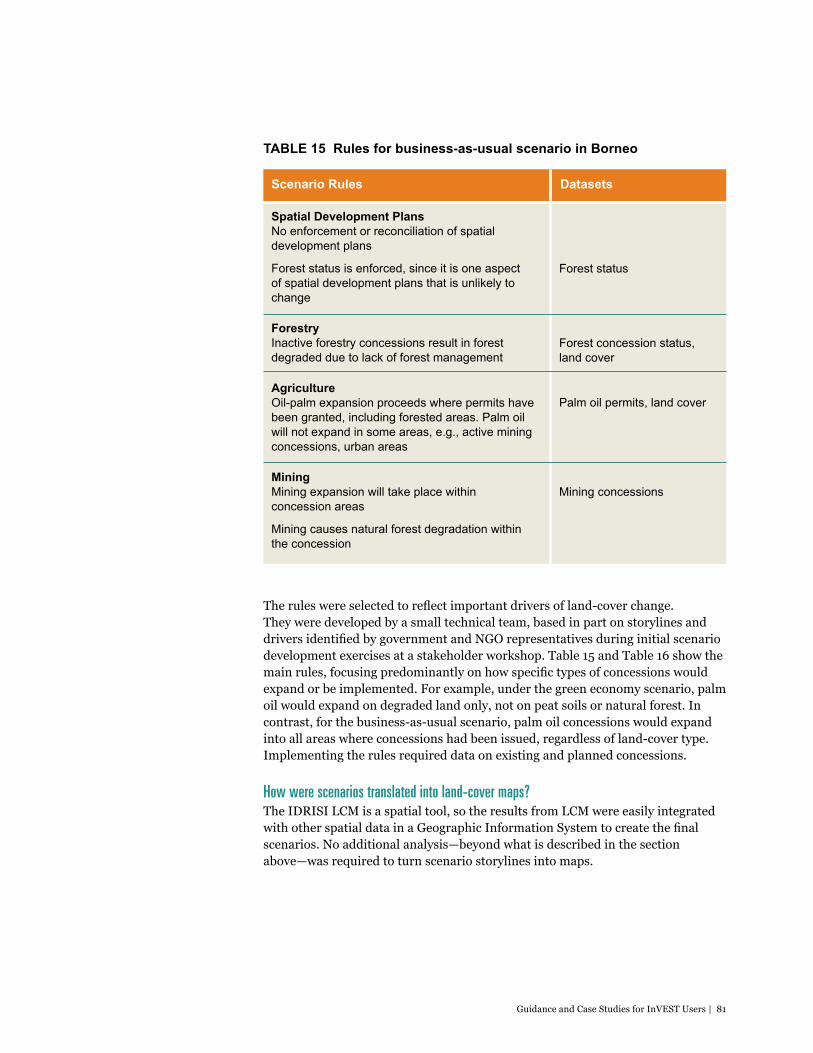
Guidance and Case Studies for InVEST Users | 81
Scenario Rules
Forest status
Datasets
Spatial Development PlansNo enforcement or reconciliation of spatial development plans
Forest status is enforced, since it is one aspect of spatial development plans that is unlikely to change
ForestryInactive forestry concessions result in forest degraded due to lack of forest management
AgricultureOil-palm expansion proceeds where permits have been granted, including forested areas. Palm oil will not expand in some areas, e.g., active mining concessions, urban areas
MiningMining expansion will take place within concession areas
Mining causes natural forest degradation within the concession
Forest concession status, land cover
Palm oil permits, land cover
Mining concessions
The rules were selected to reflect important drivers of land-cover change. They were developed by a small technical team, based in part on storylines and drivers identified by government and NGO representatives during initial scenario development exercises at a stakeholder workshop. Table 15 and Table 16 show the main rules, focusing predominantly on how specific types of concessions would expand or be implemented. For example, under the green economy scenario, palm oil would expand on degraded land only, not on peat soils or natural forest. In contrast, for the business-as-usual scenario, palm oil concessions would expand into all areas where concessions had been issued, regardless of land-cover type. Implementing the rules required data on existing and planned concessions.
How were scenarios translated into land-cover maps?The IDRISI LCM is a spatial tool, so the results from LCM were easily integrated with other spatial data in a Geographic Information System to create the final scenarios. No additional analysis—beyond what is described in the section above—was required to turn scenario storylines into maps.
TABlE 15 Rules for business-as-usual scenario in Borneo
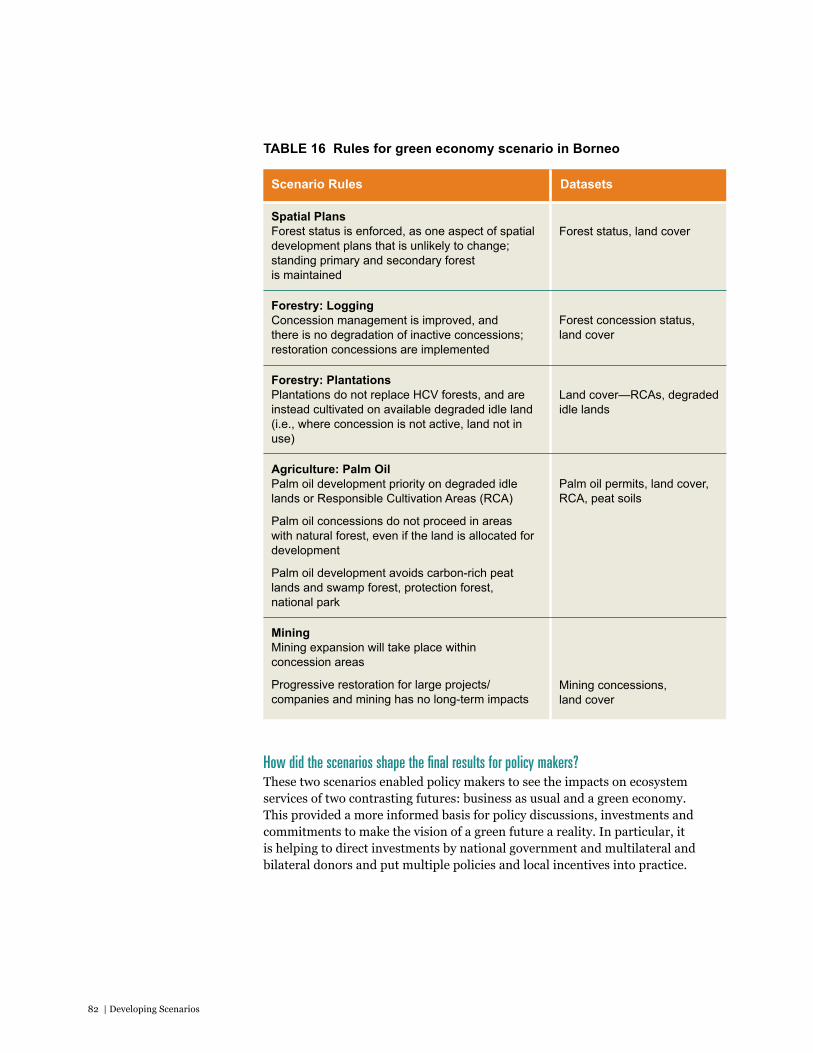
82 | Developing Scenarios
How did the scenarios shape the final results for policy makers?These two scenarios enabled policy makers to see the impacts on ecosystem services of two contrasting futures: business as usual and a green economy. This provided a more informed basis for policy discussions, investments and commitments to make the vision of a green future a reality. In particular, it is helping to direct investments by national government and multilateral and bilateral donors and put multiple policies and local incentives into practice.
Scenario Rules
Forest status, land cover
Datasets
Spatial PlansForest status is enforced, as one aspect of spatial development plans that is unlikely to change; standing primary and secondary forest is maintained
Forestry: loggingConcession management is improved, and there is no degradation of inactive concessions; restoration concessions are implemented
Forestry: PlantationsPlantations do not replace HCV forests, and are instead cultivated on available degraded idle land (i.e., where concession is not active, land not in use)
Agriculture: Palm OilPalm oil development priority on degraded idle lands or Responsible Cultivation Areas (RCA)
Palm oil concessions do not proceed in areas with natural forest, even if the land is allocated for development
Palm oil development avoids carbon-rich peat lands and swamp forest, protection forest, national park
MiningMining expansion will take place within concession areas
Progressive restoration for large projects/companies and mining has no long-term impacts
Forest concession status, land cover
Land cover—RCAs, degraded idle lands
Palm oil permits, land cover, RCA, peat soils
Mining concessions, land cover
TABlE 16 Rules for green economy scenario in Borneo
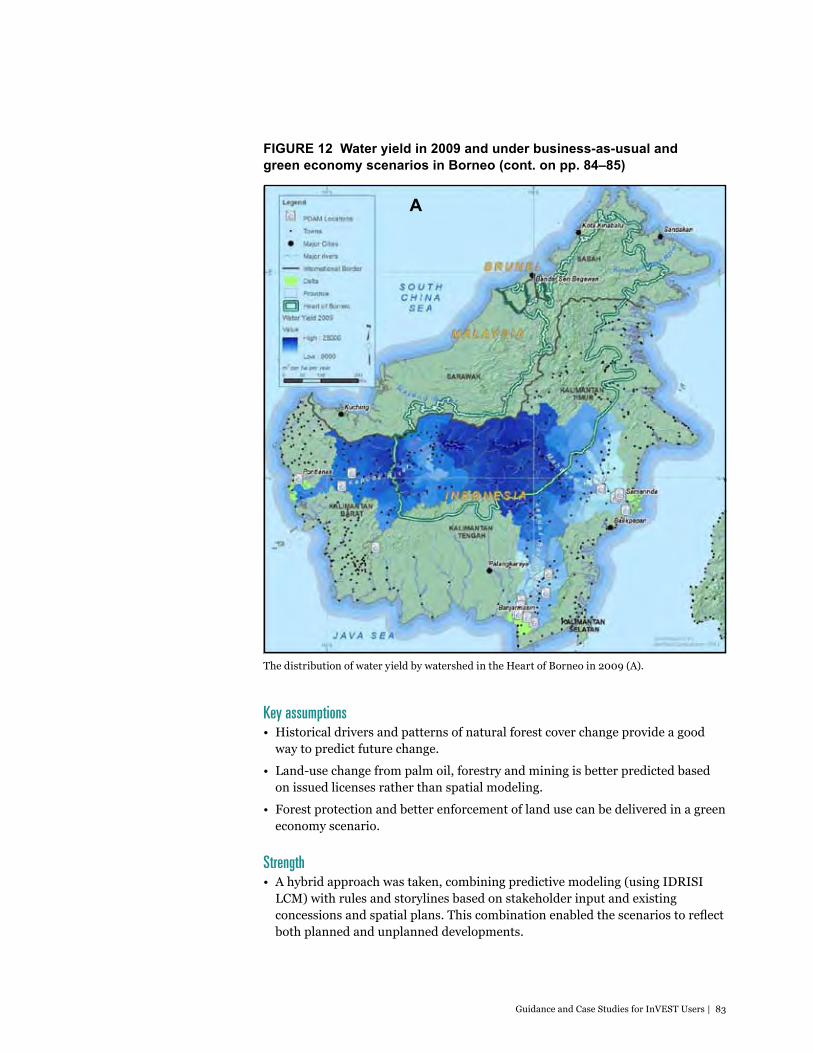
Guidance and Case Studies for InVEST Users | 83
A
Key assumptions• Historical drivers and patterns of natural forest cover change provide a good
way to predict future change.
• Land-use change from palm oil, forestry and mining is better predicted based on issued licenses rather than spatial modeling.
• Forest protection and better enforcement of land use can be delivered in a green economy scenario.
Strength• A hybrid approach was taken, combining predictive modeling (using IDRISI
LCM) with rules and storylines based on stakeholder input and existing concessions and spatial plans. This combination enabled the scenarios to reflect both planned and unplanned developments.
FIgURE 12 Water yield in 2009 and under business-as-usual and green economy scenarios in Borneo (cont. on pp. 84–85)
The distribution of water yield by watershed in the Heart of Borneo in 2009 (A).

84 | Developing Scenarios
B
Challenges and areas for future improvement• The team found using IDRISI LCM with many different land-cover classes led
to a complicated analysis, with many different land-cover transitions. This led the team to focus only on transitions between primary and secondary forest, including degradation of primary forests to secondary forest. With more time, the team would also like to predict transitions between additional land-cover types, such as secondary and non-forest.
• In Kalimantan most of the suitable lowland forest areas have been converted. Therefore, the difference between scenarios may not appear to be dramatic at this scale. However, at a more local scale there are important areas of natural forest that are protected under a green economy scenario. InVEST analysis showed how these areas can result in significant differences in ecosystem service provision.
The change in water yield relative to 2009 under the business-as-usual scenarios (B).
FIg. 12, cont.

Guidance and Case Studies for InVEST Users | 85
The change in water yield relative to 2009 under the green economy scenario (C). From WWF et al. (In Press).
C
• Inconsistent input data caused problems for spatial modeling. For example, impossible transitions between land-cover classes occurred, such as secondary returning to primary forest within 9 years. This was resolved by checking the consistency of past and current land-cover data used in the scenario analysis.
• The team found that IDRISI LCM works best with few land-cover datasets whereas InVEST gives more nuanced results with a rich set of land-cover categories and the capability to iteratively model and compare land-cover changes. The combination of LCM analysis and spatial plan data provided good inputs for InVEST.
• It proved difficult to efficiently model in LCM or InVEST how incentives could alter behavior. The team attempted to do this with the Threshold 21 economic model (Bassi and Baer 2009).
FIg. 12, cont.
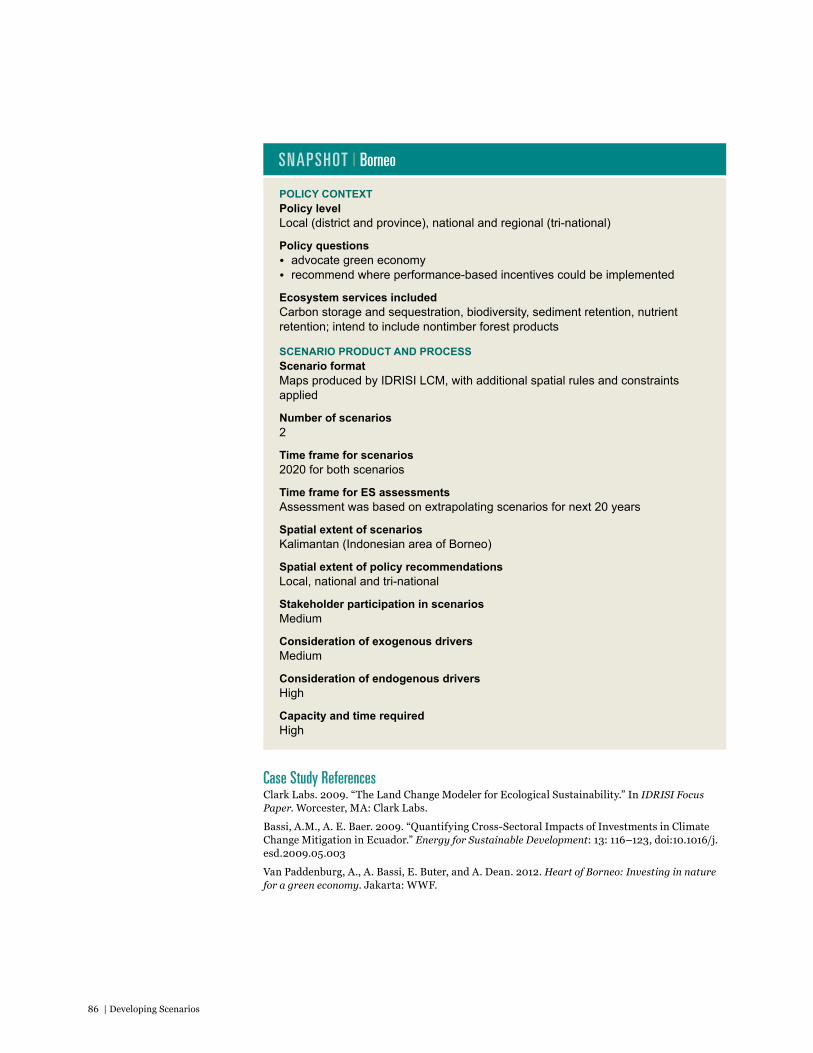
86 | Developing Scenarios
POlICy CONTExT Policy level Local (district and province), national and regional (tri-national)
Policy questions • advocate green economy• recommend where performance-based incentives could be implemented
Ecosystem services includedCarbon storage and sequestration, biodiversity, sediment retention, nutrient retention; intend to include nontimber forest products
SCENARIO PRODUCT AND PROCESS Scenario format Maps produced by IdRISI LCM, with additional spatial rules and constraints applied
Number of scenarios 2
Time frame for scenarios2020 for both scenarios
Time frame for ES assessments Assessment was based on extrapolating scenarios for next 20 years
Spatial extent of scenariosKalimantan (Indonesian area of Borneo)
Spatial extent of policy recommendationsLocal, national and tri-national
Stakeholder participation in scenariosMedium
Consideration of exogenous driversMedium
Consideration of endogenous driversHigh
Capacity and time requiredHigh
SNAPSHOT | Borneo
Case Study ReferencesClark Labs. 2009. “The Land Change Modeler for Ecological Sustainability.” In IDRISI Focus Paper. Worcester, MA: Clark Labs.
Bassi, A.M., A. E. Baer. 2009. “Quantifying Cross-Sectoral Impacts of Investments in Climate Change Mitigation in Ecuador.” Energy for Sustainable Development: 13: 116–123, doi:10.1016/j.esd.2009.05.003
Van Paddenburg, A., A. Bassi, E. Buter, and A. Dean. 2012. Heart of Borneo: Investing in nature for a green economy. Jakarta: WWF.
Guidance and Case Studies for InVEST Users | 87
7.4. Eastern Arc Mountains, Tanzania Brendan Fisher, Ruth Swetnam, Neil Burgess, Emily McKenzie, Simon Willcock
BackgroundOne of the richest areas in the world for biological diversity is the Eastern Arc Mountains, which harbor around 100 vertebrate species and at least 550 plant species found nowhere else. However, arguments based on biodiversity alone have failed to halt the conversion of Eastern Arc forests to farmland: Less than 30 percent of the original forest now remains, almost all within protected areas of various kinds.
The mountains provide benefits to people too—water regulation for farming purposes, water flow for hydroelectric power generation, and water for domestic and industrial use by almost 4 million users in Dar es Salaam. Other services derived from the forest include fuelwood, food, medicine, timber and building poles for nearby villagers, and carbon storage and sequestration for the global community. In 2007, a 5-year research program called Valuing the Arc was established to research the value of these ecosystem services, and thereby strengthen the case for conservation of the Eastern Arc Mountains. This major endeavor involved over 30 researchers in Tanzania, the UK and the U.S., and aimed to demonstrate the true contribution of ecosystems in the Eastern Arc Mountains to the Tanzanian economy and society, and integrate these values into important decisions and support novel policy solutions.
While this research was under way, Tanzania was selected as a pilot country under the UN-REDD (Reducing Emissions from Deforestation and forest Degradation) pilot program and the bilateral Norwegian government support for REDD readiness work, and the Tanzanian government was therefore involved in a variety of activities to prepare for REDD. These included building capacity and developing a national strategy for REDD, in the expectation that REDD would be included in the UN Framework Convention on Climate Change.
Tanzania also experimented with equitable payments for watershed services (PWS) with pilot feasibility studies in the Pangani and Rufiji water basins, and one operational project in the Uluguru Mountains that was established by WWF and CARE. The Eastern Arc Mountains provide drinking water for at least 60 percent of the urban population of Tanzania. The mountains are also the source for more than 90 percent of the nation’s hydroelectricity generation capacity (which constitutes half of total power production) (Burgess et al. 2007).
Within the Uluguru mountain block, poor farming practices and conversion of forest to farmland were leading to heavy sediment loading and turbidity of feeder streams leading into the main river, affecting water treatment costs of industries and utilities downstream (Zahabu, Malimbwi, and Ngaga 2005). The PWS project aimed to create incentives to conserve and improve the reliable flow and quality of water downstream, and at the same time improve the quality of life of rural poor communities. As Valuing the Arc conducted their research, there was interest in scaling up PWS schemes to additional water catchments.
Across developed and developing countries, governments are striving to improve the integration of policies across ministries and departments. Such is the case
88 | Developing Scenarios
in Tanzania. The Valuing the Arc research program used the ecosystem service framework to show how different sectors affect—and depend on—the achievement of goals in other sectors. For example, the delivery of freshwater depends on the regulation capacity of upland forests and woodlands. Therefore an integrated approach to policy and project implementation is required, involving both forestry and water sectors.
What policy questions did the analysis set out to address?The mapping of ecosystem services in the Eastern Arc Mountains was designed to meet both research and policy goals. In terms of research, the program aimed to develop cutting-edge ecosystem service analytical methods and develop new insights on the contribution of ecosystem services to a range of beneficiaries—from the global community to poor, local, rural communities. At the broadest policy scale, the program aimed to demonstrate to policy makers in Tanzania the value of ecosystem services and thereby strengthen support for conservation where the benefits outweighed the costs.
More specifically, the project aimed to provide information needed for scaling up market mechanisms to maintain ecosystem services, answering policy questions such as: “Where are REDD pilots most likely to be economically viable compared with other land-use choices?” and “Where does conservation make the most sense in terms of the net social benefits and costs across a range of services and land uses?” Valuing the Arc also aimed to demonstrate the practicality of mapping ecosystem services in a region with moderate data availability and with emerging capacity for GIS-based mapping and modeling approaches.
What scenarios were selected?Scenarios were developed to shed light on how land-use change due to socioeconomic factors affected ecosystem service delivery. These socioeconomic factors were pinned to the level of success of the implementation of various national policies or changes in such policies.
The scenario development process created a framework for exploring how driving factors—such as policy shifts and their attendant socioeconomic effects (e.g., population growth)—might change in the future. The Tanzania study team built scenarios that represented possible futures that were grounded in policy and practical realities in Tanzania and looked plausible to stakeholders.
The study team assessed ecosystem services under three scenarios:• Matazamio Mazuri (Hopeful Expectations): This scenario reflects an optimistic
vision of the future, where Tanzania meets all its stated policy goals to alleviate poverty and manage natural resources sustainably. REDD policies and payments for watershed services are successfully implemented. The population continues to grow, but more slowly, and exogenous economic pressures continue.
• Kama Kawaida (Business as Usual): This scenario represents stakeholders’ expectations of the future in Tanzania if current policy and practice continue. REDD is not implemented at any meaningful scale. There is a growing population and ongoing resource exploitation, leading to environmental degradation and declining family income.
Guidance and Case Studies for InVEST Users | 89
• Sideswipe Scenario: The team also developed a scenario sideswipe that explored the possibility of an agricultural land grab, following a recent trend in Africa. In this scenario the area of agricultural land expands dramatically. This scenario was developed outside of the participatory process, but in response to priority “what if...?” questions presented by decision makers.
How were scenarios developed?Valuing the Arc researchers broke new ground by developing a process to move from narrative scenario storylines to quantitative, spatially explicit scenario maps that described the direction and magnitude of land-cover change (Swetnam et al. 2011). The entire process involved extensive stakeholder input and participation through a policy review, interviews, and workshops (Fisher 2008).
Scenario development was led and facilitated by a social science team with some expertise in scenario development. First, current sectoral and national policies and strategies were reviewed, such as the agriculture strategy, tourism strategy, the Mkukuta Poverty Reduction Strategy Papers, and the Tanzania Vision 2025. This review highlighted the sectors, interventions and policy goals that are likely to interact directly with ecosystem services in the Eastern Arc Mountains. Relevant sectors included agriculture, water, livestock, tourism, health, forestry, transport and energy.
Semi-structured interviews were conducted with government, academic and NGO representatives. The first round of interviews helped researchers gain an understanding of current trends, key policies and interventions, and perceptions of the major impediments to, and environmental impacts of, growth in different sectors. The interviews also helped to draw together a commonly shared vision for Tanzania’s future.
A participatory workshop was then held to develop a first draft of the scenarios. Participants came from government ministries, universities and NGOs. Stakeholders gave their perspectives on the state, trends, opportunities and challenges facing relevant sectors. They also shared insights on the drivers of change in Tanzania, clarifying important linkages among development, the state of the Eastern Arc Mountains, and the ecosystem services they provide.
The workshop included exercises to elucidate the impacts of, and interactions among, sectors, policies and ecosystem services. Stakeholders situated each sector along axes of economic importance and environmental impact, and assessed how this might change over the next 25 years under a business-as-usual and an ecologically optimistic trajectory. Participants were also asked to list policies, interventions, opportunities and threats that might drive these trajectories.
For example, the forestry sector was assessed as currently having little negative impact on the environment and as being of limited economic importance. Under a business-as-usual trajectory, the group listed informal logging activities and low monitoring capacity as threats to forestry. Under an optimistic trajectory, the group saw the growth of a regulated carbon market and adequate funding for PWS schemes as opportunities to improve both the biophysical state of the forests and their economic importance.
90 | Developing Scenarios
On the basis of information and stakeholder input gleaned from the policy review, interviews and the first workshop, qualitative narrative scenario storylines were developed. These scenarios were then sent back to workshop participants for review and comment. A second round of interviews were undertaken to test the plausibility and utility of the draft scenarios. One of the original storylines (representing a situation of low economic growth and high environmental sustainability) was subsequently rejected, as it was not deemed to be relevant, realistic or useful by many stakeholders.
A second workshop was held a year after the first, to revise and build consensus on the final scenarios. A major part of this workshop involved translating the qualitative narrative storylines into quantitative changes in different land-cover classes expected under each scenario. Stakeholders ranked the impacts of particular drivers on land-cover inputs needed for the ecosystem service models. The direction and magnitude of the land-cover impacts were ranked.
For example, the group assessed how population is likely to affect forest cover, and how markets for biofuels are likely to affect agricultural lands. To simplify the process, the 30 land-cover classes were combined into six categories. Two separate groups undertook the process, and there was minimal disagreement across them. The interactions were then checked for consistency.
The participants then considered how these trends could impact land cover across the region and helped to construct simple diagrams which captured the current and future state of land cover and contained information on the flows between classes (see Figure 13).
How were scenarios translated into land-cover maps?Once the team had quantitative impacts on land cover for each scenario, the next step was to determine where these changes might happen across the landscape (Swetnam et al. 2011). The research team—with stakeholder input from the second workshop—constructed rules for each land-cover group to govern where changes could occur. These included both biophysical rules, based on factors such as soil type or climate variables, and socioeconomic rules, based on factors such as the administrative region or population level.
The workshop facilitator questioned the participants to make general rules more specific and quantitative. For example, participants clarified that land was targeted for agricultural expansion based on climate suitability and the proximity of transport infrastructure. Expert knowledge, existing data and literature reviews were used to define a specific, quantitative rule: agricultural land increases where rainfall is at least 800 mm yr and closest to current transportation routes. This process was repeated to move from qualitative to quantitatively expressed rules. Each time, participants started with a broad qualitative statement. Participants then developed more specific quantitative rules, facilitated by questions from the modelers who needed to implement the rule. In many cases, participants could not provide exact values but instead gave general guidance that could be checked in the published literature later—e.g., the minimum rainfall value for sorghum/maize/wheat.

Guidance and Case Studies for InVEST Users | 91
FIgURE 13 Interactions among sectors and land-cover change under an optimistic scenario in Tanzania
Expected land cover transitions under the Matazamio Mazuri scenario, with the top line of boxes showing the distribution of the main land-cover groups in 2000 and the bottom the estimated situation in 2025. Bold arrows between classes show those compo-nents which have remained unchanged; dashed arrows indicate fluxes between classes. Figure 2 in Swetnam et al. (2011) Journal of Environmental Management.
Each land-cover group had its own associated set of rules. These were then coded into the Geographic Information System (GIS) by combining different digital datasets. The final map for each land-cover group only contained those areas which met all the conditions specified in the rules (these were termed “spatial masks,” and there was one for each land-cover group). Agricultural expansion was deemed to be the most important driver of land-cover change in the region and as a consequence it attracted the most attention. The rules for agriculture are summarized in Table 17 (p. 92).
A second stage of refinement was then undertaken. The spatial masks were graded, with each cell assigned a weight based on accessibility to the main market of Dar es Salaam; accessibility to the nearest navigable road; accessibility to existing agriculture; and climatic suitability for the land-cover class under consideration. Cells with a high weighting were targeted first for land-cover change.
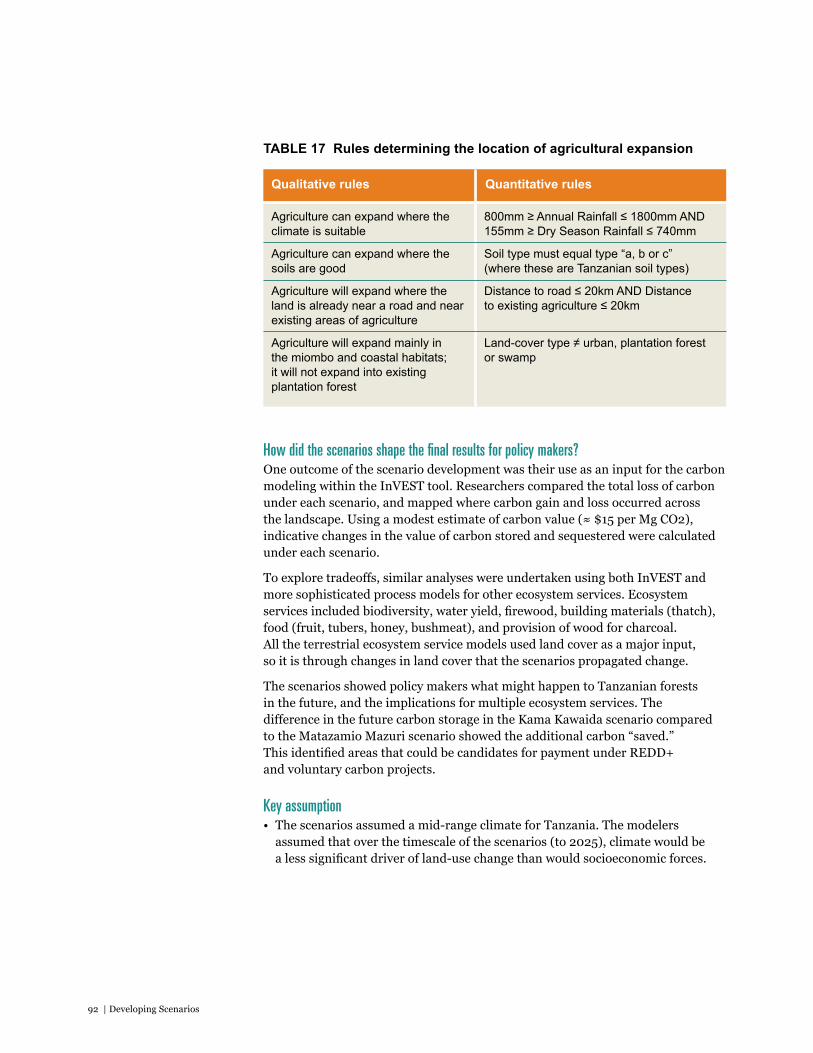
92 | Developing Scenarios
Qualitative rules
800mm ≥ Annual Rainfall ≤ 1800mm AND 155mm ≥ Dry Season Rainfall ≤ 740mm
Soil type must equal type “a, b or c” (where these are Tanzanian soil types)
Distance to road ≤ 20km AND Distance to existing agriculture ≤ 20km
Land-cover type ≠ urban, plantation forest or swamp
Quantitative rules
Agriculture can expand where the climate is suitable
Agriculture can expand where the soils are good
Agriculture will expand where the land is already near a road and near existing areas of agriculture
Agriculture will expand mainly in the miombo and coastal habitats; it will not expand into existing plantation forest
TABlE 17 Rules determining the location of agricultural expansion
How did the scenarios shape the final results for policy makers?One outcome of the scenario development was their use as an input for the carbon modeling within the InVEST tool. Researchers compared the total loss of carbon under each scenario, and mapped where carbon gain and loss occurred across the landscape. Using a modest estimate of carbon value (≈ $15 per Mg CO2), indicative changes in the value of carbon stored and sequestered were calculated under each scenario.
To explore tradeoffs, similar analyses were undertaken using both InVEST and more sophisticated process models for other ecosystem services. Ecosystem services included biodiversity, water yield, firewood, building materials (thatch), food (fruit, tubers, honey, bushmeat), and provision of wood for charcoal. All the terrestrial ecosystem service models used land cover as a major input, so it is through changes in land cover that the scenarios propagated change.
The scenarios showed policy makers what might happen to Tanzanian forests in the future, and the implications for multiple ecosystem services. The difference in the future carbon storage in the Kama Kawaida scenario compared to the Matazamio Mazuri scenario showed the additional carbon “saved.” This identified areas that could be candidates for payment under REDD+ and voluntary carbon projects.
Key assumption• The scenarios assumed a mid-range climate for Tanzania. The modelers
assumed that over the timescale of the scenarios (to 2025), climate would be a less significant driver of land-use change than would socioeconomic forces.
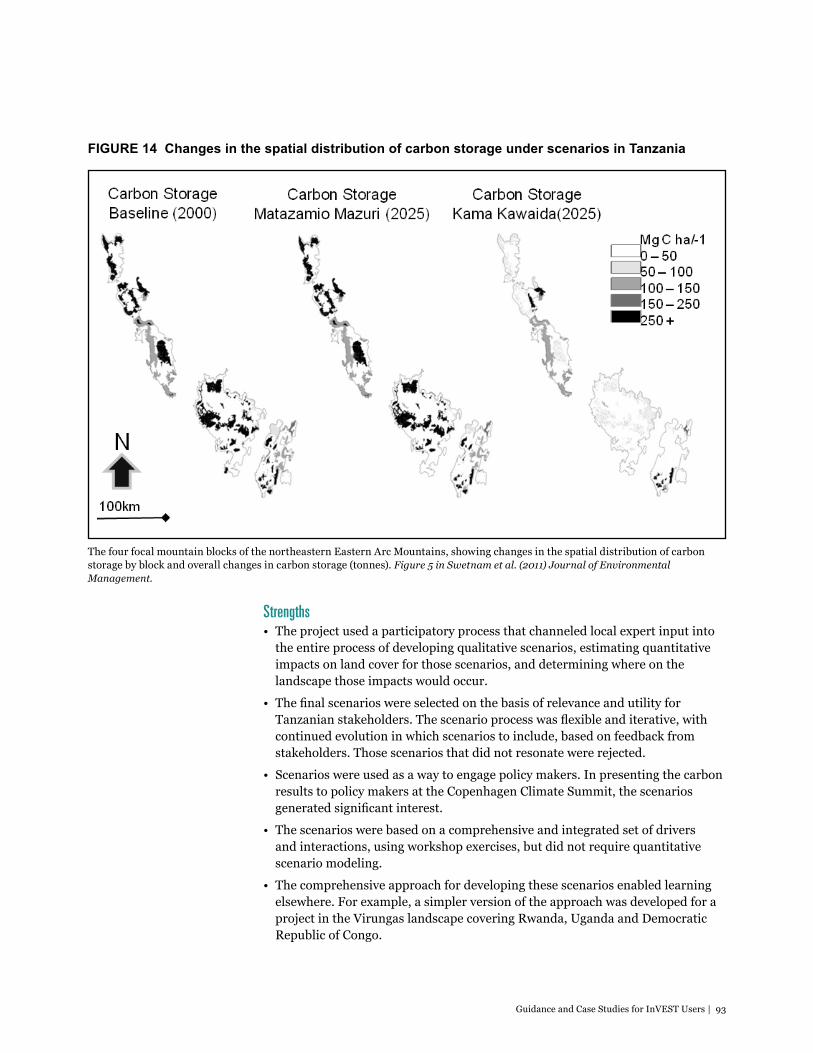
Guidance and Case Studies for InVEST Users | 93
FIgURE 14 Changes in the spatial distribution of carbon storage under scenarios in Tanzania
The four focal mountain blocks of the northeastern Eastern Arc Mountains, showing changes in the spatial distribution of carbon storage by block and overall changes in carbon storage (tonnes). Figure 5 in Swetnam et al. (2011) Journal of Environmental Management.
Strengths • The project used a participatory process that channeled local expert input into
the entire process of developing qualitative scenarios, estimating quantitative impacts on land cover for those scenarios, and determining where on the landscape those impacts would occur.
• The final scenarios were selected on the basis of relevance and utility for Tanzanian stakeholders. The scenario process was flexible and iterative, with continued evolution in which scenarios to include, based on feedback from stakeholders. Those scenarios that did not resonate were rejected.
• Scenarios were used as a way to engage policy makers. In presenting the carbon results to policy makers at the Copenhagen Climate Summit, the scenarios generated significant interest.
• The scenarios were based on a comprehensive and integrated set of drivers and interactions, using workshop exercises, but did not require quantitative scenario modeling.
• The comprehensive approach for developing these scenarios enabled learning elsewhere. For example, a simpler version of the approach was developed for a project in the Virungas landscape covering Rwanda, Uganda and Democratic Republic of Congo.
94 | Developing Scenarios
Challenges and areas for future improvement• The scenarios were highly detailed and parameterized, because they considered
a large number of interactions among drivers, sectors, policies and land-cover impacts. This may have made them too complex to be transparent to policy makers.
• The scenarios captured changes in the quantity of each land cover under each scenario, but not changes to the condition of land cover.
• The process required considerable time, capacity and expertise. The total staff time was approximately one year, devoted full-time. This was split between two staff members, who ran the interviews and workshops, and undertook the modeling. Developing the qualitative scenarios required an understanding of macroeconomics and policy, along with facilitation, data collection, literature review and interview skills. Translating the scenarios into land-cover maps demanded a high level of GIS, data management and spatial modeling skills. Funding was needed to cover the costs of workshops.
• Many people seized on the scenario maps as definitive results, and focused on the details of a relatively small area they knew well. Researchers emphasized that the scenarios were depictions of uncertain futures at broad scales—more important in terms of relative gains and losses—and should be interpreted as such.
• The study team initially intended to use downscaled global scenarios based on the Special Report on Emissions Scenarios published by the IPCC, and on the global scenarios developed to assess future trends in ecosystem services published by the Millennium Ecosystem Assessment. However, Tanzanian stakeholders felt these scenarios, and the drivers and policy levers embodied within them, were not relevant to Tanzania. The scenarios were reframed to fit their interests and needs. The new scenarios were not downscaled global scenarios, but based on local information on Tanzanian drivers and policy.
• Data availability was a challenge, with few digital data sources of sufficient quality and scale, and many inconsistencies across sources. The biggest challenges related to information on soils and agricultural capacity. Key datasets, such as settlement and road data, had to be created from disparate sources or digitized afresh. Interviews, grey literature, peer-reviewed literature, and government policies were cross-checked to obtain reliable estimates of key statistics.
• It did not prove feasible to integrate climate change and socioeconomic scenarios in the same modeling approach. As they interact, this presented a complicated modeling and conceptual challenge.
Case Study ReferencesBurgess, N. D., T. M. Butynski, N. J. Cordeiro, N. H. Doggart, J. Fjeldså, K. M. Howell, F. B. Kilahama, S. P. Loader, J. C. Lovett, B. Mbilinyi, M. Menegon, D. C. Moyer, E. Nashanda, A. Perkin, F. Rovero, W. T. Stanley, and S. N. Stuart. 2007. “The biological importance of the Eastern Arc Mountains of Tanzania and Kenya.” Biological Conservation no. 134 (2):209–231.
Fisher, Brendan. 2008. Developing scenarios for Valuing the Arc. In Valuing the Arc Workshop Report. Dar es Salaam, Tanzania.
Swetnam, R., B. Fisher, B.P. Mbilinyi, P.K.T. Munishi, S. Willcokc, T. Ricketts, S. Mwakalila, A. Balmford, N.D. Burgess, A.R. Marshall, and S.L. Lewis. 2011. “Mapping socio-economic
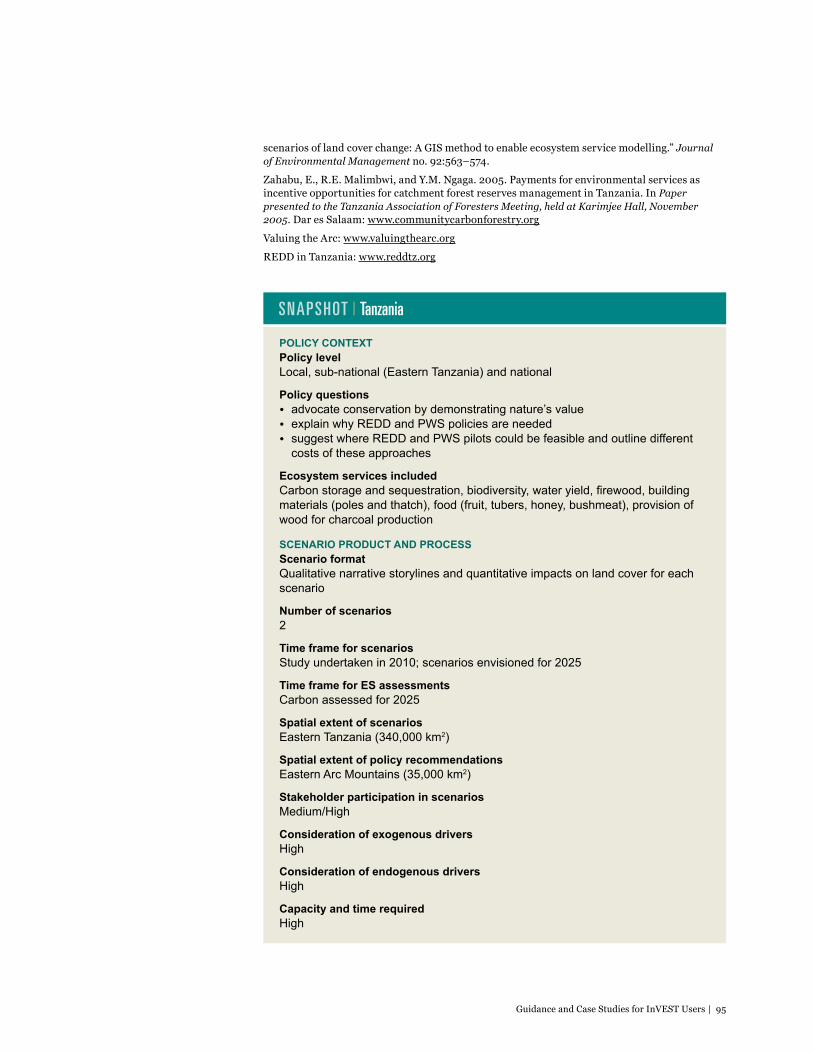
Guidance and Case Studies for InVEST Users | 95
POlICy CONTExT Policy level Local, sub-national (eastern Tanzania) and national
Policy questions • advocate conservation by demonstrating nature’s value• explain why Redd and PWS policies are needed• suggest where Redd and PWS pilots could be feasible and outline different costs of these approaches
Ecosystem services includedCarbon storage and sequestration, biodiversity, water yield, firewood, building materials (poles and thatch), food (fruit, tubers, honey, bushmeat), provision of wood for charcoal production
SCENARIO PRODUCT AND PROCESS Scenario format Qualitative narrative storylines and quantitative impacts on land cover for each scenario
Number of scenarios 2
Time frame for scenariosStudy undertaken in 2010; scenarios envisioned for 2025
Time frame for ES assessments Carbon assessed for 2025
Spatial extent of scenarioseastern Tanzania (340,000 km2)
Spatial extent of policy recommendationseastern Arc Mountains (35,000 km2)
Stakeholder participation in scenariosMedium/High
Consideration of exogenous driversHigh
Consideration of endogenous driversHigh
Capacity and time requiredHigh
scenarios of land cover change: A GIS method to enable ecosystem service modelling.” Journal of Environmental Management no. 92:563–574.
Zahabu, E., R.E. Malimbwi, and Y.M. Ngaga. 2005. Payments for environmental services as incentive opportunities for catchment forest reserves management in Tanzania. In Paper presented to the Tanzania Association of Foresters Meeting, held at Karimjee Hall, November 2005. Dar es Salaam: www.communitycarbonforestry.org
Valuing the Arc: www.valuingthearc.org
REDD in Tanzania: www.reddtz.org
SNAPSHOT | Tanzania
96 | Developing Scenarios
7.5. Oregon, USAEmily McKenzie, Dave Hulse, Erik Nelson
Acknowledgment: This case study describes scenario development undertaken by the Pacific Northwest Ecosystem Research consortium, including the U.S. Environmental Protection Agency, Oregon State University and the University of Oregon. The scenario maps were later used by researchers at the Natural Capital Project who applied InVEST to assess ecosystem services under each scenario. The Natural Capital Project was not involved in the scenario development process described here.
BackgroundThe Willamette River drains an area of nearly 30,000 km2 between the Cascade and Coast Range mountains in western Oregon in the United States. It contains a rich variety of native fish and fauna and several threatened or endangered species, such as the northern spotted owl. Sixty-eight percent of Oregon’s population lives in the Willamette River Basin. By 2050, this population is expected to double, creating challenges for land- and water-use planning.
In the mid-1990s, the governor of Oregon initiated several planning efforts to create an integrated strategy for development and conservation in the basin. First, the Willamette Valley Livability Forum was set up to develop and promote a shared vision for enhancing the livability of the river basin. Second, the Willamette Restoration Initiative was established to develop a strategy to protect and restore fish and wildlife habitat, increase populations of declining species, enhance water quality, and properly manage flood-plain areas.
Oregon has strong land-use planning and a history of conservation policies. However, at the time of this project, stakeholders had divergent views on the best approach to policy and planning. Some believed that greater natural resource protection and restoration was warranted to counteract loss of biodiversity. Other stakeholders felt that current land- and water-use policies were too restrictive, infringing unnecessarily on individual property rights.
What policy questions did the analysis set out to address?The aim of the scenarios was to inform the vision and restoration strategy being developed by the community for land and water use in the Willamette River Basin. The scenario team aimed to draw out different views and priorities among stakeholders, capture the essential elements in a few alternative future scenarios, help stakeholders find a common understanding about the best path forward, and help resolve conflicts. A principal goal was to develop capacity for community-based land- and water-use planning, rather than to achieve agreement on a specific plan.
What scenarios were selected?Three future scenarios were developed to illustrate major strategic choices for the Willamette Basin and represent the divergent views of stakeholders. Each scenario was projected at 10-year intervals through to the year 2050.
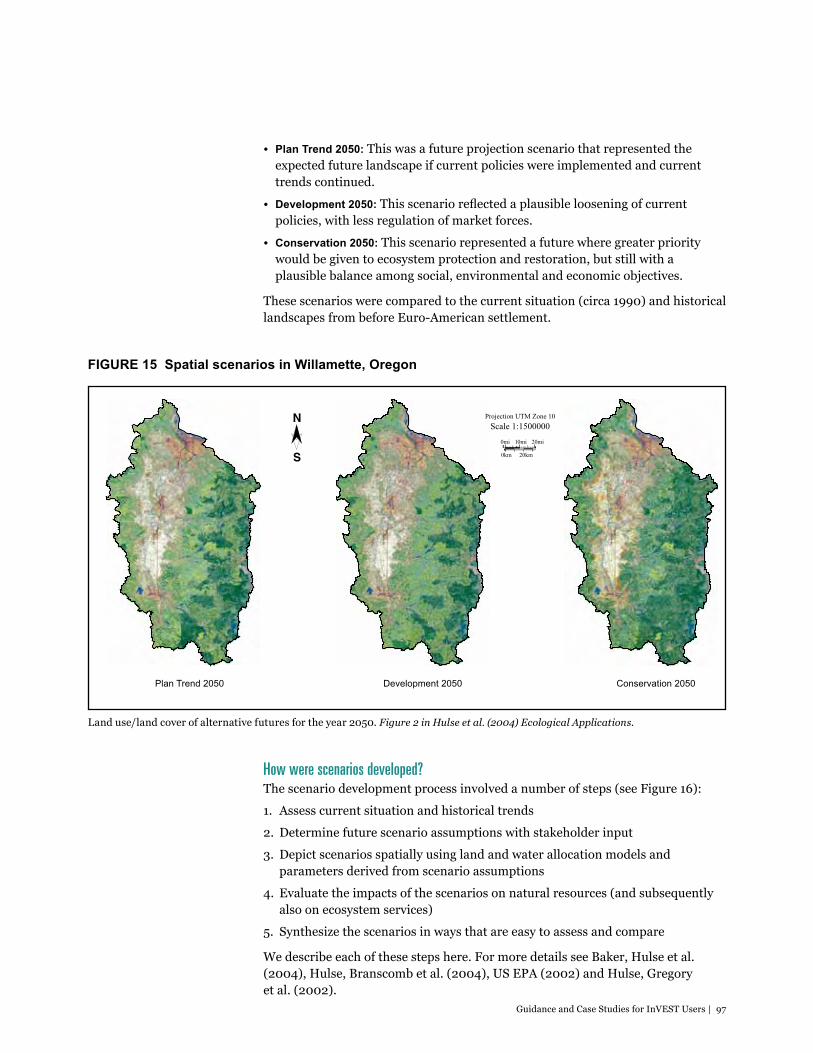
Guidance and Case Studies for InVEST Users | 97
• Plan Trend 2050: This was a future projection scenario that represented the expected future landscape if current policies were implemented and current trends continued.
• Development 2050: This scenario reflected a plausible loosening of current policies, with less regulation of market forces.
• Conservation 2050: This scenario represented a future where greater priority would be given to ecosystem protection and restoration, but still with a plausible balance among social, environmental and economic objectives.
These scenarios were compared to the current situation (circa 1990) and historical landscapes from before Euro-American settlement.
Land use/land cover of alternative futures for the year 2050. Figure 2 in Hulse et al. (2004) Ecological Applications.
(a) Plan Trend 2050 (b) Development 2050 (c) Conservation 2050
S
N
0km 20km
0mi 10mi 20mi
Projection UTM Zone 10Scale 1:1500000
Figure 2.
FIgURE 15 Spatial scenarios in Willamette, Oregon
How were scenarios developed?The scenario development process involved a number of steps (see Figure 16):
1. Assess current situation and historical trends
2. Determine future scenario assumptions with stakeholder input
3. Depict scenarios spatially using land and water allocation models and parameters derived from scenario assumptions
4. Evaluate the impacts of the scenarios on natural resources (and subsequently also on ecosystem services)
5. Synthesize the scenarios in ways that are easy to assess and compare
We describe each of these steps here. For more details see Baker, Hulse et al. (2004), Hulse, Branscomb et al. (2004), US EPA (2002) and Hulse, Gregory et al. (2002).
Plan Trend 2050 development 2050 Conservation 2050

98 | Developing Scenarios
FIgURE 16 Scenarios process applied in the Willamette River Basin, Oregon
Figure 2 in Baker, Hulse et al. (2004) Ecological Applications
The study team characterized and compared the current and historical landscapes in the area. This enabled stakeholders to see the process of change over the previous century, which helped to stimulate thinking about the future. The team also reviewed projections for population growth in the Willamette River Basin. Based on these projections, they assumed 1.9 million additional people by 2050 under all three scenarios.
The study team began by developing assumptions that would underpin the scenarios. They engaged extensively with stakeholders in order to develop plausible assumptions given local knowledge and politics. Table 18 summarizes how stakeholders were engaged. The study team met monthly for two and a half years with the Possible Futures Working Group to develop value-based assumptions and rules about future land and water use in each scenario. The working group was supported by technical experts in sectors such as agriculture, forestry and biodiversity.
Scenario creation proceeded by answering, in a spatially explicit way, the question of where and when to accommodate the additional 1.9 million people anticipated by 2050, while maintaining the agricultural- and forestry-based rural life. The
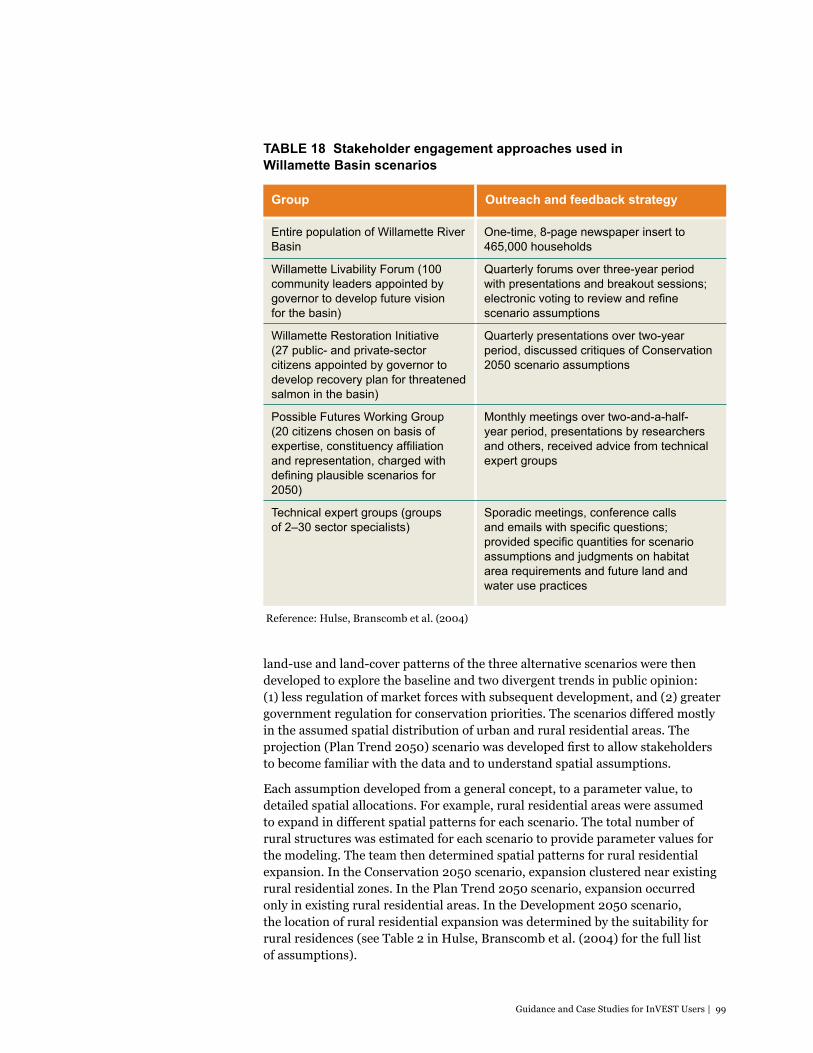
Guidance and Case Studies for InVEST Users | 99
group
One-time, 8-page newspaper insert to 465,000 households
Quarterly forums over three-year period with presentations and breakout sessions; electronic voting to review and refine scenario assumptions
Quarterly presentations over two-year period, discussed critiques of Conservation 2050 scenario assumptions
Monthly meetings over two-and-a-half- year period, presentations by researchers and others, received advice from technical expert groups
Sporadic meetings, conference calls and emails with specific questions; provided specific quantities for scenario assumptions and judgments on habitat area requirements and future land and water use practices
Outreach and feedback strategy
entire population of Willamette River Basin
Willamette Livability Forum (100 community leaders appointed by governor to develop future vision for the basin)
Willamette Restoration Initiative (27 public- and private-sector citizens appointed by governor to develop recovery plan for threatened salmon in the basin)
Possible Futures Working group (20 citizens chosen on basis of expertise, constituency affiliation and representation, charged with defining plausible scenarios for 2050)
Technical expert groups (groups of 2–30 sector specialists)
Reference: Hulse, Branscomb et al. (2004)
land-use and land-cover patterns of the three alternative scenarios were then developed to explore the baseline and two divergent trends in public opinion: (1) less regulation of market forces with subsequent development, and (2) greater government regulation for conservation priorities. The scenarios differed mostly in the assumed spatial distribution of urban and rural residential areas. The projection (Plan Trend 2050) scenario was developed first to allow stakeholders to become familiar with the data and to understand spatial assumptions.
Each assumption developed from a general concept, to a parameter value, to detailed spatial allocations. For example, rural residential areas were assumed to expand in different spatial patterns for each scenario. The total number of rural structures was estimated for each scenario to provide parameter values for the modeling. The team then determined spatial patterns for rural residential expansion. In the Conservation 2050 scenario, expansion clustered near existing rural residential zones. In the Plan Trend 2050 scenario, expansion occurred only in existing rural residential areas. In the Development 2050 scenario, the location of rural residential expansion was determined by the suitability for rural residences (see Table 2 in Hulse, Branscomb et al. (2004) for the full list of assumptions).
TABlE 18 Stakeholder engagement approaches used in Willamette Basin scenarios
100 | Developing Scenarios
The Conservation scenario was substantially based on expert opinion: experts estimated the area of key habitats required to sustain, in perpetuity, the array of dependent species. Spatially explicit analyses identified locations biophysically suited to meet the area targets. These locations were mapped and then reviewed by a series of groups to assess the political plausibility of conserving or restoring those areas.
How were scenarios translated into land-cover maps?The scenario assumptions were translated into mapped spatial scenarios using computerized allocation models. Future landscape patterns were assumed to result from interactions among six landscape change processes: agriculture, forestry, urbanization, rural residential development, natural habitats and water use. Each was implemented through a computerized allocation model. Each model consisted of GIS algorithms that distributed land-use/land-cover (LULC) transitions across the landscape based on transition probabilities, which were derived directly from the assumptions defined by stakeholders, plus a stochastic element. Further details on how each model operated can be found in Hulse, Branscomb et al. (2004).
The stakeholder assumptions were refined iteratively to create plausible scenarios. As each scenario neared completion, the maps were presented to stakeholders for review. The study team also used computer simulations to help stakeholders visualize and compare the possible future landscapes. If the models produced maps that stakeholders felt did not match their assumptions, the models and maps were revised accordingly. Considerable effort was made to define 65 LULC categories that were meaningful both to stakeholders who had to interpret them, and to modelers developing and evaluating the scenarios.
How did the scenarios shape the final results for policy makers?The scenarios research team evaluated the likely effects of each scenario on four resources: water availability, the Willamette River (the structure, vegetation and fish community), the ecological condition of streams, and terrestrial wildlife (Baker et al. 2004).
Results from these analyses were actively discussed by stakeholder groups charged with developing a vision for the basin’s future and basin-wide restoration strategy. The restoration opportunities map, created as an interim step toward Conservation 2050, became part of the restoration strategy proposed by the Willamette Restoration Initiative.
InVEST was later used to assess how scenarios would affect a number of ecosystem services: water quality, storm peak mitigation, soil retention, carbon sequestration, biodiversity, and market returns to landowners (from agricultural crop production, timber harvest, and housing values) (Nelson et al. 2009). The research found no significant tradeoffs among ecosystem services and biodiversity, but a tradeoff between market values and all other ecosystem services and biodiversity. The economic value of the conservation scenario was higher than the other two scenarios when reasonable values for ecosystem services were added to market value estimates.

Guidance and Case Studies for InVEST Users | 101
Key assumption• Assumed same population growth for all scenarios (from current 2 million to
about 3.9 million people by 2050).
Strengths • Involvement of stakeholders led to a greater understanding and sense of
ownership of the scenarios.
• The multilevel stakeholder group structure created an effective process where a sufficiently small group of stakeholders could define assumptions in quantitative detail, while also getting review from larger stakeholder groups that were broadly representative of the whole constituency.
• Local knowledge from stakeholders was used to create future scenarios that were considered to be both plausible and relevant.
• The projection scenario—Plan Trend 2050—was developed first, which enabled stakeholders to become familiar with the data and how to develop spatial assumptions.
• Scenario maps were presented to stakeholders iteratively, with stakeholders resolving ever narrower questions about the scenario assumptions and then reviewing the scenario maps. This enabled the effects of parameters to be perceived and reviewed, and led to stakeholders being less overwhelmed by the complexity of the process.
Challenges and areas for future improvement• Extensive stakeholder engagement was time and resource intensive. The
project took five years, and two-and-a-half years were devoted to defining the scenario assumptions. This process would therefore not be replicable in most circumstances.
• The scenarios did not combine climate change, changes in technology, or changes in market prices into scenarios of land-use/land-cover change.
• Tying scenarios tightly to what stakeholders considered plausible meant there was little variation among alternative futures.
• The stakeholders did not have much input in selecting the final endpoints (ecosystem services or natural resource impacts) that would be assessed for each scenario.
• The InVEST analysis was undertaken later, outside of the stakeholder engagement process.
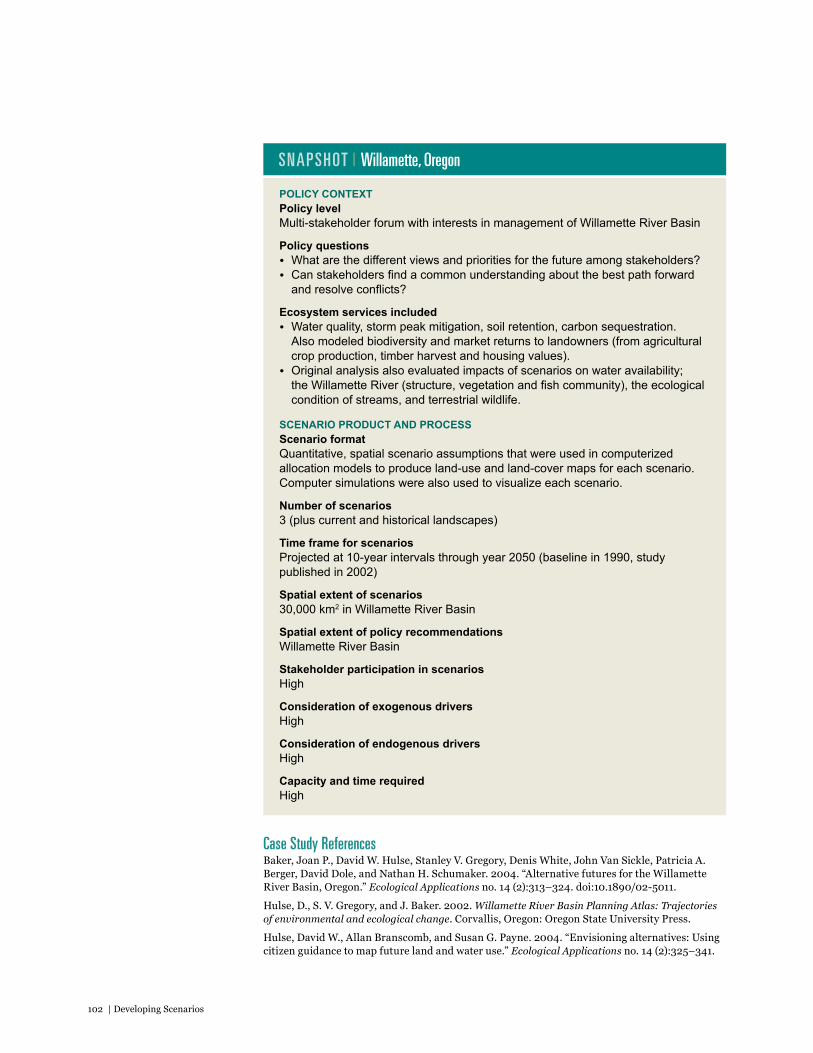
102 | Developing Scenarios
Case Study ReferencesBaker, Joan P., David W. Hulse, Stanley V. Gregory, Denis White, John Van Sickle, Patricia A. Berger, David Dole, and Nathan H. Schumaker. 2004. “Alternative futures for the Willamette River Basin, Oregon.” Ecological Applications no. 14 (2):313–324. doi:10.1890/02-5011.
Hulse, D., S. V. Gregory, and J. Baker. 2002. Willamette River Basin Planning Atlas: Trajectories of environmental and ecological change. Corvallis, Oregon: Oregon State University Press.
Hulse, David W., Allan Branscomb, and Susan G. Payne. 2004. “Envisioning alternatives: Using citizen guidance to map future land and water use.” Ecological Applications no. 14 (2):325–341.
POlICy CONTExT Policy level Multi-stakeholder forum with interests in management of Willamette River Basin
Policy questions • What are the different views and priorities for the future among stakeholders?• Can stakeholders find a common understanding about the best path forward and resolve conflicts?
Ecosystem services included• Water quality, storm peak mitigation, soil retention, carbon sequestration. Also modeled biodiversity and market returns to landowners (from agricultural crop production, timber harvest and housing values). • Original analysis also evaluated impacts of scenarios on water availability; the Willamette River (structure, vegetation and fish community), the ecological condition of streams, and terrestrial wildlife.
SCENARIO PRODUCT AND PROCESS Scenario format Quantitative, spatial scenario assumptions that were used in computerized allocation models to produce land-use and land-cover maps for each scenario. Computer simulations were also used to visualize each scenario.
Number of scenarios 3 (plus current and historical landscapes)
Time frame for scenariosProjected at 10-year intervals through year 2050 (baseline in 1990, study published in 2002)
Spatial extent of scenarios30,000 km2 in Willamette River Basin
Spatial extent of policy recommendationsWillamette River Basin
Stakeholder participation in scenariosHigh
Consideration of exogenous driversHigh
Consideration of endogenous driversHigh
Capacity and time requiredHigh
SNAPSHOT | Willamette, Oregon
Guidance and Case Studies for InVEST Users | 103
7.6. Vancouver Island, CanadaJoey Bernhardt, Anne Guerry, Emily McKenzie, Jodie Toft, Spencer Wood
BackgroundAlong the west coast of Vancouver Island in Canada, multiple, often competing interest groups came together to envision the future of their coast and how myriad human uses could coexist without undermining each other or the marine ecosystem on which they depend. The West Coast Aquatic Management Board (WCA) is helping to achieve this by creating a marine spatial plan for the region. Marine spatial planning involves using scientific and geospatial information to address conflicts and organize human activities in the ocean, while maintaining ecosystem health, function and services.
WCA is a public-private partnership with participation from four levels of government (federal, provincial, local, and First Nations) and diverse stakeholders. Ultimately, WCA’s vision is to manage resources for the benefit of current and future generations of people and nonhuman species and communities. Some key considerations for WCA and their stakeholders include balancing important industrial and commercial activities (such as shipping, mining, logging, aquaculture, and fisheries), increased development of tourism and recreation, renewable energy generation, access to healthy and local seafood, and a strong cultural desire for sustaining the remote, wild feeling of the place. Aesthetic, spiritual and cultural values—benefits that are not readily quantified—are universally important across the diverse communities.
What policy questions did the analysis set out to address?WCA worked with the Natural Capital Project (NatCap) to apply InVEST as part of a four-year marine spatial planning process. The goal of the analysis was to (1) assess the suitability of regions for different activities; (2) assess how alternative spatial plans might affect a range of ecosystem services; and (3) identify the marine-use conflicts likely to arise from alternative spatial plans, and how such conflicts could be avoided or minimized.
What scenarios were selected?Together, WCA and NatCap created a large number of spatially explicit scenarios, each representing alternative configurations and intensities of activities on the coast and in the ocean at a range of spatial scales (from that of single First Nations’ territories to whole sounds and neighboring coastlines). Since marine spatial planning involves a diversity of decisions made by different industries and government agencies at a range of spatial scales, the team needed to be flexible with the scale of analysis. In particular, the team developed scenarios at two distinct spatial scales, local and regional, each with a different mix of stakeholders and uses:
• local-scale zoning maps: WCA and NatCap worked in close collaboration with each of nine First Nations in Barkley and Clayoquot sounds to develop a number of local-scale scenarios. The spatial scale of these scenarios matched the extent of each Nation’s traditional territory (tens of km2) (Figure 17, p. 105). These scenarios reflected the visions and values of each First Nation
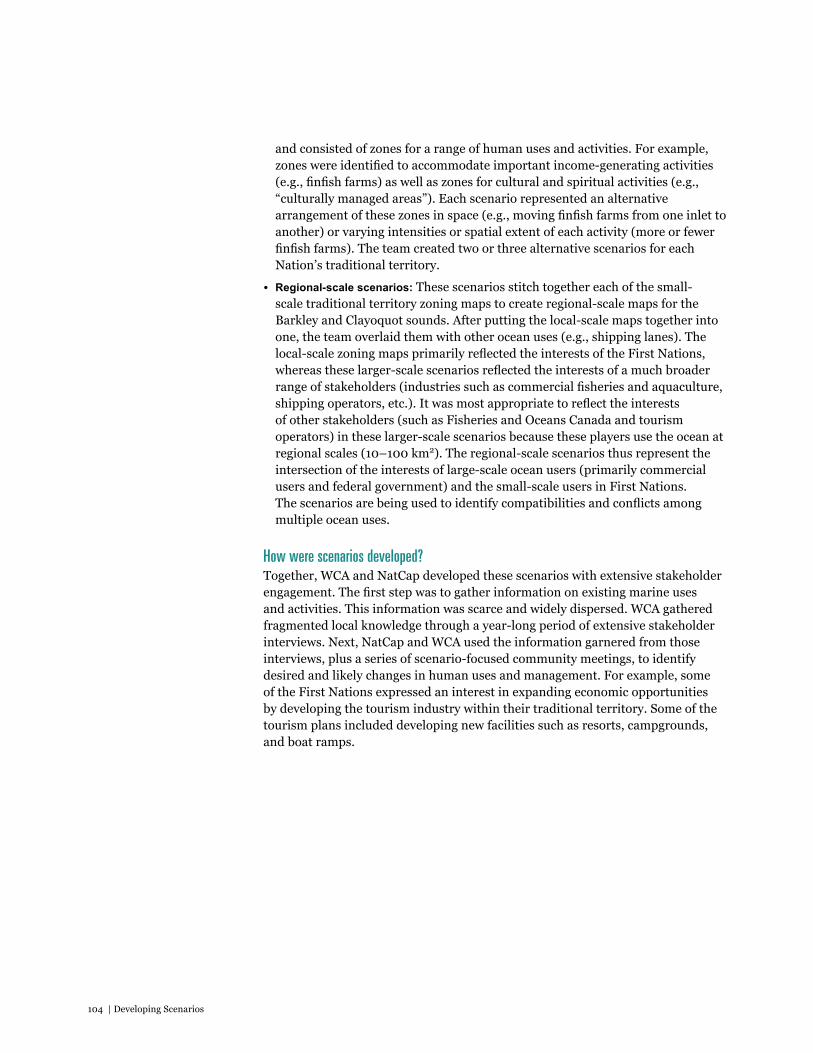
104 | Developing Scenarios
and consisted of zones for a range of human uses and activities. For example, zones were identified to accommodate important income-generating activities (e.g., finfish farms) as well as zones for cultural and spiritual activities (e.g., “culturally managed areas”). Each scenario represented an alternative arrangement of these zones in space (e.g., moving finfish farms from one inlet to another) or varying intensities or spatial extent of each activity (more or fewer finfish farms). The team created two or three alternative scenarios for each Nation’s traditional territory.
• Regional-scale scenarios: These scenarios stitch together each of the small-scale traditional territory zoning maps to create regional-scale maps for the Barkley and Clayoquot sounds. After putting the local-scale maps together into one, the team overlaid them with other ocean uses (e.g., shipping lanes). The local-scale zoning maps primarily reflected the interests of the First Nations, whereas these larger-scale scenarios reflected the interests of a much broader range of stakeholders (industries such as commercial fisheries and aquaculture, shipping operators, etc.). It was most appropriate to reflect the interests of other stakeholders (such as Fisheries and Oceans Canada and tourism operators) in these larger-scale scenarios because these players use the ocean at regional scales (10–100 km2). The regional-scale scenarios thus represent the intersection of the interests of large-scale ocean users (primarily commercial users and federal government) and the small-scale users in First Nations. The scenarios are being used to identify compatibilities and conflicts among multiple ocean uses.
How were scenarios developed?Together, WCA and NatCap developed these scenarios with extensive stakeholder engagement. The first step was to gather information on existing marine uses and activities. This information was scarce and widely dispersed. WCA gathered fragmented local knowledge through a year-long period of extensive stakeholder interviews. Next, NatCap and WCA used the information garnered from those interviews, plus a series of scenario-focused community meetings, to identify desired and likely changes in human uses and management. For example, some of the First Nations expressed an interest in expanding economic opportunities by developing the tourism industry within their traditional territory. Some of the tourism plans included developing new facilities such as resorts, campgrounds, and boat ramps.

Guidance and Case Studies for InVEST Users | 105
FIgURE 17 Planning Units designated by West Coast Aquatic
The local-scale zoning maps created in collaboration with the First Nations correspond roughly with each of the Planning Units. The regional-scale scenarios correspond to the scale of Barkley Sound (shown here) and Clayoquot Sound. Figure from West Coast Aquatic (2011).
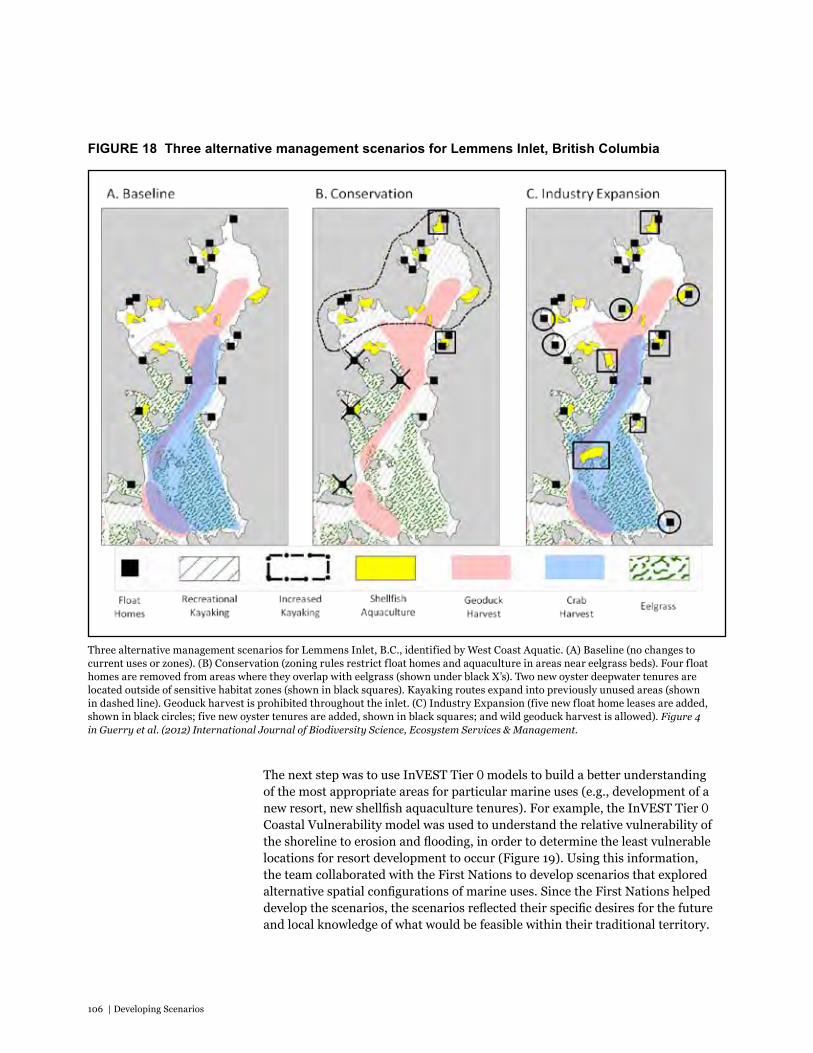
106 | Developing Scenarios
FIgURE 18 Three alternative management scenarios for lemmens Inlet, British Columbia
The next step was to use InVEST Tier O models to build a better understanding of the most appropriate areas for particular marine uses (e.g., development of a new resort, new shellfish aquaculture tenures). For example, the InVEST Tier O Coastal Vulnerability model was used to understand the relative vulnerability of the shoreline to erosion and flooding, in order to determine the least vulnerable locations for resort development to occur (Figure 19). Using this information, the team collaborated with the First Nations to develop scenarios that explored alternative spatial configurations of marine uses. Since the First Nations helped develop the scenarios, the scenarios reflected their specific desires for the future and local knowledge of what would be feasible within their traditional territory.
Three alternative management scenarios for Lemmens Inlet, B.C., identified by West Coast Aquatic. (A) Baseline (no changes to current uses or zones). (B) Conservation (zoning rules restrict float homes and aquaculture in areas near eelgrass beds). Four float homes are removed from areas where they overlap with eelgrass (shown under black X’s). Two new oyster deepwater tenures are located outside of sensitive habitat zones (shown in black squares). Kayaking routes expand into previously unused areas (shown in dashed line). Geoduck harvest is prohibited throughout the inlet. (C) Industry Expansion (five new float home leases are added, shown in black circles; five new oyster tenures are added, shown in black squares; and wild geoduck harvest is allowed). Figure 4 in Guerry et al. (2012) International Journal of Biodiversity Science, Ecosystem Services & Management.
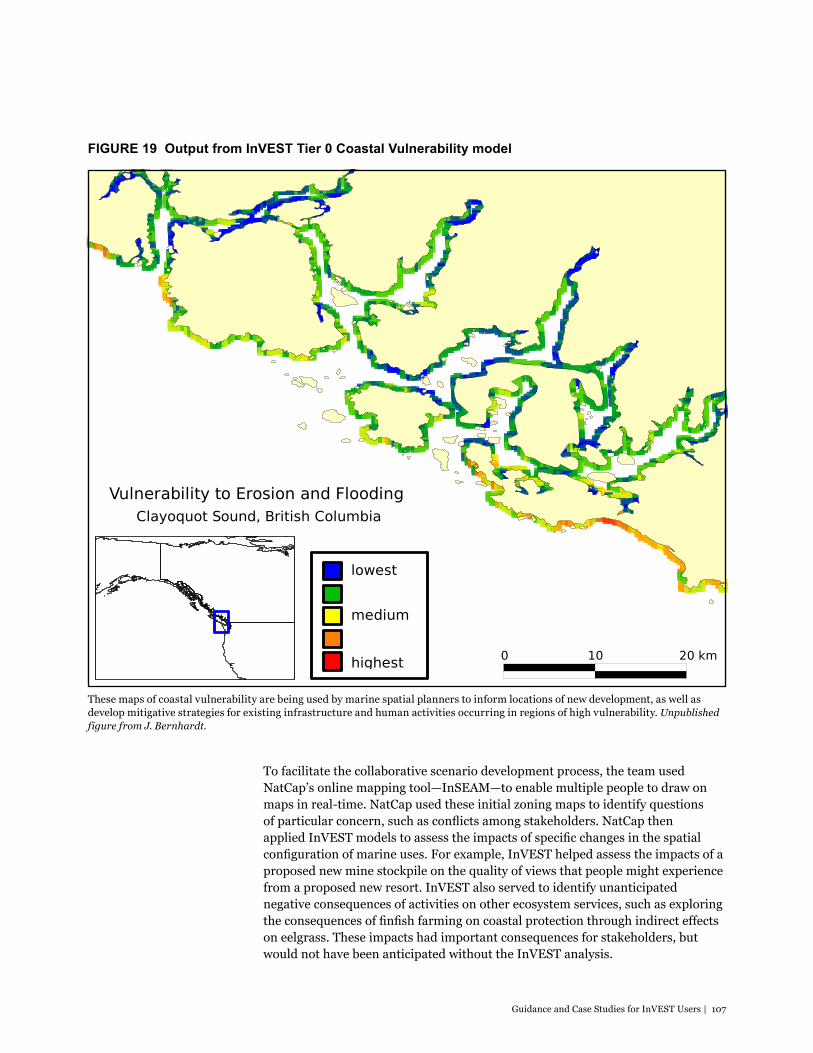
Guidance and Case Studies for InVEST Users | 107
Vulnerability to Erosion and Flooding
Clayoquot Sound, British Columbia
0 10 20 km
lowest
medium
highest
FIgURE 19 Output from InVEST Tier 0 Coastal Vulnerability model
These maps of coastal vulnerability are being used by marine spatial planners to inform locations of new development, as well as develop mitigative strategies for existing infrastructure and human activities occurring in regions of high vulnerability. Unpublished figure from J. Bernhardt.
To facilitate the collaborative scenario development process, the team used NatCap’s online mapping tool—InSEAM—to enable multiple people to draw on maps in real-time. NatCap used these initial zoning maps to identify questions of particular concern, such as conflicts among stakeholders. NatCap then applied InVEST models to assess the impacts of specific changes in the spatial configuration of marine uses. For example, InVEST helped assess the impacts of a proposed new mine stockpile on the quality of views that people might experience from a proposed new resort. InVEST also served to identify unanticipated negative consequences of activities on other ecosystem services, such as exploring the consequences of finfish farming on coastal protection through indirect effects on eelgrass. These impacts had important consequences for stakeholders, but would not have been anticipated without the InVEST analysis.
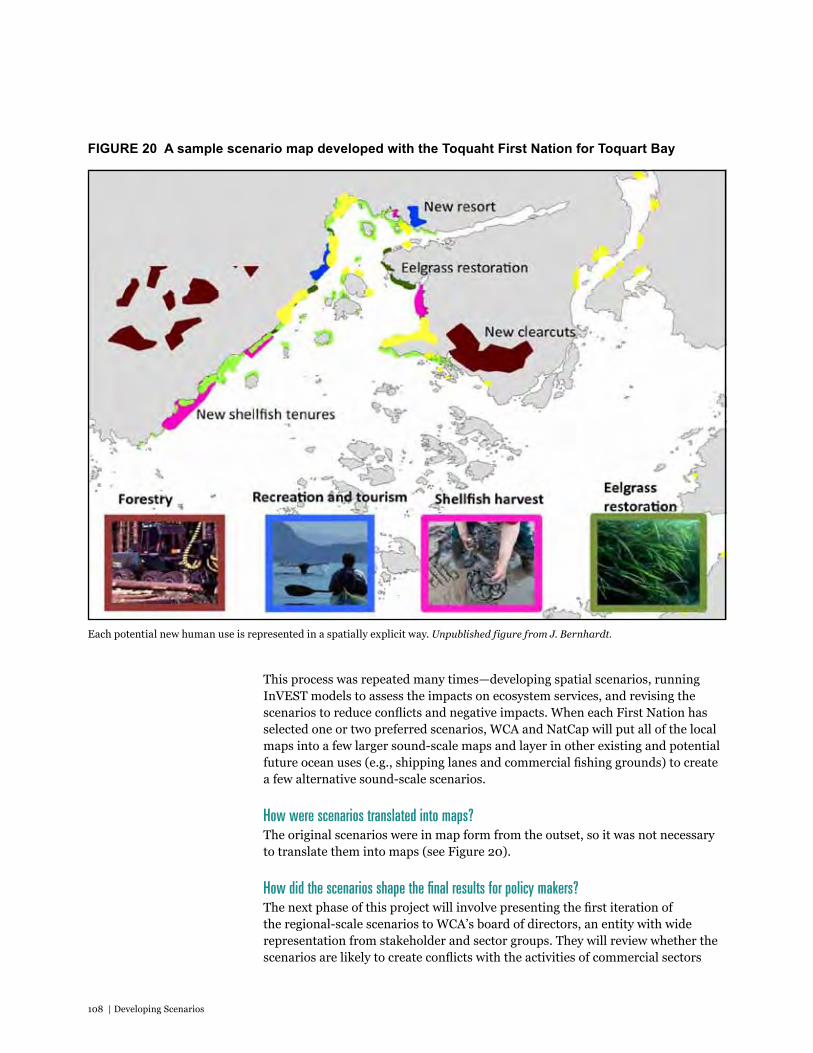
108 | Developing Scenarios
FIgURE 20 A sample scenario map developed with the Toquaht First Nation for Toquart Bay
Each potential new human use is represented in a spatially explicit way. Unpublished figure from J. Bernhardt.
This process was repeated many times—developing spatial scenarios, running InVEST models to assess the impacts on ecosystem services, and revising the scenarios to reduce conflicts and negative impacts. When each First Nation has selected one or two preferred scenarios, WCA and NatCap will put all of the local maps into a few larger sound-scale maps and layer in other existing and potential future ocean uses (e.g., shipping lanes and commercial fishing grounds) to create a few alternative sound-scale scenarios.
How were scenarios translated into maps?The original scenarios were in map form from the outset, so it was not necessary to translate them into maps (see Figure 20).
How did the scenarios shape the final results for policy makers?The next phase of this project will involve presenting the first iteration of the regional-scale scenarios to WCA’s board of directors, an entity with wide representation from stakeholder and sector groups. They will review whether the scenarios are likely to create conflicts with the activities of commercial sectors
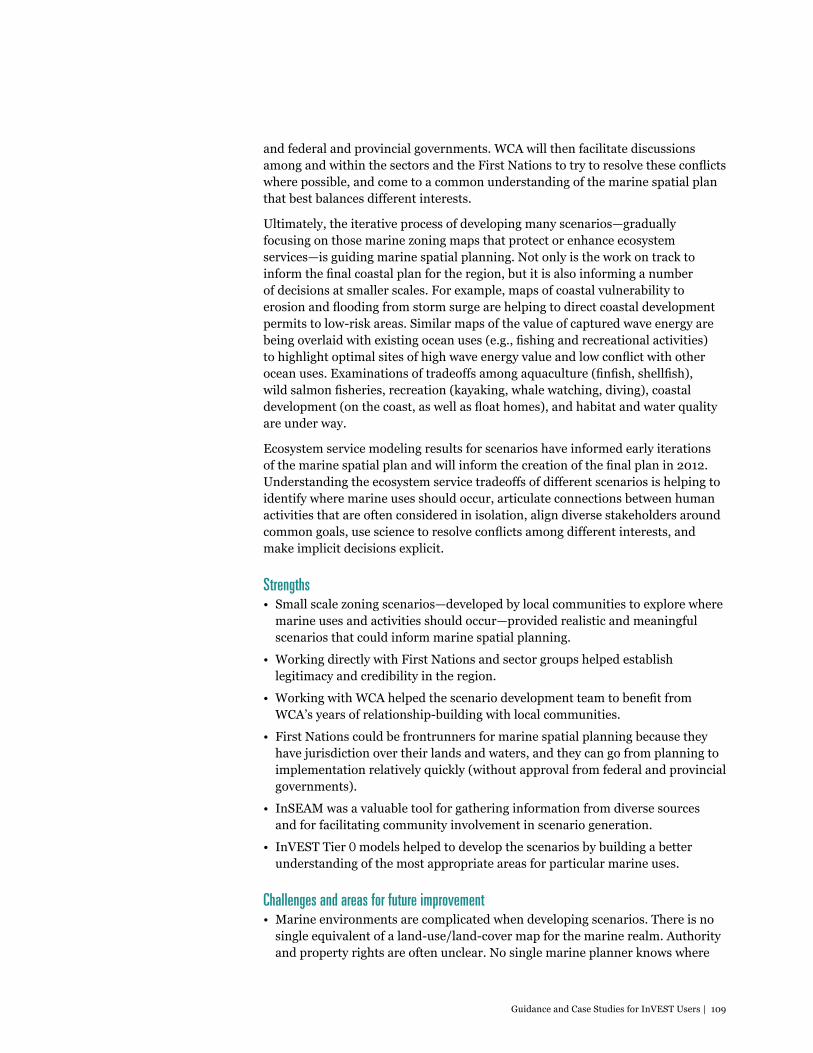
Guidance and Case Studies for InVEST Users | 109
and federal and provincial governments. WCA will then facilitate discussions among and within the sectors and the First Nations to try to resolve these conflicts where possible, and come to a common understanding of the marine spatial plan that best balances different interests.
Ultimately, the iterative process of developing many scenarios—gradually focusing on those marine zoning maps that protect or enhance ecosystem services—is guiding marine spatial planning. Not only is the work on track to inform the final coastal plan for the region, but it is also informing a number of decisions at smaller scales. For example, maps of coastal vulnerability to erosion and flooding from storm surge are helping to direct coastal development permits to low-risk areas. Similar maps of the value of captured wave energy are being overlaid with existing ocean uses (e.g., fishing and recreational activities) to highlight optimal sites of high wave energy value and low conflict with other ocean uses. Examinations of tradeoffs among aquaculture (finfish, shellfish), wild salmon fisheries, recreation (kayaking, whale watching, diving), coastal development (on the coast, as well as float homes), and habitat and water quality are under way.
Ecosystem service modeling results for scenarios have informed early iterations of the marine spatial plan and will inform the creation of the final plan in 2012. Understanding the ecosystem service tradeoffs of different scenarios is helping to identify where marine uses should occur, articulate connections between human activities that are often considered in isolation, align diverse stakeholders around common goals, use science to resolve conflicts among different interests, and make implicit decisions explicit.
Strengths • Small scale zoning scenarios—developed by local communities to explore where
marine uses and activities should occur—provided realistic and meaningful scenarios that could inform marine spatial planning.
• Working directly with First Nations and sector groups helped establish legitimacy and credibility in the region.
• Working with WCA helped the scenario development team to benefit from WCA’s years of relationship-building with local communities.
• First Nations could be frontrunners for marine spatial planning because they have jurisdiction over their lands and waters, and they can go from planning to implementation relatively quickly (without approval from federal and provincial governments).
• InSEAM was a valuable tool for gathering information from diverse sources and for facilitating community involvement in scenario generation.
• InVEST Tier O models helped to develop the scenarios by building a better understanding of the most appropriate areas for particular marine uses.
Challenges and areas for future improvement• Marine environments are complicated when developing scenarios. There is no
single equivalent of a land-use/land-cover map for the marine realm. Authority and property rights are often unclear. No single marine planner knows where
110 | Developing Scenarios
everything happens on the seascape. And no one agency has jurisdiction over any given place on the seascape. Thus, the development and implementation of a marine spatial plan—and the scenario development entailed—requires coordination among many stakeholder groups and government agencies.
• Taking a community-based, bottom-up approach to planning and scenario development took extensive time and resources. Frequent iterations and extensive community stakeholder engagement in scenario development and assessment took more than two years.
• Mapping scenarios (particularly at local scales) from individuals’ and communities’ perspectives can be challenging because planning becomes personal. An individual’s livelihood as well as that of his or her family and neighbors is at stake. This is very different from developing scenarios with a government official who may be more removed from the issues at hand.
• Working with First Nations groups can involve sensitive information and requires careful and respectful communication.
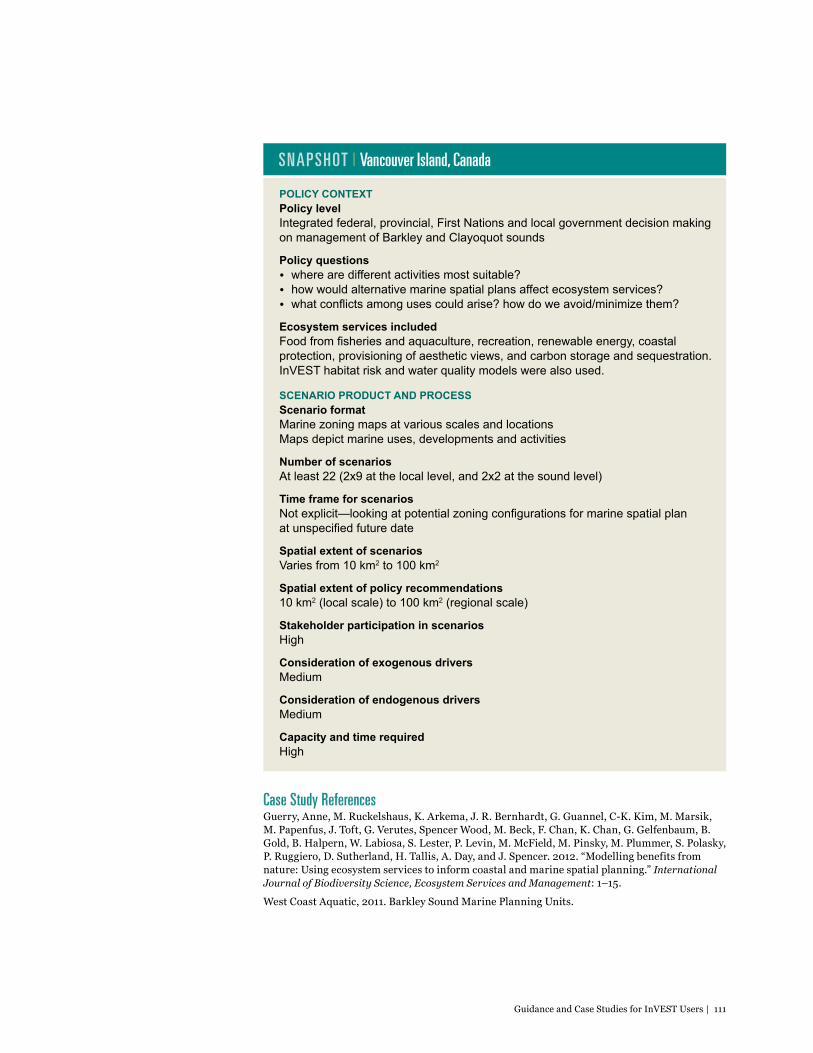
Guidance and Case Studies for InVEST Users | 111
POlICy CONTExT Policy level Integrated federal, provincial, First Nations and local government decision making on management of Barkley and Clayoquot sounds
Policy questions • where are different activities most suitable?• how would alternative marine spatial plans affect ecosystem services?• what conflicts among uses could arise? how do we avoid/minimize them?
Ecosystem services includedFood from fisheries and aquaculture, recreation, renewable energy, coastal protection, provisioning of aesthetic views, and carbon storage and sequestration. InVeST habitat risk and water quality models were also used.
SCENARIO PRODUCT AND PROCESS Scenario formatMarine zoning maps at various scales and locationsMaps depict marine uses, developments and activities
Number of scenarios At least 22 (2x9 at the local level, and 2x2 at the sound level)
Time frame for scenariosNot explicit—looking at potential zoning configurations for marine spatial plan at unspecified future date
Spatial extent of scenariosVaries from 10 km2 to 100 km2
Spatial extent of policy recommendations10 km2 (local scale) to 100 km2 (regional scale)
Stakeholder participation in scenariosHigh
Consideration of exogenous driversMedium
Consideration of endogenous driversMedium
Capacity and time requiredHigh
SNAPSHOT | Vancouver Island, Canada
Case Study ReferencesGuerry, Anne, M. Ruckelshaus, K. Arkema, J. R. Bernhardt, G. Guannel, C-K. Kim, M. Marsik, M. Papenfus, J. Toft, G. Verutes, Spencer Wood, M. Beck, F. Chan, K. Chan, G. Gelfenbaum, B. Gold, B. Halpern, W. Labiosa, S. Lester, P. Levin, M. McField, M. Pinsky, M. Plummer, S. Polasky, P. Ruggiero, D. Sutherland, H. Tallis, A. Day, and J. Spencer. 2012. “Modelling benefits from nature: Using ecosystem services to inform coastal and marine spatial planning.” International Journal of Biodiversity Science, Ecosystem Services and Management: 1–15.
West Coast Aquatic, 2011. Barkley Sound Marine Planning Units.
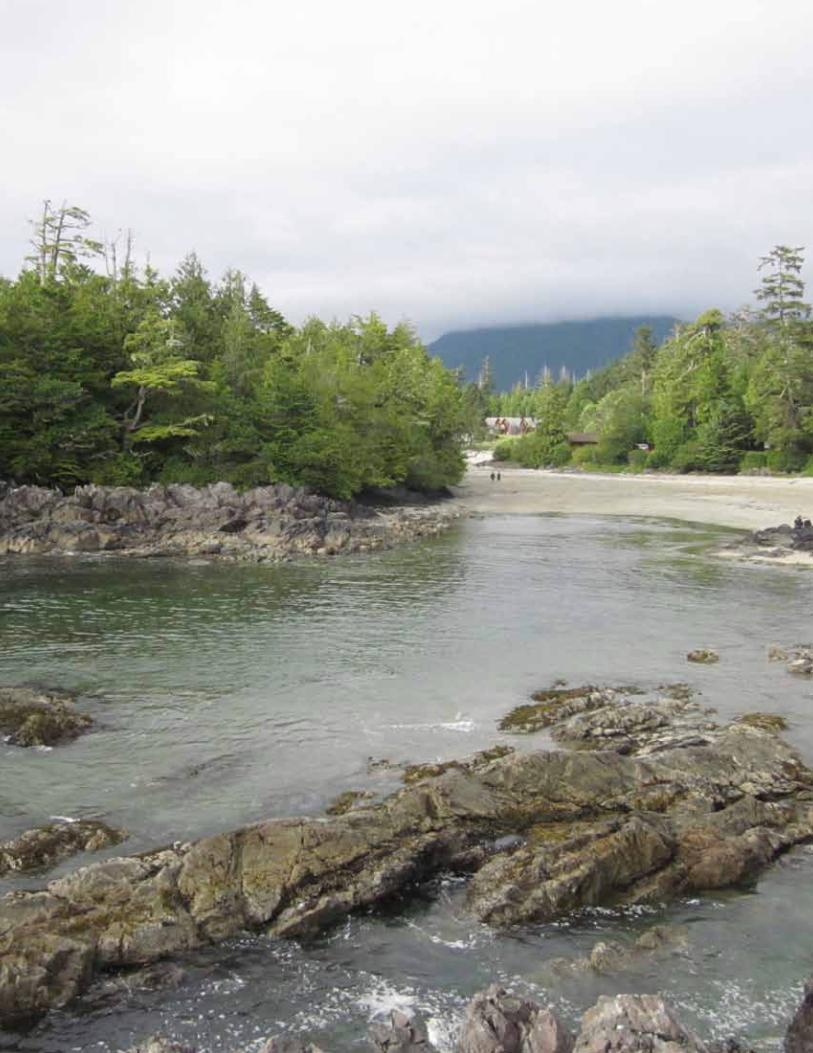
112 | Developing Scenarios

Guidance and Case Studies for InVEST Users | 113
8. Fitting it all together: A simple, combined, iterative approach to scenariosInVEST users have often found it easiest to start with a simple approach when developing scenarios, and then build in more sophisticated methods if the time and technical capacity are available. For example, the team that developed scenarios in Tanzania started simply, developing qualitative storylines based on interviews and focus groups. They built out from there, getting more explicit, sophisticated and complex in their approach and methods, drawing on global climate scenarios to set the scene, and developing rules to make the scenarios spatial.
In addition to starting simply, InVEST users have often blended aspects of different scenario types. For example, in Tanzania one of the scenarios, Matazamio, represented what was perceived as an optimistic vision of the future. It also reflected the expected manifestation of real policies in Tanzania, such as the country’s Poverty Reduction Strategy, if they were implemented effectively. A future projection scenario, Kama Kawaida, was developed to reflect business as usual. The Tanzania scenarios explicitly considered the interactions of drivers while exploring uncertain futures. Furthermore, the team considered how specific policy instruments—such as REDD and payments for watershed services—would play out within each scenario. The scenario exercise was therefore a combination of all four of the stylized scenario categories: vision, intervention, exploration, and future projection scenarios.
The most effective approaches for developing scenarios for InVEST are iterative. The initial set of scenarios are presented and discussed with stakeholders. This can occur at the stage of developing a storyline, developing a scenario map, or arriving at the InVEST results for each scenario. Scenario developers then use the feedback to expand, contract or refine the scenarios. Again, drawing on the Tanzania example, originally three scenarios were developed. Based on consultation with stakeholders, one of the scenarios was dropped—as it was not considered relevant or useful for the questions facing decision makers—while the other two scenarios were refined.
As demonstrated in the case studies here, there are many options available for developing scenarios, each with its strengths and drawbacks. Complex scenarios better reflect the world we live in and uncertain futures we face. Simple scenarios take less time and fewer resources, and may be easier for stakeholders to understand. The most appropriate scenario approach will depend on the context and decision under consideration. Whichever approach proves suitable, scenarios usually make InVEST a powerful tool for assessing tradeoffs, by providing information on the comparative change in ecosystem services under possible futures.
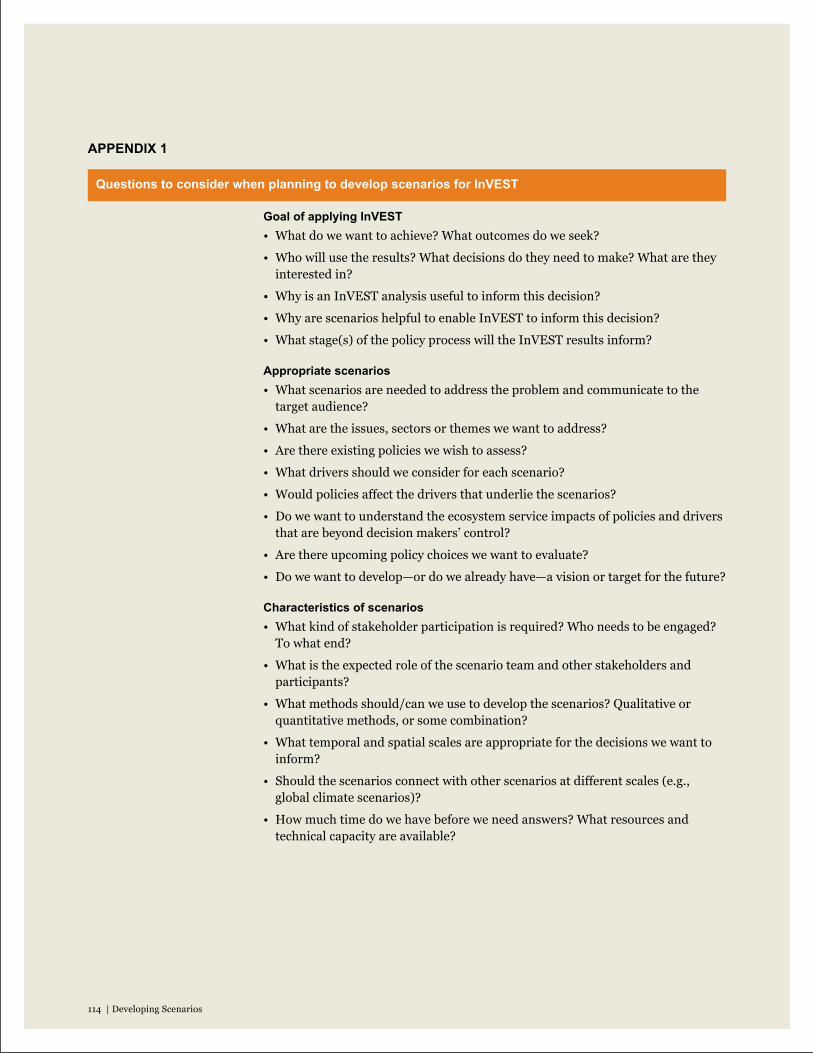
114 | Developing Scenarios
APPENDIx 1
Questions to consider when planning to develop scenarios for InVEST
goal of applying InVEST• What do we want to achieve? What outcomes do we seek?
• Who will use the results? What decisions do they need to make? What are they interested in?
• Why is an InVEST analysis useful to inform this decision?
• Why are scenarios helpful to enable InVEST to inform this decision?
• What stage(s) of the policy process will the InVEST results inform?
Appropriate scenarios• What scenarios are needed to address the problem and communicate to the
target audience?
• What are the issues, sectors or themes we want to address?
• Are there existing policies we wish to assess?
• What drivers should we consider for each scenario?
• Would policies affect the drivers that underlie the scenarios?
• Do we want to understand the ecosystem service impacts of policies and drivers that are beyond decision makers’ control?
• Are there upcoming policy choices we want to evaluate?
• Do we want to develop—or do we already have—a vision or target for the future?
Characteristics of scenarios• What kind of stakeholder participation is required? Who needs to be engaged?
To what end?
• What is the expected role of the scenario team and other stakeholders and participants?
• What methods should/can we use to develop the scenarios? Qualitative or quantitative methods, or some combination?
• What temporal and spatial scales are appropriate for the decisions we want to inform?
• Should the scenarios connect with other scenarios at different scales (e.g., global climate scenarios)?
• How much time do we have before we need answers? What resources and technical capacity are available?

Guidance and Case Studies for InVEST Users | 115
APPENDIx 2
Further resources and reading
links to further reading on scenarios• Scenarios for Sustainability: scenariosforsustainability.org/ • Scenario Thinking: scenariothinking.org/wiki/index.php/Main_Page • World Futures Studies Federation: wfsf.org/ • Foresight International: foresightinternational.com.au/ • European Environment Agency’s Environmental Scenarios Information Portal:
scenarios.ew.eea.europa.eu/fol585720 • Shell Scenarios: An Explorer’s Guide: http://www.shell.com/home/content/
aboutshell/our_strategy/shell_global_scenarios/scenarios_explorers_guide/
links to scenario tools• IDRISI Land Change Modeler:
clarklabs.org/products/land-change-modeler-overview.cfm • Marxan: uq.edu.au/marxan/ • Polestar: polestarproject.org/index.html • Dinamica: csr.ufmg.br/dinamica/ • GEOMOD: environment.yale.edu/gisf/programs/private-forests/dynamic-
models-of-land-use-change/geomod
links to further reading on InVEST• InVEST User’s Guide and download: naturalcapitalproject.org
Recommended selected readings on scenariosEvans, K., S. J. Velarde, et al. (2006). Field guide to the future: Four ways for communities to think ahead. E. Bennett and M. Zurek, Center for International Forestry Research, ASB, World Agroforestry Centre.
Alcamo, J. and T. Henrichs (2008). Towards Guidelines for Environmental Scenario Analysis. Environmental futures: The practice of environmental scenario analysis. J. Alcamo, Elsevier.
Henrichs, T., M. Zurek, et al. (2010). Scenario development and analysis for forward-looking ecosystem assessments. Ecosystems and human well-being: A manual for assessment practitioners. N. Ash, H. Blanco, K. Garcia et al.
Jaeger, J., D. S. Rothman, et al. (2007). Training Module 6: Scenario development and analysis. GEO Resource Book: A training manual on integrated environmental assessment and reporting, UNEP and IISD.
Van der Heijden, K. (1996). Scenarios: The art of strategic conversation. Chichester, Wiley.
Swetnam, R., B. Fisher, et al. (2011). “Mapping socio-economic scenarios of land-cover change: a GIS method to enable ecosystem service modelling.” Journal of Environmental Management 92: 563–574.
Xiang, W. and K. C. Clarke (2003). “The use of scenarios in land-use planning.” Environment and Planning B: Planning and Design 30: 885–909.
116 | Developing Scenarios
APPENDIx 3
References
Alcamo, J. 2001. Scenarios as tools for international environmental assessment. In Environment Issue Report No. 24. Luxembourg: Office for Official Publications of the European Communities.
_____. 2008a. Environmental futures: The practice of environmental scenario analysis, Developments in Integrated Environmental Assessment. Amsterdam: Elsevier.
_____. 2008b. “Introduction: The case for scenarios of the environment.” In Environmental futures: The practice of environmental scenario analysis, edited by J. Alcamo. Amsterdam: Elsevier.
_____. 2008c. “The SAS approach: Combining qualitative and quantitative knowledge in environmental scenarios.” In Environmental Futures: The practice of environmental scenario analysis, edited by J. Alcamo. Amsterdam: Elsevier.
Alcamo, J., and T. Henrichs. 2008. “Towards guidelines for environmental scenario analysis.” In Environmental futures: The practice of environmental scenario analysis, edited by J. Alcamo. Amsterdam: Elsevier.
Alcamo, J., D. van Vuuren, C. Ringler, W. Cramer, T. Masui, J. Alder, and K. Schulze. 2005. “Changes in nature’s balance sheet: Model-based estimates of future worldwide ecosystem services.” Ecology and Society no. 10 (2):19.
Baker, Joan P., David W. Hulse, Stanley V. Gregory, Denis White, John Van Sickle, Patricia A. Berger, David Dole, and Nathan H. Schumaker. 2004. “Alternative futures for the Willamette River Basin, Oregon.” Ecological Applications no. 14 (2):313–324. doi: doi:10.1890/02-5011.
Bassi, A., and A. E. Baer. 2009. “Quantifying cross-sectoral impacts of investment in climate change mitigation in Ecuador.” Energy for Sustainable Development no. 13:116–123.
Bennett, E. M. 2005. “Drivers of change in ecosystem condition and services.” In Ecosystems and human well-being: Scenarios. Volume 2, Millennium Ecosystem Assessment. Washington D.C.: Island Press.
Bennett, E. M., G. D. Peterson, and E. A. Levitt. 2005. “Looking to the future of ecosystem services.” Ecosystems no. 8:125–132.
Berkhout, F., and J. Hertin. 2002. “Foresight Futures Scenarios: Developing and applying a participative strategic planning tool.” Greener Management International no. 37 (Spring):37–52.
Bhagabati, Nirmal, Thomas Barano, Marc Conte, Driss Ennaanay, Oki Hadian, Emily McKenzie, Nasser Olwero, Amy Rosenthal, Suparmoko, Aurelie Shapiro, H. Tallis, and Stacie Wolny. 2012. A Green Vision for Sumatra: Using ecosystem services information to make recommendations for sustainable land use planning at the province and district level. Washington D.C.: Natural Capital Project, WWF-US and WWF-Indonesia.
Biggs, Reinette, Ciara Raudsepp-Hearne, Carol Atkinson-Palombo, Erin Bohensky, Emily Boyd, Georgina Cundhill, Helen Fox, Scott Ingram, Kasper Kok, Stephanie Spehar, Maria Tengo, Dagmar Timmer, and Monika Zurek. 2007. “Linking futures across scales: a dialog on multiscale scenarios.” Ecology and Society no. 12 (1):17.
Bohensky, E. L., B. Reyers, and A. van Jaarsveld. 2006. “Future ecosystem services in a southern African river basin: A scenario planning approach to uncertainty.” Conservation Biology no. 20 (4):1051–1061.
Borjeson, L, M. Hojer, K. Dreborg, T. Ekvall, and G. Finnveden. 2006. “Scenario types and techniques: Towards a user’s guide.” Futures no. 38 (7):723–739.
Burgess, N. D., T. M. Butynski, N. J. Cordeiro, N. H. Doggart, J. Fjeldså, K. M. Howell, F. B. Kilahama, S. P. Loader, J. C. Lovett, B. Mbilinyi, M. Menegon, D. C. Moyer, E. Nashanda, A. Perkin, F. Rovero, W. T. Stanley, and S. N. Stuart. 2007. “The biological importance of the Eastern Arc Mountains of Tanzania and Kenya.” Biological Conservation no. 134 (2):209–231.
Carpenter, S. R. 2009. “Science for managing ecosystem services: Beyond the Millennium Ecosystem Assessment.” Proceedings of the National Academy of Sciences no. 106 (5):1305.
Carpenter, Stephen, Elena Bennett, and Garry D. Peterson. 2006. “Scenarios for ecosystem services: An overview.” Ecology and Society no. 11 (1):29.
Guidance and Case Studies for InVEST Users | 117
Cash, D. W. 2000. “Distributed assessment systems: an emerging paradigm of research, assessment and decision-making for environmental change.” Global Environmental Change no. 10:241-4.
Castella, J. C., T. Ngoc Trung, and S. Boissau. 2005. “Participatory simulation of land-use changes in the northern mountains of Vietnam: The combined use of an agent-based model, a role-playing game, and a geographical information system.” Ecology and Society no. 10 (1):27.
Clark Labs. 2009. The Land Change Modeler for Ecological Sustainability. In IDRISI Focus Paper. Worcester, MA: Clark Labs.
Clark, W., R. Mitchell, D.W. Cash, and F. Alcock. 2002. Information as Influence: How institutions mediate the impact of scientific assessments on global environmental affairs. In Faculty Working Paper RWP02-044. Cambridge MA: John F. Kennedy School of Government, Harvard University.
Clarke, C., S. Rosado, Amy Rosenthal, K. Arkema, M. Canot, I. Gillett, G. Verutes, and Spencer Wood. 2012. Coastal zone planning for Belize. Washington D.C.: Belize Coastal Zone, Natural Capital Project, World Wildlife Fund.
Coreau, A., G. Pinay, J. D. Thompson, P. Cheptou, and L. Mermet. 2009. “The rise of research on futures in ecology: Rebalancing scenarios and predictions.” Ecology Letters no. 12:1277–1286.
Daily, Gretchen C., Stephen Polasky, Joshua Goldstein, Peter M. Karieva, Harold A. Mooney, Liba Pejchar, Taylor H. Ricketts, J. Salzman, and R. Shallenberger. 2009. “Ecosystem services in decision-making: Time to deliver.” Frontiers in Ecology and the Environment no. 7 (1):21–28.
Defra. 2009. Marine and Coastal Access Bill: Impact Assessment. Introduction to the House of Commons. London: Department for Environment, Food and Rural Affairs.
Evans, K., W. de John, and P. Cronkleton. 2008. “Future scenarios as a tool for collaboration in forest communities.” Surveys and Perspectives Integrating Environment and Society no. 1 (2):97–103.
Evans, Kristen, Sandra J. Velarde, Rocio P. Prieto, Sheila N. Rao, Sandra Sertzen, Karina Davila, Peter Cronkleton, and Wil De Jong. 2006. Field guide to the future: Four ways for communities to think ahead. edited by Elena Bennett and Monika Zurek: Center for International Forestry Research, ASB, World Agroforestry Centre.
Fisher, Brendan. 2008. Developing scenarios for Valuing the Arc. In Valuing the Arc Workshop Report. Dar es Salaam, Tanzania.
Gallopin, G., A. Hammond, P. Raskin, and R. Swart. 1997. Branch Points: Global scenarios and human choice. Stockholm: Stockholm Environment Institute.
Gay, C., and F. Estrada. 2010. “Objective probabilities about future climate are a matter of opinion.” Climatic Change no. 99:27–46.
Geoghegan, J., S. Cortina Villar, P. Klepeis, P. Macario Mendoza, Y. Ogneva-Himmelberger, R. Roy Chosdhury, B.L. Turner Il, and C. Vance. 2001. “Modeling tropical deforestation in the southern Yucatan peninsular region: Comparing survey and satellite data.” Agriculture, Ecosystems and Environment no. 85 (25–46).
Girvetz, E.H., C. Zganjar, G.T. Raber, E.P. Maurer, P. Kareiva, and J.J. Lawler. 2009. “Applied climate-change analysis: The Climate Wizard Tool.” PLoS One no. 4.
Goldstein, J., G. Caldarone, C. Colvin, T. Ka eo Duarte, Driss Ennaanay, K. Fronda, N. Hannahs, Emily McKenzie, G. Mendoza, K. Smith, Stacie Wolny, and G. C. Daily. 2010. Integrating ecosystem services into land-use planning in Hawai`i, USA. The Economics of Ecosystems and Biodiversity (TEEB).
Goldstein, J., G. Caldarone, T.K. Duarte, Driss Ennaanay, N. Hannahs, G. Mendoza, S. Polasky, Stacie Wolny, and G. Daily. 2012. Volume 109, Issue 19, pp. 7565–7570. “Integrating ecosystem services into land-use planning.” Proceedings of the National Academy of Sciences of the United States of America.
118 | Developing Scenarios
References, cont.
APPENDIx 3
Guerry, Anne, M. Ruckelshaus, K. Arkema, J. R. Bernhardt, G. Guannel, C-K. Kim, M. Marsik, M. Papenfus, J. Toft, G. Verutes, Spencer Wood, M. Beck, F. Chan, K. Chan, G. Gelfenbaum, B. Gold, B. Halpern, W. Labiosa, S. Lester, P. Levin, M. McField, M. Pinsky, M. Plummer, S. Polasky, P. Ruggiero, D. Sutherland, H. Tallis, A. Day, and J. Spencer. 2012. “Modelling benefits from nature: Using ecosystem services to inform coastal and marine spatial planning.” International Journal of Biodiversity Science, Ecosystem Services and Management: 1–15.
Gutowski, W.J., R.W. Arritt, S. Kawazoe, D.M. Flory, E.S. Takle, S. Biner, D. Caya, R.G. Jones, R. Laprise, L.R. Leung, L. Mearns, W. Moufama-Okia, A.M.B. Nunes, Y. Qian, J.O. Roads, L.C. Sloan, and M.A. Snyder. 2010. “Regional extreme monthly precipitation simulated by NARCCAP RCMs.” Journal of Hydrometeorology no. 11:1373–1379.
Guzy, M. R., C. L. Smithy, J. P. Bolte, D. W. Hulse, and S. V. Gregory. 2008. “Policy research using agent-based modeling to assess future impacts of urban expansion into farmlands and forests.” Ecology and Society no. 13 (1).
Henrichs, T., M. Zurek, B. Eickhout, K. Kok, C. Raudsepp-Hearne, T. Ribeiro, D. van Vuuren, nd A. Volkery. 2010. “Scenario development and analysis for forward-looking ecosystem assessments.” In Ecosystems and human well-being: A manual for assessment practitioners, edited by Neville Ash, Hernan Blanco, Keisha Garcia, Thomas Tomich, Bhaskar Vira, Monika B. Zurek and Claire Brown.
Hulse, D., A. Branscomb, C. Enright, and J. Bolte. 2009. “Anticipating floodplain trajectories: a comparison of two alternative futures approaches.” Landscape Ecology no. 24 (8):1067–1090.
Hulse, D., S. V. Gregory, and J. Baker. 2002. Willamette River Basin Planning Atlas: Trajectories of environmental and ecological change. Corvallis, Oregon: Oregon State University Press.
Hulse, David W., Allan Branscomb, and Susan G. Payne. 2004. “Envisioning alternatives: Using citizen guidance to map future land and water use.” Ecological Applications no. 14 (2):325–341.
IPCC. 2007. Climate Change 2007: The Physical Science Basis. Contribution of Working Group I to the Fourth Assessment Report of the Intergovernmental Panel on Climate Change. Edited by S. Solomon, D. Qin, M. Manning, Z. Chen, M. Marquis, K.B. Averyt and H.L. Miller. Cambridge, United Kingdom and New York, USA: Cambridge University Press.
Jaeger, J., Dale S. Rothman, C. Anastasi, S. Kartha, and Philip Van Notten. 2007. “Training Module 6: Scenario development and analysis.” In GEO Resource Book: A training manual on integrated environmental assessment and reporting. UNEP and IISD.
Kamusoko, C., M. Aniya, B. Adi, and M. Manjoro. 2009. “Rural sustainability under threat in Zimbabwe - Simulation of future land use / cover changes in the Bindura district based on the Markov-cellular automata model.” Applied Geography no. 29:435–447.
Kemp-Benedict, Eric. 2004. From narrative to number: A role for quantitative models in scenario analysis. Cambridge, USA: KB Creative.
Kok, Kasper, Reinette Biggs, and Monika Zurek. 2007. “Methods for developing multi-scale participatory scenarios: Insights from Southern Africa and Europe.” Ecology and Society no. 13 (1):8.
Lambin, Eric F., B. L. Turner, Helmut J. Geist, Samuel B. Agbola, Arild Angelsen, John W. Bruce, Oliver T. Coomes, Rodolfo Dirzo, Günther Fischer, Carl Folke, P. S. George, Katherine Homewood, Jacques Imbernon, Rik Leemans, Xiubin Li, Emilio F. Moran, Michael Mortimore, P. S. Ramakrishnan, John F. Richards, Helle Skånes, Will Steffen, Glenn D. Stone, Uno Svedin, Tom A. Veldkamp, Coleen Vogel, and Jianchu Xu. 2001. “The causes of land-use and land-cover change: moving beyond the myths.” Global Environmental Change no. 11 (4):261–269. doi: 10.1016/s0959-3780(01)00007-3.
Landis, J. D. 1994. “The California Urban Futures model: A new generation of metropolitan simulation models. Environ Plann B. 1994;21:399–420.” Environment and Planning B: Planning and Design no. 21:399–420.

Guidance and Case Studies for InVEST Users | 119
Lebel, L., P. Thongbai, k. Kok, J.B.R. Agard, E. M. Bennett, R. Biggs, M. Ferreira, C. Filer, Y. Gokhald, Mala, C. Rumsey, J. Velarde, M. Zurek, H. Blanco, T. Lynam, and Y. Tianxiang. 2005. “Sub-global scenarios.” In Ecosystems and human well-being: multiscale assessments. Findings of the Sub-global Assessments Working Group of the Millennium Ecosystem Assessment, edited by D. Capistrano, M. Lee, C. Raudsepp-Hearne and C. Samper. Washington D.C.: Island Press.
Lee, K.N. 1993. Compass and gyroscope: Integrating science and politics for the environment. Washington, D.C., USA: Island Press.
MA. 2003. Ecosystems and human well-being: A framework for assessment. Washington D.C.: Island Press.
_____. 2005. Ecosystems and human well-being: Scenarios. Volume 2, Millennium Ecosystem Assessment. Washington D.C.: Island Press.
MAE and INSMET. 2008. Climate change scenarios in Ecuador using the PRECIS Regional Modeling System. Quito, Ecuador: Environmental Ministry of Ecuador and the Meteorological Institute of Cuba.
Maurer, E.P., L. Brekke, T. Pruitt, and P.B. Duffy. 2007. “Fine-resolution climate projections enhance regional climate change impact studies.” EOS, Transactions American Geophysical Union, no. 88:504.
McDonald, R. I., P. Kareiva, and R. T. T. Formana. 2008. “The implications of current and future urbanization for global protected areas and biodiversity conservation.” Biological Conservation no. 141:1695–1703.
McNie, E. C. 2007. “Reconciling the supply of scientific information with user demands: An analysis of the problem and review of the literature.” Environmental Science and Policy no. 10:17–38.
Meadows, D.H., D.L. Meadows, J. Randers, and W.W.I Behrens. 1972. The Limits to Growth: A Report for the Club of Rome’s Project on the Predicament of Mankind. New York: Universe Books Publishers.
Mearns, L., M. Hulme, T.R. Carter, R. Leemans, M. Lal, P. Whetton, L. Hay, R.N. Jones, R. Katz, T. Kittel, J. Smith, and R. Wilby. 2001. “Climate Scenario Development.” In Climate Change 2001: The Scientific Basis. Contribution of Working Group I to the Third Assessment Report of the Intergovernmental Panel on Climate Change, edited by J.T. Houghton, Y. Ding, D.J. Griggs, M. Noguer, P.J. van der Linden, X. Dai, K. Maskell and C.A. Johnson. Cambridge, United Kingdom and New York, USA: Cambridge University Press for the Intergovernmental Panel on Climate Change.
Myint, S.W., and L. Wang. 2006. “Multicriteria decision approach for land use land cover change using Markov chain analysis and a cellular automata approach” Canadian Journal of Remote Sensing no. 32 (6):390–404.
Nakicenovic, N., J. Alcamo, G. Davis, D. de Vries, J. Fenhann, S. Gaffin, K. Gregory, A. Grübler, T. Y. Jung, T. Kram, E. Lebre La Rovere, L. Michaelis, S. Mori, T. Morita, W. Pepper, H. Pitcher, L. Price, K. Riahi, A. Roehrl, H. Rogner, A Sankovski, M. Schlesinger, P. Shukla, S. Smith, R. Swart, S. van Rooijen, N. Victor, and Dadi Z. 2000. Special Report on Emissions Scenarios. A Special Report of Working Group III of the Intergovernmental Panel on Climate Change. Edited by Intergovernmental Panel on Climate Change. Cambridge, UK: Cambridge University Press.
Navicenovic, N., and R. Swart. 2000. Special Report on Emissions Scenarios. In Special Report of the Intergovernmental Panel on Climate Change. Cambridge: Cambridge University Press.
Nelson, E., H. Sander, P. Hawthorne, Marc Conte, Stacie Wolny, S.M. Manson, and S. Polasky. 2010. “Projecting global land use change and its effect on ecosystem service provision and biodiversity with simple models.” PloS One no. 5 (12):e14327.
Nelson, Erik, Guillermo M. Mendoza, Jim Regetz, Stephen Polasky, Heather Tallis, D.R. Cameron, K.M.A. Chan, G.C. Daily, J. Goldstein, P. Kareiva, E. Lonsdorf, R. Naidoo, T.H. Ricketts, and M.R. Shaw. 2009. “Modeling multiple ecosystem services, biodiversity conservation, commodity production and tradeoffs at landscape scales.” Frontiers in Ecology and the Environment no. 7 (1):4–11.
120 | Developing Scenarios
References, cont.
APPENDIx 3
Nelson, Erik, Stephen Polasky, D.J. Lewis, A.J. Plantinga, E. Lonsdorf, D. White, D. Bael, and J.J. Lawler. 2008. “Efficiency of incentives to jointly increase carbon sequestration and species conservation on a landscape.” Proceedings of the National Academy of Sciences of the United States of America no. 105:9471–9476.
Nemarundwe, N., Wil De Jong, and Peter Cronkleton. 2003. Future scenarios as an instrument for forest management. Bogor, Indonesia: Center for International Forestry Research (CIFOR).
Newburn, D., P. Berck, and A.M. Merenlender. 2006. “Habitat and open space at risk of land use conversion: Targeting strategies for land conservation.” American Journal of Agricultural Economics no. 88 (1):28–42.
Olander, L. 2008. “Reference scenarios for deforestation and forest degradation in support of REDD: A review of data and methods.” Environmental Research Letters no. 3 (2).
Parker, D.C., S.M. Manson, M.A. Janssen, M. Hoffman, and P. Deadman. 2003. “Multi-agent systems for the simulation of land-use and land-cover change: A review.” Annals of the Association of American Geographers no. 93 (2):314–337.
Patel, M., K. Kok, and D.S. Rothman. 2007. “Participatory planning in land use analysis: An insight into the experiences and opportunities created by stakeholder involvement in scenario construction in the Northern Mediterranean.” Land Use Policy no. 24.
Peterson, Garry D., T. Douglas Beard Jr., Beatrix Beisner, E., Elena Bennett, Stephen Carpenter, Graeme S. Cumming, C. Lisa Dent, and Tanya D. Havlicek. 2003. “Assessing future ecosystem services a case study of the Northern Highlands Lake District, Wisconsin.” Conservation Ecology no. 7 (3).
Polasky, S., E. Nelson, Derric Pennington, and Kris A. Johnson. 2011. “The impact of land-use change on ecosystem services, biodiversity and returns to landowners: A case study in the State of Minnesota.” Environment and Resource Economics no. 48:219–242.
Polasky, Stephen, Erik Nelson, Camm. J., B. Csuti, P. Fackler, E. Lonsdorf, C. Montgomery, D. White, J. Arthur, B. Garber-Yonts, R. Haight, J. Kagan, A. Starfield, and C. Tobalske. 2008. “Where to put things? Spatial land management to sustain biodiversity and economic returns.” Biological Conservation no. 141:1505–1524.
Radeloff, V.C., E. Nelson, A.J. Plantinga, D. J. Lewis, D. Helmers, J.J. Lawler, J.C. Withey, F. Beaudry, S. Martinuzzi, V. Butsic, E. Lonsdorf, D. White, and S. Polasky. In press. “Economic-based projections of future land use under alternative economic policy scenarios in the conterminous U.S.” Ecological Applications.
Raskin, P., F. Monks, T. Riberio, D. van Vuuren, and M. Zurek. 2005. “Global scenarios in historical perspective.” In Ecosystems and human well-being, edited by Millennium Ecosystem Assessment.
Rawluk, A., and A. Godber. 2011. “Widening the scope of scenario planning in small communities: A case study use of an alternative method.” Ecology and Society no. 16 (1):11.
Richardson, E.A., M. Kaiser, J.G. Hiddrik, M. Galaridi, and E.J. Donald. 2006. Developing scenarios for a network of marine protected areas. In Research and Development Contract CRO 0348. Bangor: University of Wales.
Rijsberman, F.R. 2000. World Water Scenarios: Analysis. Marseille: World Water Council.
Roosita, H., H. Waluyo, S. Bakar, B.E. Naiborhu, B. Karyaatmadja, D. Koespramoedyo, A. Kamarzuki, B.S. Sulistyawan, E. Widodo, and C. Saleh. 2010. Roadmap towards ecosystem conservation of Sumatra: Sumatran Vision 2020.: Internal Affairs Department, Public Works Department, Forestry Department, Ministry of Environment, National Development and Planning Board, Coordinating Ministry of Economy Sector, Forum Tata Ruang Sumatera (ForTRUST).
Rosenthal, Amy, H. Tallis, Stacie Wolny, and Emily McKenzie. In press. Ecosystem service offsets as part of a mitigation plan. Washington D.C.: Natural Capital Project.
Guidance and Case Studies for InVEST Users | 121
Springer, J., and K. Studd. 2009. “The conversatorio for citizen action: Fulfilling rights and responsibilities in natural resource management in Colombia.” In Rights-based approaches: Exploring issues and opportunities for conservation, edited by J. Campese, T. Sunderland, T. Greiber and G. Oviedo. Bogor, Indonesia: CIFOR and IUCN.
Swetnam, R., B. Fisher, B.P. Mbilinyi, P.K.T. Munishi, S. Willcokc, T. Ricketts, S. Mwakalila, A. Balmford, N.D. Burgess, A.R. Marshall, and S.L. Lewis. 2011. “Mapping socio-economic scenarios of land cover change: A GIS method to enable ecosystem service modelling.” Journal of Environmental Management no. 92:563–574.
Tallis, H., Taylor H. Ricketts, Anne Guerry, Spencer Wood, and Rich Sharp. 2012. InVEST 2.2.2 User’s Guide: Integrated Valuation of Ecosystem Services and Tradeoffs. Stanford: Natural Capital Project, Stanford University.
Tallis, H., and Stacie Wolny. 2010. Ecosystem services in mitigation. In A report to the Ministry of Environment, Mines and Territorial Development, Colombia: Stanford: Natural Capital Project, Stanford University.
Tallis, Heather, and S. Polasky. 2011. “Assessing multiple ecosystem services: An integrated tool for the real world.” In Natural Capital: Theory and Practice of Mapping Ecosystem Services, edited by P. Kareiva, Heather Tallis, Taylor H. Ricketts, G. Daily and S. Polasky. Oxford: Oxford University Press.
Thongbai, P., D. Pipattwattanakul, P. Preechapanya, K. Manassrisuksi, and H. Huaysai. 2006. Participatory Scenarios for Sustainable Management of an ASB Benchmark site in Thailand: The case of Mae Kong Kha Subwatershed of Mae Chaem Watershed. Paper read at International Symposium: Towards sustainable livelihoods and ecosystems in mountainous regions at Chiang Mai, Thailand.
United Nations Environment Programme. 2007. Global Environmental Outlook-4 (GEO-4). edited by Environment for Development.
US EPA (US Environmental Protection Agency). 2002. Willamette Basin Alternative Futures Analysis. Environmental assessment approach that facilitates consensus building. United States Environmental Protection Agency, Office of Research and Development.
van den Belt, M. 2004. Mediated Modeling: A system dynamics approach to environmental consensus building. Washington D.C.: Island Press.
Van der Heijden, K. 1996. Scenarios: The art of strategic conversation. Chichester: Wiley.
Van der Kerkhof, M., and A. Wieczorek. 2005. “Learning and stakeholder participation in transition processes towards sustainability: Methodological considerations.” Technological Forecast Social Change no. 72:733–747.
Van Notten, Philip W. F., Jan Rotmans, Marjolein B.A. Van Asselt, and Dale S. Rothman. 2003. “An updated scenario typology.” Futures no. 35 (5):423–443.
Van Paddenburg, A., A. Bassi, E. Buter, and A. Dean. 2012. Heart of Borneo: Investing in nature for a green economy. Jakarta: WWF.
Walz, Ariane, Corina Lardelli, Heiko Behrendt, Adrienne Gret-Regamey, Corinne Lundstrom, Susanne Kytzia, and Peter Bebi. 2007. “Participatory scenario analysis for integrated regional modelling.” Landscape and Urban Planning no. 81:114–131.
Wehrmeyer, W., A. Clayton, and K. Lum. 2002. “Foresighting for development.” Greener Management International no. 37 (Spring):24–36.
Williams, J.W., S.T. Jackson, and J.E. Kutzbacht. 2007. “Projected distributions of novel and disappearing climates by 2100 AD.” Proceedings of the National Academy of Sciences of the United States of America no. 104:5738–5742.
Wollenberg, E., D. Edmunds, and L Buck. 2000a. Anticipating change: Scenarios as a tool for adaptive forest management. A guide. Bogor, Indonesia: Center for International Forestry Research (CIFOR).

122 | Developing Scenarios
Wollenberg, Eva, David Edmunds, and Louise Buck. 2000b. “Using scenarios to make decisions about the future: Anticipatory learning for the adaptive co-management of community forests.” Landscape and Urban Planning no. 47 (1-2):65–77.
Wood, A.W., L.R. Leung, V. Sridhar, and D.P. Lettenmaier. 2004. “Hydrologic implications of dynamical and statistical approaches to downscaling climate model outputs.” Climatic Change no. 62:189–216.
WWF. Ministers, governors commit to saving Sumatra 2008 [cited 22 March 2011. Available from http://wwf.panda.org/wwf_news/press_releases/?147524/Ministers-governors-commit-to-saving-Sumatra
WWF Colombia and CorpoAmazonia. 2011. Desarrollo y validación del esquema de compensación por servicios ambientales y reconversión de sistemas ganaderos en cuencas hidrográficas abastecedoras de acueductos municipales pertenecientes a la cuenca del río Putumayo. In unpublished report. Colombia: WWF Colombia
Xiang, W., and K. C. Clarke. 2003. “The use of scenarios in land-use planning.” Environment and Planning B: Planning and Design no. 30:885–909.
Yankelovich, D. 1991. Coming to public judgment: Making democracy work in a complex world. Syracuse, New York, USA: Syracuse University Press.
Zahabu, E., R.E. Malimbwi, and Y.M. Ngaga. 2005. Payments for environmental services as incentive opportunities for catchment forest reserves management in Tanzania. In Paper presented to the Tanzania Association of Foresters Meeting, held at Karimjee Hall, November 2005. Dar es Salaam: communitycarbonforestry.org
References, cont.
APPENDIx 3
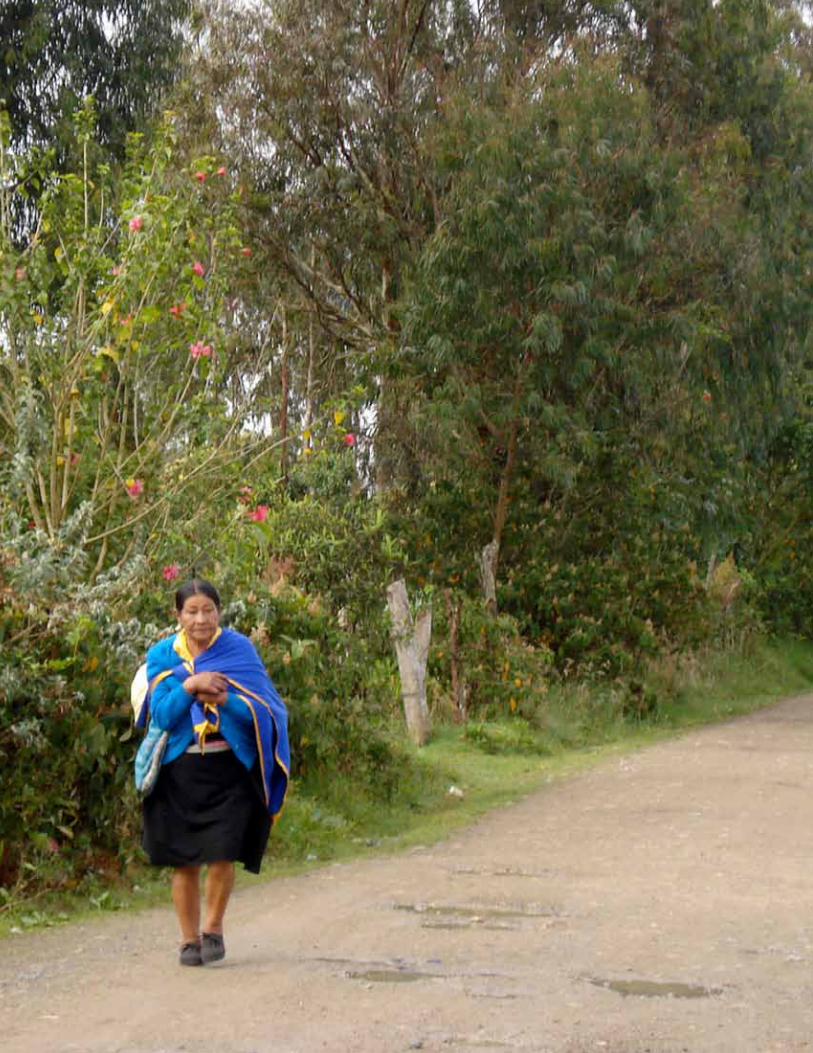
Guidance and Case Studies for InVEST Users | 123

© 2012 WWF. All rights reserved by World Wildlife Fund, Inc. 07-12
Developing Scenarios to Assess Ecosystem Service Tradeoffs: guidance and Case Studies for InVEST Users is a resource for practitioners who want to assess the provision of ecosystem services under alternative future scenarios. The guide draws on case experiences where InVEST was used to compare ecosystem service tradeoffs under different scenarios. It can help InVEST users choose appropriate types of scenarios and methods, engage stakeholders, and create scenario maps. The guide highlights key issues and questions for reflection, along with tools, case studies, references and resources for those who want to learn more.
InVEST is a suite of ecosystem service models, developed by the Natural Capital Project, for mapping, quantifying and valuing ecosystem services under different scenarios. InVEST helps decision makers incorporate ecosystem services into policy and planning at different scales in terrestrial, freshwater and marine environments.
Further materials are available on the scenarios page at naturalcapitalproject.org