scaling mobile for development: harness the opportunity
TRANSCRIPT
Scaling Mobile for Development Harness the opportunity
GSMA Mobile for Development Intelligence
With support from the Rockefeller Foundation
Final report
May 2013
with support from
2 2
• The mobile phone holds the power of ubiquity. Across the developing world, around 40% of people now actively subscribe to mobile services. Well over 50% have access to a mobile, despite not owning one. Access to mobile services in the developing world has outpaced the rate at which much of the population is gaining access to basic services such as electricity, sanitation, and banking.
• As the one technology that is becoming widely accessible to all populations, including those at the bottom of the economic pyramid (BOP), there has been increased focus on the invaluable role mobile technology can play in improving social, economic and environmental development in emerging markets. As the remaining unconnected populations get access to mobile technology and the capabilities it provides, the lives of these populations will fundamentally shift. The simple increase in access to information at a faster pace, from new sources, will influence everything. Affordable mobile phones and the opportunities they usher in for the poor will be one of the most dramatic game-changing technologies the world has ever seen. Industry growth will happen with or without our intervention; the role of MDI will be to educate all those interested in harnessing the power of mobile for good.
Overview
with support from
3 3
• This confluence underlines the opportunity held by Mobile for Development, which seeks to draw investment and partnership to scale mobile-enabled services that can help to facilitate service delivery in the absence of traditional modes of infrastructure that would otherwise do this. Indeed, Mobile for Development is a growing sector, with well over 1,000 live services now tracked by the GSMA across the developing world in verticals such as money, health, education and entrepreneurship. The problem is that while the sector has enjoyed continued growth in the number of services over the last 5-7 years, scaling up services still proves to be a challenge and sustainable business models continue to be elusive.
• This work is designed to inform and add insight to help address these challenges. It has been developed by Mobile for Development Intelligence with support from the Rockefeller Foundation. Our inclusive approach included a research process and production of an interim and final report in April and May 2013 respectively, with a series of peer review workshops held in Nairobi, Kenya and Washington DC to drive collaboration and thought leadership across stakeholder groups.
Overview (continued)
with support from
4 4
About us
Mobile for Development Intelligence is a freely available, online platform of mobile market and impact data, analysis and access to an active community of practice in Mobile for Development. We believe that open access to high quality data will improve business decision making, increase total investment from both the commercial mobile industry and the development sector and accelerate economic, environmental and social impact from mobile solutions.
For more information, visit www.mobiledevelopmentintelligence.com
5 5
For more information, please forward direct correspondence to:
Tim Hatt [email protected]
Corina Gardner [email protected]
Adam Wills [email protected]
Martin Harris [email protected]
Correspondence
6 6
1. Executive summary 7
2. Key takeaways: a stakeholder guide 18
3. Market landscape: current and outlook 25
4. Impact of mobile on development sectors 54
5. Platforms, multiplicity and the drive for scale 82
6. User-centric innovation 107
7. Role of government 130
8. Appendix 141
7 7
1. Executive summary
2. Key takeaways: a stakeholder guide
3. Market landscape: current and outlook
4. Impact of mobile on development sectors
5. Platforms, multiplicity and the drive for scale
6. User-centric innovation
7. Role of government
8. Appendix
8
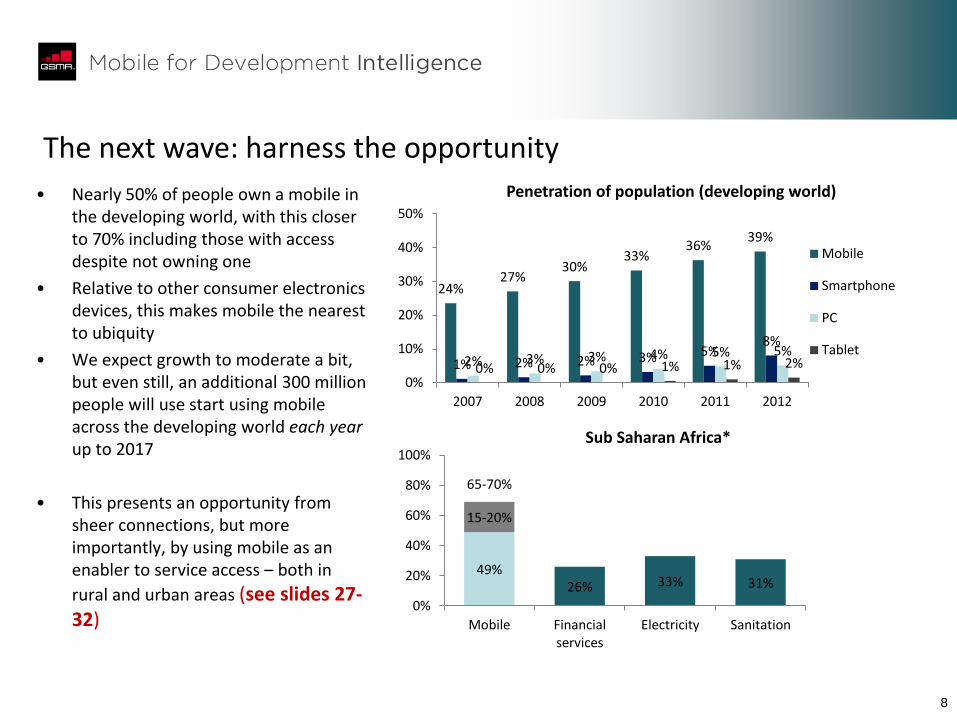
The next wave: harness the opportunity
• Nearly 50% of people own a mobile in the developing world, with this closer to 70% including those with access despite not owning one
• Relative to other consumer electronics devices, this makes mobile the nearest to ubiquity
• We expect growth to moderate a bit, but even still, an additional 300 million people will use start using mobile across the developing world each year up to 2017
• This presents an opportunity from sheer connections, but more importantly, by using mobile as an enabler to service access – both in
rural and urban areas (see slides 27-32)
24% 27%
30% 33%
36% 39%
1% 2% 2% 3% 5% 8%
2% 3% 3% 4% 5% 5% 0% 0% 0% 1% 1% 2%
0%
10%
20%
30%
40%
50%
2007 2008 2009 2010 2011 2012
Penetration of population (developing world)
Mobile
Smartphone
PC
Tablet
49% 26% 33% 31%
15-20%
65-70%
0%
20%
40%
60%
80%
100%
Mobile Financialservices
Electricity Sanitation
Sub Saharan Africa*
9
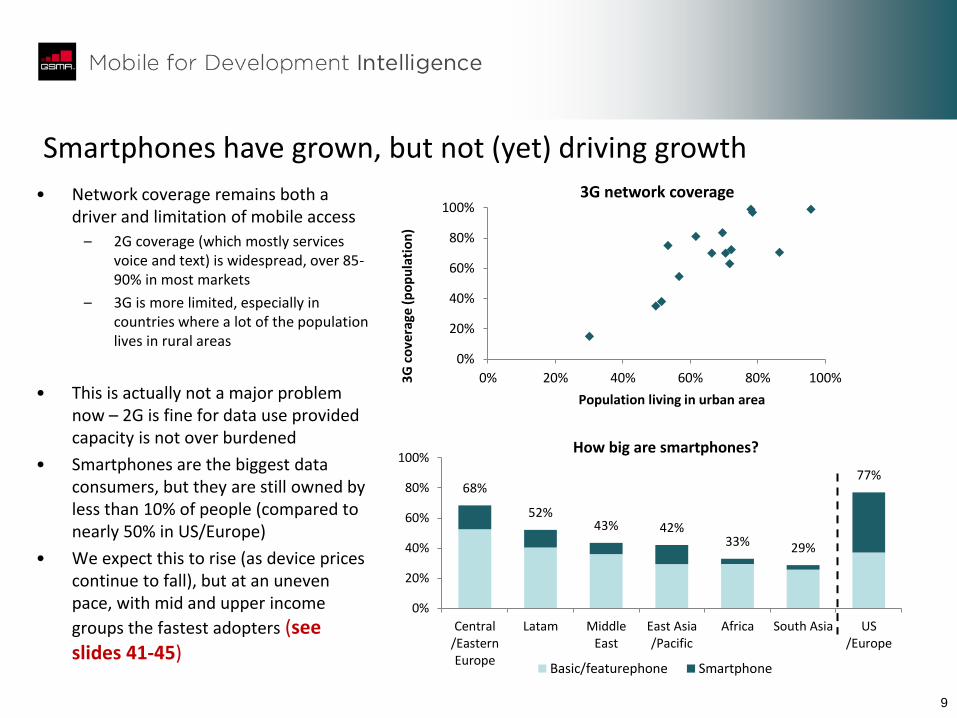
Smartphones have grown, but not (yet) driving growth
• Network coverage remains both a driver and limitation of mobile access
– 2G coverage (which mostly services voice and text) is widespread, over 85-90% in most markets
– 3G is more limited, especially in countries where a lot of the population lives in rural areas
• This is actually not a major problem now – 2G is fine for data use provided capacity is not over burdened
• Smartphones are the biggest data consumers, but they are still owned by less than 10% of people (compared to nearly 50% in US/Europe)
• We expect this to rise (as device prices continue to fall), but at an uneven pace, with mid and upper income
groups the fastest adopters (see slides 41-45)
0%
20%
40%
60%
80%
100%
0% 20% 40% 60% 80% 100%3G
co
vera
ge (
po
pu
lati
on
) Population living in urban area
3G network coverage
68%
52% 43% 42%
33% 29%
77%
0%
20%
40%
60%
80%
100%
Central/EasternEurope
Latam MiddleEast
East Asia/Pacific
Africa South Asia US/Europe
How big are smartphones?
Basic/featurephone Smartphone
10
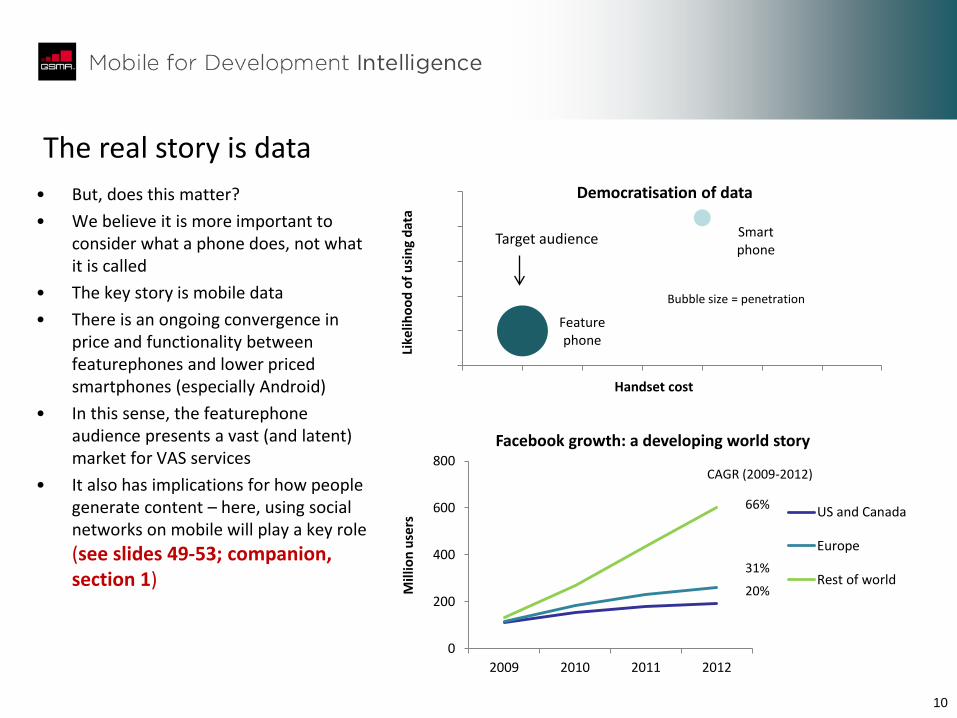
The real story is data
• But, does this matter?
• We believe it is more important to consider what a phone does, not what it is called
• The key story is mobile data
• There is an ongoing convergence in price and functionality between featurephones and lower priced smartphones (especially Android)
• In this sense, the featurephone audience presents a vast (and latent) market for VAS services
• It also has implications for how people generate content – here, using social networks on mobile will play a key role
(see slides 49-53; companion, section 1)
Smart phone
Feature phone
Like
liho
od
of
usi
ng
dat
a
Handset cost
Democratisation of data
Target audience
Bubble size = penetration
0
200
400
600
800
2009 2010 2011 2012
Mill
ion
use
rs
Facebook growth: a developing world story
US and Canada
Europe
Rest of world20%
31%
CAGR (2009-2012)
66%
11
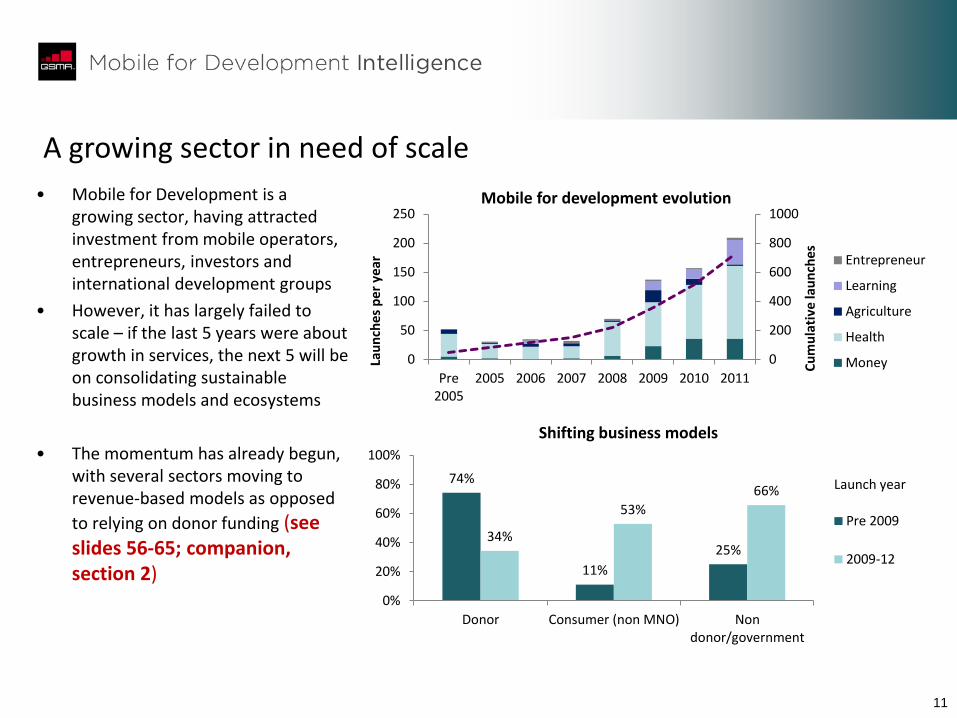
A growing sector in need of scale
• Mobile for Development is a growing sector, having attracted investment from mobile operators, entrepreneurs, investors and international development groups
• However, it has largely failed to scale – if the last 5 years were about growth in services, the next 5 will be on consolidating sustainable business models and ecosystems
• The momentum has already begun, with several sectors moving to revenue-based models as opposed
to relying on donor funding (see slides 56-65; companion, section 2)
0
200
400
600
800
1000
0
50
100
150
200
250
Pre2005
2005 2006 2007 2008 2009 2010 2011
Cu
mu
lati
ve la
un
che
s
Lau
nch
es
pe
r ye
ar
Mobile for development evolution
Entrepreneur
Learning
Agriculture
Health
Money
74%
11%
25% 34%
53%
66%
0%
20%
40%
60%
80%
100%
Donor Consumer (non MNO) Nondonor/government
Launch year
Shifting business models
Pre 2009
2009-12
12
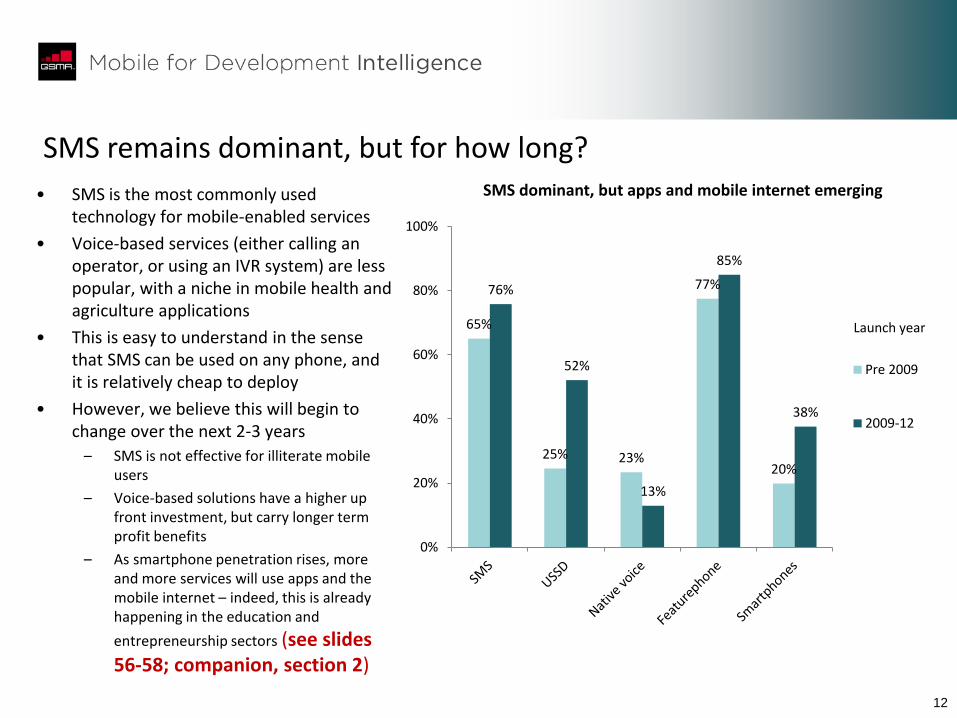
SMS remains dominant, but for how long?
• SMS is the most commonly used technology for mobile-enabled services
• Voice-based services (either calling an operator, or using an IVR system) are less popular, with a niche in mobile health and agriculture applications
• This is easy to understand in the sense that SMS can be used on any phone, and it is relatively cheap to deploy
• However, we believe this will begin to change over the next 2-3 years
– SMS is not effective for illiterate mobile users
– Voice-based solutions have a higher up front investment, but carry longer term profit benefits
– As smartphone penetration rises, more and more services will use apps and the mobile internet – indeed, this is already happening in the education and
entrepreneurship sectors (see slides 56-58; companion, section 2)
65%
25% 23%
77%
20%
76%
52%
13%
85%
38%
0%
20%
40%
60%
80%
100%
Launch year
SMS dominant, but apps and mobile internet emerging
Pre 2009
2009-12
13
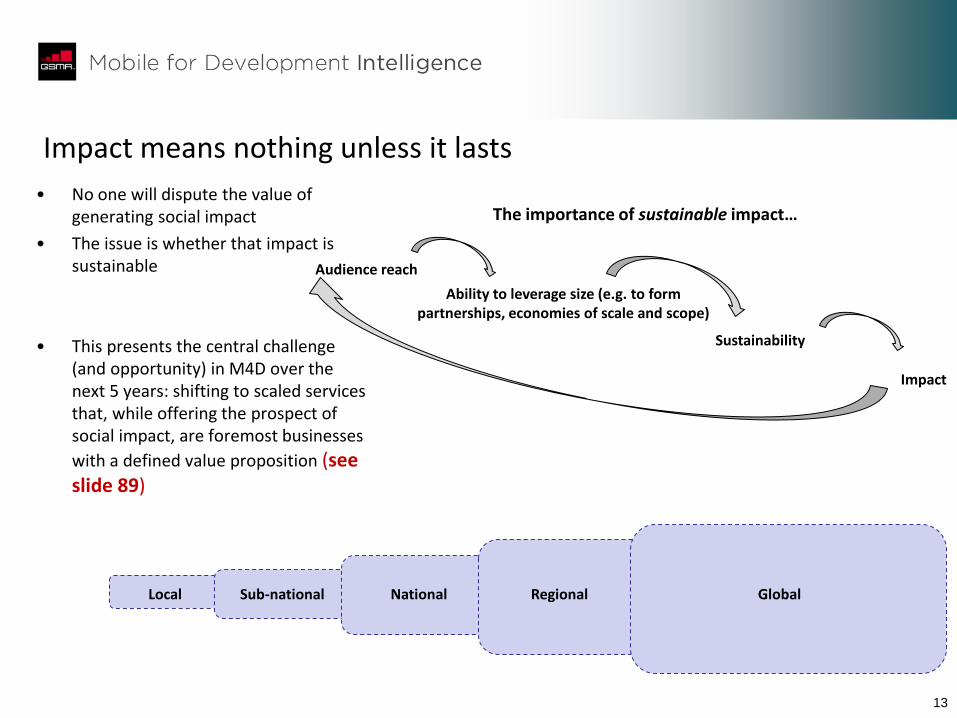
Impact means nothing unless it lasts
• No one will dispute the value of generating social impact
• The issue is whether that impact is sustainable
• This presents the central challenge (and opportunity) in M4D over the next 5 years: shifting to scaled services that, while offering the prospect of social impact, are foremost businesses
with a defined value proposition (see slide 89)
Audience reach
Ability to leverage size (e.g. to form partnerships, economies of scale and scope)
Sustainability
Impact
The importance of sustainable impact…
Local Sub-national National Regional Global
14
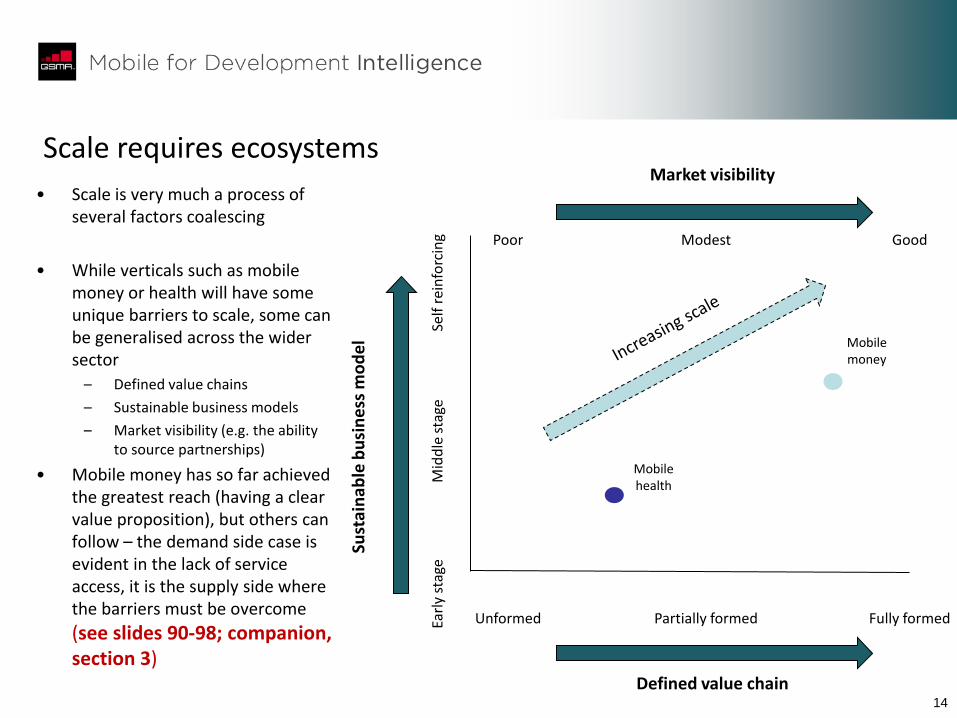
Scale requires ecosystems
• Scale is very much a process of several factors coalescing
• While verticals such as mobile money or health will have some unique barriers to scale, some can be generalised across the wider sector
– Defined value chains
– Sustainable business models
– Market visibility (e.g. the ability to source partnerships)
• Mobile money has so far achieved the greatest reach (having a clear value proposition), but others can follow – the demand side case is evident in the lack of service access, it is the supply side where the barriers must be overcome
(see slides 90-98; companion, section 3)
Fully formed Unformed Partially formed
Sust
ain
able
bu
sin
ess
mo
de
l
Self
rei
nfo
rcin
g Ea
rly
stag
e
Mid
dle
sta
ge
Mobile money
Mobile health
Good Poor Modest
Defined value chain
Market visibility
15
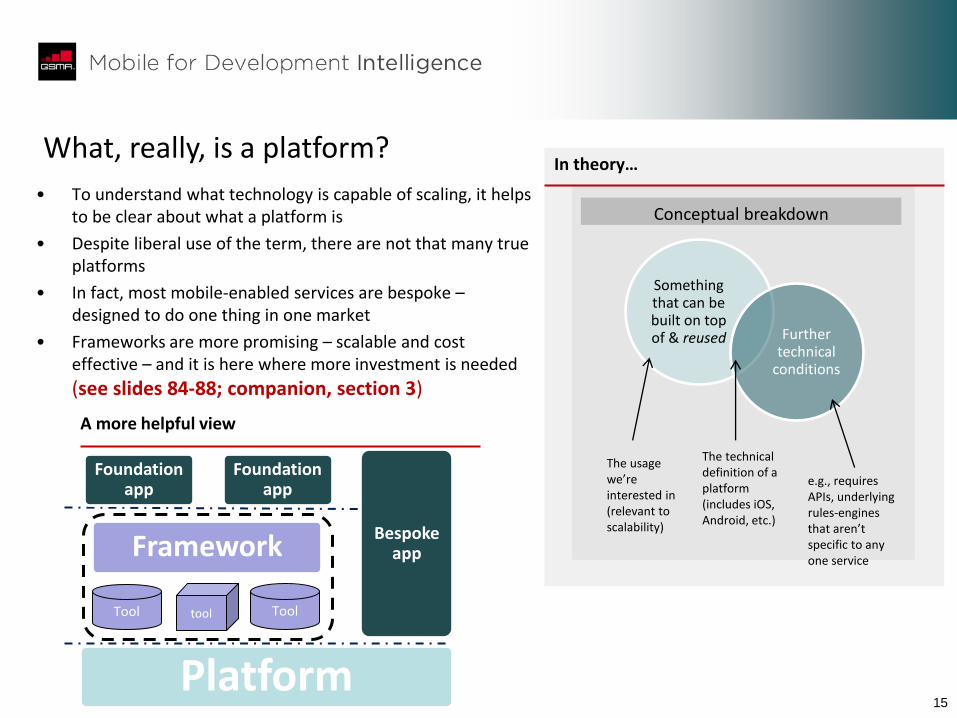
What, really, is a platform?
• To understand what technology is capable of scaling, it helps to be clear about what a platform is
• Despite liberal use of the term, there are not that many true platforms
• In fact, most mobile-enabled services are bespoke – designed to do one thing in one market
• Frameworks are more promising – scalable and cost effective – and it is here where more investment is needed
(see slides 84-88; companion, section 3)
In theory…
Conceptual breakdown
Something that can be built on top of & reused Further
technical conditions
e.g., requires APIs, underlying rules-engines that aren’t specific to any one service
The technical definition of a platform (includes iOS, Android, etc.)
The usage we’re interested in (relevant to scalability)
Tool tool
Platform
Framework
Foundation app
Foundation app
Bespoke app
Tool
A more helpful view
16
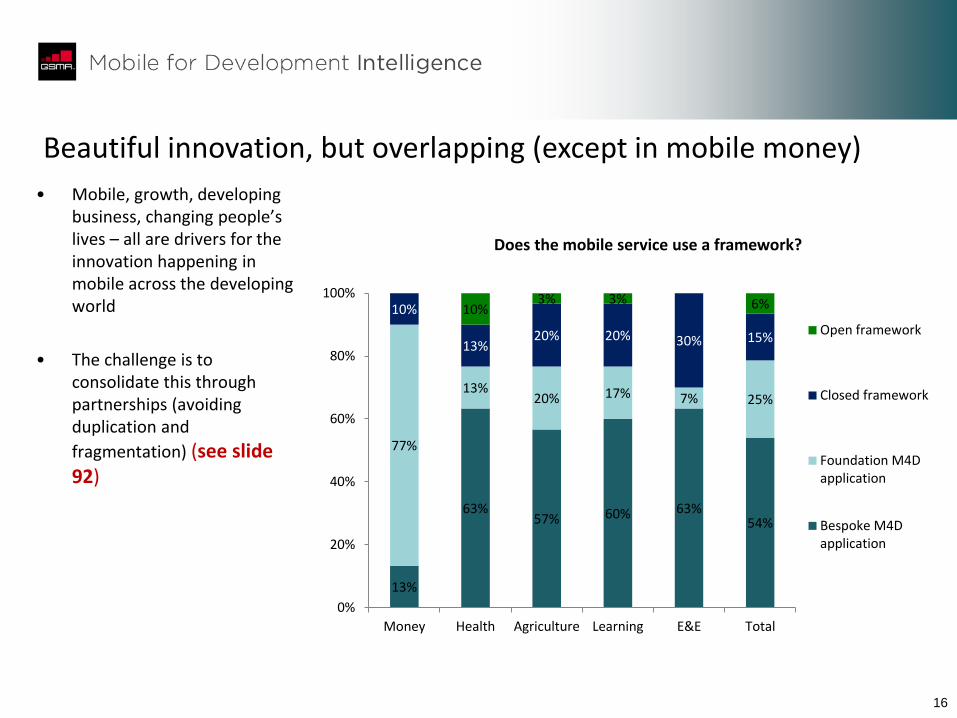
Beautiful innovation, but overlapping (except in mobile money)
• Mobile, growth, developing business, changing people’s lives – all are drivers for the innovation happening in mobile across the developing world
• The challenge is to consolidate this through partnerships (avoiding duplication and
fragmentation) (see slide 92)
13%
63% 57% 60% 63%
54%
77%
13% 20% 17% 7% 25%
10%
13% 20% 20% 30% 15%
10% 3% 3% 6%
0%
20%
40%
60%
80%
100%
Money Health Agriculture Learning E&E Total
Does the mobile service use a framework?
Open framework
Closed framework
Foundation M4Dapplication
Bespoke M4Dapplication
17
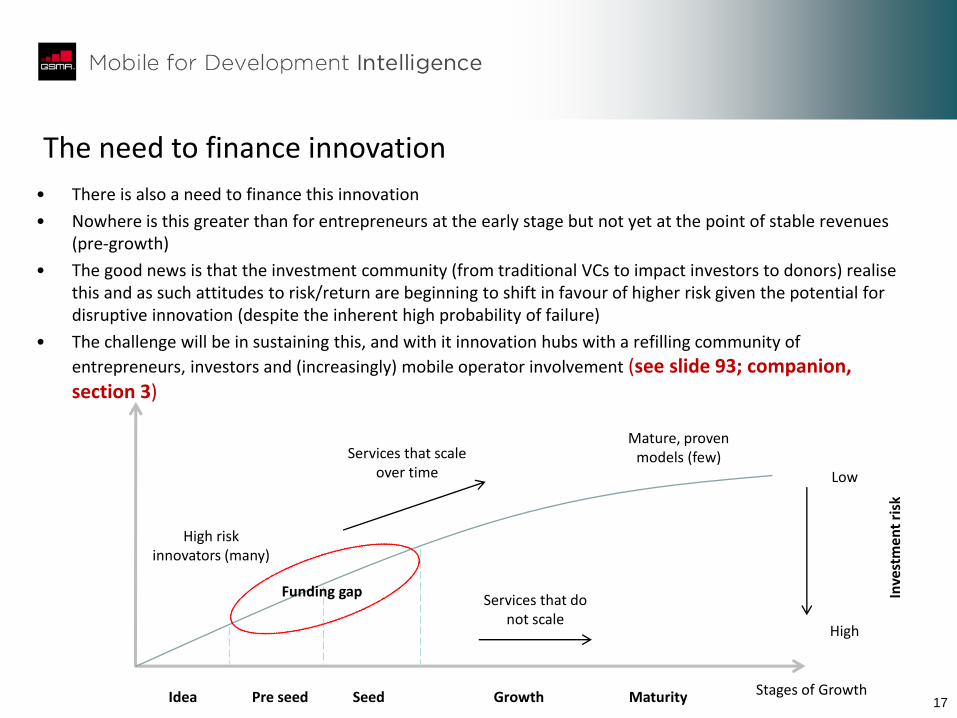
The need to finance innovation
• There is also a need to finance this innovation
• Nowhere is this greater than for entrepreneurs at the early stage but not yet at the point of stable revenues (pre-growth)
• The good news is that the investment community (from traditional VCs to impact investors to donors) realise this and as such attitudes to risk/return are beginning to shift in favour of higher risk given the potential for disruptive innovation (despite the inherent high probability of failure)
• The challenge will be in sustaining this, and with it innovation hubs with a refilling community of
entrepreneurs, investors and (increasingly) mobile operator involvement (see slide 93; companion, section 3)
Funding gap
Stages of Growth Idea Pre seed Seed Growth Maturity
High risk innovators (many)
Mature, proven models (few) Services that scale
over time
Services that do not scale
Low
High
Inve
stm
ent
risk

18 18
1. Executive summary
2. Key takeaways: a stakeholder guide
3. Market landscape: current and outlook
4. Impact of mobile on development sectors
5. Platforms, multiplicity and the drive for scale
6. User-centric innovation
7. Role of government
8. Appendix
19 19
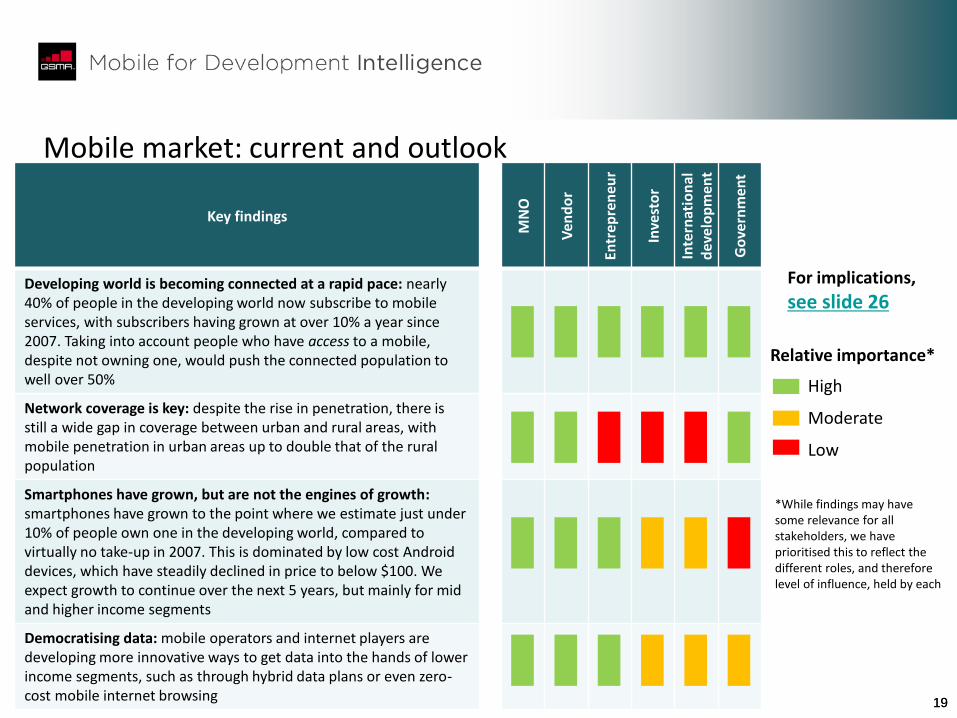
Mobile market: current and outlook
Key findings
MN
O
Ven
do
r
Entr
epre
neu
r
Inve
sto
r
Inte
rnat
ion
al
dev
elo
pm
ent
Go
vern
men
t
Developing world is becoming connected at a rapid pace: nearly 40% of people in the developing world now subscribe to mobile services, with subscribers having grown at over 10% a year since 2007. Taking into account people who have access to a mobile, despite not owning one, would push the connected population to well over 50%
Network coverage is key: despite the rise in penetration, there is still a wide gap in coverage between urban and rural areas, with mobile penetration in urban areas up to double that of the rural population
Smartphones have grown, but are not the engines of growth: smartphones have grown to the point where we estimate just under 10% of people own one in the developing world, compared to virtually no take-up in 2007. This is dominated by low cost Android devices, which have steadily declined in price to below $100. We expect growth to continue over the next 5 years, but mainly for mid and higher income segments
Democratising data: mobile operators and internet players are developing more innovative ways to get data into the hands of lower income segments, such as through hybrid data plans or even zero-cost mobile internet browsing
Relative importance*
High
Moderate
Low
*While findings may have some relevance for all stakeholders, we have prioritised this to reflect the different roles, and therefore level of influence, held by each
For implications,
see slide 26
20 20
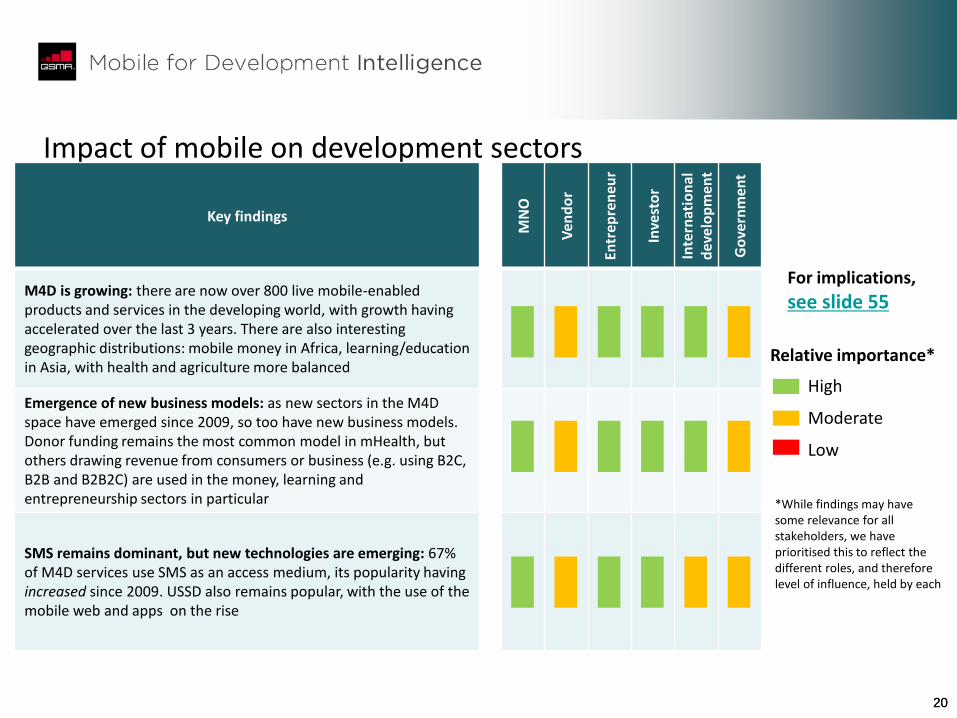
Impact of mobile on development sectors
Key findings
MN
O
Ven
do
r
Entr
epre
neu
r
Inve
sto
r
Inte
rnat
ion
al
dev
elo
pm
ent
Go
vern
men
t
M4D is growing: there are now over 800 live mobile-enabled products and services in the developing world, with growth having accelerated over the last 3 years. There are also interesting geographic distributions: mobile money in Africa, learning/education in Asia, with health and agriculture more balanced
Emergence of new business models: as new sectors in the M4D space have emerged since 2009, so too have new business models. Donor funding remains the most common model in mHealth, but others drawing revenue from consumers or business (e.g. using B2C, B2B and B2B2C) are used in the money, learning and entrepreneurship sectors in particular
SMS remains dominant, but new technologies are emerging: 67% of M4D services use SMS as an access medium, its popularity having increased since 2009. USSD also remains popular, with the use of the mobile web and apps on the rise
Relative importance*
High
Moderate
Low
*While findings may have some relevance for all stakeholders, we have prioritised this to reflect the different roles, and therefore level of influence, held by each
For implications,
see slide 55
21 21
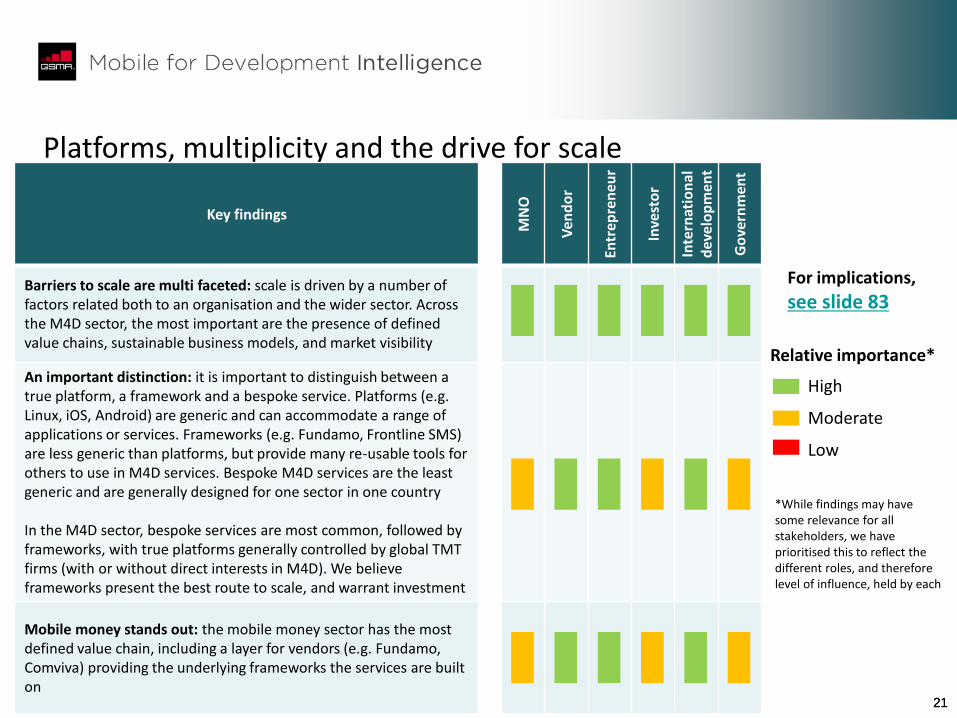
Platforms, multiplicity and the drive for scale
Key findings
MN
O
Ven
do
r
Entr
epre
neu
r
Inve
sto
r
Inte
rnat
ion
al
dev
elo
pm
ent
Go
vern
men
t
Barriers to scale are multi faceted: scale is driven by a number of factors related both to an organisation and the wider sector. Across the M4D sector, the most important are the presence of defined value chains, sustainable business models, and market visibility
An important distinction: it is important to distinguish between a true platform, a framework and a bespoke service. Platforms (e.g. Linux, iOS, Android) are generic and can accommodate a range of applications or services. Frameworks (e.g. Fundamo, Frontline SMS) are less generic than platforms, but provide many re-usable tools for others to use in M4D services. Bespoke M4D services are the least generic and are generally designed for one sector in one country In the M4D sector, bespoke services are most common, followed by frameworks, with true platforms generally controlled by global TMT firms (with or without direct interests in M4D). We believe frameworks present the best route to scale, and warrant investment
Mobile money stands out: the mobile money sector has the most defined value chain, including a layer for vendors (e.g. Fundamo, Comviva) providing the underlying frameworks the services are built on
Relative importance*
High
Moderate
Low
*While findings may have some relevance for all stakeholders, we have prioritised this to reflect the different roles, and therefore level of influence, held by each
For implications,
see slide 83
22 22
User-centric innovation
Key findings
MN
O
Ven
do
r
Entr
epre
neu
r
Inve
sto
r
Inte
rnat
ion
al
dev
elo
pm
ent
Go
vern
men
t
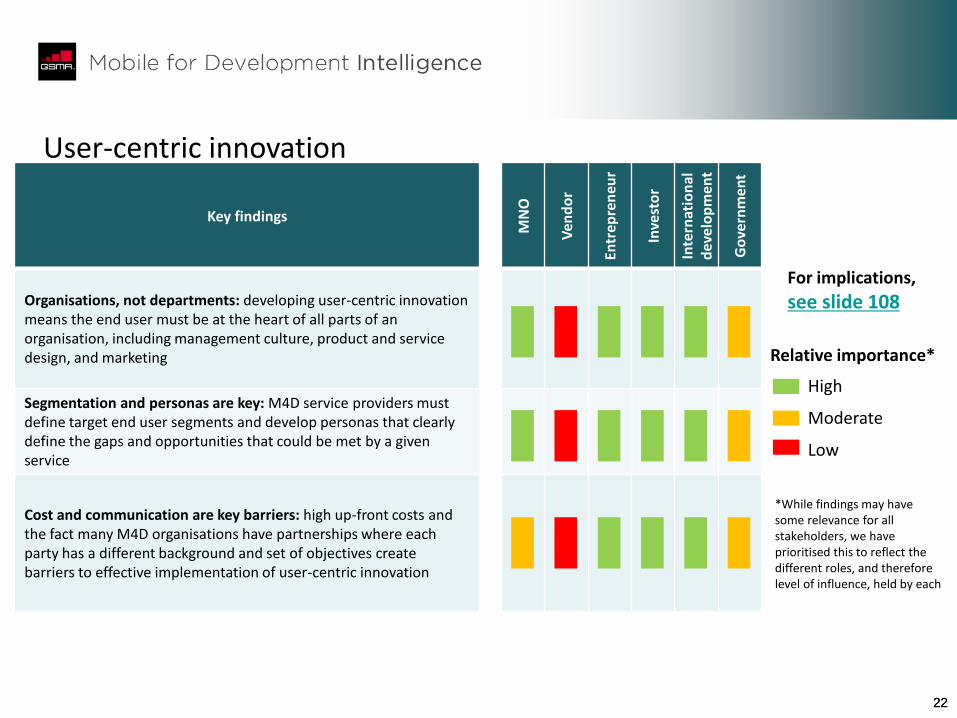
Organisations, not departments: developing user-centric innovation means the end user must be at the heart of all parts of an organisation, including management culture, product and service design, and marketing
Segmentation and personas are key: M4D service providers must define target end user segments and develop personas that clearly define the gaps and opportunities that could be met by a given service
Cost and communication are key barriers: high up-front costs and the fact many M4D organisations have partnerships where each party has a different background and set of objectives create barriers to effective implementation of user-centric innovation
Relative importance*
High
Moderate
Low
*While findings may have some relevance for all stakeholders, we have prioritised this to reflect the different roles, and therefore level of influence, held by each
For implications,
see slide 108
23 23
Role of government
Key findings
MN
O
Ven
do
r
Entr
epre
neu
r
Inve
sto
r
Inte
rnat
ion
al
dev
elo
pm
ent
Go
vern
men
t
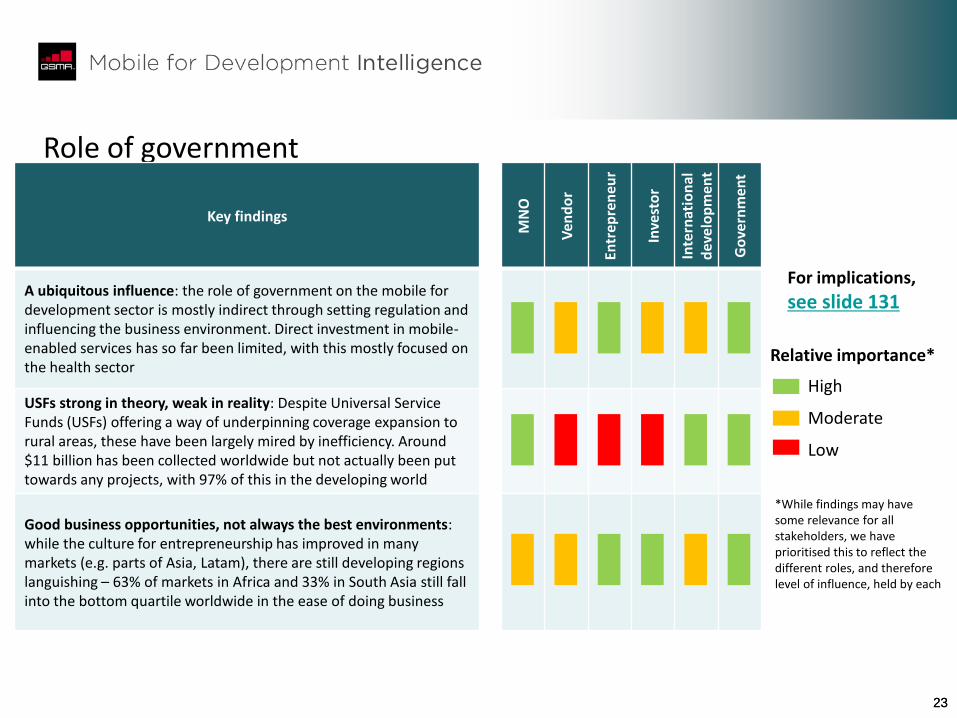
A ubiquitous influence: the role of government on the mobile for development sector is mostly indirect through setting regulation and influencing the business environment. Direct investment in mobile-enabled services has so far been limited, with this mostly focused on the health sector
USFs strong in theory, weak in reality: Despite Universal Service Funds (USFs) offering a way of underpinning coverage expansion to rural areas, these have been largely mired by inefficiency. Around $11 billion has been collected worldwide but not actually been put towards any projects, with 97% of this in the developing world
Good business opportunities, not always the best environments: while the culture for entrepreneurship has improved in many markets (e.g. parts of Asia, Latam), there are still developing regions languishing – 63% of markets in Africa and 33% in South Asia still fall into the bottom quartile worldwide in the ease of doing business
Relative importance*
High
Moderate
Low
*While findings may have some relevance for all stakeholders, we have prioritised this to reflect the different roles, and therefore level of influence, held by each
For implications,
see slide 131
24 24
• Mobile has become a transformative technology, with ownership in the developing world nearing 50%, and still significant headroom for growth over the next 5 years. This growth will likely be fuelled by populations at the lower and middle income level, further underlining the opportunity of mobile-enabled services targeting these segments
• Mobile for Development as a sector is growing. The challenge over the next 3-5 years is to move away from growth purely in the number of services towards a scalable and sustainable model. From a foundation perspective, we would highlight two points in this context:
– Focus on the cross sector. The route to scaling a sector is to re-use technology (frameworks) in different verticals, and in different countries. This horizontal, as opposed to vertical, way of thinking is driven by the recognition that, already, many services are essentially doing the same thing but under different brand names – whether this is in P2P (e.g. mobile-based recruitment solutions), in transactions using mobile money frameworks or other ways discussed in this report – which provides opportunities for leveraging existing technologies for more than their originally intended purpose
– Flexible business models. To harness the innovation that is being developed by entrepreneurs and other organisations, it is important that investors and foundations recognise the need for flexibility in business models. A crucial, yet largely unfulfilled, requirement is for organisations to align services with customer needs. In a rapidly changing consumer environment, these needs are fluid, and as such business models are likely to change over time. Established risk perceptions in mature markets will need to be reconsidered in light of this to ensure this supply of innovation is harnessed. This is indeed starting to happen, the challenge will be in gaining widespread recognition from the investment and development community. We believe the Rockefeller Foundation can play a key role, both through its interventions and role as a thought leader
• The cross sector view and driving sustainable business models are changes that will be most effective from a foundation perspective if integrated at the organisational level. We see this report as a platform for further discussions between MDI and the Rockefeller Foundation on achieving this, and ultimately helping both parties in articulating these implications to the wider mobile and development communities
Learnings: Rockefeller Foundation

25 25
1. Executive summary
2. Key takeaways: a stakeholder guide
3. Market landscape: current and outlook
4. Impact of mobile on development sectors
5. Platforms, multiplicity and the drive for scale
6. User-centric innovation
7. Role of government
8. Appendix
26 26
What you need to know
Key findings Key implications
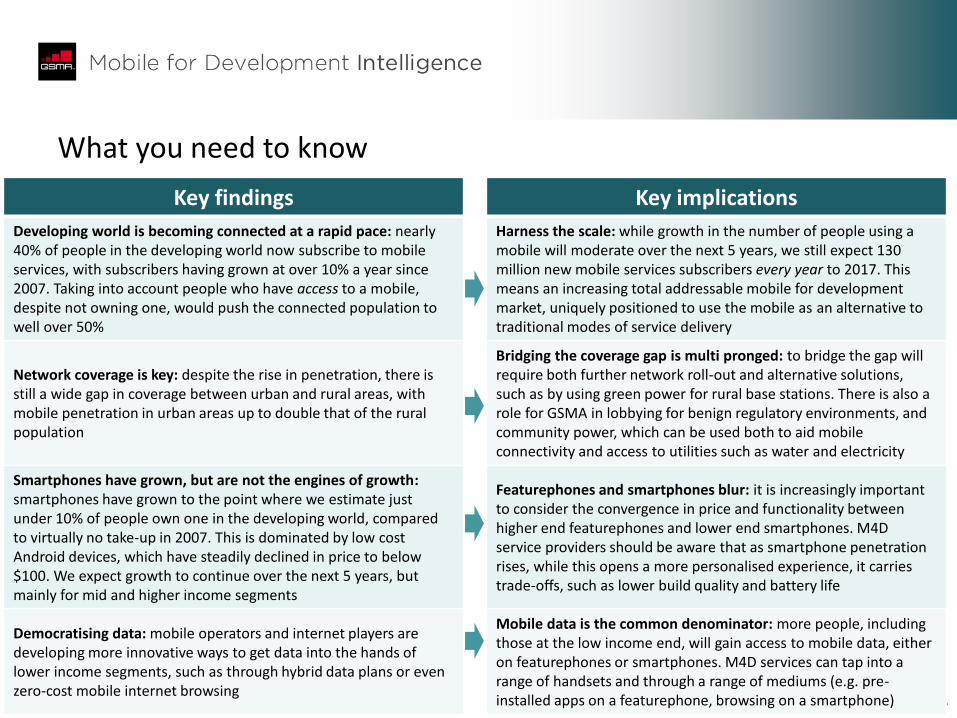
Developing world is becoming connected at a rapid pace: nearly 40% of people in the developing world now subscribe to mobile services, with subscribers having grown at over 10% a year since 2007. Taking into account people who have access to a mobile, despite not owning one, would push the connected population to well over 50%
Harness the scale: while growth in the number of people using a mobile will moderate over the next 5 years, we still expect 130 million new mobile services subscribers every year to 2017. This means an increasing total addressable mobile for development market, uniquely positioned to use the mobile as an alternative to traditional modes of service delivery
Network coverage is key: despite the rise in penetration, there is still a wide gap in coverage between urban and rural areas, with mobile penetration in urban areas up to double that of the rural population
Bridging the coverage gap is multi pronged: to bridge the gap will require both further network roll-out and alternative solutions, such as by using green power for rural base stations. There is also a role for GSMA in lobbying for benign regulatory environments, and community power, which can be used both to aid mobile connectivity and access to utilities such as water and electricity
Smartphones have grown, but are not the engines of growth: smartphones have grown to the point where we estimate just under 10% of people own one in the developing world, compared to virtually no take-up in 2007. This is dominated by low cost Android devices, which have steadily declined in price to below $100. We expect growth to continue over the next 5 years, but mainly for mid and higher income segments
Featurephones and smartphones blur: it is increasingly important to consider the convergence in price and functionality between higher end featurephones and lower end smartphones. M4D service providers should be aware that as smartphone penetration rises, while this opens a more personalised experience, it carries trade-offs, such as lower build quality and battery life
Democratising data: mobile operators and internet players are developing more innovative ways to get data into the hands of lower income segments, such as through hybrid data plans or even zero-cost mobile internet browsing
Mobile data is the common denominator: more people, including those at the low income end, will gain access to mobile data, either on featurephones or smartphones. M4D services can tap into a range of handsets and through a range of mediums (e.g. pre-installed apps on a featurephone, browsing on a smartphone)
27 27
24% 27%
30% 33%
36% 39%
1% 2% 2% 3% 5%
8%
2% 3% 3% 4% 5% 5%
0% 0% 0% 1% 1% 2%
0%
10%
20%
30%
40%
50%
2007 2008 2009 2010 2011 2012
Penetration of population (developing world)
Mobile
Smartphone
PC
Tablet
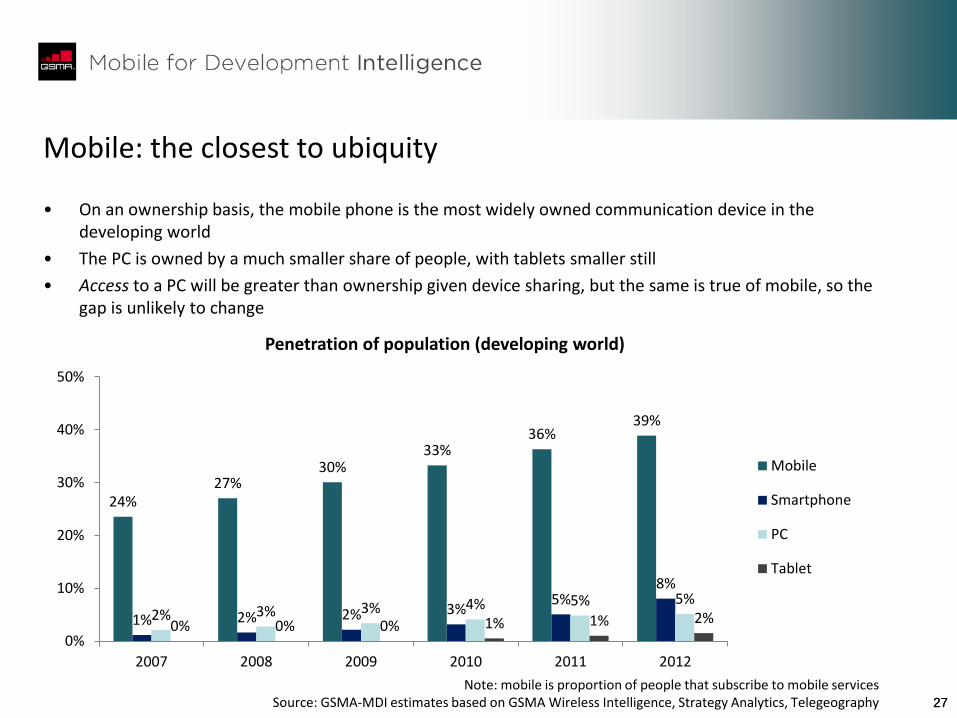
Mobile: the closest to ubiquity
• On an ownership basis, the mobile phone is the most widely owned communication device in the developing world
• The PC is owned by a much smaller share of people, with tablets smaller still
• Access to a PC will be greater than ownership given device sharing, but the same is true of mobile, so the gap is unlikely to change
Note: mobile is proportion of people that subscribe to mobile services Source: GSMA-MDI estimates based on GSMA Wireless Intelligence, Strategy Analytics, Telegeography
28 28
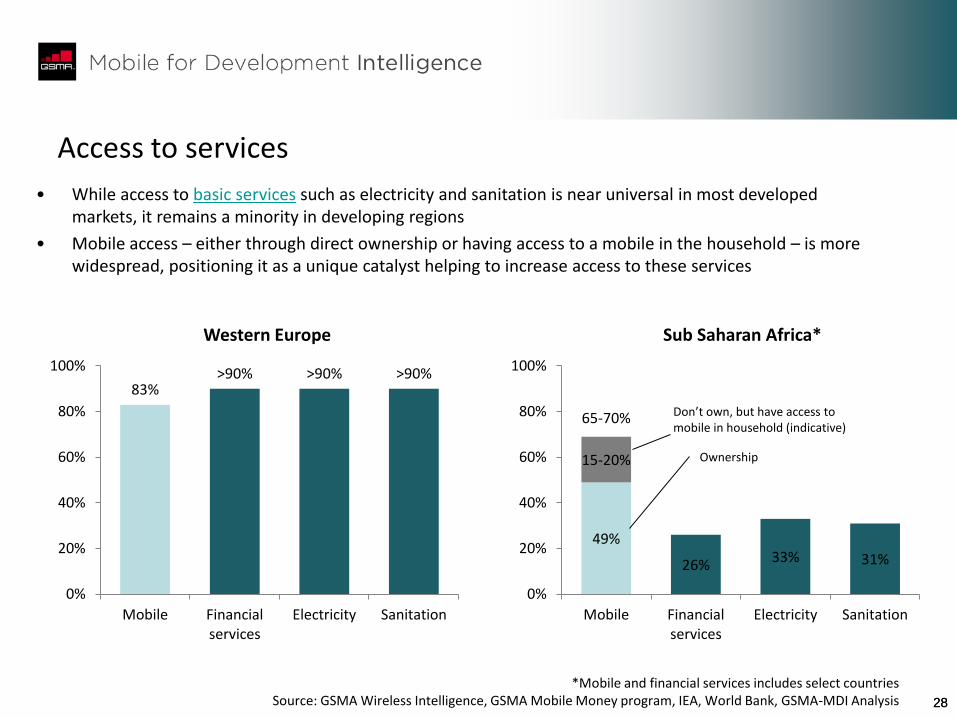
Access to services
49%
26% 33% 31%
15-20%
65-70%
0%
20%
40%
60%
80%
100%
Mobile Financialservices
Electricity Sanitation
Sub Saharan Africa*
83% >90% >90% >90%
0%
20%
40%
60%
80%
100%
Mobile Financialservices
Electricity Sanitation
Western Europe
• While access to basic services such as electricity and sanitation is near universal in most developed markets, it remains a minority in developing regions
• Mobile access – either through direct ownership or having access to a mobile in the household – is more widespread, positioning it as a unique catalyst helping to increase access to these services
Ownership
Don’t own, but have access to mobile in household (indicative)
*Mobile and financial services includes select countries Source: GSMA Wireless Intelligence, GSMA Mobile Money program, IEA, World Bank, GSMA-MDI Analysis
29 29
5.9
1.1
0
1
2
3
4
5
6
7
Developing Developed
Bill
ion
Population
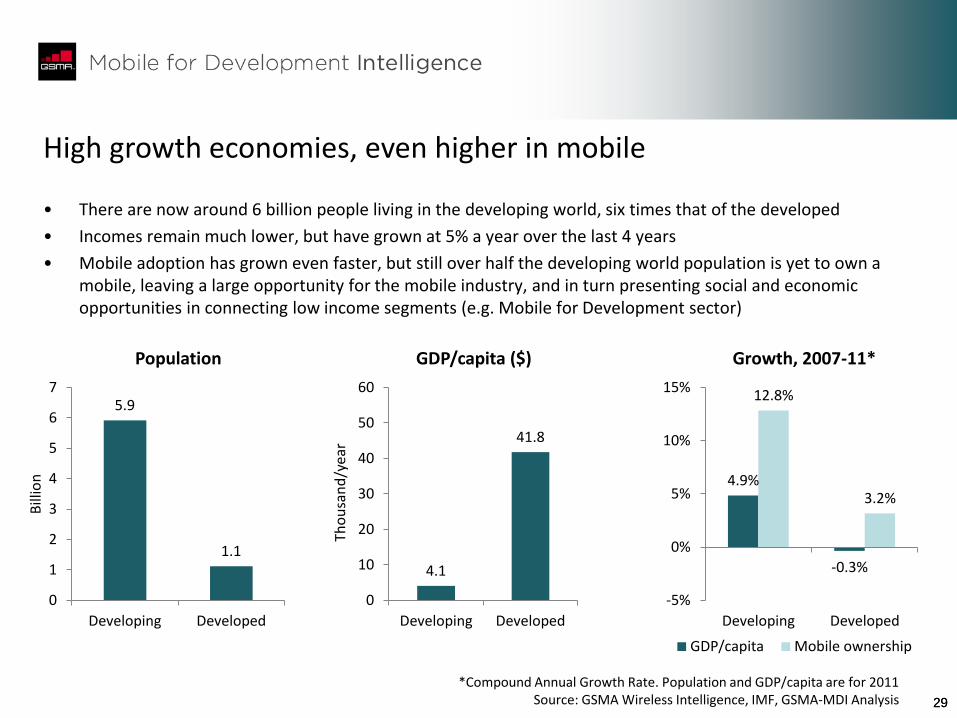
High growth economies, even higher in mobile
• There are now around 6 billion people living in the developing world, six times that of the developed
• Incomes remain much lower, but have grown at 5% a year over the last 4 years
• Mobile adoption has grown even faster, but still over half the developing world population is yet to own a mobile, leaving a large opportunity for the mobile industry, and in turn presenting social and economic opportunities in connecting low income segments (e.g. Mobile for Development sector)
4.1
41.8
0
10
20
30
40
50
60
Developing Developed
Tho
usa
nd
/yea
r GDP/capita ($)
4.9%
-0.3%
12.8%
3.2%
-5%
0%
5%
10%
15%
Developing Developed
Growth, 2007-11*
GDP/capita Mobile ownership
*Compound Annual Growth Rate. Population and GDP/capita are for 2011 Source: GSMA Wireless Intelligence, IMF, GSMA-MDI Analysis
30
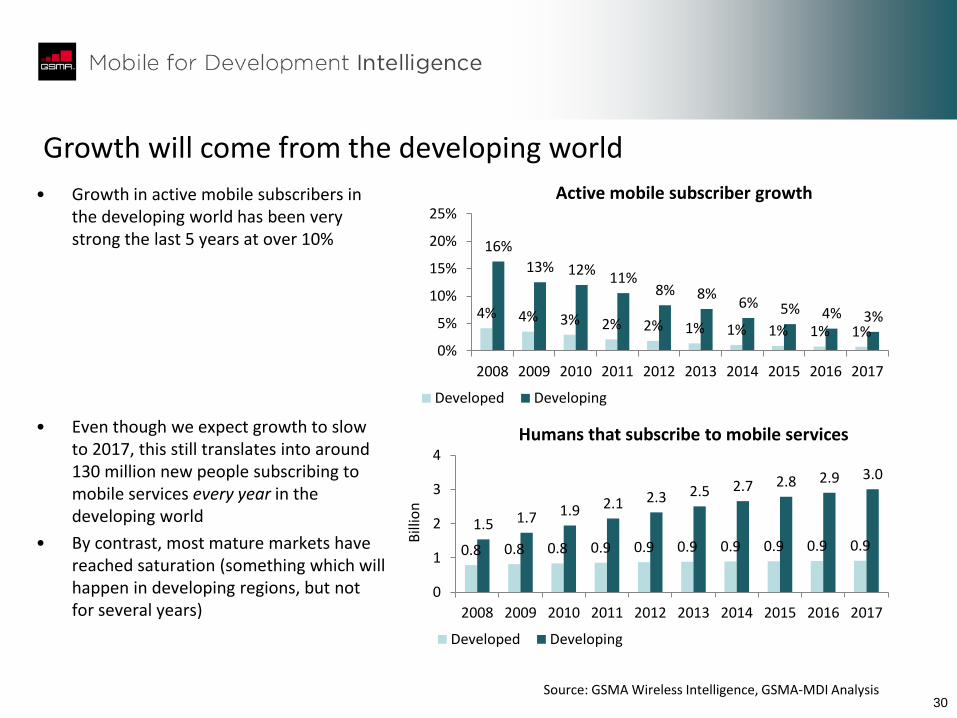
Growth will come from the developing world
• Growth in active mobile subscribers in the developing world has been very strong the last 5 years at over 10%
• Even though we expect growth to slow to 2017, this still translates into around 130 million new people subscribing to mobile services every year in the developing world
• By contrast, most mature markets have reached saturation (something which will happen in developing regions, but not for several years)
Source: GSMA Wireless Intelligence, GSMA-MDI Analysis
4% 4% 3% 2% 2% 1% 1% 1% 1% 1%
16%
13% 12% 11%
8% 8% 6% 5% 4% 3%
0%
5%
10%
15%
20%
25%
2008 2009 2010 2011 2012 2013 2014 2015 2016 2017
Active mobile subscriber growth
Developed Developing
0.8 0.8 0.8 0.9 0.9 0.9 0.9 0.9 0.9 0.9
1.5 1.7 1.9 2.1 2.3 2.5 2.7 2.8 2.9 3.0
0
1
2
3
4
2008 2009 2010 2011 2012 2013 2014 2015 2016 2017
Bill
ion
Humans that subscribe to mobile services
Developed Developing
31
Penetration
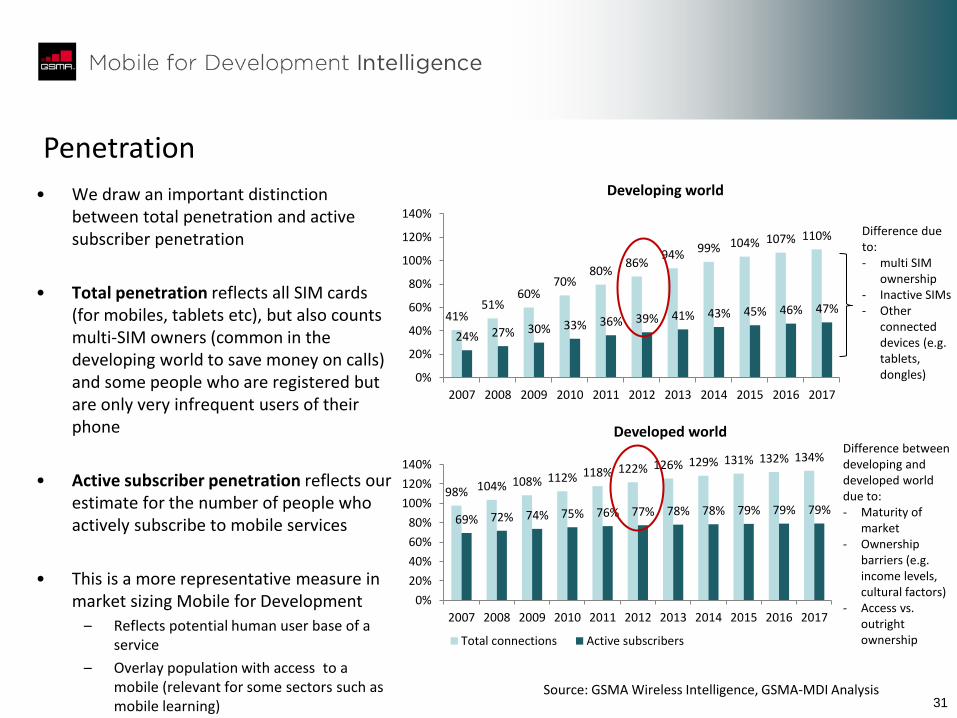
• We draw an important distinction between total penetration and active subscriber penetration
• Total penetration reflects all SIM cards (for mobiles, tablets etc), but also counts multi-SIM owners (common in the developing world to save money on calls) and some people who are registered but are only very infrequent users of their phone
• Active subscriber penetration reflects our estimate for the number of people who actively subscribe to mobile services
• This is a more representative measure in market sizing Mobile for Development
– Reflects potential human user base of a service
– Overlay population with access to a mobile (relevant for some sectors such as mobile learning)
41% 51%
60% 70%
80% 86%
94% 99% 104% 107% 110%
24% 27% 30% 33% 36% 39% 41% 43% 45% 46% 47%
0%
20%
40%
60%
80%
100%
120%
140%
2007 2008 2009 2010 2011 2012 2013 2014 2015 2016 2017
Developing world
Source: GSMA Wireless Intelligence, GSMA-MDI Analysis
98% 104% 108% 112% 118% 122% 126% 129% 131% 132% 134%
69% 72% 74% 75% 76% 77% 78% 78% 79% 79% 79%
0%
20%
40%
60%
80%
100%
120%
140%
2007 2008 2009 2010 2011 2012 2013 2014 2015 2016 2017
Developed world
Total connections Active subscribers
Difference due to: - multi SIM
ownership - Inactive SIMs - Other
connected devices (e.g. tablets, dongles)
Difference between developing and developed world due to: - Maturity of
market - Ownership
barriers (e.g. income levels, cultural factors)
- Access vs. outright ownership
32
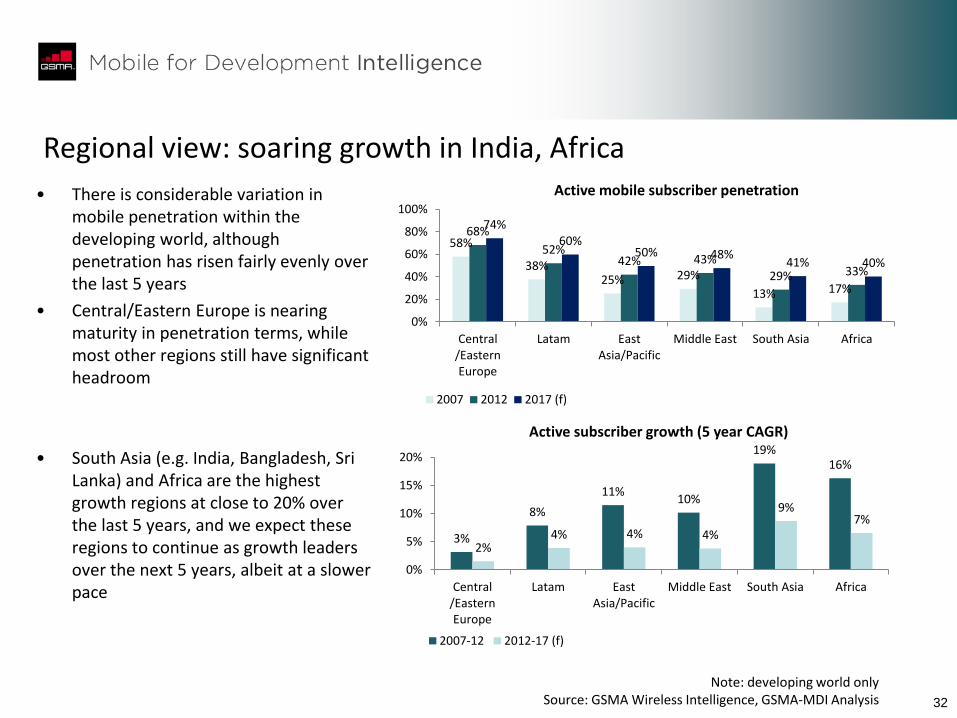
Regional view: soaring growth in India, Africa
• There is considerable variation in mobile penetration within the developing world, although penetration has risen fairly evenly over the last 5 years
• Central/Eastern Europe is nearing maturity in penetration terms, while most other regions still have significant headroom
• South Asia (e.g. India, Bangladesh, Sri Lanka) and Africa are the highest growth regions at close to 20% over the last 5 years, and we expect these regions to continue as growth leaders over the next 5 years, albeit at a slower pace
58%
38% 25% 29%
13% 17%
68%
52% 42% 43%
29% 33%
74% 60%
50% 48% 41% 40%
0%
20%
40%
60%
80%
100%
Central/EasternEurope
Latam EastAsia/Pacific
Middle East South Asia Africa
Active mobile subscriber penetration
2007 2012 2017 (f)
Note: developing world only Source: GSMA Wireless Intelligence, GSMA-MDI Analysis
3%
8%
11% 10%
19% 16%
2% 4% 4% 4%
9% 7%
0%
5%
10%
15%
20%
Central/EasternEurope
Latam EastAsia/Pacific
Middle East South Asia Africa
Active subscriber growth (5 year CAGR)
2007-12 2012-17 (f)
33 33
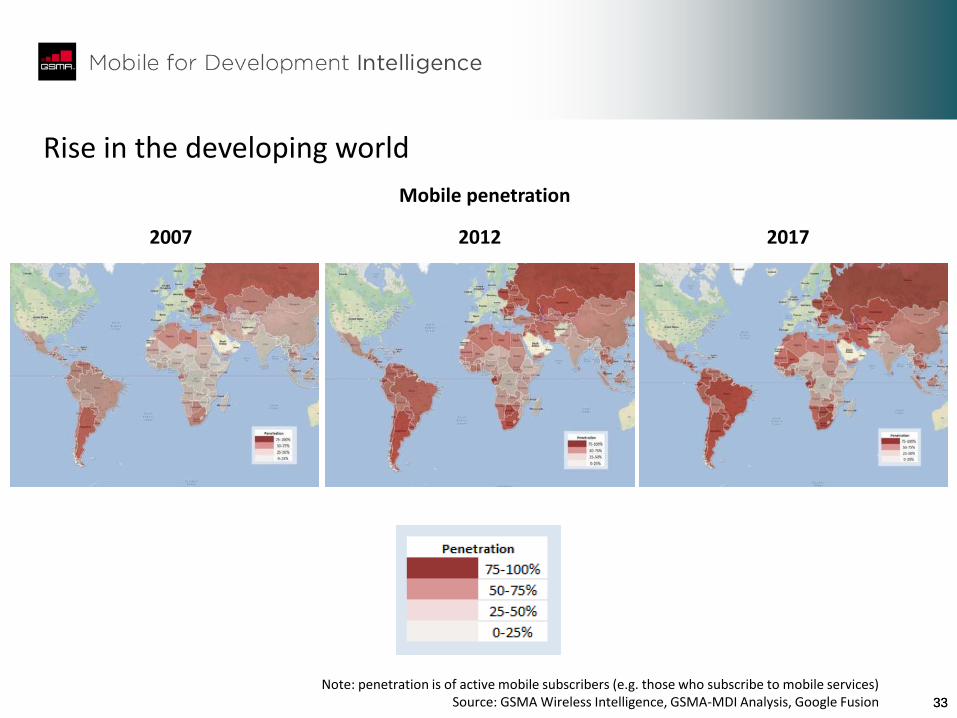
Rise in the developing world
2007 2017
Mobile penetration
Note: penetration is of active mobile subscribers (e.g. those who subscribe to mobile services) Source: GSMA Wireless Intelligence, GSMA-MDI Analysis, Google Fusion
2012
34
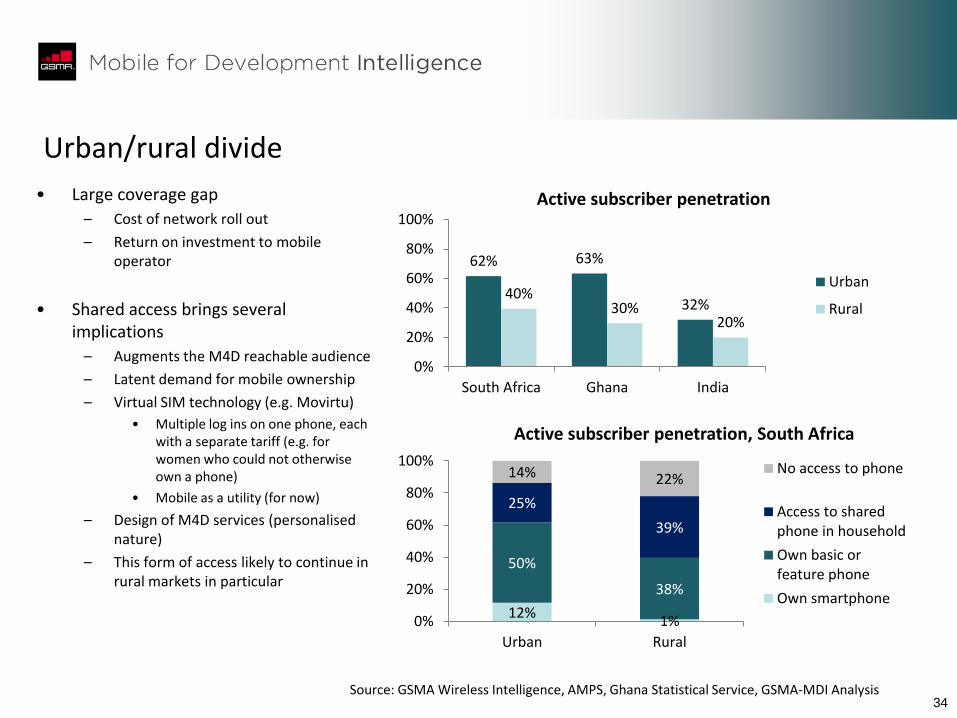
Urban/rural divide
62% 63%
32% 40%
30% 20%
0%
20%
40%
60%
80%
100%
South Africa Ghana India
Active subscriber penetration
Urban
Rural
• Large coverage gap
– Cost of network roll out
– Return on investment to mobile operator
• Shared access brings several implications
– Augments the M4D reachable audience
– Latent demand for mobile ownership
– Virtual SIM technology (e.g. Movirtu)
• Multiple log ins on one phone, each with a separate tariff (e.g. for women who could not otherwise own a phone)
• Mobile as a utility (for now)
– Design of M4D services (personalised nature)
– This form of access likely to continue in rural markets in particular
12% 1%
50%
38%
25%
39%
14% 22%
0%
20%
40%
60%
80%
100%
Urban Rural
Active subscriber penetration, South Africa
No access to phone
Access to sharedphone in household
Own basic orfeature phone
Own smartphone
Source: GSMA Wireless Intelligence, AMPS, Ghana Statistical Service, GSMA-MDI Analysis
35
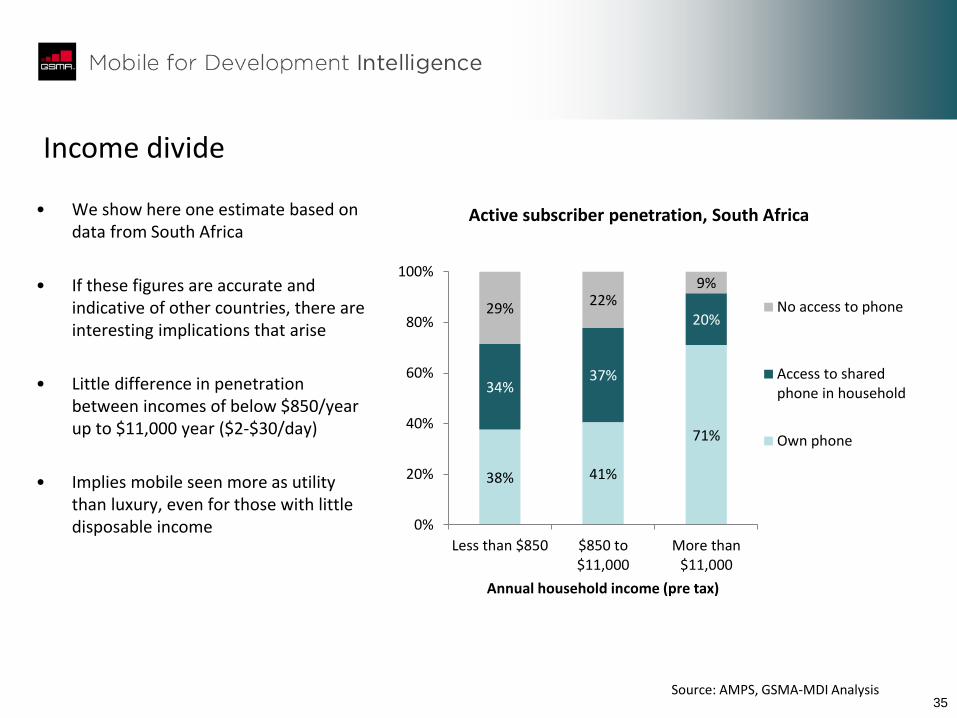
Income divide
• We show here one estimate based on data from South Africa
• If these figures are accurate and indicative of other countries, there are interesting implications that arise
• Little difference in penetration between incomes of below $850/year up to $11,000 year ($2-$30/day)
• Implies mobile seen more as utility than luxury, even for those with little disposable income
38% 41%
71%
34% 37%
20% 29%
22% 9%
0%
20%
40%
60%
80%
100%
Less than $850 $850 to$11,000
More than$11,000
Annual household income (pre tax)
Active subscriber penetration, South Africa
No access to phone
Access to sharedphone in household
Own phone
Source: AMPS, GSMA-MDI Analysis
36 36
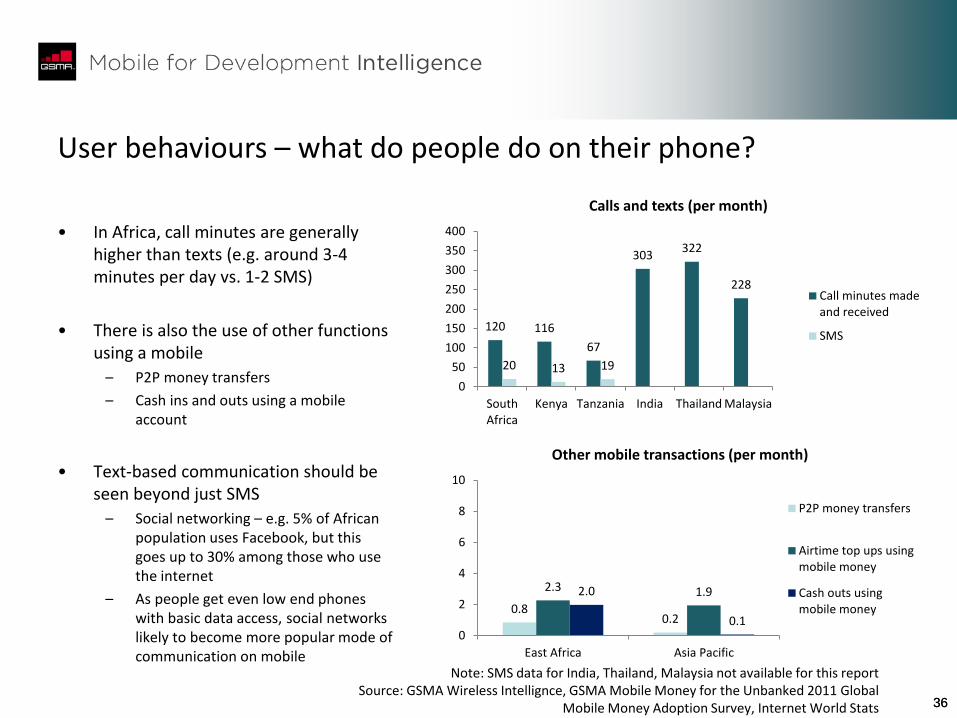
User behaviours – what do people do on their phone?
• In Africa, call minutes are generally higher than texts (e.g. around 3-4 minutes per day vs. 1-2 SMS)
• There is also the use of other functions using a mobile
– P2P money transfers
– Cash ins and outs using a mobile account
• Text-based communication should be seen beyond just SMS
– Social networking – e.g. 5% of African population uses Facebook, but this goes up to 30% among those who use the internet
– As people get even low end phones with basic data access, social networks likely to become more popular mode of communication on mobile
120 116
67
303 322
228
20 13 19
0
50
100
150
200
250
300
350
400
SouthAfrica
Kenya Tanzania India Thailand Malaysia
Calls and texts (per month)
Call minutes madeand received
SMS
0.8 0.2
2.3 1.9 2.0
0.1 0
2
4
6
8
10
East Africa Asia Pacific
Other mobile transactions (per month)
P2P money transfers
Airtime top ups usingmobile money
Cash outs usingmobile money
Note: SMS data for India, Thailand, Malaysia not available for this report Source: GSMA Wireless Intellignce, GSMA Mobile Money for the Unbanked 2011 Global
Mobile Money Adoption Survey, Internet World Stats
37 37
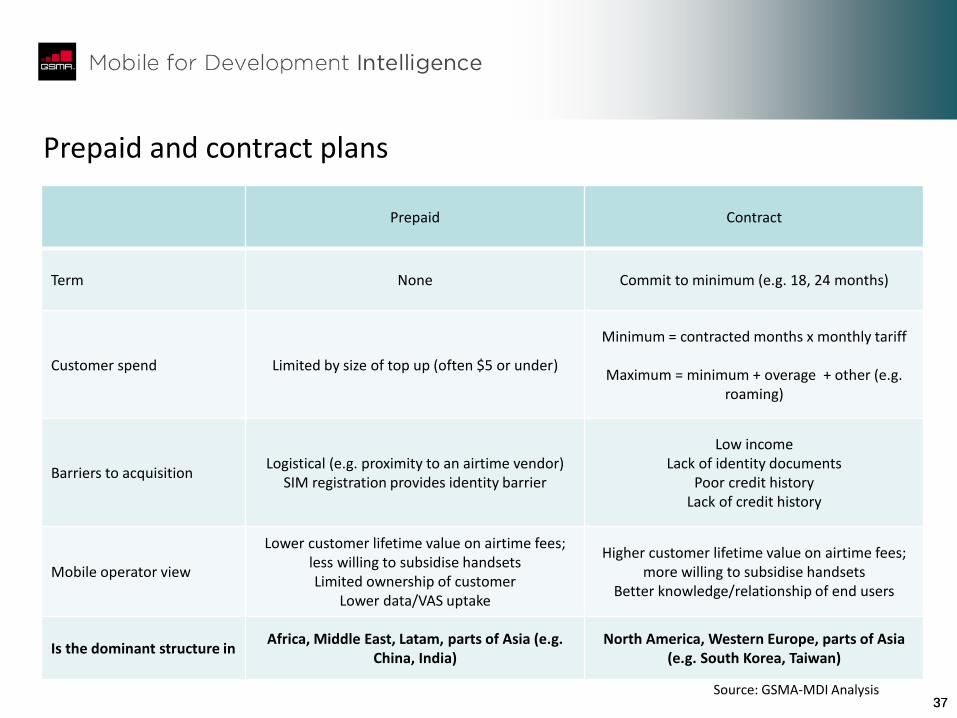
Prepaid and contract plans
Prepaid Contract
Term None Commit to minimum (e.g. 18, 24 months)
Customer spend Limited by size of top up (often $5 or under)
Minimum = contracted months x monthly tariff
Maximum = minimum + overage + other (e.g. roaming)
Barriers to acquisition Logistical (e.g. proximity to an airtime vendor)
SIM registration provides identity barrier
Low income Lack of identity documents
Poor credit history Lack of credit history
Mobile operator view
Lower customer lifetime value on airtime fees; less willing to subsidise handsets Limited ownership of customer
Lower data/VAS uptake
Higher customer lifetime value on airtime fees; more willing to subsidise handsets
Better knowledge/relationship of end users
Is the dominant structure in Africa, Middle East, Latam, parts of Asia (e.g.
China, India) North America, Western Europe, parts of Asia
(e.g. South Korea, Taiwan)
Source: GSMA-MDI Analysis
38 38
Digital pioneers
Connected players
Fast growers
Discoverers
Co
ntr
act
shar
e o
f b
ase
Smartphone penetration
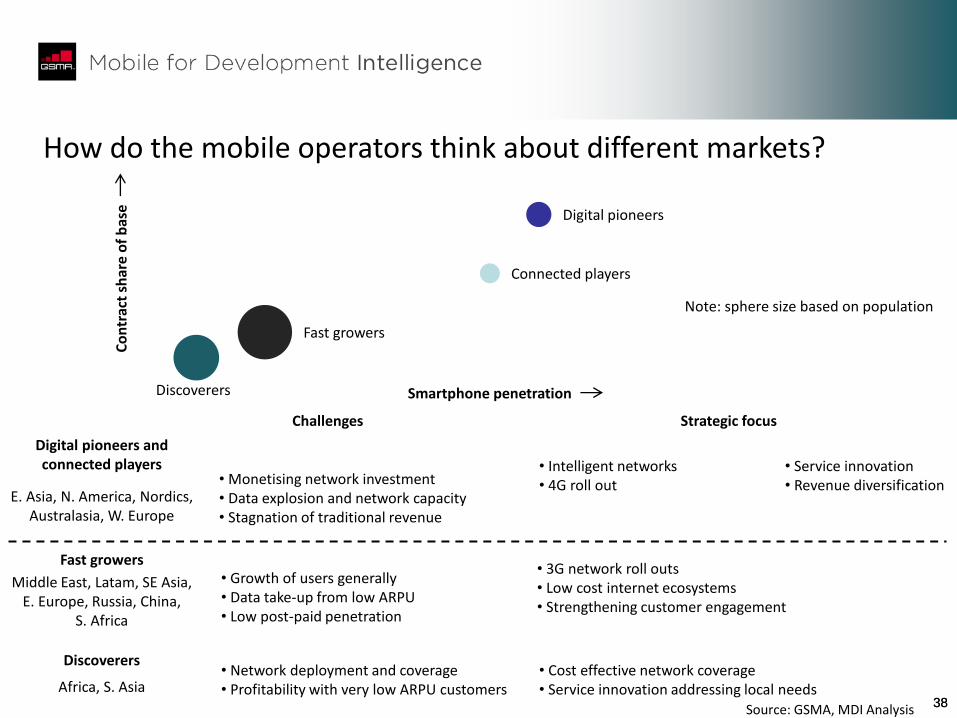
How do the mobile operators think about different markets?
• Monetising network investment • Data explosion and network capacity • Stagnation of traditional revenue
• Intelligent networks • 4G roll out
• Growth of users generally • Data take-up from low ARPU • Low post-paid penetration
• 3G network roll outs • Low cost internet ecosystems • Strengthening customer engagement
• Network deployment and coverage • Profitability with very low ARPU customers
• Cost effective network coverage • Service innovation addressing local needs
• Service innovation • Revenue diversification
Digital pioneers and connected players
Fast growers
Discoverers
Challenges Strategic focus
E. Asia, N. America, Nordics, Australasia, W. Europe
Middle East, Latam, SE Asia, E. Europe, Russia, China,
S. Africa
Africa, S. Asia
Note: sphere size based on population
Source: GSMA, MDI Analysis
39
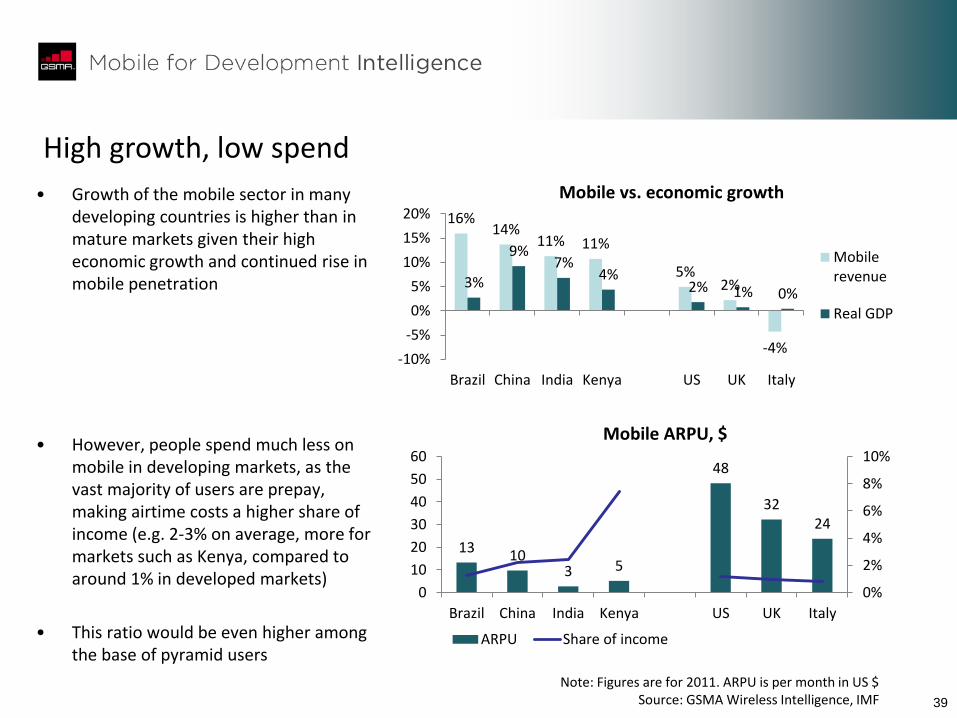
High growth, low spend
16% 14%
11% 11%
5% 2%
-4%
3%
9% 7%
4% 2% 1% 0%
-10%
-5%
0%
5%
10%
15%
20%
Brazil China India Kenya US UK Italy
Mobile vs. economic growth
Mobilerevenue
Real GDP
• Growth of the mobile sector in many developing countries is higher than in mature markets given their high economic growth and continued rise in mobile penetration
• However, people spend much less on mobile in developing markets, as the vast majority of users are prepay, making airtime costs a higher share of income (e.g. 2-3% on average, more for markets such as Kenya, compared to around 1% in developed markets)
• This ratio would be even higher among the base of pyramid users
13 10
3 5
48
32 24
0%
2%
4%
6%
8%
10%
0
10
20
30
40
50
60
Brazil China India Kenya US UK Italy
Mobile ARPU, $
ARPU Share of income
Note: Figures are for 2011. ARPU is per month in US $ Source: GSMA Wireless Intelligence, IMF
40 40
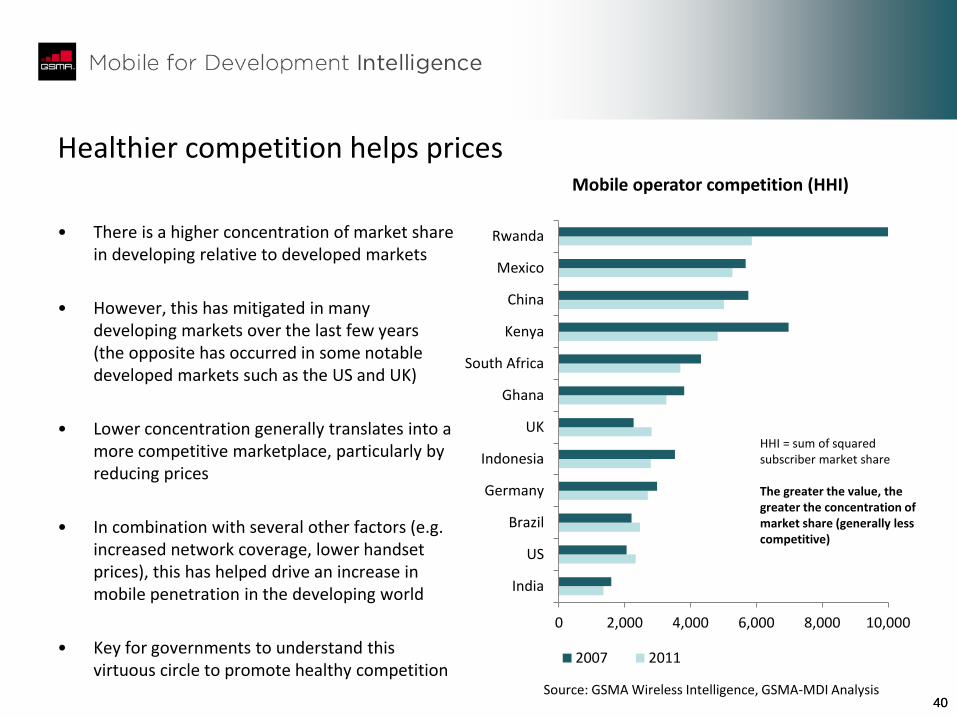
Healthier competition helps prices
• There is a higher concentration of market share in developing relative to developed markets
• However, this has mitigated in many developing markets over the last few years (the opposite has occurred in some notable developed markets such as the US and UK)
• Lower concentration generally translates into a more competitive marketplace, particularly by reducing prices
• In combination with several other factors (e.g. increased network coverage, lower handset prices), this has helped drive an increase in mobile penetration in the developing world
• Key for governments to understand this virtuous circle to promote healthy competition
0 2,000 4,000 6,000 8,000 10,000
India
US
Brazil
Germany
Indonesia
UK
Ghana
South Africa
Kenya
China
Mexico
Rwanda
Mobile operator competition (HHI)
2007 2011
Source: GSMA Wireless Intelligence, GSMA-MDI Analysis
HHI = sum of squared subscriber market share The greater the value, the greater the concentration of market share (generally less competitive)
41
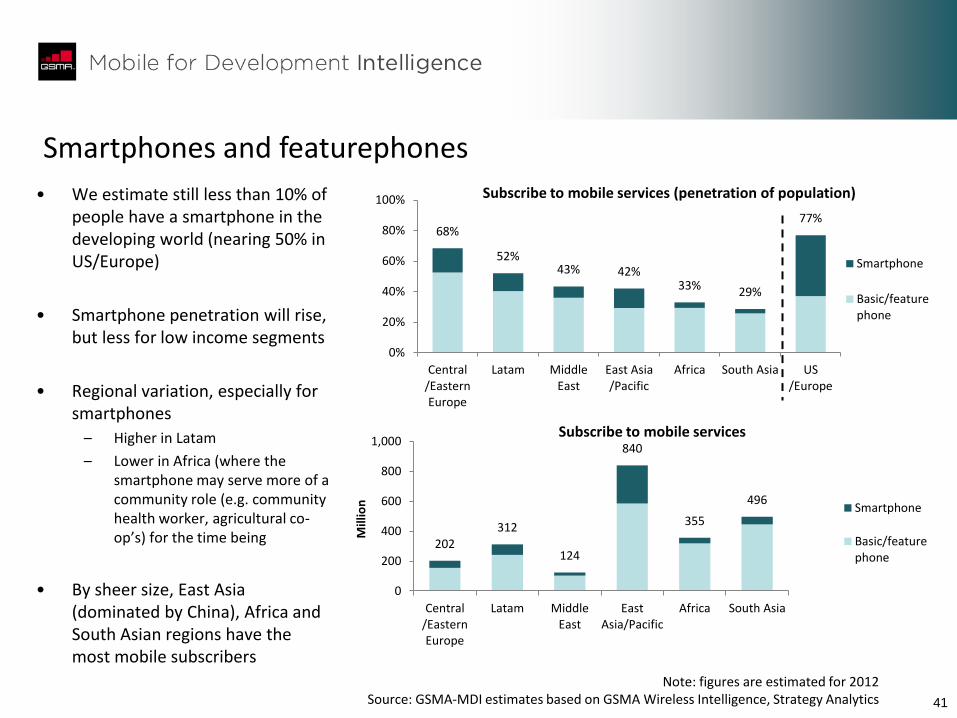
Smartphones and featurephones
• We estimate still less than 10% of people have a smartphone in the developing world (nearing 50% in US/Europe)
• Smartphone penetration will rise, but less for low income segments
• Regional variation, especially for smartphones
– Higher in Latam
– Lower in Africa (where the smartphone may serve more of a community role (e.g. community health worker, agricultural co-op’s) for the time being
• By sheer size, East Asia (dominated by China), Africa and South Asian regions have the most mobile subscribers
68%
52% 43% 42%
33% 29%
77%
0%
20%
40%
60%
80%
100%
Central/EasternEurope
Latam MiddleEast
East Asia/Pacific
Africa South Asia US/Europe
Subscribe to mobile services (penetration of population)
Smartphone
Basic/featurephone
202 312
124
840
355
496
0
200
400
600
800
1,000
Central/EasternEurope
Latam MiddleEast
EastAsia/Pacific
Africa South Asia
Mill
ion
Subscribe to mobile services
Smartphone
Basic/featurephone
Note: figures are estimated for 2012 Source: GSMA-MDI estimates based on GSMA Wireless Intelligence, Strategy Analytics
42 42
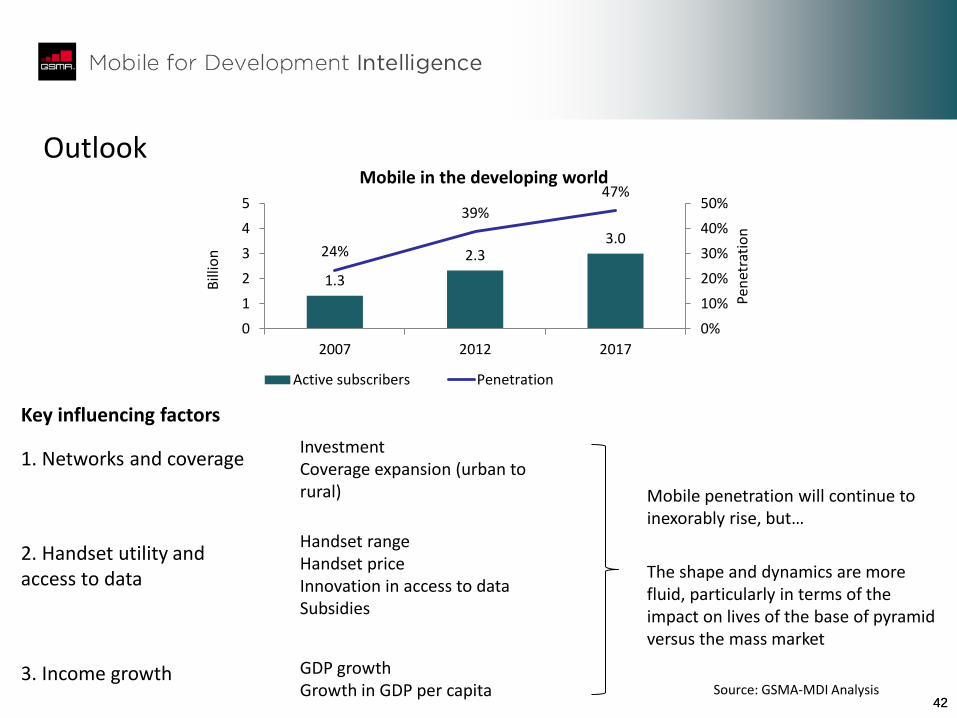
Outlook
1.3
2.3 3.0
24%
39%
47%
0%
10%
20%
30%
40%
50%
0
1
2
3
4
5
2007 2012 2017
Pen
etra
tio
n
Bill
ion
Mobile in the developing world
Active subscribers Penetration
Mobile penetration will continue to inexorably rise, but…
The shape and dynamics are more fluid, particularly in terms of the impact on lives of the base of pyramid versus the mass market
1. Networks and coverage Investment Coverage expansion (urban to rural)
Key influencing factors
2. Handset utility and access to data
3. Income growth
Handset range Handset price Innovation in access to data Subsidies
GDP growth Growth in GDP per capita Source: GSMA-MDI Analysis
43 43
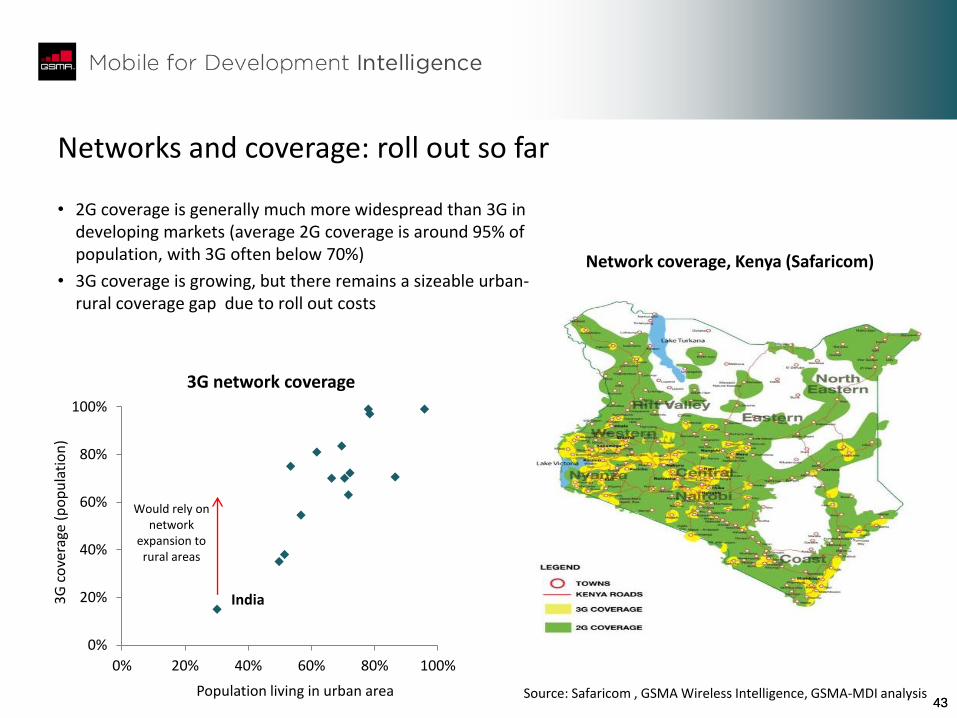
Networks and coverage: roll out so far
• 2G coverage is generally much more widespread than 3G in developing markets (average 2G coverage is around 95% of population, with 3G often below 70%)
• 3G coverage is growing, but there remains a sizeable urban-rural coverage gap due to roll out costs
Network coverage, Kenya (Safaricom)
Source: Safaricom , GSMA Wireless Intelligence, GSMA-MDI analysis
0%
20%
40%
60%
80%
100%
0% 20% 40% 60% 80% 100%
3G
co
vera
ge (
po
pu
lati
on
)
Population living in urban area
3G network coverage
India
Would rely on network
expansion to rural areas
44 44
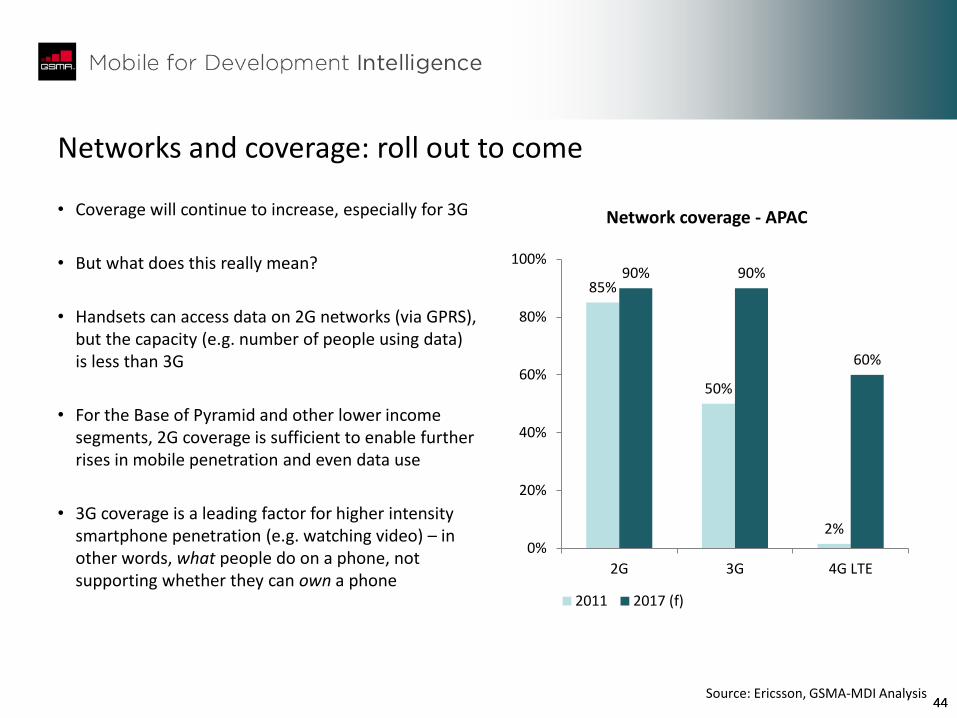
Networks and coverage: roll out to come
85%
50%
2%
90% 90%
60%
0%
20%
40%
60%
80%
100%
2G 3G 4G LTE
Network coverage - APAC
2011 2017 (f)
Source: Ericsson, GSMA-MDI Analysis
• Coverage will continue to increase, especially for 3G
• But what does this really mean?
• Handsets can access data on 2G networks (via GPRS), but the capacity (e.g. number of people using data) is less than 3G
• For the Base of Pyramid and other lower income segments, 2G coverage is sufficient to enable further rises in mobile penetration and even data use
• 3G coverage is a leading factor for higher intensity smartphone penetration (e.g. watching video) – in other words, what people do on a phone, not supporting whether they can own a phone
45
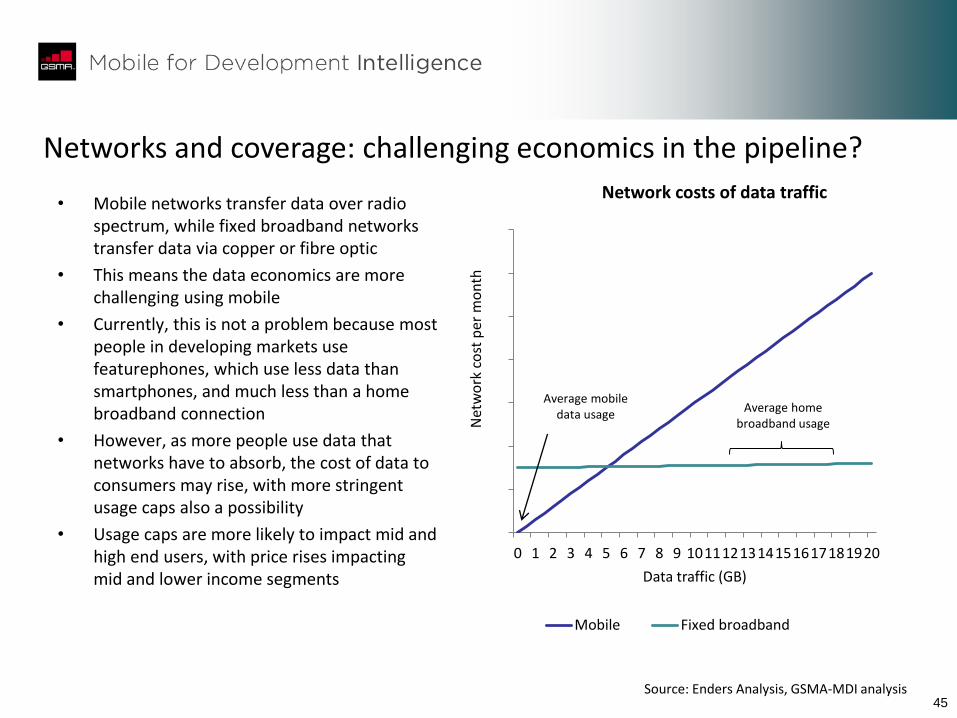
Networks and coverage: challenging economics in the pipeline?
• Mobile networks transfer data over radio spectrum, while fixed broadband networks transfer data via copper or fibre optic
• This means the data economics are more challenging using mobile
• Currently, this is not a problem because most people in developing markets use featurephones, which use less data than smartphones, and much less than a home broadband connection
• However, as more people use data that networks have to absorb, the cost of data to consumers may rise, with more stringent usage caps also a possibility
• Usage caps are more likely to impact mid and high end users, with price rises impacting mid and lower income segments
Source: Enders Analysis, GSMA-MDI analysis
0 1 2 3 4 5 6 7 8 9 1011121314151617181920
Net
wo
rk c
ost
per
mo
nth
Data traffic (GB)
Network costs of data traffic
Mobile Fixed broadband
Average home broadband usage
Average mobile data usage
46
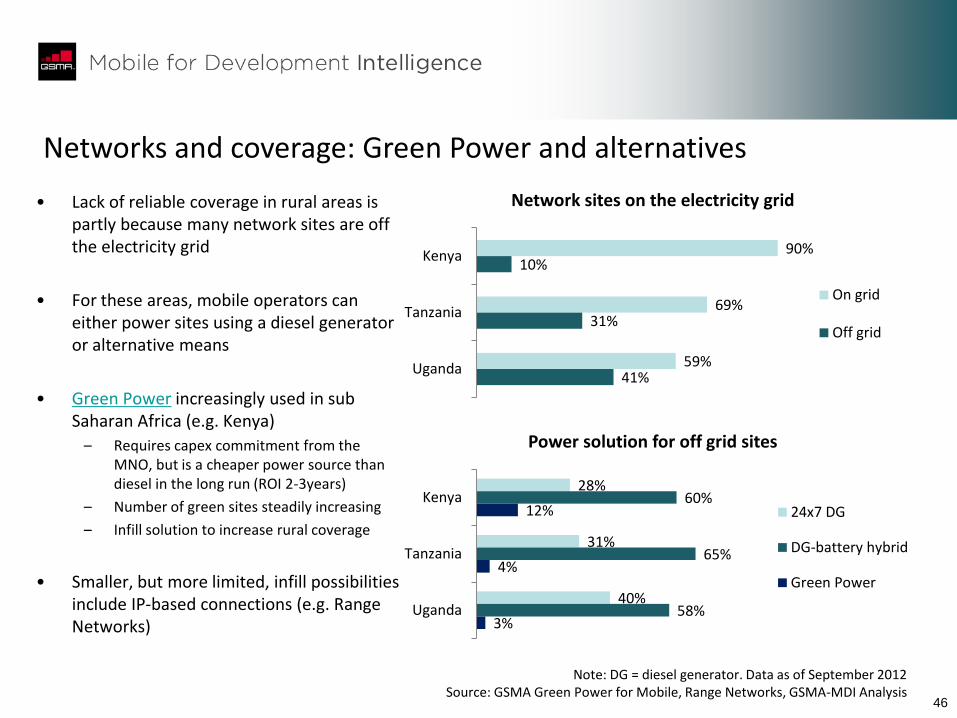
Networks and coverage: Green Power and alternatives
• Lack of reliable coverage in rural areas is partly because many network sites are off the electricity grid
• For these areas, mobile operators can either power sites using a diesel generator or alternative means
• Green Power increasingly used in sub Saharan Africa (e.g. Kenya)
– Requires capex commitment from the MNO, but is a cheaper power source than diesel in the long run (ROI 2-3years)
– Number of green sites steadily increasing
– Infill solution to increase rural coverage
• Smaller, but more limited, infill possibilities include IP-based connections (e.g. Range Networks)
90%
69%
59%
10%
31%
41%
Kenya
Tanzania
Uganda
Network sites on the electricity grid
On grid
Off grid
28%
31%
40%
60%
65%
58%
12%
4%
3%
Kenya
Tanzania
Uganda
Power solution for off grid sites
24x7 DG
DG-battery hybrid
Green Power
Note: DG = diesel generator. Data as of September 2012 Source: GSMA Green Power for Mobile, Range Networks, GSMA-MDI Analysis
47 47
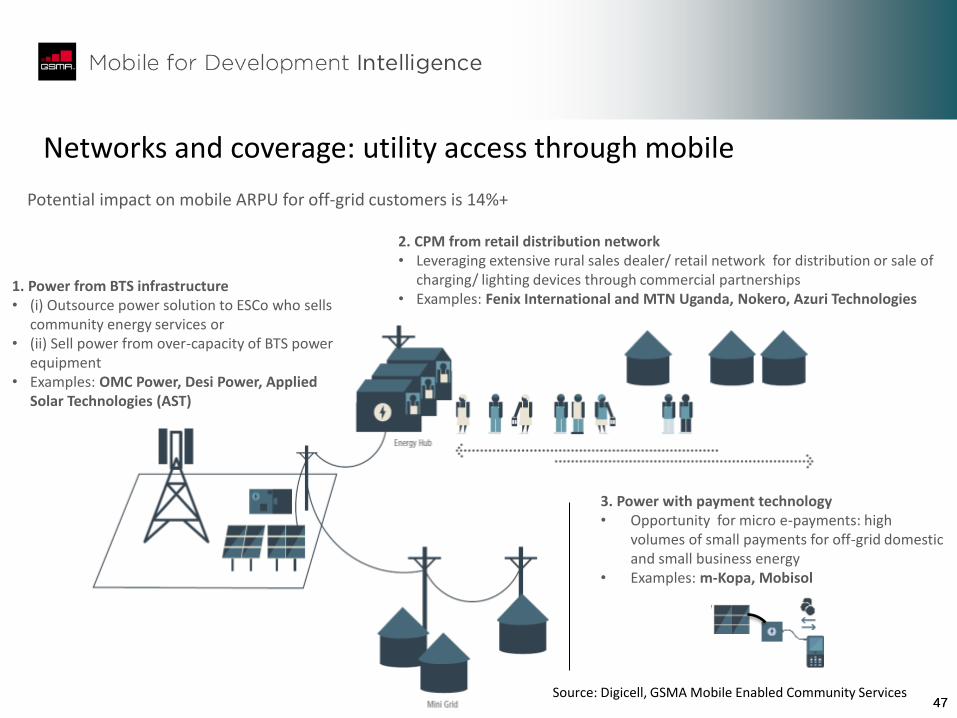
Networks and coverage: utility access through mobile
1. Power from BTS infrastructure • (i) Outsource power solution to ESCo who sells
community energy services or • (ii) Sell power from over-capacity of BTS power
equipment • Examples: OMC Power, Desi Power, Applied
Solar Technologies (AST)
2. CPM from retail distribution network • Leveraging extensive rural sales dealer/ retail network for distribution or sale of
charging/ lighting devices through commercial partnerships • Examples: Fenix International and MTN Uganda, Nokero, Azuri Technologies
3. Power with payment technology • Opportunity for micro e-payments: high
volumes of small payments for off-grid domestic and small business energy
• Examples: m-Kopa, Mobisol
Potential impact on mobile ARPU for off-grid customers is 14%+
Source: Digicell, GSMA Mobile Enabled Community Services
48
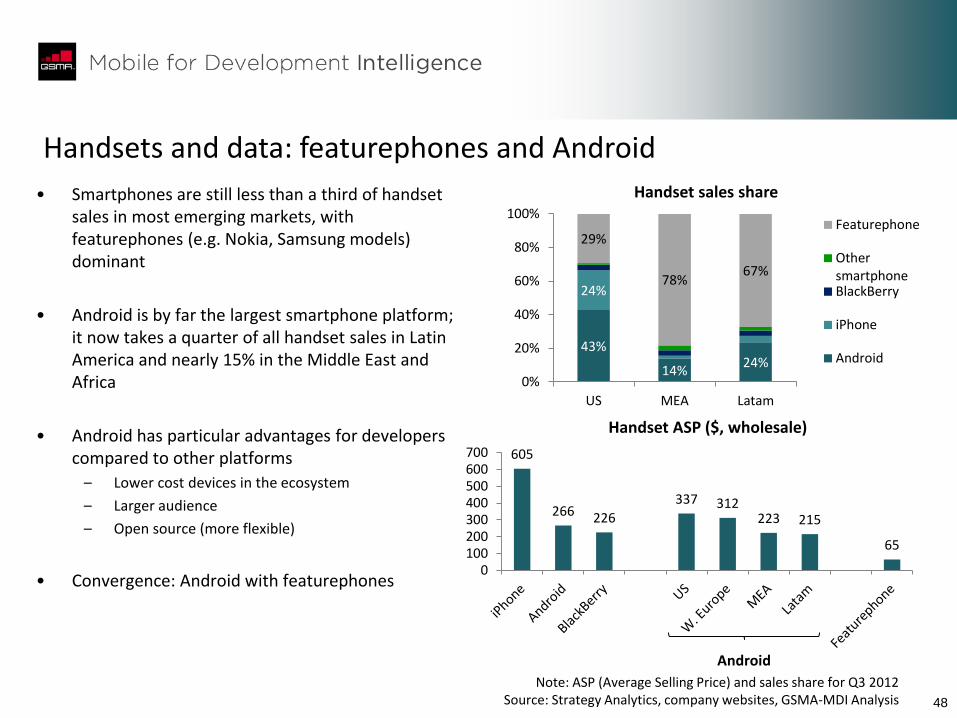
Handsets and data: featurephones and Android
• Smartphones are still less than a third of handset sales in most emerging markets, with featurephones (e.g. Nokia, Samsung models) dominant
• Android is by far the largest smartphone platform; it now takes a quarter of all handset sales in Latin America and nearly 15% in the Middle East and Africa
• Android has particular advantages for developers compared to other platforms
– Lower cost devices in the ecosystem
– Larger audience
– Open source (more flexible)
• Convergence: Android with featurephones
Note: ASP (Average Selling Price) and sales share for Q3 2012 Source: Strategy Analytics, company websites, GSMA-MDI Analysis
605
266 226
337 312 223 215
65
0100200300400500600700
Handset ASP ($, wholesale)
43%
14% 24%
24%
29%
78% 67%
0%
20%
40%
60%
80%
100%
US MEA Latam
Handset sales share
Featurephone
OthersmartphoneBlackBerry
iPhone
Android
Android
49
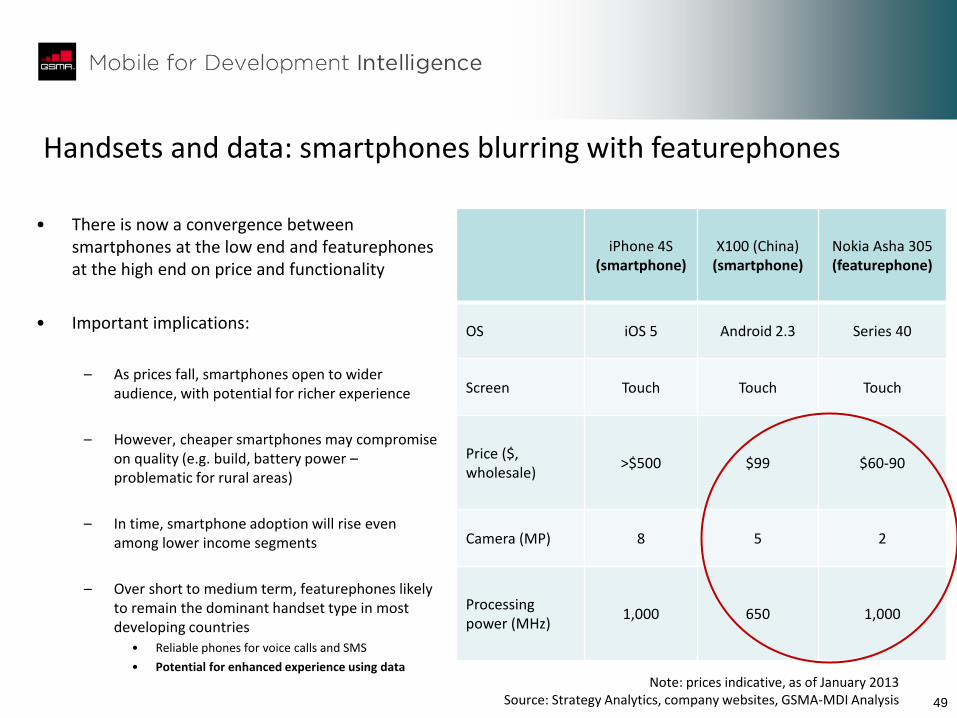
Handsets and data: smartphones blurring with featurephones
• There is now a convergence between smartphones at the low end and featurephones at the high end on price and functionality
• Important implications:
– As prices fall, smartphones open to wider audience, with potential for richer experience
– However, cheaper smartphones may compromise on quality (e.g. build, battery power – problematic for rural areas)
– In time, smartphone adoption will rise even among lower income segments
– Over short to medium term, featurephones likely to remain the dominant handset type in most developing countries
• Reliable phones for voice calls and SMS
• Potential for enhanced experience using data
iPhone 4S (smartphone)
X100 (China) (smartphone)
Nokia Asha 305 (featurephone)
OS iOS 5 Android 2.3 Series 40
Screen Touch Touch Touch
Price ($, wholesale)
>$500 $99 $60-90
Camera (MP) 8 5 2
Processing power (MHz)
1,000 650 1,000
Note: prices indicative, as of January 2013 Source: Strategy Analytics, company websites, GSMA-MDI Analysis
50
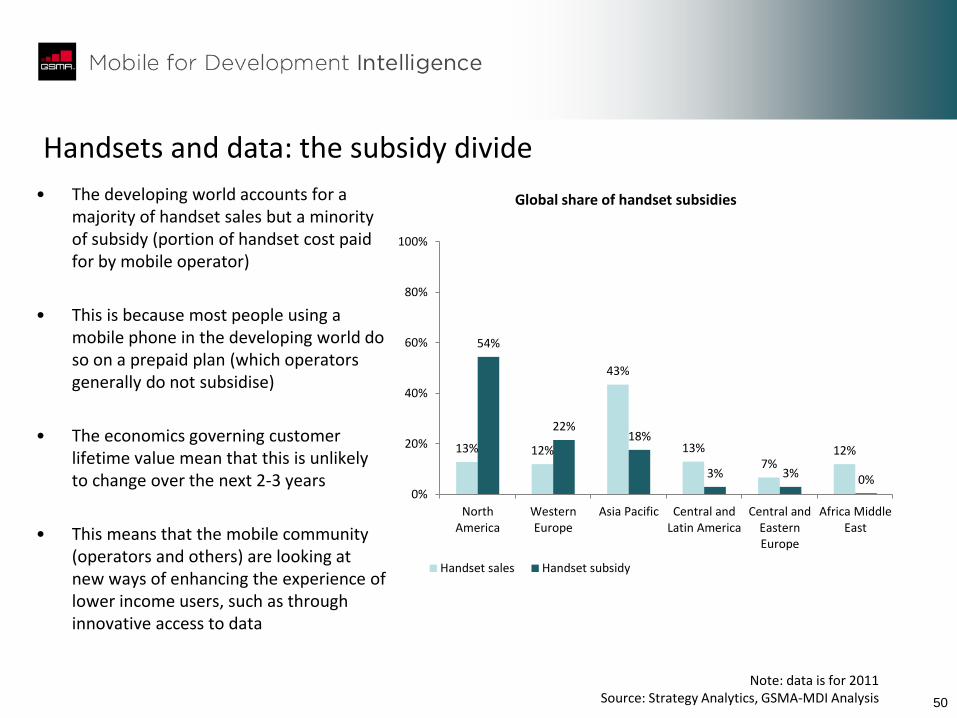
Handsets and data: the subsidy divide
• The developing world accounts for a majority of handset sales but a minority of subsidy (portion of handset cost paid for by mobile operator)
• This is because most people using a mobile phone in the developing world do so on a prepaid plan (which operators generally do not subsidise)
• The economics governing customer lifetime value mean that this is unlikely to change over the next 2-3 years
• This means that the mobile community (operators and others) are looking at new ways of enhancing the experience of lower income users, such as through innovative access to data
Note: data is for 2011 Source: Strategy Analytics, GSMA-MDI Analysis
13% 12%
43%
13% 7%
12%
54%
22% 18%
3% 3% 0% 0%
20%
40%
60%
80%
100%
NorthAmerica
WesternEurope
Asia Pacific Central andLatin America
Central andEasternEurope
Africa MiddleEast
Global share of handset subsidies
Handset sales Handset subsidy
51
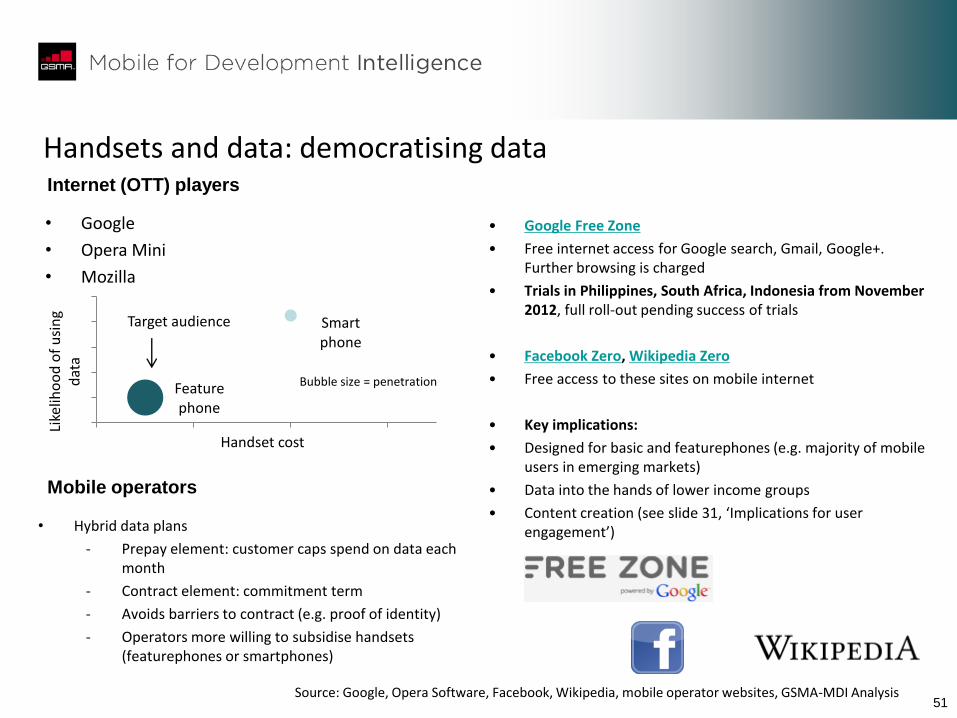
Handsets and data: democratising data
• Google Free Zone
• Free internet access for Google search, Gmail, Google+. Further browsing is charged
• Trials in Philippines, South Africa, Indonesia from November 2012, full roll-out pending success of trials
• Facebook Zero, Wikipedia Zero
• Free access to these sites on mobile internet
• Key implications:
• Designed for basic and featurephones (e.g. majority of mobile users in emerging markets)
• Data into the hands of lower income groups
• Content creation (see slide 31, ‘Implications for user engagement’)
Internet (OTT) players
Mobile operators
Smart phone
Feature phone
Like
liho
od
of
usi
ng
dat
a
Handset cost
Target audience
• Opera Mini
• Mozilla
• Hybrid data plans
- Prepay element: customer caps spend on data each month
- Contract element: commitment term
- Avoids barriers to contract (e.g. proof of identity)
- Operators more willing to subsidise handsets (featurephones or smartphones)
Source: Google, Opera Software, Facebook, Wikipedia, mobile operator websites, GSMA-MDI Analysis
Bubble size = penetration
52
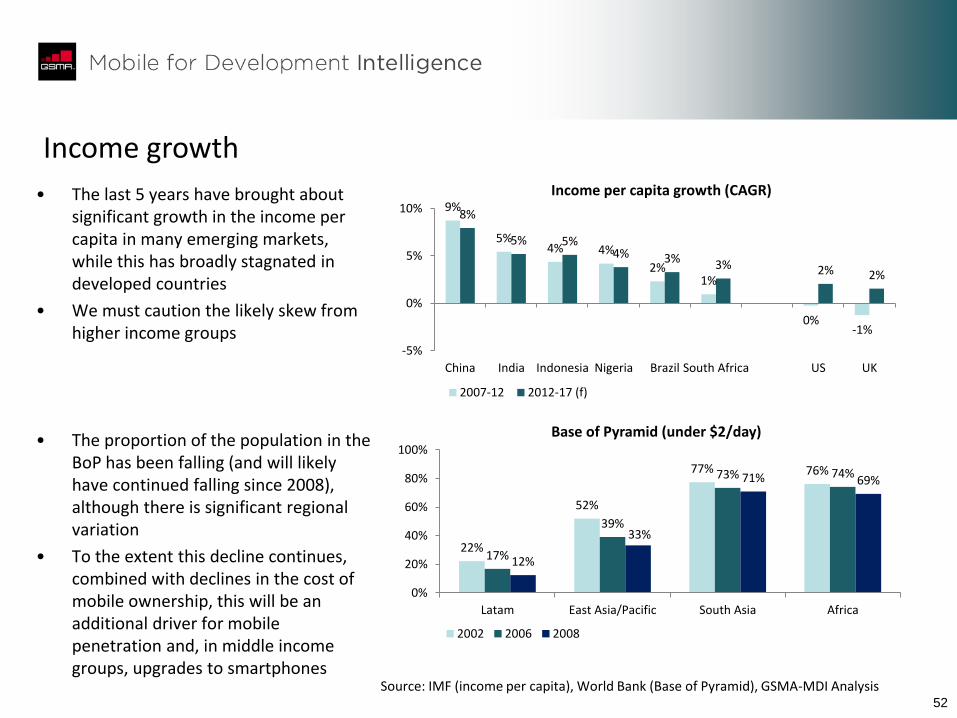
Income growth
9%
5% 4% 4%
2% 1%
0% -1%
8%
5% 5% 4% 3% 3% 2% 2%
-5%
0%
5%
10%
China India Indonesia Nigeria Brazil South Africa US UK
Income per capita growth (CAGR)
2007-12 2012-17 (f)
• The last 5 years have brought about significant growth in the income per capita in many emerging markets, while this has broadly stagnated in developed countries
• We must caution the likely skew from higher income groups
• The proportion of the population in the BoP has been falling (and will likely have continued falling since 2008), although there is significant regional variation
• To the extent this decline continues, combined with declines in the cost of mobile ownership, this will be an additional driver for mobile penetration and, in middle income groups, upgrades to smartphones
Source: IMF (income per capita), World Bank (Base of Pyramid), GSMA-MDI Analysis
22%
52%
77% 76%
17%
39%
73% 74%
12%
33%
71% 69%
0%
20%
40%
60%
80%
100%
Latam East Asia/Pacific South Asia Africa
Base of Pyramid (under $2/day)
2002 2006 2008
53
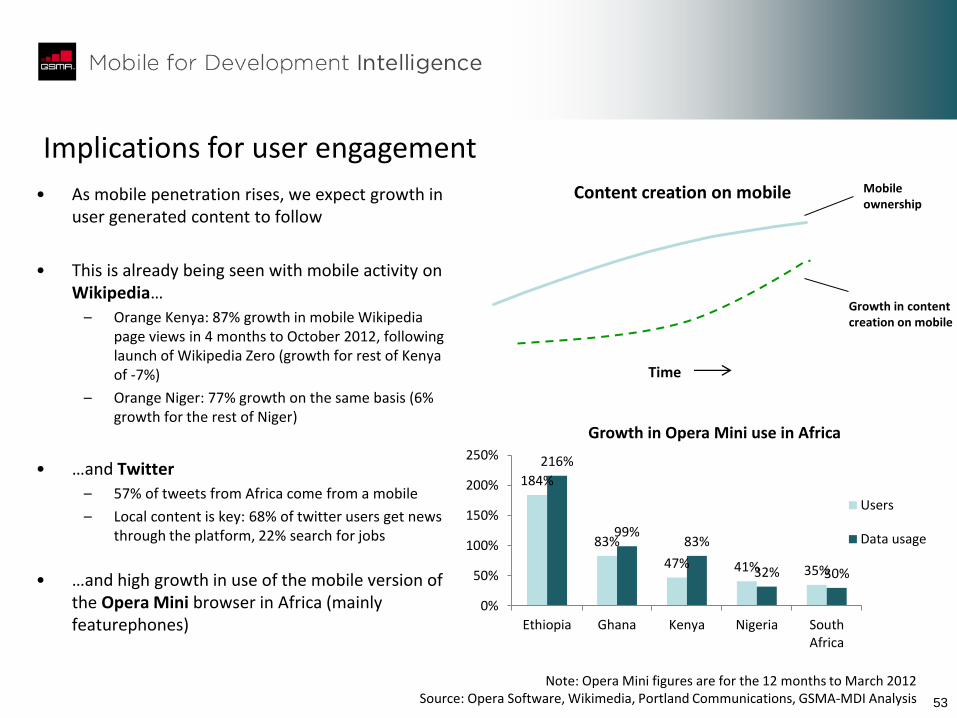
Implications for user engagement
• As mobile penetration rises, we expect growth in user generated content to follow
• This is already being seen with mobile activity on Wikipedia…
– Orange Kenya: 87% growth in mobile Wikipedia page views in 4 months to October 2012, following launch of Wikipedia Zero (growth for rest of Kenya of -7%)
– Orange Niger: 77% growth on the same basis (6% growth for the rest of Niger)
• …and Twitter
– 57% of tweets from Africa come from a mobile
– Local content is key: 68% of twitter users get news through the platform, 22% search for jobs
• …and high growth in use of the mobile version of the Opera Mini browser in Africa (mainly featurephones)
184%
83%
47% 41% 35%
216%
99% 83%
32% 30%
0%
50%
100%
150%
200%
250%
Ethiopia Ghana Kenya Nigeria SouthAfrica
Growth in Opera Mini use in Africa
Users
Data usage
Content creation on mobile Mobile ownership
Growth in content creation on mobile
Note: Opera Mini figures are for the 12 months to March 2012 Source: Opera Software, Wikimedia, Portland Communications, GSMA-MDI Analysis
Time
54 54
1. Executive summary
2. Key takeaways: a stakeholder guide
3. Market landscape: current and outlook
4. Impact of mobile on development sectors
5. Platforms, multiplicity and the drive for scale
6. User-centric innovation
7. Role of government
8. Appendix
55 55
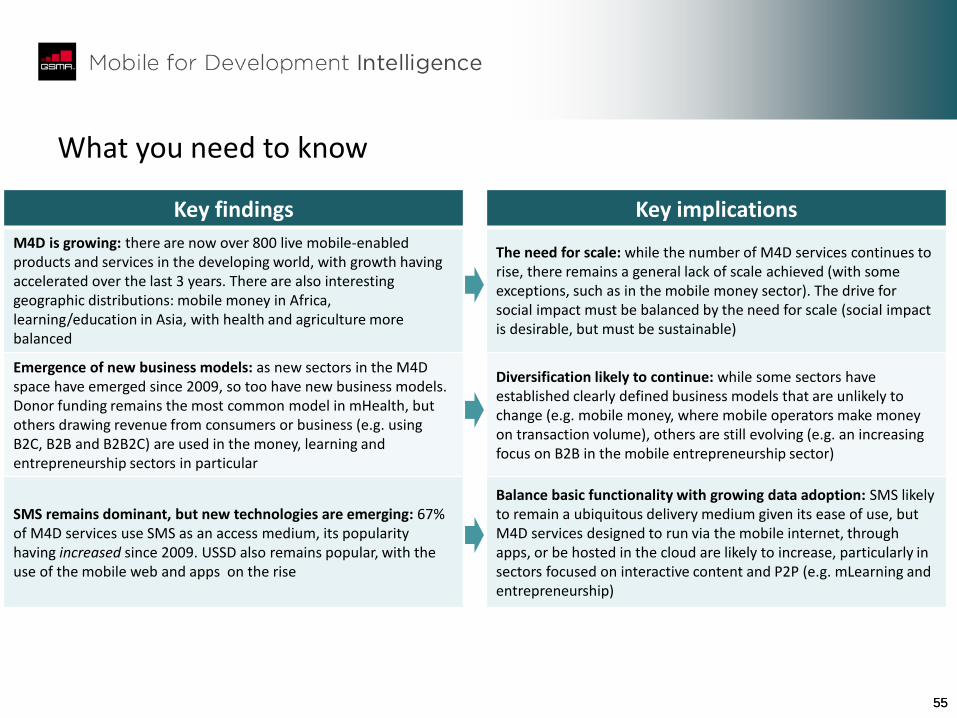
What you need to know
Key findings Key implications
M4D is growing: there are now over 800 live mobile-enabled products and services in the developing world, with growth having accelerated over the last 3 years. There are also interesting geographic distributions: mobile money in Africa, learning/education in Asia, with health and agriculture more balanced
The need for scale: while the number of M4D services continues to rise, there remains a general lack of scale achieved (with some exceptions, such as in the mobile money sector). The drive for social impact must be balanced by the need for scale (social impact is desirable, but must be sustainable)
Emergence of new business models: as new sectors in the M4D space have emerged since 2009, so too have new business models. Donor funding remains the most common model in mHealth, but others drawing revenue from consumers or business (e.g. using B2C, B2B and B2B2C) are used in the money, learning and entrepreneurship sectors in particular
Diversification likely to continue: while some sectors have established clearly defined business models that are unlikely to change (e.g. mobile money, where mobile operators make money on transaction volume), others are still evolving (e.g. an increasing focus on B2B in the mobile entrepreneurship sector)
SMS remains dominant, but new technologies are emerging: 67% of M4D services use SMS as an access medium, its popularity having increased since 2009. USSD also remains popular, with the use of the mobile web and apps on the rise
Balance basic functionality with growing data adoption: SMS likely to remain a ubiquitous delivery medium given its ease of use, but M4D services designed to run via the mobile internet, through apps, or be hosted in the cloud are likely to increase, particularly in sectors focused on interactive content and P2P (e.g. mLearning and entrepreneurship)
56 56
0
200
400
600
800
1000
0
50
100
150
200
250
Pre 2005 2005 2006 2007 2008 2009 2010 2011
Cu
mu
lati
ve la
un
ches
Lau
nch
es
pe
r ye
ar
Timeline of launches
Entrepreneur
Learning
Agriculture
Health
Money
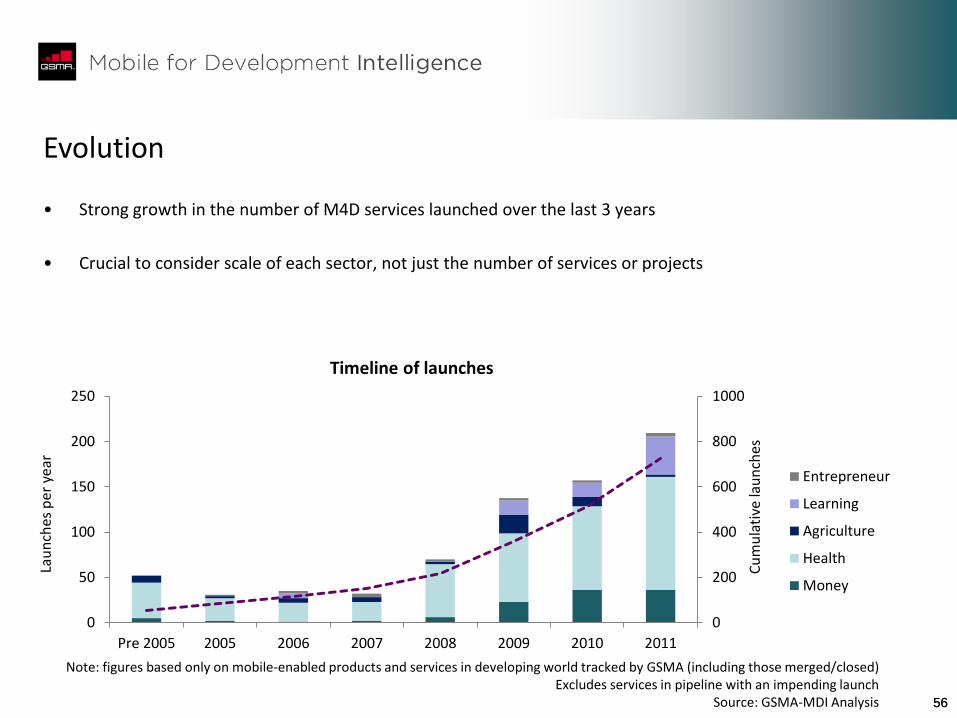
Evolution
• Strong growth in the number of M4D services launched over the last 3 years
• Crucial to consider scale of each sector, not just the number of services or projects
Note: figures based only on mobile-enabled products and services in developing world tracked by GSMA (including those merged/closed) Excludes services in pipeline with an impending launch
Source: GSMA-MDI Analysis
57 57
0
100
200
300
400
500
600
Money Health Agriculture Learning Entrepreneurship
Live deployments
Central/Eastern Europe
Oceania
Africa
Latam
Asia
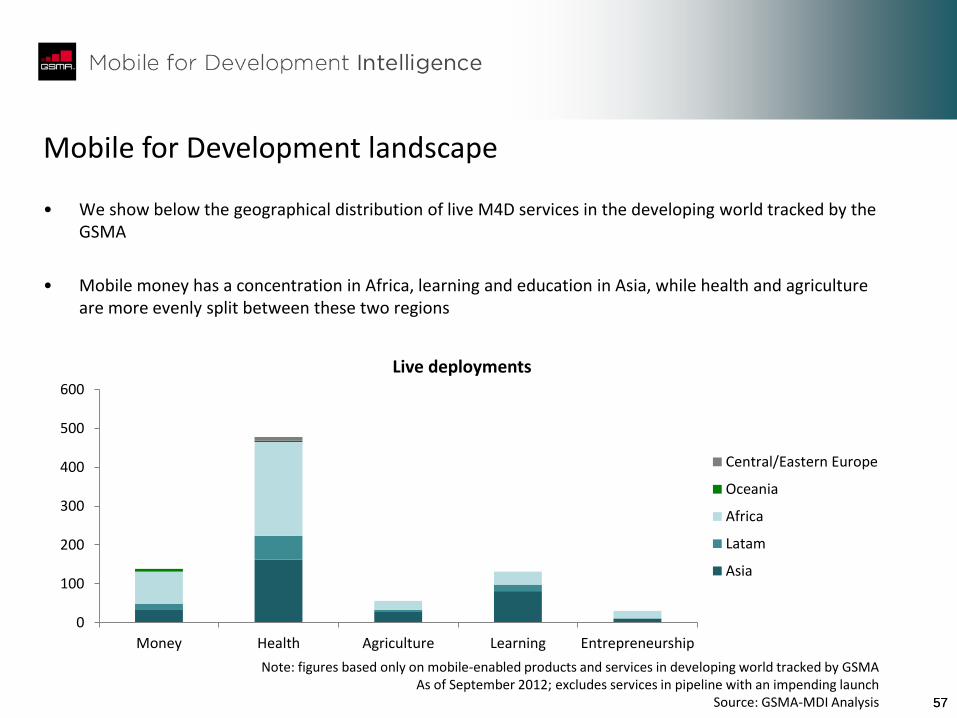
Mobile for Development landscape
• We show below the geographical distribution of live M4D services in the developing world tracked by the GSMA
• Mobile money has a concentration in Africa, learning and education in Asia, while health and agriculture are more evenly split between these two regions
Note: figures based only on mobile-enabled products and services in developing world tracked by GSMA As of September 2012; excludes services in pipeline with an impending launch
Source: GSMA-MDI Analysis

58 58
Definitions for analysis and methodology Our work so far…
Current GSMA resources Further research & definitions
Analysis & initial findings
Over 800 M4D
services tracked
Augmenting research Analysis Findings
Business model
•Where will the service generate revenue from?
•Consumer
•Donor
•Business
•Open Source
•Government
•Advertising
Device
•What type of device is the service aimed at?
•Basic phone (e.g.,
•Feature phone (e.g.,
•Smart phone (e.g.,
•PC/ laptop
•Tablet
•Other
Delivery technology
•What mobile delivery technology will the service utilise?
•Native Voice
•IVR
•SMS
•USSD
•Text-to-Audio
•Web
•Apps
•WAP
Enablers
•What kind of products and services are being offered?
•Interactive content
•Push content
•Payments
•Peer to Peer
•Data Collection
•Call Centre
•Inventory management
Source: GSMA-MDI Analysis
59 59
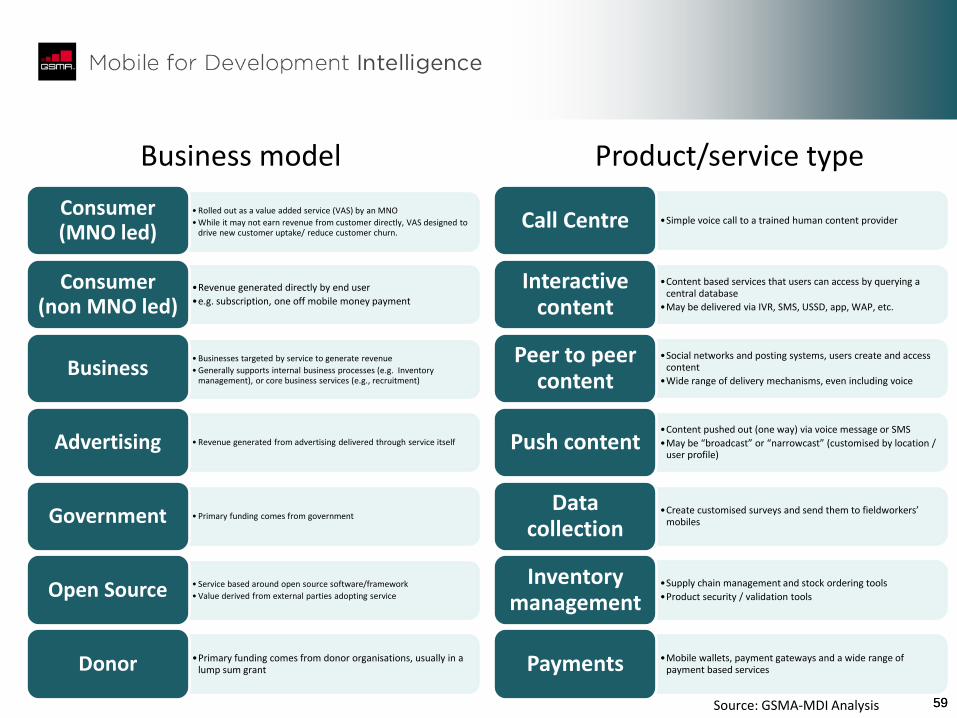
Business model
•Simple voice call to a trained human content provider Call Centre
•Content based services that users can access by querying a central database
•May be delivered via IVR, SMS, USSD, app, WAP, etc.
Interactive content
•Social networks and posting systems, users create and access content
•Wide range of delivery mechanisms, even including voice
Peer to peer content
•Content pushed out (one way) via voice message or SMS
•May be “broadcast” or “narrowcast” (customised by location / user profile)
Push content
•Create customised surveys and send them to fieldworkers’ mobiles
Data collection
•Supply chain management and stock ordering tools
•Product security / validation tools
Inventory management
•Mobile wallets, payment gateways and a wide range of payment based services Payments
• Rolled out as a value added service (VAS) by an MNO
• While it may not earn revenue from customer directly, VAS designed to drive new customer uptake/ reduce customer churn.
Consumer (MNO led)
•Revenue generated directly by end user
•e.g. subscription, one off mobile money payment
Consumer (non MNO led)
• Businesses targeted by service to generate revenue
• Generally supports internal business processes (e.g. Inventory management), or core business services (e.g., recruitment)
Business
• Revenue generated from advertising delivered through service itself Advertising
• Primary funding comes from government Government
• Service based around open source software/framework
• Value derived from external parties adopting service Open Source
•Primary funding comes from donor organisations, usually in a lump sum grant Donor
Product/service type
Source: GSMA-MDI Analysis
60 60
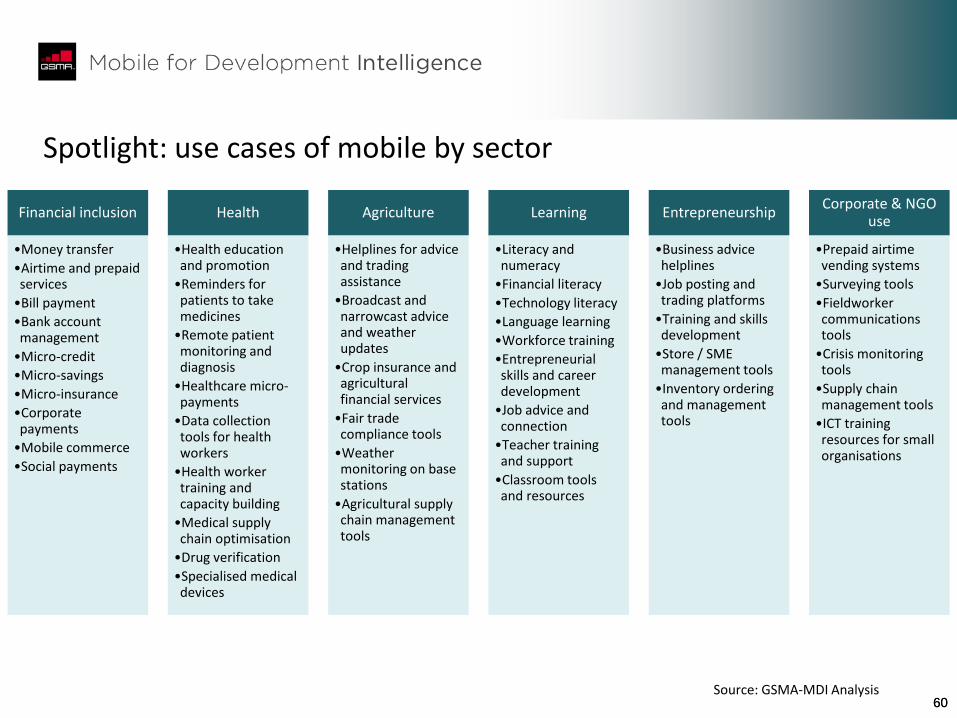
Spotlight: use cases of mobile by sector
Financial inclusion
•Money transfer
•Airtime and prepaid services
•Bill payment
•Bank account management
•Micro-credit
•Micro-savings
•Micro-insurance
•Corporate payments
•Mobile commerce
•Social payments
Health
•Health education and promotion
•Reminders for patients to take medicines
•Remote patient monitoring and diagnosis
•Healthcare micro-payments
•Data collection tools for health workers
•Health worker training and capacity building
•Medical supply chain optimisation
•Drug verification
•Specialised medical devices
Agriculture
•Helplines for advice and trading assistance
•Broadcast and narrowcast advice and weather updates
•Crop insurance and agricultural financial services
•Fair trade compliance tools
•Weather monitoring on base stations
•Agricultural supply chain management tools
Learning
•Literacy and numeracy
•Financial literacy
•Technology literacy
•Language learning
•Workforce training
•Entrepreneurial skills and career development
•Job advice and connection
•Teacher training and support
•Classroom tools and resources
Entrepreneurship
•Business advice helplines
•Job posting and trading platforms
•Training and skills development
•Store / SME management tools
•Inventory ordering and management tools
Corporate & NGO use
•Prepaid airtime vending systems
•Surveying tools
•Fieldworker communications tools
•Crisis monitoring tools
•Supply chain management tools
•ICT training resources for small organisations
Source: GSMA-MDI Analysis
61 61
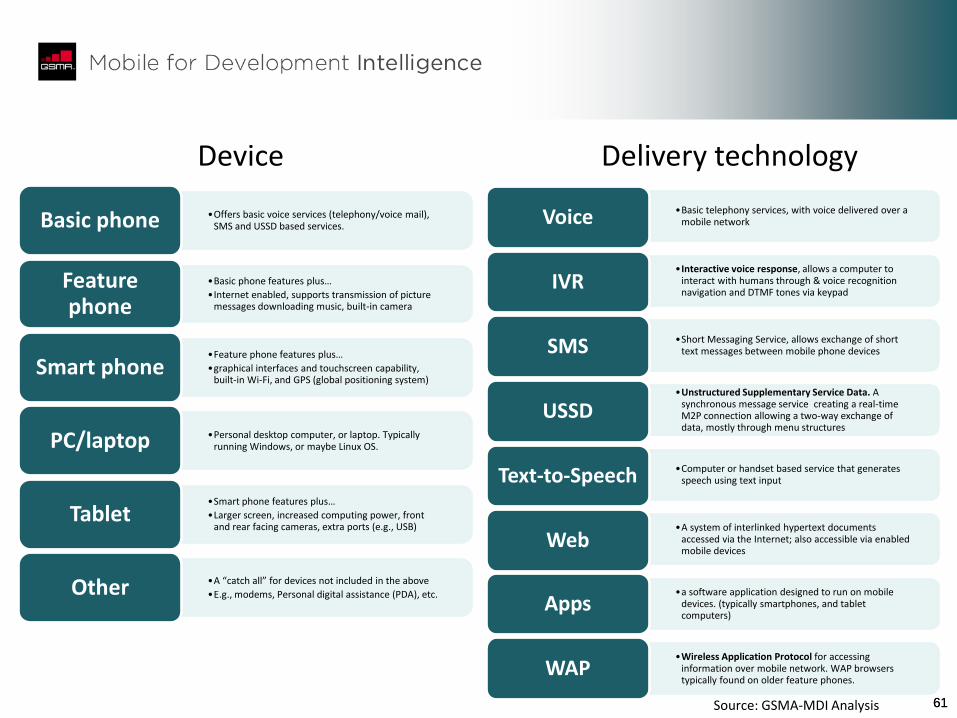
•Offers basic voice services (telephony/voice mail), SMS and USSD based services. Basic phone
•Basic phone features plus…
•Internet enabled, supports transmission of picture messages downloading music, built-in camera
Feature phone
•Feature phone features plus…
•graphical interfaces and touchscreen capability, built-in Wi-Fi, and GPS (global positioning system)
Smart phone
•Personal desktop computer, or laptop. Typically running Windows, or maybe Linux OS. PC/laptop
•Smart phone features plus…
•Larger screen, increased computing power, front and rear facing cameras, extra ports (e.g., USB)
Tablet
•A “catch all” for devices not included in the above
•E.g., modems, Personal digital assistance (PDA), etc. Other
•Basic telephony services, with voice delivered over a mobile network Voice
•Interactive voice response, allows a computer to interact with humans through & voice recognition navigation and DTMF tones via keypad
IVR
•Short Messaging Service, allows exchange of short text messages between mobile phone devices SMS
•Unstructured Supplementary Service Data. A synchronous message service creating a real-time M2P connection allowing a two-way exchange of data, mostly through menu structures
USSD
•Computer or handset based service that generates speech using text input Text-to-Speech
•A system of interlinked hypertext documents accessed via the Internet; also accessible via enabled mobile devices
Web
•a software application designed to run on mobile devices. (typically smartphones, and tablet computers)
Apps
•Wireless Application Protocol for accessing information over mobile network. WAP browsers typically found on older feature phones.
WAP
Device Delivery technology
Source: GSMA-MDI Analysis
62 62
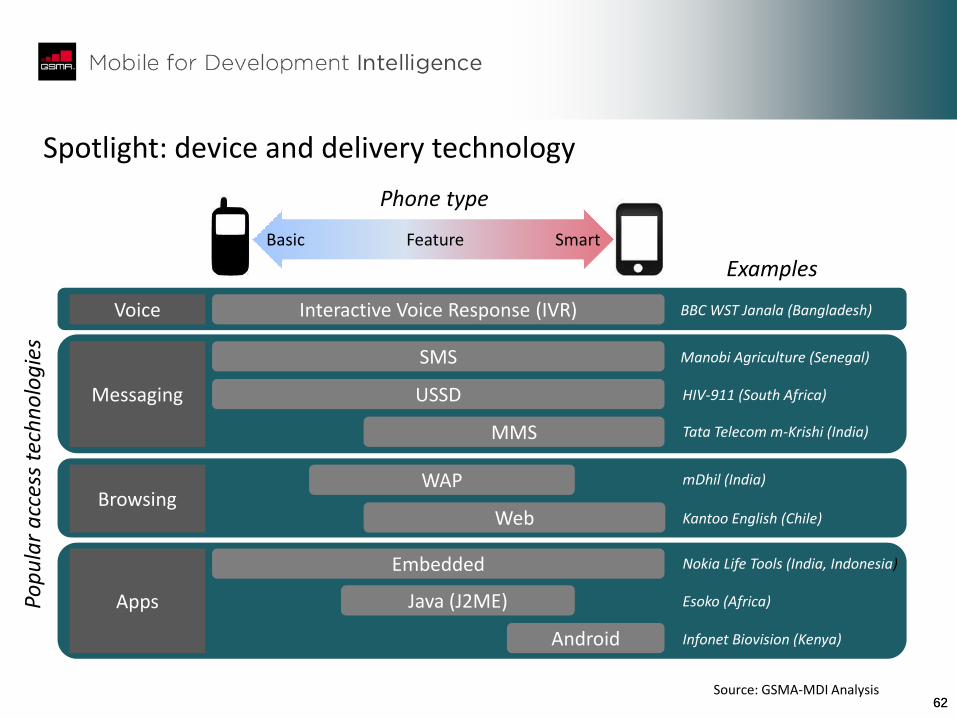
Spotlight: device and delivery technology
Voice
Messaging
Browsing
Apps
Interactive Voice Response (IVR)
SMS
USSD
MMS
WAP
Web
Embedded
Java (J2ME)
Android
Basic Feature Smart
Phone type
Examples
BBC WST Janala (Bangladesh)
Manobi Agriculture (Senegal)
HIV-911 (South Africa)
mDhil (India)
Esoko (Africa)
Kantoo English (Chile)
Infonet Biovision (Kenya)
Nokia Life Tools (India, Indonesia)
Tata Telecom m-Krishi (India)
Pop
ula
r a
cces
s te
chn
olo
gie
s
Source: GSMA-MDI Analysis
63
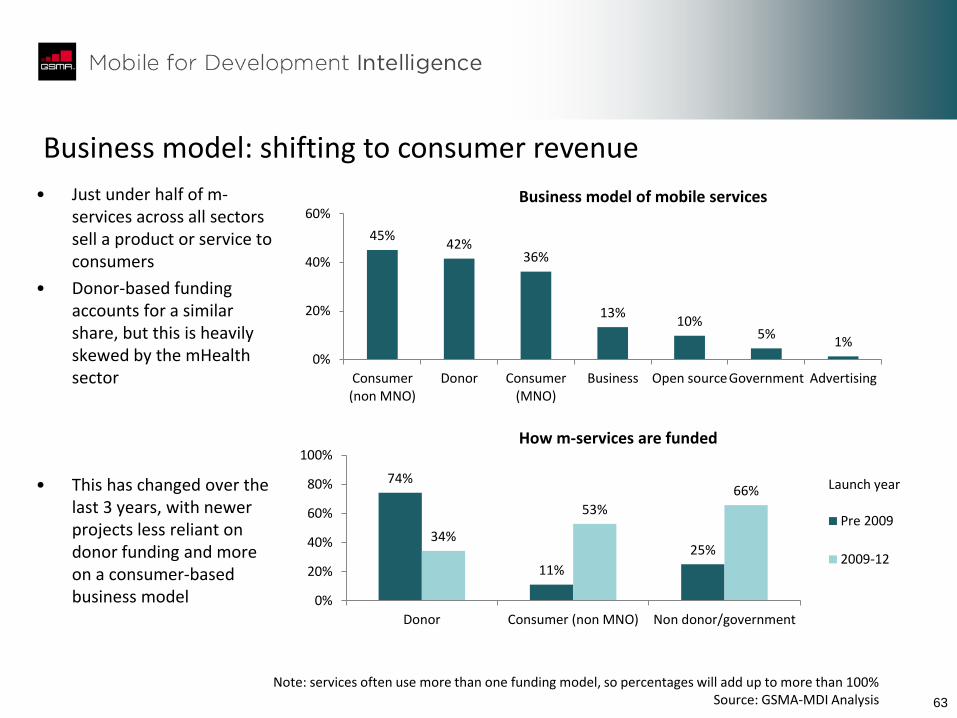
Business model: shifting to consumer revenue
• Just under half of m-services across all sectors sell a product or service to consumers
• Donor-based funding accounts for a similar share, but this is heavily skewed by the mHealth sector
• This has changed over the last 3 years, with newer projects less reliant on donor funding and more on a consumer-based business model
45% 42%
36%
13% 10%
5% 1%
0%
20%
40%
60%
Consumer(non MNO)
Donor Consumer(MNO)
Business Open sourceGovernment Advertising
Business model of mobile services
Note: services often use more than one funding model, so percentages will add up to more than 100% Source: GSMA-MDI Analysis
74%
11%
25% 34%
53%
66%
0%
20%
40%
60%
80%
100%
Donor Consumer (non MNO) Non donor/government
Launch year
How m-services are funded
Pre 2009
2009-12
64 64
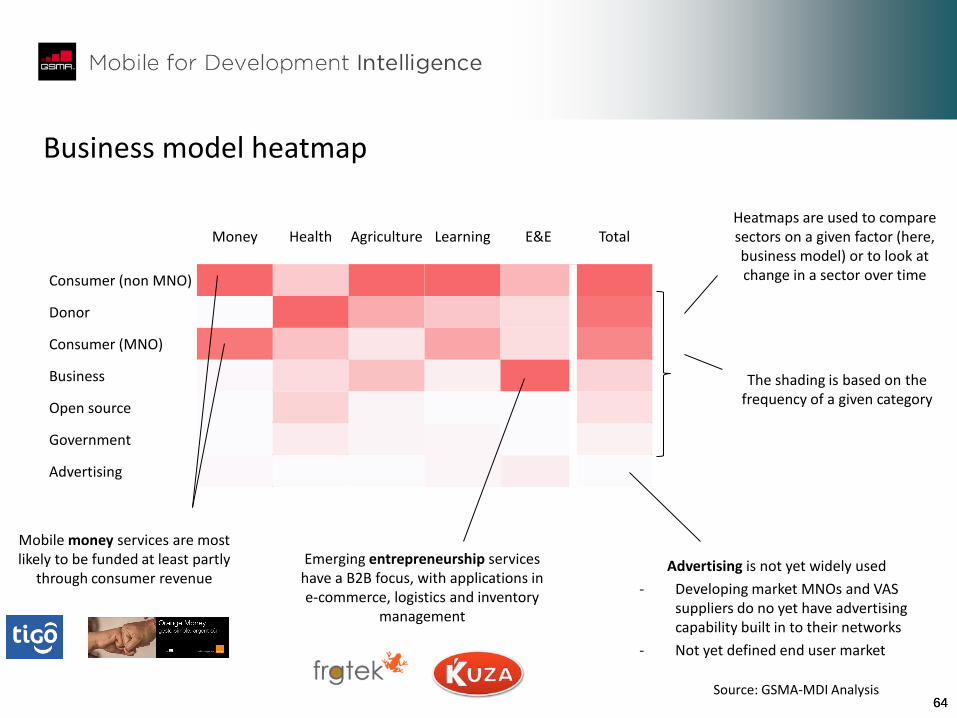
Business model heatmap
Money Health Agriculture Learning E&E Total
Consumer (non MNO) 138 96 37 96 9 376
Donor 0 287 21 35 4 346
Consumer (MNO) 124 112 6 57 4 302
Business 5 64 15 9 19 111
Open source 0 80 2 0 0 82
Government 0 32 2 4 0 38
Advertising 5 0 0 4 2 11
Source: GSMA-MDI Analysis
Mobile money services are most likely to be funded at least partly
through consumer revenue
Heatmaps are used to compare sectors on a given factor (here, business model) or to look at change in a sector over time
The shading is based on the frequency of a given category
Emerging entrepreneurship services have a B2B focus, with applications in e-commerce, logistics and inventory
management
Advertising is not yet widely used
- Developing market MNOs and VAS suppliers do no yet have advertising capability built in to their networks
- Not yet defined end user market
65 65
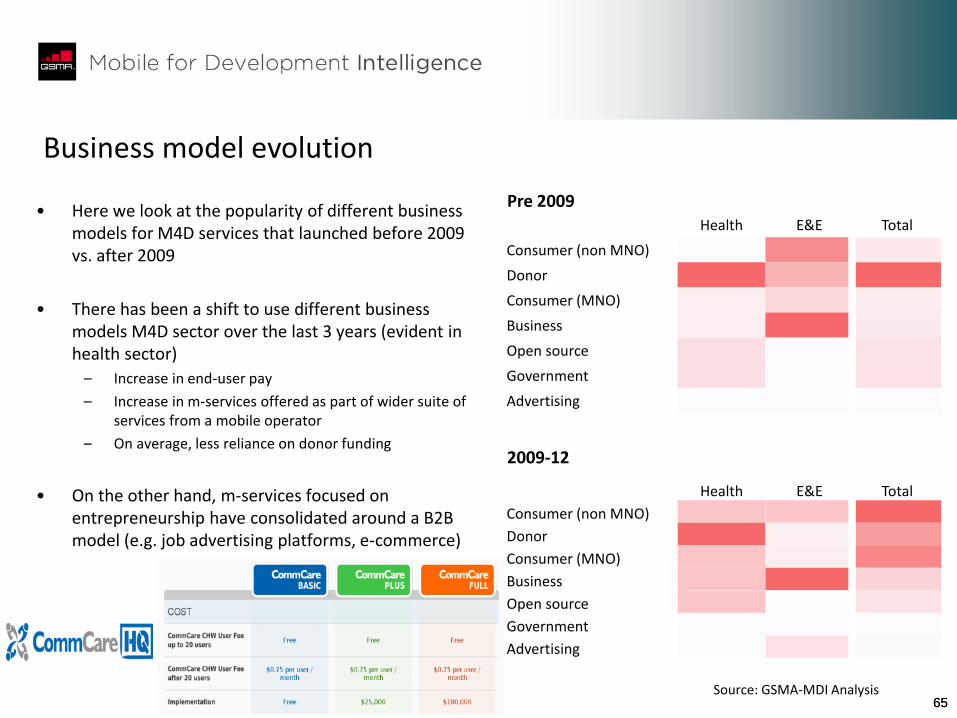
Business model evolution
Pre 2009 • Here we look at the popularity of different business
models for M4D services that launched before 2009 vs. after 2009
• There has been a shift to use different business models M4D sector over the last 3 years (evident in health sector)
– Increase in end-user pay
– Increase in m-services offered as part of wider suite of services from a mobile operator
– On average, less reliance on donor funding
• On the other hand, m-services focused on entrepreneurship have consolidated around a B2B model (e.g. job advertising platforms, e-commerce)
2009-12
Health E&E Total
Consumer (non MNO) 0 3 25
Donor 159 2 167
Consumer (MNO) 16 1 22
Business 16 4 24
Open source 32 0 32
Government 32 0 34
Advertising 0 0 4
Health E&E Total
Consumer (non MNO) 48 4 274
Donor 127 1 178
Consumer (MNO) 48 1 218
Business 48 11 75
Open source 48 0 48
Government 0 0 0
Advertising 0 2 7
Source: GSMA-MDI Analysis
66
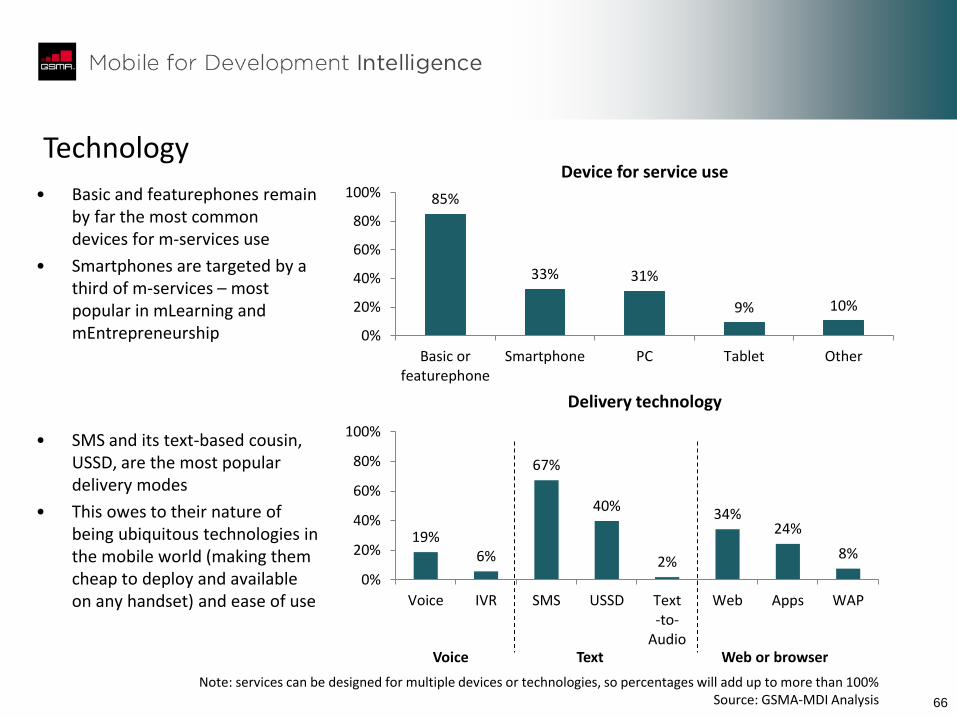
Technology
• Basic and featurephones remain by far the most common devices for m-services use
• Smartphones are targeted by a third of m-services – most popular in mLearning and mEntrepreneurship
• SMS and its text-based cousin, USSD, are the most popular delivery modes
• This owes to their nature of being ubiquitous technologies in the mobile world (making them cheap to deploy and available on any handset) and ease of use
19% 6%
67%
40%
2%
34% 24%
8%
0%
20%
40%
60%
80%
100%
Voice IVR SMS USSD Text-to-
Audio
Web Apps WAP
85%
33% 31%
9% 10%
0%
20%
40%
60%
80%
100%
Basic orfeaturephone
Smartphone PC Tablet Other
Device for service use
Delivery technology
Voice Text Web or browser
Note: services can be designed for multiple devices or technologies, so percentages will add up to more than 100% Source: GSMA-MDI Analysis
67 67
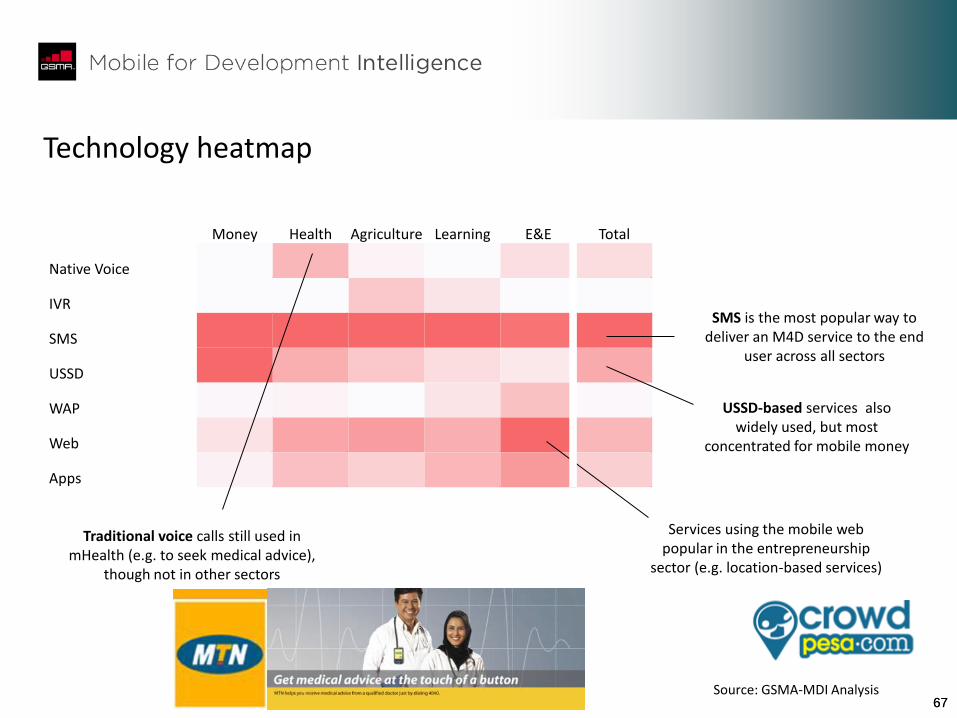
Technology heatmap
Money Health Agriculture Learning E&E Total
Native Voice 0 143 7 0 5 156
IVR 0 16 17 13 2 48
SMS 133 287 37 83 16 557
USSD 133 159 17 17 4 331
WAP 5 32 6 13 8 63
Web 23 175 26 44 17 285
Apps 9 127 15 39 12 203
Source: GSMA-MDI Analysis
Traditional voice calls still used in mHealth (e.g. to seek medical advice),
though not in other sectors
SMS is the most popular way to deliver an M4D service to the end
user across all sectors
USSD-based services also widely used, but most
concentrated for mobile money
Services using the mobile web popular in the entrepreneurship
sector (e.g. location-based services)
68 68
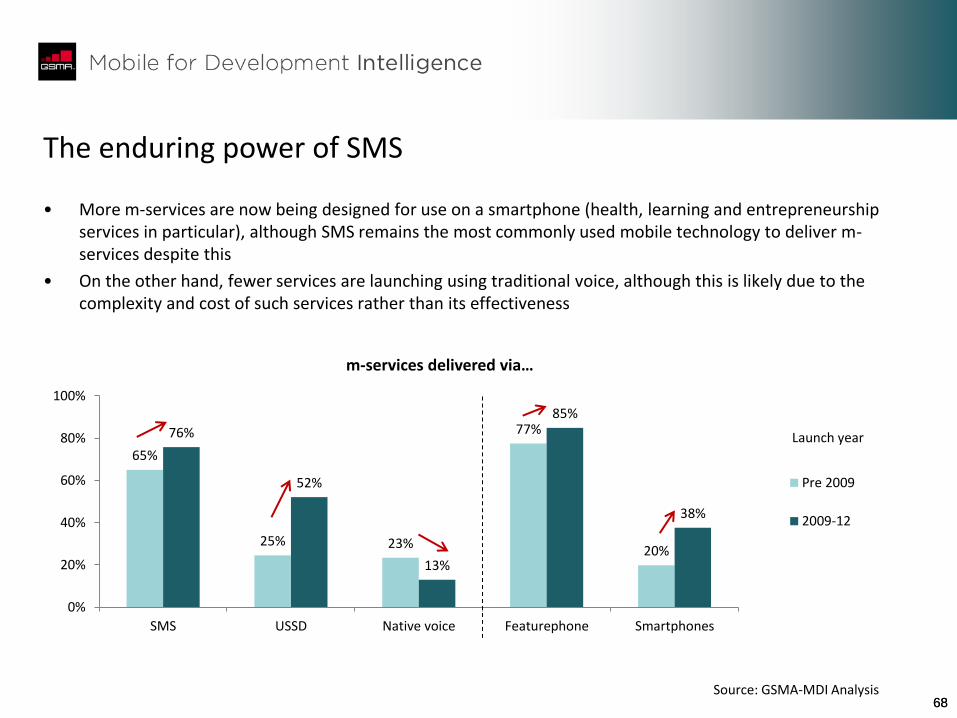
The enduring power of SMS
• More m-services are now being designed for use on a smartphone (health, learning and entrepreneurship services in particular), although SMS remains the most commonly used mobile technology to deliver m-services despite this
• On the other hand, fewer services are launching using traditional voice, although this is likely due to the complexity and cost of such services rather than its effectiveness
65%
25% 23%
77%
20%
76%
52%
13%
85%
38%
0%
20%
40%
60%
80%
100%
SMS USSD Native voice Featurephone Smartphones
Launch year
m-services delivered via…
Pre 2009
2009-12
Source: GSMA-MDI Analysis
69 69
43%
31% 29%
20% 16%
14%
3%
0%
20%
40%
60%
Push content Data collection Interactivecontent
Payments P2P content Call centre Inventorymanagement
M4D service function
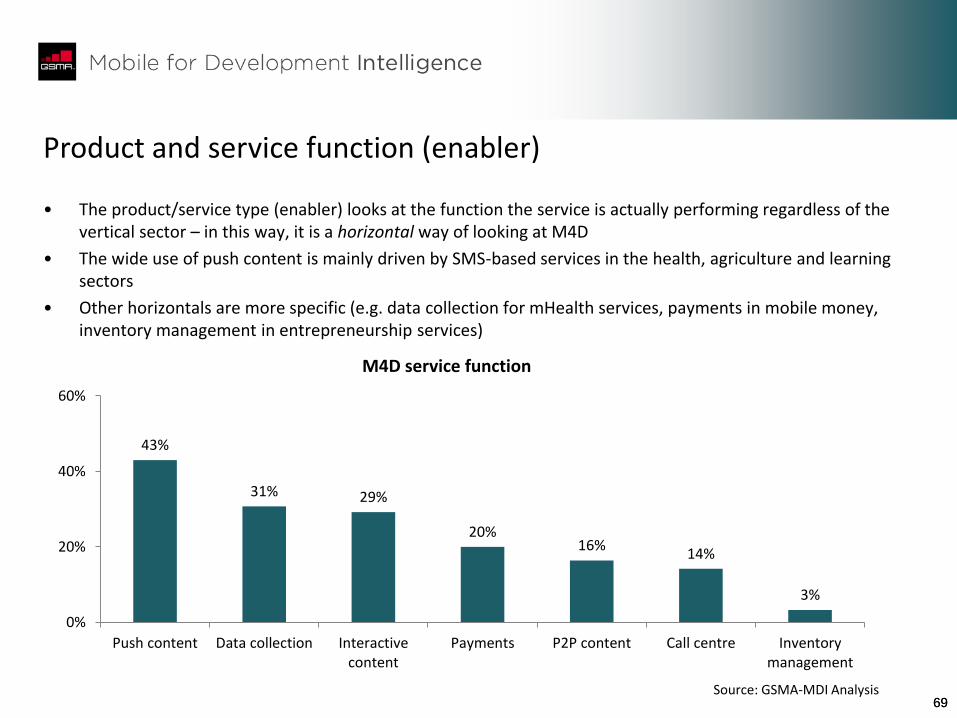
Product and service function (enabler)
• The product/service type (enabler) looks at the function the service is actually performing regardless of the vertical sector – in this way, it is a horizontal way of looking at M4D
• The wide use of push content is mainly driven by SMS-based services in the health, agriculture and learning sectors
• Other horizontals are more specific (e.g. data collection for mHealth services, payments in mobile money, inventory management in entrepreneurship services)
Source: GSMA-MDI Analysis
70 70
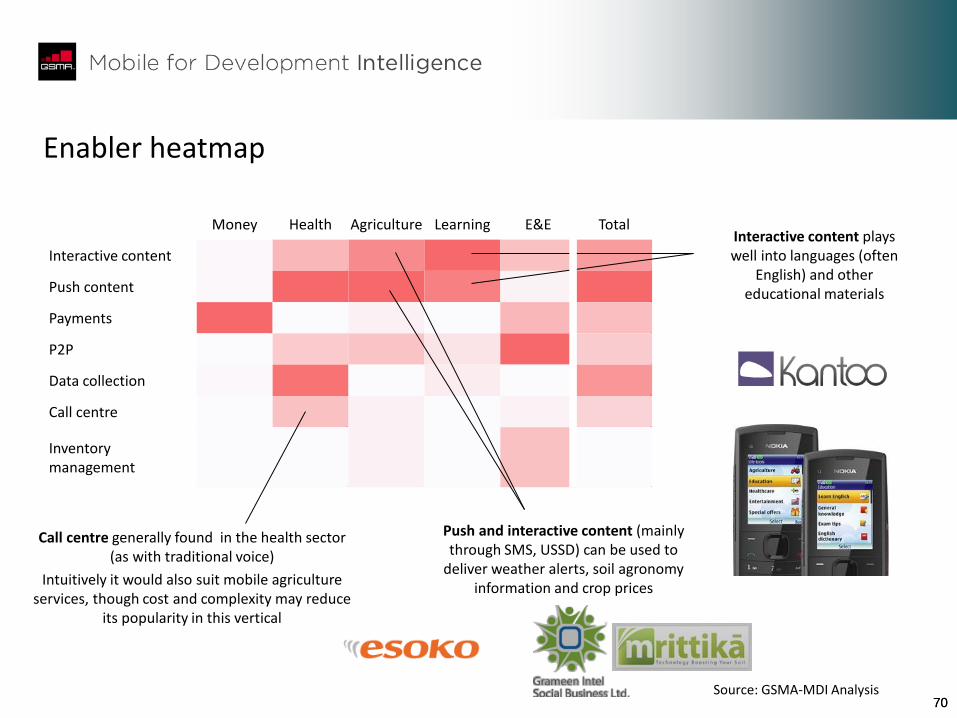
Enabler heatmap
Money Health Agriculture Learning E&E Total
Interactive content 5 127 22 83 6 243
Push content 5 255 28 70 1 358
Payments 138 16 6 0 7 167
P2P 0 96 13 13 15 137
Data collection 5 239 4 9 0 256
Call centre 0 112 6 0 1 118
Inventory management
0 16 6 0 6 28
Source: GSMA-MDI Analysis
Call centre generally found in the health sector (as with traditional voice)
Intuitively it would also suit mobile agriculture services, though cost and complexity may reduce
its popularity in this vertical
Interactive content plays well into languages (often
English) and other educational materials
Push and interactive content (mainly through SMS, USSD) can be used to
deliver weather alerts, soil agronomy information and crop prices
71
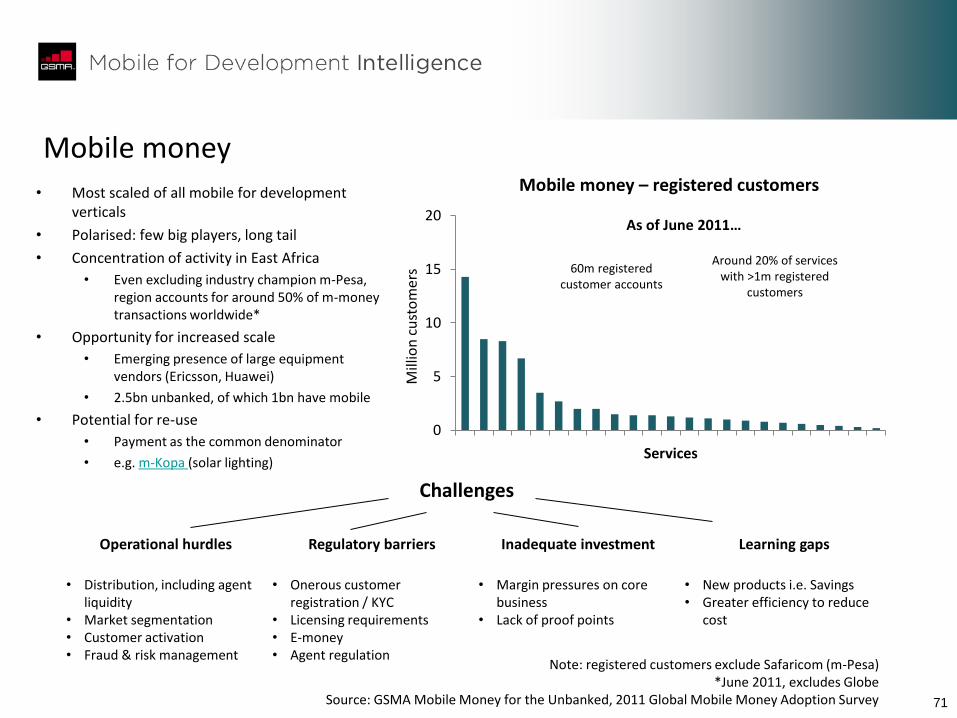
Mobile money
• Most scaled of all mobile for development verticals
• Polarised: few big players, long tail
• Concentration of activity in East Africa
• Even excluding industry champion m-Pesa, region accounts for around 50% of m-money transactions worldwide*
• Opportunity for increased scale
• Emerging presence of large equipment vendors (Ericsson, Huawei)
• 2.5bn unbanked, of which 1bn have mobile
• Potential for re-use
• Payment as the common denominator
• e.g. m-Kopa (solar lighting)
0
5
10
15
20
Mill
ion
cu
sto
mer
s
Services
Mobile money – registered customers
Note: registered customers exclude Safaricom (m-Pesa) *June 2011, excludes Globe
Source: GSMA Mobile Money for the Unbanked, 2011 Global Mobile Money Adoption Survey
60m registered customer accounts
Around 20% of services with >1m registered
customers
As of June 2011…
Challenges
Operational hurdles
• Distribution, including agent
liquidity • Market segmentation • Customer activation • Fraud & risk management
Regulatory barriers
• Onerous customer
registration / KYC • Licensing requirements • E-money • Agent regulation
Inadequate investment
• Margin pressures on core
business • Lack of proof points
Learning gaps
• New products i.e. Savings • Greater efficiency to reduce
cost
72 72
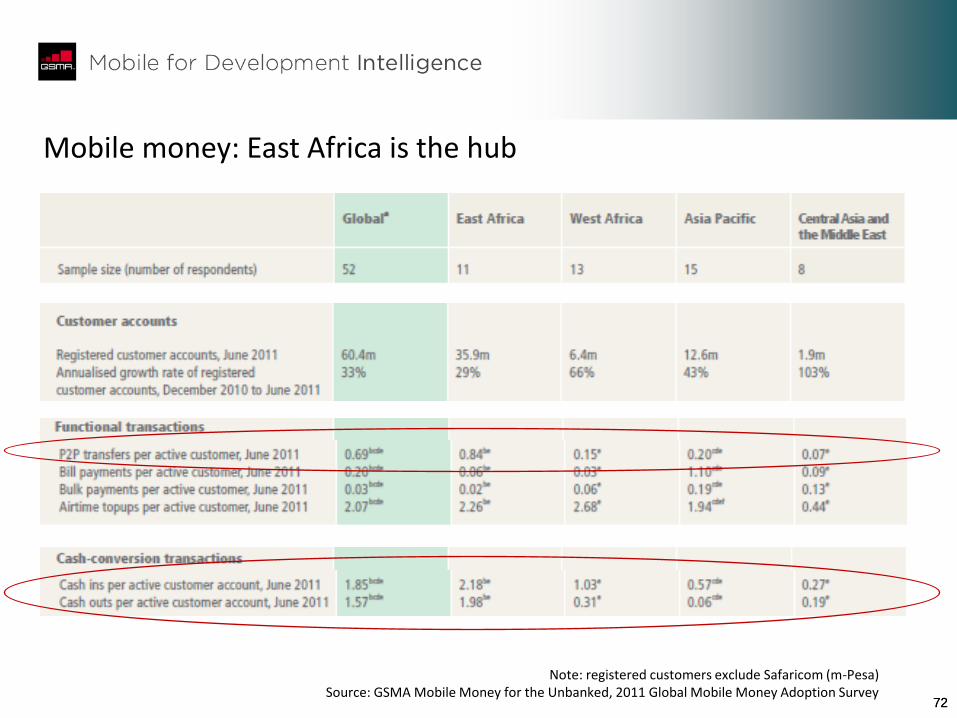
Mobile money: East Africa is the hub
Note: registered customers exclude Safaricom (m-Pesa) Source: GSMA Mobile Money for the Unbanked, 2011 Global Mobile Money Adoption Survey
73
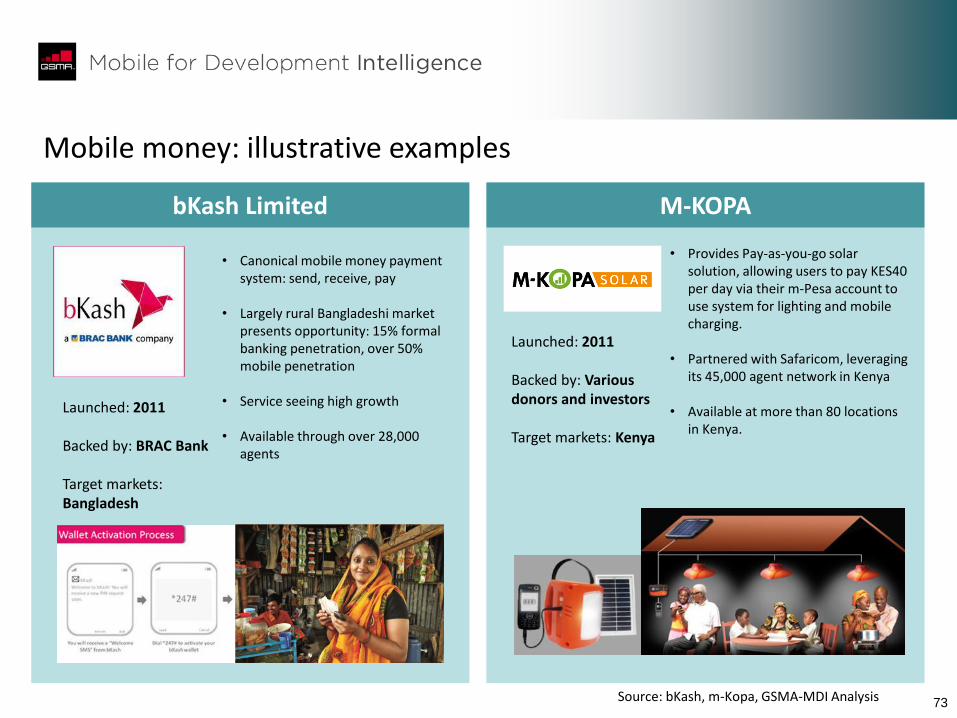
Mobile money: illustrative examples
• Provides Pay-as-you-go solar solution, allowing users to pay KES40 per day via their m-Pesa account to use system for lighting and mobile charging.
• Partnered with Safaricom, leveraging its 45,000 agent network in Kenya
• Available at more than 80 locations in Kenya.
Launched: 2011 Backed by: Various donors and investors Target markets: Kenya
M-KOPA
• Canonical mobile money payment system: send, receive, pay
• Largely rural Bangladeshi market
presents opportunity: 15% formal banking penetration, over 50% mobile penetration
• Service seeing high growth • Available through over 28,000
agents
Launched: 2011 Backed by: BRAC Bank Target markets: Bangladesh
bKash Limited
Source: bKash, m-Kopa, GSMA-MDI Analysis
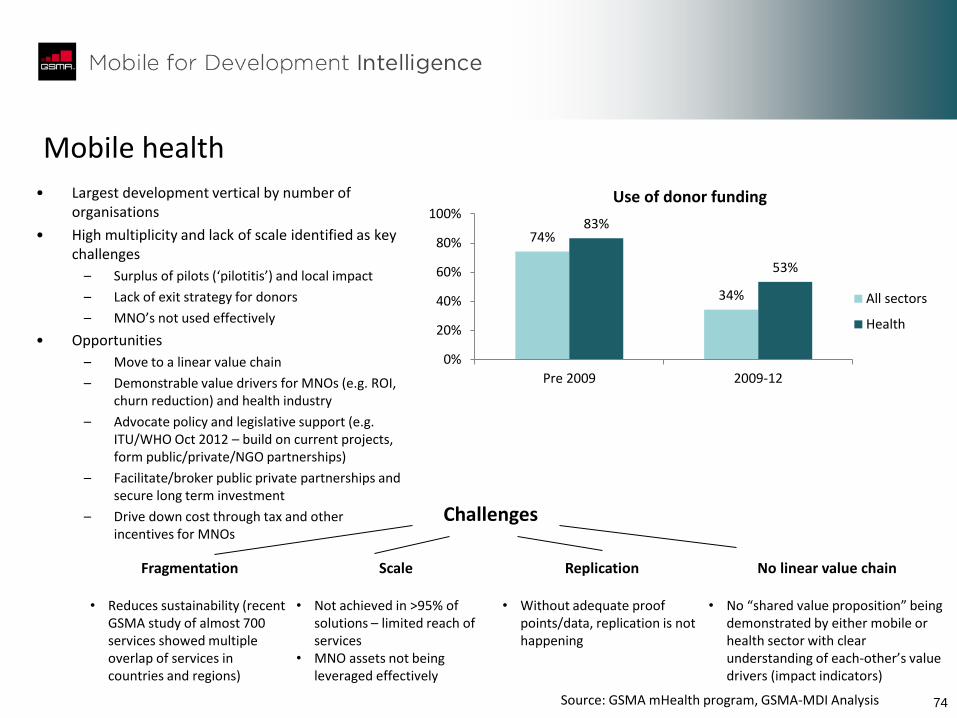
74
Mobile health
• Largest development vertical by number of organisations
• High multiplicity and lack of scale identified as key challenges
– Surplus of pilots (‘pilotitis’) and local impact
– Lack of exit strategy for donors
– MNO’s not used effectively
• Opportunities
– Move to a linear value chain
– Demonstrable value drivers for MNOs (e.g. ROI, churn reduction) and health industry
– Advocate policy and legislative support (e.g. ITU/WHO Oct 2012 – build on current projects, form public/private/NGO partnerships)
– Facilitate/broker public private partnerships and secure long term investment
– Drive down cost through tax and other incentives for MNOs
74%
34%
83%
53%
0%
20%
40%
60%
80%
100%
Pre 2009 2009-12
Use of donor funding
All sectors
Health
Challenges
Fragmentation
• Reduces sustainability (recent GSMA study of almost 700 services showed multiple overlap of services in countries and regions)
Scale
• Not achieved in >95% of solutions – limited reach of services
• MNO assets not being leveraged effectively
Replication • Without adequate proof
points/data, replication is not happening
No linear value chain • No “shared value proposition” being
demonstrated by either mobile or health sector with clear understanding of each-other’s value drivers (impact indicators)
Source: GSMA mHealth program, GSMA-MDI Analysis
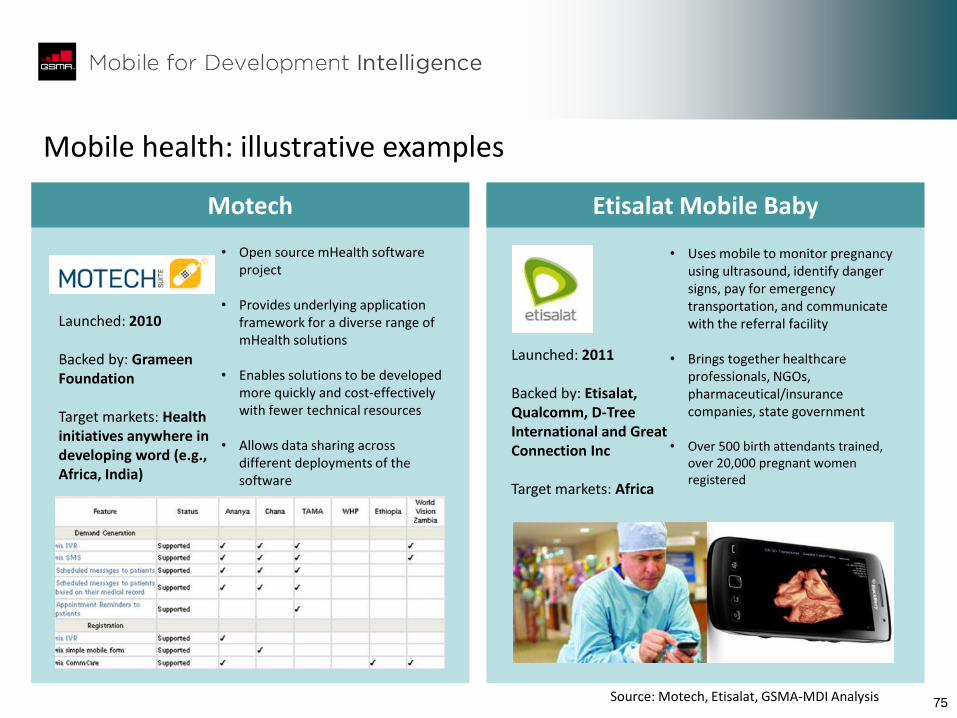
75
Mobile health: illustrative examples
• Uses mobile to monitor pregnancy using ultrasound, identify danger signs, pay for emergency transportation, and communicate with the referral facility
• Brings together healthcare
professionals, NGOs, pharmaceutical/insurance companies, state government
• Over 500 birth attendants trained, over 20,000 pregnant women registered
Launched: 2011 Backed by: Etisalat, Qualcomm, D-Tree International and Great Connection Inc Target markets: Africa
Etisalat Mobile Baby
• Open source mHealth software project
• Provides underlying application framework for a diverse range of mHealth solutions
• Enables solutions to be developed more quickly and cost-effectively with fewer technical resources
• Allows data sharing across
different deployments of the software
Launched: 2010 Backed by: Grameen Foundation Target markets: Health initiatives anywhere in developing word (e.g., Africa, India)
Motech
Source: Motech, Etisalat, GSMA-MDI Analysis
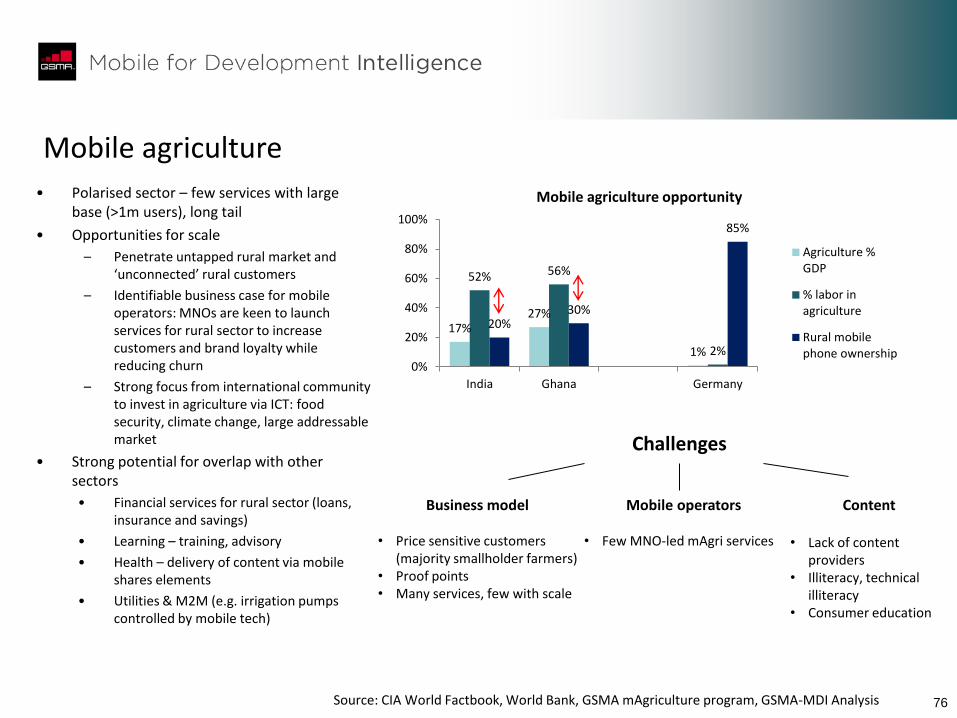
76
Mobile agriculture
• Polarised sector – few services with large base (>1m users), long tail
• Opportunities for scale
– Penetrate untapped rural market and ‘unconnected’ rural customers
– Identifiable business case for mobile operators: MNOs are keen to launch services for rural sector to increase customers and brand loyalty while reducing churn
– Strong focus from international community to invest in agriculture via ICT: food security, climate change, large addressable market
• Strong potential for overlap with other sectors
• Financial services for rural sector (loans, insurance and savings)
• Learning – training, advisory
• Health – delivery of content via mobile shares elements
• Utilities & M2M (e.g. irrigation pumps controlled by mobile tech)
17% 27%
1%
52% 56%
2%
20% 30%
85%
0%
20%
40%
60%
80%
100%
India Ghana Germany
Mobile agriculture opportunity
Agriculture %GDP
% labor inagriculture
Rural mobilephone ownership
Source: CIA World Factbook, World Bank, GSMA mAgriculture program, GSMA-MDI Analysis
Challenges
Business model
• Price sensitive customers (majority smallholder farmers)
• Proof points • Many services, few with scale
Mobile operators
• Few MNO-led mAgri services
Content • Lack of content
providers • Illiteracy, technical
illiteracy • Consumer education
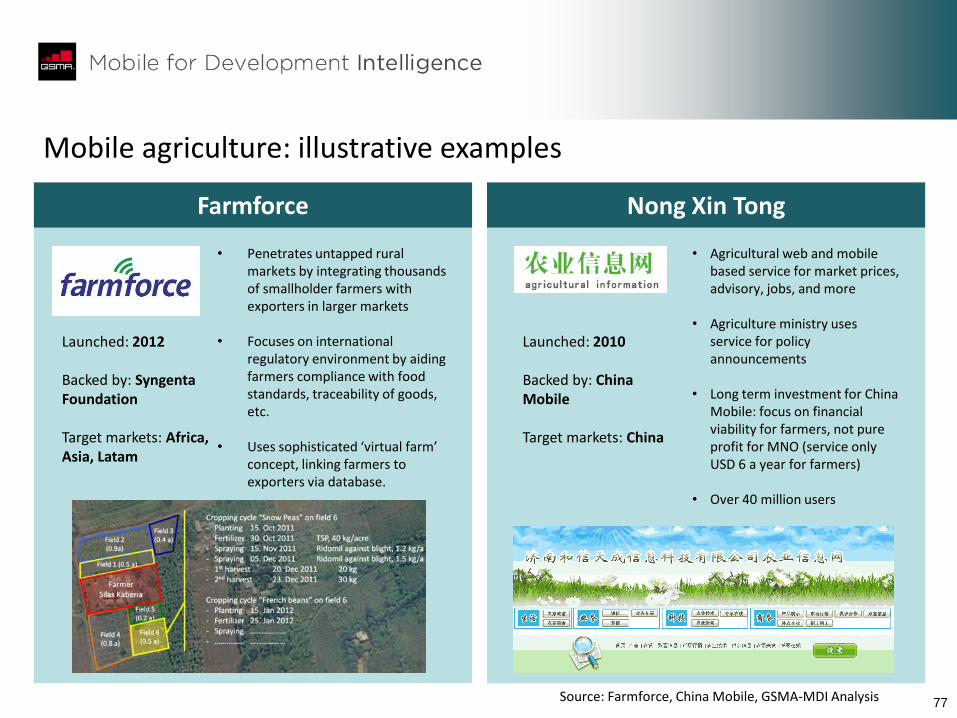
77
Mobile agriculture: illustrative examples
• Penetrates untapped rural markets by integrating thousands of smallholder farmers with exporters in larger markets
• Focuses on international
regulatory environment by aiding farmers compliance with food standards, traceability of goods, etc.
• Uses sophisticated ‘virtual farm’
concept, linking farmers to exporters via database.
Launched: 2012 Backed by: Syngenta Foundation Target markets: Africa, Asia, Latam
Farmforce
• Agricultural web and mobile based service for market prices, advisory, jobs, and more
• Agriculture ministry uses service for policy announcements
• Long term investment for China Mobile: focus on financial viability for farmers, not pure profit for MNO (service only USD 6 a year for farmers)
• Over 40 million users
Launched: 2010 Backed by: China Mobile Target markets: China
Nong Xin Tong
Source: Farmforce, China Mobile, GSMA-MDI Analysis
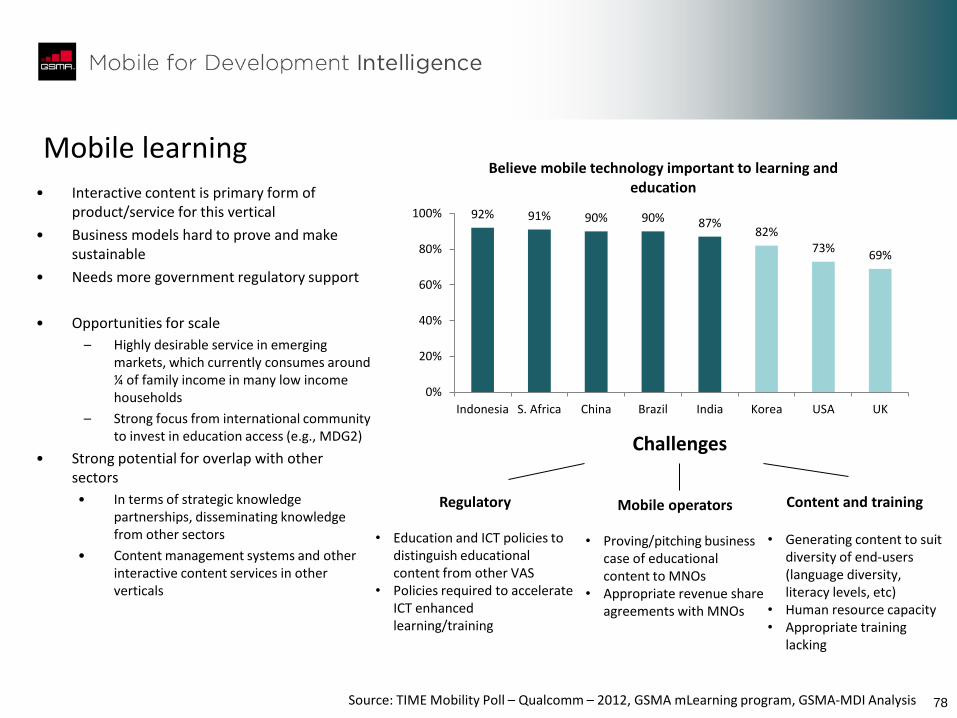
78
• Interactive content is primary form of product/service for this vertical
• Business models hard to prove and make sustainable
• Needs more government regulatory support
• Opportunities for scale
– Highly desirable service in emerging markets, which currently consumes around ¼ of family income in many low income households
– Strong focus from international community to invest in education access (e.g., MDG2)
• Strong potential for overlap with other sectors
• In terms of strategic knowledge partnerships, disseminating knowledge from other sectors
• Content management systems and other interactive content services in other verticals
Source: TIME Mobility Poll – Qualcomm – 2012, GSMA mLearning program, GSMA-MDI Analysis
Challenges
Regulatory • Education and ICT policies to
distinguish educational content from other VAS
• Policies required to accelerate ICT enhanced learning/training
Mobile operators
• Proving/pitching business case of educational content to MNOs
• Appropriate revenue share agreements with MNOs
Content and training • Generating content to suit
diversity of end-users (language diversity, literacy levels, etc)
• Human resource capacity • Appropriate training
lacking
Mobile learning
92% 91% 90% 90% 87% 82%
73% 69%
0%
20%
40%
60%
80%
100%
Indonesia S. Africa China Brazil India Korea USA UK
Believe mobile technology important to learning and education
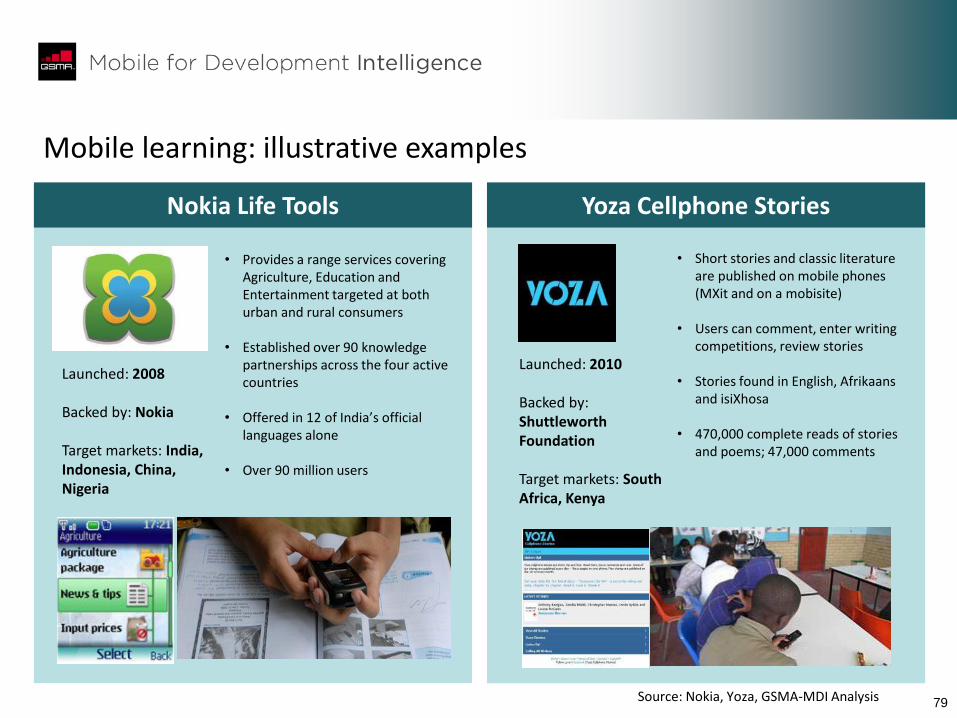
79
Mobile learning: illustrative examples
• Provides a range services covering Agriculture, Education and Entertainment targeted at both urban and rural consumers
• Established over 90 knowledge partnerships across the four active countries
• Offered in 12 of India’s official languages alone
• Over 90 million users
Launched: 2008 Backed by: Nokia Target markets: India, Indonesia, China, Nigeria
Nokia Life Tools
• Short stories and classic literature are published on mobile phones (MXit and on a mobisite)
• Users can comment, enter writing competitions, review stories
• Stories found in English, Afrikaans and isiXhosa
• 470,000 complete reads of stories and poems; 47,000 comments
Launched: 2010 Backed by: Shuttleworth Foundation Target markets: South Africa, Kenya
Yoza Cellphone Stories
Source: Nokia, Yoza, GSMA-MDI Analysis
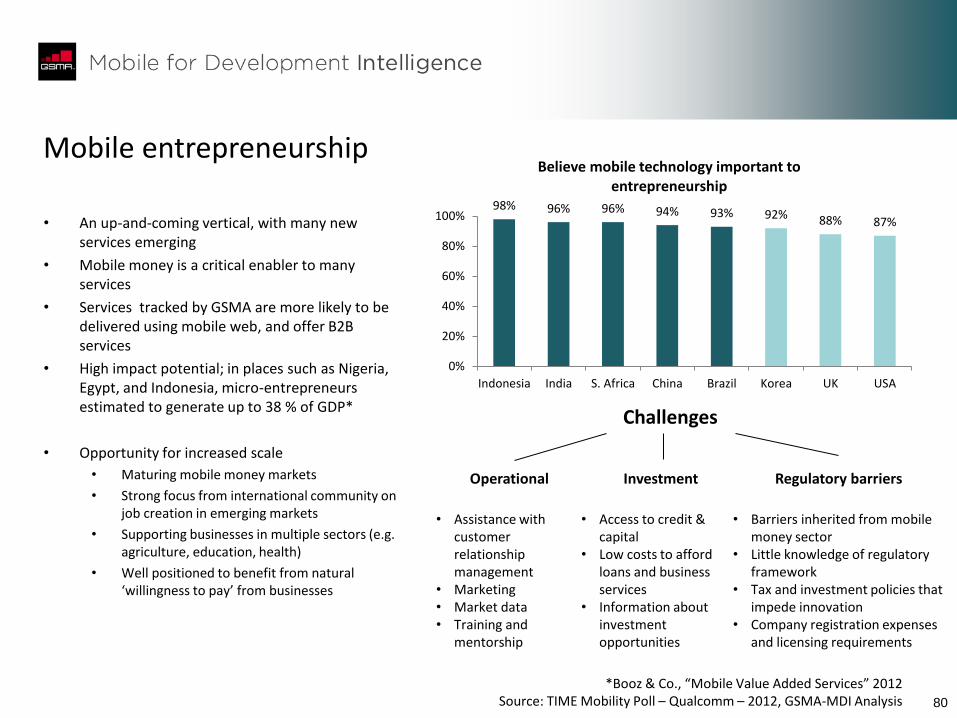
80
Mobile entrepreneurship
• An up-and-coming vertical, with many new services emerging
• Mobile money is a critical enabler to many services
• Services tracked by GSMA are more likely to be delivered using mobile web, and offer B2B services
• High impact potential; in places such as Nigeria, Egypt, and Indonesia, micro-entrepreneurs estimated to generate up to 38 % of GDP*
• Opportunity for increased scale
• Maturing mobile money markets
• Strong focus from international community on job creation in emerging markets
• Supporting businesses in multiple sectors (e.g. agriculture, education, health)
• Well positioned to benefit from natural ‘willingness to pay’ from businesses
*Booz & Co., “Mobile Value Added Services” 2012 Source: TIME Mobility Poll – Qualcomm – 2012, GSMA-MDI Analysis
Challenges
Regulatory barriers
• Barriers inherited from mobile
money sector • Little knowledge of regulatory
framework • Tax and investment policies that
impede innovation • Company registration expenses
and licensing requirements
Operational
• Assistance with
customer relationship management
• Marketing • Market data • Training and
mentorship
Investment
• Access to credit &
capital • Low costs to afford
loans and business services
• Information about investment opportunities
98% 96% 96% 94% 93% 92% 88% 87%
0%
20%
40%
60%
80%
100%
Indonesia India S. Africa China Brazil Korea UK USA
Believe mobile technology important to entrepreneurship
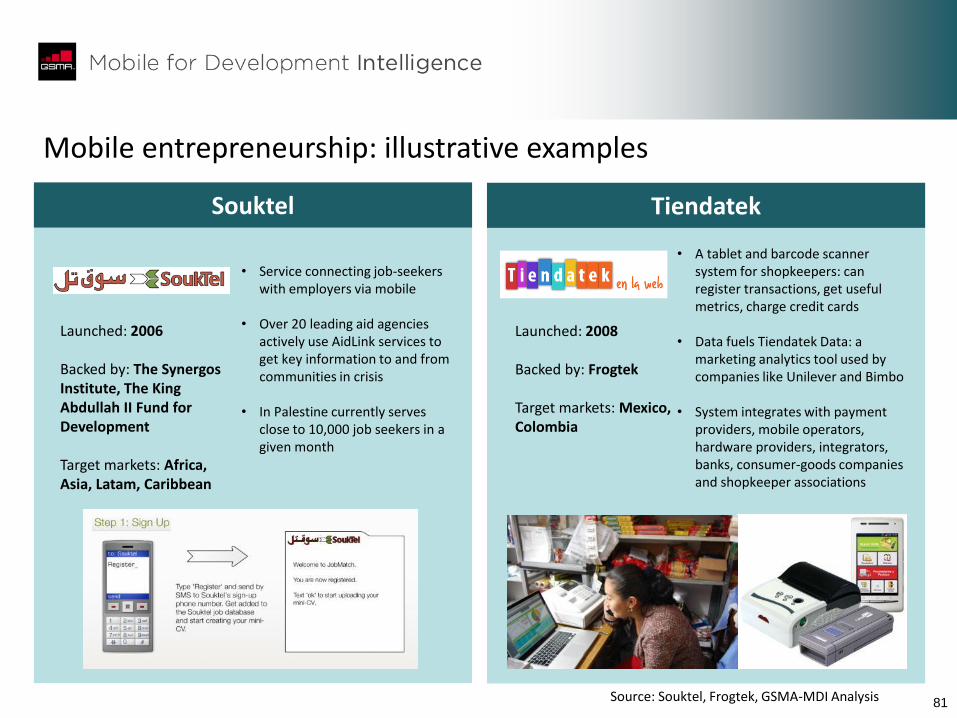
81
Mobile entrepreneurship: illustrative examples
• Service connecting job-seekers with employers via mobile
• Over 20 leading aid agencies actively use AidLink services to get key information to and from communities in crisis
• In Palestine currently serves close to 10,000 job seekers in a given month
Launched: 2006 Backed by: The Synergos Institute, The King Abdullah II Fund for Development Target markets: Africa, Asia, Latam, Caribbean
Souktel
• A tablet and barcode scanner system for shopkeepers: can register transactions, get useful metrics, charge credit cards
• Data fuels Tiendatek Data: a marketing analytics tool used by companies like Unilever and Bimbo
• System integrates with payment providers, mobile operators, hardware providers, integrators, banks, consumer-goods companies and shopkeeper associations
Launched: 2008 Backed by: Frogtek Target markets: Mexico, Colombia
Tiendatek
Source: Souktel, Frogtek, GSMA-MDI Analysis
82 82
1. Executive summary
2. Key takeaways: a stakeholder guide
3. Market landscape: current and outlook
4. Impact of mobile on development sectors
5. Platforms, multiplicity and the drive for scale
6. User-centric innovation
7. Role of government
8. Appendix
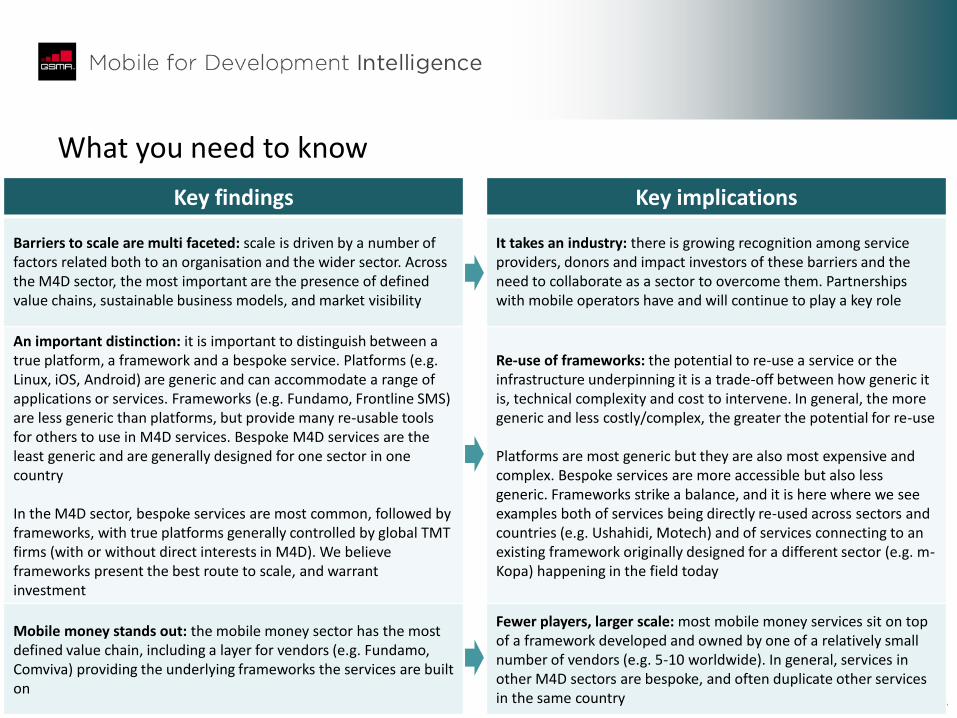
83 83
What you need to know
Key findings Key implications
Barriers to scale are multi faceted: scale is driven by a number of factors related both to an organisation and the wider sector. Across the M4D sector, the most important are the presence of defined value chains, sustainable business models, and market visibility
It takes an industry: there is growing recognition among service providers, donors and impact investors of these barriers and the need to collaborate as a sector to overcome them. Partnerships with mobile operators have and will continue to play a key role
An important distinction: it is important to distinguish between a true platform, a framework and a bespoke service. Platforms (e.g. Linux, iOS, Android) are generic and can accommodate a range of applications or services. Frameworks (e.g. Fundamo, Frontline SMS) are less generic than platforms, but provide many re-usable tools for others to use in M4D services. Bespoke M4D services are the least generic and are generally designed for one sector in one country In the M4D sector, bespoke services are most common, followed by frameworks, with true platforms generally controlled by global TMT firms (with or without direct interests in M4D). We believe frameworks present the best route to scale, and warrant investment
Re-use of frameworks: the potential to re-use a service or the infrastructure underpinning it is a trade-off between how generic it is, technical complexity and cost to intervene. In general, the more generic and less costly/complex, the greater the potential for re-use Platforms are most generic but they are also most expensive and complex. Bespoke services are more accessible but also less generic. Frameworks strike a balance, and it is here where we see examples both of services being directly re-used across sectors and countries (e.g. Ushahidi, Motech) and of services connecting to an existing framework originally designed for a different sector (e.g. m-Kopa) happening in the field today
Mobile money stands out: the mobile money sector has the most defined value chain, including a layer for vendors (e.g. Fundamo, Comviva) providing the underlying frameworks the services are built on
Fewer players, larger scale: most mobile money services sit on top of a framework developed and owned by one of a relatively small number of vendors (e.g. 5-10 worldwide). In general, services in other M4D sectors are bespoke, and often duplicate other services in the same country
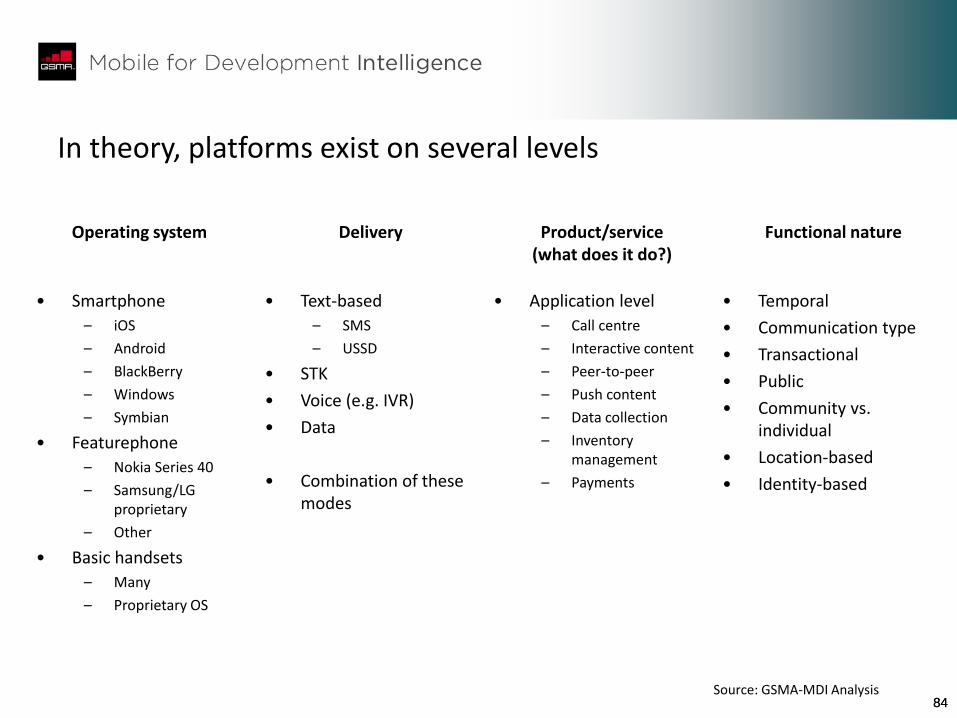
84 84
In theory, platforms exist on several levels
Operating system Delivery Product/service (what does it do?)
Functional nature
• Smartphone
– iOS
– Android
– BlackBerry
– Windows
– Symbian
• Featurephone
– Nokia Series 40
– Samsung/LG proprietary
– Other
• Basic handsets
– Many
– Proprietary OS
• Text-based
– SMS
– USSD
• STK
• Voice (e.g. IVR)
• Data
• Combination of these modes
• Temporal
• Communication type
• Transactional
• Public
• Community vs. individual
• Location-based
• Identity-based
• Application level
– Call centre
– Interactive content
– Peer-to-peer
– Push content
– Data collection
– Inventory management
– Payments
Source: GSMA-MDI Analysis
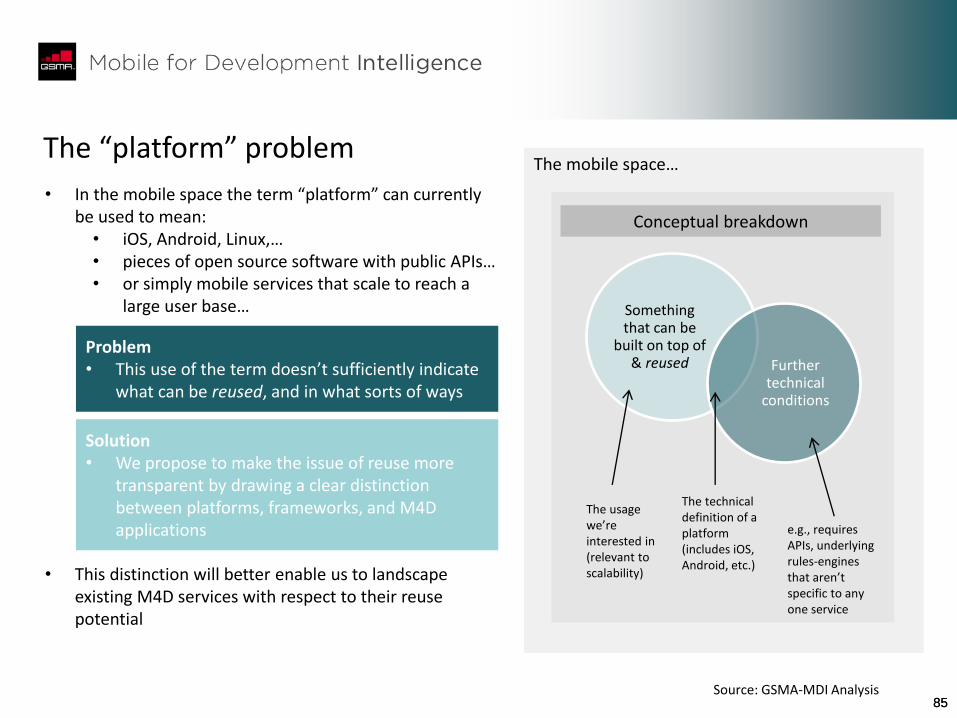
85 85
The “platform” problem
• In the mobile space the term “platform” can currently be used to mean:
• iOS, Android, Linux,… • pieces of open source software with public APIs… • or simply mobile services that scale to reach a
large user base…
• This distinction will better enable us to landscape
existing M4D services with respect to their reuse potential
The mobile space…
Conceptual breakdown
Something that can be
built on top of & reused Further
technical conditions
e.g., requires APIs, underlying rules-engines that aren’t specific to any one service
The technical definition of a platform (includes iOS, Android, etc.)
The usage we’re interested in (relevant to scalability)
Problem • This use of the term doesn’t sufficiently indicate
what can be reused, and in what sorts of ways
Solution • We propose to make the issue of reuse more
transparent by drawing a clear distinction between platforms, frameworks, and M4D applications
Source: GSMA-MDI Analysis
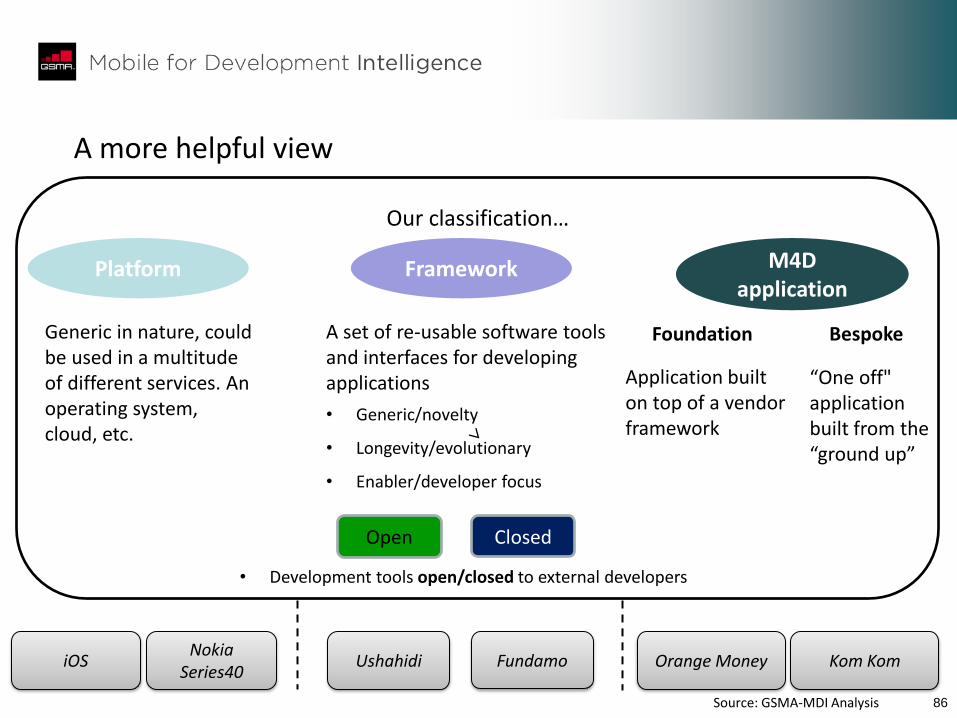
86
A more helpful view
Our classification…
Closed
iOS Ushahidi Kom Kom
Open
Generic in nature, could be used in a multitude of different services. An operating system, cloud, etc.
“One off" application built from the “ground up”
A set of re-usable software tools and interfaces for developing applications
• Generic/novelty
• Longevity/evolutionary
• Enabler/developer focus
• Development tools open/closed to external developers
Fundamo
Platform Framework M4D application
Application built on top of a vendor framework
Foundation Bespoke
Orange Money Nokia
Series40
Source: GSMA-MDI Analysis
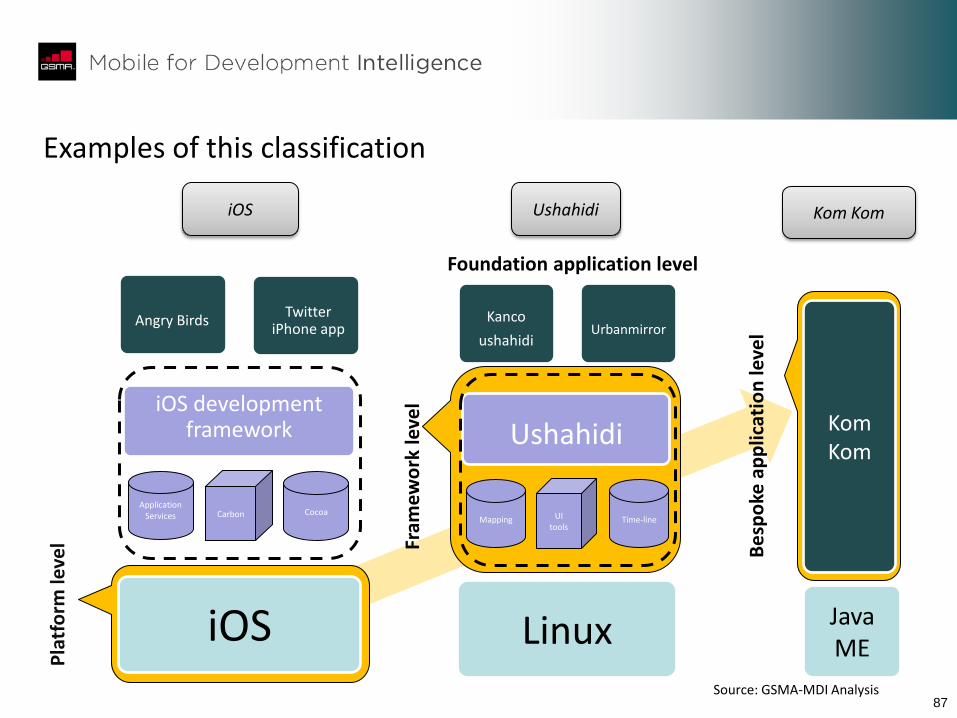
87
Examples of this classification
Application Services Carbon
iOS development framework
Angry Birds Twitter
iPhone app
Cocoa
iOS
Pla
tfo
rm le
vel
Mapping UI tools
inux
Ushahidi
Kanco
ushahidi Urbanmirror
Time-line
Linux
Fram
ewo
rk le
vel
Kom Kom
Java ME
Be
spo
ke a
pp
licat
ion
leve
l
iOS Ushahidi Kom Kom
Foundation application level
Source: GSMA-MDI Analysis
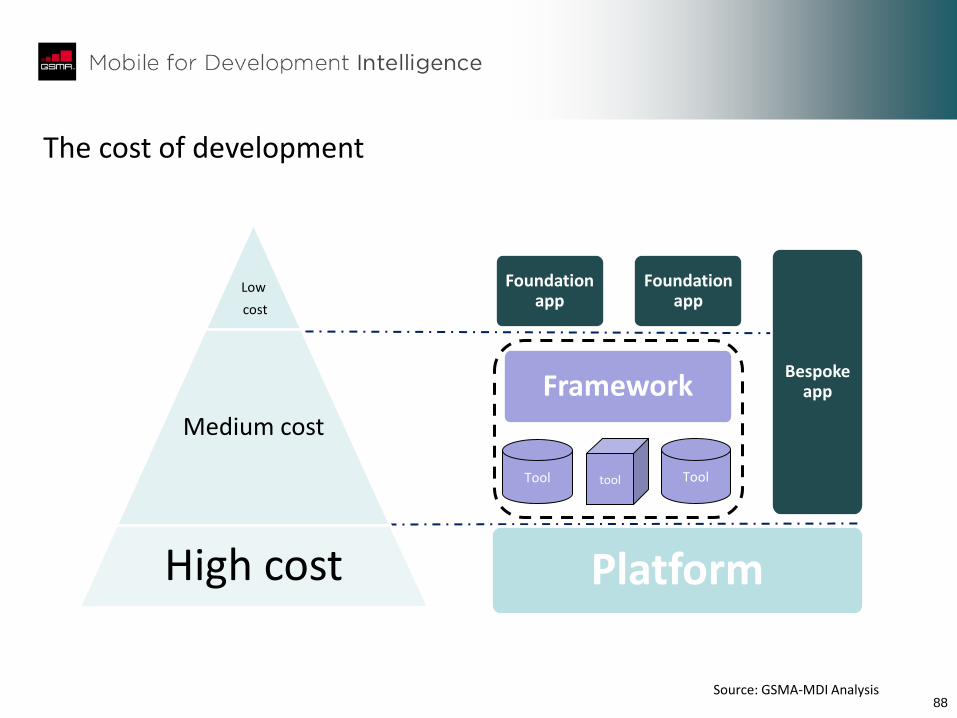
88
The cost of development
Low
cost
Medium cost
High cost
Tool tool
Platform
Framework
Foundation app
Foundation app
Bespoke app
Tool
Source: GSMA-MDI Analysis
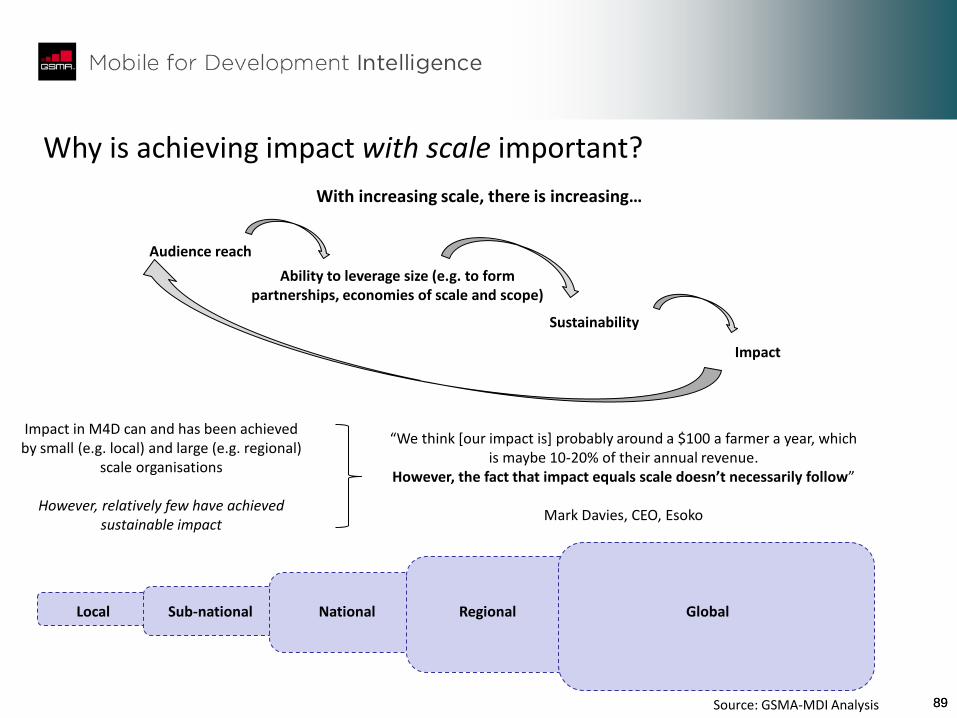
89 89
Why is achieving impact with scale important?
Audience reach
Ability to leverage size (e.g. to form partnerships, economies of scale and scope)
Sustainability
Impact
With increasing scale, there is increasing…
Local Sub-national National Regional Global
Impact in M4D can and has been achieved by small (e.g. local) and large (e.g. regional)
scale organisations
However, relatively few have achieved sustainable impact
“We think [our impact is] probably around a $100 a farmer a year, which is maybe 10-20% of their annual revenue.
However, the fact that impact equals scale doesn’t necessarily follow”
Mark Davies, CEO, Esoko
Source: GSMA-MDI Analysis

90 90
Achieving scale is multi faceted
Defined value chain
Fully formed Unformed Partially formed
Full ecosystem with defined value proposition at each level
Collection of participants, but lack of defined value proposition
Sust
ain
able
bu
sin
ess
m
od
el
Self
re
info
rcin
g Ea
rly
stag
e M
idd
le s
tage
Defined customer base, streamlined
operations, defined cost structure,
revenue linked to investment
Clusters and pilots, local impact, lack
sustainable revenue
Mobile money
Mobile health
Visibility
Good Poor Modest
Taking a user-centric approach to organisational culture and product
design also plays a key role (see section 4)
Source: GSMA-MDI Analysis
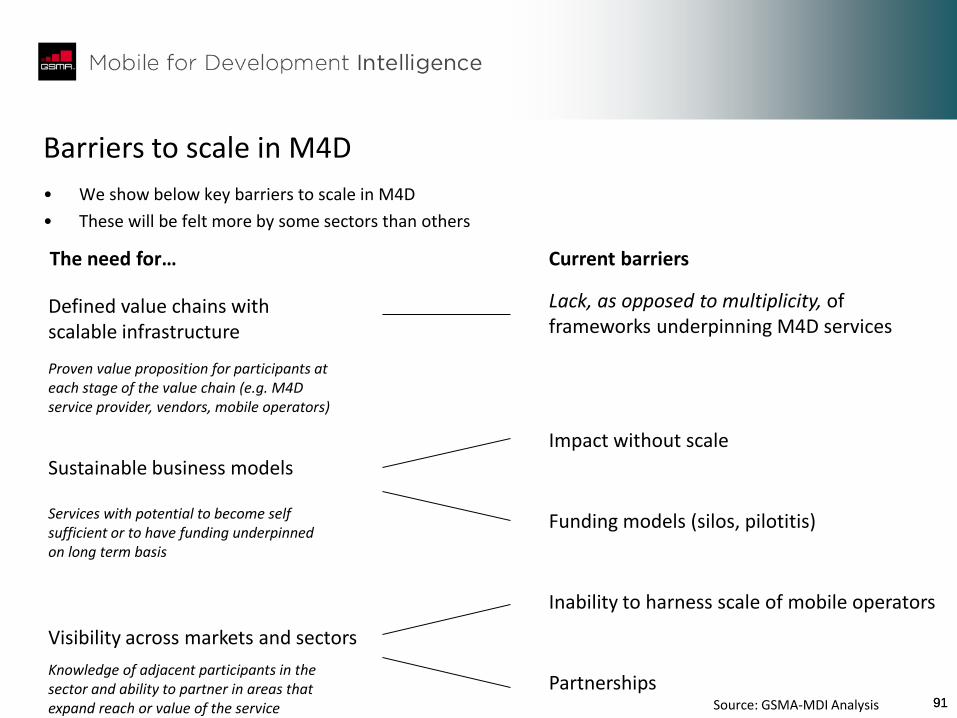
91 91
Barriers to scale in M4D
Defined value chains with scalable infrastructure
Sustainable business models
Visibility across markets and sectors
Lack, as opposed to multiplicity, of frameworks underpinning M4D services
Impact without scale
Funding models (silos, pilotitis)
Inability to harness scale of mobile operators
Partnerships
Proven value proposition for participants at each stage of the value chain (e.g. M4D service provider, vendors, mobile operators)
The need for…
Services with potential to become self sufficient or to have funding underpinned on long term basis
Current barriers
Knowledge of adjacent participants in the sector and ability to partner in areas that expand reach or value of the service
• We show below key barriers to scale in M4D
• These will be felt more by some sectors than others
Source: GSMA-MDI Analysis
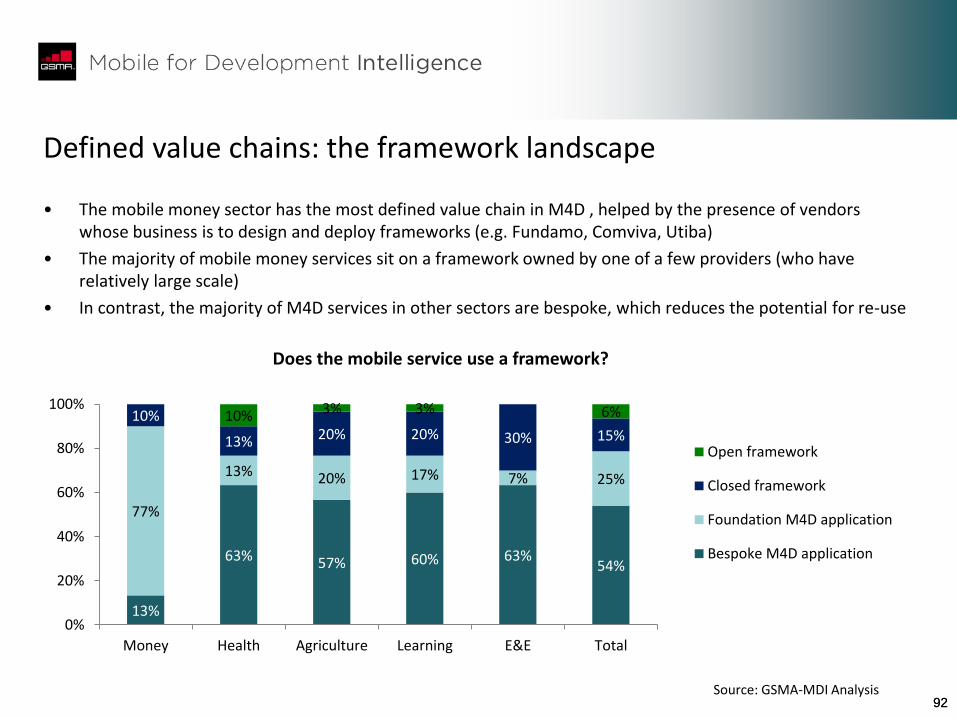
92 92
13%
63% 57% 60% 63% 54%
77%
13% 20% 17% 7% 25%
10%
13% 20% 20% 30% 15% 10% 3% 3% 6%
0%
20%
40%
60%
80%
100%
Money Health Agriculture Learning E&E Total
Does the mobile service use a framework?
Open framework
Closed framework
Foundation M4D application
Bespoke M4D application
Defined value chains: the framework landscape
• The mobile money sector has the most defined value chain in M4D , helped by the presence of vendors whose business is to design and deploy frameworks (e.g. Fundamo, Comviva, Utiba)
• The majority of mobile money services sit on a framework owned by one of a few providers (who have relatively large scale)
• In contrast, the majority of M4D services in other sectors are bespoke, which reduces the potential for re-use
Source: GSMA-MDI Analysis
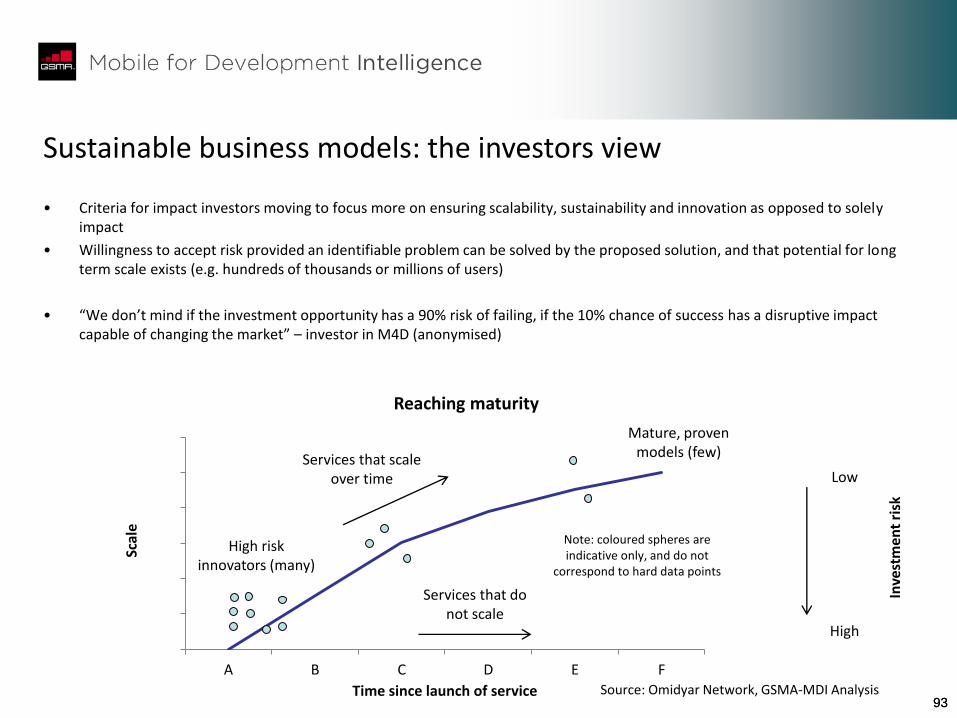
93 93
Sustainable business models: the investors view
• Criteria for impact investors moving to focus more on ensuring scalability, sustainability and innovation as opposed to solely impact
• Willingness to accept risk provided an identifiable problem can be solved by the proposed solution, and that potential for long term scale exists (e.g. hundreds of thousands or millions of users)
• “We don’t mind if the investment opportunity has a 90% risk of failing, if the 10% chance of success has a disruptive impact capable of changing the market” – investor in M4D (anonymised)
A B C D E F
Scal
e
Time since launch of service
Reaching maturity
High risk innovators (many)
Mature, proven models (few)
Low
High
Inve
stm
ent
risk
Note: coloured spheres are indicative only, and do not
correspond to hard data points
Source: Omidyar Network, GSMA-MDI Analysis
Services that scale over time
Services that do not scale
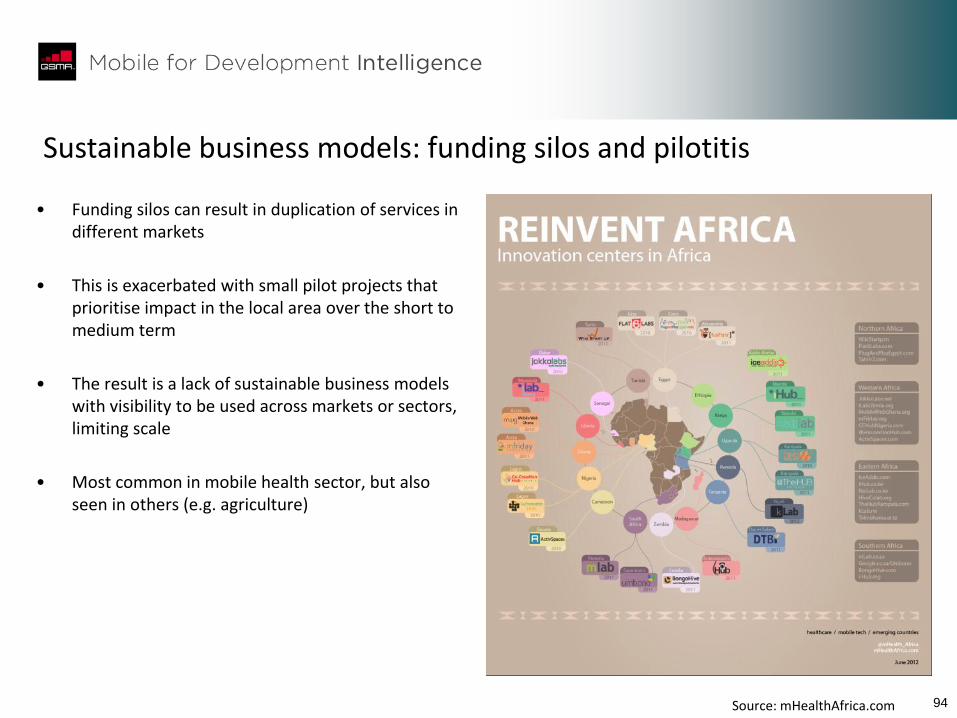
94
Sustainable business models: funding silos and pilotitis
• Funding silos can result in duplication of services in different markets
• This is exacerbated with small pilot projects that prioritise impact in the local area over the short to medium term
• The result is a lack of sustainable business models with visibility to be used across markets or sectors, limiting scale
• Most common in mobile health sector, but also seen in others (e.g. agriculture)
Source: mHealthAfrica.com
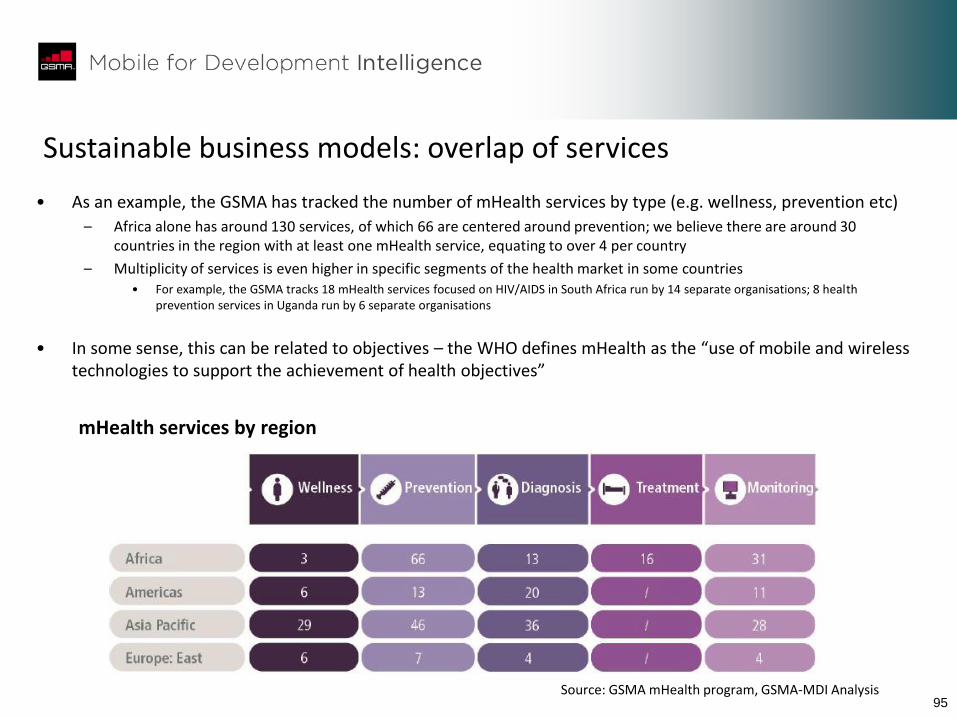
95
Sustainable business models: overlap of services
• As an example, the GSMA has tracked the number of mHealth services by type (e.g. wellness, prevention etc)
– Africa alone has around 130 services, of which 66 are centered around prevention; we believe there are around 30 countries in the region with at least one mHealth service, equating to over 4 per country
– Multiplicity of services is even higher in specific segments of the health market in some countries • For example, the GSMA tracks 18 mHealth services focused on HIV/AIDS in South Africa run by 14 separate organisations; 8 health
prevention services in Uganda run by 6 separate organisations
• In some sense, this can be related to objectives – the WHO defines mHealth as the “use of mobile and wireless technologies to support the achievement of health objectives”
mHealth services by region
Source: GSMA mHealth program, GSMA-MDI Analysis
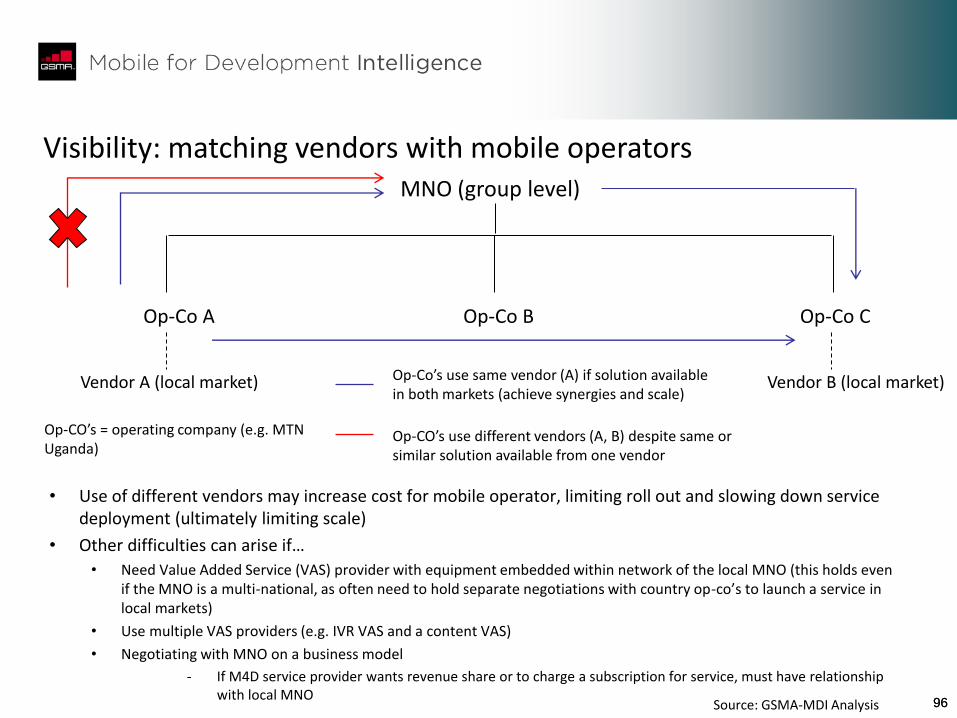
96 96
• Use of different vendors may increase cost for mobile operator, limiting roll out and slowing down service deployment (ultimately limiting scale)
• Other difficulties can arise if…
• Need Value Added Service (VAS) provider with equipment embedded within network of the local MNO (this holds even if the MNO is a multi-national, as often need to hold separate negotiations with country op-co’s to launch a service in local markets)
• Use multiple VAS providers (e.g. IVR VAS and a content VAS)
• Negotiating with MNO on a business model
- If M4D service provider wants revenue share or to charge a subscription for service, must have relationship with local MNO
Visibility: matching vendors with mobile operators MNO (group level)
Op-Co A Op-Co B Op-Co C
Vendor A (local market) Op-Co’s use same vendor (A) if solution available in both markets (achieve synergies and scale)
Vendor B (local market)
Op-CO’s use different vendors (A, B) despite same or similar solution available from one vendor
Source: GSMA-MDI Analysis
Op-CO’s = operating company (e.g. MTN Uganda)
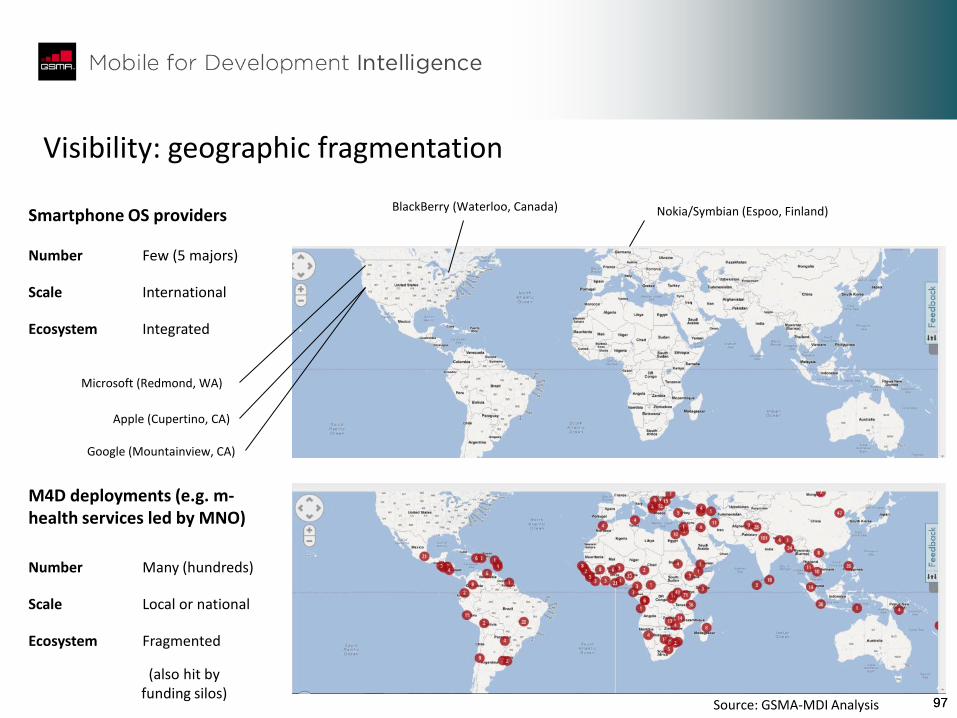
97 97
Smartphone OS providers
M4D deployments (e.g. m-health services led by MNO)
Microsoft (Redmond, WA)
Apple (Cupertino, CA)
Google (Mountainview, CA)
BlackBerry (Waterloo, Canada) Nokia/Symbian (Espoo, Finland)
Number
Scale
Ecosystem
Number
Scale
Ecosystem
Few (5 majors)
International
Integrated
Many (hundreds)
Local or national
Fragmented
Visibility: geographic fragmentation
(also hit by funding silos)
Source: GSMA-MDI Analysis
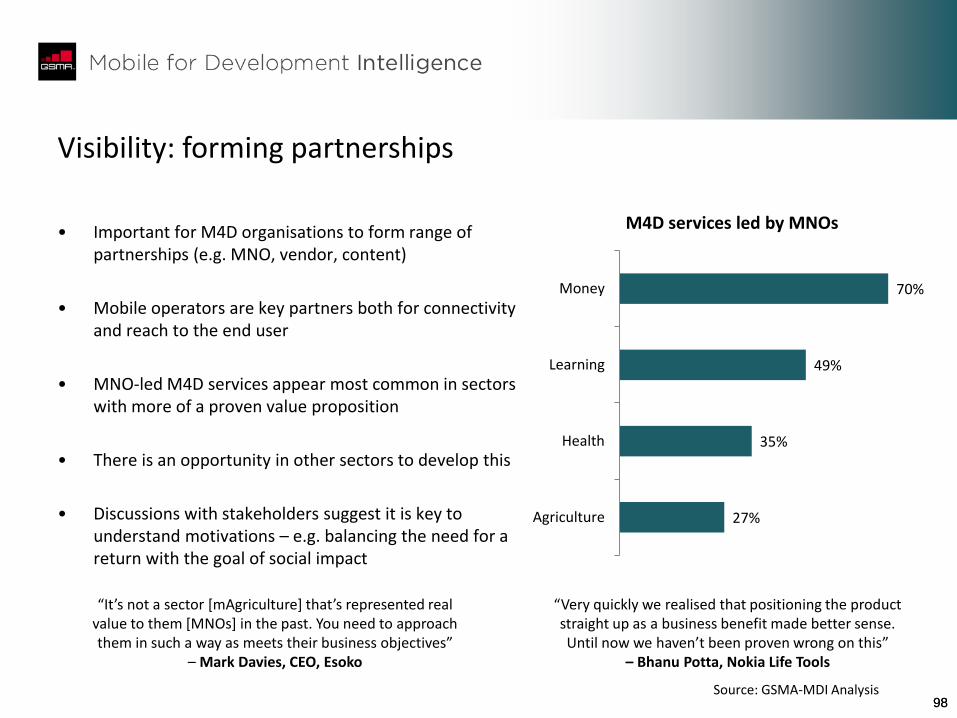
98 98
Visibility: forming partnerships
• Important for M4D organisations to form range of partnerships (e.g. MNO, vendor, content)
• Mobile operators are key partners both for connectivity and reach to the end user
• MNO-led M4D services appear most common in sectors with more of a proven value proposition
• There is an opportunity in other sectors to develop this
• Discussions with stakeholders suggest it is key to understand motivations – e.g. balancing the need for a return with the goal of social impact
70%
49%
35%
27%
Money
Learning
Health
Agriculture
M4D services led by MNOs
Source: GSMA-MDI Analysis
“Very quickly we realised that positioning the product straight up as a business benefit made better sense. Until now we haven’t been proven wrong on this”
– Bhanu Potta, Nokia Life Tools
“It’s not a sector [mAgriculture] that’s represented real value to them [MNOs] in the past. You need to approach them in such a way as meets their business objectives”
– Mark Davies, CEO, Esoko
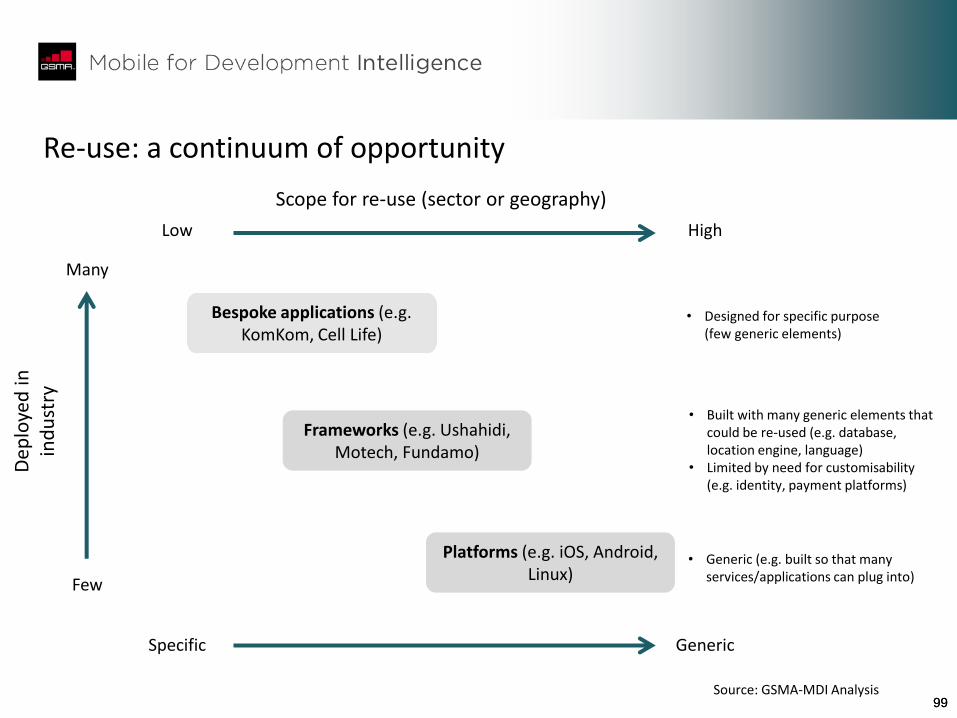
99 99
Re-use: a continuum of opportunity
Dep
loye
d in
in
du
stry
Low High
Scope for re-use (sector or geography)
Bespoke applications (e.g. KomKom, Cell Life)
Frameworks (e.g. Ushahidi, Motech, Fundamo)
Platforms (e.g. iOS, Android, Linux)
Few
Many
• Designed for specific purpose (few generic elements)
• Built with many generic elements that could be re-used (e.g. database, location engine, language)
• Limited by need for customisability (e.g. identity, payment platforms)
• Generic (e.g. built so that many services/applications can plug into)
Specific Generic
Source: GSMA-MDI Analysis
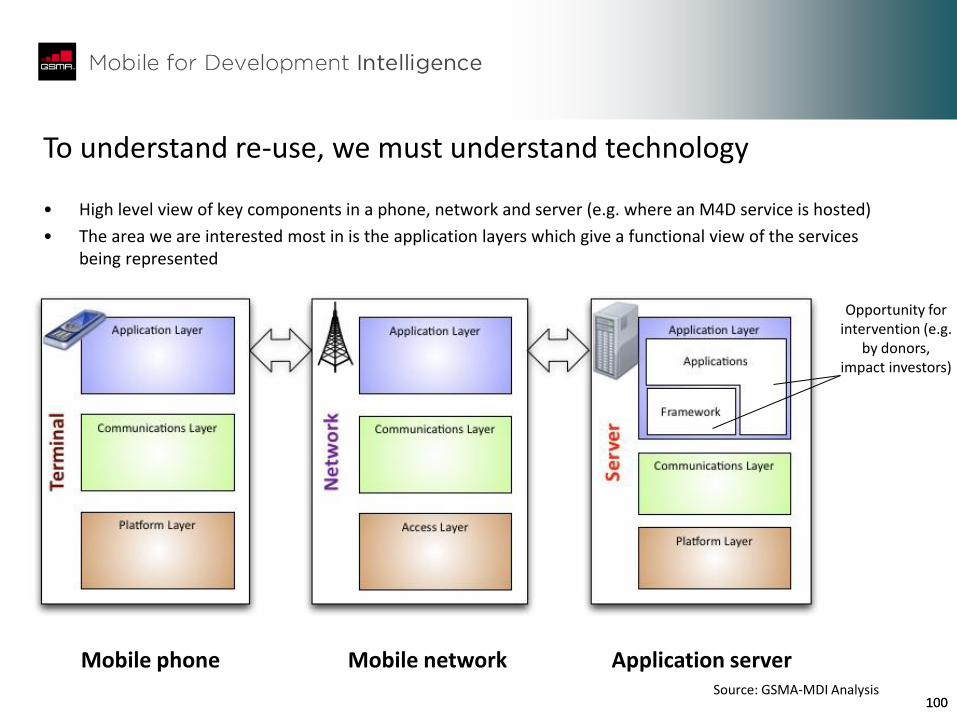
100 100
To understand re-use, we must understand technology
Mobile phone Mobile network Application server
Opportunity for intervention (e.g.
by donors, impact investors)
• High level view of key components in a phone, network and server (e.g. where an M4D service is hosted)
• The area we are interested most in is the application layers which give a functional view of the services being represented
Source: GSMA-MDI Analysis
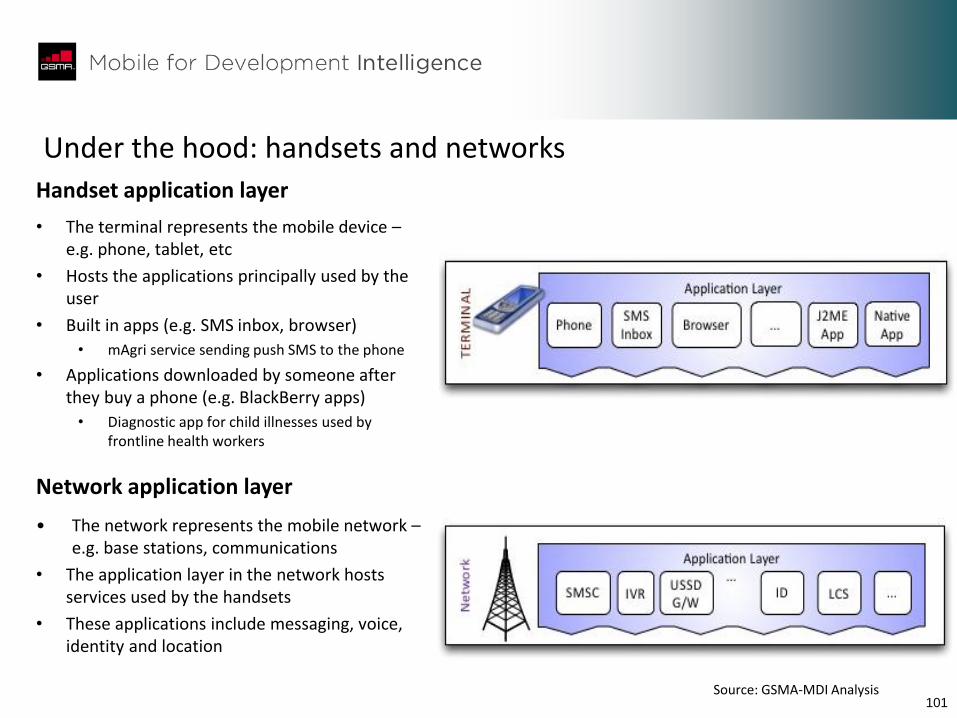
101
Under the hood: handsets and networks
• The terminal represents the mobile device – e.g. phone, tablet, etc
• Hosts the applications principally used by the user
• Built in apps (e.g. SMS inbox, browser)
• mAgri service sending push SMS to the phone
• Applications downloaded by someone after they buy a phone (e.g. BlackBerry apps)
• Diagnostic app for child illnesses used by frontline health workers
Handset application layer
• The network represents the mobile network – e.g. base stations, communications
• The application layer in the network hosts services used by the handsets
• These applications include messaging, voice, identity and location
Network application layer
Source: GSMA-MDI Analysis
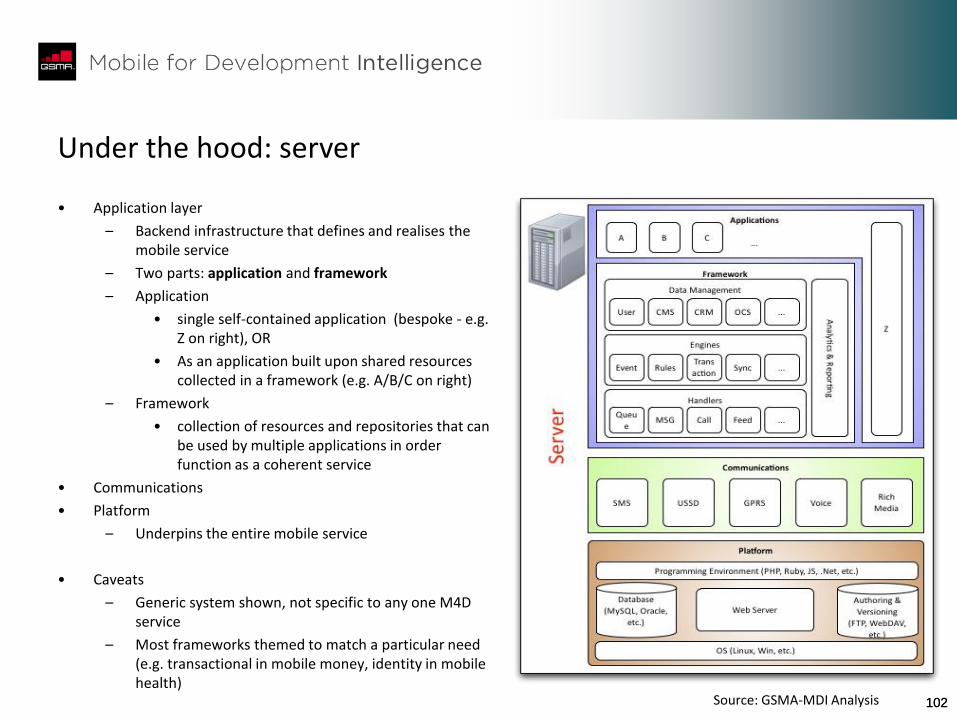
102 102
Under the hood: server
• Application layer
– Backend infrastructure that defines and realises the mobile service
– Two parts: application and framework
– Application
• single self-contained application (bespoke - e.g. Z on right), OR
• As an application built upon shared resources collected in a framework (e.g. A/B/C on right)
– Framework
• collection of resources and repositories that can be used by multiple applications in order function as a coherent service
• Communications
• Platform
– Underpins the entire mobile service
• Caveats
– Generic system shown, not specific to any one M4D service
– Most frameworks themed to match a particular need (e.g. transactional in mobile money, identity in mobile health)
Source: GSMA-MDI Analysis
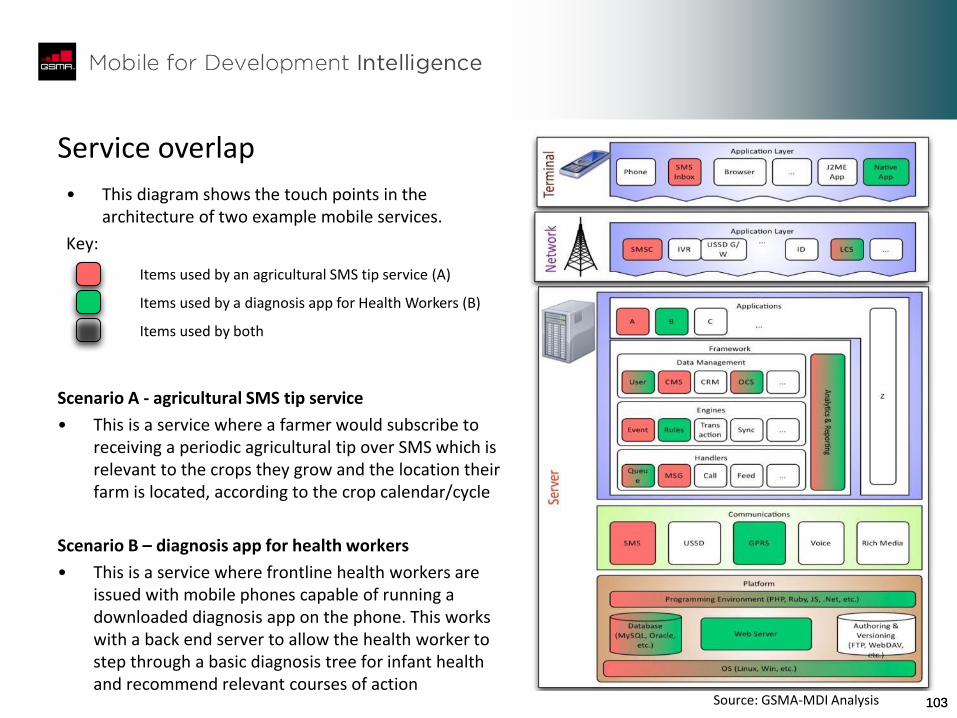
103 103
Service overlap
Scenario A - agricultural SMS tip service
• This is a service where a farmer would subscribe to receiving a periodic agricultural tip over SMS which is relevant to the crops they grow and the location their farm is located, according to the crop calendar/cycle
Scenario B – diagnosis app for health workers
• This is a service where frontline health workers are issued with mobile phones capable of running a downloaded diagnosis app on the phone. This works with a back end server to allow the health worker to step through a basic diagnosis tree for infant health and recommend relevant courses of action
• This diagram shows the touch points in the architecture of two example mobile services.
Key:
Items used by an agricultural SMS tip service (A)
Items used by a diagnosis app for Health Workers (B)
Items used by both
Source: GSMA-MDI Analysis
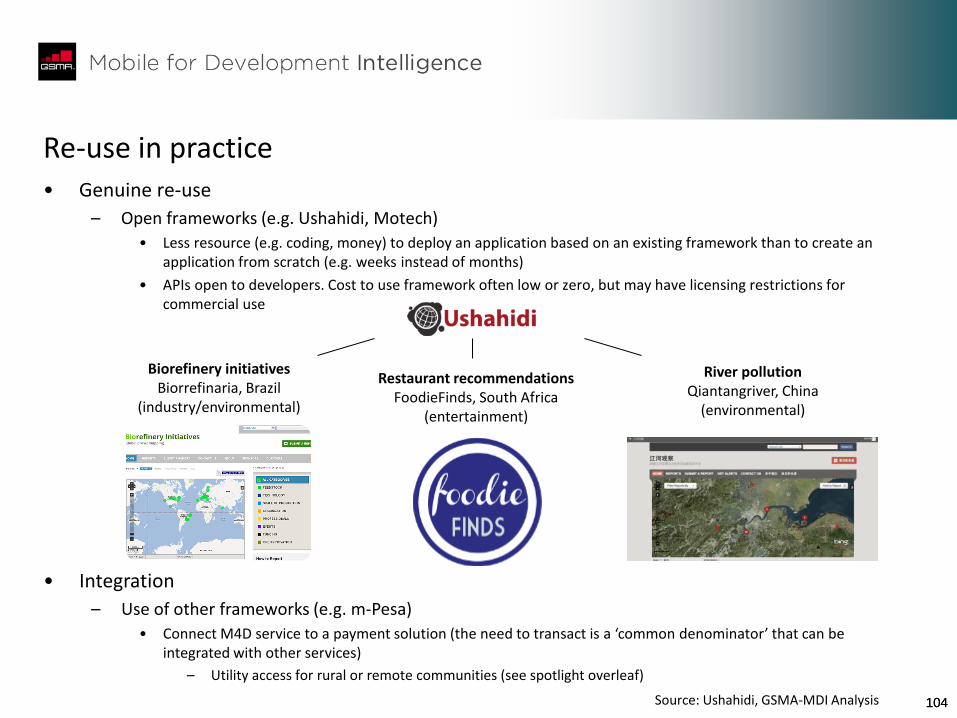
104 104
Re-use in practice • Genuine re-use
– Open frameworks (e.g. Ushahidi, Motech)
• Less resource (e.g. coding, money) to deploy an application based on an existing framework than to create an application from scratch (e.g. weeks instead of months)
• APIs open to developers. Cost to use framework often low or zero, but may have licensing restrictions for commercial use
• Integration
– Use of other frameworks (e.g. m-Pesa)
• Connect M4D service to a payment solution (the need to transact is a ‘common denominator’ that can be integrated with other services)
– Utility access for rural or remote communities (see spotlight overleaf)
Biorefinery initiatives Biorrefinaria, Brazil
(industry/environmental)
Restaurant recommendations FoodieFinds, South Africa
(entertainment)
River pollution Qiantangriver, China
(environmental)
Source: Ushahidi, GSMA-MDI Analysis
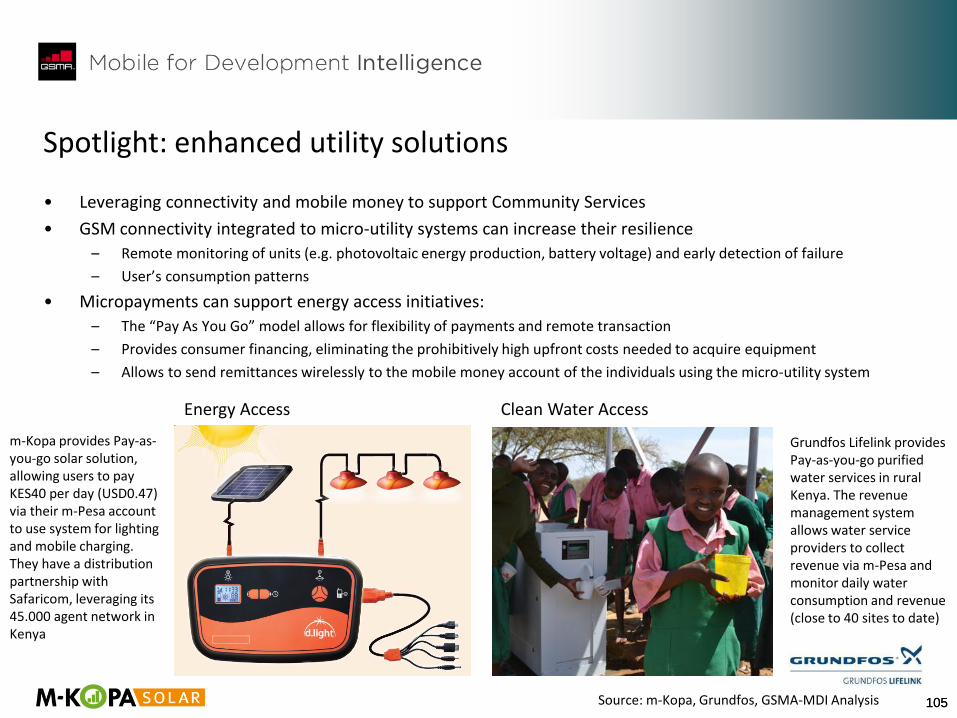
105 105
• Leveraging connectivity and mobile money to support Community Services
• GSM connectivity integrated to micro-utility systems can increase their resilience
– Remote monitoring of units (e.g. photovoltaic energy production, battery voltage) and early detection of failure
– User’s consumption patterns
• Micropayments can support energy access initiatives:
– The “Pay As You Go” model allows for flexibility of payments and remote transaction
– Provides consumer financing, eliminating the prohibitively high upfront costs needed to acquire equipment
– Allows to send remittances wirelessly to the mobile money account of the individuals using the micro-utility system
Spotlight: enhanced utility solutions
Grundfos Lifelink provides Pay-as-you-go purified water services in rural Kenya. The revenue management system allows water service providers to collect revenue via m-Pesa and monitor daily water consumption and revenue (close to 40 sites to date)
m-Kopa provides Pay-as-you-go solar solution, allowing users to pay KES40 per day (USD0.47) via their m-Pesa account to use system for lighting and mobile charging. They have a distribution partnership with Safaricom, leveraging its 45.000 agent network in Kenya
Energy Access Clean Water Access
Source: m-Kopa, Grundfos, GSMA-MDI Analysis
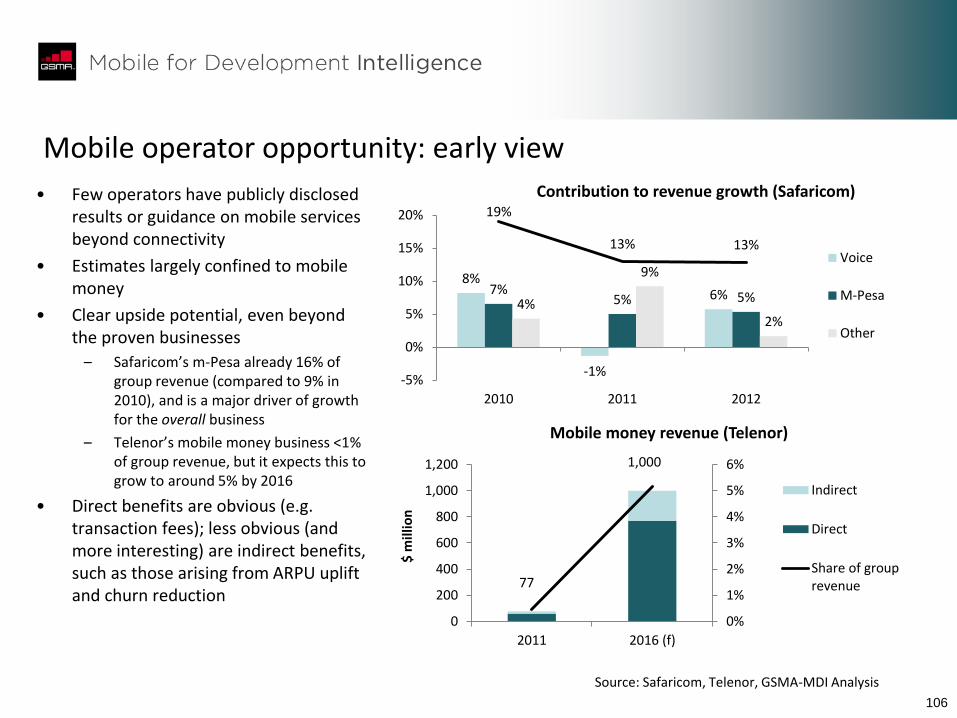
106
Mobile operator opportunity: early view
• Few operators have publicly disclosed results or guidance on mobile services beyond connectivity
• Estimates largely confined to mobile money
• Clear upside potential, even beyond the proven businesses
– Safaricom’s m-Pesa already 16% of group revenue (compared to 9% in 2010), and is a major driver of growth for the overall business
– Telenor’s mobile money business <1% of group revenue, but it expects this to grow to around 5% by 2016
• Direct benefits are obvious (e.g. transaction fees); less obvious (and more interesting) are indirect benefits, such as those arising from ARPU uplift and churn reduction
8%
-1%
6% 7% 5% 5% 4%
9%
2%
19%
13% 13%
-5%
0%
5%
10%
15%
20%
2010 2011 2012
Contribution to revenue growth (Safaricom)
Voice
M-Pesa
Other
77
1,000
0%
1%
2%
3%
4%
5%
6%
0
200
400
600
800
1,000
1,200
2011 2016 (f)
$ m
illio
n
Mobile money revenue (Telenor)
Indirect
Direct
Share of grouprevenue
Source: Safaricom, Telenor, GSMA-MDI Analysis
107 107
1. Executive summary
2. Key takeaways: a stakeholder guide
3. Market landscape: current and outlook
4. Impact of mobile on development sectors
5. Platforms, multiplicity and the drive for scale
6. User-centric innovation
7. Role of government
8. Appendix
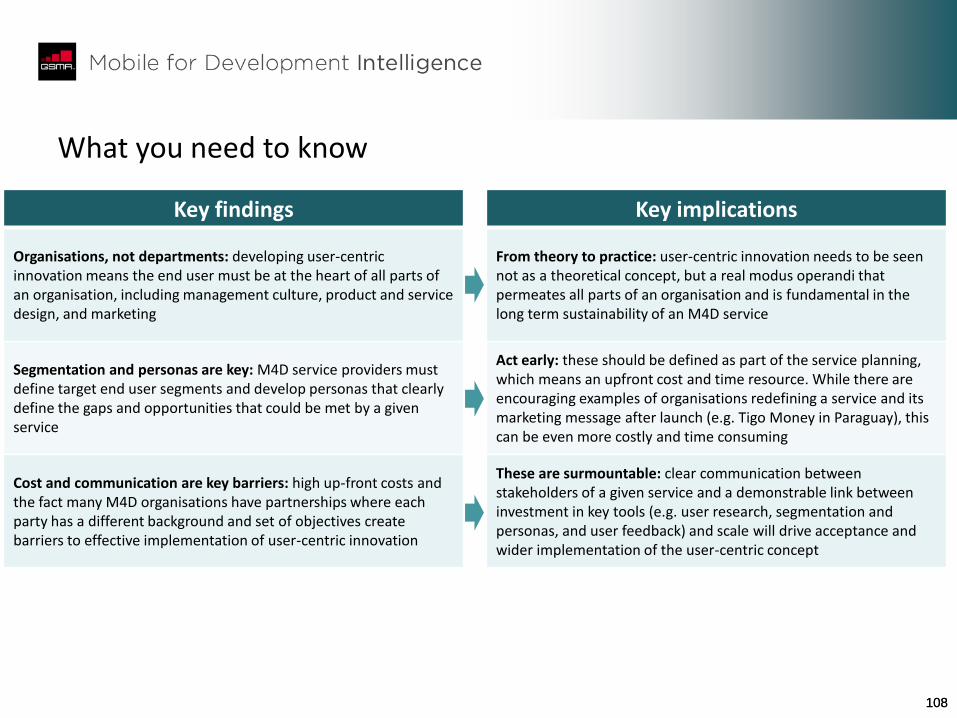
108 108
What you need to know
Key findings Key implications
Organisations, not departments: developing user-centric innovation means the end user must be at the heart of all parts of an organisation, including management culture, product and service design, and marketing
From theory to practice: user-centric innovation needs to be seen not as a theoretical concept, but a real modus operandi that permeates all parts of an organisation and is fundamental in the long term sustainability of an M4D service
Segmentation and personas are key: M4D service providers must define target end user segments and develop personas that clearly define the gaps and opportunities that could be met by a given service
Act early: these should be defined as part of the service planning, which means an upfront cost and time resource. While there are encouraging examples of organisations redefining a service and its marketing message after launch (e.g. Tigo Money in Paraguay), this can be even more costly and time consuming
Cost and communication are key barriers: high up-front costs and the fact many M4D organisations have partnerships where each party has a different background and set of objectives create barriers to effective implementation of user-centric innovation
These are surmountable: clear communication between stakeholders of a given service and a demonstrable link between investment in key tools (e.g. user research, segmentation and personas, and user feedback) and scale will drive acceptance and wider implementation of the user-centric concept
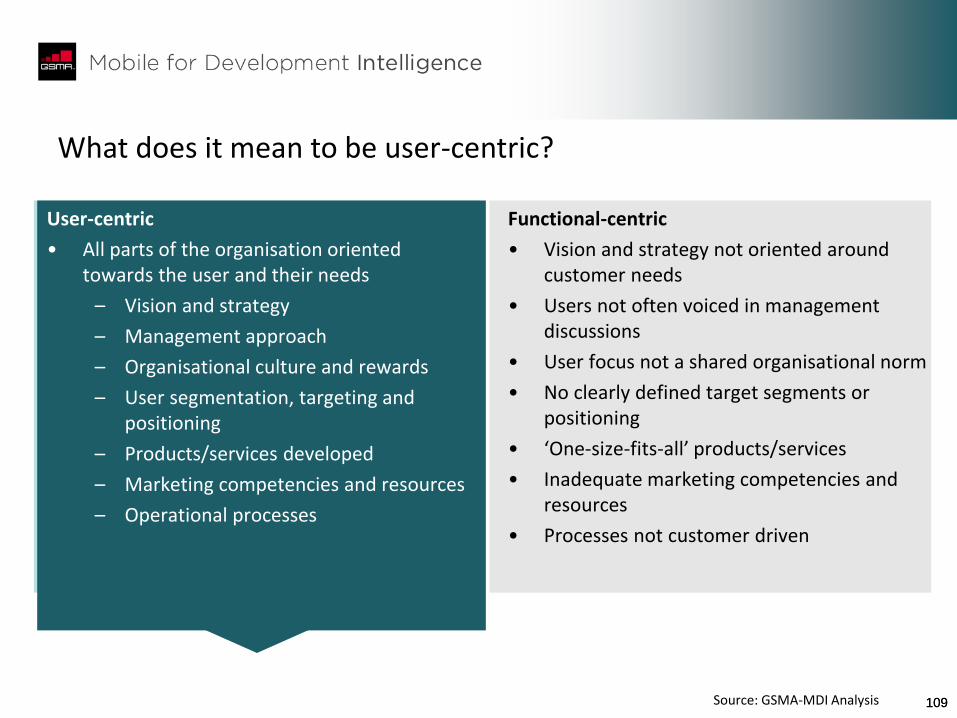
109 109
What does it mean to be user-centric?
User-centric
• All parts of the organisation oriented towards the user and their needs
– Vision and strategy
– Management approach
– Organisational culture and rewards
– User segmentation, targeting and positioning
– Products/services developed
– Marketing competencies and resources
– Operational processes
Functional-centric
• Vision and strategy not oriented around customer needs
• Users not often voiced in management discussions
• User focus not a shared organisational norm
• No clearly defined target segments or positioning
• ‘One-size-fits-all’ products/services
• Inadequate marketing competencies and resources
• Processes not customer driven
Source: GSMA-MDI Analysis
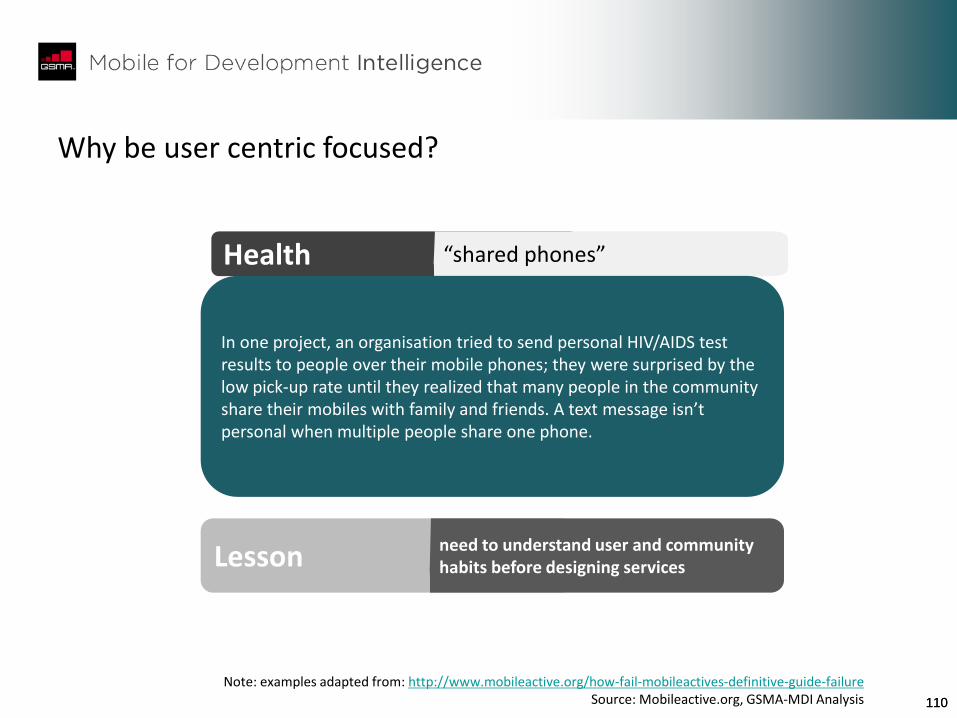
110 110
Why be user centric focused?
Health “shared phones”
In one project, an organisation tried to send personal HIV/AIDS test results to people over their mobile phones; they were surprised by the low pick-up rate until they realized that many people in the community share their mobiles with family and friends. A text message isn’t personal when multiple people share one phone.
Lesson need to understand user and community habits before designing services
Note: examples adapted from: http://www.mobileactive.org/how-fail-mobileactives-definitive-guide-failure Source: Mobileactive.org, GSMA-MDI Analysis

111 111
MNO perspective: the customer journey (mobile money)
Unaware
Customer has never heard of mobile money
Customer has heard of mobile money and knows what it does
Awareness
Customer understands how mobile money could be useful to them
Understanding
Customer knows the steps necessary to transact
Knowledge
Customer tries the service
Trial
Customer habitually uses the mobile money service
Regular Use
• The process of converting a customer who had never heard of mobile
money to one that habitually uses the service
• In theory this is the way it works, but where can practical barriers spring up?
Note: adapted from “Marketing Mobile Money: Top 3 Challenges” - Yasmina McCarty, June 2012 Source: GSMA Mobile Money program, GSMA-MDI Analysis
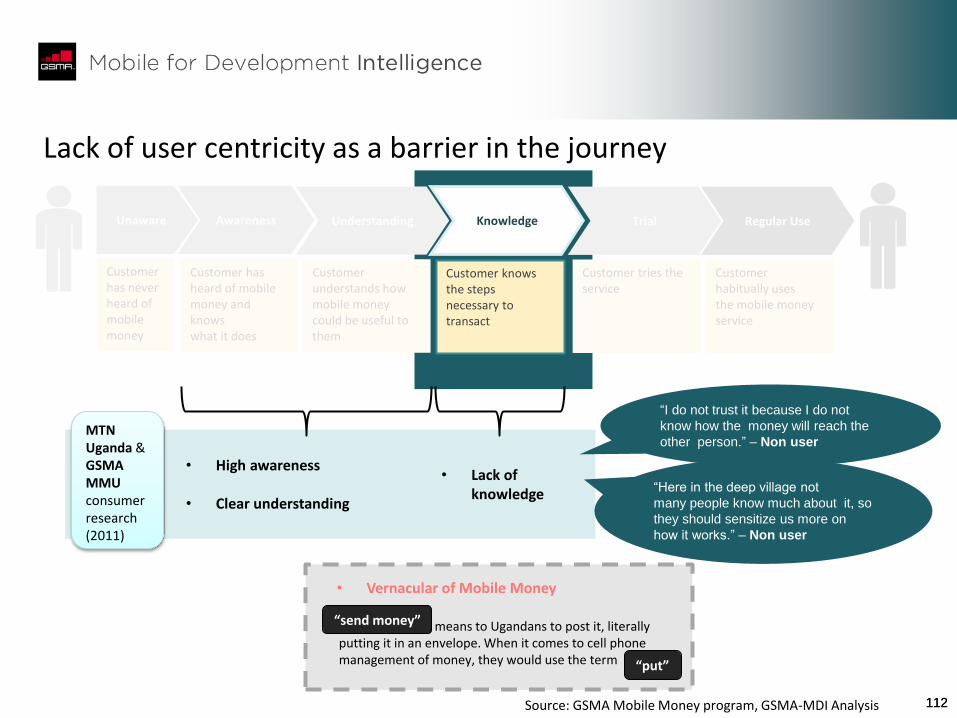
112 112
Lack of user centricity as a barrier in the journey
“I do not trust it because I do not
know how the money will reach the
other person.” – Non user
“Here in the deep village not
many people know much about it, so
they should sensitize us more on
how it works.” – Non user
Unaware
Customer has never heard of mobile money
Customer has heard of mobile money and knows what it does
Awareness
Customer understands how mobile money could be useful to them
Understanding
Customer knows the steps necessary to transact
Knowledge
Customer tries the service
Trial
Customer habitually uses the mobile money service
Regular Use
• High awareness
• Clear understanding
• Lack of knowledge
MTN Uganda & GSMA MMU consumer research (2011)
means to Ugandans to post it, literally putting it in an envelope. When it comes to cell phone management of money, they would use the term “put”
“send money”
• Vernacular of Mobile Money
Source: GSMA Mobile Money program, GSMA-MDI Analysis
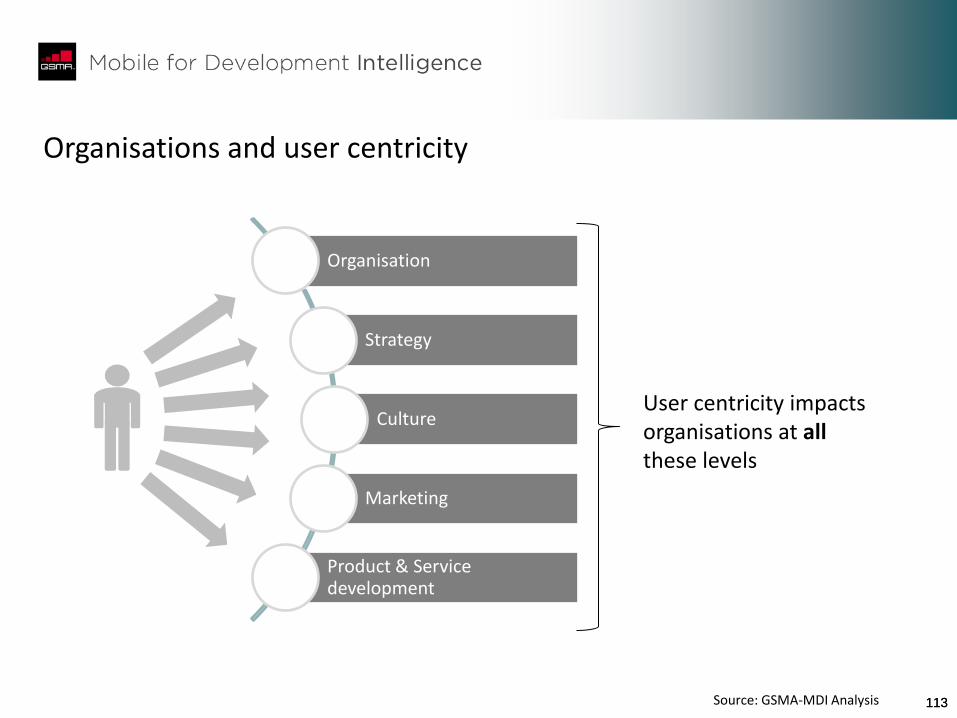
113 113
Organisations and user centricity
Organisation
Strategy
Culture
Marketing
Product & Service development
User centricity impacts organisations at all these levels
Source: GSMA-MDI Analysis
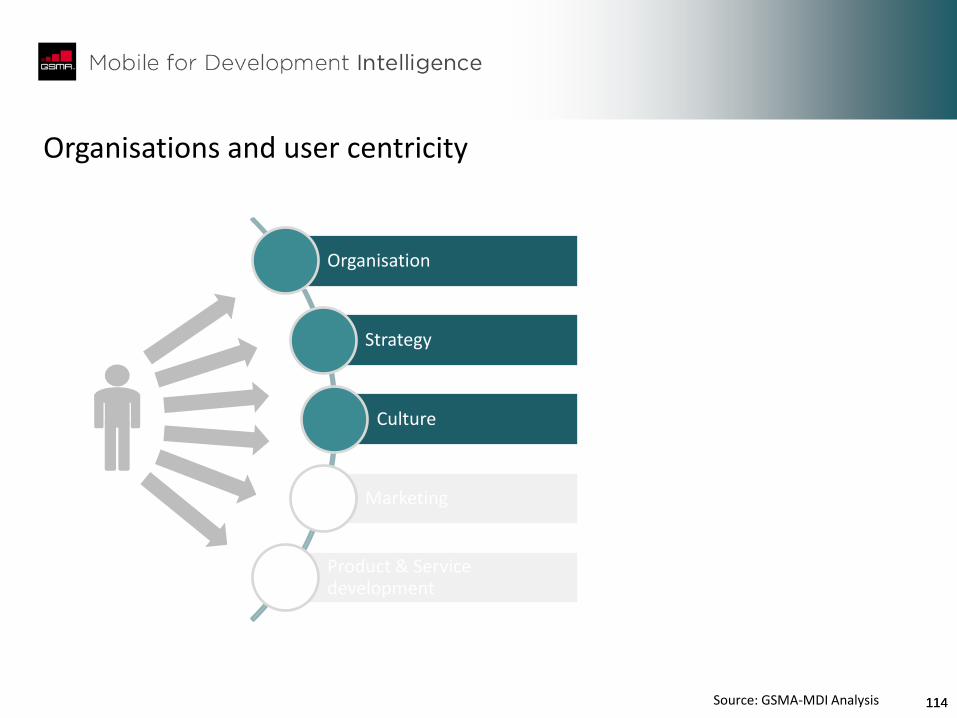
114 114
Organisations and user centricity
Organisation
Strategy
Culture
Marketing
Product & Service development
Source: GSMA-MDI Analysis
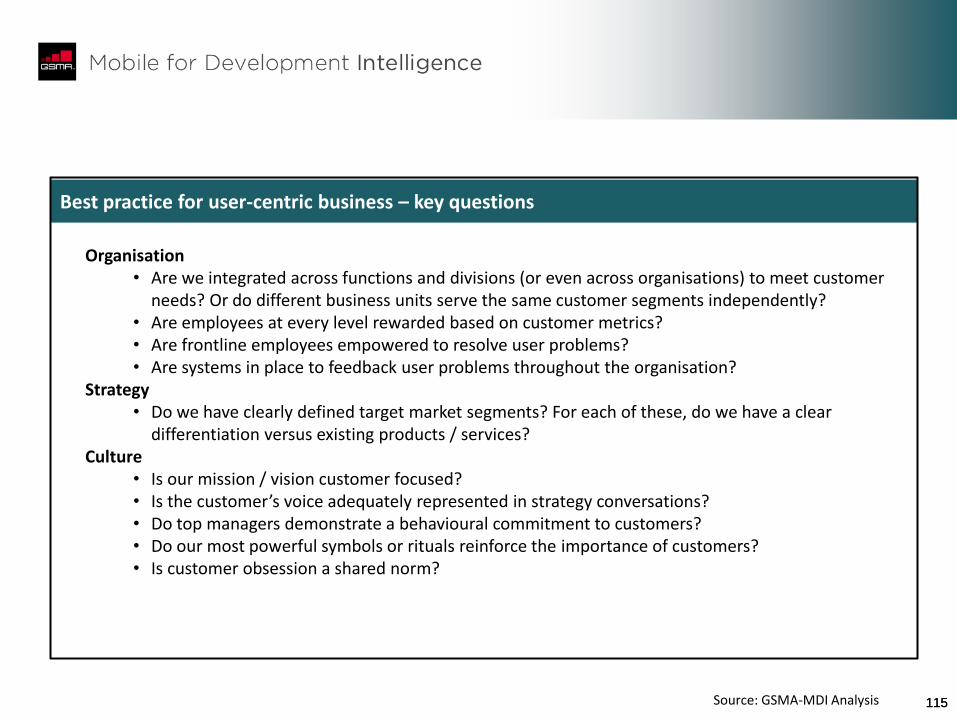
115 115
Best practice for user-centric business – key questions
Organisation • Are we integrated across functions and divisions (or even across organisations) to meet customer
needs? Or do different business units serve the same customer segments independently? • Are employees at every level rewarded based on customer metrics? • Are frontline employees empowered to resolve user problems? • Are systems in place to feedback user problems throughout the organisation?
Strategy • Do we have clearly defined target market segments? For each of these, do we have a clear
differentiation versus existing products / services? Culture
• Is our mission / vision customer focused? • Is the customer’s voice adequately represented in strategy conversations? • Do top managers demonstrate a behavioural commitment to customers? • Do our most powerful symbols or rituals reinforce the importance of customers? • Is customer obsession a shared norm?
Source: GSMA-MDI Analysis
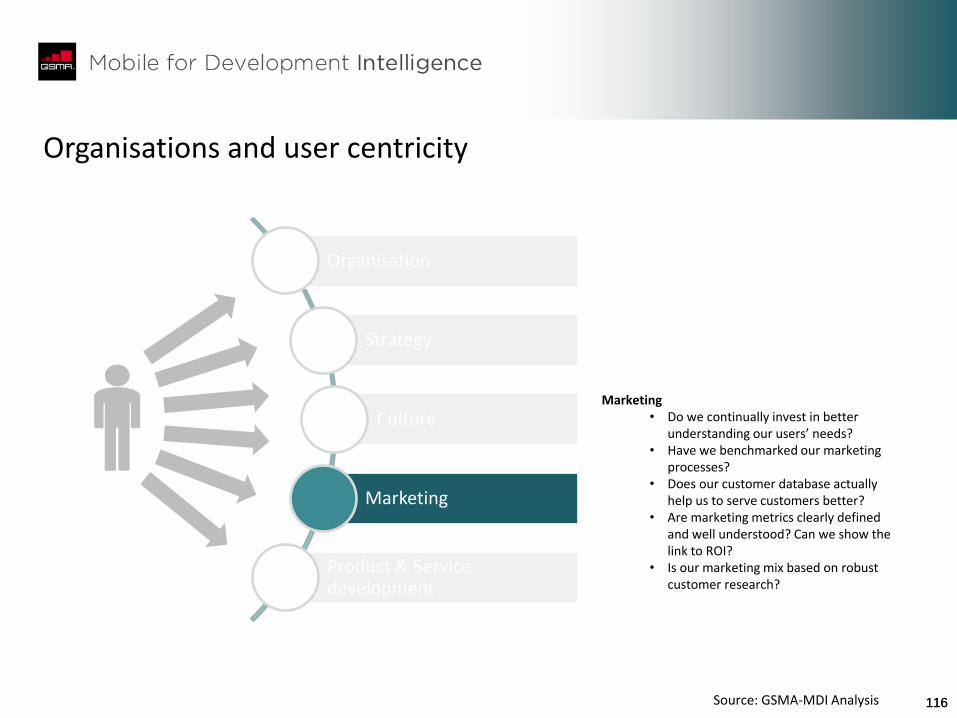
116 116
Organisations and user centricity
Organisation
Strategy
Culture
Marketing
Product & Service development
Marketing • Do we continually invest in better
understanding our users’ needs? • Have we benchmarked our marketing
processes? • Does our customer database actually
help us to serve customers better? • Are marketing metrics clearly defined
and well understood? Can we show the link to ROI?
• Is our marketing mix based on robust customer research?
Source: GSMA-MDI Analysis
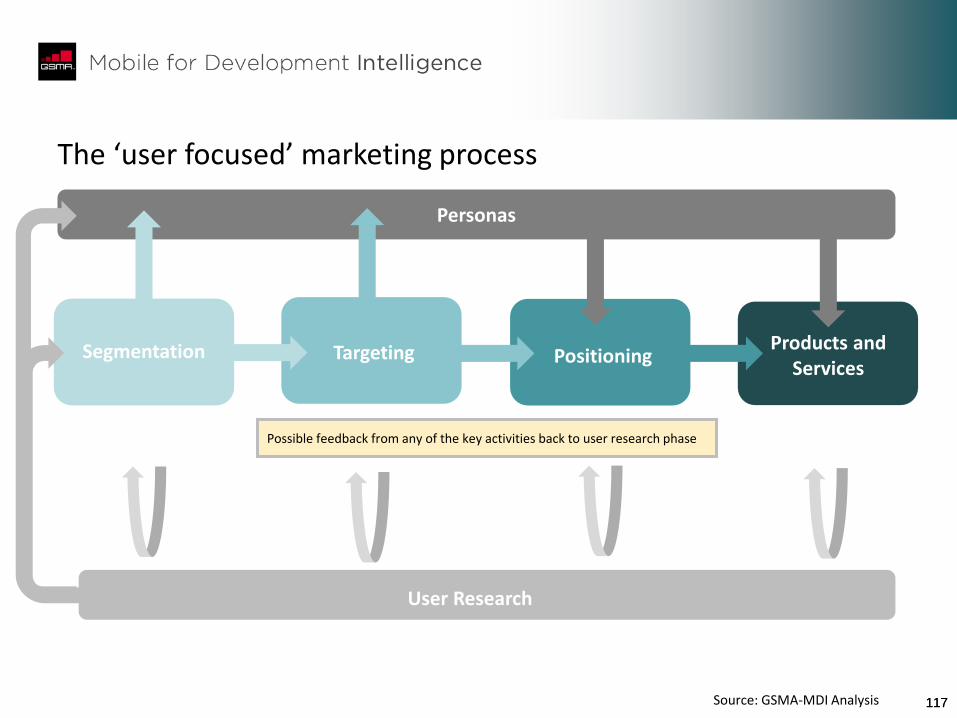
117 117
Personas
Segmentation Products and Services
Positioning Targeting
The ‘user focused’ marketing process
User Research
Possible feedback from any of the key activities back to user research phase
Source: GSMA-MDI Analysis
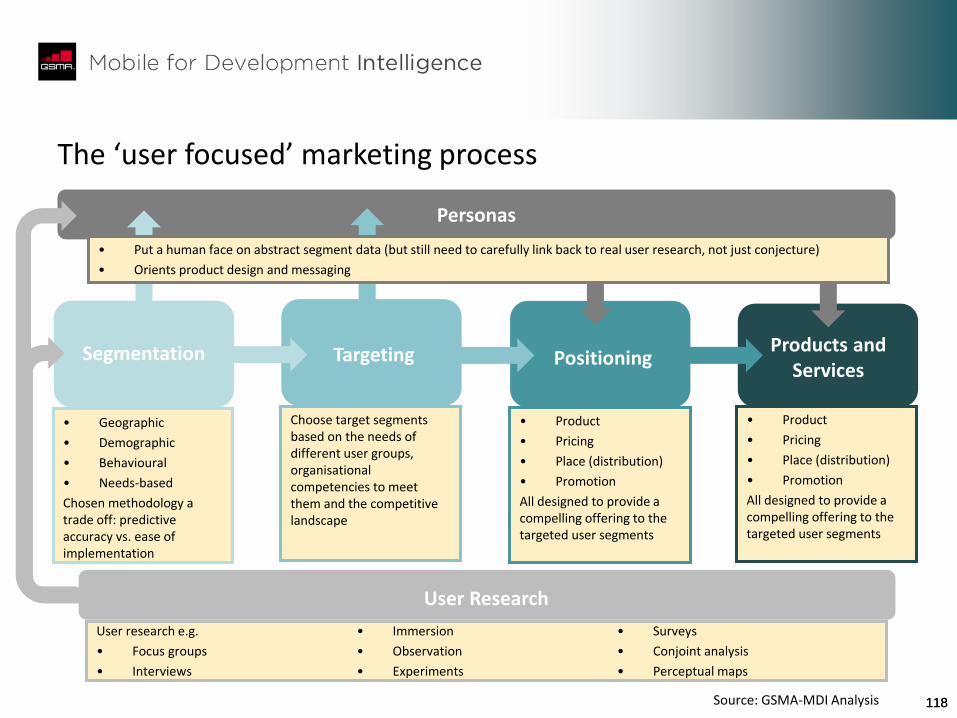
118 118
Personas
Segmentation
User research e.g.
• Focus groups
• Interviews
• Immersion
• Observation
• Experiments
• Surveys
• Conjoint analysis
• Perceptual maps
• Geographic
• Demographic
• Behavioural
• Needs-based
Chosen methodology a trade off: predictive accuracy vs. ease of implementation
Choose target segments based on the needs of different user groups, organisational competencies to meet them and the competitive landscape
• Product
• Pricing
• Place (distribution)
• Promotion
All designed to provide a compelling offering to the targeted user segments
Products and Services
Positioning Targeting
• Product
• Pricing
• Place (distribution)
• Promotion
All designed to provide a compelling offering to the targeted user segments
User Research
The ‘user focused’ marketing process
• Put a human face on abstract segment data (but still need to carefully link back to real user research, not just conjecture)
• Orients product design and messaging
Source: GSMA-MDI Analysis
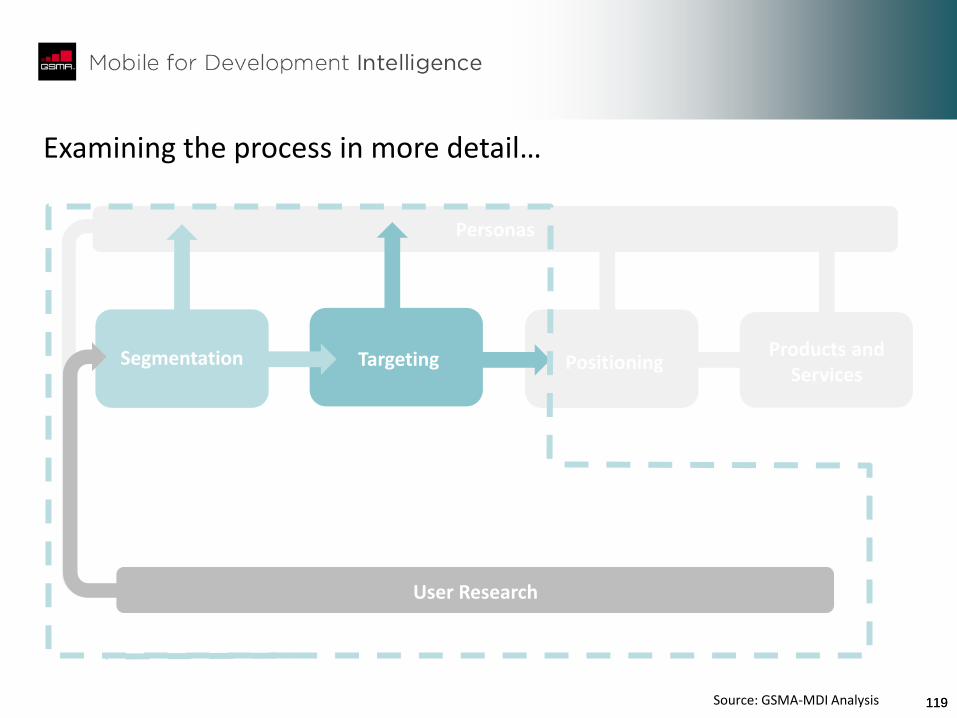
119 119
Personas
Segmentation Products and Services
Positioning Targeting
User Research
Examining the process in more detail…
Source: GSMA-MDI Analysis
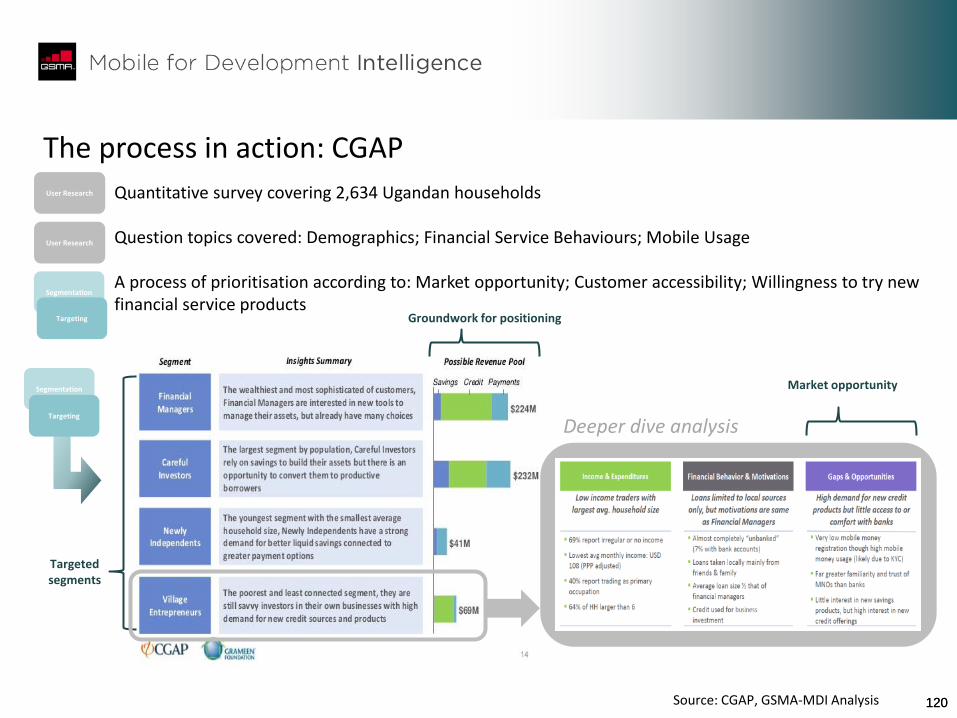
120 120
The process in action: CGAP
• Quantitative survey covering 2,634 Ugandan households • Question topics covered: Demographics; Financial Service Behaviours; Mobile Usage • A process of prioritisation according to: Market opportunity; Customer accessibility; Willingness to try new
financial service products Segmentation
User Research
User Research
Targeting
Targeted segments
Deeper dive analysis
Segmentation
Targeting
Groundwork for positioning
Market opportunity
Source: CGAP, GSMA-MDI Analysis
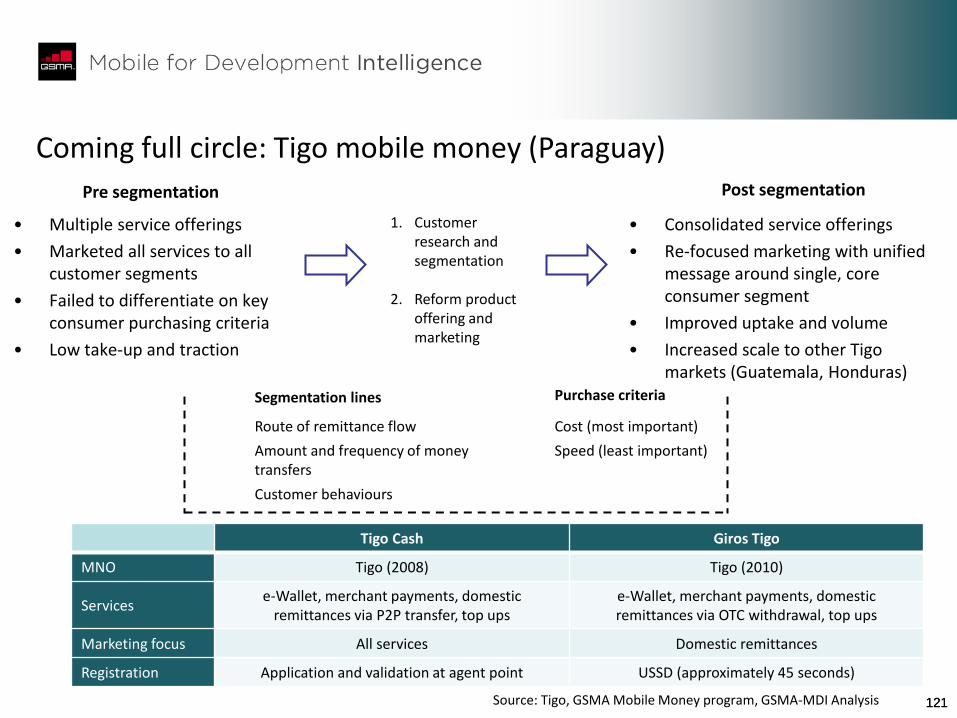
121 121
Coming full circle: Tigo mobile money (Paraguay)
• Multiple service offerings
• Marketed all services to all customer segments
• Failed to differentiate on key consumer purchasing criteria
• Low take-up and traction
• Consolidated service offerings
• Re-focused marketing with unified message around single, core consumer segment
• Improved uptake and volume
• Increased scale to other Tigo markets (Guatemala, Honduras)
Tigo Cash Giros Tigo
MNO Tigo (2008) Tigo (2010)
Services e-Wallet, merchant payments, domestic
remittances via P2P transfer, top ups e-Wallet, merchant payments, domestic remittances via OTC withdrawal, top ups
Marketing focus All services Domestic remittances
Registration Application and validation at agent point USSD (approximately 45 seconds)
1. Customer research and segmentation
2. Reform product offering and marketing
Purchase criteria Segmentation lines
Route of remittance flow
Amount and frequency of money transfers
Customer behaviours
Cost (most important)
Speed (least important)
Pre segmentation Post segmentation
Source: Tigo, GSMA Mobile Money program, GSMA-MDI Analysis
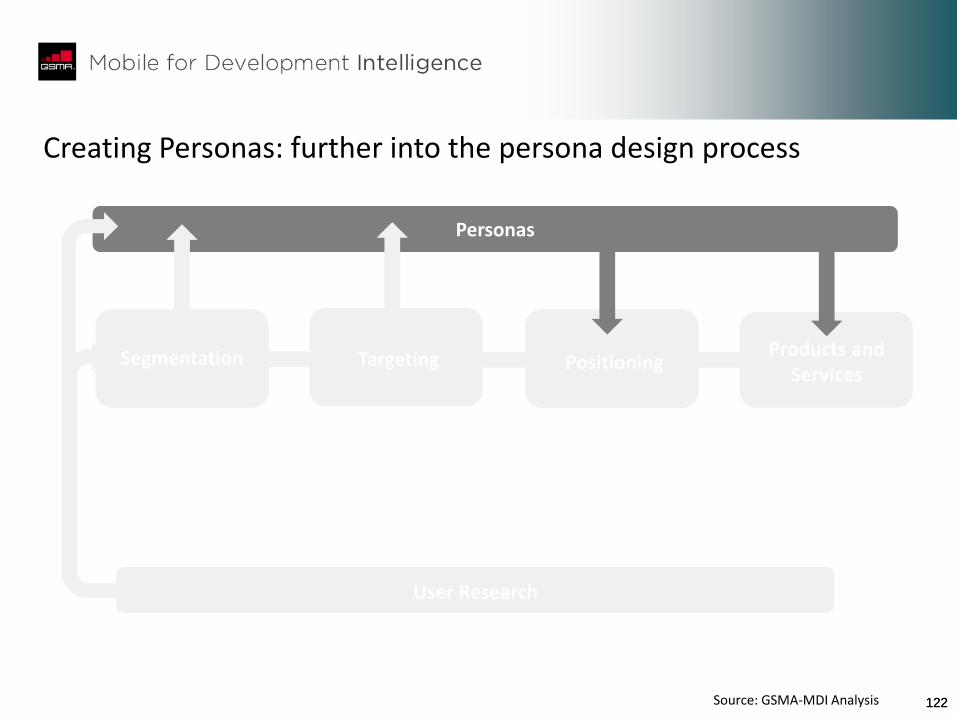
122 122
Personas
Segmentation Products and Services
Positioning Targeting
User Research
Creating Personas: further into the persona design process
Source: GSMA-MDI Analysis
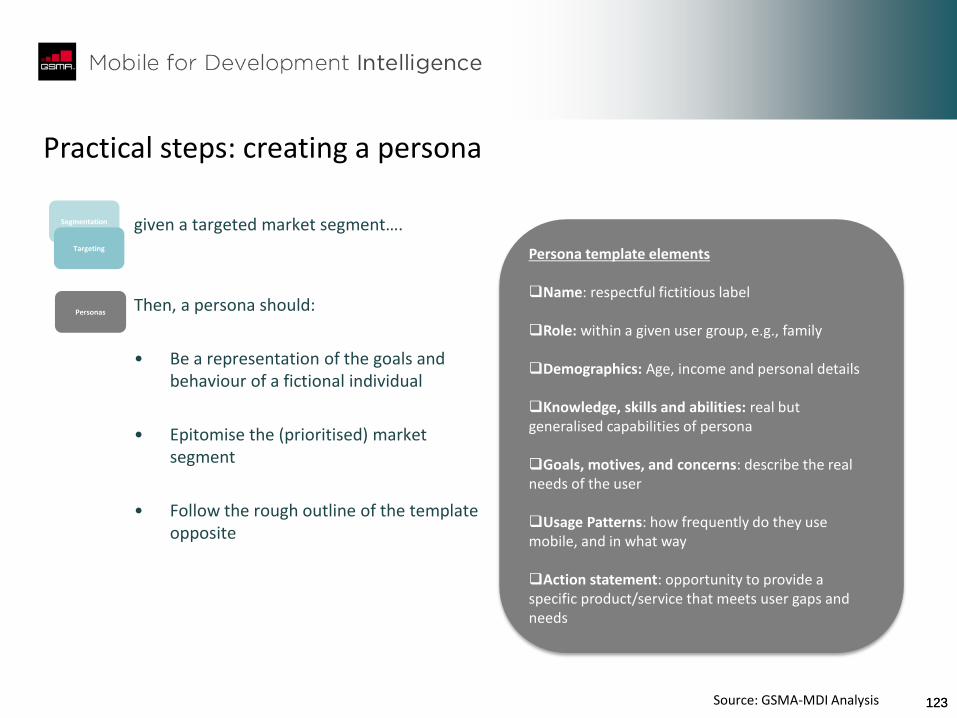
123 123
given a targeted market segment….
Then, a persona should:
• Be a representation of the goals and behaviour of a fictional individual
• Epitomise the (prioritised) market segment
• Follow the rough outline of the template opposite
Practical steps: creating a persona
Persona template elements Name: respectful fictitious label Role: within a given user group, e.g., family Demographics: Age, income and personal details Knowledge, skills and abilities: real but generalised capabilities of persona Goals, motives, and concerns: describe the real needs of the user Usage Patterns: how frequently do they use mobile, and in what way
Action statement: opportunity to provide a specific product/service that meets user gaps and needs
Personas
Segmentation
Targeting
Source: GSMA-MDI Analysis
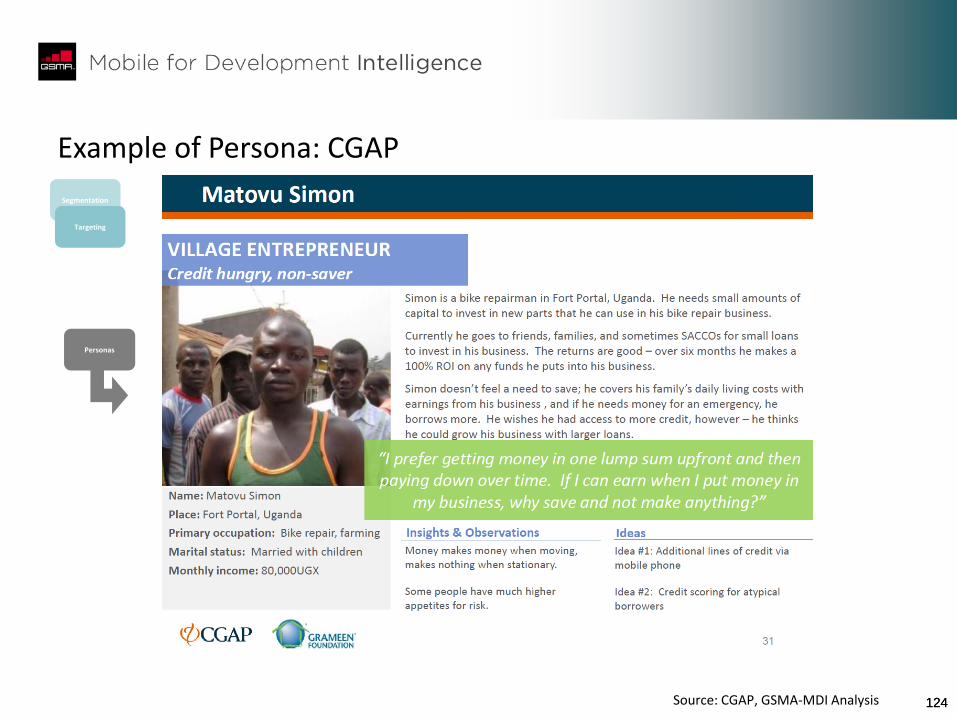
124 124
Example of Persona: CGAP
Personas
Segmentation
Targeting
Source: CGAP, GSMA-MDI Analysis
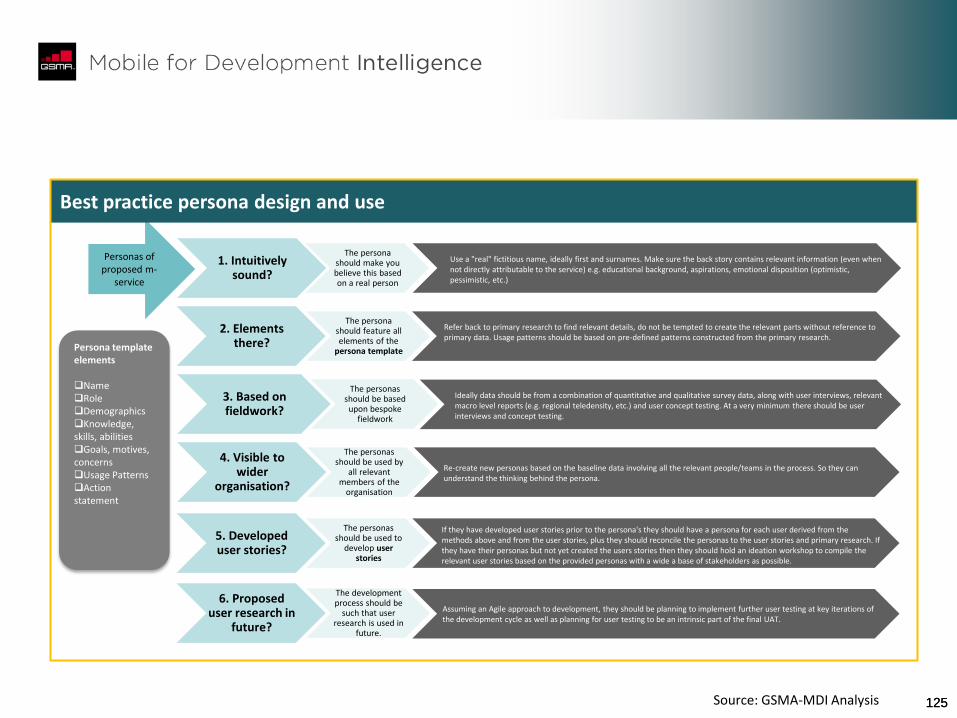
125 125
Personas of proposed m-
service
Best practice persona design and use
Persona template elements Name Role Demographics Knowledge, skills, abilities Goals, motives, concerns Usage Patterns Action statement
1. Intuitively sound?
The persona should make you believe this based on a real person
Use a "real" fictitious name, ideally first and surnames. Make sure the back story contains relevant information (even when not directly attributable to the service) e.g. educational background, aspirations, emotional disposition (optimistic, pessimistic, etc.)
2. Elements there?
The persona should feature all elements of the
persona template
Refer back to primary research to find relevant details, do not be tempted to create the relevant parts without reference to primary data. Usage patterns should be based on pre-defined patterns constructed from the primary research.
3. Based on fieldwork?
The personas should be based upon bespoke
fieldwork
Ideally data should be from a combination of quantitative and qualitative survey data, along with user interviews, relevant macro level reports (e.g. regional teledensity, etc.) and user concept testing. At a very minimum there should be user interviews and concept testing.
4. Visible to wider
organisation?
The personas should be used by
all relevant members of the
organisation
Re-create new personas based on the baseline data involving all the relevant people/teams in the process. So they can understand the thinking behind the persona.
5. Developed user stories?
The personas should be used to
develop user stories
If they have developed user stories prior to the persona's they should have a persona for each user derived from the methods above and from the user stories, plus they should reconcile the personas to the user stories and primary research. If they have their personas but not yet created the users stories then they should hold an ideation workshop to compile the relevant user stories based on the provided personas with a wide a base of stakeholders as possible.
6. Proposed user research in
future?
The development process should be
such that user research is used in
future.
Assuming an Agile approach to development, they should be planning to implement further user testing at key iterations of the development cycle as well as planning for user testing to be an intrinsic part of the final UAT.
Source: GSMA-MDI Analysis
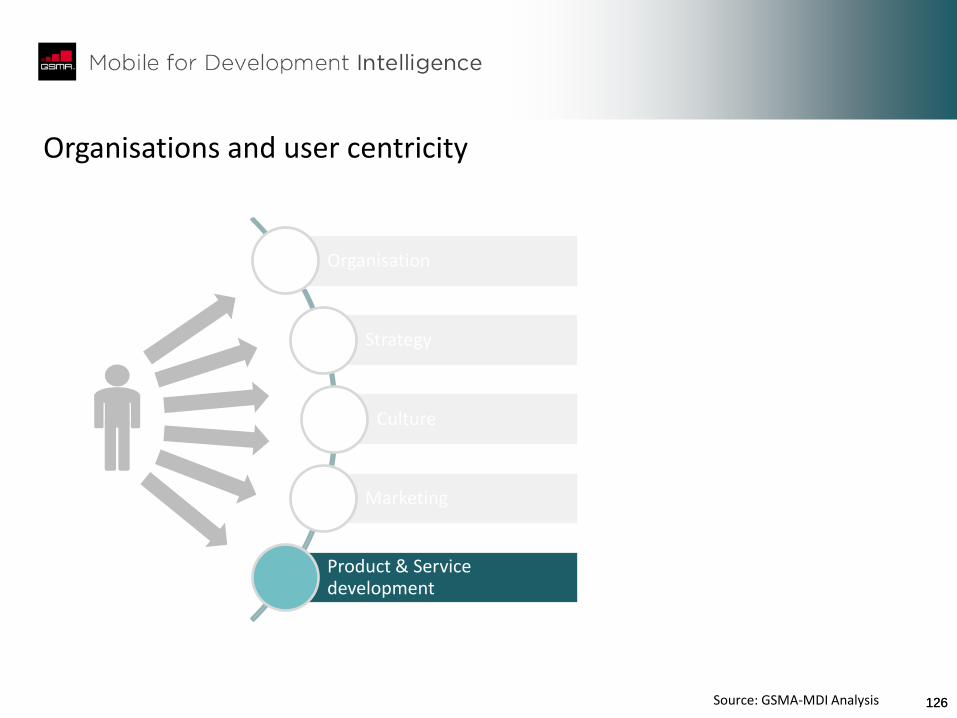
126 126
Organisations and user centricity
Organisation
Strategy
Culture
Marketing
Product & Service development
Source: GSMA-MDI Analysis
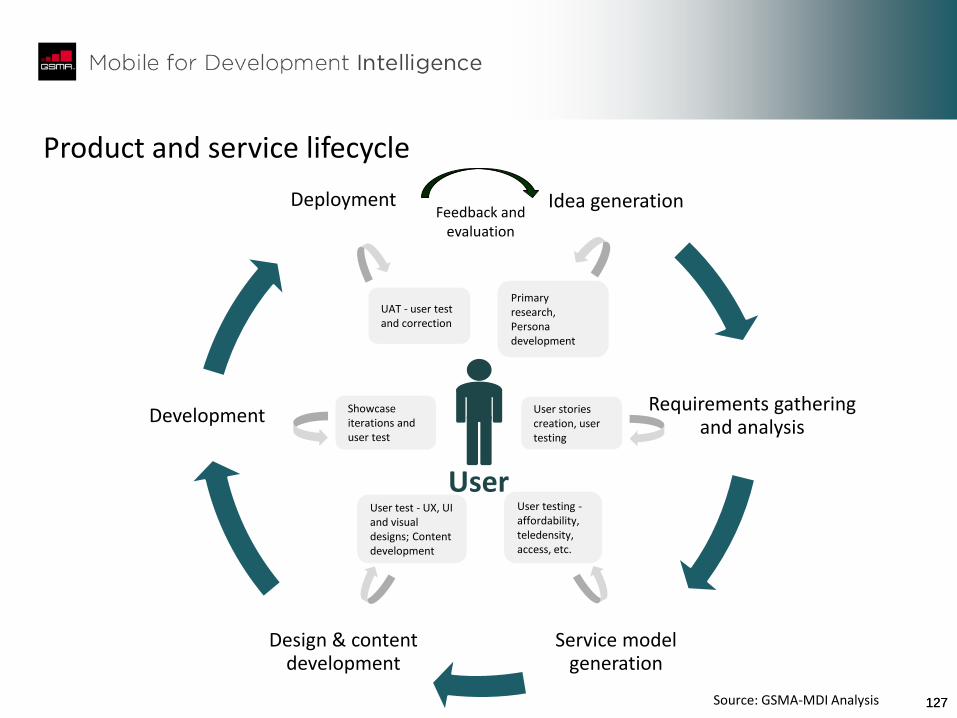
127 127
Product and service lifecycle
Idea generation
Requirements gathering and analysis
Service model generation
Design & content development
Development
Deployment Feedback and
evaluation
User
Primary research, Persona development
User stories creation, user testing
User testing - affordability, teledensity, access, etc.
User test - UX, UI and visual designs; Content development
Showcase iterations and user test
UAT - user test and correction
Source: GSMA-MDI Analysis
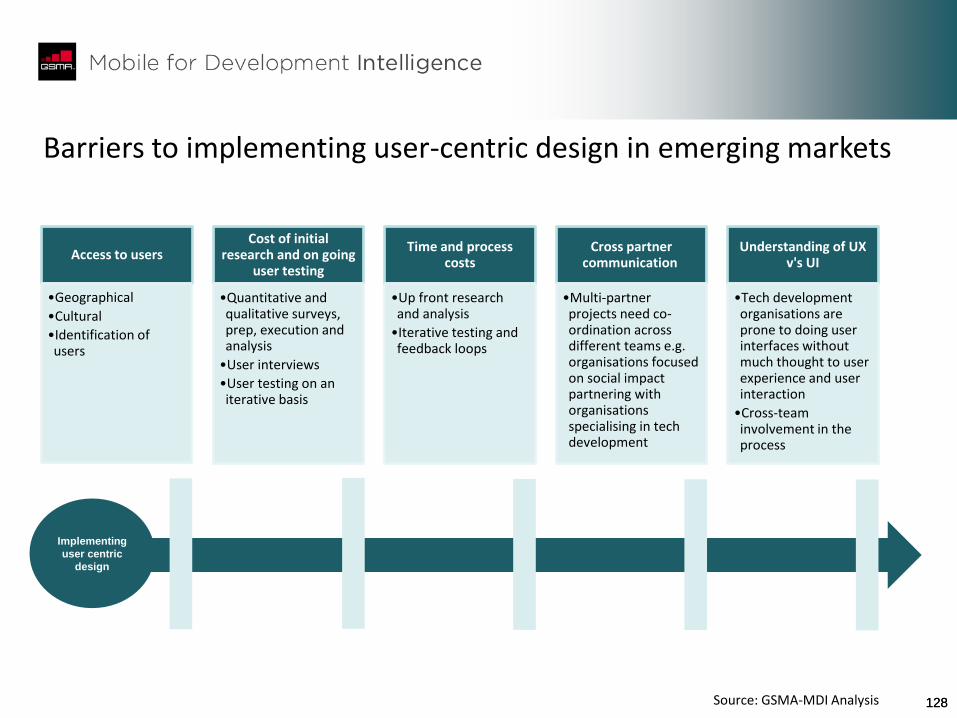
128 128
Barriers to implementing user-centric design in emerging markets
Access to users
•Geographical
•Cultural
•Identification of users
Cost of initial research and on going
user testing
•Quantitative and qualitative surveys, prep, execution and analysis
•User interviews
•User testing on an iterative basis
Time and process costs
•Up front research and analysis
•Iterative testing and feedback loops
Cross partner communication
•Multi-partner projects need co-ordination across different teams e.g. organisations focused on social impact partnering with organisations specialising in tech development
Understanding of UX v's UI
•Tech development organisations are prone to doing user interfaces without much thought to user experience and user interaction
•Cross-team involvement in the process
Implementing
user centric
design
Source: GSMA-MDI Analysis
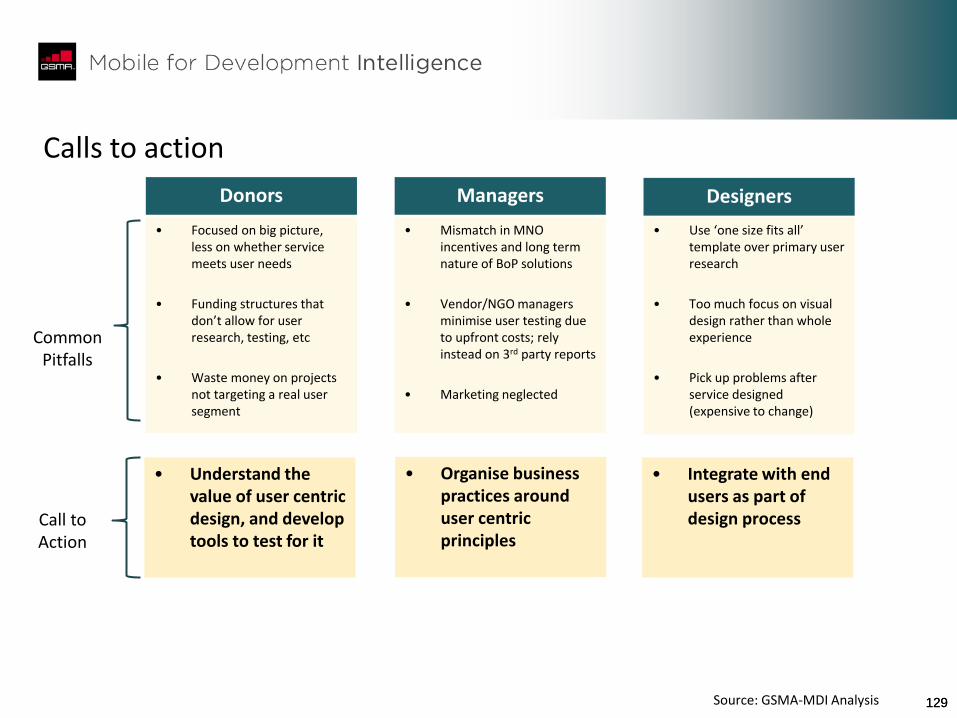
129 129
Calls to action
Donors
• Focused on big picture, less on whether service meets user needs
• Funding structures that don’t allow for user research, testing, etc
• Waste money on projects not targeting a real user segment
Managers
Designers
• Mismatch in MNO incentives and long term nature of BoP solutions
• Vendor/NGO managers minimise user testing due to upfront costs; rely instead on 3rd party reports
• Marketing neglected
• Use ‘one size fits all’ template over primary user research
• Too much focus on visual design rather than whole experience
• Pick up problems after service designed (expensive to change)
Common Pitfalls
• Understand the value of user centric design, and develop tools to test for it
• Organise business practices around user centric principles
• Integrate with end users as part of design process
Call to Action
Source: GSMA-MDI Analysis
130 130
1. Executive summary
2. Key takeaways: a stakeholder guide
3. Market landscape: current and outlook
4. Impact of mobile on development sectors
5. Platforms, multiplicity and the drive for scale
6. User-centric innovation
7. Role of government
8. Appendix
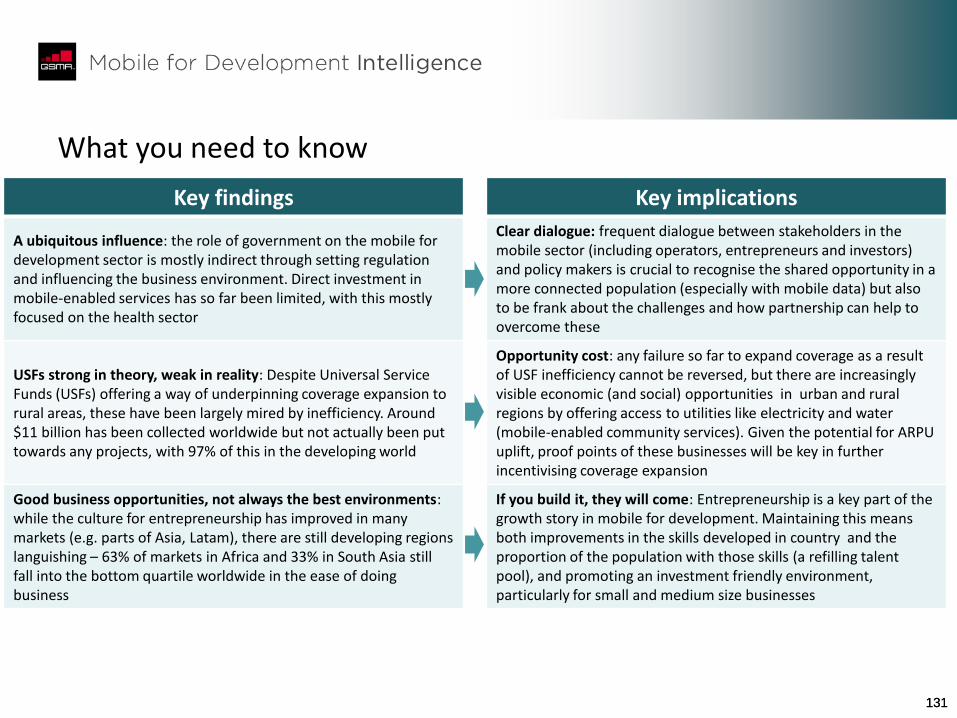
131 131
What you need to know
Key findings Key implications
A ubiquitous influence: the role of government on the mobile for development sector is mostly indirect through setting regulation and influencing the business environment. Direct investment in mobile-enabled services has so far been limited, with this mostly focused on the health sector
Clear dialogue: frequent dialogue between stakeholders in the mobile sector (including operators, entrepreneurs and investors) and policy makers is crucial to recognise the shared opportunity in a more connected population (especially with mobile data) but also to be frank about the challenges and how partnership can help to overcome these
USFs strong in theory, weak in reality: Despite Universal Service Funds (USFs) offering a way of underpinning coverage expansion to rural areas, these have been largely mired by inefficiency. Around $11 billion has been collected worldwide but not actually been put towards any projects, with 97% of this in the developing world
Opportunity cost: any failure so far to expand coverage as a result of USF inefficiency cannot be reversed, but there are increasingly visible economic (and social) opportunities in urban and rural regions by offering access to utilities like electricity and water (mobile-enabled community services). Given the potential for ARPU uplift, proof points of these businesses will be key in further incentivising coverage expansion
Good business opportunities, not always the best environments: while the culture for entrepreneurship has improved in many markets (e.g. parts of Asia, Latam), there are still developing regions languishing – 63% of markets in Africa and 33% in South Asia still fall into the bottom quartile worldwide in the ease of doing business
If you build it, they will come: Entrepreneurship is a key part of the growth story in mobile for development. Maintaining this means both improvements in the skills developed in country and the proportion of the population with those skills (a refilling talent pool), and promoting an investment friendly environment, particularly for small and medium size businesses
132 132
• Governments are a somewhat unique stakeholder – they control vast amounts of resources, but often act ‘behind the scenes’, as such playing more of an influencer as opposed to direct actor role in M4D
• This influence is broadly separated into two areas
– Regulatory environment (excluding direct regulation on pricing)
• Ease of doing business
• Promoting network coverage (via USFs)
• SIM registration
– Investment
• Direct (or through partnerships)
• Promoting a business-friendly investment environment
What is the role of government in M4D?
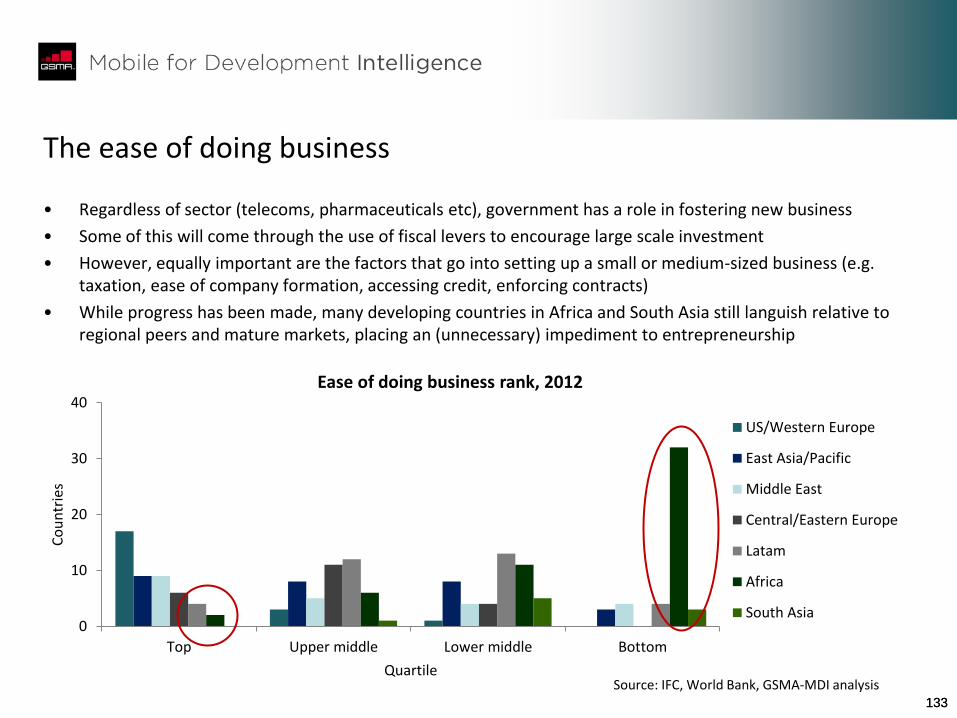
133 133
The ease of doing business
• Regardless of sector (telecoms, pharmaceuticals etc), government has a role in fostering new business
• Some of this will come through the use of fiscal levers to encourage large scale investment
• However, equally important are the factors that go into setting up a small or medium-sized business (e.g. taxation, ease of company formation, accessing credit, enforcing contracts)
• While progress has been made, many developing countries in Africa and South Asia still languish relative to regional peers and mature markets, placing an (unnecessary) impediment to entrepreneurship
0
10
20
30
40
Top Upper middle Lower middle Bottom
Co
un
trie
s
Quartile
Ease of doing business rank, 2012
US/Western Europe
East Asia/Pacific
Middle East
Central/Eastern Europe
Latam
Africa
South Asia
Source: IFC, World Bank, GSMA-MDI analysis
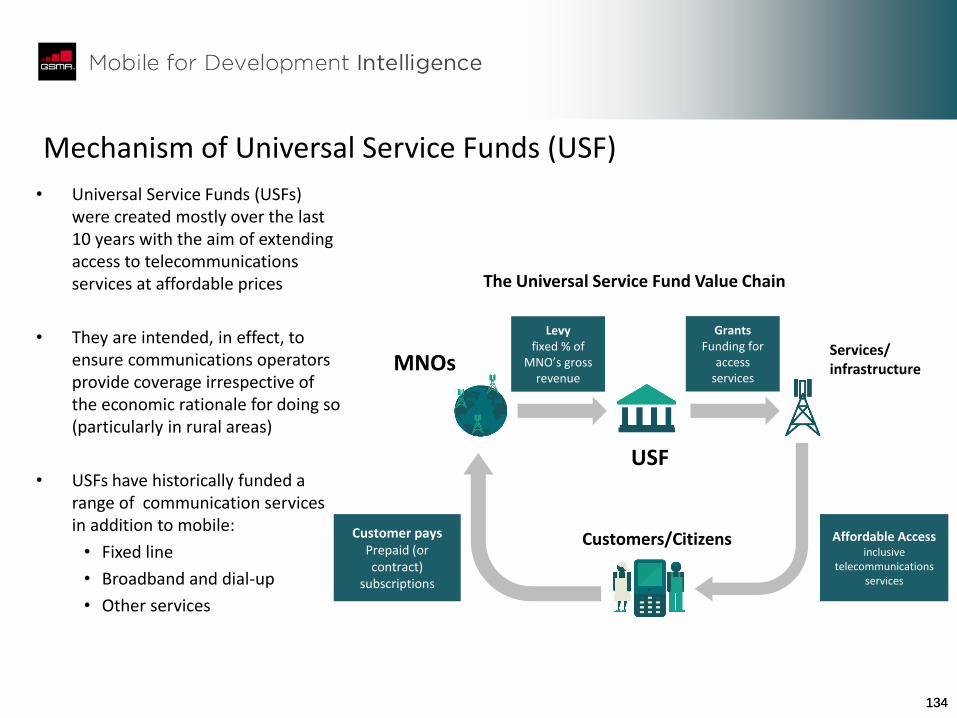
134 134
Mechanism of Universal Service Funds (USF)
Customer pays Prepaid (or contract)
subscriptions
Levy fixed % of
MNO’s gross revenue
Affordable Access inclusive
telecommunications services
USF
Grants Funding for
access services
Customers/Citizens
MNOs Services/ infrastructure
The Universal Service Fund Value Chain
• Universal Service Funds (USFs) were created mostly over the last 10 years with the aim of extending access to telecommunications services at affordable prices
• They are intended, in effect, to ensure communications operators provide coverage irrespective of the economic rationale for doing so (particularly in rural areas)
• USFs have historically funded a range of communication services in addition to mobile:
• Fixed line
• Broadband and dial-up
• Other services
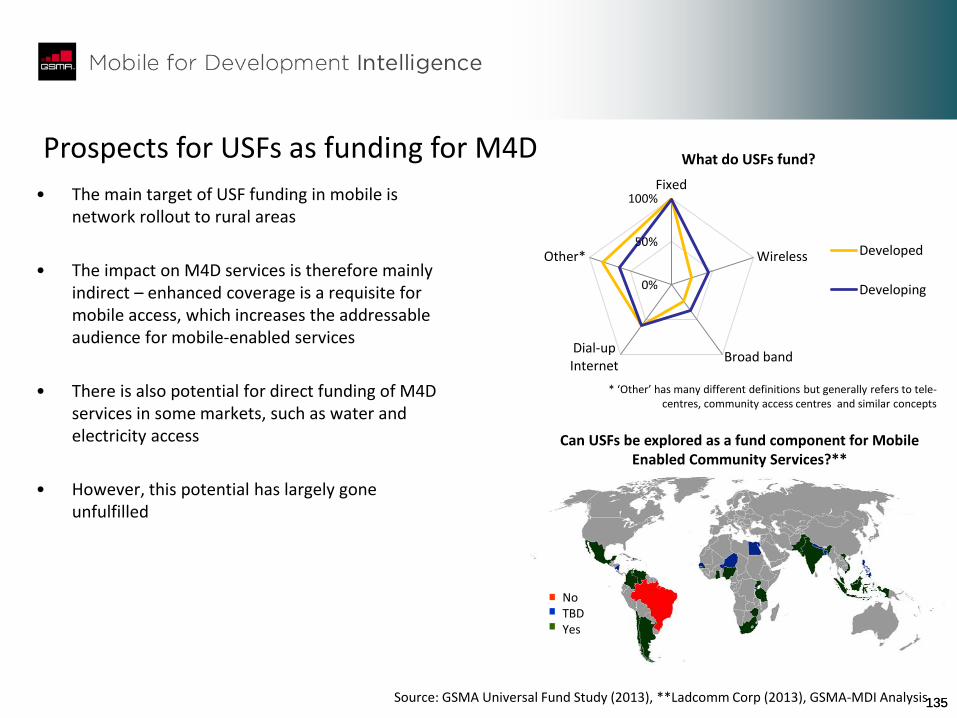
135 135
Can USFs be explored as a fund component for Mobile Enabled Community Services?**
No TBD Yes
Source: GSMA Universal Fund Study (2013), **Ladcomm Corp (2013), GSMA-MDI Analysis
0%
50%
100%Fixed
Wireless
Broad bandDial-upInternet
Other*
What do USFs fund?
Developed
Developing
* ‘Other’ has many different definitions but generally refers to tele-centres, community access centres and similar concepts
• The main target of USF funding in mobile is network rollout to rural areas
• The impact on M4D services is therefore mainly indirect – enhanced coverage is a requisite for mobile access, which increases the addressable audience for mobile-enabled services
• There is also potential for direct funding of M4D services in some markets, such as water and electricity access
• However, this potential has largely gone unfulfilled
Prospects for USFs as funding for M4D
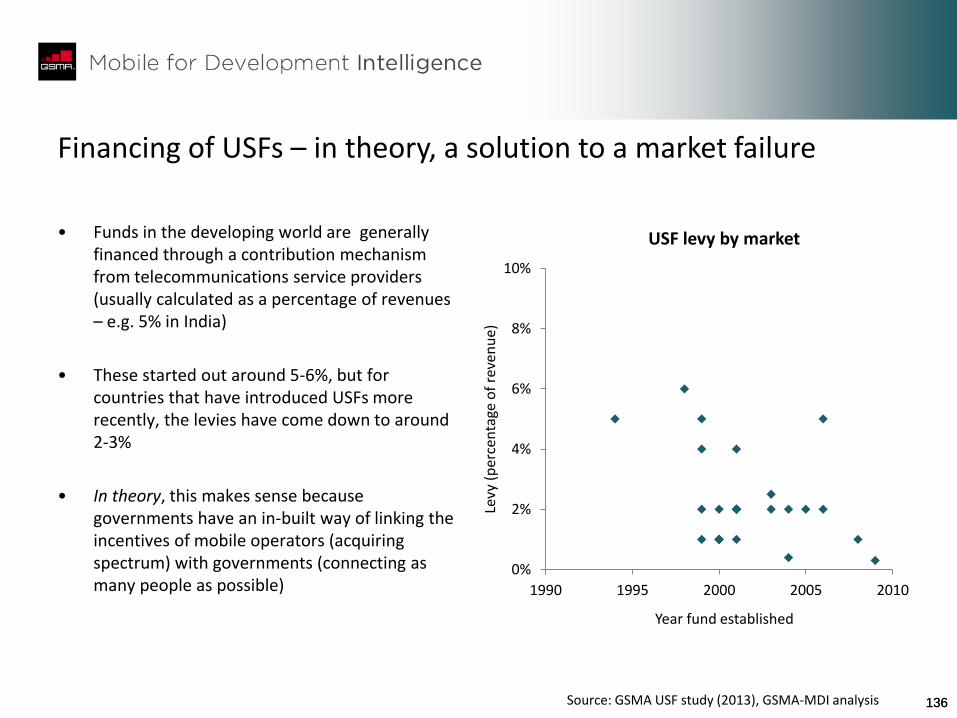
136 136
Financing of USFs – in theory, a solution to a market failure
• Funds in the developing world are generally financed through a contribution mechanism from telecommunications service providers (usually calculated as a percentage of revenues – e.g. 5% in India)
• These started out around 5-6%, but for countries that have introduced USFs more recently, the levies have come down to around 2-3%
• In theory, this makes sense because governments have an in-built way of linking the incentives of mobile operators (acquiring spectrum) with governments (connecting as many people as possible)
0%
2%
4%
6%
8%
10%
1990 1995 2000 2005 2010
Levy
(p
erce
nta
ge o
f re
ven
ue)
Year fund established
USF levy by market
Source: GSMA USF study (2013), GSMA-MDI analysis
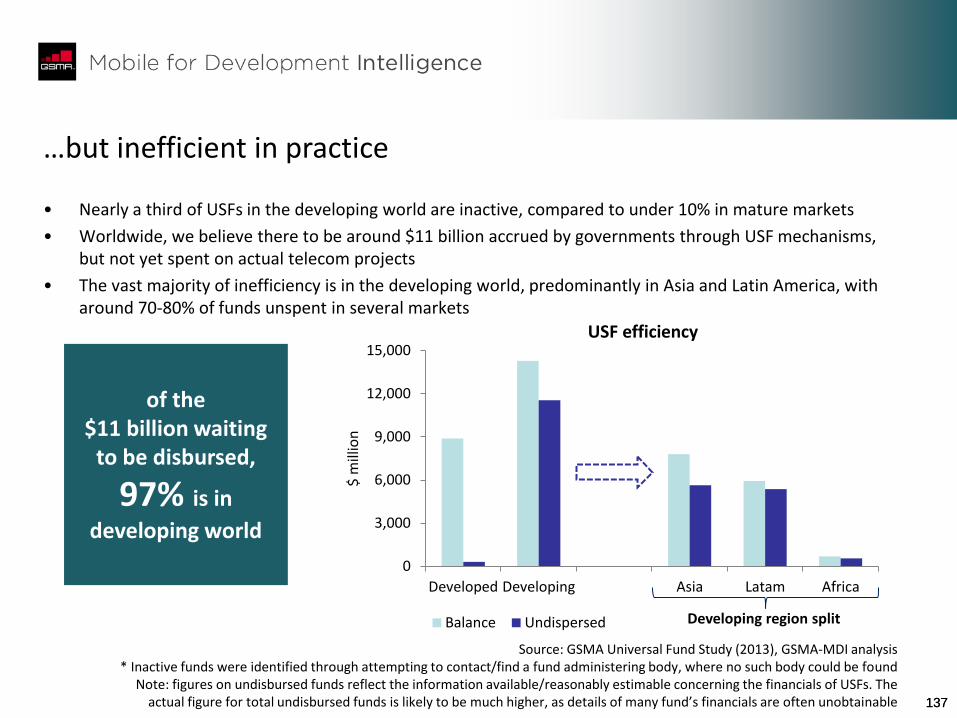
137 137
…but inefficient in practice
• Nearly a third of USFs in the developing world are inactive, compared to under 10% in mature markets
• Worldwide, we believe there to be around $11 billion accrued by governments through USF mechanisms, but not yet spent on actual telecom projects
• The vast majority of inefficiency is in the developing world, predominantly in Asia and Latin America, with around 70-80% of funds unspent in several markets
Source: GSMA Universal Fund Study (2013), GSMA-MDI analysis * Inactive funds were identified through attempting to contact/find a fund administering body, where no such body could be found
Note: figures on undisbursed funds reflect the information available/reasonably estimable concerning the financials of USFs. The actual figure for total undisbursed funds is likely to be much higher, as details of many fund’s financials are often unobtainable
of the $11 billion waiting
to be disbursed,
97% is in
developing world
0
3,000
6,000
9,000
12,000
15,000
Developed Developing Asia Latam Africa
$ m
illio
n
USF efficiency
Balance Undispersed Developing region split
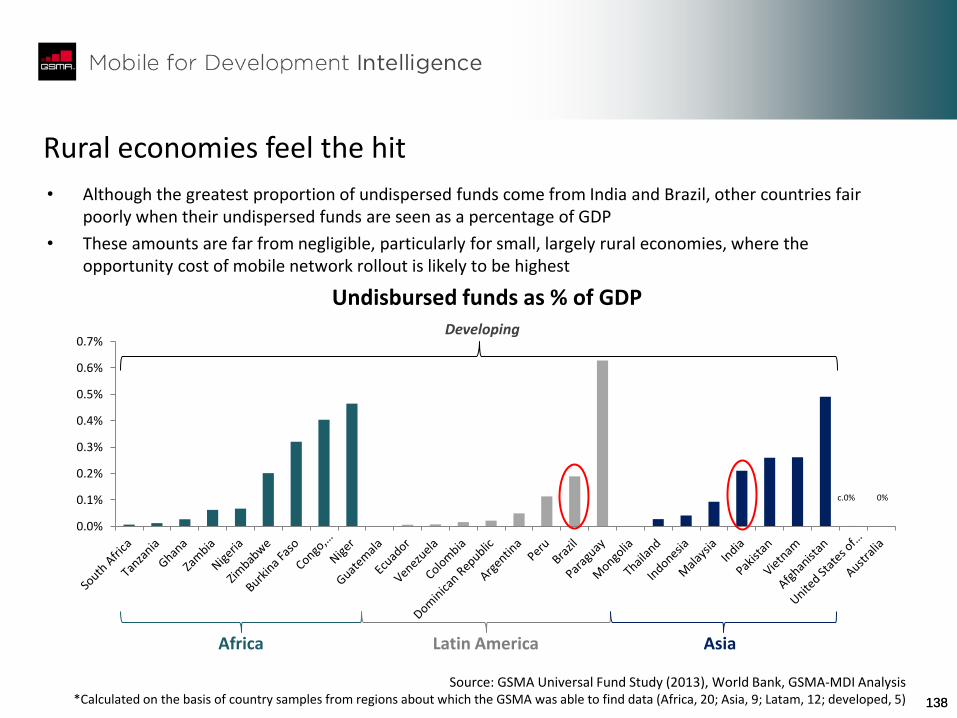
138 138
Rural economies feel the hit
Source: GSMA Universal Fund Study (2013), World Bank, GSMA-MDI Analysis *Calculated on the basis of country samples from regions about which the GSMA was able to find data (Africa, 20; Asia, 9; Latam, 12; developed, 5)
• Although the greatest proportion of undispersed funds come from India and Brazil, other countries fair poorly when their undispersed funds are seen as a percentage of GDP
• These amounts are far from negligible, particularly for small, largely rural economies, where the opportunity cost of mobile network rollout is likely to be highest
0.0%
0.1%
0.2%
0.3%
0.4%
0.5%
0.6%
0.7%
Undisbursed funds as % of GDP
Africa Latin America Asia
Developing
c.0% 0%
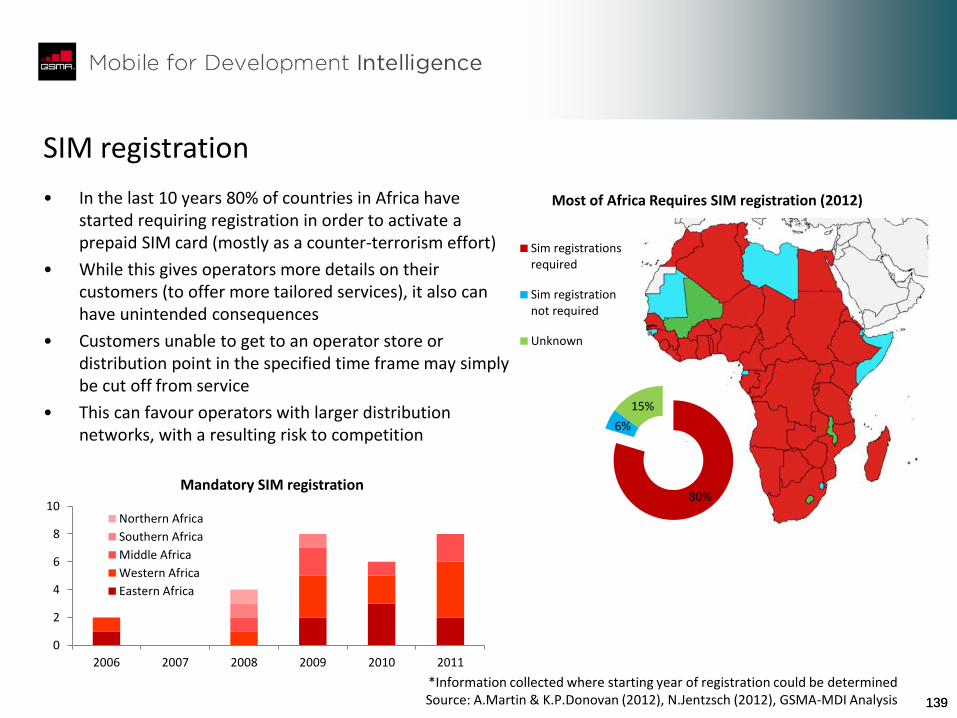
139 139
SIM registration
*Information collected where starting year of registration could be determined Source: A.Martin & K.P.Donovan (2012), N.Jentzsch (2012), GSMA-MDI Analysis
Most of Africa Requires SIM registration (2012)
80%
6%
15%
Sim registrationsrequired
Sim registrationnot required
Unknown
0
2
4
6
8
10
2006 2007 2008 2009 2010 2011
Mandatory SIM registration
Northern Africa
Southern Africa
Middle Africa
Western Africa
Eastern Africa
• In the last 10 years 80% of countries in Africa have started requiring registration in order to activate a prepaid SIM card (mostly as a counter-terrorism effort)
• While this gives operators more details on their customers (to offer more tailored services), it also can have unintended consequences
• Customers unable to get to an operator store or distribution point in the specified time frame may simply be cut off from service
• This can favour operators with larger distribution networks, with a resulting risk to competition
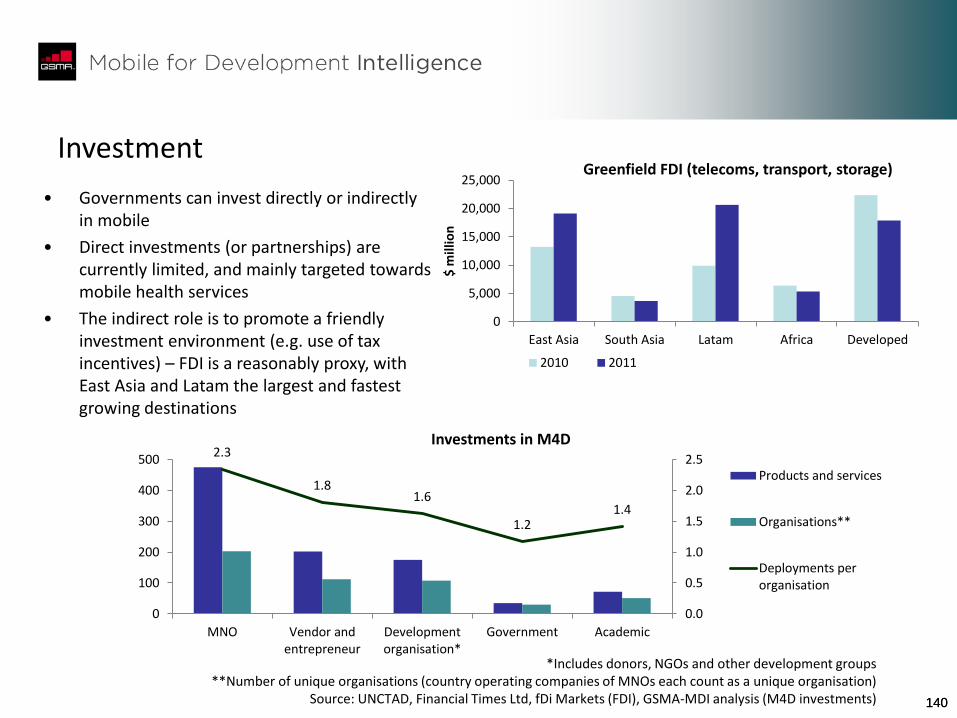
140 140
Investment
2.3
1.8 1.6
1.2 1.4
0.0
0.5
1.0
1.5
2.0
2.5
0
100
200
300
400
500
MNO Vendor andentrepreneur
Developmentorganisation*
Government Academic
Investments in M4D
Products and services
Organisations**
Deployments perorganisation
*Includes donors, NGOs and other development groups **Number of unique organisations (country operating companies of MNOs each count as a unique organisation)
Source: UNCTAD, Financial Times Ltd, fDi Markets (FDI), GSMA-MDI analysis (M4D investments)
0
5,000
10,000
15,000
20,000
25,000
East Asia South Asia Latam Africa Developed
$ m
illio
n
Greenfield FDI (telecoms, transport, storage)
2010 2011
• Governments can invest directly or indirectly in mobile
• Direct investments (or partnerships) are currently limited, and mainly targeted towards mobile health services
• The indirect role is to promote a friendly investment environment (e.g. use of tax incentives) – FDI is a reasonably proxy, with East Asia and Latam the largest and fastest growing destinations

141 141
1. Executive summary
2. Key takeaways: a stakeholder guide
3. Market landscape: current and outlook
4. Impact of mobile on development sectors
5. Platforms, multiplicity and the drive for scale
6. User-centric innovation
7. Role of government
8. Appendix
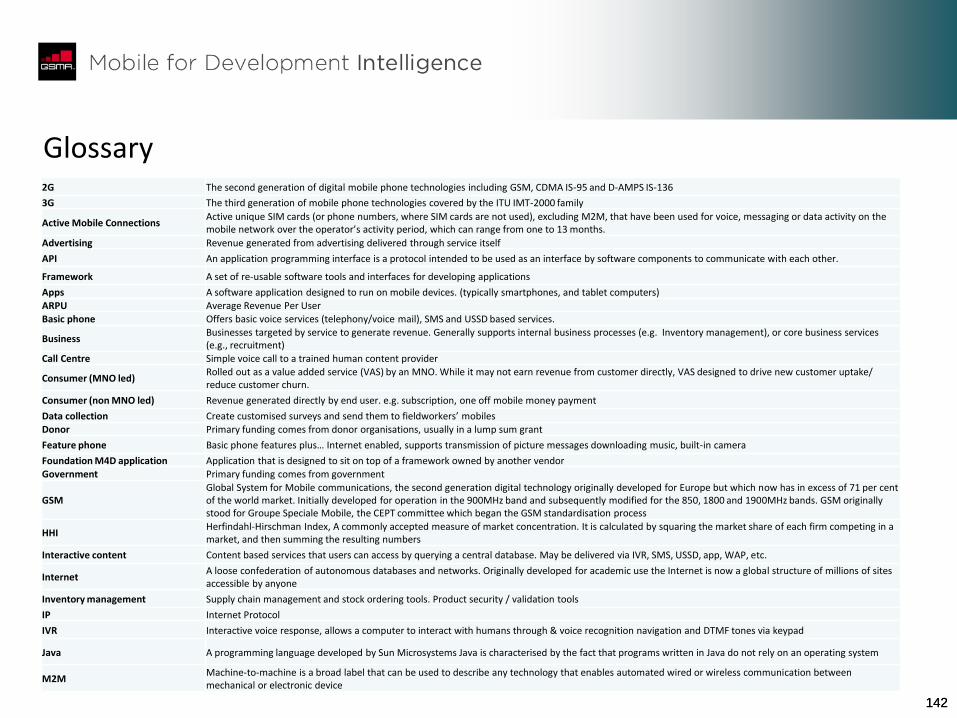
142 142
Glossary 2G The second generation of digital mobile phone technologies including GSM, CDMA IS-95 and D-AMPS IS-136
3G The third generation of mobile phone technologies covered by the ITU IMT-2000 family
Active Mobile Connections Active unique SIM cards (or phone numbers, where SIM cards are not used), excluding M2M, that have been used for voice, messaging or data activity on the mobile network over the operator’s activity period, which can range from one to 13 months.
Advertising Revenue generated from advertising delivered through service itself
API An application programming interface is a protocol intended to be used as an interface by software components to communicate with each other.
Framework A set of re-usable software tools and interfaces for developing applications
Apps A software application designed to run on mobile devices. (typically smartphones, and tablet computers) ARPU Average Revenue Per User Basic phone Offers basic voice services (telephony/voice mail), SMS and USSD based services.
Business Businesses targeted by service to generate revenue. Generally supports internal business processes (e.g. Inventory management), or core business services (e.g., recruitment)
Call Centre Simple voice call to a trained human content provider
Consumer (MNO led) Rolled out as a value added service (VAS) by an MNO. While it may not earn revenue from customer directly, VAS designed to drive new customer uptake/ reduce customer churn.
Consumer (non MNO led) Revenue generated directly by end user. e.g. subscription, one off mobile money payment
Data collection Create customised surveys and send them to fieldworkers’ mobiles Donor Primary funding comes from donor organisations, usually in a lump sum grant
Feature phone Basic phone features plus… Internet enabled, supports transmission of picture messages downloading music, built-in camera
Foundation M4D application Application that is designed to sit on top of a framework owned by another vendor Government Primary funding comes from government
GSM Global System for Mobile communications, the second generation digital technology originally developed for Europe but which now has in excess of 71 per cent of the world market. Initially developed for operation in the 900MHz band and subsequently modified for the 850, 1800 and 1900MHz bands. GSM originally stood for Groupe Speciale Mobile, the CEPT committee which began the GSM standardisation process
HHI Herfindahl-Hirschman Index, A commonly accepted measure of market concentration. It is calculated by squaring the market share of each firm competing in a market, and then summing the resulting numbers
Interactive content Content based services that users can access by querying a central database. May be delivered via IVR, SMS, USSD, app, WAP, etc.
Internet A loose confederation of autonomous databases and networks. Originally developed for academic use the Internet is now a global structure of millions of sites accessible by anyone
Inventory management Supply chain management and stock ordering tools. Product security / validation tools
IP Internet Protocol
IVR Interactive voice response, allows a computer to interact with humans through & voice recognition navigation and DTMF tones via keypad
Java A programming language developed by Sun Microsystems Java is characterised by the fact that programs written in Java do not rely on an operating system
M2M Machine-to-machine is a broad label that can be used to describe any technology that enables automated wired or wireless communication between mechanical or electronic device
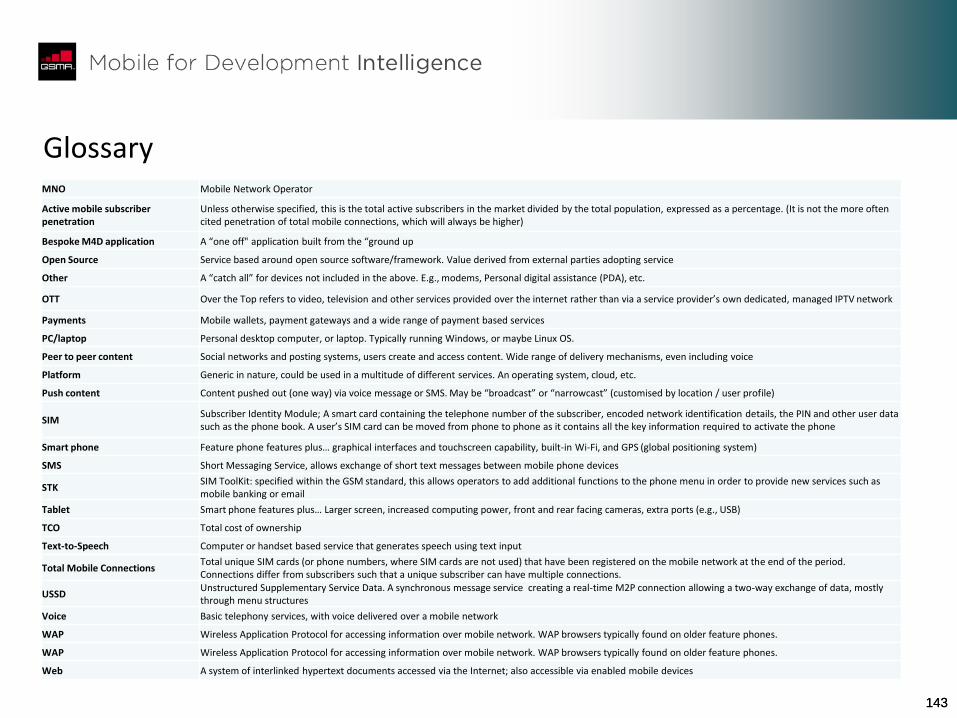
143 143
Glossary MNO Mobile Network Operator
Active mobile subscriber penetration
Unless otherwise specified, this is the total active subscribers in the market divided by the total population, expressed as a percentage. (It is not the more often cited penetration of total mobile connections, which will always be higher)
Bespoke M4D application A “one off" application built from the “ground up
Open Source Service based around open source software/framework. Value derived from external parties adopting service
Other A “catch all” for devices not included in the above. E.g., modems, Personal digital assistance (PDA), etc.
OTT Over the Top refers to video, television and other services provided over the internet rather than via a service provider’s own dedicated, managed IPTV network
Payments Mobile wallets, payment gateways and a wide range of payment based services
PC/laptop Personal desktop computer, or laptop. Typically running Windows, or maybe Linux OS.
Peer to peer content Social networks and posting systems, users create and access content. Wide range of delivery mechanisms, even including voice
Platform Generic in nature, could be used in a multitude of different services. An operating system, cloud, etc.
Push content Content pushed out (one way) via voice message or SMS. May be “broadcast” or “narrowcast” (customised by location / user profile)
SIM Subscriber Identity Module; A smart card containing the telephone number of the subscriber, encoded network identification details, the PIN and other user data such as the phone book. A user’s SIM card can be moved from phone to phone as it contains all the key information required to activate the phone
Smart phone Feature phone features plus… graphical interfaces and touchscreen capability, built-in Wi-Fi, and GPS (global positioning system)
SMS Short Messaging Service, allows exchange of short text messages between mobile phone devices
STK SIM ToolKit: specified within the GSM standard, this allows operators to add additional functions to the phone menu in order to provide new services such as mobile banking or email
Tablet Smart phone features plus… Larger screen, increased computing power, front and rear facing cameras, extra ports (e.g., USB)
TCO Total cost of ownership
Text-to-Speech Computer or handset based service that generates speech using text input
Total Mobile Connections Total unique SIM cards (or phone numbers, where SIM cards are not used) that have been registered on the mobile network at the end of the period. Connections differ from subscribers such that a unique subscriber can have multiple connections.
USSD Unstructured Supplementary Service Data. A synchronous message service creating a real-time M2P connection allowing a two-way exchange of data, mostly through menu structures
Voice Basic telephony services, with voice delivered over a mobile network
WAP Wireless Application Protocol for accessing information over mobile network. WAP browsers typically found on older feature phones.
WAP Wireless Application Protocol for accessing information over mobile network. WAP browsers typically found on older feature phones.
Web A system of interlinked hypertext documents accessed via the Internet; also accessible via enabled mobile devices
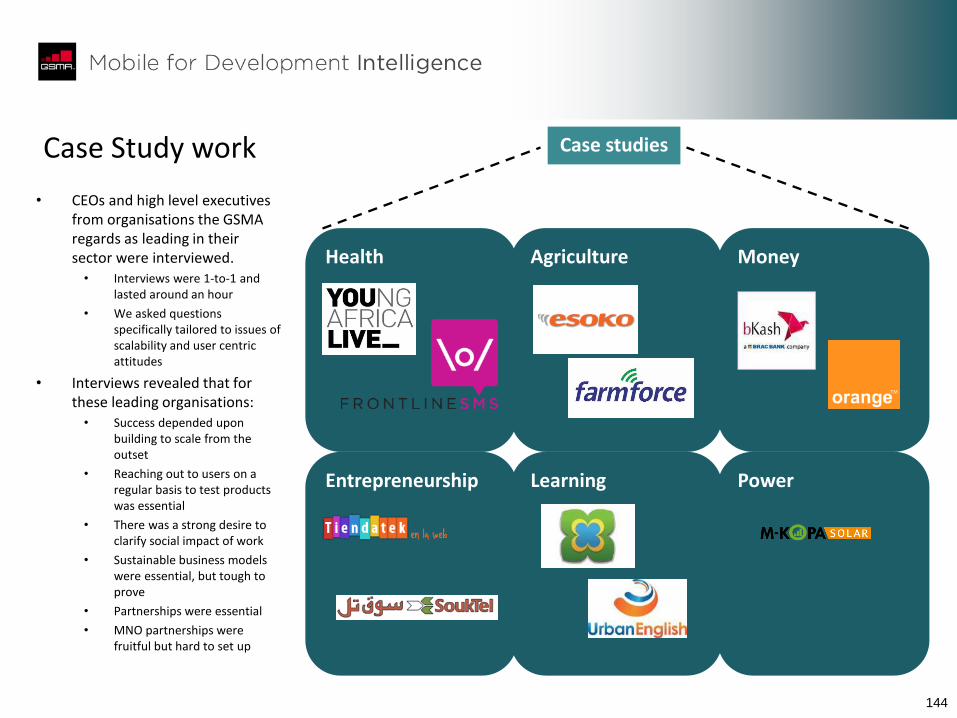
144
Case Study work
Health Agriculture Money
Entrepreneurship
Learning Power
• CEOs and high level executives from organisations the GSMA regards as leading in their sector were interviewed.
• Interviews were 1-to-1 and lasted around an hour
• We asked questions specifically tailored to issues of scalability and user centric attitudes
• Interviews revealed that for these leading organisations:
• Success depended upon building to scale from the outset
• Reaching out to users on a regular basis to test products was essential
• There was a strong desire to clarify social impact of work
• Sustainable business models were essential, but tough to prove
• Partnerships were essential
• MNO partnerships were fruitful but hard to set up
Case studies