sbir & sttr program annual report fys 2009-2011 · sbir & sttr program annual report fys...
TRANSCRIPT

SBIR & STTR Program Annual Report FYs 2009-2011
ii | P a g e
SBIR & STTR Program Annual Report FYs 2009-2011
iii | P a g e
Contents 1. Introduction .................................................................................................................................................. 1 2. SBIR Program Performance ........................................................................................................................... 3
a. Awards ...................................................................................................................................................... 3 b. Solicitations and Proposal Acceptance Rates........................................................................................... 7 c. Impact ....................................................................................................................................................11 d. Agency Compliance ................................................................................................................................17 e. SBIR Data Collection Scorecard for FY 2011 ...........................................................................................22 f. Energy Independence and Security Act of 2007 ....................................................................................24
3. STTR Program Performance ........................................................................................................................26 a. Introduction ...........................................................................................................................................26 b. Summary of Legislation ..........................................................................................................................26 c. Solicitations and Proposal Acceptance Rates.........................................................................................29 d. Impact ....................................................................................................................................................32 e. Agency Compliance ................................................................................................................................34 f. Energy Independence and Security Act of 2007 ....................................................................................35 g. STTR Data Collection Score Card for FY2011..........................................................................................37
4. Key Initiatives ..............................................................................................................................................39 a. TechNet ..................................................................................................................................................39 b. Tibbetts/Hall of Fame Awards ................................................................................................................40 c. Program Effectiveness and Leveraging Best Practices ...........................................................................40
5. Appendix A – Geographic SBIR Award Data for FYs 2009-2011 ..................................................................42 6. Appendix B – Extramural Budget Calculation for FY2011 ...........................................................................43 7. Appendix C – Agency SBIR Profiles ..............................................................................................................49 8. Appendix D – SBIR Summary Tables ...........................................................................................................60 9. Appendix E – STTR Summary Tables ..........................................................................................................63 10. Appendix F – SBIR Award Timelines ............................................................................................................69
SBIR & STTR Program Annual Report FYs 2009-2011
iv | P a g e
List of Exhibits Exhibit 1 – SBIR Award Amounts by Phase for FYs 2002-2011 (In millions of $) .................................................. 3 Exhibit 2 – Total SBIR Number of Awards by Phase for FYs 2002-2011 ................................................................ 4 Exhibit 3 – Distribution of Total Obligated SBIR Award Dollars for FYs 2009-2011 .............................................. 5 Exhibit 4 – Average SBIR Award Size by Phase for FYs 2002-2011 ........................................................................ 6 Exhibit 5 – SBIR Average Award Size FYs 2009-2011 Overall and by Agency ........................................................ 7 Exhibit 6 – SBIR Solicitations and Topics FYs 2002 – 2011 .................................................................................... 7 Exhibit 7 – Agencies Grouped By Average Number of Solicitations Per Year between FYs 2002 – 2011 ............. 8 Exhibit 8 – SBIR Topics by Year from FYs 2002 – 2011 .......................................................................................... 8 Exhibit 9 – SBIR Proposals Received for FYs 2002-2011 ........................................................................................ 9 Exhibit 10 – SBIR Proposal Acceptance Rate for FYs 2002-2011 by FY ...............................................................10 Exhibit 11 – Number of Companies Receiving SBIR Awards (FYs 2009 – 2011) ..................................................11 Exhibit 12 –SBIR Awards per Company (FY 2009 – 2011) ...................................................................................11 Exhibit 13 – Average SBIR Award Dollars by State FYs 2009 – 2011 (Phase I & Phase II) ...................................12 Exhibit 14 – Percent of SBIR Award Dollars in Underserved Communities for FYs 2007 – 2011 ........................13 Exhibit 15 – Percent of SBIR Award Dollars in HUBZones by Agency for FYs 2009-2011 ...................................14 Exhibit 16 – Percent of SBIR Award Dollars in Minority-Owned/Disadvantaged Businesses by Agency for FYs 2007-2011 15 Exhibit 17 – Percent of SBIR Award Dollars in Women-Owned Businesses by Agency for FY 2009-2011 ..........16 Exhibit 18 – Agency SBIR Obligated to Extramural Budget Percentage FYs 2007 - 2011 ...................................17 Exhibit 19 – Number of Years Compliant at 2.5% of Extramural Budget by Agency for FYs 2007 - 2011 ..........18 Exhibit 20 – Agency Obligated SBIR Share of Extramural Budget Scorecard FYs 2007-2011..............................19 Exhibit 21 – Average Time Between Solicitation Close and Award Start Dates FY 2011 ....................................20 Exhibit 22 – SBIR Data Collection Agency Scorecard for FY2011 ........................................................................22 Exhibit 23 – STTR Award Amounts by Phase for FYs 2009-2011 (In thousands of $) .........................................27 Exhibit 24 – STTR Award Number by Phase for FYs 2009-2011 ..........................................................................27 Exhibit 25 – Distribution of Total STTR Award Dollars for FYs 2009-2011 ..........................................................28 Exhibit 26 – STTR Average Award Size FYs 2009-2011 Overall and by Agency* .................................................28 Exhibit 27 – STTR Solicitations and Topics FYs ....................................................................................................29 Exhibit 28 – Agencies Grouped By Average Number of Solicitations Per Year between FYs 2009 – 2011 .........29 Exhibit 29 – STTR Topics by Year from FYs 2009 – 2011 .....................................................................................29 Exhibit 30 – STTR Proposals Received for FY 2009-2011 by FY and Agency .......................................................30 Exhibit 31 – STTR Proposal Acceptance Rate for FY 2009-2011 by FY and Agency ............................................31 Exhibit 32 – Percent of STTR Award Dollars in Underserved Communities for FYs 2009 – 2011 .......................32 Exhibit 33 – Percent of STTR Award Dollars to HUBZone Certified Businesses by Agency for FYs 2009-2011...33 Exhibit 34 – Percent of STTR Dollars in Minority-Owned/Disadvantaged Businesses by Agency for FYs 2009-2011 33 Exhibit 35 – Agency STTR Obligated to Extramural Budget Percentage FYs 2009 -2011 ....................................34 Exhibit 36 – STTR Data Collection Agency Scorecard for FY2011........................................................................37
SBIR & STTR Program Annual Report FYs 2009-2011
1 | P a g e
1. Introduction Under the Small Business Innovation Development Act of 1982, Public Law 97-219, as amended, the U.S. Small Business Administration (SBA) has authority to establish policy for monitoring, evaluating, and reporting on accomplishments of the Small Business Innovation Research (SBIR) program. Public Law 97-219 was signed on July 22, 1982, and is found in section 9 of the Small Business Act and at Title 15 United States Code (U.S.C.) § 638. Congress reauthorized the SBIR program in 1986, and again in 1993, extending it to October 1, 2000. This reauthorization also increased the percentage of research and development (R&D) funds that participating Federal agencies must direct to small businesses under the program from 2 percent to 2.5 percent. On December 21, 2000, Public Law 106-554 was signed, reauthorizing the SBIR program through September 30, 2001. Through a series of extensions, the program was extended through the end of Fiscal Year (FY) 2011. To qualify for the SBIR program, agencies must have an extramural research and development (R&D) budget greater than $100 million. As of October 1, 2011, there are 11 agencies, which include:
Department of Defense (DOD)
Department of Health & Human Services (HHS)
Department of Energy (DOE)
National Aeronautics & Space Administration (NASA)
National Science Foundation (NSF)
Department of Agriculture (USDA)
Department of Homeland Security (DHS)
Department of Education (ED)
Department of Commerce (DOC)
Environmental Protection Agency (EPA)
Department of Transportation (DOT) This report highlights the performance of the SBIR program as reported to SBA by the participating agencies. To conduct this analysis, SBA used the congressional fiscal year. For some agencies, dollar obligations may occur in future years. SBA cannot credit those future obligations to the fiscal reporting years in this report. SBA is congressionally mandated to report on all agency obligations that occur within the congressional fiscal year. Additionally, numbers reported for underserved communities come from agency-reported annual report data. As such, this represents the most accurate data for the congressional fiscal year. Nevertheless, SBA took steps to provide analysis across years in order to account for these variations. For further information, Appendix D details each agency by fiscal year. Each agency is broken down important category and respective fiscal year (e.g. Phase I, Phase II, subsequent Phase IIs, Modifications for FY08, Modifications for FY09, etc.). Lastly, this report outlines some of the key initiatives undertaken by the agencies and SBA toward program improvement.
SBIR & STTR Program Annual Report FYs 2009-2011
2 | P a g e
SBIR/STTR Program Highlights
Over the 2009 and 2011 fiscal years, the SBIR program gave out an average of $1.99 billion in SBIR awards per year while the STTR program averaged $245 million in STTR awards annually. This represents a 34% increase in average dollars over the last 10 years.
Between 2009 and 2011, the SBIR program gave out an average of 5,730 awards to an average of 3,112 distinct companies. The number of awards has stayed flat, and is down slightly from 2002 levels. Average award sizes, however, have increased in nominal terms by 27% over this period. 10 of 11 agencies maintain average award sizes that do not exceed the maximum award size guidelines.
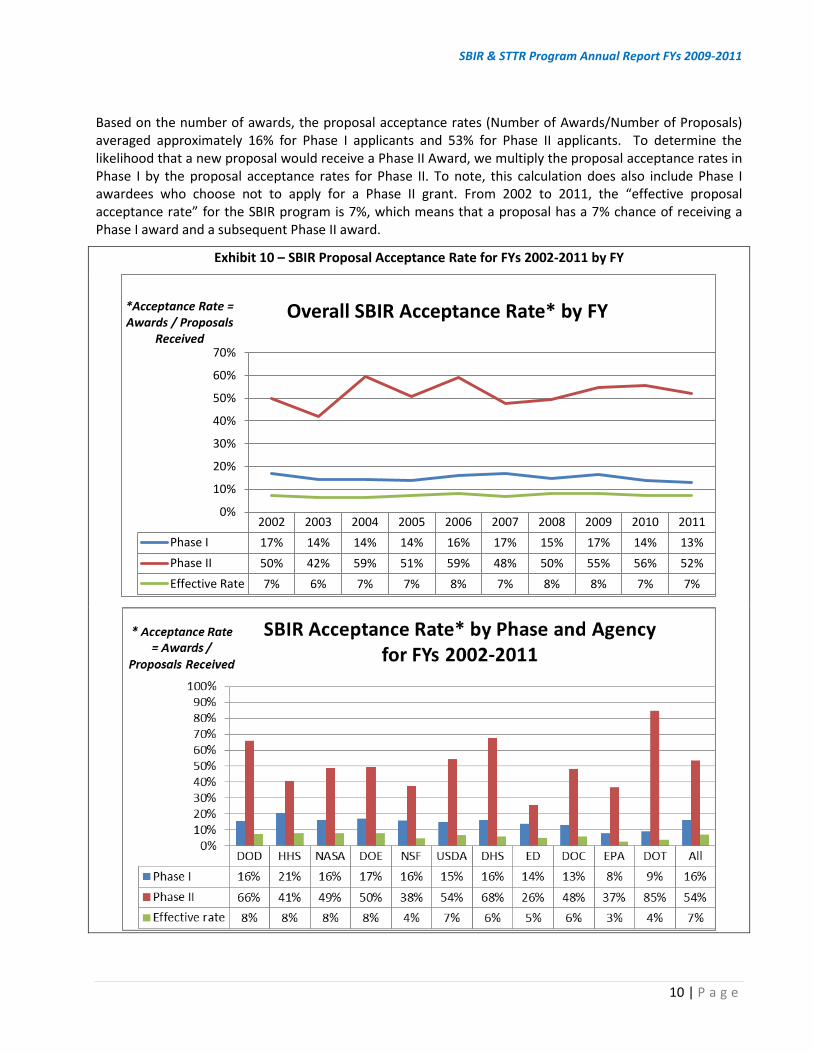
The SBIR program is competitive. Between 2009 and 2011, 16% of Phase 1 proposals received an award. Over half of Phase I awards go on to receive a Phase 2 award, netting an “effective proposal acceptance rate” of 7% for Phase II awards
In terms of agency breakout, DOD and HHS comprise approximately 79% of the awards, with the next three largest agencies (DOE, NASA, and NSF) comprising an additional 18% of the awards.
Over the last 5 years (FY2007-FY2011), the SBIR program has met the statutory goal of 2.5% of agency extramural R&D spending, averaging 2.54%.
Over the last 3 years (FY2009-FY2011), the STTR program as a whole has met the statutory goal of 0.3% of agency extramural R&D spending.
Timelines for selecting companies and making awards varies widely by agency; several agencies (DOD, EPA, USDA, and DOT) will need to significantly reduce their timelines to meet new statutory targets.
Distribution of awards remains relatively concentrated. Ten states received two-thirds of all SBIR award dollars. Additionally, half of the states and territories less than 10% of all SBIR award dollars.
Awards to HUBZone certified and minority/disadvantaged-owned businesses have modestly declined. Since 2007, awards to HUBZone certified businesses have decreased by 1% and awards to Minority/Disadvantaged-owned businesses have decreased by 1.8%.
In regards to women-owned businesses, SBA only began to fully track these numbers in 2009. We have incomplete award data for women-owned businesses in the program. Nevertheless, in FY 2011, 15.3% of SBIR awards went to women-owned businesses.
Performance of agencies in reporting data on the program in a timely manner has been mixed. In addition to working to improve performance at individual agencies, the program launched multiple cross agency initiatives to improve program effectiveness including sharing best practices, overhauling the TechNet database, improving the public facing SBIR.gov, and instituting awards programs to celebrate successful companies in the program.
SBIR & STTR Program Annual Report FYs 2009-2011
3 | P a g e
2. SBIR Program Performance This section identifies the impact of the SBIR program and its performance by individual agencies.
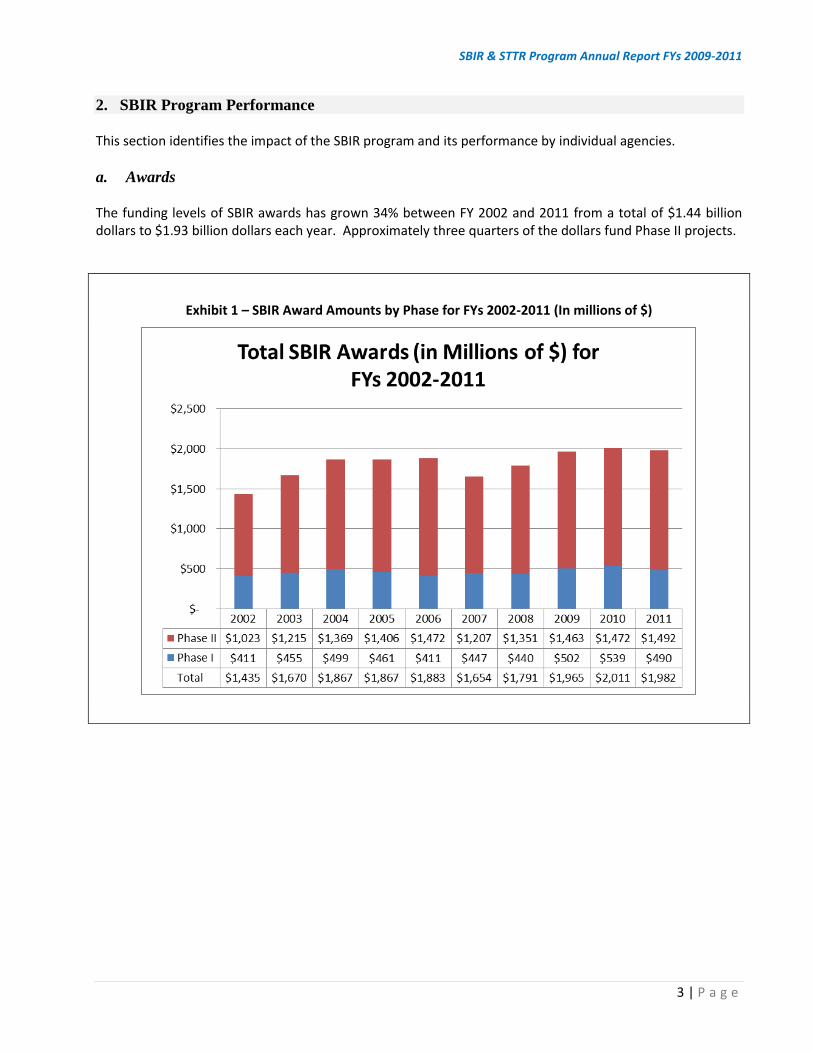
a. Awards The funding levels of SBIR awards has grown 34% between FY 2002 and 2011 from a total of $1.44 billion dollars to $1.93 billion dollars each year. Approximately three quarters of the dollars fund Phase II projects.
Exhibit 1 – SBIR Award Amounts by Phase for FYs 2002-2011 (In millions of $)
SBIR & STTR Program Annual Report FYs 2009-2011
4 | P a g e
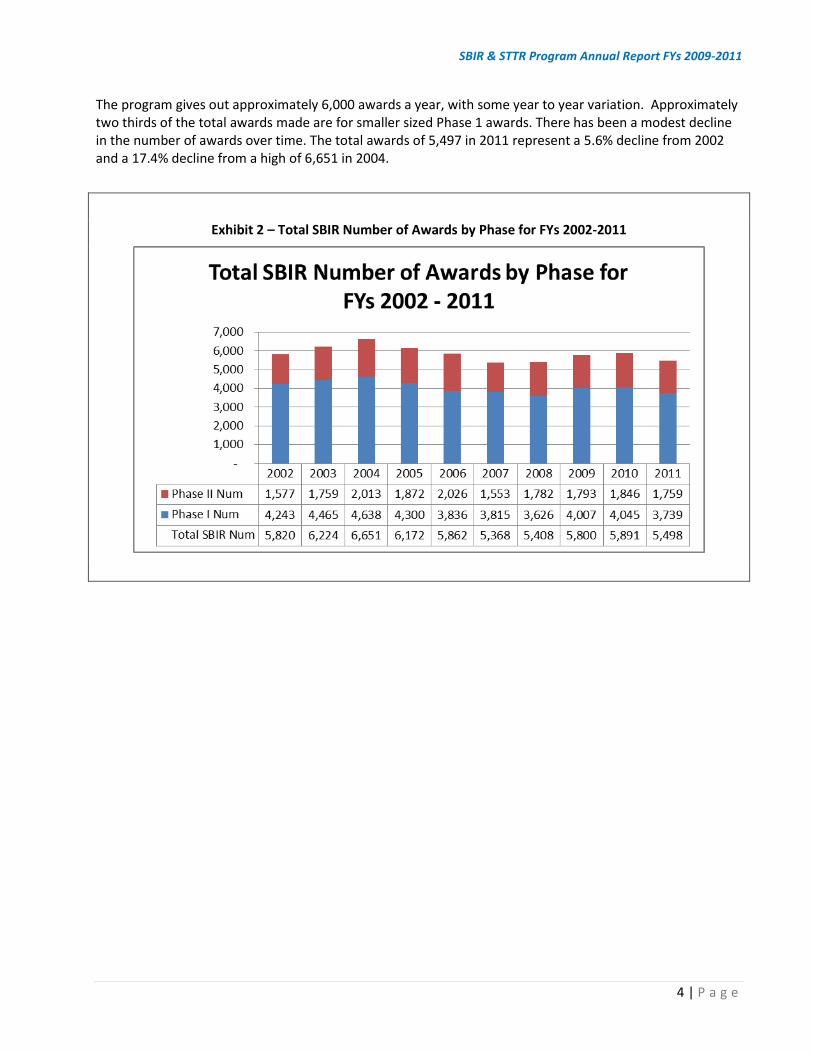
The program gives out approximately 6,000 awards a year, with some year to year variation. Approximately two thirds of the total awards made are for smaller sized Phase 1 awards. There has been a modest decline in the number of awards over time. The total awards of 5,497 in 2011 represent a 5.6% decline from 2002 and a 17.4% decline from a high of 6,651 in 2004.
Exhibit 2 – Total SBIR Number of Awards by Phase for FYs 2002-2011
SBIR & STTR Program Annual Report FYs 2009-2011
5 | P a g e
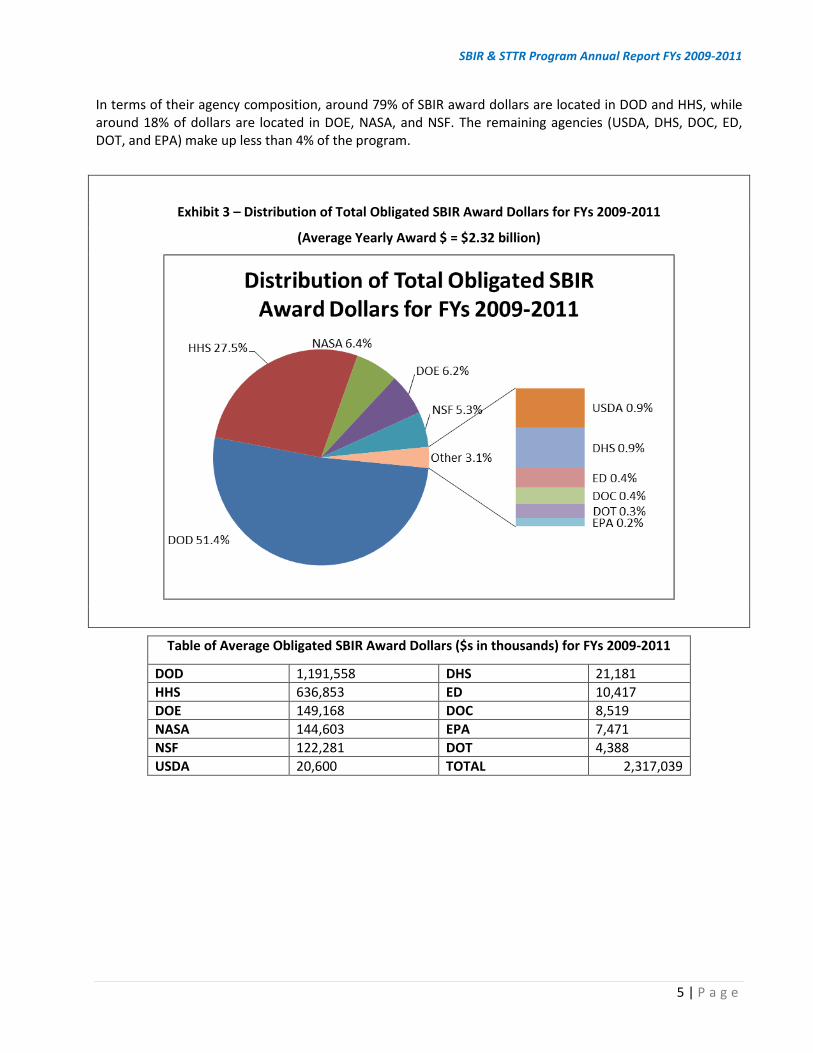
In terms of their agency composition, around 79% of SBIR award dollars are located in DOD and HHS, while around 18% of dollars are located in DOE, NASA, and NSF. The remaining agencies (USDA, DHS, DOC, ED, DOT, and EPA) make up less than 4% of the program.
Exhibit 3 – Distribution of Total Obligated SBIR Award Dollars for FYs 2009-2011
(Average Yearly Award $ = $2.32 billion)
Table of Average Obligated SBIR Award Dollars ($s in thousands) for FYs 2009-2011
DOD 1,191,558 DHS 21,181
HHS 636,853 ED 10,417
DOE 149,168 DOC 8,519
NASA 144,603 EPA 7,471
NSF 122,281 DOT 4,388
USDA 20,600 TOTAL 2,317,039
SBIR & STTR Program Annual Report FYs 2009-2011
6 | P a g e
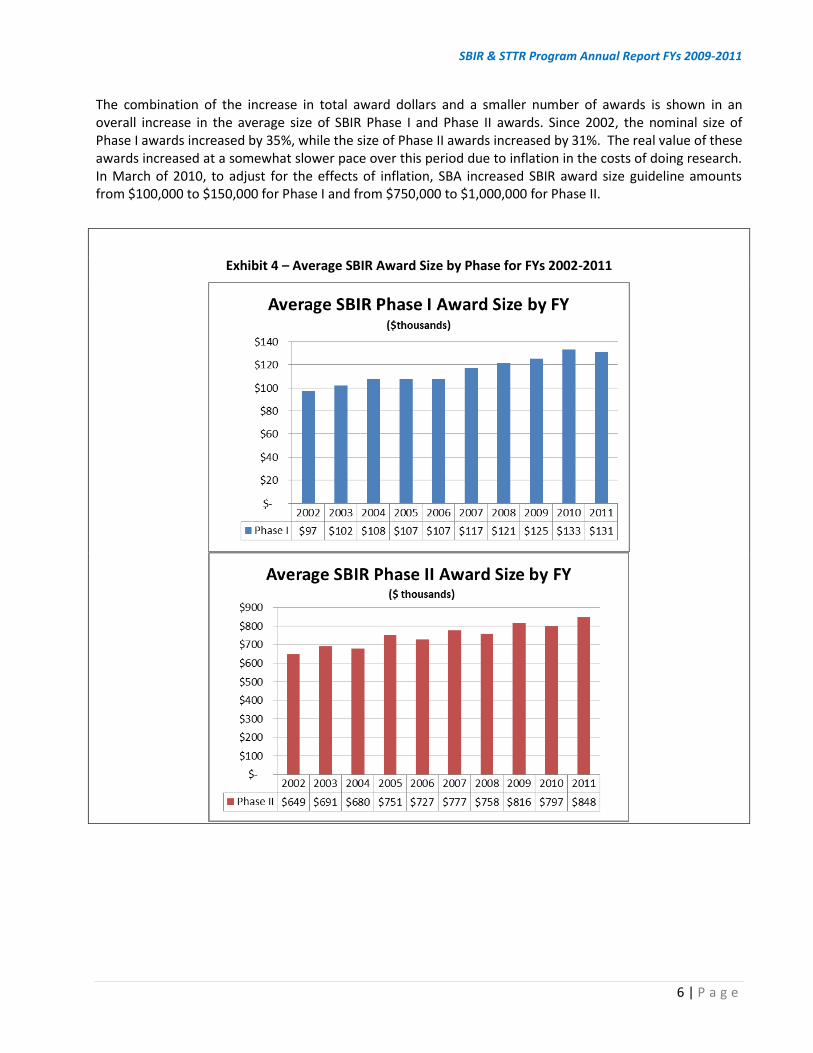
The combination of the increase in total award dollars and a smaller number of awards is shown in an overall increase in the average size of SBIR Phase I and Phase II awards. Since 2002, the nominal size of Phase I awards increased by 35%, while the size of Phase II awards increased by 31%. The real value of these awards increased at a somewhat slower pace over this period due to inflation in the costs of doing research. In March of 2010, to adjust for the effects of inflation, SBA increased SBIR award size guideline amounts from $100,000 to $150,000 for Phase I and from $750,000 to $1,000,000 for Phase II.
Exhibit 4 – Average SBIR Award Size by Phase for FYs 2002-2011
SBIR & STTR Program Annual Report FYs 2009-2011
7 | P a g e
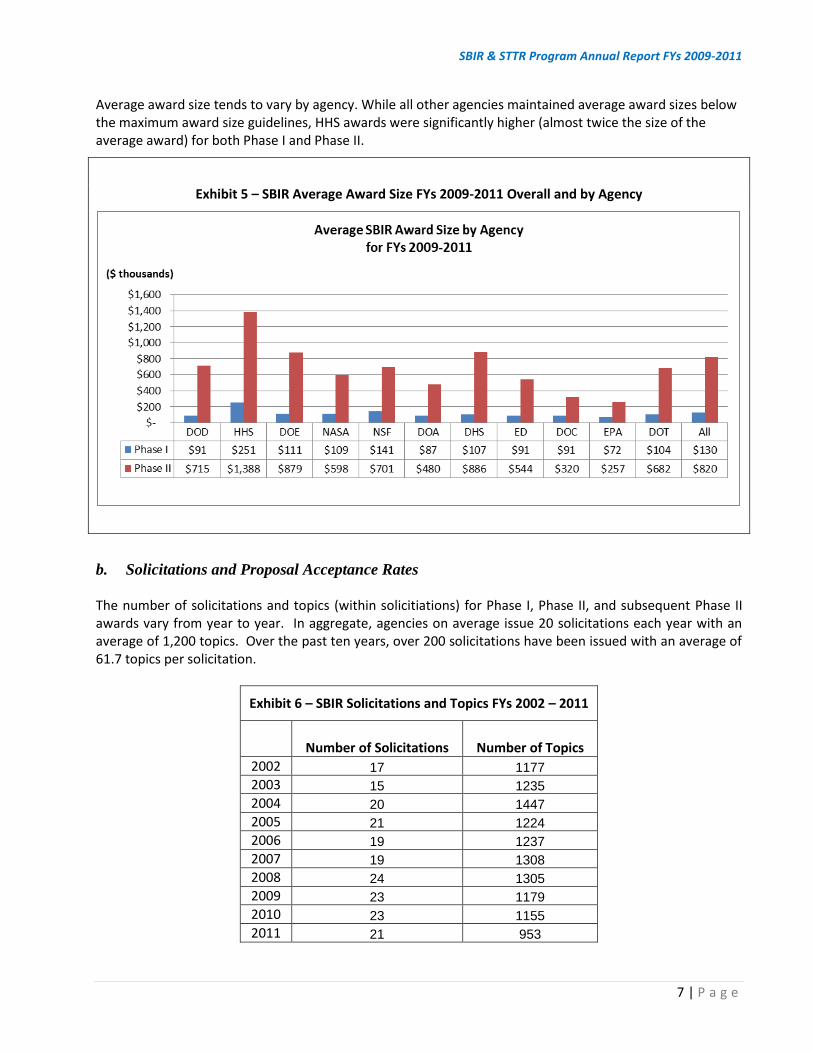
Average award size tends to vary by agency. While all other agencies maintained average award sizes below the maximum award size guidelines, HHS awards were significantly higher (almost twice the size of the average award) for both Phase I and Phase II.
Exhibit 5 – SBIR Average Award Size FYs 2009-2011 Overall and by Agency
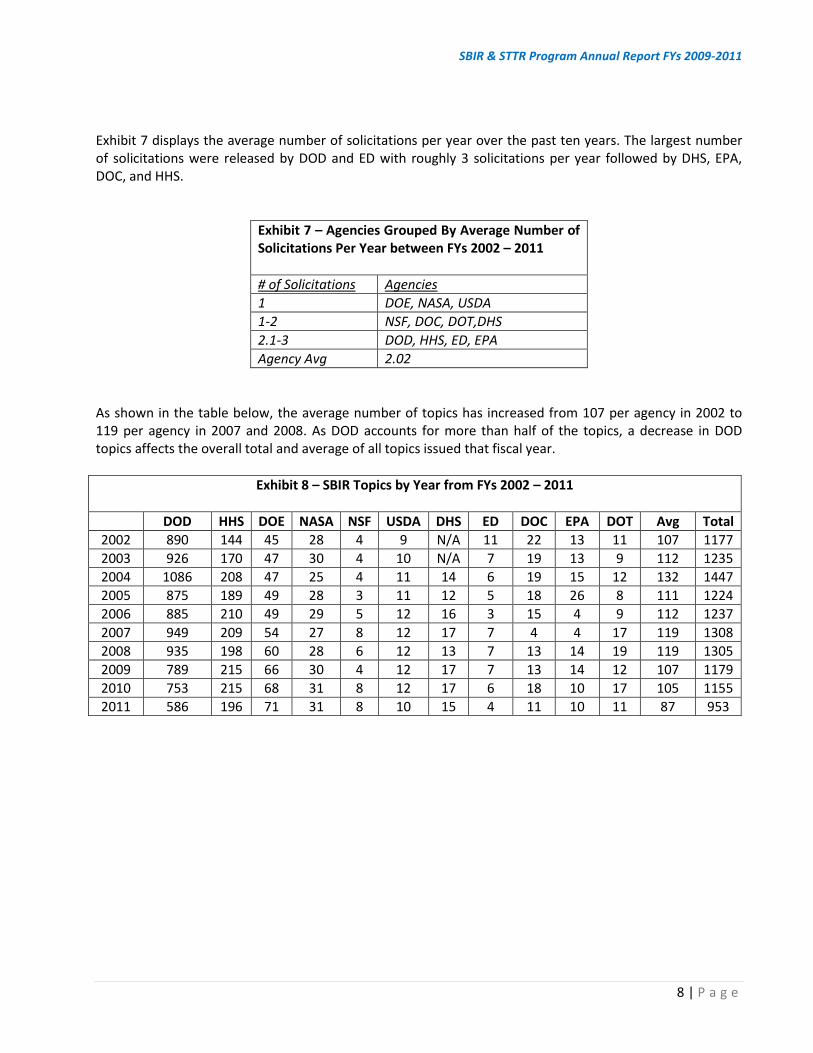
b. Solicitations and Proposal Acceptance Rates The number of solicitations and topics (within solicitiations) for Phase I, Phase II, and subsequent Phase II awards vary from year to year. In aggregate, agencies on average issue 20 solicitations each year with an average of 1,200 topics. Over the past ten years, over 200 solicitations have been issued with an average of 61.7 topics per solicitation.
Exhibit 6 – SBIR Solicitations and Topics FYs 2002 – 2011
Number of Solicitations
Number of Topics
2002 17 1177
2003 15 1235
2004 20 1447
2005 21 1224
2006 19 1237
2007 19 1308
2008 24 1305
2009 23 1179
2010 23 1155
2011 21 953
SBIR & STTR Program Annual Report FYs 2009-2011
8 | P a g e
Exhibit 7 displays the average number of solicitations per year over the past ten years. The largest number of solicitations were released by DOD and ED with roughly 3 solicitations per year followed by DHS, EPA, DOC, and HHS.
Exhibit 7 – Agencies Grouped By Average Number of Solicitations Per Year between FYs 2002 – 2011
# of Solicitations Agencies
1 DOE, NASA, USDA
1-2 NSF, DOC, DOT,DHS
2.1-3 DOD, HHS, ED, EPA
Agency Avg 2.02
As shown in the table below, the average number of topics has increased from 107 per agency in 2002 to 119 per agency in 2007 and 2008. As DOD accounts for more than half of the topics, a decrease in DOD topics affects the overall total and average of all topics issued that fiscal year.
Exhibit 8 – SBIR Topics by Year from FYs 2002 – 2011
DOD HHS DOE NASA NSF USDA DHS ED DOC EPA DOT Avg Total
2002 890 144 45 28 4 9 N/A 11 22 13 11 107 1177
2003 926 170 47 30 4 10 N/A 7 19 13 9 112 1235
2004 1086 208 47 25 4 11 14 6 19 15 12 132 1447
2005 875 189 49 28 3 11 12 5 18 26 8 111 1224
2006 885 210 49 29 5 12 16 3 15 4 9 112 1237
2007 949 209 54 27 8 12 17 7 4 4 17 119 1308
2008 935 198 60 28 6 12 13 7 13 14 19 119 1305
2009 789 215 66 30 4 12 17 7 13 14 12 107 1179
2010 753 215 68 31 8 12 17 6 18 10 17 105 1155
2011 586 196 71 31 8 10 15 4 11 10 11 87 953
SBIR & STTR Program Annual Report FYs 2009-2011
9 | P a g e
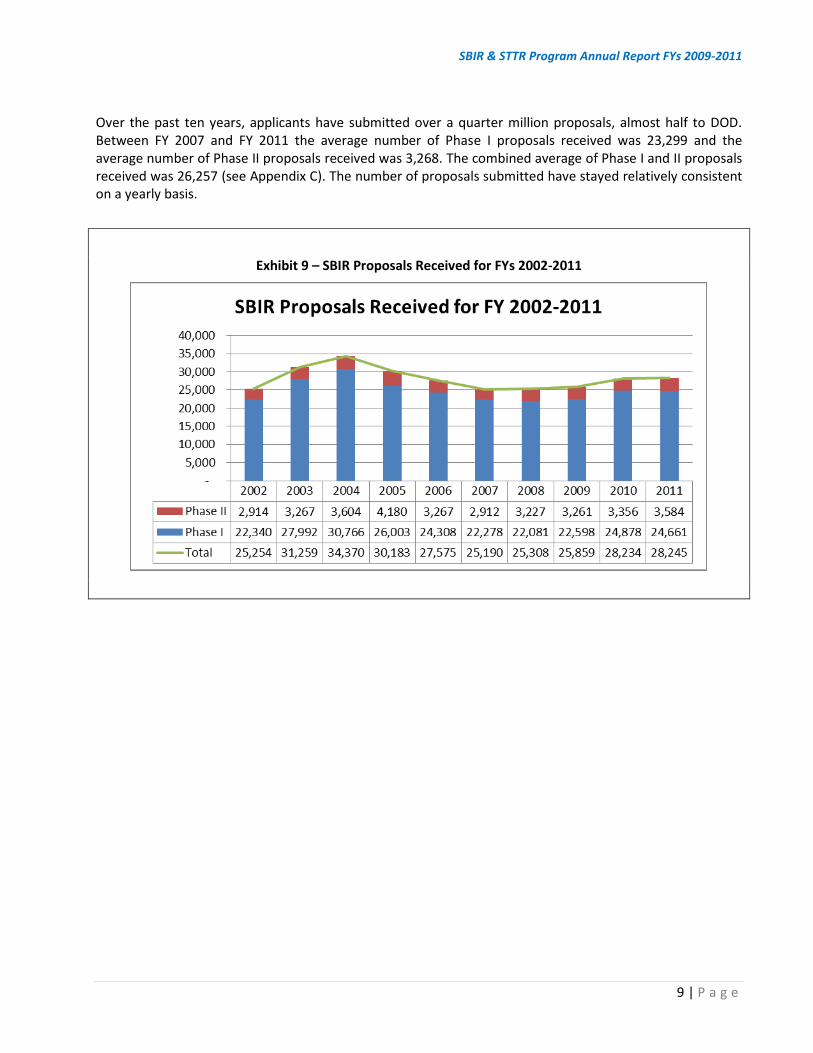
Over the past ten years, applicants have submitted over a quarter million proposals, almost half to DOD. Between FY 2007 and FY 2011 the average number of Phase I proposals received was 23,299 and the average number of Phase II proposals received was 3,268. The combined average of Phase I and II proposals received was 26,257 (see Appendix C). The number of proposals submitted have stayed relatively consistent on a yearly basis.
Exhibit 9 – SBIR Proposals Received for FYs 2002-2011
SBIR & STTR Program Annual Report FYs 2009-2011
10 | P a g e
Based on the number of awards, the proposal acceptance rates (Number of Awards/Number of Proposals) averaged approximately 16% for Phase I applicants and 53% for Phase II applicants. To determine the likelihood that a new proposal would receive a Phase II Award, we multiply the proposal acceptance rates in Phase I by the proposal acceptance rates for Phase II. To note, this calculation does also include Phase I awardees who choose not to apply for a Phase II grant. From 2002 to 2011, the “effective proposal acceptance rate” for the SBIR program is 7%, which means that a proposal has a 7% chance of receiving a Phase I award and a subsequent Phase II award.
Exhibit 10 – SBIR Proposal Acceptance Rate for FYs 2002-2011 by FY
2002 2003 2004 2005 2006 2007 2008 2009 2010 2011
Phase I 17% 14% 14% 14% 16% 17% 15% 17% 14% 13%
Phase II 50% 42% 59% 51% 59% 48% 50% 55% 56% 52%
Effective Rate 7% 6% 7% 7% 8% 7% 8% 8% 7% 7%
0%
10%
20%
30%
40%
50%
60%
70%
*Acceptance Rate = Awards / Proposals
Received
Overall SBIR Acceptance Rate* by FY
SBIR & STTR Program Annual Report FYs 2009-2011
11 | P a g e
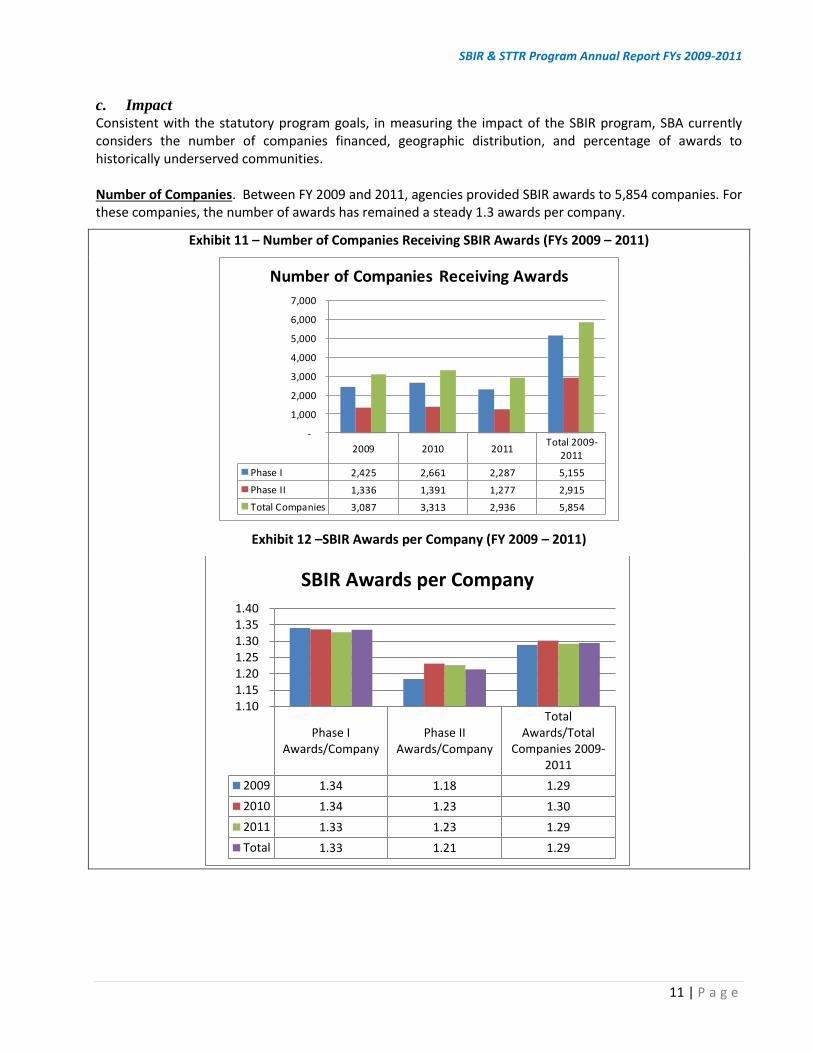
c. Impact Consistent with the statutory program goals, in measuring the impact of the SBIR program, SBA currently considers the number of companies financed, geographic distribution, and percentage of awards to historically underserved communities. Number of Companies. Between FY 2009 and 2011, agencies provided SBIR awards to 5,854 companies. For these companies, the number of awards has remained a steady 1.3 awards per company.
Exhibit 11 – Number of Companies Receiving SBIR Awards (FYs 2009 – 2011)
Exhibit 12 –SBIR Awards per Company (FY 2009 – 2011)
2009 2010 2011Total 2009-
2011
Phase I 2,425 2,661 2,287 5,155
Phase II 1,336 1,391 1,277 2,915
Total Companies 3,087 3,313 2,936 5,854
-
1,000
2,000
3,000
4,000
5,000
6,000
7,000
Number of Companies Receiving Awards
Phase IAwards/Company
Phase IIAwards/Company
TotalAwards/Total
Companies 2009-2011
2009 1.34 1.18 1.29
2010 1.34 1.23 1.30
2011 1.33 1.23 1.29
Total 1.33 1.21 1.29
1.10 1.15 1.20 1.25 1.30 1.35 1.40
SBIR Awards per Company
SBIR & STTR Program Annual Report FYs 2009-2011
12 | P a g e
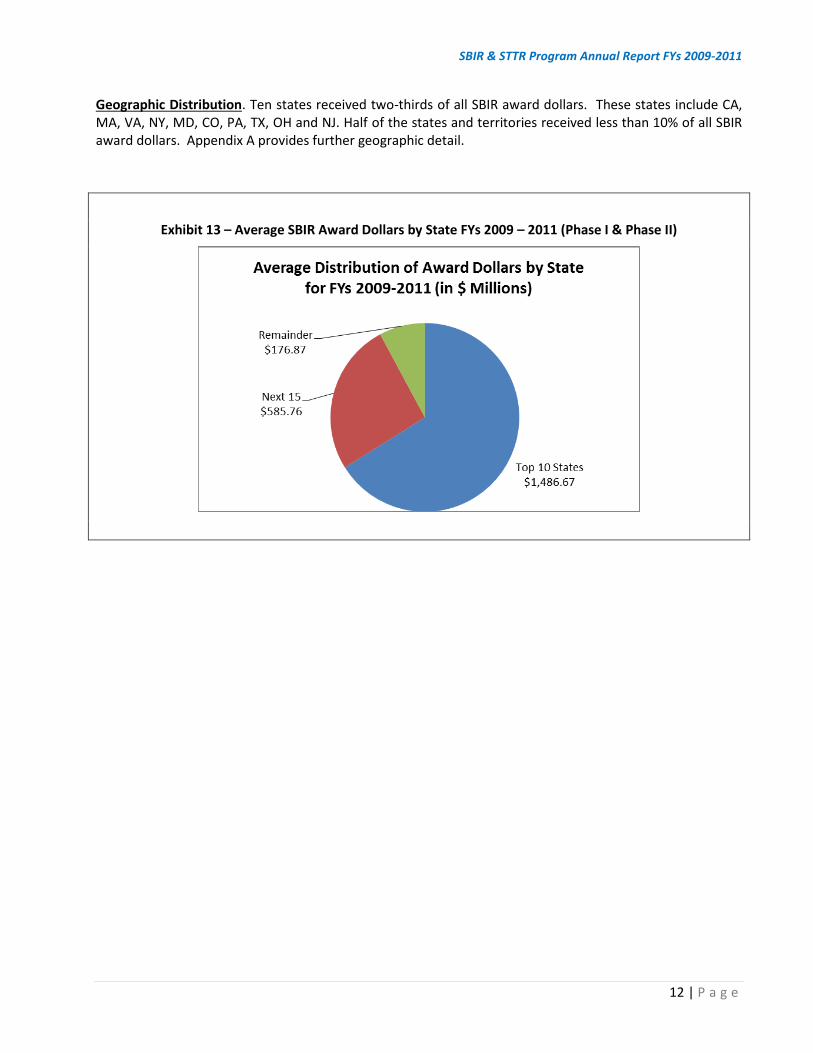
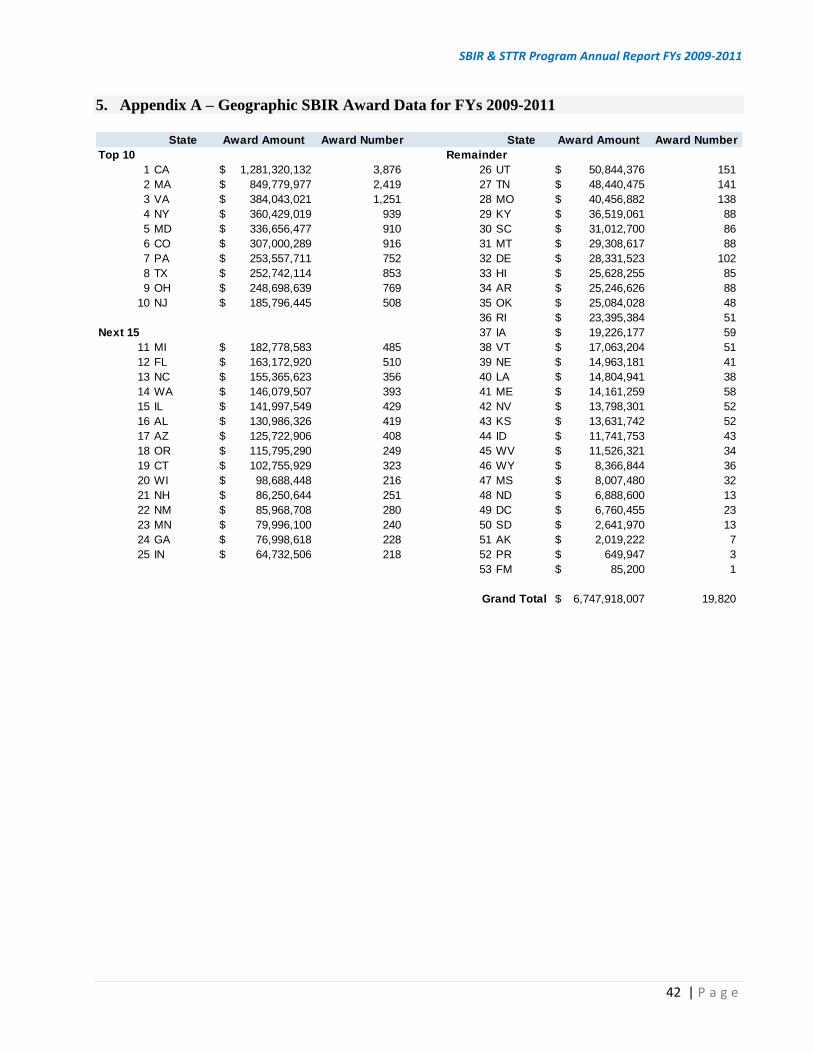
Geographic Distribution. Ten states received two-thirds of all SBIR award dollars. These states include CA, MA, VA, NY, MD, CO, PA, TX, OH and NJ. Half of the states and territories received less than 10% of all SBIR award dollars. Appendix A provides further geographic detail.
Exhibit 13 – Average SBIR Award Dollars by State FYs 2009 – 2011 (Phase I & Phase II)
SBIR & STTR Program Annual Report FYs 2009-2011
13 | P a g e
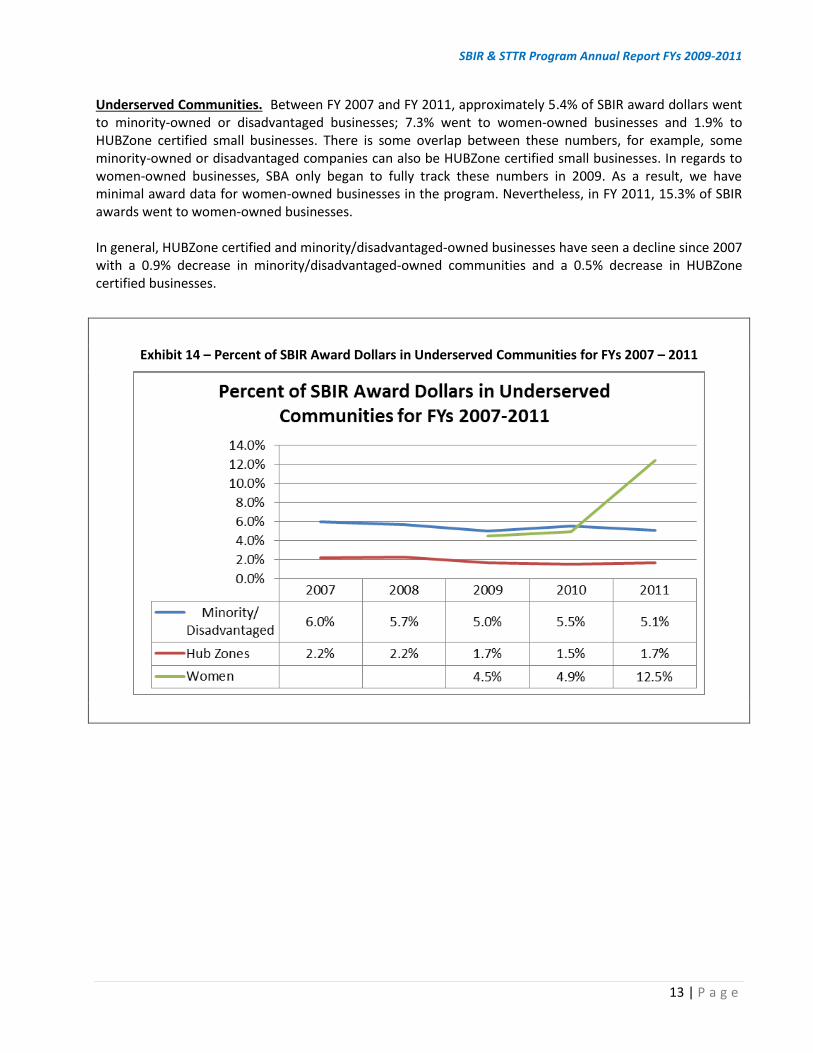
Underserved Communities. Between FY 2007 and FY 2011, approximately 5.4% of SBIR award dollars went to minority-owned or disadvantaged businesses; 7.3% went to women-owned businesses and 1.9% to HUBZone certified small businesses. There is some overlap between these numbers, for example, some minority-owned or disadvantaged companies can also be HUBZone certified small businesses. In regards to women-owned businesses, SBA only began to fully track these numbers in 2009. As a result, we have minimal award data for women-owned businesses in the program. Nevertheless, in FY 2011, 15.3% of SBIR awards went to women-owned businesses. In general, HUBZone certified and minority/disadvantaged-owned businesses have seen a decline since 2007 with a 0.9% decrease in minority/disadvantaged-owned communities and a 0.5% decrease in HUBZone certified businesses.
Exhibit 14 – Percent of SBIR Award Dollars in Underserved Communities for FYs 2007 – 2011
SBIR & STTR Program Annual Report FYs 2009-2011
14 | P a g e
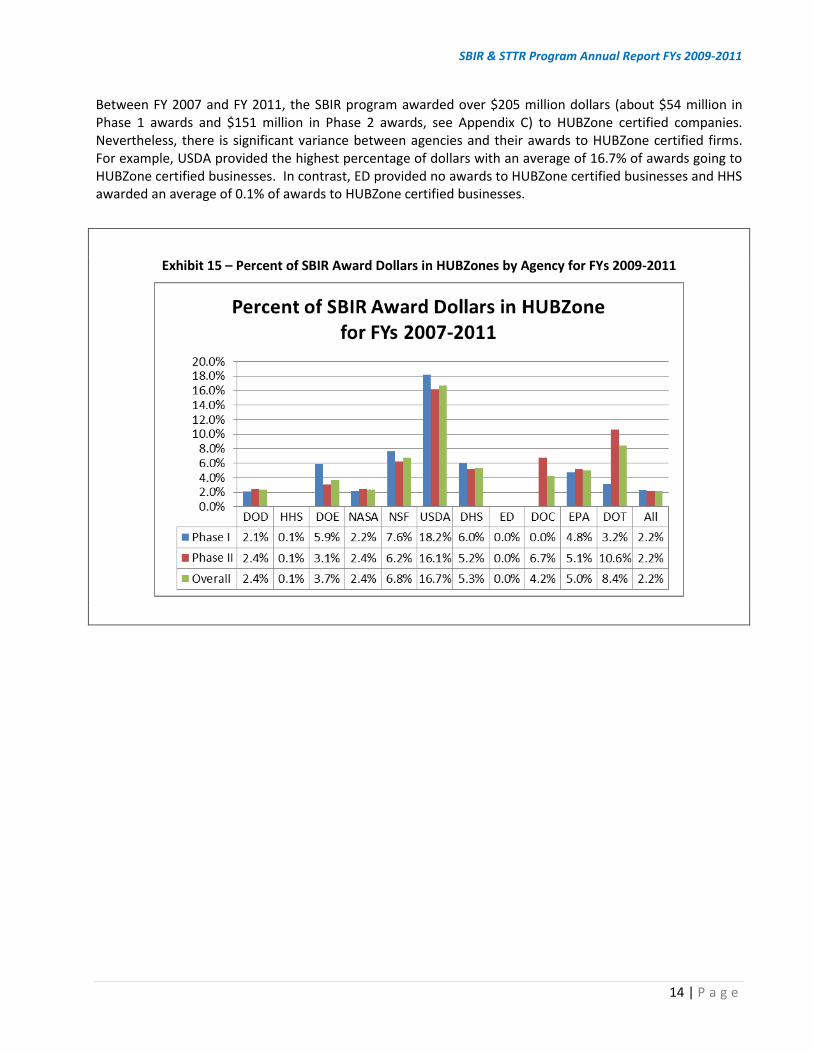
Between FY 2007 and FY 2011, the SBIR program awarded over $205 million dollars (about $54 million in Phase 1 awards and $151 million in Phase 2 awards, see Appendix C) to HUBZone certified companies. Nevertheless, there is significant variance between agencies and their awards to HUBZone certified firms. For example, USDA provided the highest percentage of dollars with an average of 16.7% of awards going to HUBZone certified businesses. In contrast, ED provided no awards to HUBZone certified businesses and HHS awarded an average of 0.1% of awards to HUBZone certified businesses.
Exhibit 15 – Percent of SBIR Award Dollars in HUBZones by Agency for FYs 2009-2011
SBIR & STTR Program Annual Report FYs 2009-2011
15 | P a g e
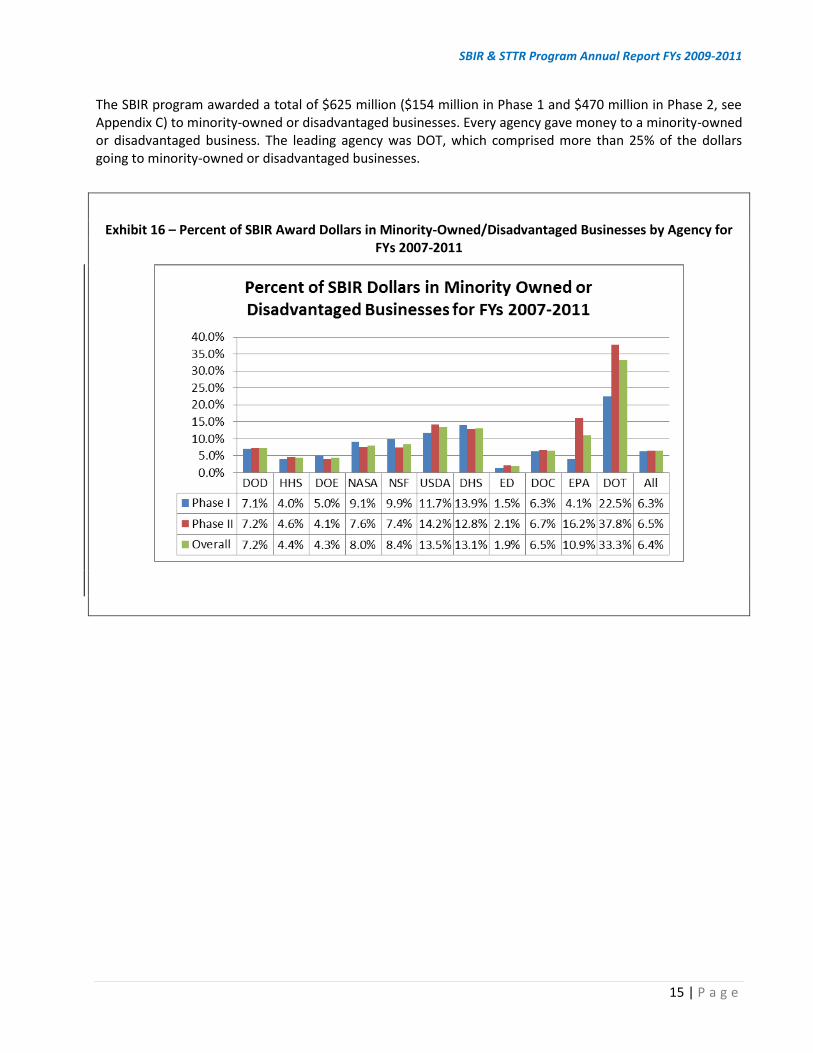
The SBIR program awarded a total of $625 million ($154 million in Phase 1 and $470 million in Phase 2, see Appendix C) to minority-owned or disadvantaged businesses. Every agency gave money to a minority-owned or disadvantaged business. The leading agency was DOT, which comprised more than 25% of the dollars going to minority-owned or disadvantaged businesses.
Exhibit 16 – Percent of SBIR Award Dollars in Minority-Owned/Disadvantaged Businesses by Agency for FYs 2007-2011
SBIR & STTR Program Annual Report FYs 2009-2011
16 | P a g e
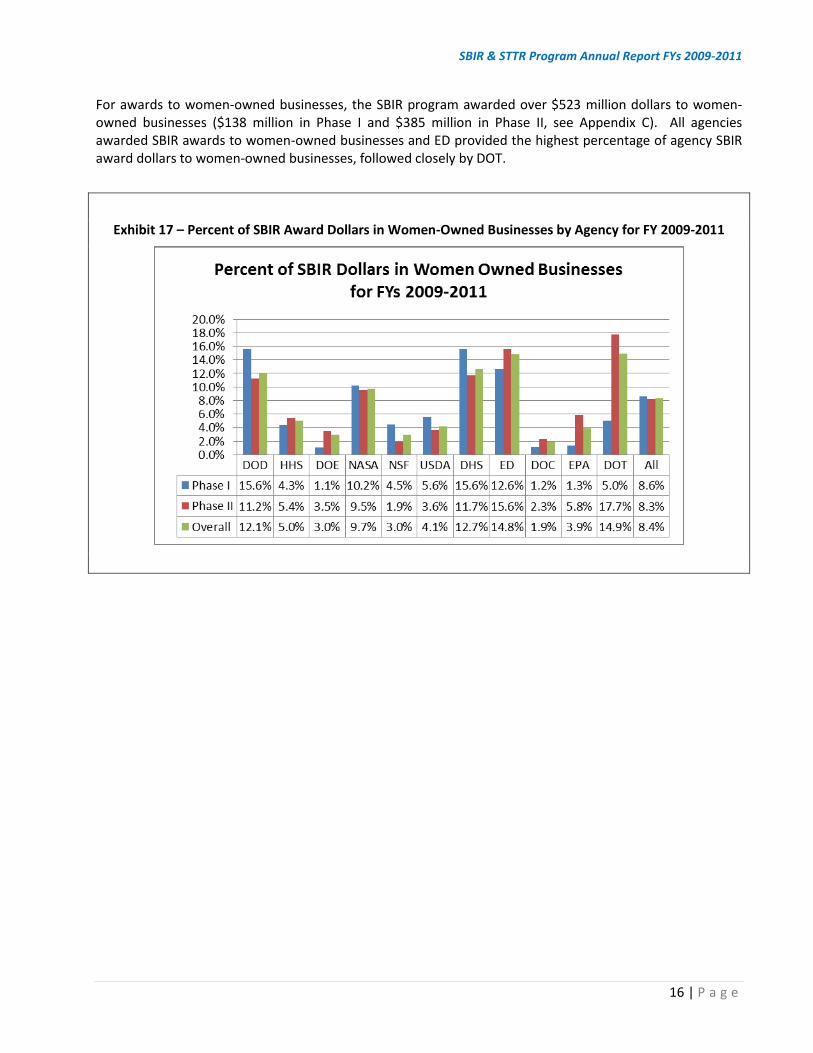
For awards to women-owned businesses, the SBIR program awarded over $523 million dollars to women-owned businesses ($138 million in Phase I and $385 million in Phase II, see Appendix C). All agencies awarded SBIR awards to women-owned businesses and ED provided the highest percentage of agency SBIR award dollars to women-owned businesses, followed closely by DOT.
Exhibit 17 – Percent of SBIR Award Dollars in Women-Owned Businesses by Agency for FY 2009-2011
SBIR & STTR Program Annual Report FYs 2009-2011
17 | P a g e
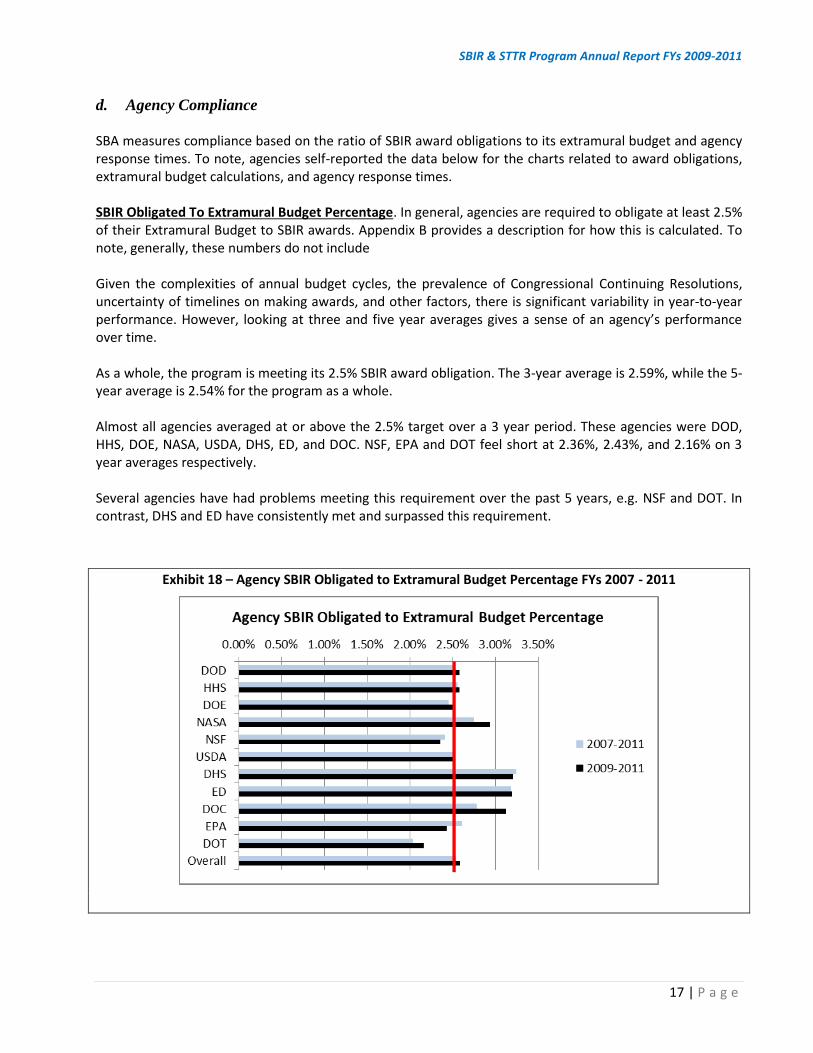
d. Agency Compliance SBA measures compliance based on the ratio of SBIR award obligations to its extramural budget and agency response times. To note, agencies self-reported the data below for the charts related to award obligations, extramural budget calculations, and agency response times. SBIR Obligated To Extramural Budget Percentage. In general, agencies are required to obligate at least 2.5% of their Extramural Budget to SBIR awards. Appendix B provides a description for how this is calculated. To note, generally, these numbers do not include Given the complexities of annual budget cycles, the prevalence of Congressional Continuing Resolutions, uncertainty of timelines on making awards, and other factors, there is significant variability in year-to-year performance. However, looking at three and five year averages gives a sense of an agency’s performance over time. As a whole, the program is meeting its 2.5% SBIR award obligation. The 3-year average is 2.59%, while the 5-year average is 2.54% for the program as a whole. Almost all agencies averaged at or above the 2.5% target over a 3 year period. These agencies were DOD, HHS, DOE, NASA, USDA, DHS, ED, and DOC. NSF, EPA and DOT feel short at 2.36%, 2.43%, and 2.16% on 3 year averages respectively. Several agencies have had problems meeting this requirement over the past 5 years, e.g. NSF and DOT. In contrast, DHS and ED have consistently met and surpassed this requirement.
Exhibit 18 – Agency SBIR Obligated to Extramural Budget Percentage FYs 2007 - 2011
SBIR & STTR Program Annual Report FYs 2009-2011
18 | P a g e
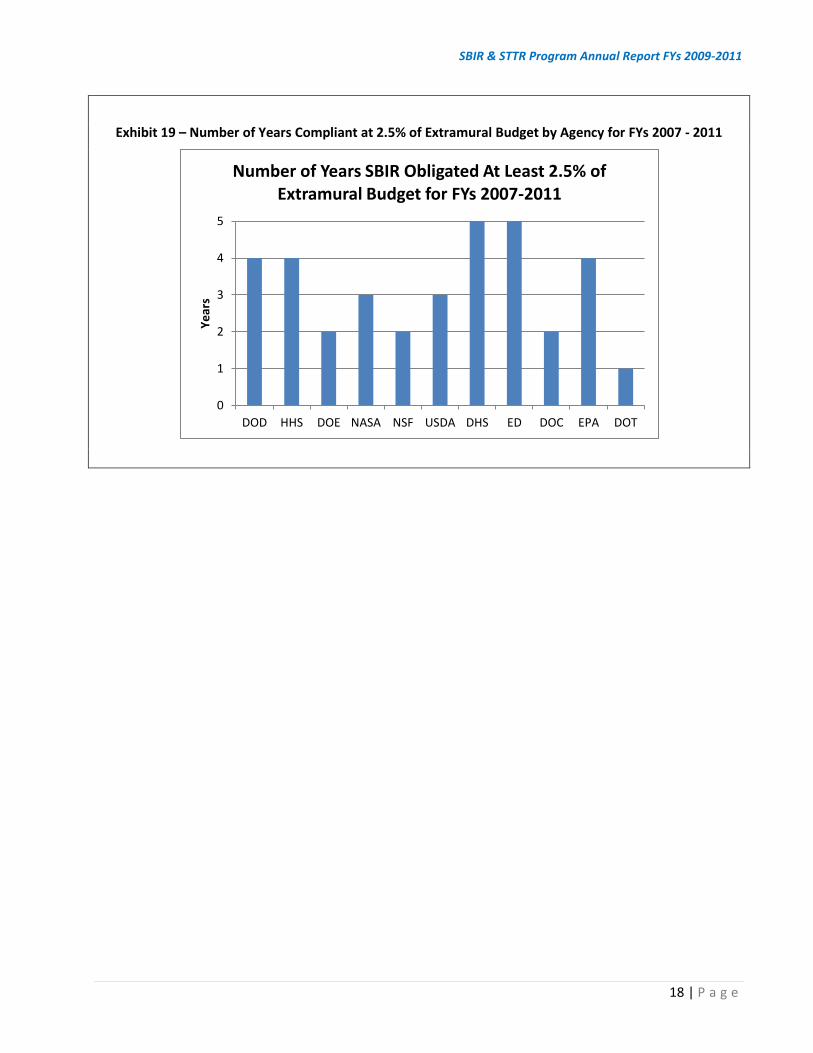
Exhibit 19 – Number of Years Compliant at 2.5% of Extramural Budget by Agency for FYs 2007 - 2011
0
1
2
3
4
5
DOD HHS DOE NASA NSF USDA DHS ED DOC EPA DOT
Ye
ars
Number of Years SBIR Obligated At Least 2.5% of Extramural Budget for FYs 2007-2011
SBIR & STTR Program Annual Report FYs 2009-2011
19 | P a g e
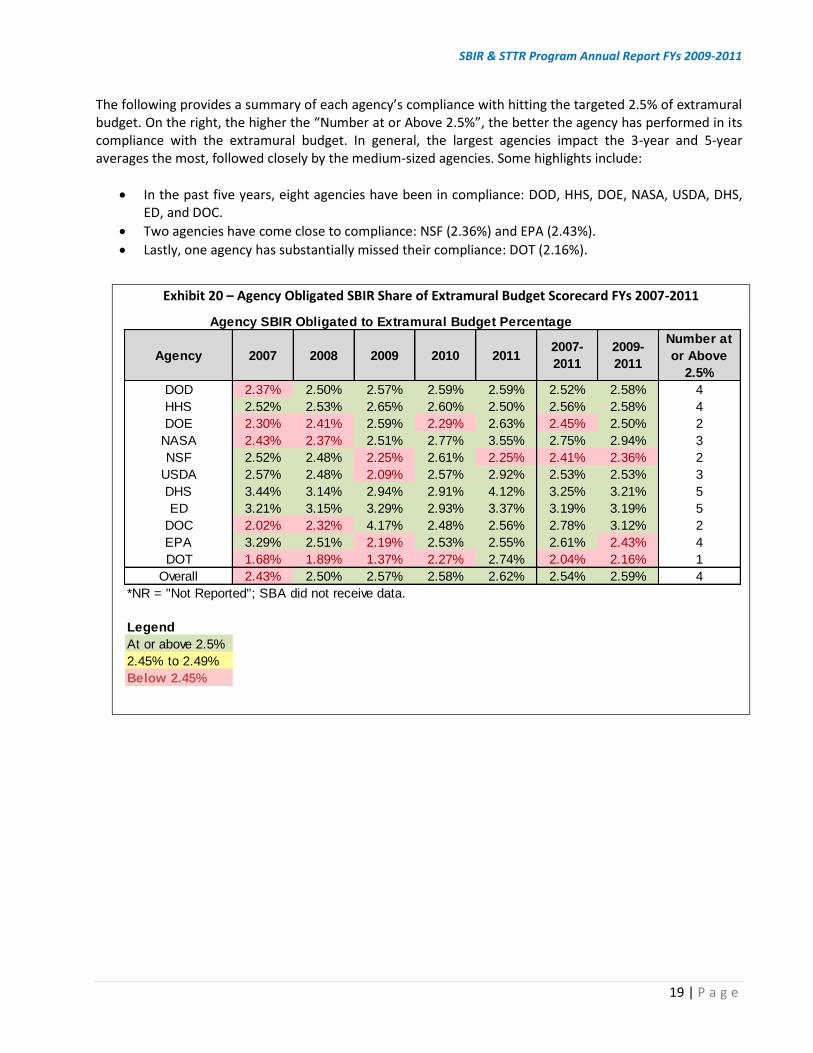
The following provides a summary of each agency’s compliance with hitting the targeted 2.5% of extramural budget. On the right, the higher the “Number at or Above 2.5%”, the better the agency has performed in its compliance with the extramural budget. In general, the largest agencies impact the 3-year and 5-year averages the most, followed closely by the medium-sized agencies. Some highlights include:
In the past five years, eight agencies have been in compliance: DOD, HHS, DOE, NASA, USDA, DHS, ED, and DOC.
Two agencies have come close to compliance: NSF (2.36%) and EPA (2.43%).
Lastly, one agency has substantially missed their compliance: DOT (2.16%).
Exhibit 20 – Agency Obligated SBIR Share of Extramural Budget Scorecard FYs 2007-2011
Agency 2007 2008 2009 2010 20112007-
2011
2009-
2011
Number at
or Above
2.5%
DOD 2.37% 2.50% 2.57% 2.59% 2.59% 2.52% 2.58% 4
HHS 2.52% 2.53% 2.65% 2.60% 2.50% 2.56% 2.58% 4
DOE 2.30% 2.41% 2.59% 2.29% 2.63% 2.45% 2.50% 2
NASA 2.43% 2.37% 2.51% 2.77% 3.55% 2.75% 2.94% 3
NSF 2.52% 2.48% 2.25% 2.61% 2.25% 2.41% 2.36% 2
USDA 2.57% 2.48% 2.09% 2.57% 2.92% 2.53% 2.53% 3
DHS 3.44% 3.14% 2.94% 2.91% 4.12% 3.25% 3.21% 5
ED 3.21% 3.15% 3.29% 2.93% 3.37% 3.19% 3.19% 5
DOC 2.02% 2.32% 4.17% 2.48% 2.56% 2.78% 3.12% 2
EPA 3.29% 2.51% 2.19% 2.53% 2.55% 2.61% 2.43% 4
DOT 1.68% 1.89% 1.37% 2.27% 2.74% 2.04% 2.16% 1
Overall 2.43% 2.50% 2.57% 2.58% 2.62% 2.54% 2.59% 4
*NR = "Not Reported"; SBA did not receive data.
Legend
At or above 2.5%
2.45% to 2.49%
Below 2.45%
Agency SBIR Obligated to Extramural Budget Percentage
SBIR & STTR Program Annual Report FYs 2009-2011
20 | P a g e
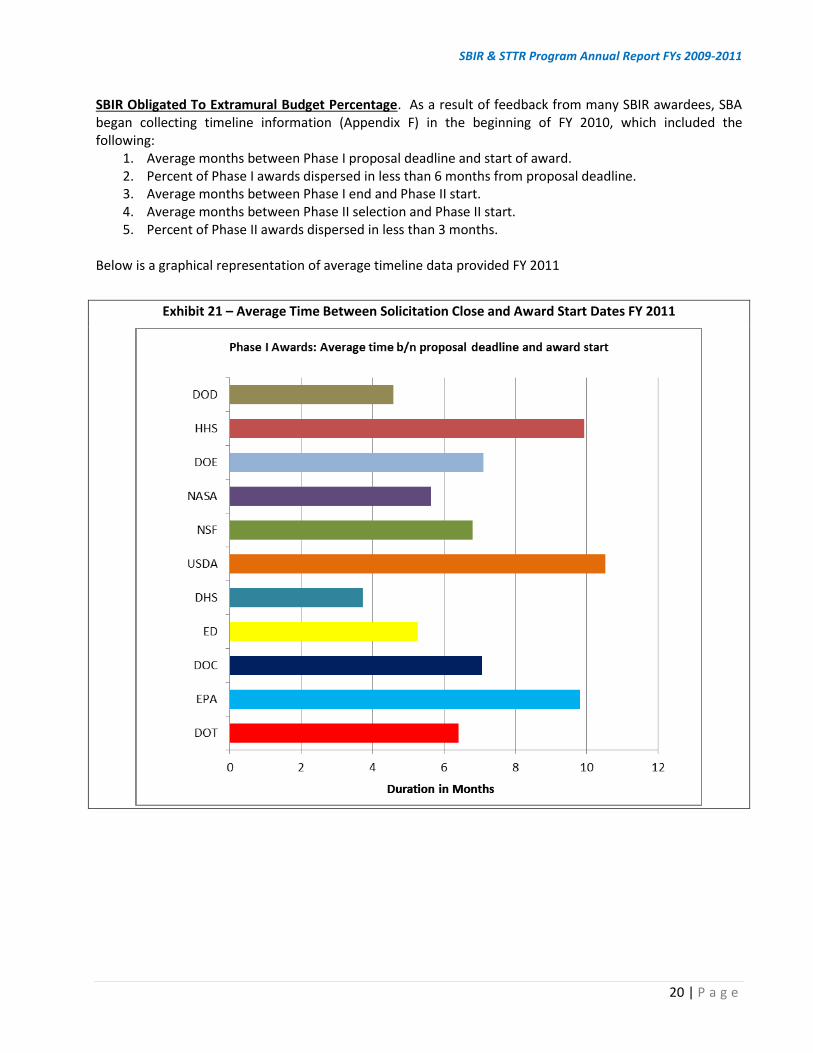
SBIR Obligated To Extramural Budget Percentage. As a result of feedback from many SBIR awardees, SBA began collecting timeline information (Appendix F) in the beginning of FY 2010, which included the following:
1. Average months between Phase I proposal deadline and start of award. 2. Percent of Phase I awards dispersed in less than 6 months from proposal deadline. 3. Average months between Phase I end and Phase II start. 4. Average months between Phase II selection and Phase II start. 5. Percent of Phase II awards dispersed in less than 3 months.
Below is a graphical representation of average timeline data provided FY 2011
Exhibit 21 – Average Time Between Solicitation Close and Award Start Dates FY 2011
SBIR & STTR Program Annual Report FYs 2009-2011
21 | P a g e
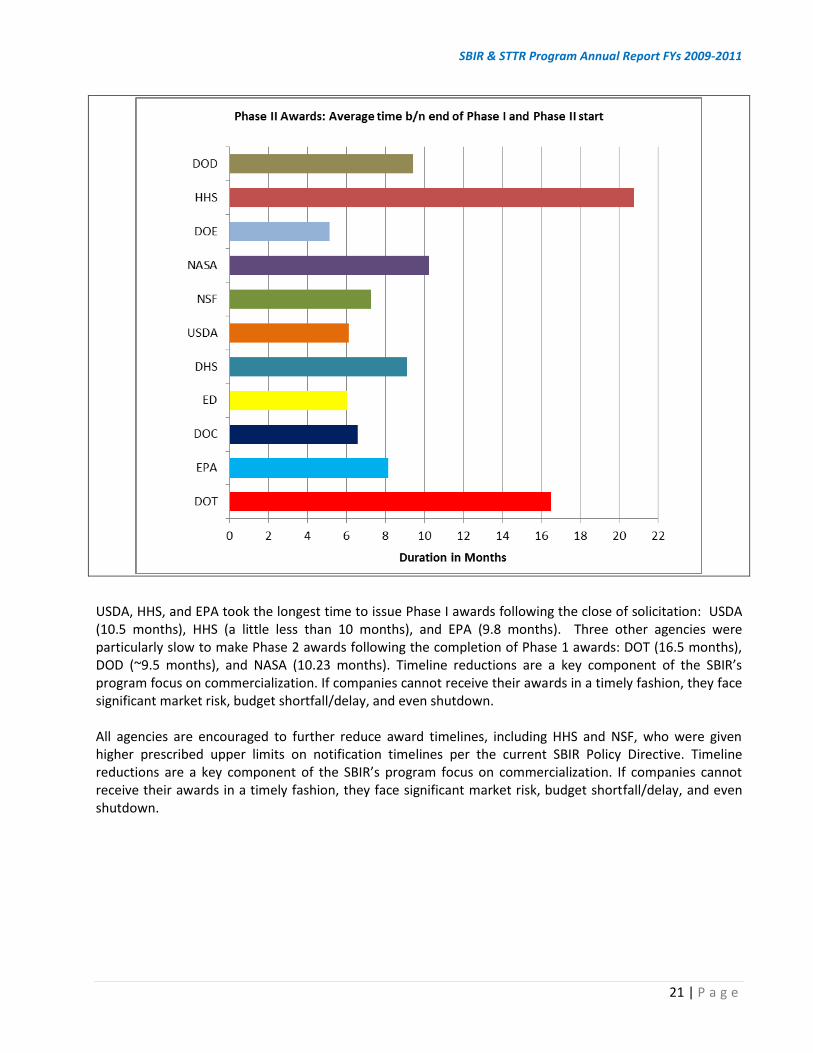
USDA, HHS, and EPA took the longest time to issue Phase I awards following the close of solicitation: USDA (10.5 months), HHS (a little less than 10 months), and EPA (9.8 months). Three other agencies were particularly slow to make Phase 2 awards following the completion of Phase 1 awards: DOT (16.5 months), DOD (~9.5 months), and NASA (10.23 months). Timeline reductions are a key component of the SBIR’s program focus on commercialization. If companies cannot receive their awards in a timely fashion, they face significant market risk, budget shortfall/delay, and even shutdown. All agencies are encouraged to further reduce award timelines, including HHS and NSF, who were given higher prescribed upper limits on notification timelines per the current SBIR Policy Directive. Timeline reductions are a key component of the SBIR’s program focus on commercialization. If companies cannot receive their awards in a timely fashion, they face significant market risk, budget shortfall/delay, and even shutdown.
SBIR & STTR Program Annual Report FYs 2009-2011
22 | P a g e
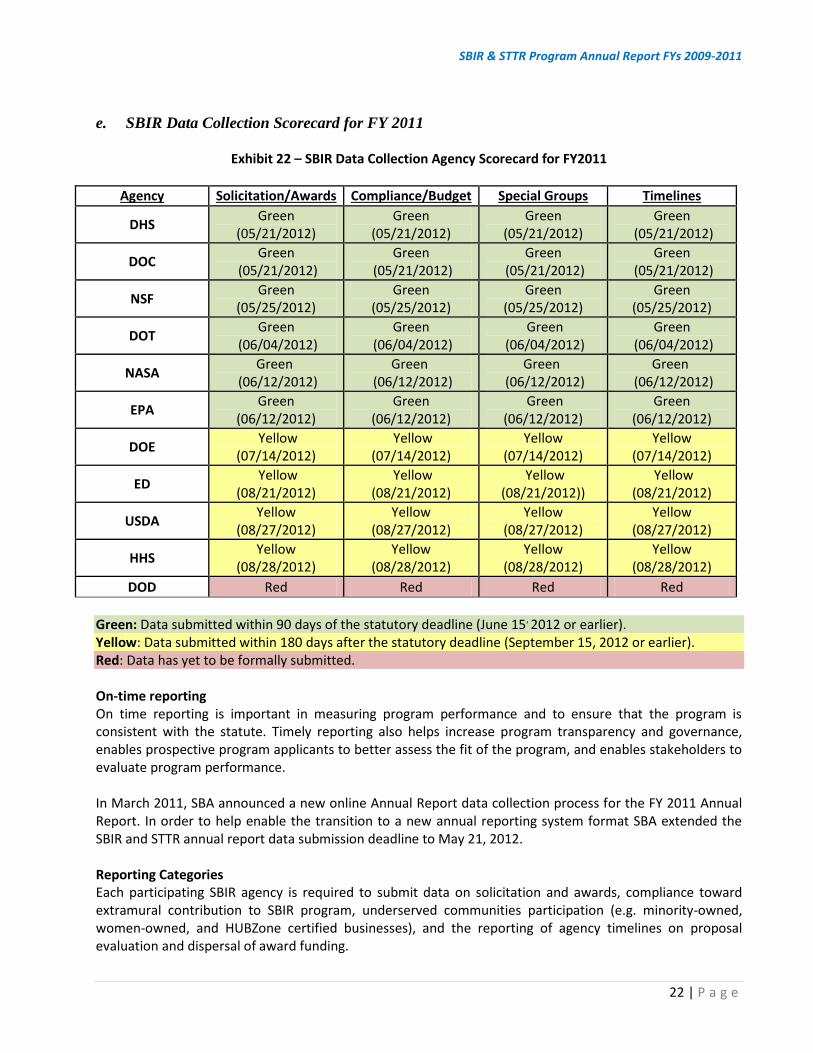
e. SBIR Data Collection Scorecard for FY 2011
Exhibit 22 – SBIR Data Collection Agency Scorecard for FY2011
Agency Solicitation/Awards Compliance/Budget Special Groups Timelines
DHS Green
(05/21/2012) Green
(05/21/2012) Green
(05/21/2012) Green
(05/21/2012)
DOC Green
(05/21/2012) Green
(05/21/2012) Green
(05/21/2012) Green
(05/21/2012)
NSF Green
(05/25/2012) Green
(05/25/2012) Green
(05/25/2012) Green
(05/25/2012)
DOT Green
(06/04/2012) Green
(06/04/2012) Green
(06/04/2012) Green
(06/04/2012)
NASA Green
(06/12/2012) Green
(06/12/2012) Green
(06/12/2012) Green
(06/12/2012)
EPA Green
(06/12/2012) Green
(06/12/2012) Green
(06/12/2012) Green
(06/12/2012)
DOE Yellow
(07/14/2012) Yellow
(07/14/2012) Yellow
(07/14/2012) Yellow
(07/14/2012)
ED Yellow
(08/21/2012) Yellow
(08/21/2012) Yellow
(08/21/2012)) Yellow
(08/21/2012)
USDA Yellow
(08/27/2012) Yellow
(08/27/2012) Yellow
(08/27/2012) Yellow
(08/27/2012)
HHS Yellow
(08/28/2012) Yellow
(08/28/2012) Yellow
(08/28/2012) Yellow
(08/28/2012)
DOD Red Red Red Red
Green: Data submitted within 90 days of the statutory deadline (June 15, 2012 or earlier). Yellow: Data submitted within 180 days after the statutory deadline (September 15, 2012 or earlier). Red: Data has yet to be formally submitted.
On-time reporting On time reporting is important in measuring program performance and to ensure that the program is consistent with the statute. Timely reporting also helps increase program transparency and governance, enables prospective program applicants to better assess the fit of the program, and enables stakeholders to evaluate program performance. In March 2011, SBA announced a new online Annual Report data collection process for the FY 2011 Annual Report. In order to help enable the transition to a new annual reporting system format SBA extended the SBIR and STTR annual report data submission deadline to May 21, 2012. Reporting Categories Each participating SBIR agency is required to submit data on solicitation and awards, compliance toward extramural contribution to SBIR program, underserved communities participation (e.g. minority-owned, women-owned, and HUBZone certified businesses), and the reporting of agency timelines on proposal evaluation and dispersal of award funding.
SBIR & STTR Program Annual Report FYs 2009-2011
23 | P a g e
Agency Reporting Performance Six agencies submitted program data within 90 days of the statutory FY 2011 annual reporting deadline: DHS, NASA, NSF, DOC, EPA, and DOT. HHS, DOE, USDA and ED submited FY 2011 annual reports between 90 to 180 days after the statutory deadline. DOD has not formally submitted an annual report to SBA. Informally, DOD reported timeline data and solicitation and award data eleven months after the statutory reporting deadline. DOD submitted draft and award data for extramural budget figures, underserved communities data, and their agency approved report data for FY 2011 in late March of 2013. Technical Difficulty Agencies experienced varying levels of difficulty with the new data reporting system. Therefore, SBA gave more flexibility to agencies beyond the regular submission deadline from March 15, 2012 to June 15, 2012 to adapt to a new annual reporting technical system. DOD, DOE, and HHS voiced objection to publishing the dates of SBIR data submission for FY2011 due to the technical difficulties they encountered with SBA’s new data reporting system. These agencies assert that the lateness in the submission of the data was attributable to technical issues, outside of the control of these agencies. In order to resolve technical issues, SBA hosted a series of conference calls with HHS and DOD, which also included SBA and DOD’s respective contractors, REI, Inc. and BRTRC.
SBIR & STTR Program Annual Report FYs 2009-2011
24 | P a g e
f. Energy Independence and Security Act of 2007 On December 19, 2007, the President signed into law the Energy Independence and Security Act of 2007 (Public Law 110-140, codified at 15 U.S.C. § 638(z)(1)-(3)), directing the SBA to:
Ensure that SBIR agencies give high priority to small business concerns that participate in or conduct energy efficiency or renewable energy system research and development projects;
Include in SBA’s annual report to Congress a determination of whether such priority is being carried out;
Consult with the heads of the agencies in determining whether such priority has been given; and
Issue guidelines and directives to assist the participating agencies in meeting these requirements. On September 3, 2008, guidelines were issued to the participating agencies for meeting these requirements. Agencies are complying with the Energy Independence and Security Act of 2007 by including energy-related priorities in SBA projects. Hundreds of projects have been funded by the agencies in the past 3 years. Below is a sample of priorities given to energy-related projects from 2009-2011:
Biomass-to-Gasoline Process
Development of cost effective and flexible desulfurization technology to clean-up biogas generated from waste streams fuels
Compact Gas-Phase Sulfur Analyzer for JP-8 Reformers
Next Generation Energy Efficient Supplemental Lighting for Plant Production
Wind Powered Water Pumping Incorporating Compressed Air Energy Storage
Conversion of Agricultural Waste into High Quality Insulation for Energy Conversion
Low Wind Speed Wind Turbine; 50- 100 Watt Wind Energy Harvesting in Light Tactical Applications
Compact, Lightweight Intelligent Cartridge for Interoperable fuel Transport
Development of GaN Substrates for High Power and Multi-Functional Devices
Nonpolar Green LEDs Based on InGaN
Roll-to-Roll Process for Transparent Metal Electrodes in OLED Manufacturing
Advanced Heat Exchanger based on 3D Woven Metal Wires
Nanofluids Enhanced Twisted Tape Heat Exchanger
Novel Ethanol Dehydration Membranes
Novel Membranes for Enhancing Value of Bio-Oil
New Fabrication Technique for Ultrathin Membranes
Roadway Waste Heat Electricity Productions Using Improved Roadway Paving Technologies
Solar Roadways
Air-Steam Hybrid: an Alternative to Internal Combustion-Cleaner
High-capacity hydrogen storage system for a fuel cell or battery hybrid power supply for electric wheelchairs and scooters
Hyper Molecular Modeling System, which allows users to interact with molecular models generated by the computational chemistry software in real time
The Virtual Physics Lab
Development of Intelligent Process Control for Thin Film Solar Panel Manufacturing
Bio-Electrochemical Systems for Ethanol Wastewater Treatment
Explore wearable power generation and distribution technologies that will power an array of body worn sensors and devices for the first responders
SBIR & STTR Program Annual Report FYs 2009-2011
25 | P a g e
Energy efficient oxygen concentrator
Rapid Hydrogen and Methane Sensors for Wireless Leak Detection
Lightweight IMM Multi-Junction Photovoltaic Flexible Blanket Assembly
Real Time Optical Control System for Thin Film Solar Cell Manufacturing
An Integrated Decision Support Framework for Sustainability CAE
Wave Energy Harvesting; Advanced Cooling and Advanced Waste Heat Recovery
Hydrogen Odorant Technology
Self Sustaining Intelligent Pavement Systems
STEM Solar Explorations platform
In addition to energy efficiency and renewal energy topics in the SBIR solicitations, other mechanisms used to give priority to energy efficiency include outreach to raise awareness of the Energy Independence and Security Act of 2007 to the small business research community through presentations, conferences, meetings, and website notices. Some websites report success stories that show the impact of the SBIR program on energy efficiency and renewable energy system technology research. For example, instructions have been included in some solicitations stating that proposals that address energy related aspects to their technology development will have a “tie-breaker” advantage. This is also stressed during outreach presentations to the small business community. One agency is also teaching students about the underlying concepts related to energy efficiency and renewable energy.
SBIR & STTR Program Annual Report FYs 2009-2011
26 | P a g e
3. STTR Program Performance
a. Introduction This section is a report on the Small Business Technology Transfer (STTR) program. This report is prepared pursuant to Public Law 102-564, the Small Business Research and Development Enhancement Act of 1992, as amended. This report describes the operation and administration of the STTR program for fiscal years (FYs) 2009-2011. It also provides data on the number of solicitations released, the number of proposals received and number of awards resulting from those solicitations. To conduct this analysis, SBA used the congressional fiscal year. For some agencies, dollar obligations may occur in future years. SBA cannot credit those future obligations to the fiscal reporting years in this report. SBA is congressionally mandated to report on all agency obligations that occur within the congressional fiscal year. Additionally, numbers reported for underserved communities come from agency-reported annual report data. As such, this represents the most accurate data for the congressional fiscal year. Nevertheless, SBA took steps to provide analysis across years in order to account for these variations. For further information, Appendix E details each agency by fiscal year. Each agency is broken down important category and respective fiscal year (e.g. Phase I, Phase II, subsequent Phase IIs, Modifications for FY08, Modifications for FY09, etc.).
b. Summary of Legislation Title I of Public Law 102-564 amended the Small Business Act by reauthorizing the Small Business Innovation Research (SBIR) program. Congress passed Title II of the Act authorizing the STTR program. The STTR program and the SBIR program share a similar philosophy. The STTR program recognizes Federally funded research and development as a base for technological innovation that will contribute to the growth and strength of the Nation’s economy. It differs from the SBIR program in that STTR awards are made to small businesses that pursue technological innovation through cooperative research and development with Federal laboratories and non-profit scientific and educational institutions. In September 1996, Public Law 104-208 reauthorized the STTR program through FY 1997. In December 1997, Public Law 105-135 reauthorized the program through September 30, 2006. In October 2001, Public Law 107-50 reauthorized the STTR program through FY 2009 and increased the program set-aside from 0.15 percent to 0.30 percent which began in FY 2004. The program was extended through continuing resolutions through FY 2011. An STTR program is mandated for agencies that have an extramural research and development (R&D) budget greater than $1 billion. As of October 1, 2011, there are 5 agenices that meet this requirement;
Department of Defense (DOD)
Department of Health & Human Services (HHS)
Department of Energy (DOE)
National Aeronautics & Space Administration (NASA)
National Science Foundation (NSF) This report highlights the performance of the STTR program as reported to SBA by the participating agencies.
SBIR & STTR Program Annual Report FYs 2009-2011
27 | P a g e
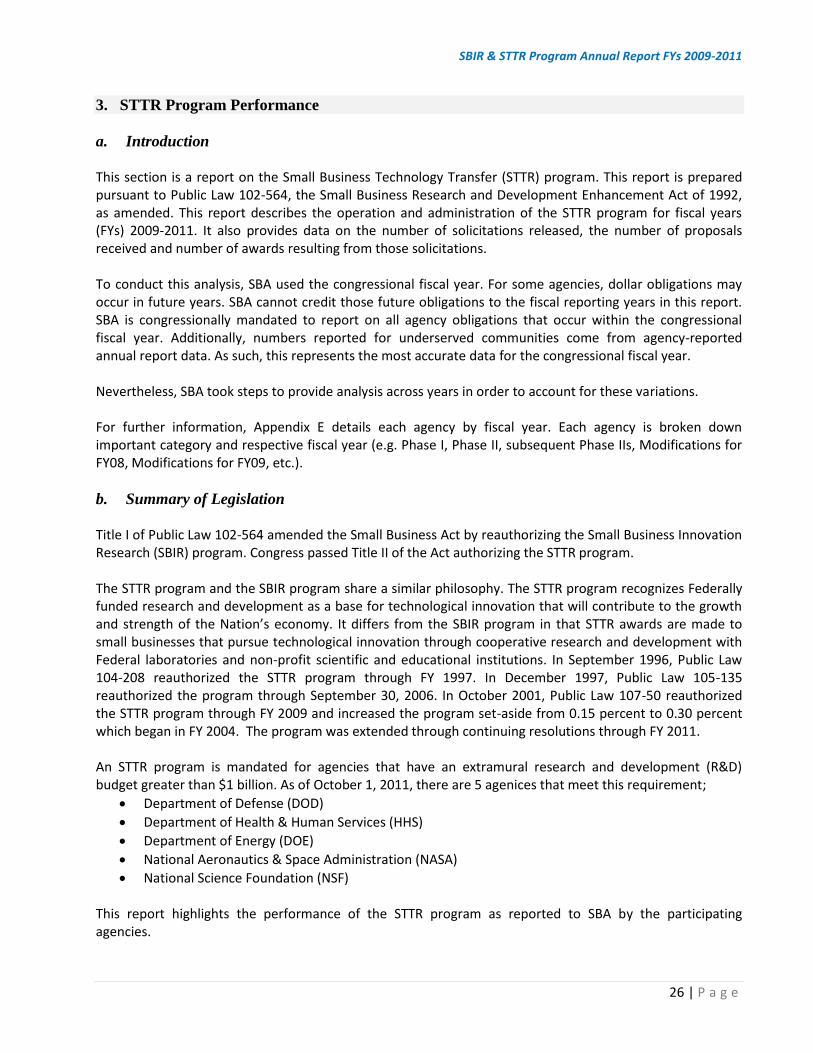
Funding levels of STTR awards modestly decreased 8.2% between FY 2009 and 2011 from $269 million to $247 million dollars per year. Similar to SBIR, approximately three quarters of dollars fund Phase II projects.
Exhibit 23 – STTR Award Amounts by Phase for FYs 2009-2011 (In thousands of $)
Agencies make approximately 769 STTR awards per year (566 for Phase 1 and 203 for Phase 2), with some year to year variation. Approximately, two thirds of the total awards made are to smaller sized Phase 1 awards. Generally, the number of STTR awards ranges between 700-900 awards annually.
Exhibit 24 – STTR Award Number by Phase for FYs 2009-2011
SBIR & STTR Program Annual Report FYs 2009-2011
28 | P a g e
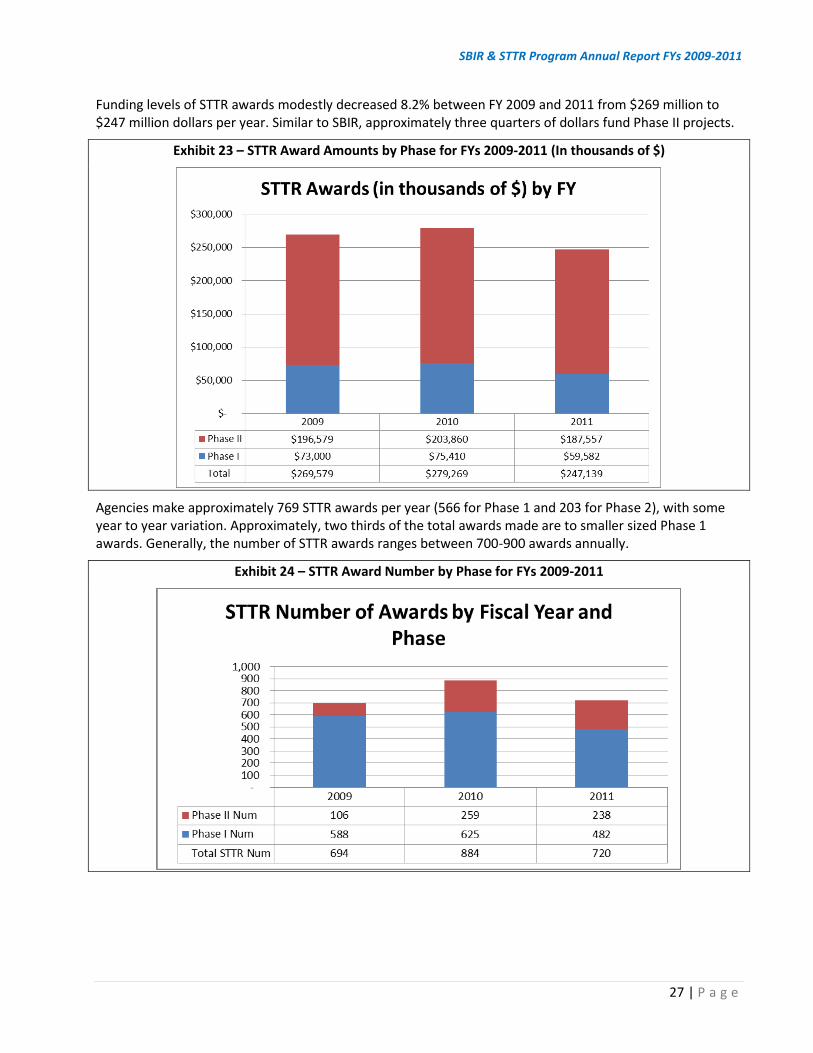
In terms of agency composition, 51% of STTR award dollars originate with DOD, 31% with HHS, while DOE, NASA, and NSF each contribute 6% of STTR award dollars.
Exhibit 25 – Distribution of Total STTR Award Dollars for FYs 2009-2011
(Average Yearly Obligation Award = $265.3 million)
The STTR average award size tends to vary by agency. While all other agencies maintained average award sizes below the award size guidelines, HHS awards were significantly higher.
Exhibit 26 – STTR Average Award Size FYs 2009-2011 Overall and by Agency*
*DOE submitted comments describing that their Phase I Avg Size was $99.912 and Phase II Average Size was $740,722
6% 6%
31%
6%
51%
Distribution of STTR Award Dollars for FYs 2009-2011
NSF
NASA
HHS
DOE
SBIR & STTR Program Annual Report FYs 2009-2011
29 | P a g e
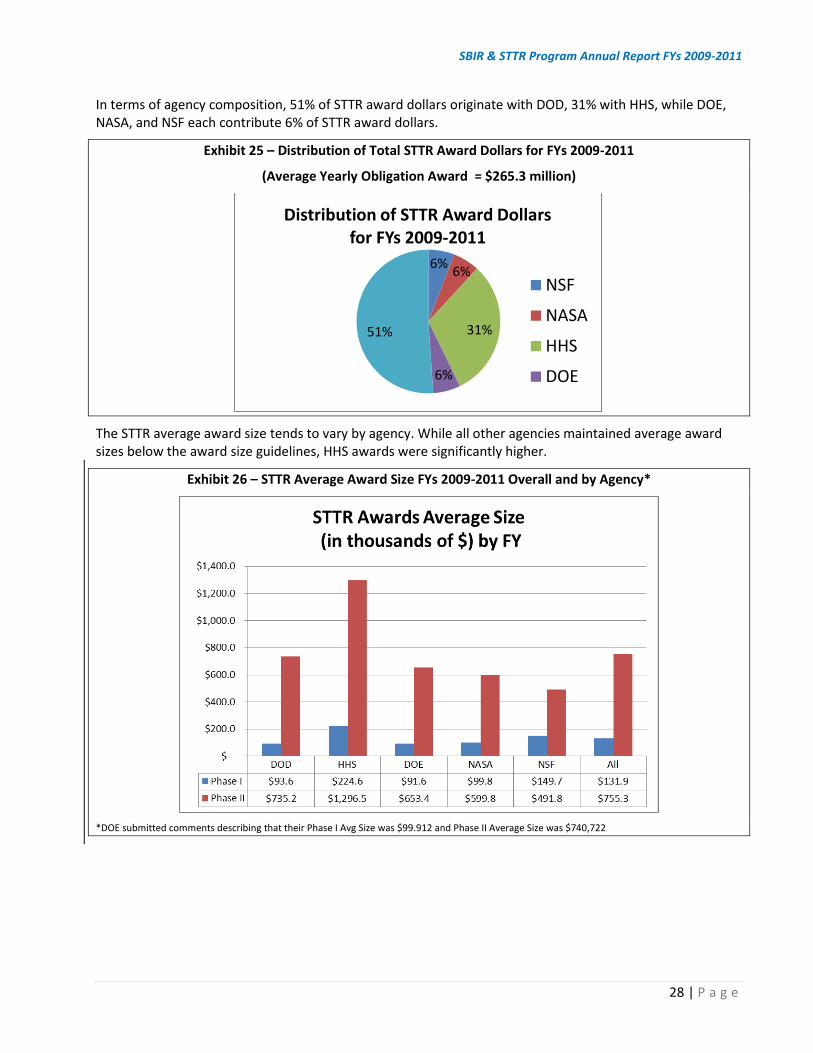
c. Solicitations and Proposal Acceptance Rates The number of solicitations and topics vary from year to year. From 2009 –z 2011, in aggregate, agencies on average issued 6 solicitations each year with an average of 310 topics. Over the past three years, 18 solicitations have been issued with an average of 57 topics per solicitation.
Exhibit 27 – STTR Solicitations and Topics FYs
2009 – 2011
Number of Solicitations
Number of Topics
2009 6 353
2010 6 350
2011 6 331
To get a better sense of the makeup of these solicitations, we look at the average number of solicitations per year over the past three years. DOD has 2 solicitations per year while DOE, HHS, NASA, and NSF each has one.
Exhibit 28 – Agencies Grouped By Average Number of Solicitations Per Year between FYs 2009 – 2011
# of Solicitations Agencies
1 HHS, DOE, NASA, NSF
2 DOD
Agency Avg 1.2
As shown in the table below, the average number of topics has decreased from 70.6 per agency in 2009 to 44.8 per agency in 2011. As DOD accounts for about one third of the topics, a decrease in DOD topics affects the overall total and average of all topics issued that fiscal year.
Exhibit 29 – STTR Topics by Year from FYs 2009 – 2011
DOD HHS DOE NASA NSF Avg Total
2009 123 153 66 10 1 70.6 353
2010 126 68 68 10 1 70 350
2011 111 139 71 10 1 44.8 224
SBIR & STTR Program Annual Report FYs 2009-2011
30 | P a g e
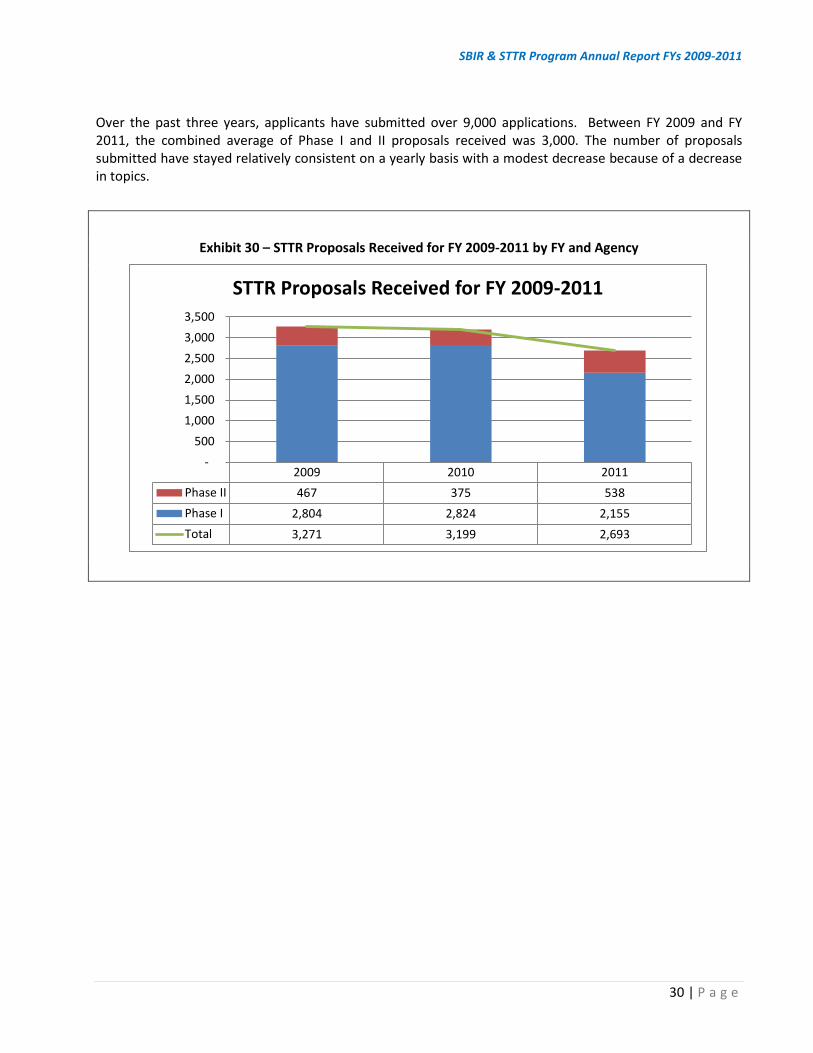
Over the past three years, applicants have submitted over 9,000 applications. Between FY 2009 and FY 2011, the combined average of Phase I and II proposals received was 3,000. The number of proposals submitted have stayed relatively consistent on a yearly basis with a modest decrease because of a decrease in topics.
Exhibit 30 – STTR Proposals Received for FY 2009-2011 by FY and Agency
2009 2010 2011
Phase II 467 375 538
Phase I 2,804 2,824 2,155
Total 3,271 3,199 2,693
-
500
1,000
1,500
2,000
2,500
3,000
3,500
STTR Proposals Received for FY 2009-2011
SBIR & STTR Program Annual Report FYs 2009-2011
31 | P a g e
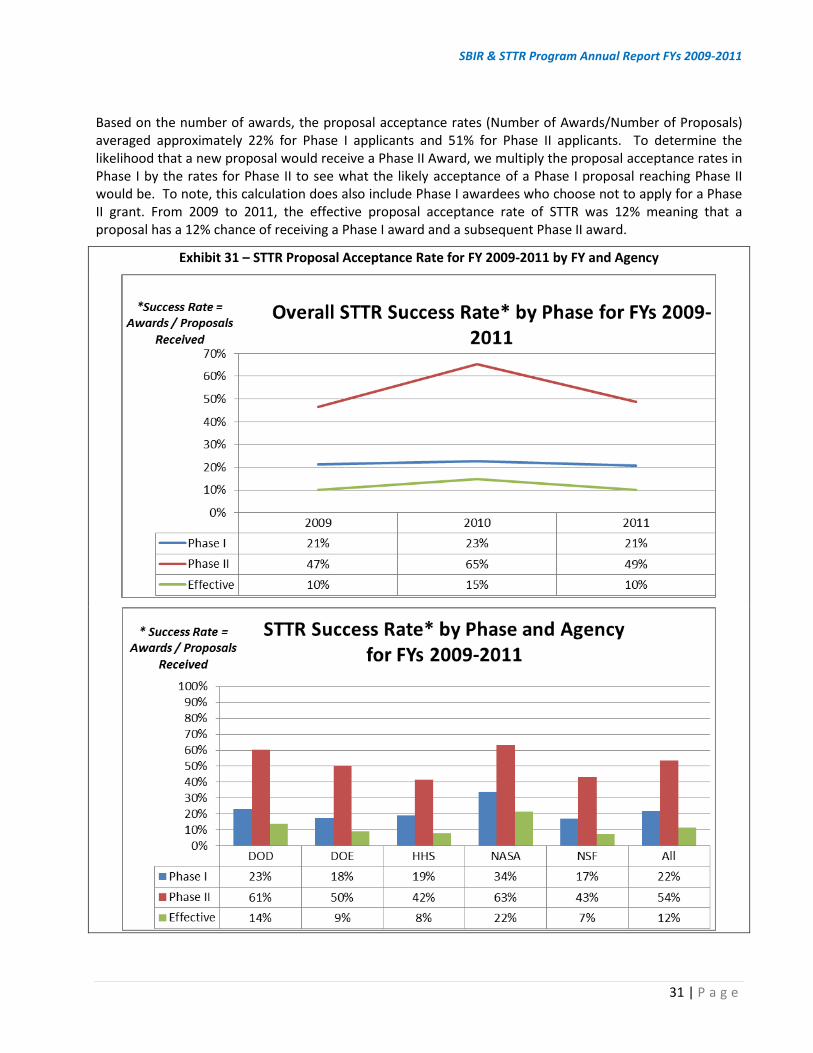
Based on the number of awards, the proposal acceptance rates (Number of Awards/Number of Proposals) averaged approximately 22% for Phase I applicants and 51% for Phase II applicants. To determine the likelihood that a new proposal would receive a Phase II Award, we multiply the proposal acceptance rates in Phase I by the rates for Phase II to see what the likely acceptance of a Phase I proposal reaching Phase II would be. To note, this calculation does also include Phase I awardees who choose not to apply for a Phase II grant. From 2009 to 2011, the effective proposal acceptance rate of STTR was 12% meaning that a proposal has a 12% chance of receiving a Phase I award and a subsequent Phase II award.
Exhibit 31 – STTR Proposal Acceptance Rate for FY 2009-2011 by FY and Agency
SBIR & STTR Program Annual Report FYs 2009-2011
32 | P a g e
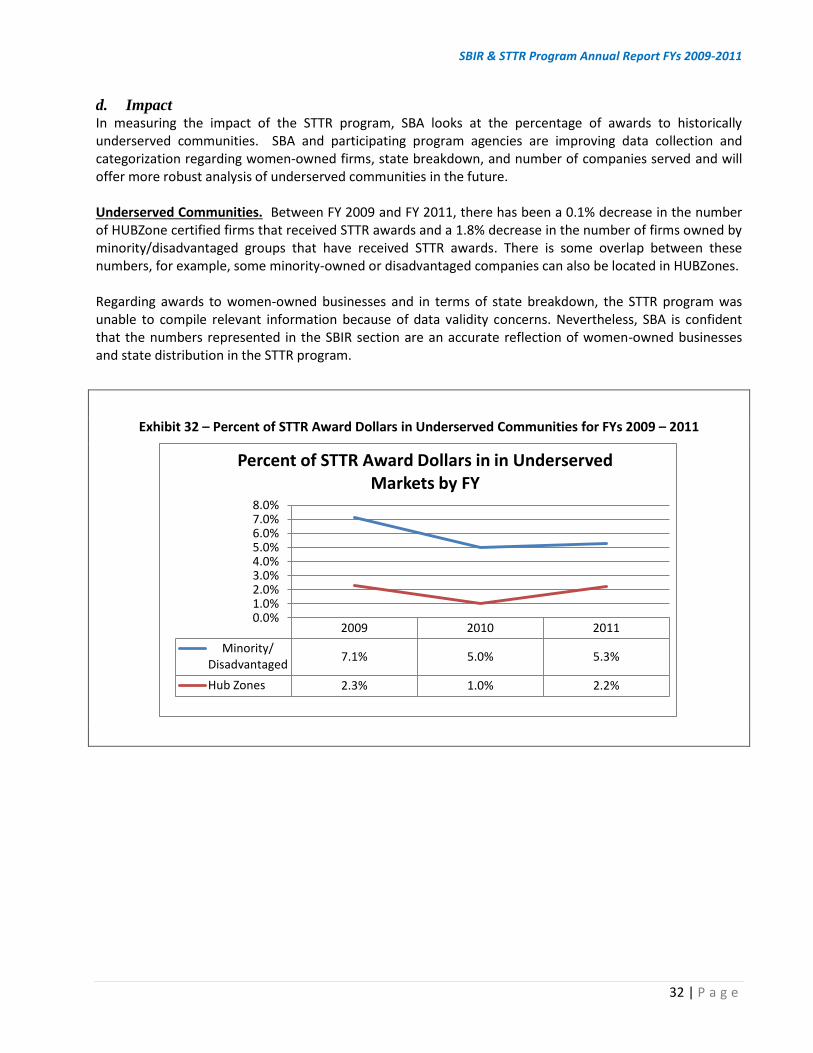
d. Impact In measuring the impact of the STTR program, SBA looks at the percentage of awards to historically underserved communities. SBA and participating program agencies are improving data collection and categorization regarding women-owned firms, state breakdown, and number of companies served and will offer more robust analysis of underserved communities in the future. Underserved Communities. Between FY 2009 and FY 2011, there has been a 0.1% decrease in the number of HUBZone certified firms that received STTR awards and a 1.8% decrease in the number of firms owned by minority/disadvantaged groups that have received STTR awards. There is some overlap between these numbers, for example, some minority-owned or disadvantaged companies can also be located in HUBZones. Regarding awards to women-owned businesses and in terms of state breakdown, the STTR program was unable to compile relevant information because of data validity concerns. Nevertheless, SBA is confident that the numbers represented in the SBIR section are an accurate reflection of women-owned businesses and state distribution in the STTR program.
Exhibit 32 – Percent of STTR Award Dollars in Underserved Communities for FYs 2009 – 2011
2009 2010 2011
Minority/Disadvantaged
7.1% 5.0% 5.3%
Hub Zones 2.3% 1.0% 2.2%
0.0%1.0%2.0%3.0%4.0%5.0%6.0%7.0%8.0%
Percent of STTR Award Dollars in in Underserved Markets by FY
SBIR & STTR Program Annual Report FYs 2009-2011
33 | P a g e
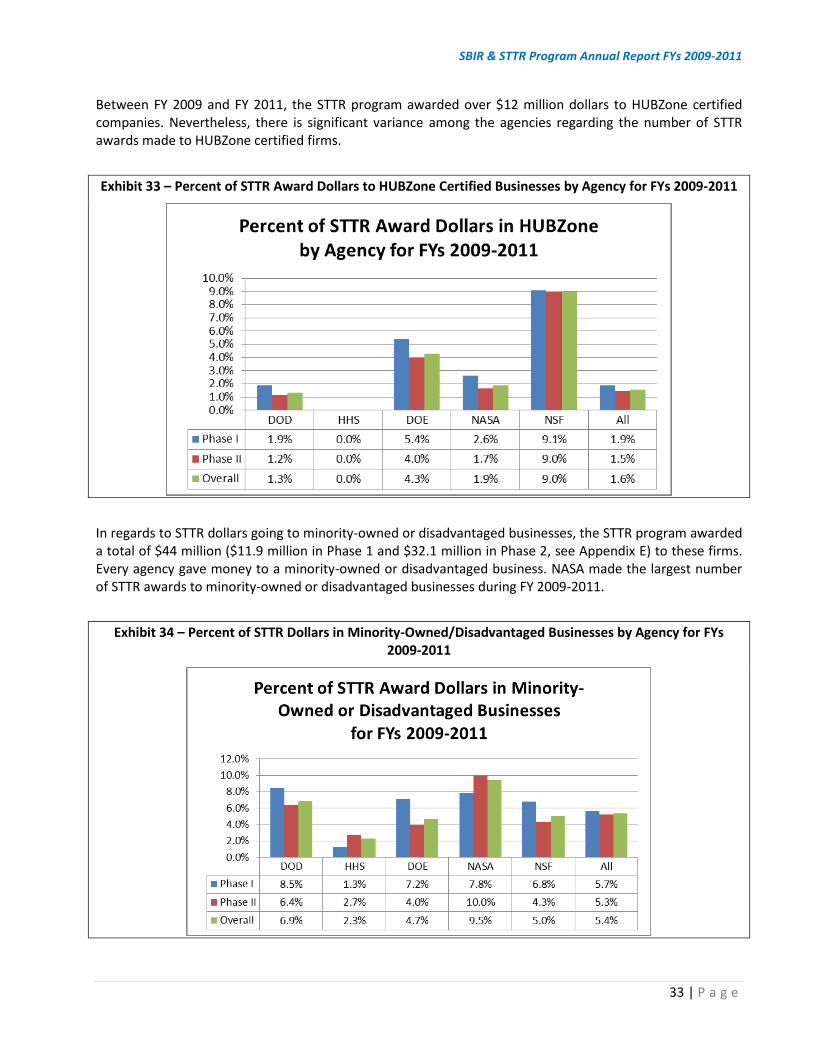
Between FY 2009 and FY 2011, the STTR program awarded over $12 million dollars to HUBZone certified companies. Nevertheless, there is significant variance among the agencies regarding the number of STTR awards made to HUBZone certified firms.
Exhibit 33 – Percent of STTR Award Dollars to HUBZone Certified Businesses by Agency for FYs 2009-2011
In regards to STTR dollars going to minority-owned or disadvantaged businesses, the STTR program awarded a total of $44 million ($11.9 million in Phase 1 and $32.1 million in Phase 2, see Appendix E) to these firms. Every agency gave money to a minority-owned or disadvantaged business. NASA made the largest number of STTR awards to minority-owned or disadvantaged businesses during FY 2009-2011.
Exhibit 34 – Percent of STTR Dollars in Minority-Owned/Disadvantaged Businesses by Agency for FYs 2009-2011
SBIR & STTR Program Annual Report FYs 2009-2011
34 | P a g e
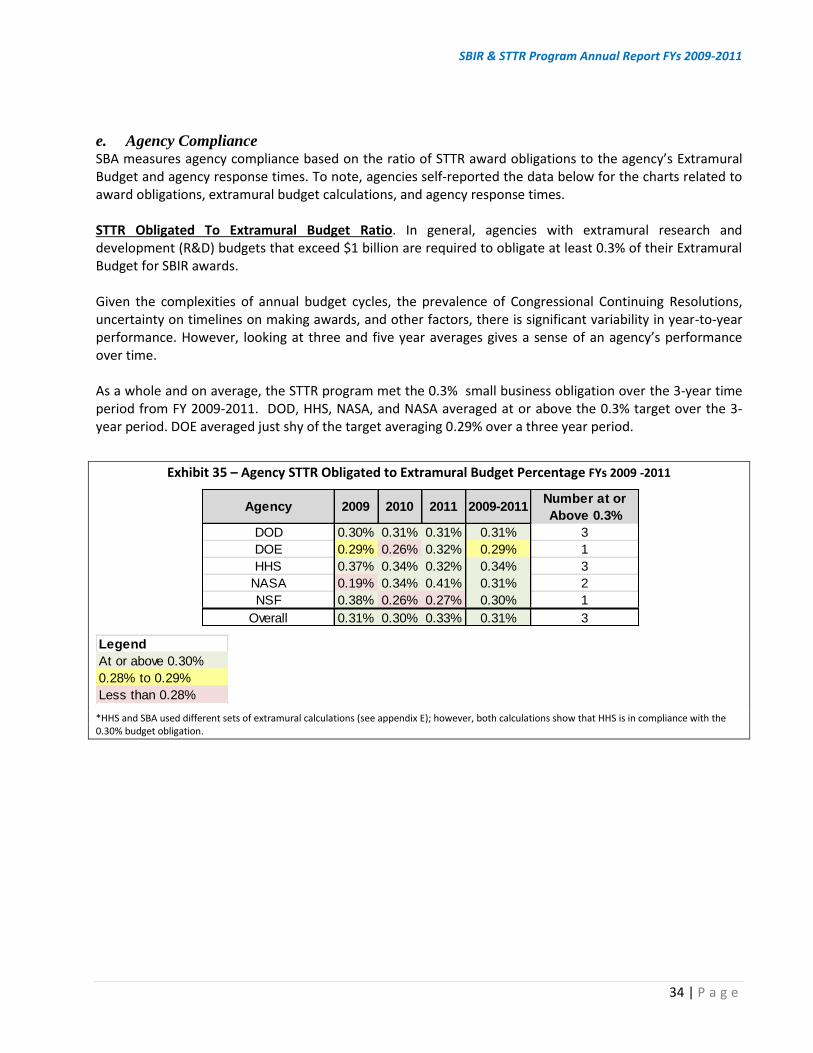
e. Agency Compliance SBA measures agency compliance based on the ratio of STTR award obligations to the agency’s Extramural Budget and agency response times. To note, agencies self-reported the data below for the charts related to award obligations, extramural budget calculations, and agency response times. STTR Obligated To Extramural Budget Ratio. In general, agencies with extramural research and development (R&D) budgets that exceed $1 billion are required to obligate at least 0.3% of their Extramural Budget for SBIR awards. Given the complexities of annual budget cycles, the prevalence of Congressional Continuing Resolutions, uncertainty on timelines on making awards, and other factors, there is significant variability in year-to-year performance. However, looking at three and five year averages gives a sense of an agency’s performance over time. As a whole and on average, the STTR program met the 0.3% small business obligation over the 3-year time period from FY 2009-2011. DOD, HHS, NASA, and NASA averaged at or above the 0.3% target over the 3-year period. DOE averaged just shy of the target averaging 0.29% over a three year period.
Exhibit 35 – Agency STTR Obligated to Extramural Budget Percentage FYs 2009 -2011
*HHS and SBA used different sets of extramural calculations (see appendix E); however, both calculations show that HHS is in compliance with the 0.30% budget obligation.
Agency 2009 2010 2011 2009-2011Number at or
Above 0.3%
DOD 0.30% 0.31% 0.31% 0.31% 3
DOE 0.29% 0.26% 0.32% 0.29% 1
HHS 0.37% 0.34% 0.32% 0.34% 3
NASA 0.19% 0.34% 0.41% 0.31% 2
NSF 0.38% 0.26% 0.27% 0.30% 1
Overall 0.31% 0.30% 0.33% 0.31% 3
Legend
At or above 0.30%
0.28% to 0.29%
Less than 0.28%
SBIR & STTR Program Annual Report FYs 2009-2011
35 | P a g e
f. Energy Independence and Security Act of 2007 On December 19, 2007, the President signed into law the Energy Independence and Security Act of 2007 (Public Law 110-140 codified at 15 U.S.C. §638(z) (1)-(3)), directing the SBA to:
Ensure that STTR agencies give high priority to small business concerns that participate in or conduct energy efficiency or renewable energy system research and development projects;
Include in SBA’s annual report to Congress a determination of whether such priority is being carried out;
Consult with the heads of the agencies in determining whether such priority has been given; and
Issue guidelines and directives to assist the participating agencies in meeting these requirements. On September 3, 2009, guidelines were issued to the participating agencies for meeting the requirements. The STTR program solicitations have included energy efficiency or renewable energy topics. Some of those topics or technology areas are:
Contaminate Removal for Laboratory Pharmaceutical Synthesis
Portable Photoacoustic Microscopy
Compact Lightweight Intelligent Cartridge for Interoperable Fuel Transport
Heat Actuated Cooling System
High Power and Capacity Anode for Thermal Battery
Spinning Inertia Energy Scavenger by Thin-Film Alternator
Standardized Ultraportable Rugged Fuel-Cell Automated Carrier Equipment
Cathode Improvements for Thermal Batteries
Hybrid Harvesting Energy for Wireless Sensor Networks
Solar Refrigeration
Thin Film Thermal Batteries
Solid State Lighting
Core Technology for Organic Light Emitting Diodes
Energy Efficient Membranes
Selective Catalytic Conversion of Fossil Feedstocks
Biomass Deconstruction and Catalytic Conversion to Fuels
Nanotechnology Applications in Electronics, Sensors, and Controls
Technologies to Assess the Behavior of a Lithium-Ion Cell Containing and Internal Short Circuit
Process Heat Transfer Enhancement
High Intensity Discharge Lamps
Biomass Densification
Advanced Hydropower Systems
Advanced Exploration Technologies for Hidden Geothermal Resources
Hydrogen Home Fueling System
High Efficiency Organic or Sensitized Photovoltaic Cells
Development of Hydrogen/Halogen Fuel Cell Technology Renewable Based-Energy Storage
Advanced Materials for High Energy Density Electrochemical Capacitors, and Next Generation Ultra-Low Power Microprocessor Design
Advanced Electrodes and Electrolytes for Improved Energy Density and Safety Lithium-Ion Batteries
CO2 Harvesting and Mobile Production of Liquid Fuel (CHAMP-Fuel)
Bright White Tandem OLED with Carbon Nanotube Hole Injecting Interlayer
Self-Assembled Rare Earth Doped Nanostructured Metal Aluminate Phosphors
SBIR & STTR Program Annual Report FYs 2009-2011
36 | P a g e
Novel High Performance Permeation Barrier for Long Lifetime Flexible OLED Lighting
Rapid Hydrogen and Methane Sensors for Wireless Leak Detection
Lightweight IMM Multi-Junction Photovoltaic Flexible Blanket Assembly
Real Time Optical Control System for Thin Film Solar Cell Manufacturing
Oxidation Resistant Carbon Supports For Fuel Cells
Bright White Tandem OLED with Carbon Nanotube Hole Injecting Interlayer
Self-Assembled Rare Earth Doped
Nanostructured Metal Aluminate Phosphors
In addition to energy efficiency and renewable energy topics in the STTR solicitations, other mechanisms used to give priority to energy efficiency include outreach to raise awareness of the Energy Independence and Security Act of 2007 to the small business research community through presentations, conferences, meetings, and website notices.
SBIR & STTR Program Annual Report FYs 2009-2011
37 | P a g e
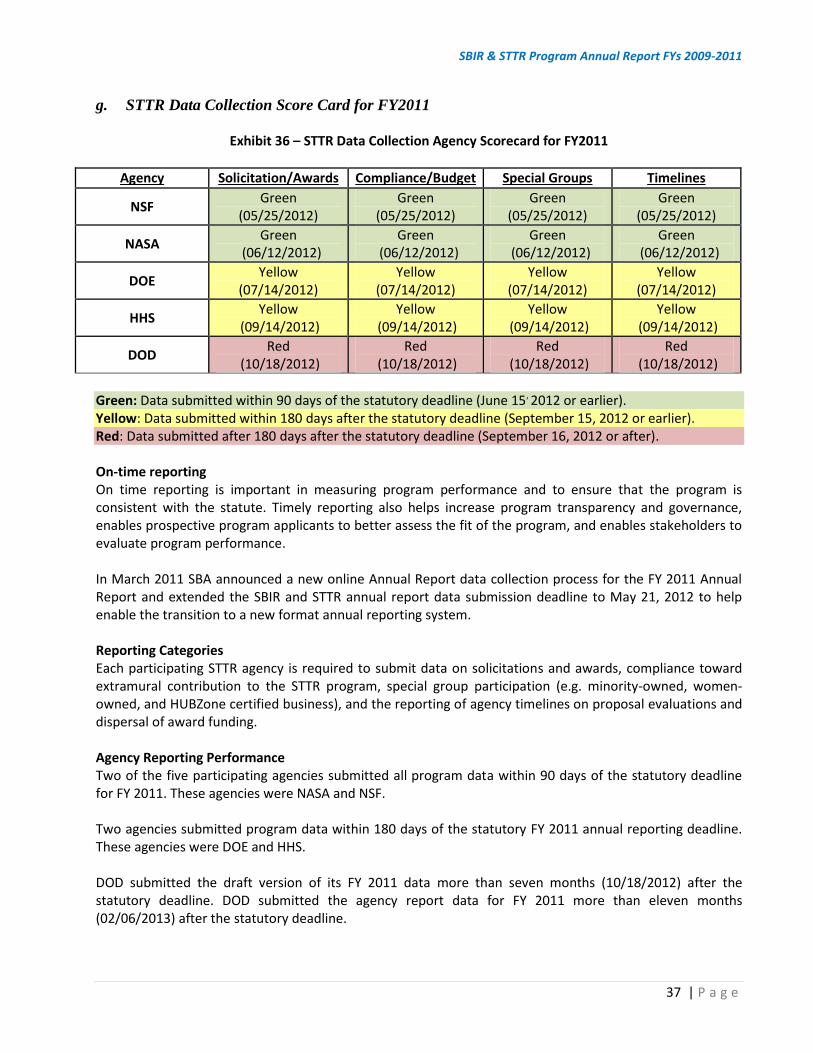
g. STTR Data Collection Score Card for FY2011
Exhibit 36 – STTR Data Collection Agency Scorecard for FY2011
Agency Solicitation/Awards Compliance/Budget Special Groups Timelines
NSF Green
(05/25/2012) Green
(05/25/2012) Green
(05/25/2012) Green
(05/25/2012)
NASA Green
(06/12/2012) Green
(06/12/2012) Green
(06/12/2012) Green
(06/12/2012)
DOE Yellow
(07/14/2012) Yellow
(07/14/2012) Yellow
(07/14/2012) Yellow
(07/14/2012)
HHS Yellow
(09/14/2012) Yellow
(09/14/2012) Yellow
(09/14/2012) Yellow
(09/14/2012)
DOD Red
(10/18/2012) Red
(10/18/2012) Red
(10/18/2012) Red
(10/18/2012)
Green: Data submitted within 90 days of the statutory deadline (June 15, 2012 or earlier). Yellow: Data submitted within 180 days after the statutory deadline (September 15, 2012 or earlier). Red: Data submitted after 180 days after the statutory deadline (September 16, 2012 or after). On-time reporting On time reporting is important in measuring program performance and to ensure that the program is consistent with the statute. Timely reporting also helps increase program transparency and governance, enables prospective program applicants to better assess the fit of the program, and enables stakeholders to evaluate program performance. In March 2011 SBA announced a new online Annual Report data collection process for the FY 2011 Annual Report and extended the SBIR and STTR annual report data submission deadline to May 21, 2012 to help enable the transition to a new format annual reporting system. Reporting Categories Each participating STTR agency is required to submit data on solicitations and awards, compliance toward extramural contribution to the STTR program, special group participation (e.g. minority-owned, women-owned, and HUBZone certified business), and the reporting of agency timelines on proposal evaluations and dispersal of award funding. Agency Reporting Performance Two of the five participating agencies submitted all program data within 90 days of the statutory deadline for FY 2011. These agencies were NASA and NSF. Two agencies submitted program data within 180 days of the statutory FY 2011 annual reporting deadline. These agencies were DOE and HHS. DOD submitted the draft version of its FY 2011 data more than seven months (10/18/2012) after the statutory deadline. DOD submitted the agency report data for FY 2011 more than eleven months (02/06/2013) after the statutory deadline.
SBIR & STTR Program Annual Report FYs 2009-2011
38 | P a g e
Technical Difficulty Agencies experienced varying levels of difficulty with the new data reporting system. SBA gave more flexibility to agencies beyond the regular submission deadline from March 15, 2012 to June 15, 2012 to adapt to a new annual reporting technical system. DOD, DOE, and HHS voiced objection to publishing the dates of STTR data submission for FY2011 due to the technical difficulties they encountered with SBA’s new data reporting system. These agencies assert that the lateness in the submission of the data was attributable to technical issues, outside of the control of these agencies. In order to resolve technical issues, SBA hosted a series of conference calls with HHS and DOD, which also included SBA and DOD’s respective contractors, REI, Inc. and BRTRC.
SBIR & STTR Program Annual Report FYs 2009-2011
39 | P a g e
4. Key Initiatives
a. TechNet The role of the SBA is to oversee and coordinate the efforts of the eleven participating agencies in the SBIR/STTR program. SBA coordinates the solicitation schedules at the participating agencies, collects and maintains the data required to assess the SBIR/STTR program and reports to the U.S. Congress about the programs. SBA’s core reporting responsibilities are reporting the number of awards, amount of money spent, and the performance of participating agencies in meeting minimum small business set aside thresholds. The purpose of the investment in TechNet is to the meet statutory reporting requirements through an enhanced TechNet database and development of the SBIR.gov portal, which provide a central repository for interested stakeholders to learn about the SBIR program and solicitations and to provide value for companies in Phases I-III of the program. The SBIR/STTR system provides a secure web based electronic system for the collection of Phase I and Phase II award information, company information and Non-Awardee information, as mandated by the U.S. Congress. In the future, the platform is also expected to collect and host proposals, company applications, Commercialization Phase III information, and to provide transparency to mitigate fraud, waste and abuse within the program. The upgrades to TechNet will help SBA and participating agencies improve SBIR operations and reporting of commercialization outcomes. The enhanced TechNet system closes many performance gaps in the SBIR/STTR program, including the ability to collect and maintain data that is required to assess the SBIR/STTR program and report information to the U.S. Congress. Before the investment in TechNet, the SBA SBIR program collected much of its information by paper and the program office was unable to reconcile the paper-based annual reports submitted by Agencies with the information entered into TechNet. The enhanced TechNet investment has created a centralized place to collect, catalogue, and display program metrics for public and internal use. Additionally, the transfer and enhancement of SBIR.gov from NSF to SBA continues to drive enhanced public outreach about the program. The SBIR.gov portal provides:
The ability to segment visitors into roles and create targeted splash/landing pages based on visitors' interests and needs: Applicant, Awardees, Investor, Large Business Concern, SBIR/STTR Agencies, Other Interested Citizens;
Provide web-based outreach tools to users, such as conference listings and registration links, agency information and links, and blogging; and
Provide an area for identifying Licensing Opportunities for investors and entrepreneurs The SBIR/STTR program was reauthorized through 2017 by the U.S. Congress in December 2011 as part of the National Defense Authorization Act of 2012. SBA is focused on implementing the reauthorization and translating the statute into more detailed regulations and directives that will govern how the program will work and be administered. There are two governing bodies of rules for SBIR/STTR that need to be modified before all the changes can take effect: (1) SBA size and eligibility regulations and (2) SBIR/STTR policy directives. These are broader SBA regulations that define what constitutes a small business and the eligibility requirements for the SBIR/STTR programs. The reauthorization modified the requirements for venture capital participation, domestic ownership and affiliation as related to the SBIR/STTR programs. Minor enhancements to the TechNet system will be made to accommodate these changes.
SBIR & STTR Program Annual Report FYs 2009-2011
40 | P a g e
Additional enhancements are planned as a result of the SBIR reauthorization. Key changes include, but are not limited to:
More support for commercialization efforts and enhanced provisions for Phase III transitions;
Greater reporting from agencies to increase accountability in the program; and
Stronger measures to prevent fraud, waste, and abuse in the program. The investment objectives continue to support the new SBIR policy directives and enhancements. Additionally, benchmarks will be established to measure the effectiveness of these changes. The system will support the gathering of statutorily required information from both applicants and agencies, and support the new measures put in place to address fraud, waste and abuse.
b. Tibbetts/Hall of Fame Awards Named after Roland Tibbetts, the pioneer of SBIR program, Tibbetts Awards are presented to companies and individuals from all over the United States who are beacons of promise and models of excellence for achieving commercial success through the SBIR program. The Tibbetts Award winners are selected based on the economic impact of their technological innovation, and on whether they have met federal research and development needs, encouraged diverse participation in technological innovation, and increased the commercialization of federal research. In addition, the Hall of Fame award recognizes companies that have an extended period of extraordinary success of research, innovation, and product commercialization. SBA brought the Tibbetts and Hall of Fame Awards back from hiatus and began collecting nominations for 2011. On February 15, 2011, forty-four small businesses and eight individuals were honored for the critical role that they play in research and development for the government and for their success in driving innovation and creating new jobs. The complete list of Tibbetts Award winners can be found at: http://sbir.gov/news/2011-tibbetts-awards-ceremony The SBA also presented eight Hall of Fame awards to companies with extraordinary records of accomplishments through the SBIR program over the past thirty years. Award winners include:
A123 Systems – Westborough, MA
Advanced Ceramics Research (BAE Systems) – Tucson, AZ
ATMI – Danbury, CT
ROBOT Corp. – Bedford, MA
MARTEK Corp. – Columbia, MD
Qualcomm, Inc. – San Diego, CA
Symantec – Mountain View, CA
ViaSat, Inc. – Carlsbad, CA
SBIR & STTR Program Annual Report FYs 2009-2011
40 | P a g e
c. Program Effectiveness and Leveraging Best Practices The SBA announced a series of improvements in the fall of 2010 to increase the effectiveness and efficiency of the overall program. The initiatives center on leveraging best practices among existing agencies, as well as implementing broader Administration priorities such as increasing transparency. Some of the key initiatives include: building a unified web portal; establishing intramural technology transfer topics; expanding bridge financing programs; implementing and publishing performance management metrics; decreasing timelines to award; and releasing joint solicitations between agencies. The purpose of these changes was to make the program more entrepreneur-friendly and to ensure that entrepreneurs have the support they need to do what they do best – innovate and create jobs. By leveraging best practices among the 11 agencies who participate in the SBIR program and strengthening performance measurements to ensure effective operation government wide, these key initiatives will produce better results for the program. To increase program effectiveness and help agencies share best practices, SBA focused on:
• Unified web portal and performance management – SBA launched the SBIR.gov/Tech-Net public
facing website on August 1, 2011 and launched the Government database in fall 2011. More details are in the Tech-Net section of this report.
• Performance management framework – Previously, there was not a comprehensive method to
measure performance across the SBIR agencies against the program’s statutory goals. SBA is working to develop a set of measures that will be useful indicators of SBIR program performance that will focus on commercialization of awardees, the existence and treatment of repeat-award winners, and the timeliness of award milestones. The performance management indicators have been drafted and reviewed by Agencies through multiple drafts. The data will be collected through Tech-Net and the Annual Report.
• Intramural technology transfer topics – There exists a great potential for SBIR programs to fund targeted innovations leading to the advancement of federal intramural lab technologies and enhancing small business commercialization prospects. By using the SBIR open competition model, the small businesses that are most suited to conduct the required follow-on research to fully exploit the federal technologies will be identified and supported toward that end. SBIR agencies will seek to replicate the NIST model of using the SBIR program as a platform for intramural technology transfer. In spring 2011, at least 8 new solicitation topics by 3 agencies were provided on intramural technologies for technology transfer. This is in addition to the NIST program.
• Bridge financing program – Companies coming out of the SBIR program frequently find fundraising difficult – the frequently cited “Valley of Death”. This initiative will look to expand successful “bridge financing” programs launched at several agencies. These programs provide supplemental funding to Phase II awardees, based on a match with private investment. These efforts more fully leverage SBIR dollars and increase the alignment with the private sector.
• Timelines between the close of the solicitation and award – One of the most challenging aspects
has been to drive down timelines between the close of the solicitation and the issuance of an award. From the perspective of SBIR applicants, if the time from application to award takes too long it discourages potential applicants. This effort focuses on: (1) agencies committing to dramatically
SBIR & STTR Program Annual Report FYs 2009-2011
41 | P a g e
improving cycle times; (2) publishing the timeline data to encourage accountability and transparency; and (3) sharing best practices and making policy changes to shorten the timelines. To address this challenge, SBA has been looking at other programs like the Qualifying Therapeutic Discovery Project Program under the Internal Revenue Service (IRS) with assistance from the National Institutes of Health (NIH), as a model for improving efficiency. At some agencies, more training and education of contracting and granting officers from within the SBIR program offices regarding award processing may be necessary. In Appendix F, we have collected and documented the timelines for parts of the SBIR process at agencies.
Joint Solicitations- The path for identifying SBIR/STTR funding opportunities and other information is inefficient, cumbersome and often intimidating to entrepreneurs. Moreover, many topics cross-cut many (often all) agencies; yet, small business applicants are not aware of these topic similarities. Consequently, opportunities for entrepreneurs may be missed. SBA used SBIR.gov to market a joint-agency SBIR Funding Opportunity Announcement (FOA) focused on robotics that cross-cuts several SBIR agencies led by NIH, and with cooperation and cooperation from NSF, DARPA, USDA, and DHS. Many agencies participated in this joint solicitation. This joint solicitation had a total of 20 Phase I SBIR awards (3 DARPA/DoD, 3 DHS, 9 NIH, 3 NSF, 2 USDA) for a total of $2,182,318. Out of that number, 16 solicitiations were funded in FY11 for $1,602,792 (3 DARPA, 3 DHS, 8 NIH, 2 USDA) and 4 were funded in FY12 for $579,526 (1 NIH, 3 NSF). See here for more information on the Joint Robotics SBIR PAR-10-279: http://grants.nih.gov/grants/guide/pa-files/PAR-10-279.html .
SBIR & STTR Program Annual Report FYs 2009-2011
42 | P a g e
5. Appendix A – Geographic SBIR Award Data for FYs 2009-2011
State Award Amount Award Number State Award Amount Award Number
Top 10 Remainder
1 CA 1,281,320,132$ 3,876 26 UT 50,844,376$ 151
2 MA 849,779,977$ 2,419 27 TN 48,440,475$ 141
3 VA 384,043,021$ 1,251 28 MO 40,456,882$ 138
4 NY 360,429,019$ 939 29 KY 36,519,061$ 88
5 MD 336,656,477$ 910 30 SC 31,012,700$ 86
6 CO 307,000,289$ 916 31 MT 29,308,617$ 88
7 PA 253,557,711$ 752 32 DE 28,331,523$ 102
8 TX 252,742,114$ 853 33 HI 25,628,255$ 85
9 OH 248,698,639$ 769 34 AR 25,246,626$ 88
10 NJ 185,796,445$ 508 35 OK 25,084,028$ 48
36 RI 23,395,384$ 51
Next 15 37 IA 19,226,177$ 59
11 MI 182,778,583$ 485 38 VT 17,063,204$ 51
12 FL 163,172,920$ 510 39 NE 14,963,181$ 41
13 NC 155,365,623$ 356 40 LA 14,804,941$ 38
14 WA 146,079,507$ 393 41 ME 14,161,259$ 58
15 IL 141,997,549$ 429 42 NV 13,798,301$ 52
16 AL 130,986,326$ 419 43 KS 13,631,742$ 52
17 AZ 125,722,906$ 408 44 ID 11,741,753$ 43
18 OR 115,795,290$ 249 45 WV 11,526,321$ 34
19 CT 102,755,929$ 323 46 WY 8,366,844$ 36
20 WI 98,688,448$ 216 47 MS 8,007,480$ 32
21 NH 86,250,644$ 251 48 ND 6,888,600$ 13
22 NM 85,968,708$ 280 49 DC 6,760,455$ 23
23 MN 79,996,100$ 240 50 SD 2,641,970$ 13
24 GA 76,998,618$ 228 51 AK 2,019,222$ 7
25 IN 64,732,506$ 218 52 PR 649,947$ 3
53 FM 85,200$ 1
Grand Total 6,747,918,007$ 19,820
SBIR & STTR Program Annual Report FYs 2009-2011
43 | P a g e
6. Appendix B – Extramural Budget Calculation for FY2011 Below are extramurural budget calculations provided directly from participating SBIR and STTR agencies. The comprehensiveness of these budget explanations vary widely. SBA will work with participating agencies to gain greater clarity and transparency on how these budget calculations are computed. Department of Defense: The methodology used for calculating the amount of the extramural budget is as follows: Total Component RDT&E budget appropriation, less Congressional Reductions, less OSD Reductions, less Programs exempted by statute (15 USC 638 (e)(2)), less Intramural RDT&E (15 USC 638 (e)(1)), equals Total Extramural RDT&E budget base for SBIR and STTR assessment. Department of Health and Human Services: NIH – The calculation for the extramural research and development base used to determine the set-aside for the Small Business Innovation Research (SBIR) and Small Business Technology Transfer (STTR) programs includes Research Grants, R&D contracts, the extramural portion of the Cancer Control program (prior to FY 2008), and extramural grants in the National Library of Medicine Medicine (NLM). (Medical Library Assistance Awards (MLAA) grants are not included; these are support grants; NLM extramural contracts are not included, as these are service and support contracts.) A proration is made for certain minority programs (MBRS/BRS) and the Fogarty International Center, whose grant portfolio does not lend itself to small business awards. MBRS/BRS awards are made to institutions to strengthen, balance, and stabilize their programs. The program provides flexible funds on a formula basis. The amounts are provided to the Institutes and Centers (ICs). This calculation establishes the minimum that each IC must set-aside for SBIR/STTR awards. ICs have the option of spending more.
CDC – CDC participates in the National Science Foundation’s (NSF) annual Federal Funds survey*. This survey is the primary source of information about Federal funding for R&D in the United States. Federal Funds data, as collected, span 3 government fiscal years: the fiscal year just completed, the current fiscal year, and the next fiscal year. Actual data are collected for the year just completed; estimates are obtained for the current and next fiscal year. CDC uses the data generated by the survey (i.e., estimated R&D for current fiscal year) to calculate our annual extramural R/R&D from which the SBIR set-aside is derived.
*The results of NSF’s Federal Funds survey are used to calculate CDC’s extramural R/R&D data and to derive CDC’s SBIR set-aside. The responses to the NSF survey questions are self-reported by each designated program office within CDC. Extramural activities are defined as those whose primary objective is to build capacity external to CDC by carrying our message throughout the world and improving the effectiveness of management processes or procedures for outside activities: Management and support services for Research & Development activities; Engineering and technical support services to state and local health surveillance systems; Personnel as direct assistance to state and local health departments; Grants or contracts to facilitate state-based education or surveillance; Vaccines for the immunization of children.
In general, we define program support costs as any costs related to the ability of CDC to implement its programs. These are costs that fund people such as project officers for
SBIR & STTR Program Annual Report FYs 2009-2011
44 | P a g e
cooperative agreements, grants, and contracts, or other activities and/or functions that are necessary to assure programs in the field are executed to achieve the greatest health impact and the most efficient use of resources. In addition, program support activities include some aspects of CDC’s work in surveillance, evaluation, epidemiology, and intramural research. While the majority of these costs are not external to the Agency (i.e. CDC onsite staff or contractors provide the support), they are important to the execution and evaluation of programs in the field. These activities have a primary objective to build capacity external to CDC by improving the effectiveness of management processes or procedures for outside activities. These activities are an essential part of the Agency’s core mission; our work would not be possible without these costs.
FDA – The calculation for the extramural research and development base used to determine the set-aside for the Small Business Innovation Research (SBIR) Programs include Research Grants, and R&D contracts. FDA took the extramural research budget for FY 2011 and calculated 2.5%.
ACF -- ACF took the research budget for FY 2011 and calculated 2.5%. Department of Energy: The DOE calculates extramural R&D as follows: Each year, DOE collects and reports data on its R&D funding. Two major categories are used to report this data: “Conduct of R&D” that includes basic and applied research and development; and “Facilities” that includes all capital projects. Only “Conduct of R&D” obligations are assessed for SBIR.
A very substantial portion of the DOE “Conduct of R&D” budget is related to the DOE’s defense mission. Most defense-related funding is exempted from SBIR assessments by language in the Small Business Research and Development Act of 1992 (P.L. 102-564) that states “…for the Department of Energy it shall not include amounts obligated for atomic energy defense programs solely for weapons activities or for naval reactor programs.” The above data adjusts for that portion of total FY 2010 DOE R&D that is exempted per the Public Law.
Most of the non-exempted R&D is extramural R&D, which is performed in DOE contractor-operated laboratories, or by universities and other contractors. DOE intramural R&D is that which is performed in DOE’s government-owned and government-operated laboratories. National Aeronautics and Space Administration:
Calculate prior year’s extramural R&D obligations as a percentage of total budgeted R&D, adjusted for operational exclusions.
The calculated percentage of extramural R&D in the year of execution is used as the basis for
calculating future estimates for extramural R&D.
Then, apply the defined statute for SBIR/STTR to the projected estimates for extramural R&D.
The result is a working estimate for budget authority for SBIR/STTR.
Exclusions:
SBIR & STTR Program Annual Report FYs 2009-2011
45 | P a g e
• Based on the definition of R&D, projects that are operational in nature (not R&D) would be excluded from the analysis of calculating extramural R&D.
– Examples • Space Operations (Space Station excluding ISS Research), Cross
Agency Support, Education, Construction and Environmental Compliance & Restoration, and Inspector General
• Missions that have launched and are fully operational, operational satellites.
• Expendable Launch Vehicles (ELV) • Program & Management Support • Mission and Ground Operations • Ongoing review of projects as they mature to operational
National Science Foundation: At NSF, all costs classified as “conduct of research and development” under OMB Circular A-11’s character classification schedule, with the exception of the costs of the Federally Funded Research and Development Centers (FFRDCs), form the basis for calculating the SBIR and STTR budgets. The Small Business Innovation Development Act of 1982 defines an agency’s extramural research budget to include, “…total obligations minus amounts obligated for agency activities in or through Government owned and Government-operated facilities…”
NSF Footnote for FY 2009 In FY 2009, the estimate of NSF’s total R&D costs was $6.095 billion including funds associated with the American Reinvestment & Recovery Act, (ARRA). From this total, the Foundation excluded approximately $252 million budgeted for the FFRDCs, for a total extramural research and development budget of $5.770 billion. Applying the statutorily mandated set-aside of 2.50 %, the estimated SBIR budget, including the ARRA funds, was $144.25 million. Footnote for FY 2011 In FY 2011, NSF was funded through a full-year continuing resolution that was based on the FY 2010 appropriation. The SBIR and STTR targets established by NSF for FY 2011 in the Current Plan were likewise based upon the FY 2010 target for these two programs. Given the actual obligations for FY 2011, however, we recognize that this approach led to underestimating the amounts required for the targets. NSF has determined that several changes affecting NSF’s character classifications occurred in FY 2010 and FY 2011, and these changes contributed directly to the agency underestimating the targets for FY 2011. The character class designations for a number of NSF investments were reviewed and reclassified in this time frame. This led to a shift of over $400 million from the non-investment and education and training categories to research. These shifts will be maintained going forward, and they have been reflected in NSF’s FY 2012 target for SBIR and STTR.
SBIR & STTR Program Annual Report FYs 2009-2011
46 | P a g e
In addition, there were a number of smaller shifts that were specific to FY 2011. The most noteworthy of these entailed decreased support for major equipment and a corresponding increase for research. In keeping with NSF’s longstanding support for investments in SBIR and STTR, the agency is establishing new procedures to ensure that shifts like those described above are better reflected the annual targets set by the agency following enactment of appropriations.
Department of Agriculture: Every fiscal year, USDA agency budget officers estimate the amount of funds available for R&D, including how much will be available for extramural R&D. These estimates are reported to the USDA budget office and forwarded to the National Institute of Food and Agriculture, which manages the SBIR Program for USDA. Department of Homeland Security:
Science and Technology (S&T) Directorate
A detailed explanation of the methodology the S&T Directorate used for calculating its extramural RR&D: Per the Science and Technology (S&T) Directorate CFO, in FY11, the S&T Directorate received $686.7M in its RDA&O appropriation. Of that amount, $140M was for the operations, maintenance and construction of DHS labs, $13M for Standards, $6.5M for Test and Evaluation oversight, $7.9M for Safety Act, $8.7M for Scholars and Fellows, and Minority Serving Institutions. The remainder is $499.6M for R&D funding of which $135.1M goes to intramural R&D and $364.5M goes to extramural R&D. The 2.5% SBIR assessment of this amount should have been $9,111,264. However, the S&T Directorate provided $11,821,580 for the S&T SBIR Program, exceeding the 2.5% statutory amount. Domestic Nuclear Detection Office (DNDO) A detailed explanation of the methodology the S&T Directorate used for calculating its extramural RR&D: Per the Domestic Nuclear Detection Office (DNDO) Budget and Finance Manager, in FY11, DNDO received $274.886M in its RD&O appropriation. Of that amount, approximately $103.880M was classified under object class 25.5 “Research and Development of Contracts”. The 2.5% assessment of this amount should have been $2.597M. However, in FY11, DNDO classified additional projects under object class 25.5 and subsequently provided $4.75M for the DNDO SBIR Program within its FY2011 Spend Plan, exceeding the 2.5% statutory amount.
Department of Education: To ensure compliance with Federal requirements for the Small Business Innovation Research (SBIR) program, the Department of Education (ED) uses its most recent actual obligations for research and development, as reported to the National Science Foundation for the Survey of Federal Funds for Research and Development. These obligations are calculated by the Budget Service with the assistance of program analysts who have detailed knowledge of program budgets, plans, and operations.
SBIR & STTR Program Annual Report FYs 2009-2011
47 | P a g e
Because ED supports extramural research and development through a variety of programs with different purposes, structures, and authorizations, different approaches are more appropriate or efficient when used with particular programs. Most research and development activities supported by ED are administered by one of its two research agencies, the Institute of Education Sciences (IES) and the National Institute on Disability and Rehabilitation Research (NIDRR). Through their primary programs of research, these agencies also support extensive dissemination and knowledge utilization activities, as well as training and fellowship programs to expand the capacity of their respective fields to conduct rigorous research and development. To determine the overall share of program resources that support extramural research and development, ED periodically reviews grants and contracts awarded under each competition, topic, or program of research (e.g., research on reading and writing education or model systems for rehabilitation of burn injuries). For each competition, topic, or program of research, analysts determine the average share of each award that supports basic or applied research and development. ED also supports research and development through smaller programs or set-asides under larger programs. For some of these programs, such as the Technology and Media Program in the Special Education account and the National Activities programs within the Career, Technical and Adult Education accounts, there are a small number of awards that analysts review each year to determine the share of each award that supports research and development. For other programs, such as International Research and Studies grants within the International Education and Foreign Language Studies program or the Demonstration Projects to Ensure Quality Higher Education for Students with Disabilities, both in the Higher Education account, the activities authorized under the program result in fairly uniform percentages of research and development supported by each project so a program average is applied to calculate extramural research and development obligations. Based on the most recent actual extramural research and development obligations reported for all programs in the Department, we calculate the amount that must be devoted to the SBIR competitions administered through IES and NIDRR for the coming fiscal year. Department of Commerce: NIST uses data contained in its’ financial accounting system to determine the total amount of Research and Development funds obligated during the fiscal year. Specific National Science Foundation codes denote that the funds are being used for Research and Development work and unique object classes identify the work as extramural or intramural. NOAA uses the National Science Foundation definitions of extramural research and development (R&D), defined as R&D performed by organizations outside the Federal sector with Federal funds under grant, contract, or cooperative agreement. The NOAA Line Offices estimate the amount of their extramural R&D by using data on grants, contracts, and cooperative agreements. A number of Cooperative institutes with which NOAA’s Office Oceanic and Atmospheric Research has long standing agreements are included in the extramural estimates. Environmental Protection Agency: EPA’s research and development resources primarily reside in the Office of Research and Development’s (ORD) Science and Technology appropriation, with a lesser amount residing in ORD’s Superfund appropriation. During the development of the Agency’s operating plan (and prior to congressional earmarks), payroll, travel, facility, and operating expenses, and other costs required to support in-house research are excluded from these appropriations. The Agency directs 2.5% of the remaining extramural resources to its SBIR program. In addition, upon determination that ORD will monitor a congressional
SBIR & STTR Program Annual Report FYs 2009-2011
48 | P a g e
earmark, ORD directs 2.5% of those resources to the SBIR program. To facilitate comparison between years, EPA uses enacted budgets in the calculation of SBIR funding because EPA has two year authority to obligate funds. Department of Transportation: The Office of the Secretary of Transportation provides us with the final extramural research budget each FY when those numbers are determined. We then calculate the SBIR assessment using the minimum percentages established for that year, in this case, 2.5%.
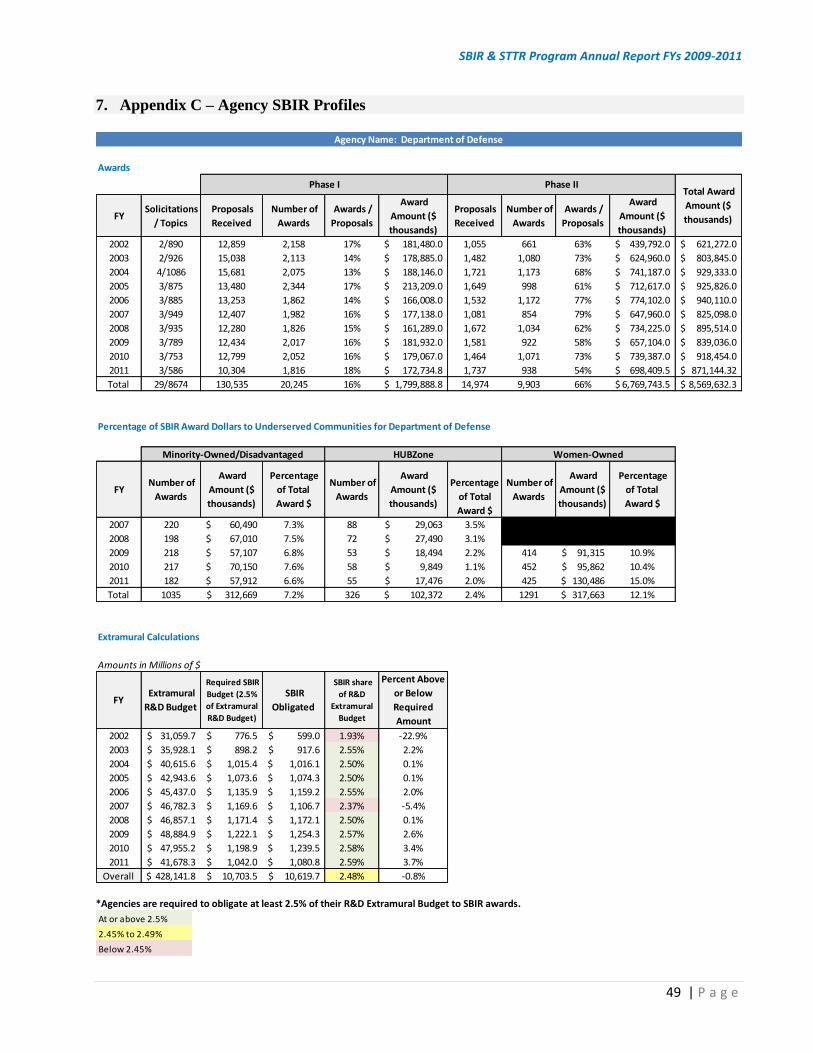
SBIR & STTR Program Annual Report FYs 2009-2011
49 | P a g e
7. Appendix C – Agency SBIR Profiles
*Agencies are required to obligate at least 2.5% of their R&D Extramural Budget to SBIR awards.
Awards
FY Solicitations
/ Topics
Proposals
Received
Number of
Awards
Awards /
Proposals
Award
Amount ($
thousands)
Proposals
Received
Number of
Awards
Awards /
Proposals
Award
Amount ($
thousands)
2002 2/890 12,859 2,158 17% 181,480.0$ 1,055 661 63% 439,792.0$ 621,272.0$
2003 2/926 15,038 2,113 14% 178,885.0$ 1,482 1,080 73% 624,960.0$ 803,845.0$
2004 4/1086 15,681 2,075 13% 188,146.0$ 1,721 1,173 68% 741,187.0$ 929,333.0$
2005 3/875 13,480 2,344 17% 213,209.0$ 1,649 998 61% 712,617.0$ 925,826.0$
2006 3/885 13,253 1,862 14% 166,008.0$ 1,532 1,172 77% 774,102.0$ 940,110.0$
2007 3/949 12,407 1,982 16% 177,138.0$ 1,081 854 79% 647,960.0$ 825,098.0$
2008 3/935 12,280 1,826 15% 161,289.0$ 1,672 1,034 62% 734,225.0$ 895,514.0$
2009 3/789 12,434 2,017 16% 181,932.0$ 1,581 922 58% 657,104.0$ 839,036.0$
2010 3/753 12,799 2,052 16% 179,067.0$ 1,464 1,071 73% 739,387.0$ 918,454.0$
2011 3/586 10,304 1,816 18% 172,734.8$ 1,737 938 54% 698,409.5$ 871,144.32$
Total 29/8674 130,535 20,245 16% 1,799,888.8$ 14,974 9,903 66% 6,769,743.5$ 8,569,632.3$
Percentage of SBIR Award Dollars to Underserved Communities for Department of Defense
FY Number of
Awards
Award
Amount ($
thousands)
Percentage
of Total
Award $
Number of
Awards
Award
Amount ($
thousands)
Percentage
of Total
Award $
Number of
Awards
Award
Amount ($
thousands)
Percentage
of Total
Award $
2007 220 60,490$ 7.3% 88 29,063$ 3.5%
2008 198 67,010$ 7.5% 72 27,490$ 3.1%
2009 218 57,107$ 6.8% 53 18,494$ 2.2% 414 91,315$ 10.9%
2010 217 70,150$ 7.6% 58 9,849$ 1.1% 452 95,862$ 10.4%
2011 182 57,912$ 6.6% 55 17,476$ 2.0% 425 130,486$ 15.0%
Total 1035 312,669$ 7.2% 326 102,372$ 2.4% 1291 317,663$ 12.1%
Extramural Calculations
Amounts in Millions of $
FY Extramural
R&D Budget
Required SBIR
Budget (2.5%
of Extramural
R&D Budget)
SBIR
Obligated
SBIR share
of R&D
Extramural
Budget
Percent Above
or Below
Required
Amount
2002 31,059.7$ 776.5$ 599.0$ 1.93% -22.9%
2003 35,928.1$ 898.2$ 917.6$ 2.55% 2.2%
2004 40,615.6$ 1,015.4$ 1,016.1$ 2.50% 0.1%
2005 42,943.6$ 1,073.6$ 1,074.3$ 2.50% 0.1%
2006 45,437.0$ 1,135.9$ 1,159.2$ 2.55% 2.0%
2007 46,782.3$ 1,169.6$ 1,106.7$ 2.37% -5.4%
2008 46,857.1$ 1,171.4$ 1,172.1$ 2.50% 0.1%
2009 48,884.9$ 1,222.1$ 1,254.3$ 2.57% 2.6%
2010 47,955.2$ 1,198.9$ 1,239.5$ 2.58% 3.4%
2011 41,678.3$ 1,042.0$ 1,080.8$ 2.59% 3.7%
Overall 428,141.8$ 10,703.5$ 10,619.7$ 2.48% -0.8%
Phase I Phase II Total Award
Amount ($
thousands)
Agency Name: Department of Defense
Minority-Owned/Disadvantaged HUBZone Women-Owned
At or above 2.5%
2.45% to 2.49%
Below 2.45%
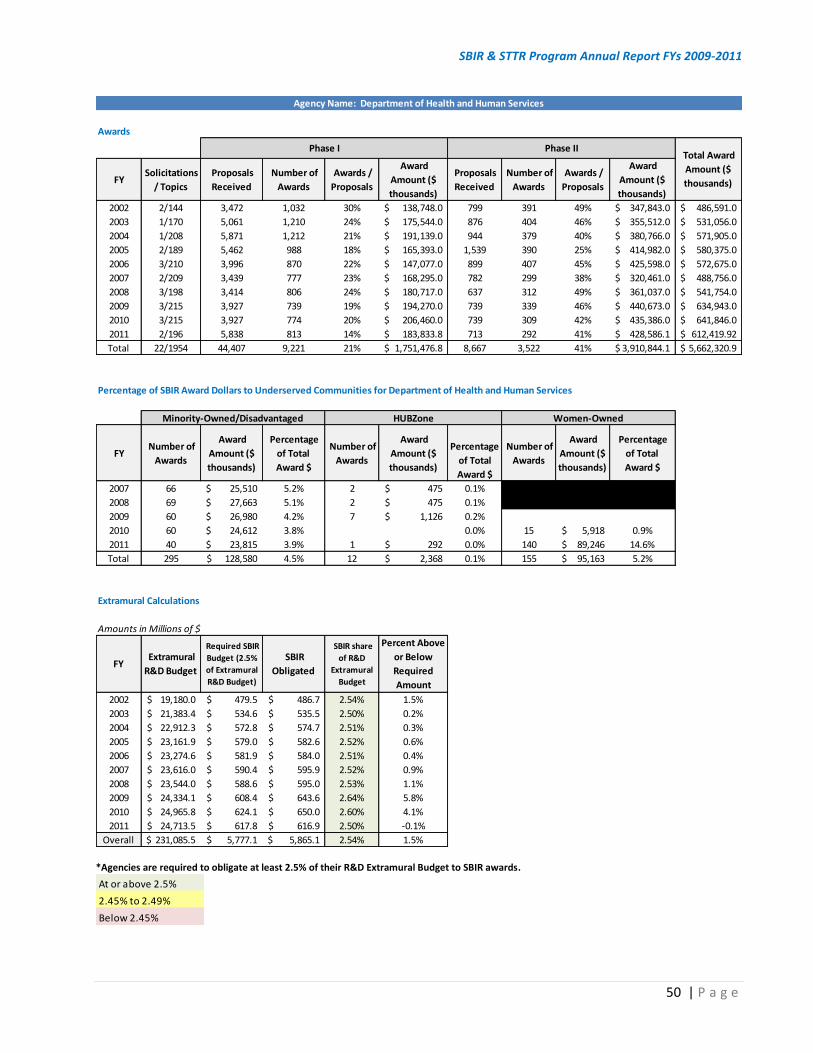
SBIR & STTR Program Annual Report FYs 2009-2011
50 | P a g e
*Agencies are required to obligate at least 2.5% of their R&D Extramural Budget to SBIR awards.
Awards
FY Solicitations
/ Topics
Proposals
Received
Number of
Awards
Awards /
Proposals
Award
Amount ($
thousands)
Proposals
Received
Number of
Awards
Awards /
Proposals
Award
Amount ($
thousands)
2002 2/144 3,472 1,032 30% 138,748.0$ 799 391 49% 347,843.0$ 486,591.0$
2003 1/170 5,061 1,210 24% 175,544.0$ 876 404 46% 355,512.0$ 531,056.0$
2004 1/208 5,871 1,212 21% 191,139.0$ 944 379 40% 380,766.0$ 571,905.0$
2005 2/189 5,462 988 18% 165,393.0$ 1,539 390 25% 414,982.0$ 580,375.0$
2006 3/210 3,996 870 22% 147,077.0$ 899 407 45% 425,598.0$ 572,675.0$
2007 2/209 3,439 777 23% 168,295.0$ 782 299 38% 320,461.0$ 488,756.0$
2008 3/198 3,414 806 24% 180,717.0$ 637 312 49% 361,037.0$ 541,754.0$
2009 3/215 3,927 739 19% 194,270.0$ 739 339 46% 440,673.0$ 634,943.0$
2010 3/215 3,927 774 20% 206,460.0$ 739 309 42% 435,386.0$ 641,846.0$
2011 2/196 5,838 813 14% 183,833.8$ 713 292 41% 428,586.1$ 612,419.92$
Total 22/1954 44,407 9,221 21% 1,751,476.8$ 8,667 3,522 41% 3,910,844.1$ 5,662,320.9$
Percentage of SBIR Award Dollars to Underserved Communities for Department of Health and Human Services
FY Number of
Awards
Award
Amount ($
thousands)
Percentage
of Total
Award $
Number of
Awards
Award
Amount ($
thousands)
Percentage
of Total
Award $
Number of
Awards
Award
Amount ($
thousands)
Percentage
of Total
Award $
2007 66 25,510$ 5.2% 2 475$ 0.1%
2008 69 27,663$ 5.1% 2 475$ 0.1%
2009 60 26,980$ 4.2% 7 1,126$ 0.2%
2010 60 24,612$ 3.8% 0.0% 15 5,918$ 0.9%
2011 40 23,815$ 3.9% 1 292$ 0.0% 140 89,246$ 14.6%
Total 295 128,580$ 4.5% 12 2,368$ 0.1% 155 95,163$ 5.2%
Extramural Calculations
Amounts in Millions of $
FY Extramural
R&D Budget
Required SBIR
Budget (2.5%
of Extramural
R&D Budget)
SBIR
Obligated
SBIR share
of R&D
Extramural
Budget
Percent Above
or Below
Required
Amount
2002 19,180.0$ 479.5$ 486.7$ 2.54% 1.5%
2003 21,383.4$ 534.6$ 535.5$ 2.50% 0.2%
2004 22,912.3$ 572.8$ 574.7$ 2.51% 0.3%
2005 23,161.9$ 579.0$ 582.6$ 2.52% 0.6%
2006 23,274.6$ 581.9$ 584.0$ 2.51% 0.4%
2007 23,616.0$ 590.4$ 595.9$ 2.52% 0.9%
2008 23,544.0$ 588.6$ 595.0$ 2.53% 1.1%
2009 24,334.1$ 608.4$ 643.6$ 2.64% 5.8%
2010 24,965.8$ 624.1$ 650.0$ 2.60% 4.1%
2011 24,713.5$ 617.8$ 616.9$ 2.50% -0.1%
Overall 231,085.5$ 5,777.1$ 5,865.1$ 2.54% 1.5%
Phase I Phase II Total Award
Amount ($
thousands)
Agency Name: Department of Health and Human Services
Minority-Owned/Disadvantaged HUBZone Women-Owned
At or above 2.5%
2.45% to 2.49%
Below 2.45%
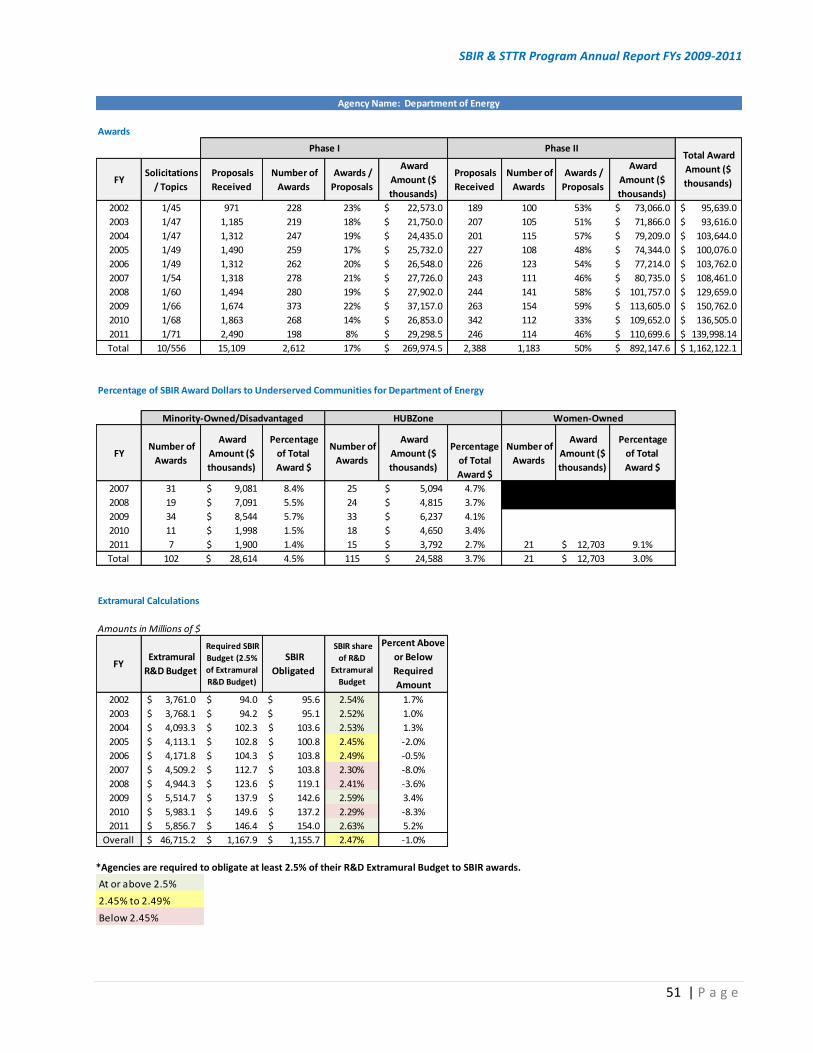
SBIR & STTR Program Annual Report FYs 2009-2011
51 | P a g e
*Agencies are required to obligate at least 2.5% of their R&D Extramural Budget to SBIR awards.
Awards
FY Solicitations
/ Topics
Proposals
Received
Number of
Awards
Awards /
Proposals
Award
Amount ($
thousands)
Proposals
Received
Number of
Awards
Awards /
Proposals
Award
Amount ($
thousands)
2002 1/45 971 228 23% 22,573.0$ 189 100 53% 73,066.0$ 95,639.0$
2003 1/47 1,185 219 18% 21,750.0$ 207 105 51% 71,866.0$ 93,616.0$
2004 1/47 1,312 247 19% 24,435.0$ 201 115 57% 79,209.0$ 103,644.0$
2005 1/49 1,490 259 17% 25,732.0$ 227 108 48% 74,344.0$ 100,076.0$
2006 1/49 1,312 262 20% 26,548.0$ 226 123 54% 77,214.0$ 103,762.0$
2007 1/54 1,318 278 21% 27,726.0$ 243 111 46% 80,735.0$ 108,461.0$
2008 1/60 1,494 280 19% 27,902.0$ 244 141 58% 101,757.0$ 129,659.0$
2009 1/66 1,674 373 22% 37,157.0$ 263 154 59% 113,605.0$ 150,762.0$
2010 1/68 1,863 268 14% 26,853.0$ 342 112 33% 109,652.0$ 136,505.0$
2011 1/71 2,490 198 8% 29,298.5$ 246 114 46% 110,699.6$ 139,998.14$
Total 10/556 15,109 2,612 17% 269,974.5$ 2,388 1,183 50% 892,147.6$ 1,162,122.1$
Percentage of SBIR Award Dollars to Underserved Communities for Department of Energy
FY Number of
Awards
Award
Amount ($
thousands)
Percentage
of Total
Award $
Number of
Awards
Award
Amount ($
thousands)
Percentage
of Total
Award $
Number of
Awards
Award
Amount ($
thousands)
Percentage
of Total
Award $
2007 31 9,081$ 8.4% 25 5,094$ 4.7%
2008 19 7,091$ 5.5% 24 4,815$ 3.7%
2009 34 8,544$ 5.7% 33 6,237$ 4.1%
2010 11 1,998$ 1.5% 18 4,650$ 3.4%
2011 7 1,900$ 1.4% 15 3,792$ 2.7% 21 12,703$ 9.1%
Total 102 28,614$ 4.5% 115 24,588$ 3.7% 21 12,703$ 3.0%
Extramural Calculations
Amounts in Millions of $
FY Extramural
R&D Budget
Required SBIR
Budget (2.5%
of Extramural
R&D Budget)
SBIR
Obligated
SBIR share
of R&D
Extramural
Budget
Percent Above
or Below
Required
Amount
2002 3,761.0$ 94.0$ 95.6$ 2.54% 1.7%
2003 3,768.1$ 94.2$ 95.1$ 2.52% 1.0%
2004 4,093.3$ 102.3$ 103.6$ 2.53% 1.3%
2005 4,113.1$ 102.8$ 100.8$ 2.45% -2.0%
2006 4,171.8$ 104.3$ 103.8$ 2.49% -0.5%
2007 4,509.2$ 112.7$ 103.8$ 2.30% -8.0%
2008 4,944.3$ 123.6$ 119.1$ 2.41% -3.6%
2009 5,514.7$ 137.9$ 142.6$ 2.59% 3.4%
2010 5,983.1$ 149.6$ 137.2$ 2.29% -8.3%
2011 5,856.7$ 146.4$ 154.0$ 2.63% 5.2%
Overall 46,715.2$ 1,167.9$ 1,155.7$ 2.47% -1.0%
Phase I Phase II Total Award
Amount ($
thousands)
Agency Name: Department of Energy
Minority-Owned/Disadvantaged HUBZone Women-Owned
At or above 2.5%
2.45% to 2.49%
Below 2.45%
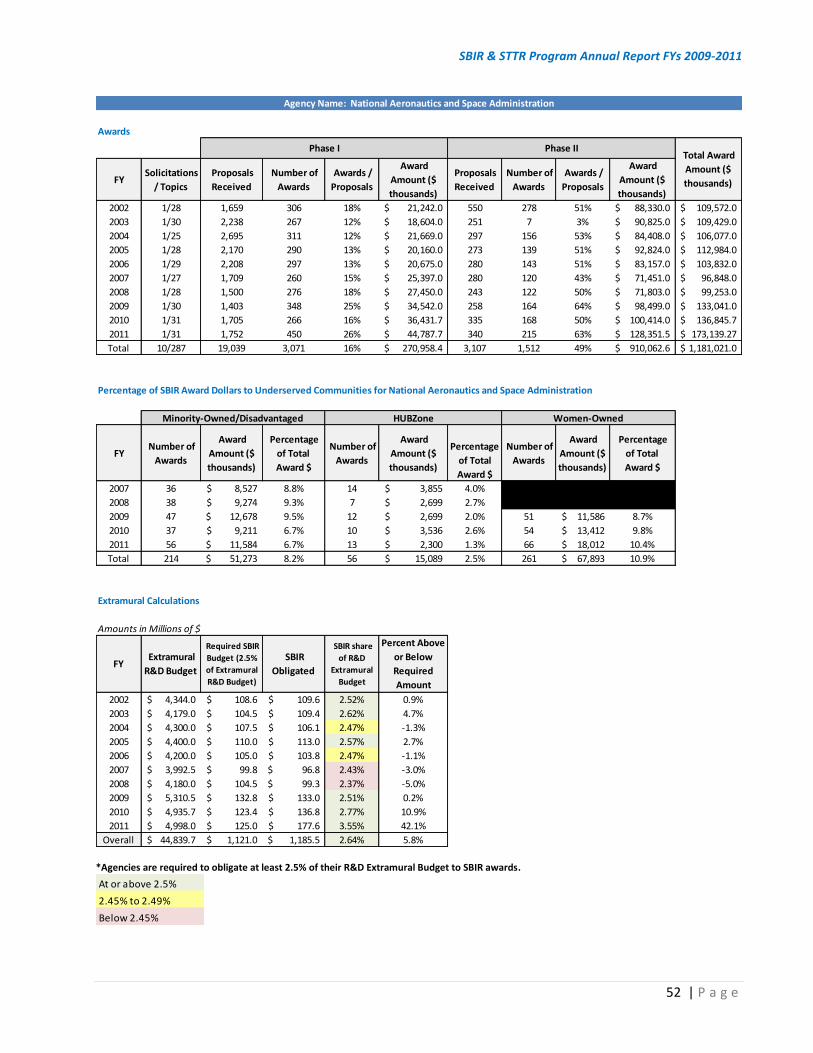
SBIR & STTR Program Annual Report FYs 2009-2011
52 | P a g e
*Agencies are required to obligate at least 2.5% of their R&D Extramural Budget to SBIR awards.
Awards
FY Solicitations
/ Topics
Proposals
Received
Number of
Awards
Awards /
Proposals
Award
Amount ($
thousands)
Proposals
Received
Number of
Awards
Awards /
Proposals
Award
Amount ($
thousands)
2002 1/28 1,659 306 18% 21,242.0$ 550 278 51% 88,330.0$ 109,572.0$
2003 1/30 2,238 267 12% 18,604.0$ 251 7 3% 90,825.0$ 109,429.0$
2004 1/25 2,695 311 12% 21,669.0$ 297 156 53% 84,408.0$ 106,077.0$
2005 1/28 2,170 290 13% 20,160.0$ 273 139 51% 92,824.0$ 112,984.0$
2006 1/29 2,208 297 13% 20,675.0$ 280 143 51% 83,157.0$ 103,832.0$
2007 1/27 1,709 260 15% 25,397.0$ 280 120 43% 71,451.0$ 96,848.0$
2008 1/28 1,500 276 18% 27,450.0$ 243 122 50% 71,803.0$ 99,253.0$
2009 1/30 1,403 348 25% 34,542.0$ 258 164 64% 98,499.0$ 133,041.0$
2010 1/31 1,705 266 16% 36,431.7$ 335 168 50% 100,414.0$ 136,845.7$
2011 1/31 1,752 450 26% 44,787.7$ 340 215 63% 128,351.5$ 173,139.27$
Total 10/287 19,039 3,071 16% 270,958.4$ 3,107 1,512 49% 910,062.6$ 1,181,021.0$
Percentage of SBIR Award Dollars to Underserved Communities for National Aeronautics and Space Administration
FY Number of
Awards
Award
Amount ($
thousands)
Percentage
of Total
Award $
Number of
Awards
Award
Amount ($
thousands)
Percentage
of Total
Award $
Number of
Awards
Award
Amount ($
thousands)
Percentage
of Total
Award $
2007 36 8,527$ 8.8% 14 3,855$ 4.0% 45 12,912$ 13.3%
2008 38 9,274$ 9.3% 7 2,699$ 2.7% 45 11,971$ 12.1%
2009 47 12,678$ 9.5% 12 2,699$ 2.0% 51 11,586$ 8.7%
2010 37 9,211$ 6.7% 10 3,536$ 2.6% 54 13,412$ 9.8%
2011 56 11,584$ 6.7% 13 2,300$ 1.3% 66 18,012$ 10.4%
Total 214 51,273$ 8.2% 56 15,089$ 2.5% 261 67,893$ 10.9%
Extramural Calculations
Amounts in Millions of $
FY Extramural
R&D Budget
Required SBIR
Budget (2.5%
of Extramural
R&D Budget)
SBIR
Obligated
SBIR share
of R&D
Extramural
Budget
Percent Above
or Below
Required
Amount
2002 4,344.0$ 108.6$ 109.6$ 2.52% 0.9%
2003 4,179.0$ 104.5$ 109.4$ 2.62% 4.7%
2004 4,300.0$ 107.5$ 106.1$ 2.47% -1.3%
2005 4,400.0$ 110.0$ 113.0$ 2.57% 2.7%
2006 4,200.0$ 105.0$ 103.8$ 2.47% -1.1%
2007 3,992.5$ 99.8$ 96.8$ 2.43% -3.0%
2008 4,180.0$ 104.5$ 99.3$ 2.37% -5.0%
2009 5,310.5$ 132.8$ 133.0$ 2.51% 0.2%
2010 4,935.7$ 123.4$ 136.8$ 2.77% 10.9%
2011 4,998.0$ 125.0$ 177.6$ 3.55% 42.1%
Overall 44,839.7$ 1,121.0$ 1,185.5$ 2.64% 5.8%
Phase I Phase II Total Award
Amount ($
thousands)
Agency Name: National Aeronautics and Space Administration
Minority-Owned/Disadvantaged HUBZone Women-Owned
At or above 2.5%
2.45% to 2.49%
Below 2.45%

SBIR & STTR Program Annual Report FYs 2009-2011
53 | P a g e
*Agencies are required to obligate at least 2.5% of their R&D Extramural Budget to SBIR awards.
Awards
FY Solicitations
/ Topics
Proposals
Received
Number of
Awards
Awards /
Proposals
Award
Amount ($
thousands)
Proposals
Received
Number of
Awards
Awards /
Proposals
Award
Amount ($
thousands)
2002 1/4 1,477 277 19% 29,400.0$ 148 66 45% 48,600.0$ 78,000.0$
2003 1/4 2,704 447 17% 44,500.0$ 225 77 34% 45,000.0$ 89,500.0$
2004 1/4 2,704 447 17% 44,500.0$ 225 77 34% 45,000.0$ 89,500.0$
2005 2/3 1,482 152 10% 15,054.0$ 271 132 49% 64,101.0$ 79,155.0$
2006 2/5 1,620 259 16% 25,768.0$ 140 76 54% 64,681.0$ 90,449.0$
2007 2/8 1,751 286 16% 28,407.0$ 239 79 33% 39,475.0$ 67,882.0$
2008 2/6 1,450 224 15% 22,275.0$ 236 81 34% 39,951.0$ 62,226.0$
2009 2/4 1,533 311 20% 35,284.0$ 234 114 49% 94,368.0$ 129,652.0$
2010 2/8 2,463 431 17% 67,172.0$ 275 80 29% 39,033.0$ 106,205.0$
2011 2/8 2,450 272 11% 40,352.1$ 350 98 28% 71,147.9$ 111,500.00$
Total 17/54 19,634 3,106 16% 352,712.1$ 2,343 880 38% 551,356.9$ 904,069.0$
Percentage of SBIR Award Dollars to Underserved Communities for National Science Foundation
FY Number of
Awards
Award
Amount ($
thousands)
Percentage
of Total
Award $
Number of
Awards
Award
Amount ($
thousands)
Percentage
of Total
Award $
Number of
Awards
Award
Amount ($
thousands)
Percentage
of Total
Award $
2007 45 12,075$ 17.8% 13 2,663$ 3.9%
2008 29 4,881$ 7.8% 23 5,477$ 8.8%
2009 33 6,180$ 4.8% 31 6,141$ 4.7%
2010 49 10,200$ 9.6% 50 10,685$ 10.1%
2011 32 6,774$ 6.1% 30 7,420$ 6.7% 52 10,363$ 9.3%
Total 188 40,110$ 9.2% 147 32,386$ 6.8% 52 10,363$ 3.1%
Extramural Calculations
Amounts in Millions of $
FY Extramural
R&D Budget
Required SBIR
Budget (2.5%
of Extramural
R&D Budget)
SBIR
Obligated
SBIR share
of R&D
Extramural
Budget
Percent Above
or Below
Required
Amount
2002 3,000.0$ 75.0$ 78.0$ 2.60% 4.0%
2003 3,430.0$ 85.8$ 91.4$ 2.66% 6.6%
2004 3,430.0$ 85.8$ 91.4$ 2.66% 6.6%
2005 3,590.0$ 89.8$ 92.1$ 2.57% 2.6%
2006 3,618.1$ 90.5$ 90.5$ 2.50% 0.0%
2007 3,785.0$ 94.6$ 95.4$ 2.52% 0.8%
2008 3,853.0$ 96.3$ 95.5$ 2.48% -0.9%
2009 5,770.0$ 144.3$ 129.7$ 2.25% -10.1%
2010 4,824.0$ 120.6$ 125.7$ 2.61% 4.2%
2011 4,956.0$ 123.9$ 111.5$ 2.25% -10.0%
Overall 40,256.1$ 1,006.4$ 1,001.1$ 2.49% -0.5%
Phase I Phase II Total Award
Amount ($
thousands)
Agency Name: National Science Foundation
Minority-Owned/Disadvantaged HUBZone Women-Owned
At or above 2.5%
2.45% to 2.49%
Below 2.45%
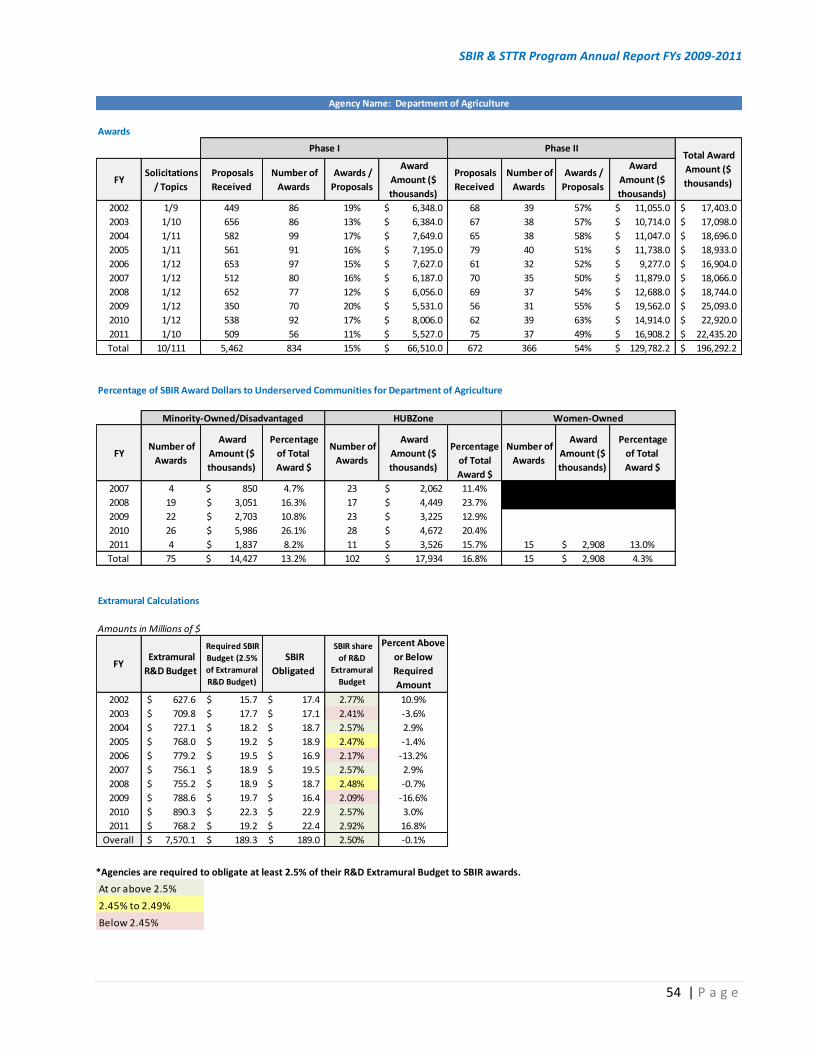
SBIR & STTR Program Annual Report FYs 2009-2011
54 | P a g e
*Agencies are required to obligate at least 2.5% of their R&D Extramural Budget to SBIR awards.
Awards
FY Solicitations
/ Topics
Proposals
Received
Number of
Awards
Awards /
Proposals
Award
Amount ($
thousands)
Proposals
Received
Number of
Awards
Awards /
Proposals
Award
Amount ($
thousands)
2002 1/9 449 86 19% 6,348.0$ 68 39 57% 11,055.0$ 17,403.0$
2003 1/10 656 86 13% 6,384.0$ 67 38 57% 10,714.0$ 17,098.0$
2004 1/11 582 99 17% 7,649.0$ 65 38 58% 11,047.0$ 18,696.0$
2005 1/11 561 91 16% 7,195.0$ 79 40 51% 11,738.0$ 18,933.0$
2006 1/12 653 97 15% 7,627.0$ 61 32 52% 9,277.0$ 16,904.0$
2007 1/12 512 80 16% 6,187.0$ 70 35 50% 11,879.0$ 18,066.0$
2008 1/12 652 77 12% 6,056.0$ 69 37 54% 12,688.0$ 18,744.0$
2009 1/12 350 70 20% 5,531.0$ 56 31 55% 19,562.0$ 25,093.0$
2010 1/12 538 92 17% 8,006.0$ 62 39 63% 14,914.0$ 22,920.0$
2011 1/10 509 56 11% 5,527.0$ 75 37 49% 16,908.2$ 22,435.20$
Total 10/111 5,462 834 15% 66,510.0$ 672 366 54% 129,782.2$ 196,292.2$
Percentage of SBIR Award Dollars to Underserved Communities for Department of Agriculture
FY Number of
Awards
Award
Amount ($
thousands)
Percentage
of Total
Award $
Number of
Awards
Award
Amount ($
thousands)
Percentage
of Total
Award $
Number of
Awards
Award
Amount ($
thousands)
Percentage
of Total
Award $
2007 4 850$ 4.7% 23 2,062$ 11.4%
2008 19 3,051$ 16.3% 17 4,449$ 23.7%
2009 22 2,703$ 10.8% 23 3,225$ 12.9%
2010 26 5,986$ 26.1% 28 4,672$ 20.4%
2011 4 1,837$ 8.2% 11 3,526$ 15.7% 15 2,908$ 13.0%
Total 75 14,427$ 13.2% 102 17,934$ 16.8% 15 2,908$ 4.3%
Extramural Calculations
Amounts in Millions of $
FY Extramural
R&D Budget
Required SBIR
Budget (2.5%
of Extramural
R&D Budget)
SBIR
Obligated
SBIR share
of R&D
Extramural
Budget
Percent Above
or Below
Required
Amount
2002 627.6$ 15.7$ 17.4$ 2.77% 10.9%
2003 709.8$ 17.7$ 17.1$ 2.41% -3.6%
2004 727.1$ 18.2$ 18.7$ 2.57% 2.9%
2005 768.0$ 19.2$ 18.9$ 2.47% -1.4%
2006 779.2$ 19.5$ 16.9$ 2.17% -13.2%
2007 756.1$ 18.9$ 19.5$ 2.57% 2.9%
2008 755.2$ 18.9$ 18.7$ 2.48% -0.7%
2009 788.6$ 19.7$ 16.4$ 2.09% -16.6%
2010 890.3$ 22.3$ 22.9$ 2.57% 3.0%
2011 768.2$ 19.2$ 22.4$ 2.92% 16.8%
Overall 7,570.1$ 189.3$ 189.0$ 2.50% -0.1%
Phase I Phase II Total Award
Amount ($
thousands)
Agency Name: Department of Agriculture
Minority-Owned/Disadvantaged HUBZone Women-Owned
At or above 2.5%
2.45% to 2.49%
Below 2.45%
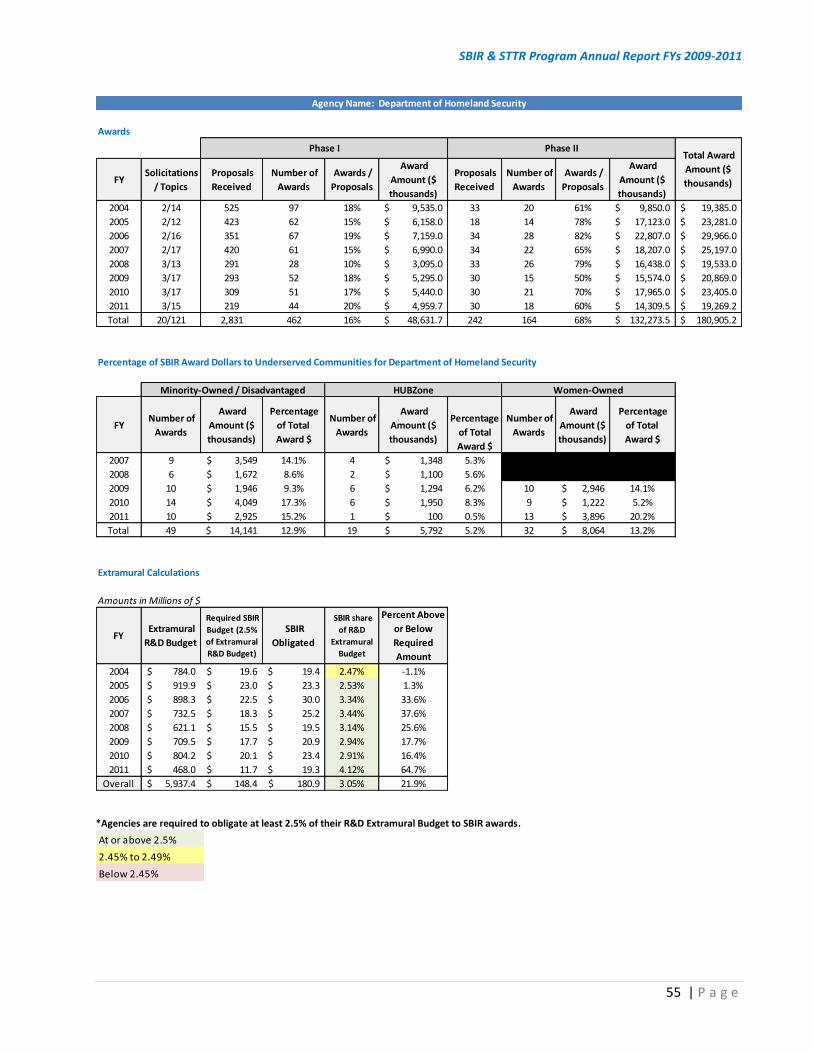
SBIR & STTR Program Annual Report FYs 2009-2011
55 | P a g e
*Agencies are required to obligate at least 2.5% of their R&D Extramural Budget to SBIR awards.
Awards
FY Solicitations
/ Topics
Proposals
Received
Number of
Awards
Awards /
Proposals
Award
Amount ($
thousands)
Proposals
Received
Number of
Awards
Awards /
Proposals
Award
Amount ($
thousands)
2004 2/14 525 97 18% 9,535.0$ 33 20 61% 9,850.0$ 19,385.0$
2005 2/12 423 62 15% 6,158.0$ 18 14 78% 17,123.0$ 23,281.0$
2006 2/16 351 67 19% 7,159.0$ 34 28 82% 22,807.0$ 29,966.0$
2007 2/17 420 61 15% 6,990.0$ 34 22 65% 18,207.0$ 25,197.0$
2008 3/13 291 28 10% 3,095.0$ 33 26 79% 16,438.0$ 19,533.0$
2009 3/17 293 52 18% 5,295.0$ 30 15 50% 15,574.0$ 20,869.0$
2010 3/17 309 51 17% 5,440.0$ 30 21 70% 17,965.0$ 23,405.0$
2011 3/15 219 44 20% 4,959.7$ 30 18 60% 14,309.5$ 19,269.2$
Total 20/121 2,831 462 16% 48,631.7$ 242 164 68% 132,273.5$ 180,905.2$
Percentage of SBIR Award Dollars to Underserved Communities for Department of Homeland Security
FY Number of
Awards
Award
Amount ($
thousands)
Percentage
of Total
Award $
Number of
Awards
Award
Amount ($
thousands)
Percentage
of Total
Award $
Number of
Awards
Award
Amount ($
thousands)
Percentage
of Total
Award $
2007 9 3,549$ 14.1% 4 1,348$ 5.3%
2008 6 1,672$ 8.6% 2 1,100$ 5.6%
2009 10 1,946$ 9.3% 6 1,294$ 6.2% 10 2,946$ 14.1%
2010 14 4,049$ 17.3% 6 1,950$ 8.3% 9 1,222$ 5.2%
2011 10 2,925$ 15.2% 1 100$ 0.5% 13 3,896$ 20.2%
Total 49 14,141$ 12.9% 19 5,792$ 5.2% 32 8,064$ 13.2%
Extramural Calculations
Amounts in Millions of $
FY Extramural
R&D Budget
Required SBIR
Budget (2.5%
of Extramural
R&D Budget)
SBIR
Obligated
SBIR share
of R&D
Extramural
Budget
Percent Above
or Below
Required
Amount
2004 784.0$ 19.6$ 19.4$ 2.47% -1.1%
2005 919.9$ 23.0$ 23.3$ 2.53% 1.3%
2006 898.3$ 22.5$ 30.0$ 3.34% 33.6%
2007 732.5$ 18.3$ 25.2$ 3.44% 37.6%
2008 621.1$ 15.5$ 19.5$ 3.14% 25.6%
2009 709.5$ 17.7$ 20.9$ 2.94% 17.7%
2010 804.2$ 20.1$ 23.4$ 2.91% 16.4%
2011 468.0$ 11.7$ 19.3$ 4.12% 64.7%
Overall 5,937.4$ 148.4$ 180.9$ 3.05% 21.9%
Agency Name: Department of Homeland Security
Phase I Phase II Total Award
Amount ($
thousands)
Minority-Owned / Disadvantaged HUBZone Women-Owned
At or above 2.5%
2.45% to 2.49%
Below 2.45%
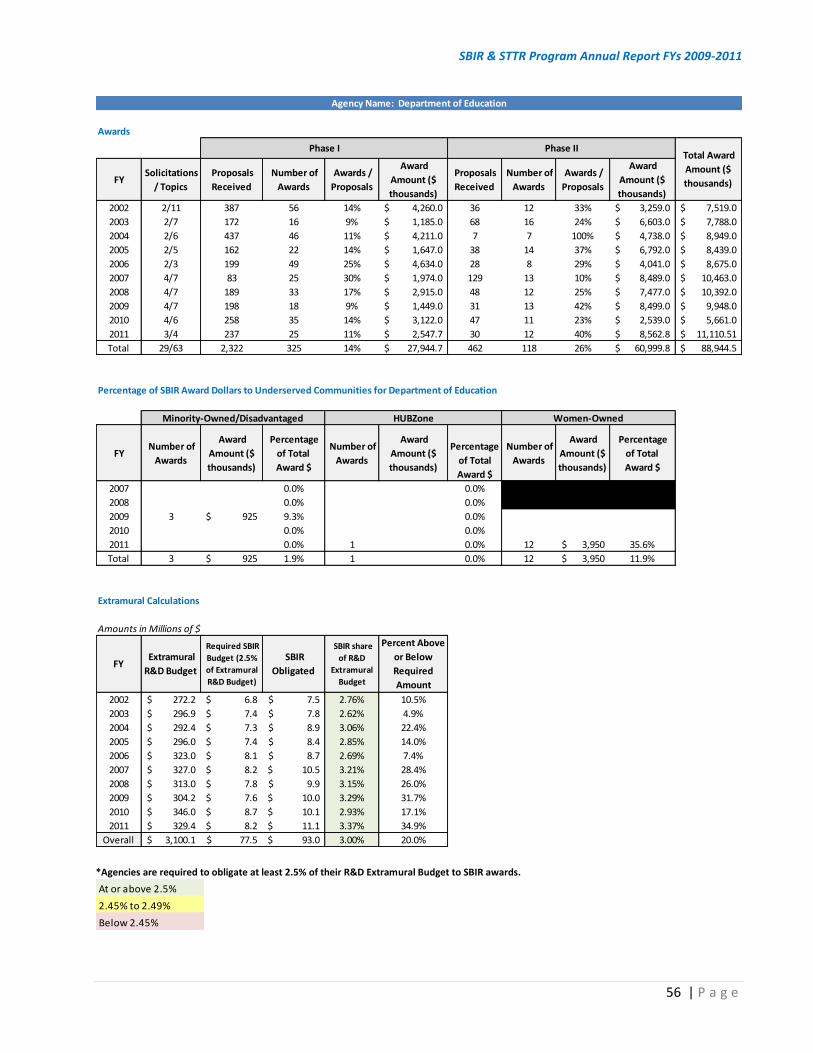
SBIR & STTR Program Annual Report FYs 2009-2011
56 | P a g e
*Agencies are required to obligate at least 2.5% of their R&D Extramural Budget to SBIR awards.
Awards
FY Solicitations
/ Topics
Proposals
Received
Number of
Awards
Awards /
Proposals
Award
Amount ($
thousands)
Proposals
Received
Number of
Awards
Awards /
Proposals
Award
Amount ($
thousands)
2002 2/11 387 56 14% 4,260.0$ 36 12 33% 3,259.0$ 7,519.0$
2003 2/7 172 16 9% 1,185.0$ 68 16 24% 6,603.0$ 7,788.0$
2004 2/6 437 46 11% 4,211.0$ 7 7 100% 4,738.0$ 8,949.0$
2005 2/5 162 22 14% 1,647.0$ 38 14 37% 6,792.0$ 8,439.0$
2006 2/3 199 49 25% 4,634.0$ 28 8 29% 4,041.0$ 8,675.0$
2007 4/7 83 25 30% 1,974.0$ 129 13 10% 8,489.0$ 10,463.0$
2008 4/7 189 33 17% 2,915.0$ 48 12 25% 7,477.0$ 10,392.0$
2009 4/7 198 18 9% 1,449.0$ 31 13 42% 8,499.0$ 9,948.0$
2010 4/6 258 35 14% 3,122.0$ 47 11 23% 2,539.0$ 5,661.0$
2011 3/4 237 25 11% 2,547.7$ 30 12 40% 8,562.8$ 11,110.51$
Total 29/63 2,322 325 14% 27,944.7$ 462 118 26% 60,999.8$ 88,944.5$
Percentage of SBIR Award Dollars to Underserved Communities for Department of Education
FY Number of
Awards
Award
Amount ($
thousands)
Percentage
of Total
Award $
Number of
Awards
Award
Amount ($
thousands)
Percentage
of Total
Award $
Number of
Awards
Award
Amount ($
thousands)
Percentage
of Total
Award $
2007 0.0% 0.0%
2008 0.0% 0.0%
2009 3 925$ 9.3% 0.0%
2010 0.0% 0.0%
2011 0.0% 1 0.0% 12 3,950$ 35.6%
Total 3 925$ 1.9% 1 0.0% 12 3,950$ 11.9%
Extramural Calculations
Amounts in Millions of $
FY Extramural
R&D Budget
Required SBIR
Budget (2.5%
of Extramural
R&D Budget)
SBIR
Obligated
SBIR share
of R&D
Extramural
Budget
Percent Above
or Below
Required
Amount
2002 272.2$ 6.8$ 7.5$ 2.76% 10.5%
2003 296.9$ 7.4$ 7.8$ 2.62% 4.9%
2004 292.4$ 7.3$ 8.9$ 3.06% 22.4%
2005 296.0$ 7.4$ 8.4$ 2.85% 14.0%
2006 323.0$ 8.1$ 8.7$ 2.69% 7.4%
2007 327.0$ 8.2$ 10.5$ 3.21% 28.4%
2008 313.0$ 7.8$ 9.9$ 3.15% 26.0%
2009 304.2$ 7.6$ 10.0$ 3.29% 31.7%
2010 346.0$ 8.7$ 10.1$ 2.93% 17.1%
2011 329.4$ 8.2$ 11.1$ 3.37% 34.9%
Overall 3,100.1$ 77.5$ 93.0$ 3.00% 20.0%
Phase I Phase II Total Award
Amount ($
thousands)
Agency Name: Department of Education
Minority-Owned/Disadvantaged HUBZone Women-Owned
At or above 2.5%
2.45% to 2.49%
Below 2.45%

SBIR & STTR Program Annual Report FYs 2009-2011
57 | P a g e
*Agencies are required to obligate at least 2.5% of their R&D Extramural Budget to SBIR awards.
Awards
FY Solicitations
/ Topics
Proposals
Received
Number of
Awards
Awards /
Proposals
Award
Amount ($
thousands)
Proposals
Received
Number of
Awards
Awards /
Proposals
Award
Amount ($
thousands)
2002 2/22 308 47 15% 3,347.0$ 25 13 52% 3,597.0$ 6,944.0$
2003 2/19 272 45 17% 3,220.0$ 43 19 44% 5,094.0$ 8,314.0$
2004 2/19 345 49 14% 3,559.0$ 43 19 44% 4,998.0$ 8,557.0$
2005 2/18 344 49 14% 3,497.0$ 44 19 43% 5,360.0$ 8,857.0$
2006 2/15 205 23 11% 2,037.0$ 35 18 51% 5,041.0$ 7,078.0$
2007 1/4 149 12 8% 1,100.0$ 22 4 18% 1,200.0$ 2,300.0$
2008 3/13 194 40 21% 3,652.0$ 10 6 60% 2,108.0$ 5,760.0$
2009 2/13 250 40 16% 3,539.0$ 35 28 80% 8,992.0$ 12,531.0$
2010 2/18 318 25 8% 2,323.0$ 37 15 41% 4,621.0$ 6,944.0$
2011 2/11 281 23 8% 2,116.6$ 23 12 52% 3,997.8$ 6,114.45$
Total 20/152 2,666 353 13% 28,390.6$ 317 153 48% 45,008.8$ 73,399.4$
Percentage of SBIR Award Dollars to Underserved Communities for Department of Commerce
FY Number of
Awards
Award
Amount ($
thousands)
Percentage
of Total
Award $
Number of
Awards
Award
Amount ($
thousands)
Percentage
of Total
Award $
Number of
Awards
Award
Amount ($
thousands)
Percentage
of Total
Award $
2007 2 374$ 16.3% 1 400$ 17.4%
2008 4 365$ 6.3% 3 1,007$ 17.5%
2009 1 89$ 0.7% 0.0%
2010 3 791$ 11.4% 0.0%
2011 3 585$ 9.6% 0.0% 2 495$ 8.1%
Total 13 2,204$ 8.9% 4 1,407$ 7.0% 2 495$ 2.7%
Extramural Calculations
Amounts in Millions of $
FY Extramural
R&D Budget
Required SBIR
Budget (2.5%
of Extramural
R&D Budget)
SBIR
Obligated
SBIR share
of R&D
Extramural
Budget
Percent Above
or Below
Required
Amount
2002 275.5$ 6.9$ 6.9$ 2.52% 0.8%
2003 333.7$ 8.3$ 8.3$ 2.49% -0.3%
2004 337.8$ 8.4$ 8.6$ 2.53% 1.3%
2005 355.8$ 8.9$ 8.9$ 2.49% -0.4%
2006 253.6$ 6.3$ 7.1$ 2.79% 11.7%
2007 221.3$ 5.5$ 4.5$ 2.02% -19.3%
2008 248.3$ 6.2$ 5.8$ 2.32% -7.2%
2009 299.4$ 7.5$ 12.5$ 4.17% 67.0%
2010 280.6$ 7.0$ 6.9$ 2.48% -1.0%
2011 238.6$ 6.0$ 6.1$ 2.56% 2.5%
Overall 2,844.6$ 71.1$ 75.5$ 2.66% 6.2%
Phase I Phase II Total Award
Amount ($
thousands)
Agency Name: Department of Commerce
Minority-Owned/Disadvantaged HUBZone Women-Owned
At or above 2.5%
2.45% to 2.49%
Below 2.45%
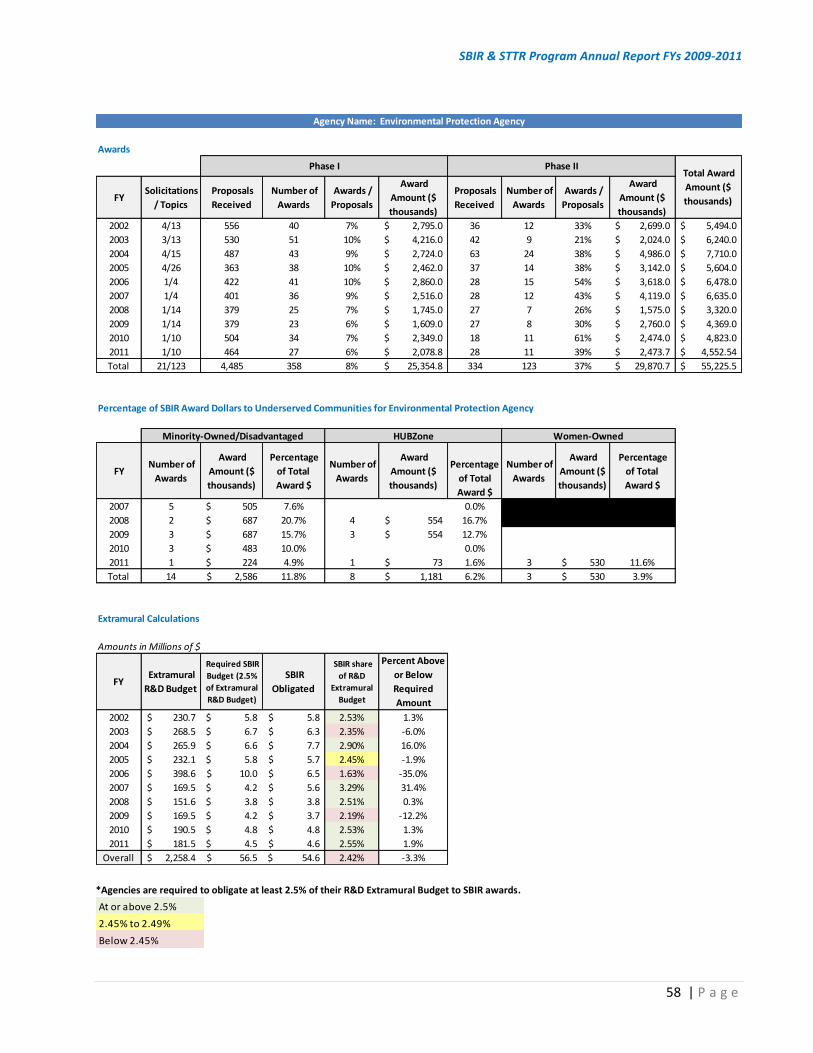
SBIR & STTR Program Annual Report FYs 2009-2011
58 | P a g e
*Agencies are required to obligate at least 2.5% of their R&D Extramural Budget to SBIR awards.
Awards
FY Solicitations
/ Topics
Proposals
Received
Number of
Awards
Awards /
Proposals
Award
Amount ($
thousands)
Proposals
Received
Number of
Awards
Awards /
Proposals
Award
Amount ($
thousands)
2002 4/13 556 40 7% 2,795.0$ 36 12 33% 2,699.0$ 5,494.0$
2003 3/13 530 51 10% 4,216.0$ 42 9 21% 2,024.0$ 6,240.0$
2004 4/15 487 43 9% 2,724.0$ 63 24 38% 4,986.0$ 7,710.0$
2005 4/26 363 38 10% 2,462.0$ 37 14 38% 3,142.0$ 5,604.0$
2006 1/4 422 41 10% 2,860.0$ 28 15 54% 3,618.0$ 6,478.0$
2007 1/4 401 36 9% 2,516.0$ 28 12 43% 4,119.0$ 6,635.0$
2008 1/14 379 25 7% 1,745.0$ 27 7 26% 1,575.0$ 3,320.0$
2009 1/14 379 23 6% 1,609.0$ 27 8 30% 2,760.0$ 4,369.0$
2010 1/10 504 34 7% 2,349.0$ 18 11 61% 2,474.0$ 4,823.0$
2011 1/10 464 27 6% 2,078.8$ 28 11 39% 2,473.7$ 4,552.54$
Total 21/123 4,485 358 8% 25,354.8$ 334 123 37% 29,870.7$ 55,225.5$
Percentage of SBIR Award Dollars to Underserved Communities for Environmental Protection Agency
FY Number of
Awards
Award
Amount ($
thousands)
Percentage
of Total
Award $
Number of
Awards
Award
Amount ($
thousands)
Percentage
of Total
Award $
Number of
Awards
Award
Amount ($
thousands)
Percentage
of Total
Award $
2007 5 505$ 7.6% 0.0%
2008 2 687$ 20.7% 4 554$ 16.7%
2009 3 687$ 15.7% 3 554$ 12.7%
2010 3 483$ 10.0% 0.0%
2011 1 224$ 4.9% 1 73$ 1.6% 3 530$ 11.6%
Total 14 2,586$ 11.8% 8 1,181$ 6.2% 3 530$ 3.9%
Extramural Calculations
Amounts in Millions of $
FY Extramural
R&D Budget
Required SBIR
Budget (2.5%
of Extramural
R&D Budget)
SBIR
Obligated
SBIR share
of R&D
Extramural
Budget
Percent Above
or Below
Required
Amount
2002 230.7$ 5.8$ 5.8$ 2.53% 1.3%
2003 268.5$ 6.7$ 6.3$ 2.35% -6.0%
2004 265.9$ 6.6$ 7.7$ 2.90% 16.0%
2005 232.1$ 5.8$ 5.7$ 2.45% -1.9%
2006 398.6$ 10.0$ 6.5$ 1.63% -35.0%
2007 169.5$ 4.2$ 5.6$ 3.29% 31.4%
2008 151.6$ 3.8$ 3.8$ 2.51% 0.3%
2009 169.5$ 4.2$ 3.7$ 2.19% -12.2%
2010 190.5$ 4.8$ 4.8$ 2.53% 1.3%
2011 181.5$ 4.5$ 4.6$ 2.55% 1.9%
Overall 2,258.4$ 56.5$ 54.6$ 2.42% -3.3%
Phase I Phase II Total Award
Amount ($
thousands)
Agency Name: Environmental Protection Agency
Minority-Owned/Disadvantaged HUBZone Women-Owned
At or above 2.5%
2.45% to 2.49%
Below 2.45%
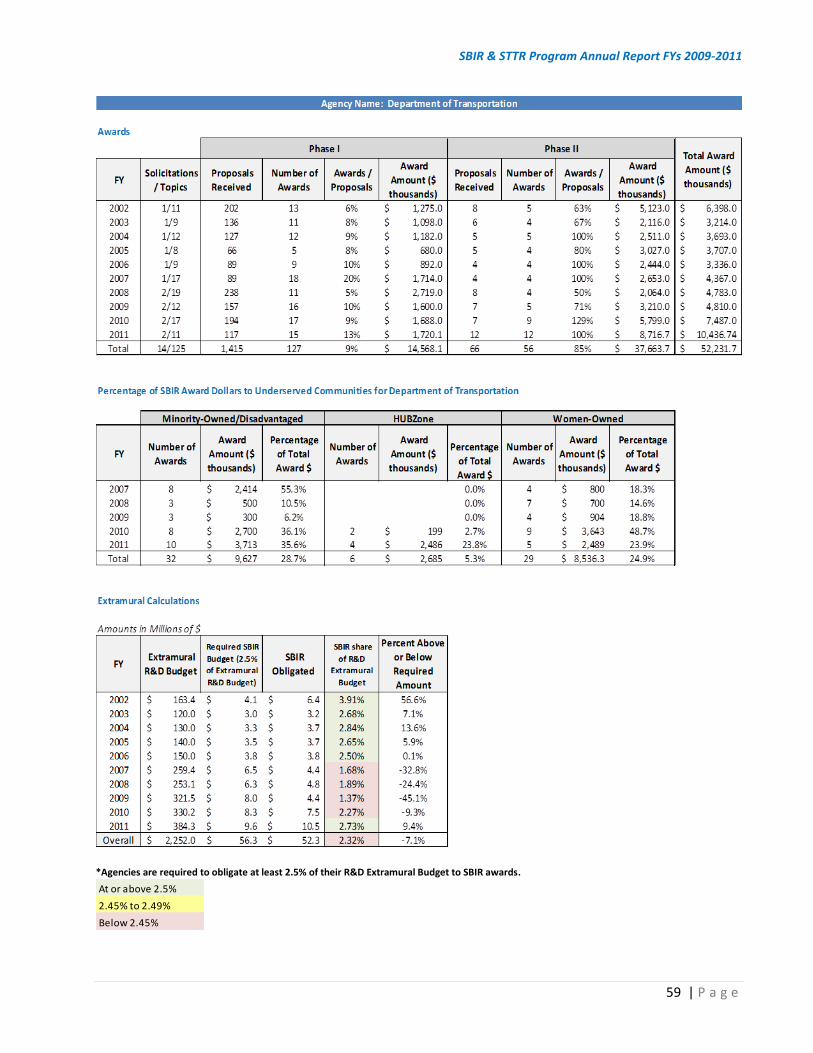
SBIR & STTR Program Annual Report FYs 2009-2011
59 | P a g e
*Agencies are required to obligate at least 2.5% of their R&D Extramural Budget to SBIR awards.
At or above 2.5%
2.45% to 2.49%
Below 2.45%
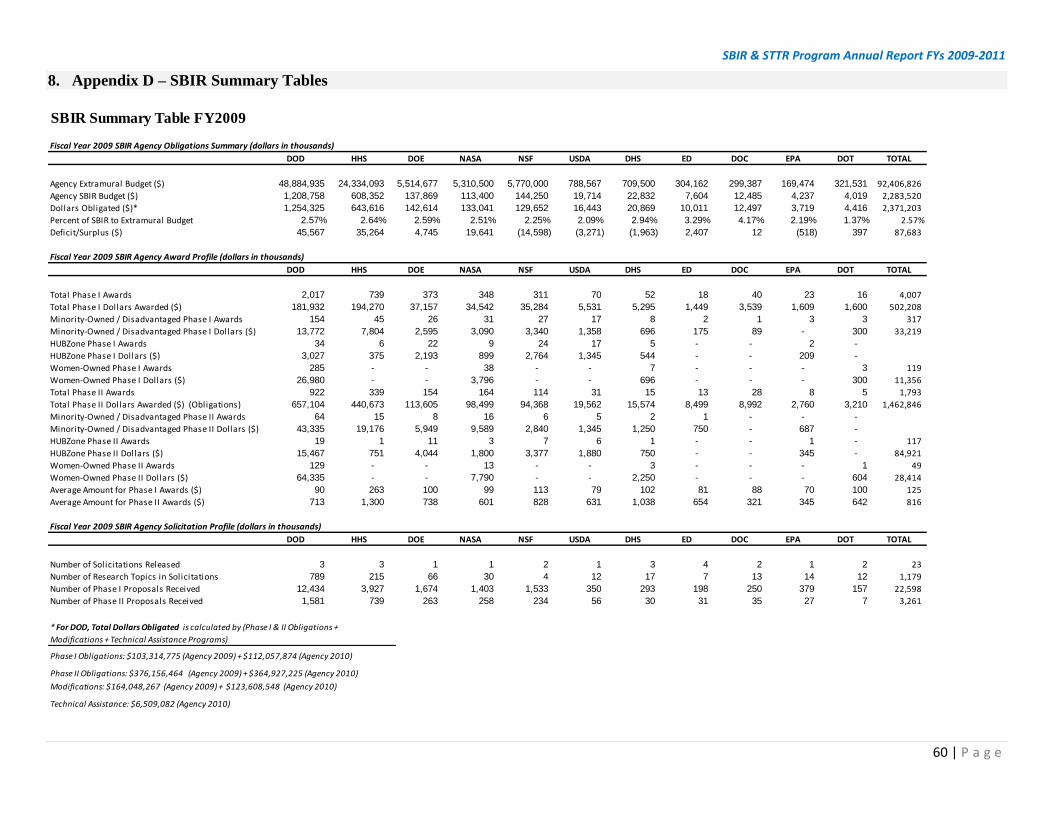
SBIR & STTR Program Annual Report FYs 2009-2011
60 | P a g e
8. Appendix D – SBIR Summary Tables
SBIR Summary Table FY2009
Fiscal Year 2009 SBIR Agency Obligations Summary (dollars in thousands)
DOD HHS DOE NASA NSF USDA DHS ED DOC EPA DOT TOTAL
Agency Extramural Budget ($) 48,884,935 24,334,093 5,514,677 5,310,500 5,770,000 788,567 709,500 304,162 299,387 169,474 321,531 92,406,826
Agency SBIR Budget ($) 1,208,758 608,352 137,869 113,400 144,250 19,714 22,832 7,604 12,485 4,237 4,019 2,283,520
Dollars Obligated ($)* 1,254,325 643,616 142,614 133,041 129,652 16,443 20,869 10,011 12,497 3,719 4,416 2,371,203
Percent of SBIR to Extramural Budget 2.57% 2.64% 2.59% 2.51% 2.25% 2.09% 2.94% 3.29% 4.17% 2.19% 1.37% 2.57%
Deficit/Surplus ($) 45,567 35,264 4,745 19,641 (14,598) (3,271) (1,963) 2,407 12 (518) 397 87,683
Fiscal Year 2009 SBIR Agency Award Profile (dollars in thousands)
DOD HHS DOE NASA NSF USDA DHS ED DOC EPA DOT TOTAL
Total Phase I Awards 2,017 739 373 348 311 70 52 18 40 23 16 4,007
Total Phase I Dollars Awarded ($) 181,932 194,270 37,157 34,542 35,284 5,531 5,295 1,449 3,539 1,609 1,600 502,208
Minority-Owned / Disadvantaged Phase I Awards 154 45 26 31 27 17 8 2 1 3 3 317
Minority-Owned / Disadvantaged Phase I Dollars ($) 13,772 7,804 2,595 3,090 3,340 1,358 696 175 89 - 300 33,219
HUBZone Phase I Awards 34 6 22 9 24 17 5 - - 2 -
HUBZone Phase I Dollars ($) 3,027 375 2,193 899 2,764 1,345 544 - - 209 -
Women-Owned Phase I Awards 285 - - 38 - - 7 - - - 3 119
Women-Owned Phase I Dollars ($) 26,980 - - 3,796 - - 696 - - - 300 11,356
Total Phase II Awards 922 339 154 164 114 31 15 13 28 8 5 1,793
Total Phase II Dollars Awarded ($) (Obligations) 657,104 440,673 113,605 98,499 94,368 19,562 15,574 8,499 8,992 2,760 3,210 1,462,846
Minority-Owned / Disadvantaged Phase II Awards 64 15 8 16 6 5 2 1 - - -
Minority-Owned / Disadvantaged Phase II Dollars ($) 43,335 19,176 5,949 9,589 2,840 1,345 1,250 750 - 687 -
HUBZone Phase II Awards 19 1 11 3 7 6 1 - - 1 - 117
HUBZone Phase II Dollars ($) 15,467 751 4,044 1,800 3,377 1,880 750 - - 345 - 84,921
Women-Owned Phase II Awards 129 - - 13 - - 3 - - - 1 49
Women-Owned Phase II Dollars ($) 64,335 - - 7,790 - - 2,250 - - - 604 28,414
Average Amount for Phase I Awards ($) 90 263 100 99 113 79 102 81 88 70 100 125
Average Amount for Phase II Awards ($) 713 1,300 738 601 828 631 1,038 654 321 345 642 816
Fiscal Year 2009 SBIR Agency Solicitation Profile (dollars in thousands)
DOD HHS DOE NASA NSF USDA DHS ED DOC EPA DOT TOTAL
Number of Solicitations Released 3 3 1 1 2 1 3 4 2 1 2 23
Number of Research Topics in Solicitations 789 215 66 30 4 12 17 7 13 14 12 1,179
Number of Phase I Proposals Received 12,434 3,927 1,674 1,403 1,533 350 293 198 250 379 157 22,598
Number of Phase II Proposals Received 1,581 739 263 258 234 56 30 31 35 27 7 3,261
* For DOD, Total Dollars Obligated is calculated by (Phase I & II Obligations +
Modifications + Technical Assistance Programs)
Phase I Obligations: $103,314,775 (Agency 2009) + $112,057,874 (Agency 2010)
Phase II Obligations: $376,156,464 (Agency 2009) + $364,927,225 (Agency 2010)
Modifications: $164,048,267 (Agency 2009) + $123,608,548 (Agency 2010)
Technical Assistance: $6,509,082 (Agency 2010)
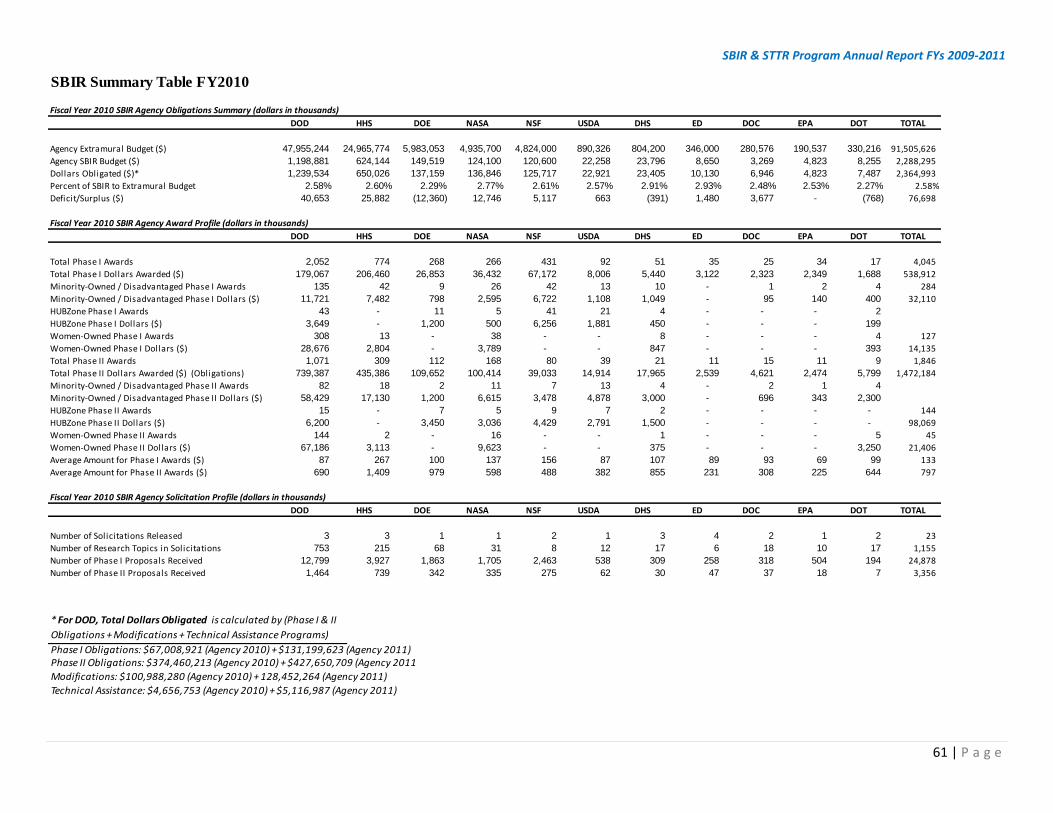
SBIR & STTR Program Annual Report FYs 2009-2011
61 | P a g e
SBIR Summary Table FY2010
Fiscal Year 2010 SBIR Agency Obligations Summary (dollars in thousands)
DOD HHS DOE NASA NSF USDA DHS ED DOC EPA DOT TOTAL
Agency Extramural Budget ($) 47,955,244 24,965,774 5,983,053 4,935,700 4,824,000 890,326 804,200 346,000 280,576 190,537 330,216 91,505,626
Agency SBIR Budget ($) 1,198,881 624,144 149,519 124,100 120,600 22,258 23,796 8,650 3,269 4,823 8,255 2,288,295
Dollars Obligated ($)* 1,239,534 650,026 137,159 136,846 125,717 22,921 23,405 10,130 6,946 4,823 7,487 2,364,993
Percent of SBIR to Extramural Budget 2.58% 2.60% 2.29% 2.77% 2.61% 2.57% 2.91% 2.93% 2.48% 2.53% 2.27% 2.58%
Deficit/Surplus ($) 40,653 25,882 (12,360) 12,746 5,117 663 (391) 1,480 3,677 - (768) 76,698
Fiscal Year 2010 SBIR Agency Award Profile (dollars in thousands)
DOD HHS DOE NASA NSF USDA DHS ED DOC EPA DOT TOTAL
Total Phase I Awards 2,052 774 268 266 431 92 51 35 25 34 17 4,045
Total Phase I Dollars Awarded ($) 179,067 206,460 26,853 36,432 67,172 8,006 5,440 3,122 2,323 2,349 1,688 538,912
Minority-Owned / Disadvantaged Phase I Awards 135 42 9 26 42 13 10 - 1 2 4 284
Minority-Owned / Disadvantaged Phase I Dollars ($) 11,721 7,482 798 2,595 6,722 1,108 1,049 - 95 140 400 32,110
HUBZone Phase I Awards 43 - 11 5 41 21 4 - - - 2
HUBZone Phase I Dollars ($) 3,649 - 1,200 500 6,256 1,881 450 - - - 199
Women-Owned Phase I Awards 308 13 - 38 - - 8 - - - 4 127
Women-Owned Phase I Dollars ($) 28,676 2,804 - 3,789 - - 847 - - - 393 14,135
Total Phase II Awards 1,071 309 112 168 80 39 21 11 15 11 9 1,846
Total Phase II Dollars Awarded ($) (Obligations) 739,387 435,386 109,652 100,414 39,033 14,914 17,965 2,539 4,621 2,474 5,799 1,472,184
Minority-Owned / Disadvantaged Phase II Awards 82 18 2 11 7 13 4 - 2 1 4
Minority-Owned / Disadvantaged Phase II Dollars ($) 58,429 17,130 1,200 6,615 3,478 4,878 3,000 - 696 343 2,300
HUBZone Phase II Awards 15 - 7 5 9 7 2 - - - - 144
HUBZone Phase II Dollars ($) 6,200 - 3,450 3,036 4,429 2,791 1,500 - - - - 98,069
Women-Owned Phase II Awards 144 2 - 16 - - 1 - - - 5 45
Women-Owned Phase II Dollars ($) 67,186 3,113 - 9,623 - - 375 - - - 3,250 21,406
Average Amount for Phase I Awards ($) 87 267 100 137 156 87 107 89 93 69 99 133
Average Amount for Phase II Awards ($) 690 1,409 979 598 488 382 855 231 308 225 644 797
Fiscal Year 2010 SBIR Agency Solicitation Profile (dollars in thousands)
DOD HHS DOE NASA NSF USDA DHS ED DOC EPA DOT TOTAL
Number of Solicitations Released 3 3 1 1 2 1 3 4 2 1 2 23
Number of Research Topics in Solicitations 753 215 68 31 8 12 17 6 18 10 17 1,155
Number of Phase I Proposals Received 12,799 3,927 1,863 1,705 2,463 538 309 258 318 504 194 24,878
Number of Phase II Proposals Received 1,464 739 342 335 275 62 30 47 37 18 7 3,356
* For DOD, Total Dollars Obligated is calculated by (Phase I & II
Obligations + Modifications + Technical Assistance Programs)
Phase I Obligations: $67,008,921 (Agency 2010) + $131,199,623 (Agency 2011)Phase II Obligations: $374,460,213 (Agency 2010) + $427,650,709 (Agency 2011)
Modifications: $100,988,280 (Agency 2010) + 128,452,264 (Agency 2011)
Technical Assistance: $4,656,753 (Agency 2010) + $5,116,987 (Agency 2011)
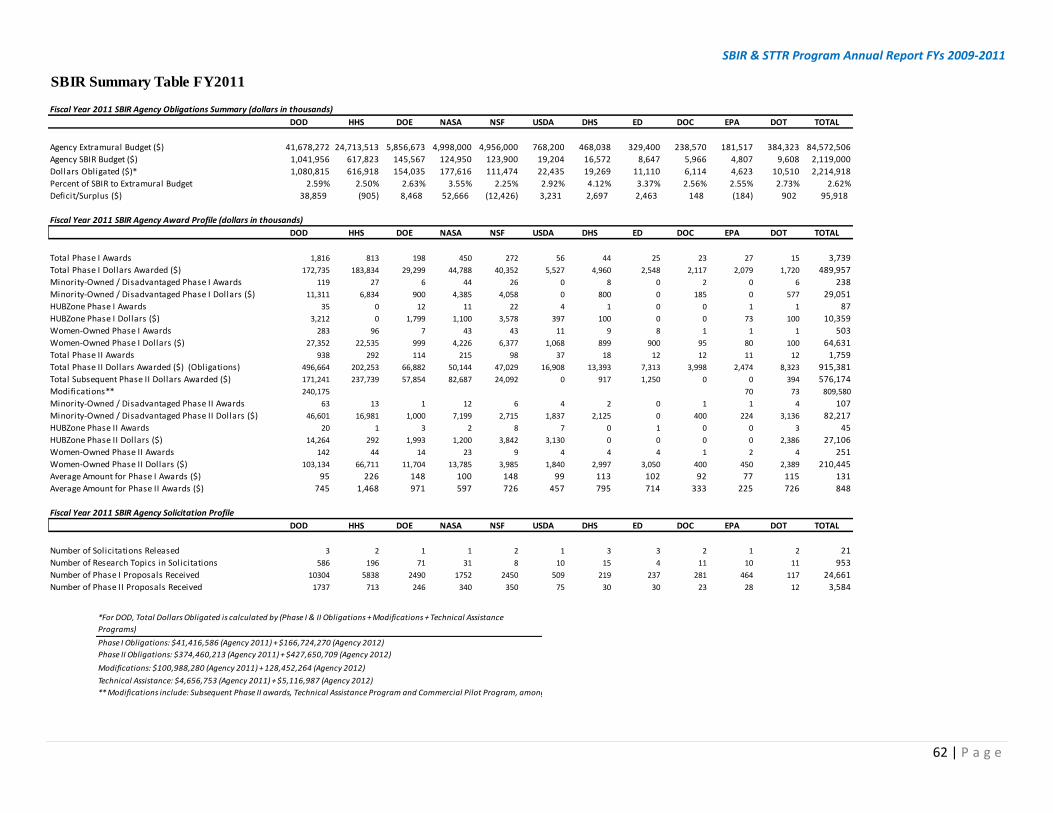
SBIR & STTR Program Annual Report FYs 2009-2011
62 | P a g e
SBIR Summary Table FY2011
Fiscal Year 2011 SBIR Agency Obligations Summary (dollars in thousands)
DOD HHS DOE NASA NSF USDA DHS ED DOC EPA DOT TOTAL
Agency Extramural Budget ($) 41,678,272 24,713,513 5,856,673 4,998,000 4,956,000 768,200 468,038 329,400 238,570 181,517 384,323 84,572,506
Agency SBIR Budget ($) 1,041,956 617,823 145,567 124,950 123,900 19,204 16,572 8,647 5,966 4,807 9,608 2,119,000
Dollars Obligated ($)* 1,080,815 616,918 154,035 177,616 111,474 22,435 19,269 11,110 6,114 4,623 10,510 2,214,918
Percent of SBIR to Extramural Budget 2.59% 2.50% 2.63% 3.55% 2.25% 2.92% 4.12% 3.37% 2.56% 2.55% 2.73% 2.62%
Deficit/Surplus ($) 38,859 (905) 8,468 52,666 (12,426) 3,231 2,697 2,463 148 (184) 902 95,918
Fiscal Year 2011 SBIR Agency Award Profile (dollars in thousands)
DOD HHS DOE NASA NSF USDA DHS ED DOC EPA DOT TOTAL
Total Phase I Awards 1,816 813 198 450 272 56 44 25 23 27 15 3,739
Total Phase I Dollars Awarded ($) 172,735 183,834 29,299 44,788 40,352 5,527 4,960 2,548 2,117 2,079 1,720 489,957
Minority-Owned / Disadvantaged Phase I Awards 119 27 6 44 26 0 8 0 2 0 6 238
Minority-Owned / Disadvantaged Phase I Dollars ($) 11,311 6,834 900 4,385 4,058 0 800 0 185 0 577 29,051
HUBZone Phase I Awards 35 0 12 11 22 4 1 0 0 1 1 87
HUBZone Phase I Dollars ($) 3,212 0 1,799 1,100 3,578 397 100 0 0 73 100 10,359
Women-Owned Phase I Awards 283 96 7 43 43 11 9 8 1 1 1 503
Women-Owned Phase I Dollars ($) 27,352 22,535 999 4,226 6,377 1,068 899 900 95 80 100 64,631
Total Phase II Awards 938 292 114 215 98 37 18 12 12 11 12 1,759
Total Phase II Dollars Awarded ($) (Obligations) 496,664 202,253 66,882 50,144 47,029 16,908 13,393 7,313 3,998 2,474 8,323 915,381
Total Subsequent Phase II Dollars Awarded ($) 171,241 237,739 57,854 82,687 24,092 0 917 1,250 0 0 394 576,174
Modifications** 240,175 70 73 809,580
Minority-Owned / Disadvantaged Phase II Awards 63 13 1 12 6 4 2 0 1 1 4 107
Minority-Owned / Disadvantaged Phase II Dollars ($) 46,601 16,981 1,000 7,199 2,715 1,837 2,125 0 400 224 3,136 82,217
HUBZone Phase II Awards 20 1 3 2 8 7 0 1 0 0 3 45
HUBZone Phase II Dollars ($) 14,264 292 1,993 1,200 3,842 3,130 0 0 0 0 2,386 27,106
Women-Owned Phase II Awards 142 44 14 23 9 4 4 4 1 2 4 251
Women-Owned Phase II Dollars ($) 103,134 66,711 11,704 13,785 3,985 1,840 2,997 3,050 400 450 2,389 210,445
Average Amount for Phase I Awards ($) 95 226 148 100 148 99 113 102 92 77 115 131
Average Amount for Phase II Awards ($) 745 1,468 971 597 726 457 795 714 333 225 726 848
Fiscal Year 2011 SBIR Agency Solicitation Profile
DOD HHS DOE NASA NSF USDA DHS ED DOC EPA DOT TOTAL
Number of Solicitations Released 3 2 1 1 2 1 3 3 2 1 2 21
Number of Research Topics in Solicitations 586 196 71 31 8 10 15 4 11 10 11 953
Number of Phase I Proposals Received 10304 5838 2490 1752 2450 509 219 237 281 464 117 24,661
Number of Phase II Proposals Received 1737 713 246 340 350 75 30 30 23 28 12 3,584
*For DOD, Total Dollars Obligated is calculated by (Phase I & II Obligations + Modifications + Technical Assistance
Programs)
Phase I Obligations: $41,416,586 (Agency 2011) + $166,724,270 (Agency 2012)
Phase II Obligations: $374,460,213 (Agency 2011) + $427,650,709 (Agency 2012)
Modifications: $100,988,280 (Agency 2011) + 128,452,264 (Agency 2012)
Technical Assistance: $4,656,753 (Agency 2011) + $5,116,987 (Agency 2012)
** Modifications include: Subsequent Phase II awards, Technical Assistance Program and Commercial Pilot Program, among others.
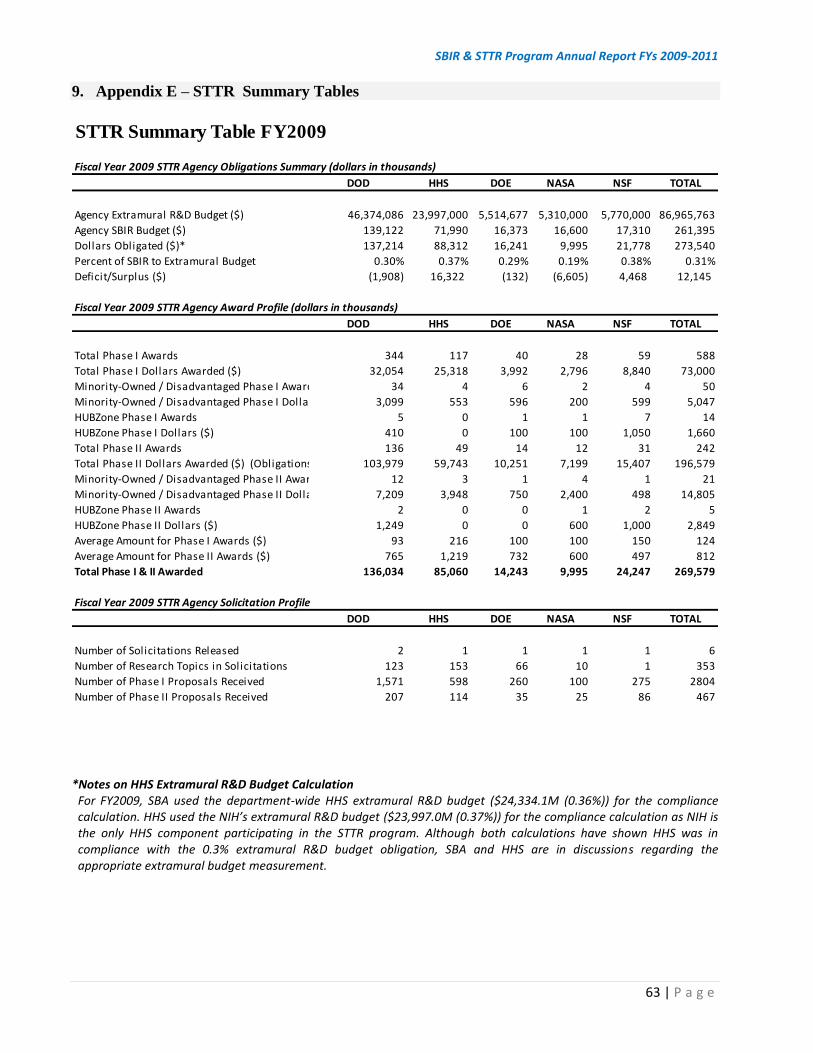
SBIR & STTR Program Annual Report FYs 2009-2011
63 | P a g e
9. Appendix E – STTR Summary Tables
*Notes on HHS Extramural R&D Budget Calculation
For FY2009, SBA used the department-wide HHS extramural R&D budget ($24,334.1M (0.36%)) for the compliance calculation. HHS used the NIH’s extramural R&D budget ($23,997.0M (0.37%)) for the compliance calculation as NIH is the only HHS component participating in the STTR program. Although both calculations have shown HHS was in compliance with the 0.3% extramural R&D budget obligation, SBA and HHS are in discussions regarding the appropriate extramural budget measurement.
STTR Summary Table FY2009
Fiscal Year 2009 STTR Agency Obligations Summary (dollars in thousands)
DOD HHS DOE NASA NSF TOTAL
Agency Extramural R&D Budget ($) 46,374,086 23,997,000 5,514,677 5,310,000 5,770,000 86,965,763
Agency SBIR Budget ($) 139,122 71,990 16,373 16,600 17,310 261,395
Dollars Obligated ($)* 137,214 88,312 16,241 9,995 21,778 273,540
Percent of SBIR to Extramural Budget 0.30% 0.37% 0.29% 0.19% 0.38% 0.31%
Deficit/Surplus ($) (1,908) 16,322 (132) (6,605) 4,468 12,145
Fiscal Year 2009 STTR Agency Award Profile (dollars in thousands)
DOD HHS DOE NASA NSF TOTAL
Total Phase I Awards 344 117 40 28 59 588
Total Phase I Dollars Awarded ($) 32,054 25,318 3,992 2,796 8,840 73,000
Minority-Owned / Disadvantaged Phase I Awards 34 4 6 2 4 50
Minority-Owned / Disadvantaged Phase I Dollars ($) 3,099 553 596 200 599 5,047
HUBZone Phase I Awards 5 0 1 1 7 14
HUBZone Phase I Dollars ($) 410 0 100 100 1,050 1,660
Total Phase II Awards 136 49 14 12 31 242
Total Phase II Dollars Awarded ($) (Obligations) 103,979 59,743 10,251 7,199 15,407 196,579
Minority-Owned / Disadvantaged Phase II Awards 12 3 1 4 1 21
Minority-Owned / Disadvantaged Phase II Dollars ($) 7,209 3,948 750 2,400 498 14,805
HUBZone Phase II Awards 2 0 0 1 2 5
HUBZone Phase II Dollars ($) 1,249 0 0 600 1,000 2,849
Average Amount for Phase I Awards ($) 93 216 100 100 150 124
Average Amount for Phase II Awards ($) 765 1,219 732 600 497 812
Total Phase I & II Awarded 136,034 85,060 14,243 9,995 24,247 269,579
Fiscal Year 2009 STTR Agency Solicitation Profile
DOD HHS DOE NASA NSF TOTAL
Number of Solicitations Released 2 1 1 1 1 6
Number of Research Topics in Solicitations 123 153 66 10 1 353
Number of Phase I Proposals Received 1,571 598 260 100 275 2804
Number of Phase II Proposals Received 207 114 35 25 86 467
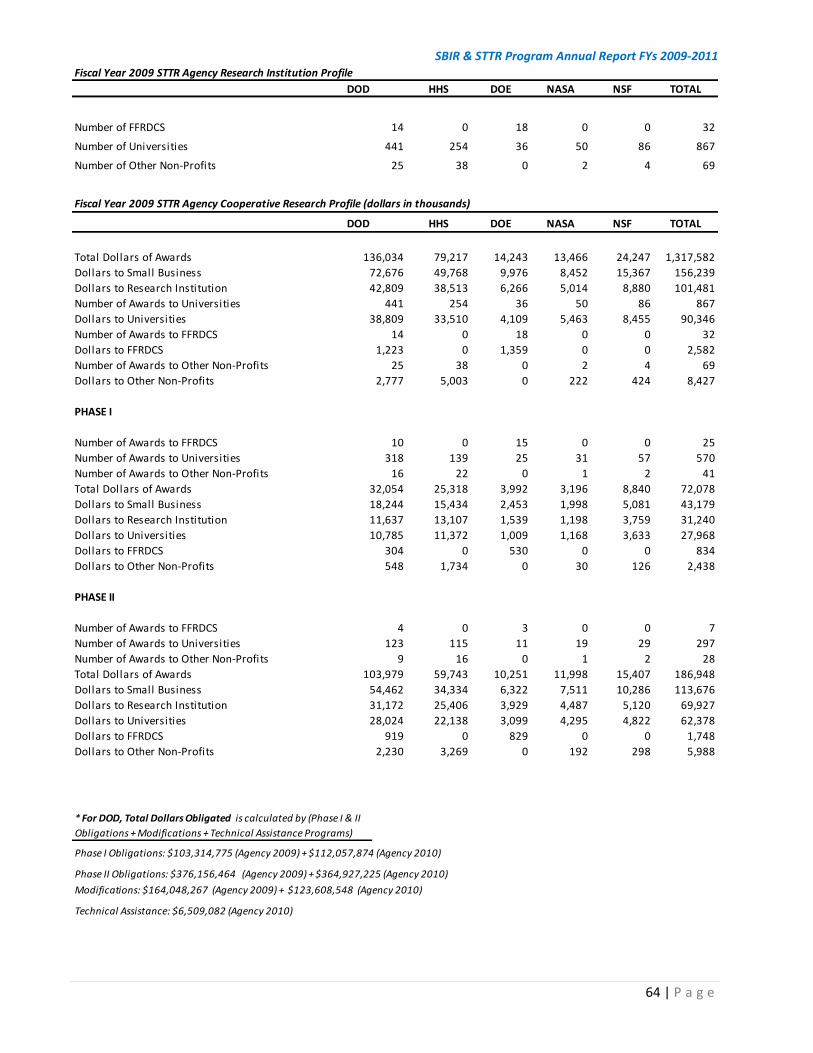
SBIR & STTR Program Annual Report FYs 2009-2011
64 | P a g e
Fiscal Year 2009 STTR Agency Research Institution Profile
DOD HHS DOE NASA NSF TOTAL
Number of FFRDCS 14 0 18 0 0 32
Number of Universities 441 254 36 50 86 867
Number of Other Non-Profits 25 38 0 2 4 69
Fiscal Year 2009 STTR Agency Cooperative Research Profile (dollars in thousands)
DOD HHS DOE NASA NSF TOTAL
Total Dollars of Awards 136,034 79,217 14,243 13,466 24,247 1,317,582
Dollars to Small Business 72,676 49,768 9,976 8,452 15,367 156,239
Dollars to Research Institution 42,809 38,513 6,266 5,014 8,880 101,481
Number of Awards to Universities 441 254 36 50 86 867
Dollars to Universities 38,809 33,510 4,109 5,463 8,455 90,346
Number of Awards to FFRDCS 14 0 18 0 0 32
Dollars to FFRDCS 1,223 0 1,359 0 0 2,582
Number of Awards to Other Non-Profits 25 38 0 2 4 69
Dollars to Other Non-Profits 2,777 5,003 0 222 424 8,427
PHASE I
Number of Awards to FFRDCS 10 0 15 0 0 25
Number of Awards to Universities 318 139 25 31 57 570
Number of Awards to Other Non-Profits 16 22 0 1 2 41
Total Dollars of Awards 32,054 25,318 3,992 3,196 8,840 72,078
Dollars to Small Business 18,244 15,434 2,453 1,998 5,081 43,179
Dollars to Research Institution 11,637 13,107 1,539 1,198 3,759 31,240
Dollars to Universities 10,785 11,372 1,009 1,168 3,633 27,968
Dollars to FFRDCS 304 0 530 0 0 834
Dollars to Other Non-Profits 548 1,734 0 30 126 2,438
PHASE II
Number of Awards to FFRDCS 4 0 3 0 0 7
Number of Awards to Universities 123 115 11 19 29 297
Number of Awards to Other Non-Profits 9 16 0 1 2 28
Total Dollars of Awards 103,979 59,743 10,251 11,998 15,407 186,948
Dollars to Small Business 54,462 34,334 6,322 7,511 10,286 113,676
Dollars to Research Institution 31,172 25,406 3,929 4,487 5,120 69,927
Dollars to Universities 28,024 22,138 3,099 4,295 4,822 62,378
Dollars to FFRDCS 919 0 829 0 0 1,748
Dollars to Other Non-Profits 2,230 3,269 0 192 298 5,988
* For DOD, Total Dollars Obligated is calculated by (Phase I & II
Obligations + Modifications + Technical Assistance Programs)
Phase I Obligations: $103,314,775 (Agency 2009) + $112,057,874 (Agency 2010)
Phase II Obligations: $376,156,464 (Agency 2009) + $364,927,225 (Agency 2010)
Modifications: $164,048,267 (Agency 2009) + $123,608,548 (Agency 2010)
Technical Assistance: $6,509,082 (Agency 2010)
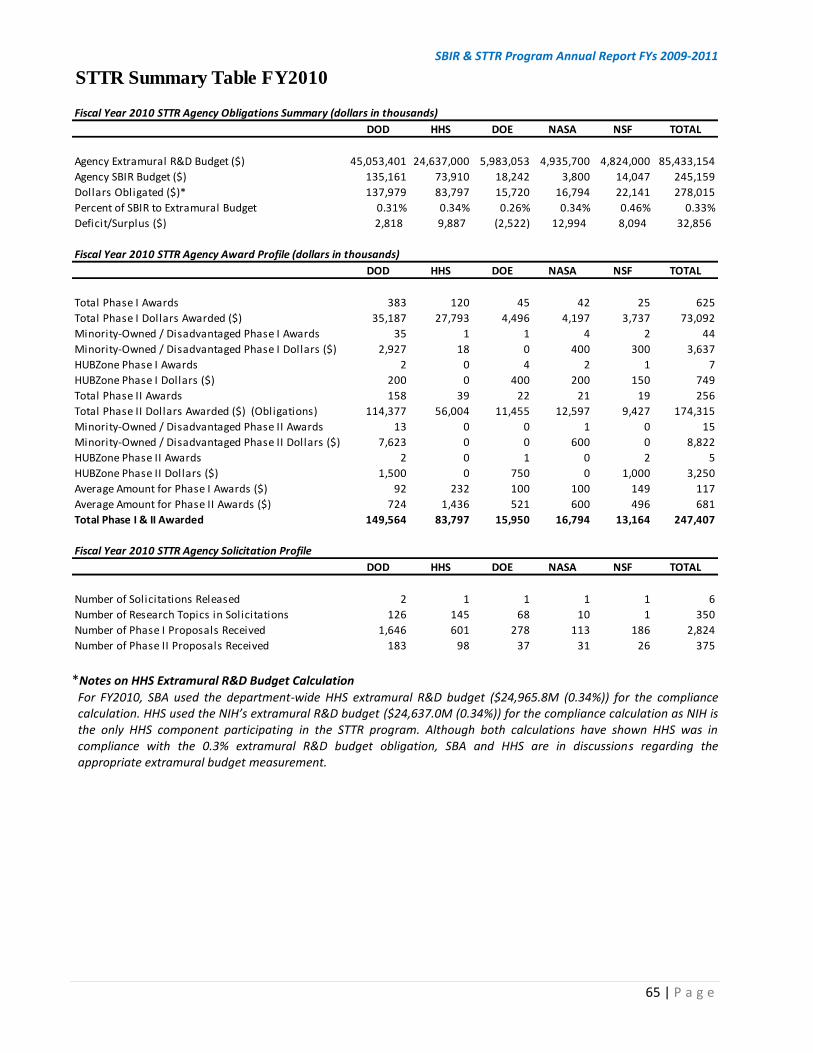
SBIR & STTR Program Annual Report FYs 2009-2011
65 | P a g e
*Notes on HHS Extramural R&D Budget Calculation
For FY2010, SBA used the department-wide HHS extramural R&D budget ($24,965.8M (0.34%)) for the compliance calculation. HHS used the NIH’s extramural R&D budget ($24,637.0M (0.34%)) for the compliance calculation as NIH is the only HHS component participating in the STTR program. Although both calculations have shown HHS was in compliance with the 0.3% extramural R&D budget obligation, SBA and HHS are in discussions regarding the appropriate extramural budget measurement.
STTR Summary Table FY2010
Fiscal Year 2010 STTR Agency Obligations Summary (dollars in thousands)
DOD HHS DOE NASA NSF TOTAL
Agency Extramural R&D Budget ($) 45,053,401 24,637,000 5,983,053 4,935,700 4,824,000 85,433,154
Agency SBIR Budget ($) 135,161 73,910 18,242 3,800 14,047 245,159
Dollars Obligated ($)* 137,979 83,797 15,720 16,794 22,141 278,015
Percent of SBIR to Extramural Budget 0.31% 0.34% 0.26% 0.34% 0.46% 0.33%
Deficit/Surplus ($) 2,818 9,887 (2,522) 12,994 8,094 32,856
Fiscal Year 2010 STTR Agency Award Profile (dollars in thousands)
DOD HHS DOE NASA NSF TOTAL
Total Phase I Awards 383 120 45 42 25 625
Total Phase I Dollars Awarded ($) 35,187 27,793 4,496 4,197 3,737 73,092
Minority-Owned / Disadvantaged Phase I Awards 35 1 1 4 2 44
Minority-Owned / Disadvantaged Phase I Dollars ($) 2,927 18 0 400 300 3,637
HUBZone Phase I Awards 2 0 4 2 1 7
HUBZone Phase I Dollars ($) 200 0 400 200 150 749
Total Phase II Awards 158 39 22 21 19 256
Total Phase II Dollars Awarded ($) (Obligations) 114,377 56,004 11,455 12,597 9,427 174,315
Minority-Owned / Disadvantaged Phase II Awards 13 0 0 1 0 15
Minority-Owned / Disadvantaged Phase II Dollars ($) 7,623 0 0 600 0 8,822
HUBZone Phase II Awards 2 0 1 0 2 5
HUBZone Phase II Dollars ($) 1,500 0 750 0 1,000 3,250
Average Amount for Phase I Awards ($) 92 232 100 100 149 117
Average Amount for Phase II Awards ($) 724 1,436 521 600 496 681
Total Phase I & II Awarded 149,564 83,797 15,950 16,794 13,164 247,407
Fiscal Year 2010 STTR Agency Solicitation Profile
DOD HHS DOE NASA NSF TOTAL
Number of Solicitations Released 2 1 1 1 1 6
Number of Research Topics in Solicitations 126 145 68 10 1 350
Number of Phase I Proposals Received 1,646 601 278 113 186 2,824
Number of Phase II Proposals Received 183 98 37 31 26 375

SBIR & STTR Program Annual Report FYs 2009-2011
66 | P a g e
Fiscal Year 2010 STTR Agency Research Institution Profile
DOD HHS DOE NASA NSF TOTAL
Number of FFRDCS 22 0 14 1 0 37
Number of Universities 494 212 49 58 44 857
Number of Other Non-Profits 25 40 0 1 0 66
Fiscal Year 2010 STTR Agency Cooperative Research Profile (dollars in thousands)
DOD HHS DOE NASA NSF TOTAL
Total Dollars of Awards 149,564 83,797 15,950 6,794 13,164 247,407
Dollars to Small Business 86,708 47,813 9,955 3,895 17,209 165,579
Dollars to Research Institution 49,607 34,854 5,600 2,899 4,932 97,891
Number of Awards to Universities 494 212 49 58 22 835
Dollars to Universities 46,065 29,454 4,404 7,103 4,932 91,958
Number of Awards to FFRDCS 22 0 14 1 0 37
Dollars to FFRDCS 1,378 0 1,866 73 0 3,317
Number of Awards to Other Non-Profits 25 40 0 1 0 66
Dollars to Other Non-Profits 2,164 5,400 0 100 0 7,664
PHASE I
Number of Awards to FFRDCS 18 0 7 1 0 26
Number of Awards to Universities 347 118 38 40 10 553
Number of Awards to Other Non-Profits 18 24 0 1 0 43
Total Dollars of Awards 35,187 27,793 4,496 3,341 3,737 73,092
Dollars to Small Business 20,223 15,160 2,787 2,006 2,233 42,409
Dollars to Research Institution 12,707 12,525 1,709 1,334 1,504 29,779
Dollars to Universities 11,540 10,485 1,445 3,167 1,504 28,142
Dollars to FFRDCS 553 0 264 73 0 890
Dollars to Other Non-Profits 613 2,040 0 100 0 2,754
PHASE II
Number of Awards to FFRDCS 4 0 7 0 0 11
Number of Awards to Universities 147 94 11 18 12 282
Number of Awards to Other Non-Profits 7 16 0 0 0 23
Total Dollars of Awards 114,377 56,004 11,455 3,453 9,427 174,315
Dollars to Small Business 66,485 32,653 8,938 6,863 5,999 120,938
Dollars to Research Institution 36,900 22,329 4,562 3,935 3,427 71,153
Dollars to Universities 34,525 18,969 2,959 3,935 3,428 63,816
Dollars to FFRDCS 825 0 1,602 0 0 2,427
Dollars to Other Non-Profits 1,550 3,360 0 0 0 4,910
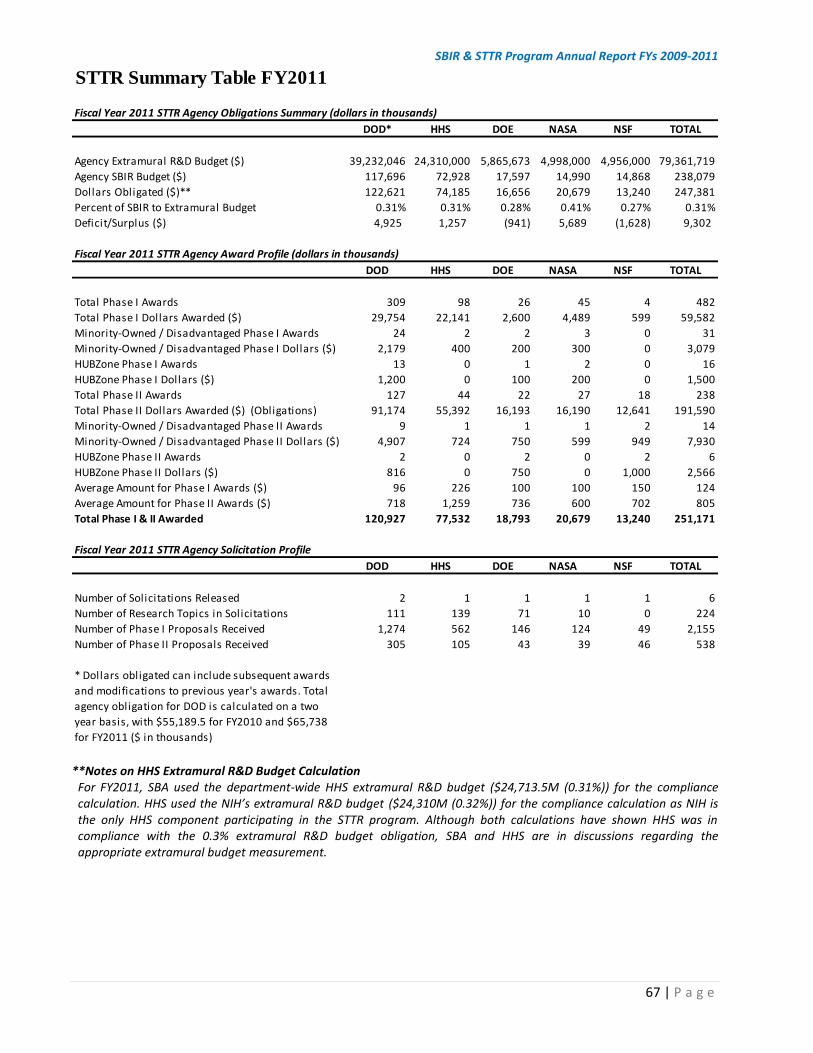
SBIR & STTR Program Annual Report FYs 2009-2011
67 | P a g e
**Notes on HHS Extramural R&D Budget Calculation
For FY2011, SBA used the department-wide HHS extramural R&D budget ($24,713.5M (0.31%)) for the compliance calculation. HHS used the NIH’s extramural R&D budget ($24,310M (0.32%)) for the compliance calculation as NIH is the only HHS component participating in the STTR program. Although both calculations have shown HHS was in compliance with the 0.3% extramural R&D budget obligation, SBA and HHS are in discussions regarding the appropriate extramural budget measurement.
STTR Summary Table FY2011
Fiscal Year 2011 STTR Agency Obligations Summary (dollars in thousands)
DOD* HHS DOE NASA NSF TOTAL
Agency Extramural R&D Budget ($) 39,232,046 24,310,000 5,865,673 4,998,000 4,956,000 79,361,719
Agency SBIR Budget ($) 117,696 72,928 17,597 14,990 14,868 238,079
Dollars Obligated ($)** 122,621 74,185 16,656 20,679 13,240 247,381
Percent of SBIR to Extramural Budget 0.31% 0.31% 0.28% 0.41% 0.27% 0.31%
Deficit/Surplus ($) 4,925 1,257 (941) 5,689 (1,628) 9,302
Fiscal Year 2011 STTR Agency Award Profile (dollars in thousands)
DOD HHS DOE NASA NSF TOTAL
Total Phase I Awards 309 98 26 45 4 482
Total Phase I Dollars Awarded ($) 29,754 22,141 2,600 4,489 599 59,582
Minority-Owned / Disadvantaged Phase I Awards 24 2 2 3 0 31
Minority-Owned / Disadvantaged Phase I Dollars ($) 2,179 400 200 300 0 3,079
HUBZone Phase I Awards 13 0 1 2 0 16
HUBZone Phase I Dollars ($) 1,200 0 100 200 0 1,500
Total Phase II Awards 127 44 22 27 18 238
Total Phase II Dollars Awarded ($) (Obligations) 91,174 55,392 16,193 16,190 12,641 191,590
Minority-Owned / Disadvantaged Phase II Awards 9 1 1 1 2 14
Minority-Owned / Disadvantaged Phase II Dollars ($) 4,907 724 750 599 949 7,930
HUBZone Phase II Awards 2 0 2 0 2 6
HUBZone Phase II Dollars ($) 816 0 750 0 1,000 2,566
Average Amount for Phase I Awards ($) 96 226 100 100 150 124
Average Amount for Phase II Awards ($) 718 1,259 736 600 702 805
Total Phase I & II Awarded 120,927 77,532 18,793 20,679 13,240 251,171
Fiscal Year 2011 STTR Agency Solicitation Profile
DOD HHS DOE NASA NSF TOTAL
Number of Solicitations Released 2 1 1 1 1 6
Number of Research Topics in Solicitations 111 139 71 10 0 224
Number of Phase I Proposals Received 1,274 562 146 124 49 2,155
Number of Phase II Proposals Received 305 105 43 39 46 538
* Dollars obligated can include subsequent awards
and modifications to previous year's awards. Total
agency obligation for DOD is calculated on a two
year basis, with $55,189.5 for FY2010 and $65,738
for FY2011 ($ in thousands)
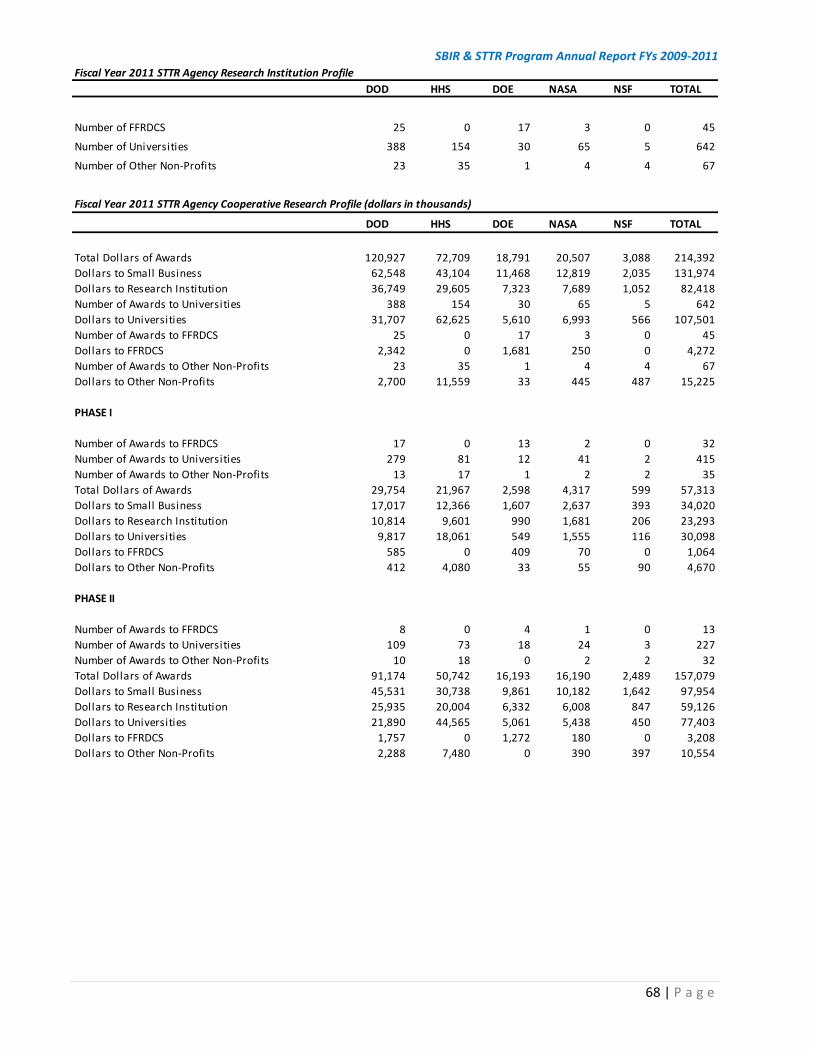
SBIR & STTR Program Annual Report FYs 2009-2011
68 | P a g e
Fiscal Year 2011 STTR Agency Research Institution Profile
DOD HHS DOE NASA NSF TOTAL
Number of FFRDCS 25 0 17 3 0 45
Number of Universities 388 154 30 65 5 642
Number of Other Non-Profits 23 35 1 4 4 67
Fiscal Year 2011 STTR Agency Cooperative Research Profile (dollars in thousands)
DOD HHS DOE NASA NSF TOTAL
Total Dollars of Awards 120,927 72,709 18,791 20,507 3,088 214,392
Dollars to Small Business 62,548 43,104 11,468 12,819 2,035 131,974
Dollars to Research Institution 36,749 29,605 7,323 7,689 1,052 82,418
Number of Awards to Universities 388 154 30 65 5 642
Dollars to Universities 31,707 62,625 5,610 6,993 566 107,501
Number of Awards to FFRDCS 25 0 17 3 0 45
Dollars to FFRDCS 2,342 0 1,681 250 0 4,272
Number of Awards to Other Non-Profits 23 35 1 4 4 67
Dollars to Other Non-Profits 2,700 11,559 33 445 487 15,225
PHASE I
Number of Awards to FFRDCS 17 0 13 2 0 32
Number of Awards to Universities 279 81 12 41 2 415
Number of Awards to Other Non-Profits 13 17 1 2 2 35
Total Dollars of Awards 29,754 21,967 2,598 4,317 599 57,313
Dollars to Small Business 17,017 12,366 1,607 2,637 393 34,020
Dollars to Research Institution 10,814 9,601 990 1,681 206 23,293
Dollars to Universities 9,817 18,061 549 1,555 116 30,098
Dollars to FFRDCS 585 0 409 70 0 1,064
Dollars to Other Non-Profits 412 4,080 33 55 90 4,670
PHASE II
Number of Awards to FFRDCS 8 0 4 1 0 13
Number of Awards to Universities 109 73 18 24 3 227
Number of Awards to Other Non-Profits 10 18 0 2 2 32
Total Dollars of Awards 91,174 50,742 16,193 16,190 2,489 157,079
Dollars to Small Business 45,531 30,738 9,861 10,182 1,642 97,954
Dollars to Research Institution 25,935 20,004 6,332 6,008 847 59,126
Dollars to Universities 21,890 44,565 5,061 5,438 450 77,403
Dollars to FFRDCS 1,757 0 1,272 180 0 3,208
Dollars to Other Non-Profits 2,288 7,480 0 390 397 10,554
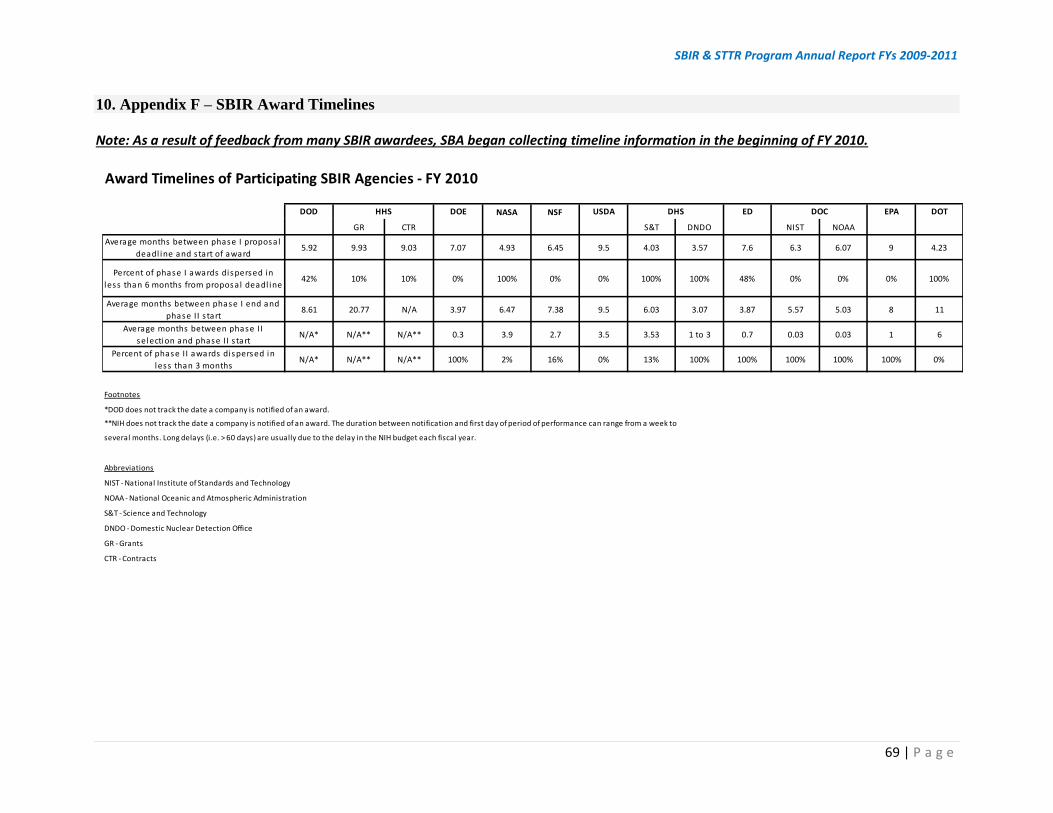
SBIR & STTR Program Annual Report FYs 2009-2011
69 | P a g e
10. Appendix F – SBIR Award Timelines Note: As a result of feedback from many SBIR awardees, SBA began collecting timeline information in the beginning of FY 2010.
NASA NSF
Average months between phase I proposal
deadl ine and s tart of award4.93 6.45
Percent of phase I awards dispersed in
less than 6 months from proposal deadl ine100% 0%
Average months between phase I end and
phase II s tart6.47 7.38
Average months between phase II
selection and phase II s tart3.9 2.7
Percent of phase II awards dispersed in
less than 3 months2% 16%
Footnotes
Award Timelines of Participating SBIR Agencies - FY 2010
USDA DOCDOD DOE DOTED EPA
5.92 7.07 4.23
DHSHHS
NIST NOAA
7.6 94.03 3.579.93 9.03
S&T DNDOGR CTR
9.5 6.3 6.07
8.61 3.97 11
48% 0%100% 100%10% 10% 0% 0% 0%42% 0% 100%
3.87 86.03 3.0720.77 N/A 9.5 5.57 5.03
N/A* 100% 0%
0.7 13.53 1 to 3N/A** N/A** 3.5 0.03 0.03N/A* 0.3 6
100% 100%13% 100%N/A** N/A** 0% 100% 100%
**NIH does not track the date a company is notified of an award. The duration between notification and first day of period of performance can range from a week to
several months. Long delays (i.e. > 60 days) are usually due to the delay in the NIH budget each fiscal year.
*DOD does not track the date a company is notified of an award.
S&T - Science and Technology
Abbreviations
NOAA - National Oceanic and Atmospheric Administration
NIST - National Institute of Standards and Technology
GR - Grants
DNDO - Domestic Nuclear Detection Office
CTR - Contracts
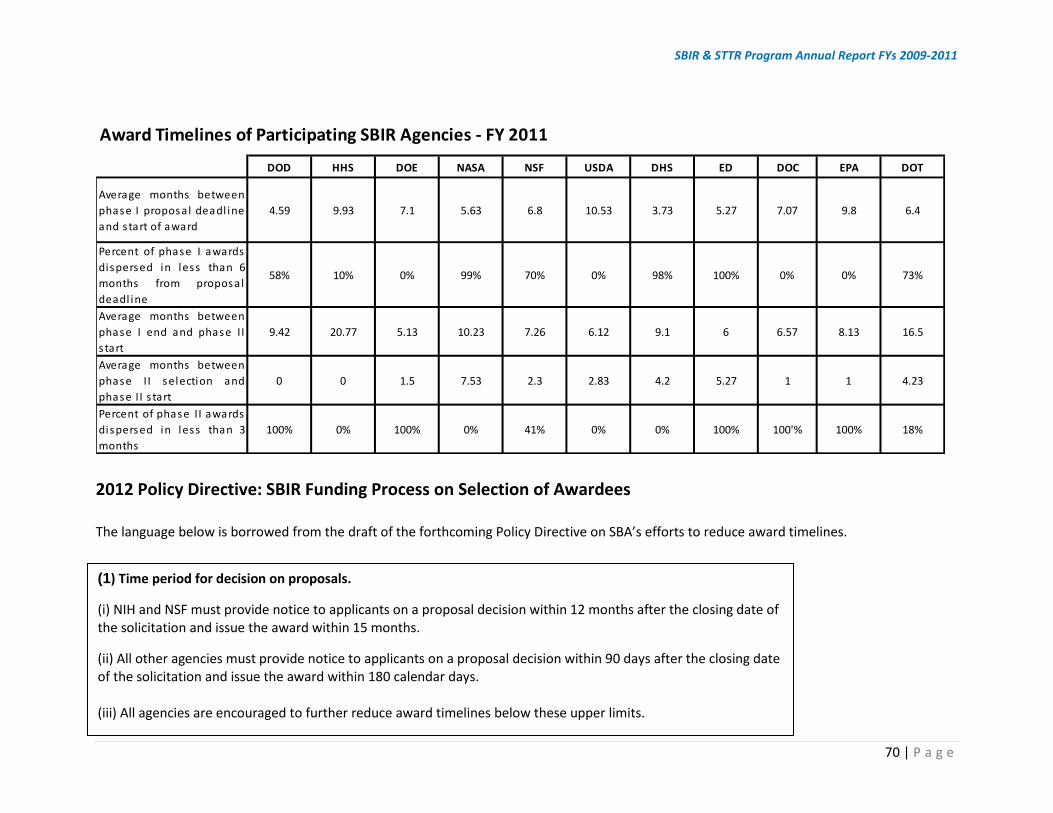
SBIR & STTR Program Annual Report FYs 2009-2011
70 | P a g e
2012 Policy Directive: SBIR Funding Process on Selection of Awardees The language below is borrowed from the draft of the forthcoming Policy Directive on SBA’s efforts to reduce award timelines.
DOD HHS DOE NASA NSF USDA DHS ED DOC EPA DOT
Average months between
phase I proposal deadl ine
and start of award
4.59 9.93 7.1 5.63 6.8 10.53 3.73 5.27 7.07 9.8 6.4
Percent of phase I awards
dispersed in less than 6
months from proposal
deadl ine
58% 10% 0% 99% 70% 0% 98% 100% 0% 0% 73%
Average months between
phase I end and phase II
s tart
9.42 20.77 5.13 10.23 7.26 6.12 9.1 6 6.57 8.13 16.5
Average months between
phase II selection and
phase II s tart
0 0 1.5 7.53 2.3 2.83 4.2 5.27 1 1 4.23
Percent of phase II awards
dispersed in less than 3
months
100% 0% 100% 0% 41% 0% 0% 100% 100'% 100% 18%
Award Timelines of Participating SBIR Agencies - FY 2011
(1) Time period for decision on proposals.
(i) NIH and NSF must provide notice to applicants on a proposal decision within 12 months after the closing date of the solicitation and issue the award within 15 months.
(ii) All other agencies must provide notice to applicants on a proposal decision within 90 days after the closing date of the solicitation and issue the award within 180 calendar days.
(iii) All agencies are encouraged to further reduce award timelines below these upper limits.