sbi holdings, inc. - sbi group · strategic business innovator sbi holdings, inc. fy2013 financial...
TRANSCRIPT

Strategic
Business
Innovator
SBI Holdings, Inc.
FY2013 Financial Results
(Year Ended Mar. 31, 2014)
May 8, 2014

1
Note: Fiscal Year (“FY”) ends March 31 of the following year
The items in this document are provided as
information related to the financial results and
the business strategy of the SBI Group
companies and not as an invitation to invest in
the stock or securities issued by each company.
None of the Group companies guarantees the
completeness of this document in terms of
information and future business strategy.
The content of this document is subject to
revision or cancellation without warning.

2
1. Summary of FY2013
Consolidated Financial Results (Adopted IFRS from FY2012)
2. FY2014 Priority Measures to
Achieve Continued Growth

3
1. Summary of FY2013
Consolidated Financial Results (Adopted IFRS from FY2012)

4
Key Points for FY2013 Consolidated Results
Achieved record-high operating revenue (sales),
including periods for which results were
disclosed under J-GAAP, on higher revenue in all
segments
Achieved a substantial overall increase in
operating income, on higher income in all
segments. However, operating income fell short
of the record high (JPY49.6bn in FY2005) owing to
a sharp 4Q decline in shares of bio-related
companies that were IPO’d in FY2013.
5
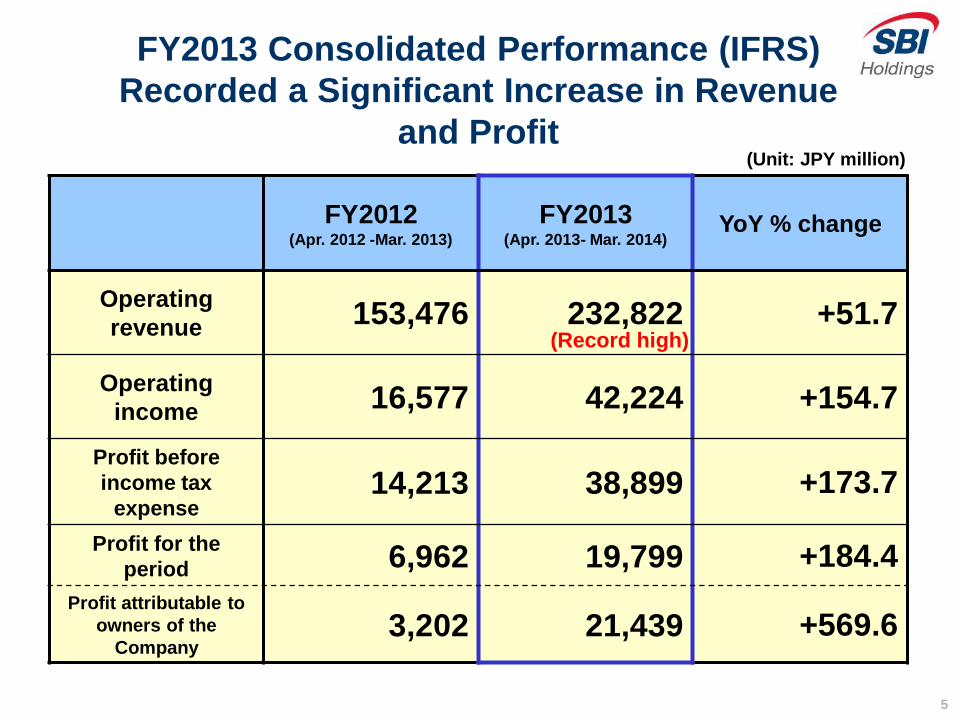
FY2012 (Apr. 2012 -Mar. 2013)
FY2013 (Apr. 2013- Mar. 2014)
YoY % change
Operating
revenue 153,476 232,822 +51.7
Operating
income 16,577 42,224 +154.7
Profit before
income tax
expense 14,213 38,899 +173.7
Profit for the
period 6,962 19,799 +184.4
Profit attributable to
owners of the
Company 3,202 21,439 +569.6
(Unit: JPY million)
FY2013 Consolidated Performance (IFRS)
Recorded a Significant Increase in Revenue
and Profit
(Record high)

6 * Figures are before elimination of inter-segment transactions
FY2012 (Apr. 2012 -Mar. 2013)
FY2013 (Apr. 2013- Mar. 2014)
YoY % change
Financial Services
Business 113,340 147,835 +30.4
Asset Management
Business 32,202 72,725 +125.8
Biotechnology-
related Business 970 2,195 +126.3
Others (Primarily Housing and
Real Estate Business)
9,240 11,626 +25.8
(Unit: JPY million)
Achieved Significant Increases in Revenue and Income in
All Segments, Including Profit Before Income Tax Expense
(i) FY2013 Operating Revenue by Segment (IFRS)

7
FY2012 (Apr. 2012 -Mar. 2013)
FY2013 (Apr. 2013- Mar. 2014)
YoY % change /
amount
Financial Services
Business 18,741 37,298 +99.0%
Asset Management
Business 5,450 8,990 +65.0%
Biotechnology-
related Business -3,900 -2,432 +1,468
Others (Primarily Housing and
Real Estate Business)
1,659 2,438 +46.9%
(Unit: JPY million)
(ii) FY2013 Profit Before Income Tax Expense by Segment (IFRS)
* Figures are before elimination of inter-segment transactions
Achieved Significant Increases in Revenue and Income in
All Segments, Including Profit Before Income Tax Expense

8
Financial Services Business: Expected to consistently accumulate profits
Asset Management Business: Acucela’s IPO was scheduled for Feb. 13, 2014, and a
significant decline in previously listed portfolio stocks was not anticipated.
Biotechnology-related Business: A partial receipt of a contingency fee was planned,
along with the possibility of achieving a full-year profitability
FY2013 full-year operating income expected to exceed that of FY2005, when record-
high operating income of JPY 49.6bn on a J-GAAP basis was recorded
Outlook at the time of 3Q FY2013 results announcement
① The Financial Services Business companies achieved favorable results, such as record-
high income and full-year profitability, as anticipated.
② The Asset Management Business recorded significant loss from a change in fair value
in 4Q, as a result of factors including the valuation loss of JPY 5.4bn on sharp declines
in the shares of ReproCELL and Acucela, along with the valuation loss of JPY 1.5bn
from the shares of Auto Server in 4Q.
③ The Biotechnology-related Business posted a full-year loss on a slippage of the planned
receipt of a contingency fee into FY2014 or later.
As a result, achieved record-high consolidated operating revenue of JPY 232.8bn,
whereas operating income was JPY 42.2bn.
Review of FY2013 Segment Results

9
Major Group Companies that Achieved Record High Profits
◆ SBI SECURITIES
◆ SBI Japannext
◆ SBI FXTRADE
◆ SBI Mortgage
◆ SBI MONEY PLAZA
◆ Morningstar Japan
◆ SBI Insurance
◆ SBI SSI
◆ SBI Sumishin Net Bank
Achieved a full-year operating profitability in the second
operating year
Significantly decreased deficits by JPY 1.1bn YoY
Expected to dramatically exceed its previous record high (announcement scheduled for May 14, 2014)
Expected to achieve its first full-year operating
profitability since its establishment
(after adopting IFRS)
All profit items recorded an historical high
Achieved operating profitability of 3.9x YoY
Achieved operating profitability for two operating years
in a row since its launch
Increased non-consolidated profits for ten consecutive
years
Recorded an historical high in profits despite adverse
market conditions
[Financial Services Business]
[Other Business]
◆ SBI Life Living Recorded an historical high for three consecutive
operating years

10
(Based on IFRS, Unit: JPY billion, Amounts are
rounded to the nearest JPY 100 million) [Profit before Income Tax Expense]
Profit Before Income Tax Expense of Major
Financial Services Business Companies (1)
FY2012 (Apr. 2012 -Mar. 2013)
FY2013 (Apr. 2013- Mar. 2014)
YoY change
SBI SECURITIES 11.6 33.3 +21.7
SBI Japannext 0.2 0.9 +0.7
SBI Liquidity Market 1.5 1.9 +0.4
SBI FXTRADE -0.1 1.3 +1.4
SBI Insurance -5.0 -3.9 +1.1
SBI Mortgage 3.8 4.1 +0.3 * * Consolidated SBI Lease from Oct. 2013
① Financial Services Business:

11
* Based on IFRS, SBI Sumishin Net Bank used interest rate swaps in preparation for the rise in interest rates, and
accordingly SBIH recorded deferred losses from hedging, etc., in 1Q FY2012.
Also, for 1Q FY2013, SBI Sumishin Net Bank recorded loss on revaluation of securities based on IFRS, due to the
devaluation of treasuries held. Therefore the amount are different from that based on J-GAAP.
FY2012 (Apr. 2012 -Mar. 2013)
FY2013 (Apr. 2013- Mar. 2014)
YoY change
SBI MONEY PLAZA 0 1.1 +1.1
Morningstar Japan 0.8 1.0 +0.2
SBI Sumishin Net Bank (Shares of results of associates
using the equity method)
1.6 2.1 +0.5 [1Q: -0.8bn, 2Q: 0.6bn,
3Q: 0.3bn, 4Q: 2.0bn] *
(Based on IFRS, Unit: JPY billion, Amounts are
rounded to the nearest JPY 100 million) [Profit before Income Tax Expense]
Profit Before Income Tax Expense of Major
Financial Services Business Companies (2)
① Financial Services Business:

12
2013 2014
Mar. 31 June 30 Sept. 30 Dec. 31 Mar. 31
Nikkei
225 12,397.9
13,677.3 (+10.3)
14,455.8 (+5.7)
16,291.3 (+12.7)
14,827.8 (-9.0)
NYSE 9,107.0 9,112.7
(+0.1)
9,621.2 (+5.6)
10,400.3 (+8.1)
10,527.7 (+1.2)
Shanghai
SE 2,236.6
1,979.2 (-11.5)
2,174.6 (+9.9)
2,115.9 (-2.7)
2,033.3 (-3.9)
Change (%) (Mar. 31, 2013 – Mar. 31, 2014)
+19.6
+15.6
-9.1
Change in Major Stock Indices During FY2013
( Apr. 2013 – Mar. 2014)
*1: Figures in parentheses represent QoQ changes (%)
80
100
120
140
Mar. 31 June 30 Sept. 30 Dec. 31 Mar. 31,2014
Nikkei 225
NYSE
Shanghai SE
Change in major stock indices (Indexation based on Mar. 31, 2013 = 100)
② Asset Management Business:

13
Bio-related Stocks Fell Sharply Toward the Fiscal Year-end
110.3 116.6
131.4
119.6
100.7
117.4
91.6 82.2
60
80
100
120
140
Mar. 31,2013
June 30,2013
Sept. 30,2013
Dec. 31,2013
Mar. 31,2014
Nikkei 225 Average of bio ventures*1
*1: Bio ventures that conducted IPOs from Jan. 2010 to Mar. 2013
CellSeed Inc., RaQualia Pharma Inc., SymBio
Pharmaceuticals Limited, 3-D Matrix, Ltd., Chiome Bioscience
Inc., Gene Techno Science Co. Ltd., UMN Pharma Inc.,
MEDRx Co., Ltd, euglena Co.,Ltd. and Adjuvant Cosme Japan
Co., Ltd.
Change in Nikkei 225 and stock prices of
bio ventures that conducted IPOs from Jan.
2010 to Mar. 2013*1
(Indexation based on the figure on Mar. 31, 2013 = 100)
Bio-related stocks that conducted IPOs in
FY2013 (Apr. 2013 – Mar. 2014)
The number of companies 5 companies
Initial price / public offering
price 2.7(x)
Average stock price
change from Initial prices (As of Mar. 31, 2014)
-39.5%
Average stock price*3
change for 4Q FY2013 (Jan. 2014 – Mar. 2014)
-51.3%
*3: Only stocks that conducted IPOs from Apr. 2013 to Dec. 2013
② Asset Management Business:
*2: Bio-related companies:
ReproCELL Incorporated, PeptiDream Inc., Oncolys
BioPharma Inc., Human Metabolome Technologies Inc.,
and Accucela Inc.
Japanese bio-venture stocks that conducted IPOs in FY2013, along with the
U.S. biotechnology stocks, declined sharply in Feb. and Mar. 2014, and
eventually ended FY2013 at lower levels.

14
(IFRS, JPY billion) [Primary Fluctuations Factors in Profit for FY2013
The Asset Management Business’ Factors for Stagnant Profits,
Affected by the Change in Fair Value Valuation
The portfolio price of the bio-related stocks declined sharply during 4Q FY2013,
which depressed profits for the Asset Management Business
Stock Change in stock prices
Profit/loss in fair value
and profit/loss on
sales of investment
securities
ReproCELL As of Dec. 31, 2013: JPY 1,725 As of Mar. 31, 2014: JPY 909 -3.9
Acucela Initial Price: JPY 2,300 As of Mar. 31, 2014: JPY 1,581 -1.5
Profit/loss from major bio-related stock portfolio for 4Q FY2013 (Jan. 2014 – Mar. 2014)
② Asset Management Business:
9 months FY2013 (Apr. 2013 - Dec. 2013)
4Q FY2013 (Jan. 2014 – Mar. 2014)
FY2013 (Apr. 2013 – Mar. 2014)
Profit before income tax expense for
Asset Management Business 12.9 -4.0 9.0
Profit/loss from the change in fair
value and profit/loss on sales of
investment securities 12.6 -3.2 9.4
Recorded fair value loss of approx. JPY 5.4bn for the bio-related stock
portfolio, which depressed profits for 4Q FY2013, and restrained the
full-year profit growth.
15
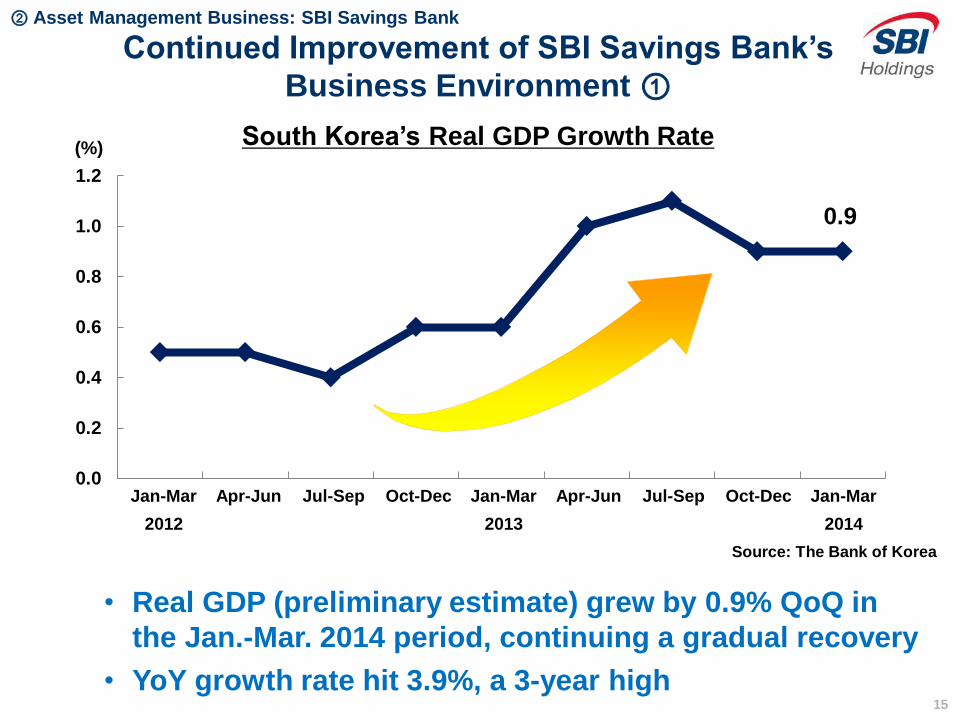
0.9
0.0
0.2
0.4
0.6
0.8
1.0
1.2
Jan-Mar Apr-Jun Jul-Sep Oct-Dec Jan-Mar Apr-Jun Jul-Sep Oct-Dec Jan-Mar
2012 2013 2014
South Korea’s Real GDP Growth Rate
• Real GDP (preliminary estimate) grew by 0.9% QoQ in
the Jan.-Mar. 2014 period, continuing a gradual recovery
• YoY growth rate hit 3.9%, a 3-year high
Continued Improvement of SBI Savings Bank’s
Business Environment ①
② Asset Management Business: SBI Savings Bank
(%)
Source: The Bank of Korea

16
99.6
99.8
100.0
100.2
100.4
100.6
100.8
101.0
101.2
Jan Apr Jul Oct Jan Apr Jul Oct Jan
2012 2013
200,000
300,000
400,000
500,000
1H 2H 1H 2H
2012 2013
(Jan-Jun)
2014
Continued Improvement of SBI Savings Bank’s
Business Environment ② South Korean Housing
Purchase Price Index
Transaction Amount of Home
Sales in South Korea (houses)
(Mar. 2013 = 100)
Source: The Bank of Korea Source: Ministry of Land, Infrastructure and
Transport (Korea)
• Lowering of the real estate acquisition tax rate and other real estate transaction
stimulation policies of the Korean government have succeeded, and housing prices
continue to recover rapidly.
• Transaction amount of home sales is steadily firming, compared with a year earlier.
② Asset Management Business: SBI Savings Bank

17
Operating revenue 36.6
Operating income 4.6
Profit before
income tax expense 4.0
Operating
receivables 322.3
Allowance for bad
debt 128.8
Bad debt
provisioning % 40.0%
Management improvement orders issued by South Korean financial authorities
were lifted on Apr. 30, 2014, which enabled normal business operations.
The bank will continue to focus on increasing normal assets and decreasing non-
performing assets, to further strengthen profitability
• Amid improvement in real estate market conditions, steady progress has been
made with debt collection by means including the sale of bad debt (project
finance and consumer loans).
• Capital injections from SBI Holdings made the strengthening of sales activities
possible, and campaigns, TV commercials and other active promotions for
personal loans are underway.
• The business loan structure has been strengthened, and new lending has
increased.
Recorded a Profit before Income Tax Expense of JPY 4bn
FY2013 Results (SBIH’s consolidated accounts basis; IFRS)
JPY billion
Operating Receivables (As of Mar. 31, 2014; IFRS)
JPY billion
(Rounded to one decimal place)
② Asset Management Business: SBI Savings Bank
18
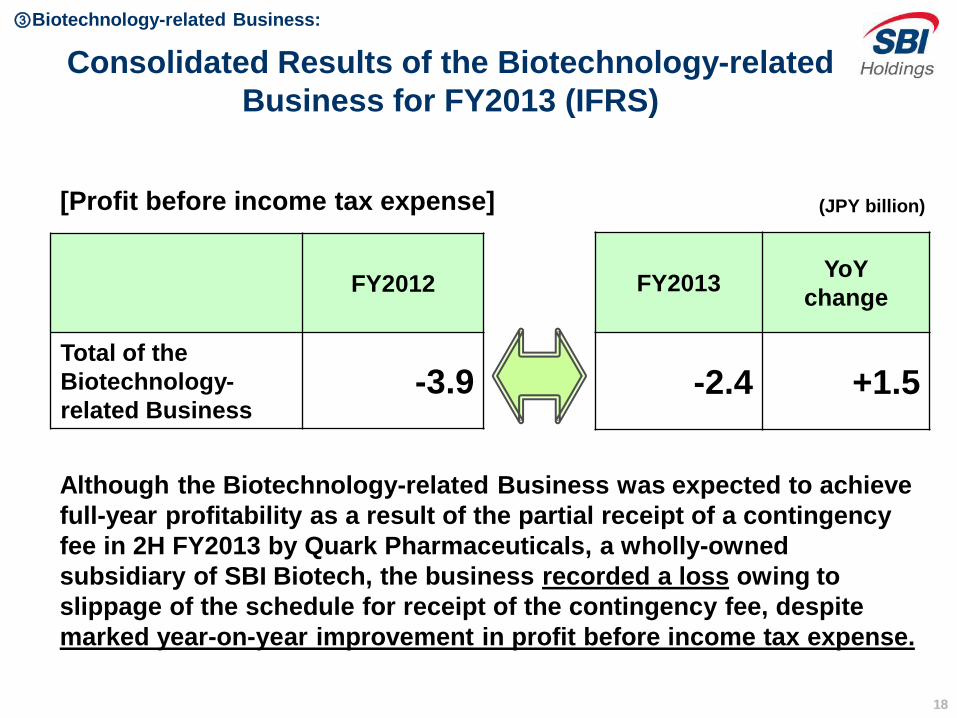
FY2012
Total of the
Biotechnology-
related Business -3.9
FY2013 YoY
change
-2.4 +1.5
③Biotechnology-related Business:
Consolidated Results of the Biotechnology-related
Business for FY2013 (IFRS)
[Profit before income tax expense] (JPY billion)
Although the Biotechnology-related Business was expected to achieve
full-year profitability as a result of the partial receipt of a contingency
fee in 2H FY2013 by Quark Pharmaceuticals, a wholly-owned
subsidiary of SBI Biotech, the business recorded a loss owing to
slippage of the schedule for receipt of the contingency fee, despite
marked year-on-year improvement in profit before income tax expense.

19
State of the Major Financial Services
Business Companies
① SBI SECURITIES
② SBI Japannext
③ SBI Liquidity Market, SBI FXTRADE
④ SBI Sumishin Net Bank (Equity method company)
⑤ Insurance Business
⑥ SBI Mortgage
⑦ SBI MONEY PLAZA
⑧ Morningstar Japan

20
① SBI SECURITIES
FY2013 (Apr. 2013-Mar. 2014) results were strong as
operating revenue increased 71.2%, and operating income
rose 185.7% year-on-year. Operating revenue and all profit
items recorded an historical high
Share of individual stock trading value of the overall trading,
including that of the margin trading, significantly increased
by 2-3 percentage points year-on-year, respectively
Owing to the favorable market conditions, commissions and
financial revenue rose 1.9 times year-on-year, respectively.
Investment trust fees continued at record levels.

21
1,005.6861.7
1,219.9
1,540.8
1,656.6
1,317.8
1,251.3
961.1
1,332.6
2,064.8
2,595.0
1,439.6
1,507.7
0
500
1,000
1,500
2,000
2,500
3,000
Apr. June Aug. Oct. Dec. Feb. Apr. June Aug. Oct. Dec. Feb. Apr. June Aug. Oct. Dec. Feb. Apr.
7,000
8,000
9,000
10,000
11,000
12,000
13,000
14,000
15,000
16,000
Average daily individual brokerage trading value (left-side scale)
End-of-month Nikkei Average (right-side scale)
FY2012
FY2013
Individual Brokerage Trading
Value: JPY 366,329.8bn
Change from FY2012 +140.4%
FY2011 +232.7%
(until 25th) FY2013 FY2011
FY2011
Individual Brokerage Trading
Value: JPY 110,097.0bn
Average Daily Individual Brokerage Trading Value
(2 market total *) (JPY billion)
(JPY) SBI SECURITIES hit a record high of monthly
individual brokerage trading value of JPY 18.3tn
FY2012
Individual Brokerage Trading
Value: JPY 152,372.3bn
Source: Complied by SBIH from disclosed data from TSE *Japanese Stocks listed on Tokyo Stock Exchange and Nagoya Stock Exchange
(Including TSE Mothers, JASDAQ and NSE Centrex)

22
(Unit: JPY million) [Year-on-year]
FY2012 (Apr. 2012 -Mar. 2013)
FY2013 (Apr. 2013- Mar. 2014)
YoY %
change
Operating
Revenue 43,401 74,298 +71.2
Net Operating
Revenue 40,495 69,955 +72.7
Operating
Income 11,478 32,799 +185.7
Ordinary
Income 11,512 32,743 +184.4
Net Profit 6,733 18,069 +168.3
SBI SECURITIES FY2013
Consolidated Results (J-GAAP)
* Owing to the significant increase of stock trading value followed by the brisk market, SBI SECURITIES reserved approximately JPY 2,482m for
financial instruments transaction liability reserves under the Financial Instruments and Exchange Act in the consolidated fiscal year ended March
2014, which means posting of an extraordinary loss. Due to this treatment the year-on-year change of net income is smaller than those of operating
income and ordinary income.
*
SBI SECURITIES:
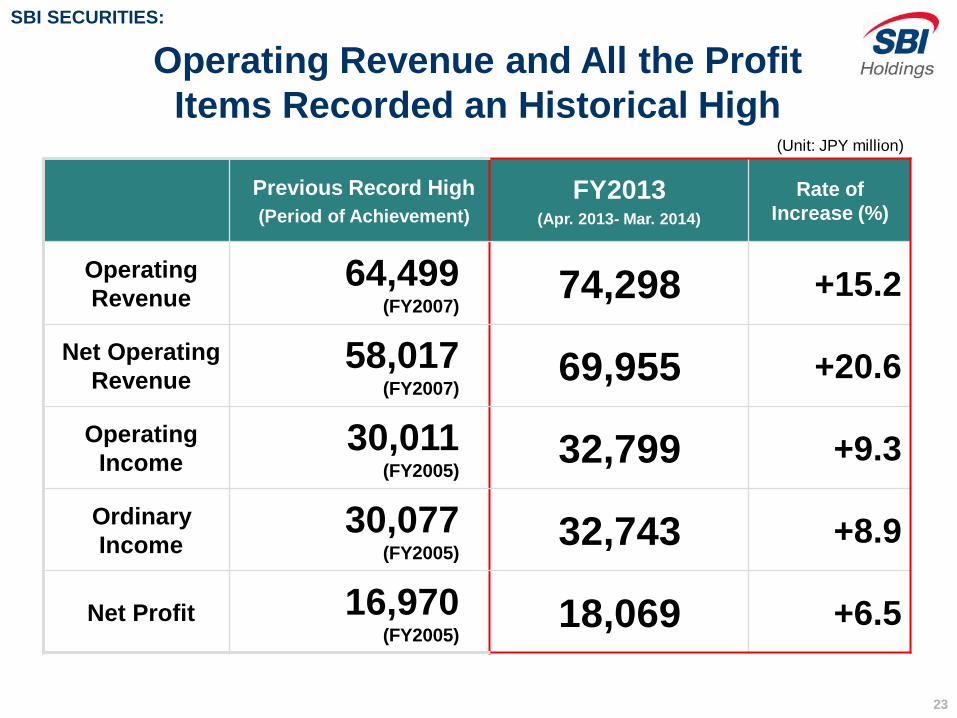
23
Operating Revenue and All the Profit
Items Recorded an Historical High
Previous Record High
(Period of Achievement)
FY2013 (Apr. 2013- Mar. 2014)
Rate of
Increase (%)
Operating
Revenue 64,499
(FY2007) 74,298 +15.2
Net Operating
Revenue 58,017
(FY2007) 69,955 +20.6
Operating
Income 30,011
(FY2005) 32,799 +9.3
Ordinary
Income 30,077
(FY2005) 32,743 +8.9
Net Profit 16,970 (FY2005)
18,069 +6.5
SBI SECURITIES:
(Unit: JPY million)

24
Change in Operating Income Since FY2004
Surpassed the amount of operating
income recorded in FY2005 and achieved
an historical high
30,011
32,799
0
5,000
10,000
15,000
20,000
25,000
30,000
35,000
2005 2006 2007 2008 2009 2010 2011 2012 2013 2014
(JPY million)
(FY ended Mar.)
SBI SECURITIES:

25
Performance Comparison of Major Online
Securities Companies (J-GAAP)
Operating
Revenue YoY %
change
Operating
Income YoY %
change
Income
before
Income Taxes
YoY %
change
SBI (cons.) 74,298 +71.2 32,799 +185.7 30,651 +165.2
Monex (*) (cons.)
54,722 +51.6 15,069 +341.9 16,895 +141.4
Rakuten (cons.) 45,773 +86.5 22,393 +217.0 21,097 +140.8
Matsui 39,883 +91.8 27,090 +165.7 26,348 +156.3
kabu.com 23,347 +77.8 11,579 +198.2 11,106 +193.6
* From full year FY2012, Monex has adopted IFRS, so the relevant figures above are based on IFRS. Incidentally, the
amount of “Operating Income” is “The amount equivalent to operating income” disclosed by Monex. (“The amount
equivalent to operating income” of FY2012 was JPY 3,410m)
Source: Compiled by SBIH from the information on websites of each company.
SBI SECURITIES:
(Unit: JPY million)
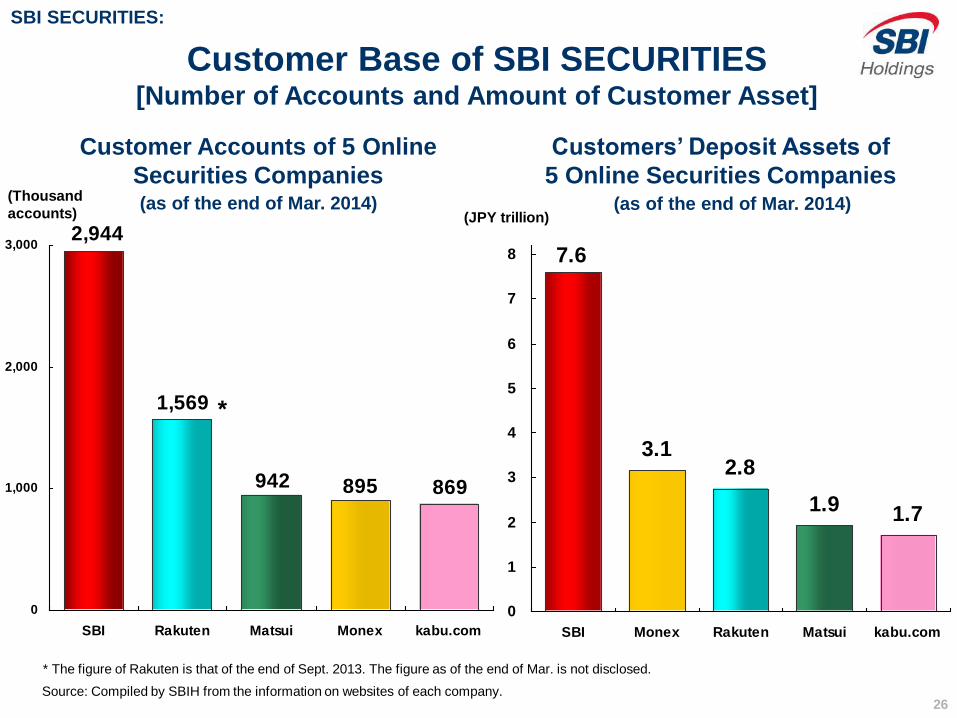
26
3.12.8
1.7
7.6
1.9
0
1
2
3
4
5
6
7
8
SBI Monex Rakuten Matsui kabu.com
869895
1,569
942
2,944
0
1,000
2,000
3,000
SBI Rakuten Matsui Monex kabu.com
(Thousand
accounts)
Source: Compiled by SBIH from the information on websites of each company.
Customer Base of SBI SECURITIES [Number of Accounts and Amount of Customer Asset]
Customer Accounts of 5 Online
Securities Companies (as of the end of Mar. 2014)
(JPY trillion)
Customers’ Deposit Assets of
5 Online Securities Companies
*
* The figure of Rakuten is that of the end of Sept. 2013. The figure as of the end of Mar. is not disclosed.
SBI SECURITIES:
(as of the end of Mar. 2014)

27
Source: Compiled by SBI SECURITIES based on Tokyo Stock Exchange and JASDAQ materials and websites of each company
* The whole individual stock trading value and individual margin trading value are the sum of 1st and 2nd section of the Tokyo and Nagoya Stock
Exchange, respectively.
SBI SECURITIES’ Share of Individual Stock Trading
Value Significantly Increased
Share of Individual Stock
Trading Value (%)
(of which) Share of Individual Margin
Trading Value (%)
SBI
35.3
Rakuten
15.2
Monex
6.5
kabu.com
7.7 Matsui
11.0
Others
24.3 SBI
38.2
Rakuten
15.8
Monex
5.7
kabu.com
9.2
Matsui
13.4
Others
17.7
FY2013 (Apr. 2013-Mar. 2014)
Inside: FY2012
Outside: FY2013
33.2
15.1 8.4
7.4
7.2
28.8
35.4
15.5 9.1
8.9
6.9
24.2
SBI SECURITIES:
FY2013 (Apr. 2013-Mar. 2014)
Inside: FY2012
Outside: FY2013

28
Commission Rate Comparison Between the Major
Online Securities Companies (*1)
3.3
5.5 5.5
9.310.2
2.4
8.6
4.04.0
6.4
0.0
5.0
10.0
15.0
SBI Rakuten kabu.com Monex (*2) Matsui
Left: FY2012 (Apr. 2012-Mar. 2013)
Right: FY2013 (Apr. 2013-Mar. 2014)
(Basis point) (Calculated as commissions divided by stock brokerage trading value)
Source: Compiled by SBI SECURITIES from financial results
announcement materials and monthly disclosure
reports of each company.
Commissions are from earnings briefings.
*1 Major online securities companies refer to SBI SECURITIES, Rakuten Securities,
kabu.com Securities, Monex and Matsui Securities
*2 Figures of Monex are based on commission of Monex, Inc.’s commission figures
Lowest level among
the major online
securities companies
SBI SECURITIES:

29
50.53
129.99
0
20
40
60
80
100
120
140
Full year Full year
17,304
32,190
0
10,000
20,000
30,000
Full year Full year
SBI SECURITIES’ Stock Brokerage Trading
Value and Commissions Dramatically Increased
(JPY million)
Stock Brokerage Trading Value Commissions (JPY trillion)
2.6x YoY
FY2013 FY2013
1.9x YoY
FY2012 FY2012
SBI SECURITIES:

30
13,007
24,553
0
4,000
8,000
12,000
16,000
20,000
24,000
Full year Full year
353
317 299 302
322 297
278
315 307 287
323
517
575
633
706 691
0
100
200
300
400
500
600
700
1Q 2Q 3Q 4Q 1Q 2Q 3Q 4Q 1Q 2Q 3Q 4Q 1Q 2Q 3Q 4Q
SBI SECURITIES’ Financial Revenue and Open
Interest Credit Balance Significantly Increased
Financial Revenue Open Interest Credit Balance
(EOM) (JPY billion) (JPY million)
FY2010 FY2011 FY2012
Quarterly
balance
increasing
steadily
FY2013 FY2013
1.9x YoY
FY2012
SBI SECURITIES:

31
2,209
2,938
0
500
1,000
1,500
2,000
2,500
3,000
Full year Full year
SBI SECURITIES’ Investment Trust Fees and
Investment Trust Balance Both Hit a Record
Investment Trust Fees
502.8
843.9
778.4
722.4
765.1738.3
457.4
555.1
502.7
617.1
525.1
465.1
0
200
400
600
800
1Q 2Q 3Q 4Q 1Q 2Q 3Q 4Q 1Q 2Q 3Q 4Q
Investment Trust Balance (JPY billion)
* Includes MMF, deposits of Chinese Fund and deposits of face-to-face accounts * Investment trust fees is included in “Other commission received” * Trust fee excludes MRF
FY2013 FY2011 FY2012 FY2013
+33.0% YoY
Quarterly balance
hit historical high
FY2012
SBI SECURITIES:
(JPY million)

32
4,263
3,709
0
500
1,000
1,500
2,000
2,500
3,000
3,500
4,000
4,500
Full year Full year
SBI SECURITIES’ FX Trading-related Gains
for FY2013
FY2013
+14.9% YoY
FY2012
SBI SECURITIES:
(JPY million)

33
[NISA accounts and customers’ deposits (as of the end of Mar. 2014)]
Number of accounts: approx. 410,000 / Deposits: JPY 77,531m
* Based on the numerical data of Dec. 26, 2013 to Mar. 31, 2014
Breakdown by customer (%) (*)
23.1
76.9
New
customers
Existing customers
Of the number
of new
customers
opening NISA
accounts,
66.5% are
beginner
investors
Status of NISA (Tax Exempt System for Small Investment) Accounts
Breakdown by product (%)
76.4
21.5
2.1
Domestic stocks
Investment trust
Foreign stocks Of the entire
deposits in
the NISA
account, 76%
is domestic
stocks and
22% is
investment
trust
SBI SECURITIES:
(*)
■ Persons age 20 to 49 make up 56.3% of customers opening NISA
accounts
■ Providing a service to obtain residence certificates free of charge (For applications to open NISA accounts from May 1 to June 30, 2014)

34
② SBI Japannext
With an active stock market environment, trading
value increased steadily and continuously, and
FY2013 operating income resulted in an historical
high, 3.9 times year-on-year increase.
With Daiwa Securities as its lead manager,
progressing smoothly toward a targeted 2015 IPO.

35
100.4
43.8
0
20
40
60
80
100
120
140
160
Apr. June Aug. Oct. Dec. Feb. Apr. June Aug. Oct. Dec. Feb. Apr. June Aug. Oct. Dec. Feb Apr
Japannext PTS
Chi-X Japan
SBI Japannext (PTS):
Average Daily Trading Value at Japannext PTS Surged
(JPY billion)
* Trading value is based on “single count”
SBI SECURITIES
started SOR connection
(June 2011)
2011 2012 2013
TOB (take-over-bid) regulation The regulation obliges investors who acquire more than 5% of a company through off-exchange transactions, or for investors who
already own more than 5% that decide to increase their holdings, to make a takeover bid. This has hindered large institutional
investors from utilizing the PTS.
Source: Complied by SBIH from information on websites of each company and Reuters
2014
(Oct. 31, 2012)
After the TOB
regulatory easing
Monthly trading value topped JPY 3.0tn for
May 2013, recording a historical high
Daily trading value recorded an historical
high (JPY 192.0bn) on Jan. 6, 2014
Ratio of Japannext PTS to 1st section of the TSE (%)
4.1 (FY2012) / 5.2 (4 month period; Jan.-Apr. 2014) 4.9 (FY2013)

36
-311
228
-400
-200
0
200
400
600
800
(JPY million)
FY2012 FY2011
Change in SBI Japannext’s Financial Results
Change in Operating Income/Loss
FY2013 operating income resulted in an historical high,
3.9 times year-on-year increase
(Consolidated in Sept. 2012)
* Based on J-GAAP
Preparing for a targeted 2015 IPO
with Daiwa as its lead manager
JPY 897m
FY2013
SBI Japannext (PTS):

37
③ SBI Liquidity Market, SBI FXTRADE
SBI Liquidity Market’s operating income before
allocation for FY2013 was JPY 8.5bn, up 39.3% year-on-
year
SBI FXTRADE achieved a full-year operating
profitability in the second operating year
SBI Liquidity Market has acquired new customers
through the establishment of SBI FXTRADE (started its
business on May 30, 2012), with a consequent increase in
liquidity, accordingly the share among the OTC FX
industry greatly increased to be 10.5% (as of FY2013)
As a result, the SBI Group has grown its customer base
and customer deposit assets to become No. 1 in the
OTC FX industry

38
7,705
6,122
8,527
0
2,000
4,000
6,000
8,000
FY2011 FY2012 FY2013
(JPY million)
Financial Results of SBI Liquidity Market
Operating Income Before Allocation
SBI Liquidity Market’s “Operating Income Before Allocation”
represents the amount before its allocation of profits to
affiliated companies: SBI SECURITIES, SBI Sumishin Net
Bank and SBI FXTRADE
+39.3% YoY
SBI Liquidity Market, SBI FXTRADE
The highest
operating income
before allocation
since introduction
of leverage
regulations (Aug.
2010, Aug. 2011)
* Based on J-GAAP

39
-145-400
-200
0
200
400
600
800
1,000
1,200
1,400
SBI FXTRADE Achieved a Full-year Operating
Profitability in the Second Operating Year
FY2012
JPY 1,263m
FY2013
(Started its business on May 30, 2012)
Operating income for FY2013 rose by JPY 1,408m year-on-year
SBI FXTRADE offers the Industry’s
narrowest level of spreads on all
major currency pairs to provide an
overwhelming advantage in
customers’ trading capacity.
Eliminated the cumulative loss in a
little more than a year after the
establishment.
Change in Operating Income/Loss
(JPY million)
* Based on J-GAAP
SBI Liquidity Market, SBI FXTRADE

40
52,754
0
10,000
20,000
30,000
40,000
50,000
May Aug. Nov. Feb. May Aug. Nov. Feb.
16,017
0
2,000
4,000
6,000
8,000
10,000
12,000
14,000
16,000
May Aug. Nov. Feb. May Aug. Nov. Feb.
SBI FXTRADE’s Deposit Assets and Number of
Accounts Significantly Increased
(JPY million)
2012 2013 2014
(Accounts)
2012 2013 2014
Change in Customers’
Deposit Assets
Change in Number of
Accounts
SBI Liquidity Market, SBI FXTRADE
(Started its business on May 30, 2012)

41
Change in FX Trading Volume
SBI Liquidity Market’s Rise in Trading Volume
Significantly Exceeds that of the Whole OTC FX Industry
* Note: Counts 10,000 currency unit as 1
Source: Material announced by the Financial Future Association of Japan
SBI LM’s share among the total OTC market is steadily increasing
5.6% (FY2011) 10.5% (FY2013) 8.5% (FY2012)
0
1,000
2,000
3,000
4,000
OTC Total SBI LM (of which) SBI FXT
0
100
200
300
400
500Left: FY2012 (Apr. 2012-Mar. 2013)
Right: FY2013 (Apr. 2013-Mar. 2014)
(million) (million)
1.8x
2.2x
3.6x
SBI Liquidity Market, SBI FXTRADE

42
SBI Liquidity Market, SBI FXTRADE
Number of FX Trading Accounts
No. Company name Number of
accounts
MoM
change
1 SBI Group 470,342 9,606
2 DMM.com 380,031 5,064
3 Gaitame.com 378,664 894
4 GMO CLICK 333,944 3,250
5 YJFX 280,187 2,711
6 MONEY PARTNERS 235,807 1,615
7 Traders Securities 218,265 1,473
8 Hirose FX 162,104 1,146
9 FX PRIME by GMO
Corporation 146,774 908
10 Central Tanshi FX 145,246 1,288
11 MONEY SQUARE JAPAN 67,718 1,220
12 Ueda Harlow 49,105 183
Others (2 companies) 294,947 1,915
Total 3,163,134 31,273
(Accounts)
The SBI Group’s (SBI SECURITIES, SBI FXTRADE and SBI Sumishin Net Bank)
Total Number of Accounts and Customer Deposit Assets are No.1
in the OTC FX Industry
Source: Yano Research “Monthly Research on 17 Major FX Trading Companies – Mar. 2014”
(JPY million) Customers’ Deposit Assets
No. Company name Amount MoM
change
1 SBI Group 135,868 5,730
2 Gaitame.com 101,797 -300
3 GMO CLICK 96,242 775
4 YJFX 81,440 -211
5 DMM.com 80,490 1,736
6 Central Tanshi FX 55,579 390
7 MONEY SQUARE JAPAN 52,524 712
8 MONEY PARTNERS 44,348 98
9 Hirose FX 22,524 -108
10 FX PRIME by GMO
Corporation 16,129 274
11 Traders Securities 13,714 127
12 Ueda Harlow 11,893 -171
Others (2 companies) 56,165 413
Total 768,713 9,465

43
④ SBI Sumishin Net Bank
As of May 6, 2014, the number of accounts exceeded 2 million,
and SBI Sumishin Net Bank is the only pure-play Internet bank
with deposits surpassing JPY 3tn; the business base continues
to steadily expand
Specific purpose loan products and “Mr. Housing Loan” product
launched this current fiscal year is steadily growing. Continuing
a successful diversification of its fund management methods
With ordinary income of SBI Sumishin Net Bank (J-GAAP)
steadily growing, ordinary income appears to have substantially
increased in 4Q FY2013
FY2013 financial results announcement is scheduled for May 14,
2014

44
3,306
2,358
1,813
1,009
560 541
0
1,000
2,000
3,000
SonyBank
Rakuten Jibun
The Only Pure-play Internet Bank with Deposit
Balance Exceeding JPY 3tn
SBI Sumishin Net Bank:
2,691
2,888
3,048
3,306
3,171
3,077
2,500
2,700
2,900
3,100
3,300
3,500
Mar. June Sept. Dec. Mar. Apr.
Change in Deposits (JPY billion)
Number of accounts: 2,000,379 / Deposits: JPY 3,179.3bn (as of May 6, 2014)
SBI
Sumishin
Daiwa
Next
The
Japan
Net
(JPY billion) Deposits of 6 Internet Banks
(as of the end of Dec. 2013)
(Dec.) (Dec.) (Sept.) (Dec.) (Dec.) (Dec.) * Amounts are rounded to the nearest JPY 100 million
2013 2014
Source: Compiled by SBIH from the information
on websites of each company.
* Because the figure as of the end of Dec. is
not disclosed, the figure of Sony Bank is that
of the end of Sept. 2013.

45
450
639
877
300
500
700
900
1,100
Apr. July Oct. Jan. Apr. July Oct. Jan. Apr.
(JPY billion) Change in SBI Hybrid Deposits
of SBI Sumishin Net Bank (Apr. 2012 – Apr. 2014)
2013
SBI Hybrid Deposit balance
increased approx. JPY 382.3bn in
the past two years from Apr. 2012
・Topped JPY 1tn on Nov.
28, 2013
・More than 800,000 users
2014 2012
SBI Sumishin Net Bank:
Synergy with SBI SECURITIES Contributed to the
Growth of Deposits (SBI Hybrid Deposit)
SBI Hybrid Deposits (Automatic deposits and withdrawals of stock trading deposits) :
SBI Hybrid Deposit balance can be integrated into available deposit balance for stock trading,
margin trading, and actual receipt of stock purchased at SBI SECURITIES

46
SBI Sumishin Net Bank is 35th among 77 Banks
Including Community Banks and New Entrant Banks
(JPY billion) Ranking in deposits (community banks and New Entrant Banks)
SBI Sumishin Net Bank:
Rank Bank name Listing Deposits
1 Bank of Yokohama
✓ 11,484.9
2 Chiba Bank ✓ 9,636.8
3 Bank of
Fukuoka *1 8,063.7
4 Shizuoka Bank ✓ 7,932.4
5 Joyo Bank ✓ 7,355.3
6 77 Bank ✓ 6,897.1
7 Nishi-Nippon
City Bank ✓ 6,400.6
8 Bank of Kyoto ✓ 6,091.5
9 Hiroshima
Bank ✓ 5,932.5
10 Hachijuni Bank ✓ 5,823.3
11 Gunma Bank ✓ 5,822.8
12 Shinsei Bank ✓ 5,631.6
13 Hokuriku Bank *1 5,585.4
14 Chugoku Bank ✓ 5,492.5
15 Juroku Bank ✓ 5,014.9
Rank Bank name Listing Deposits
16 Ashikaga Bank *1 4,782.1
17 Iyo Bank ✓ 4,639.3
18 Yamaguchi
Bank *1 4,583.2
19 Senshu Ikeda Bank *1 4,512.8
20 Nanto Bank ✓ 4,432.1
21 Hokkaido Bank *1 4,250.6
22 Daishi Bank ✓ 4,180.7
23 Shiga Bank ✓ 4,094.9
24 Hyakugo Bank ✓ 4,077.5
25 Toho Bank ✓ 4,068.2
26 Ogaki Kyoritsu
Bank ✓ 3,986.5
27 Higo Bank ✓ 3,729.8
28 Musashino Bank ✓ 3,634.8
29 San-in Godo
Bank ✓ 3,618.2
30 Citibank Japan n/a 3,541.5
*1 Bank Holding Company is listed
* As of the end of Mar. 2013
The number of SBI Sumishin Net Bank is as of
May 6, 2014. Amounts are rounded to the nearest
100 million yen.
(Source: websites of each company)
・・・ Rank Bank name Listing Deposits
31 Kiyo Bank *1 3,540.0
32 Suruga Bank ✓ 3,514.8
33 Hyakujushi Bank ✓ 3,427.9
34 Kinki Osaka Bank *1 3,250.2
35 SBI Sumishin Net
Bank n/a 3,179.3
36 Kagoshima Bank ✓ 3,146.3
37 Bank of Iwate ✓ 3,023.9
38 Hokkoku Bank ✓ 3,016.5
39 Aozora Bank ✓ 2,714.0
40 Yamanashi Chuo
Bank ✓ 2,547.6

47
0
200
400
600
800
1,000
1,200
1,400
Mar. Sept. Mar. Sept. Mar. Sept. Mar. Sept. Mar. Sept. Mar. Sept. Mar. (EOM)
2008 2009 2010 2011 2012
(JPY billion)
Diversification of Loans with Deposits Accumulating
JPY 1,503.4bn (as of the end of Mar. 2014)
Fastest among
Internet banks
Cumulative total of
housing loans
exceeded JPY 1.8tn (as of Apr. 28, 2014)
(*2)
① Housing loans processed directly
by SBI Sumishin Net Bank
- Via alliance with real estate
companies (from Sept. 2007)
- “Mr. Housing Loan” (from Nov. 2013)
② Banking Agency Business for
Sumitomo Mitsui Trust Bank (from Jan. 2012)
2013
Balance expanded at auto loan (JPY 233.0bn*) and net loan (JPY 56.1bn*)
SBI Sumishin Net Bank’s housing
loans business:
The total balance of new housing loans
(①+②) for FY2013 increased 14.8% YoY
2014
SBI Sumishin Net Bank:
* as of the end of Mar. Change in Balance of Housing Loans *1
(Mar. 2008 – Mar. 2014) *1 Deducts repayments from the cumulative total of new loans. Include
housing loans as a banking agency of Sumitomo Mitsui Trust Bank
*2 Cumulative total of
new loans
48
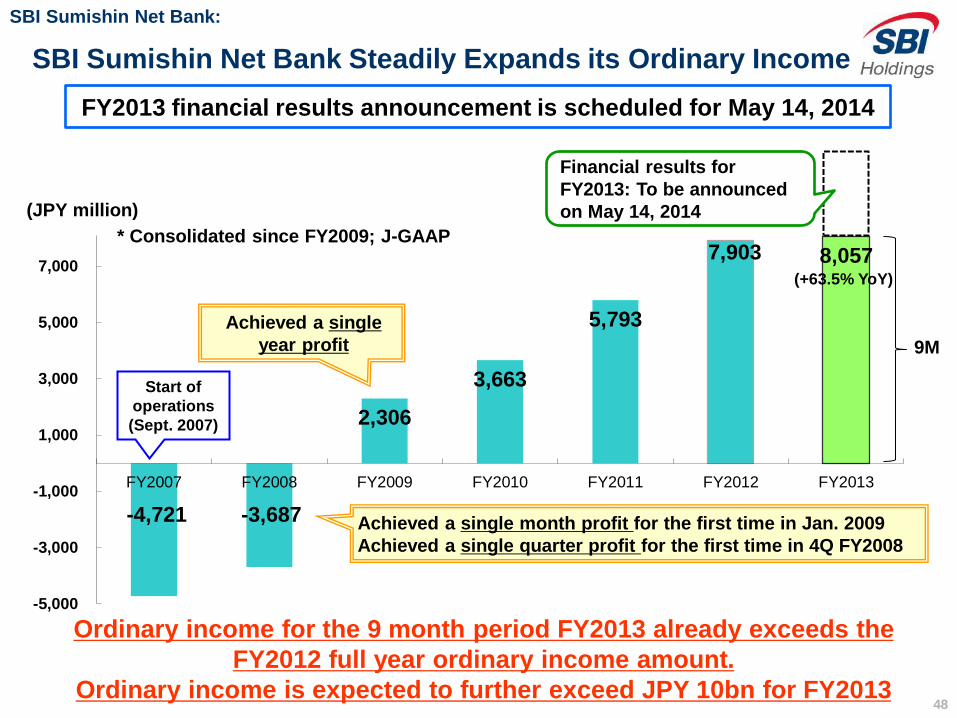
-4,721 -3,687
2,306
3,663
5,793
7,903 8,057
-5,000
-3,000
-1,000
1,000
3,000
5,000
7,000
FY2007 FY2008 FY2009 FY2010 FY2011 FY2012 FY2013
(JPY million)
Achieved a single month profit for the first time in Jan. 2009
Achieved a single quarter profit for the first time in 4Q FY2008
SBI Sumishin Net Bank Steadily Expands its Ordinary Income
Achieved a single
year profit
Start of
operations
(Sept. 2007)
* Consolidated since FY2009; J-GAAP
Ordinary income for the 9 month period FY2013 already exceeds the
FY2012 full year ordinary income amount.
Ordinary income is expected to further exceed JPY 10bn for FY2013
9M
Financial results for
FY2013: To be announced
on May 14, 2014
(+63.5% YoY)
FY2013 financial results announcement is scheduled for May 14, 2014
SBI Sumishin Net Bank:
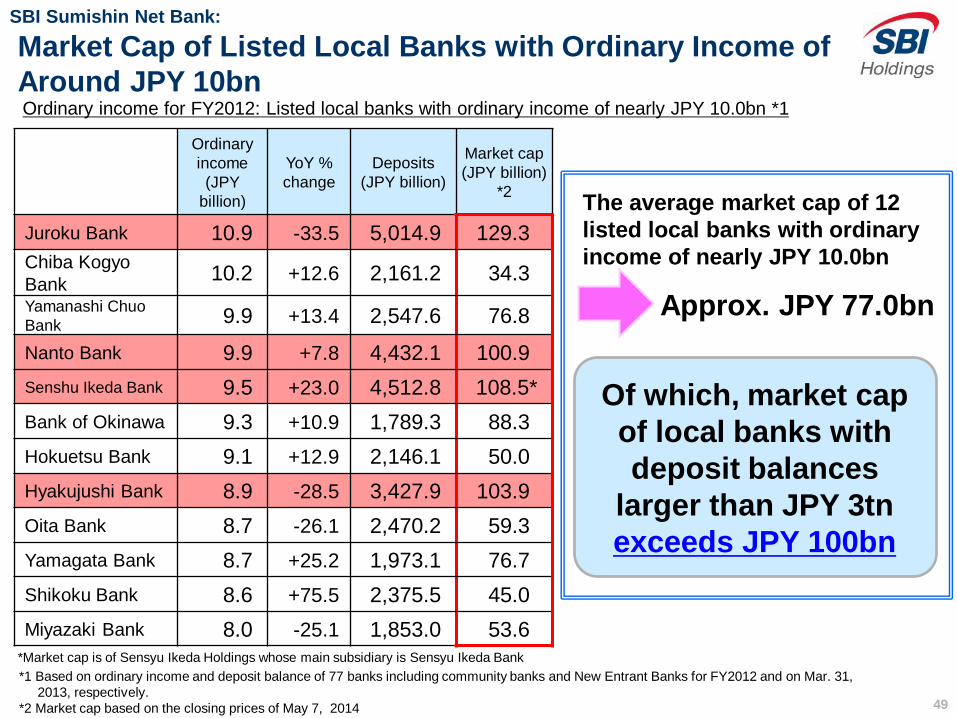
49
The average market cap of 12
listed local banks with ordinary
income of nearly JPY 10.0bn
Ordinary
income
(JPY
billion)
YoY %
change
Deposits
(JPY billion)
Market cap
(JPY billion)
*2
Juroku Bank 10.9 -33.5 5,014.9 129.3
Chiba Kogyo
Bank 10.2 +12.6 2,161.2 34.3
Yamanashi Chuo
Bank 9.9 +13.4 2,547.6 76.8
Nanto Bank 9.9 +7.8 4,432.1 100.9
Senshu Ikeda Bank 9.5 +23.0 4,512.8 108.5*
Bank of Okinawa 9.3 +10.9 1,789.3 88.3
Hokuetsu Bank 9.1 +12.9 2,146.1 50.0
Hyakujushi Bank 8.9 -28.5 3,427.9 103.9
Oita Bank 8.7 -26.1 2,470.2 59.3
Yamagata Bank 8.7 +25.2 1,973.1 76.7
Shikoku Bank 8.6 +75.5 2,375.5 45.0
Miyazaki Bank 8.0 -25.1 1,853.0 53.6
*Market cap is of Sensyu Ikeda Holdings whose main subsidiary is Sensyu Ikeda Bank
Market Cap of Listed Local Banks with Ordinary Income of
Around JPY 10bn
Approx. JPY 77.0bn
SBI Sumishin Net Bank:
*1 Based on ordinary income and deposit balance of 77 banks including community banks and New Entrant Banks for FY2012 and on Mar. 31,
2013, respectively.
*2 Market cap based on the closing prices of May 7, 2014
Ordinary income for FY2012: Listed local banks with ordinary income of nearly JPY 10.0bn *1
Of which, market cap
of local banks with
deposit balances
larger than JPY 3tn
exceeds JPY 100bn

50
SBI Insurance’s auto insurance business continues to
expand with the number of contracts up 20.4% and
insurance premiums up 18.7% year-on-year.
SBI Insurance has improved its combined ratio steadily and
expects full-year profitability in FY2015.
Both SBI SSI and IKIIKI SEDAI has continued steady growth
since the acquisition of their shares by the SBI Group, and
SBI SSI is fully expected to achieve a full-year profitability
for the first time since its establishment.
⑤ Insurance Business

51
0
100
200
300
400
500
600
700
March March March March March
2010 2011 2012 2013 2014
SBI Insurance:
SBI Insurance’s Number of Auto Insurance Contracts
Number of Auto Insurance Contracts (Written Basis*)
(thousand policies)
* Written basis: completion of receipt of insurance premium, excluding continuing contracts, expired continuing contracts and cancelled contracts.
(EOM)
Compound Annual Growth Rate
(March 2010 – March 2014)
48.5%
Approx. 650
thousand
Approx. 540
thousand
+20.4% YoY

52
19,501
23,156
0
8,000
16,000
24,000
FY2009 FY2010 FY2011 FY2012 FY2013
Insurance Premium of SBI Insurance’s Auto Insurance
Change in Insurance Premium Income (JPY million)
+18.7% YoY Compound Annual Growth Rate
(FY2009 – FY2013)
48.9%
SBI Insurance:

53
50
150
250
350
8
10
12
14
FY2011 FY2012 FY2013
Number of Contracts (Left) Premium Income (Right)
500
1,000
1,500
2,000
20
25
30
35
FY2011 FY2012 FY2013
Number of Contracts (Left) Premium Income (Right)
*1 The financial results of SBI SSI and IKIIKI SEDAI are to be announced in June 2014.
*2 Premium income after deduction of reinsurance income
(thousand) (JPY million)
Fully expected to achieve a full-year profitability
for the first time since its establishment *1
Both SBI SSI and IKIIKI SEDAI Continue Steady Growth
SBI SSI, IKIIKI SEDAI:
[IKIIKI SEDAI] [SBI SSI]
Acquired in Mar. 2012 Acquired in Mar. 2013 (thousand) (JPY million)

54
⑥ SBI Mortgage
In an adverse business environment where the
“Flat 35” market shrank, profit before income tax
expense for FY2013 increased 7.8% year-on-year,
reaching a record high.
SBI Mortgage’s “Flat 35” market share of the total
number of loans issued was 25.8% in FY2013,
placing the company as a market share leader for
the 4th consecutive year.

55
FY2012 (Apr. 2012 – Mar. 2013)
FY2013 (Apr. 2013 – Mar. 2014)
YoY
% change
Net Operating
Revenue 11,527 12,394 +7.5
Profit Before Income
Tax Expense 3,787 4,083 +7.8
Profit for the Period 2,340 2,524 +7.9
Market cap on Korea’s KOSPI Market (as of May 7, 2014): JPY 33.2bn
SBI Mortgage:
SBI Mortgage FY2013
Consolidated Financial Results (IFRS) *1
(Announced on May 7, 2014)
(JPY million)
*2
*1 The results above are unaudited and therefore subject to change upon an audit by external auditors.
*2 Consolidated SBI Lease from Oct. 2013.
(Converted at KRW 1 = JPY 0.0992)

56
Change in Net Profit
-164 -21
264 432
-360
648 796
1,149
2,005
1,757
2,340
2,524
-500
0
500
1,000
1,500
2,000
2,500
3,000
FY2002 FY'03 FY'04 FY'05 FY'06 FY'07 FY'08 FY'09 FY'10 FY'11 FY'12 FY'13
IFRS J-GAAP
Record high!
*1 FY2008 – FY2010 financial statements were also provided on an IFRS basis, as it was required to prepare the IFRS-based
financial statements for the last three fiscal years, at the time of its Apr. 2012 IPO on South Korea’s KOSPI Market.
*2 Unaudited and therefore subject to change upon an audit by external auditors.
*1
(JPY million)
*2
SBI Mortgage:

57
0
200
400
600
800
1,000
1,200
1,400
1,600
1,800
Sep Mar Sep Mar Sep Mar Sep Mar Sep Mar Sep Mar Sep Mar Sep Mar Sep Mar Sep Mar Sep Mar Sep Mar Sep Mar
2004 2003 2005 2002 2001 2007 2008 2009 2010 2006 2011 2012
Disbursed amount of housing loans
hit a record high in Mar. 2014
Focusing on strengthening
refinancing services
Launched “SBI Freedom Premier” in
Jan. 2014, thereby expanding “SBI
Freedom” product offerings
2013
SBI Mortgage:
SBI Mortgage’s Outstanding Loan Balance
(JPY billion)
End of Mar. 2014:
JPY 1,865.7bn
2014

58
No. 1 in “Flat 35” Market Share
for the 4th Consecutive Year
12.2 13.1
21.7 25.8
11.9 12.4
11.3
10.2
0
5
10
15
20
25
30
35
40
FY2010 FY2011 FY2012 FY2013
SBI Mortgage
No. 2
Company
Endeavoring to further expand its market share
SBI Mortgage:
“Flat 35” Market Share in Terms of the Number of Loans Issued (%)
The highest
share amongst
330 financial
institutions that
offer “Flat 35”!
Source: Compiled by SBI Mortgage
59
Achieved operating profitability in the previous fiscal
year, which was its first operating year
Recorded operating income (J-GAAP) of JPY 1,054m
for FY2013, which was a year-on-year increase of 29x
Customers’ deposit assets and the number of
accounts have increased rapidly
Targeting an early stage IPO
⑦ SBI MONEY PLAZA (Launched on June 15, 2012)

60
36
1,054
0
200
400
600
800
1,000
1,200
FY2012 FY2013
FY2013 Financial Results (J-GAAP) Recorded operating income (J-GAAP) of JPY 1,054m for FY2013,
which was a year-on-year increase of 29x
0
1,000
2,000
3,000
4,000
FY2012 FY2013
Insurance
Housing loans
Securities
Others
29x YoY
SBI MONEY PLAZA:
(JPY million)
Operating Income Operating Revenue (JPY million)
* Launched on June 15, 2012
* *
2,207
4,063

61
252.2
311.3
354.1
402.2
0
100
200
300
400
Sep 2012 Mar 2013 Sep 2013 Mar 2014
Customers’ Deposit Assets and the Number of Accounts
have Increased Rapidly Since Its June 2012 Launch
Customers’ Deposit Assets (JPY billion)
Number of Accounts
57,855
58,877
61,254
63,106
56,000
58,000
60,000
62,000
64,000
Sep 2012 Mar 2013 Sep 2013 Mar 2014
(accounts)
SBI MONEY PLAZA:

62
⑧ Morningstar Japan
Consistently recorded a profit since its June 2000
listing, and for FY2013 recorded all time highs in
operating income, ordinary income and net profit.
On a non-consolidated basis, Morningstar Japan
achieved an increase in profit for the 10th
consecutive year

63
FY2012 (Apr. 2012 – Mar. 2013)
FY2013 (Apr. 2013 – Mar. 2014)
YoY % change
Net Sales 2,987 3,920 +31.2
Operating Income 762 1,019 +33.6
Ordinary Income 855 1,107 +29.5
Net Profit 508 683 +34.3
Morningstar Japan:
Consolidated Results (J-GAAP) (JPY million)
Recorded All Time Highs in Operating
Income, Ordinary Income and Net Profit
Note: Operating income and ordinary income reached record highs, exceeding the FY2007 level of JPY 824m and JPY 891m, respectively. Net profit also
reached a record high, exceeding JPY 673m recorded in FY2005, when an extraordinary gain of JPY 329m related to the listing of a subsidiary (equivalent to
net income of JPY 282m) was recorded.

64
Consolidated Operating Income (J-GAAP) Surpassed FY2007 record for consolidated operating income over a 15 month period
On a non-consolidated basis, Morningstar Japan achieved an increase in profit for the
10th consecutive year
07/01~07/03
245
191
312 313
115
171
252
431
323
415 459
595
762
1,019
June 2000
Listed
Feb. 2006
The Livedoor Shock
Sept. 2008
Lehman Brothers'
Collapse
Mar. 2011
The Great East
Japan Earthquake
■ Consolidated subsidiaries
■ Morningstar Japan (non-consolidated)
(15 months)
New Record!
Morningstar Japan:
(JPY million)
191
294 238
55 70 104
238
313
328 360
394
529
573
737
19 74
60 101
148
193
266
(5)
55 65
66
189
282 824
(100)
100
300
500
700
900
1,100
00/12 01/12 02/12 03/12 04/12 05/12 06/12 08/03 09/03 10/03 11/03 12/03 13/3 14/0312/00 12/01 12/02 12/03 12/04 12/05 12/06
03/08
(15M) 03/09 03/10 03/11 03/12 03/13 03/14
Morningstar Japan on a non-
consolidated basis has
increased profit for 10 Years!

65
2. FY2014 Priority Measures to
Achieve Continued Growth
(1) In the Financial Services Business, further expand synergies
within the domestic financial ecosystem and strive to
reinforce profitability
(2) Generate cash flow and strengthen the financial base through
business “selection and concentration” and seek to actualize
the company’s inherent enterprise value and increase ROE
(3) Target early profitability of the Biotechnology-related
Business by means including an SBI Biotech IPO and
acceleration of overseas development of the 5-ALA related
business
(4) Under the alliances with prominent local partners, the SBI
Group has advanced the overseas development of its various
financial services

66
(1) In the Financial Services Business, further expand
synergies within the domestic financial ecosystem
and strive to reinforce profitability
① Thorough pursuit of Group synergies through the
strategic utilization of “Big Data”
② The nonlife insurance business will endeavor to improve
the combined ratio and expand product offerings,
targeting quarterly profitability in FY2014
③ Implement integration of online and face-to-face
channels, primarily at SBI MONEY PLAZA, in order to
become Japan’s largest financial products distributor

67
① Thorough pursuit of Group synergies through
the strategic utilization of “Big Data”

68
The Group’s Big Data
The SBI Group’s various services
Link IDs
Website analysis / action history
Attribute information / rewards points
Provide a system
for optimal
services at the
optimal timing
Number of page views by the Group’s 17.53 million customers is 540 million
per month (as of Mar. 2014), and a cross-sectional utilization of the Group’s
Big Data will become possible through the detailed analysis of this data
Social data, open data
+
• Establish an
organization which
aggregates personnel
who utilizes the Group's
data
• Accumulate expertise
and share examples of
data utilization.
Customers’ Data from Respective Services of the SBI
Group will be Centralized and Analyzed as “Group Big
Data” to Offer Best Services and to Achieve Further
Customer Satisfaction and Customer Base Expansion

69
Big Data held
by the SBI Group
Big Data held by
a partner company Synergy
A company in
another industry
Retail, food service, real estate
beauty, healthcare…
Finance, real estate, automotive,
life events, pharmaceuticals…
Construct “Bigger Data” through collaboration with data held by
companies from different industries and strive for a higher level of
database marketing and new business creation.
Customer activity history Customer interests
Purchase information,
offline shopping data
Customer issues and values
Rapidly, deeply, and accurately
understand customer issues
Make “Big Data” into “Bigger Data” through Partnerships
with Companies in Other Industries

70
By Utilizing Big Data, Realize a Business Ecosystem
that Transcends the Existing Financial Ecosystem
Financial
Ecosystem
Synergy
Synergy Synergy
Synergy
Synergy
Company B in
another industry
Company A in
another industry
Company C in
another industry
Company D in
another industry
[SBI SECURITIES]

71
② The nonlife insurance business will endeavor
to improve the combined ratio and expand
product offerings, targeting quarterly
profitability in FY2014

72
FY2012 FY2013
Combined ratio 103.1% 98.8%
Net operating
expenses ratio*2 33.4% 26.4%
Net loss ratio*2 69.8% 72.4%
The E/B loss ratio, calculated on the basis of premiums earned during
the past year, which indicates the occurrence of substantive losses, is
trending down.
SBI Insurance:
Combined Ratio*1 Improvement
Targeting substantive quarterly profitability in FY2014 and full-year
profitability in FY2015 on an IFRS consolidated basis. *1 Combined ratio: An index reflecting profitability of nonlife insurance companies. The ratio of the sum of insurance premium
payment and expense to insurance premium income.
*2 Net operating expenses ratio (%) = (Operating and general administrative expenses + Agency commission and brokerage) / Net
premium Income X 100
Net loss ratio (%) = (Net claims paid + Loss adjustment expenses) / Net premium Income X 100

73
Earthquake insurance
Underwriter: SBI SSI
Traveler's insurance
Underwriter: HS Insurance
Initiated the combined sale of SBI Insurance’s existing cancer
insurance product with cancer insurance products of other companies
Fire insurance
Underwriter: SAISON
AUTOMOBILE&FIRE INSURANCE
Expanded Product Offerings to Increase Profitability
[SBI’s products]
Cancer Insurance
Auto Insurance
[Partner companies’ products]
Life insurance
“Anshin (secure) -sedai”
Underwriter:
IKIIKI SEDAI
Medical insurance
“Shin-ikiiki (new lively) -sedai”
Underwriter:
IKIIKI SEDAI
Cancer Insurance Launched in Apr. 2014
Offering and combining products
with different compensation
details makes possible new
solicitation opportunities.
SBI Insurance:
Payment of a lump sum when
cancer is confirmed
Compensation for the amount of actual medical expenses*
* Amounts covered by the public medical insurance system (amounts equivalent to medical treatment at one’s own expense that should be compensated under the public medical insurance
system and high-cost medical care expenses) are not covered by this policy. If the policyholder has other insurance agreements that pay the amount of actual medical expenses, the maximum
compensation is the amount of actual medical expenses, including amounts covered by such other agreements.
Possesses a special
contract for bicycle
accident indemnification
Underwriter:
AIG Fuji Life Insurance

74
[Measures to Increase Profitability]
- Efficient use of resources related to the insurance business,
including the information and know-how on fund management
and risk management information as well as human resources.
- Strengthening cooperation and creating synergies between
insurance companies.
- Diversifying the financing means for implementing a capital
increase following business expansion.
[IKIIKI SEDAI] [SBI SSI]
The Domestic Insurance Business will Pursue Greater
Business Efficiency and Synergies, through Considerations
such as Consolidation into a Holding Company, or
Restructuring, to Target an Early Stage IPO

75
③ Implement integration of online and face-to-
face channels, primarily at SBI MONEY
PLAZA, in order to become Japan’s largest
financial products distributor

76
Common Infrastructure:
Securities
Supporting Businesses
Insurance
Supporting Businesses
2 SSI companies
Banking
Supporting Businesses
[SBI SECURITIES]
Integrating Online and Face-to-face Services by
Thoroughly Utilizing SBI MONEY PLAZA as the
Group’s Common Infrastructure
Implement an online-to-offline strategy with SBI MONEY PLAZA as a
common infrastructure, and continue its quest to become Japan’s largest
financial products distributor that offers products from both within and
outside of the Group on a neutral basis.
[SBI MONEY PLAZA]

77
SBI MONEY PLAZA Endeavors to Construct a
Business Model for Meeting the Wide-ranging
Financial Needs of a Broad Base of Customers
.
.
Upper mass affluent (Managers, etc.)
Ultra-high
net worth
(Company owners)
Upper mass market
Mass affluent
Mass market
- Greater collaboration with the Corporate Division
of SBI SECURITIES
- Collaboration with business partners of Group
companies
- Greater collaboration with brokers
- Strengthening of insurance sales
- Draw people to shops through O2O
- Shop network expansion
SBI MONEY PLAZA is implementing measures to approach each
customer segment, some in collaboration with Group companies.
Customer Segments Measures

78
361
484
192
170
157
267 628
*3
SBI MONEY PLAZA Shops Network
Hoken no Madoguchi, Minnano Hoken
Plaza and Hoken no Senmonten
(HOKEN NO MADOGUCHI GROUP INC.)
HOKEN MINAOSHI HONPO
(HOKENMINAOSHIHONPO Co., Ltd.)
*Subsidiary of WebCrew
Mitsubachi Insurance
(MITSUBACHIHOKEN GROUP)
Insurance Clinic
(IRRC Corporation)
SBI MONEY PLAZA *2
Mitsubachi Insurance + Insurance Clinic
(Total)
*1 As of Mar. 31, 2014. Compiled by SBIH.
*2 SBI MONEY PLAZA includes shops that are not insurance dealers.
*3 The number of Mitsubachi Insurance shops are added after subtracting the number of shops that already carry the SBI MONEY PLAZA brand
(60 shops as of Mar. 31, 2014).
[SBI’s Shareholding]
MITSUBACHIHOKEN GROUP: 48.5%
IRRC Corporation: 32.0%
Sequentially transitioning Mitsubachi Insurance and Insurance Clinic shops,
both operated by SBI Group’s portfolio companies, into SBI MONEY PLAZA shops
to further expand the shops network
Targeting early stage expansion of shops network to 500 shops

79
(2) Generate cash flow and strengthen the financial
base through business “selection and
concentration” and seek to actualize the
company’s inherent enterprise value and increase
ROE

80
Pursued a Forward-looking Business Strategy in a
Prolonged Adverse Business Environment
Nikkei 225 Trend
(JPY)
5,000
10,000
15,000
20,000
Apr-07 Apr-08 Apr-09 Apr-10 Apr-11 Apr-12 Apr-13 Apr-14
①
② ③
④ ⑤
⑥ ⑦
⑧
⑨ ⑩
⑪
[Measures carried out during the period]
The BNP
Paribas Shock
Global
situation
The Lehman
Shock / Start of
G20
Greek Debt
Issue
Occurrence
European Debt
Crisis
Greek Debt
Issue
Recurrence
End of QE3 in US /
Economic
deterioration in China
①Aug. 2007 SBI Japannext began operation of PTS
②Sept. 2007 SBI Sumishin Net Bank commenced
business
③Jan. 2008 SBI Insurance commenced business
④Apr. 2008 SBI AXA Life Insurance commenced
business
⑤Nov. 2008 SBI Liquidity Market started operations
⑥Feb. 2010 Transferred all shares of SBI AXA Life
Insurance (posted JPY0.8bn as extraordinary income)
⑦July 2010 Announcement of “Brilliant Cut Initiative” and
promotion of “selection and concentration”
⑧May 2012 SBI FXTRADE started operations
⑨June 2012 Established an intermediate holding
company for FS and AM Businesses
⑩Sept. 2012 Consolidated SBI Japannext (posted JPY 2.8bn as gain on step acquisition associated
with the consolidation)
⑪Mar. 2013 Consolidated current SBI Savings Bank

81
30.8
60.2
-13.7 -10.8
-20
-10
0
10
20
30
40
50
60
70
FY2012 FY2013
Group Profitability Enhancement through the
Promotion of the “Brilliant Cut Initiative”
(JPY billion) Change in the total sum of operating income/loss of the major entities
(based on J-GAAP)
Compared with FY2012, the total sum of the operating income of the profitable
companies/divisions of the major entities increased by approx. JPY 29.5bn,
whereas the total sum of the operating loss of the unprofitable companies/divisions
was reduced by approx. JPY 2.9bn.
Increased by approx.
JPY 29.5bn
Decreased by approx.
JPY 2.9bn
Major unprofitable entities
SBI Insurance: approx. JPY 4.1bn Improving steadily toward full-year
profitability in FY2015
SBI Card: approx. JPY 3.1bn Owing to the termination of the SBI Card
Plus, a substantial reduction in losses is
expected from reduced systems cost of
JPY 150m per month
SBI Pharmaceutical + SBI ALApromo:
approx. JPY 1.3bn Improvement in deficit is expected owing
to an expansion in the sales of health
foods containing 5-ALA in Japan and
overseas

82
The Financial Services Business,
Asset Management Business and
Biotechnology-related Business are
defined as the three major
businesses. As a general rule,
regardless of their profitability,
businesses and companies involved
in other fields should be sold,
integrated with other Group
companies, or IPO’d.
Basic “Selection and Concentration”
policy for the Financial Services
Business is based on whether a
business provides meaningful
synergy with one of the core
businesses of securities, banking or
insurance.
Overlapping businesses will generally
be consolidated
Banking
Securities Insurance Synergy
+ Supporting
companies
Three core
businesses
Synergy Synergy
Asset
Management
Business
Biotechnology
-related
Business
Basic "Selection and
Concentration" policy
+ Supporting
companies
+ Supporting
companies
Cash Flow Management through Business
“Selection and Concentration” to Actualize SBI’s
Estimated Business Value ①

83
With regard to non-core businesses, sales, IPOs, and
integration with other Group companies will be prioritized,
thereby maximizing cash flow
Generated cash will be appropriated to
reduce debt with high interest rates
IPOs will be implemented after value is maximally increased
through measures including reorganizations within the Group
An improving equity ratio will contribute to an improvement of the
financial condition.
Share repurchases will also be considered.
Cash Flow Management through Business
“Selection and Concentration” to Actualize SBI’s
Estimated Business Value ②

84
Examples of Generating Cash Flow through
“Selection and Concentration”
SBI VeriTrans (currently VeriTrans), Wall Street Journal
Japan and SBI Capital Solutions
① Selling subsidiaries that are not expected to generate meaningful
synergies with one of the three core businesses
Principal examples
Recovered more than JPY 20.0bn, on a total basis, since Mar. 2012
② Listing subsidiaries, on either the domestic or foreign markets, deemed not
synergistic with one of the three core businesses
SBI Mortgage (SBI Group’s share: 66.5%)
SBI AXES (SBI Group’s share: 75.0%)
③ Consider reorganizations within the Group to manage businesses that
have strong business relevancy
Morningstar Japan absorbed both SBI Searchina and SBI Asset
Management as its subsidiaries
Implementing reorganization of the face-to-face sales business of
SBI SECURITIES, with SBI MONEY PLAZA as the managing entity
Regarding the HKEx, while SBIH
is now in process of delisting,
SBIH is proactively considering
listing its subsidiaries on this
exchange
Principal examples
* SBI's shareholding percentage corresponds to a total percentage based on the IFRS criteria
for subsidiary companies and subsidiary funds of the Group.

85
Level of ROE pre-Lehman Shock
20.7% Average for FY2003 to FY2006 :
Peak during the period (FY2004) : 29.0%
ROE for FY2013 (results) : 6.8%
Targeting pre-Lehman Shock level
Endeavoring to Improve ROE
* Figures for the fiscal years up until FY2011 are based on J-GAAP. The Company introduced IFRS from FY2012.

86
Continued Focus on Shareholder Return
* Figures for the fiscal years up until FY2011 are based on J-GAAP. The Company introduced IFRS from FY2012.
The Company executed a split of its shares at a ratio of 10 shares to 1 shares on October 1, 2012.
Total amount of dividends
Total amount of dividends
(JPY million)
FY2013 (IFRS) 4,340
FY2012 (IFRS) * 2,170
FY2011 2,207
FY2010 2,391
FY2009 1,676
FY2008 1,673
FY2007 13,579
FY2006 13,514
FY2005 7,337
FY2004 2,985
FY2003 1,784
Dividend per share for shareholders as of Mar. 2014 was JPY 20

87
—Each Business Segment Valuation is Conservatively Estimated
Business valuation per share: 2,507 yen
Corporate Value by Business Segment Valuation
■ Sum of the values by segment (as of May 7, 2014) (JPY billion)
Valuation of each
segment (theoretical value)
Financial Services 366.5 (+)*
Asset Management 111.0
Biotechnology-related 59.8
Housing and Real Estate 25.7
Sum total 563.0 (+)
* Other business including SBIH’s comparison website business, SBI Business Support and so on are
also profitable, but these businesses are not included in this valuation estimation.
Of the major Group companies, 14 are profitable companies that are not included
in the above calculations (Total Operating Income: approx. JPY 3.9bn)

88
(3) Target early profitability of the
Biotechnology-related Business by means
including an SBI Biotech IPO and
acceleration of overseas development of
the 5-ALA related business
①SBI Biotech
②5-ALA Related Business
(SBI Pharmaceuticals / SBI ALApromo)

89
Drug or project code
(partners) Adaptation disease Current status
GNKG168
(CN Huapu)
B cell chronic
lymphocytic leukemia US: P1 Clinical Trial
Immuno-cell therapy
(US Baylor Research
Institute)
Cancers
US: P2 Clinical Trial
JPN:
Pre-Clinical Trial was safely conducted for
melanoma patients at Kyoto University
Hospital
Moreover, seriously considering Clinical
Trial for Immuno-cell therapy in Japan
Anti-ILT-7 antibody Autoimmune diseases
Gave development and commercialization
rights to MedImmune, Inc., a subsidiary of
AstraZeneca
①SBI Biotech
SBI Biotech's R&D Progress in the Medical Field (Shares: 77.25%)
Planning to go public in 2014 (Lead manager: Mizuho Securities)
* SBI's shareholding percentage corresponds to a total percentage based on the IFRS criteria for subsidiary companies and subsidiary funds of the Group.

90
The pipelines of the U.S. biotechnology company Quark Pharmaceuticals, SBI Biotech’s subsidiary
Drug or project
code (partners) Adaptation disease Current status Content of conclusions
PF-655
(Pfizer Inc.)
Diabetic macular
edema (DME),
Wet age-related
macular degeneration
P2b Clinical Trial
Potential contingency fee (total): USD 713m
Received so far: USD 28.35m
Scheduled for receiving USD 25.8m at the
conclusion of Phase 2b
*Based on the premise of an acceptance by Pfizer Inc.
QPI-1002 (Novartis
Pharmaceuticals
Corp.)
Kidney
Transplantation (DGF),
Acute Kidney Injury
(AKI)
P2a Clinical Trial
Potential contingency fee (total): USD 670m
Not yet received, but will receive USD 8m at
the conclusion of Phase 2a
*Based on the premise of an acceptance by Novartis
Pharmaceuticals Corp.
QPI-1007
(IN Biocon)
Non-arteritic Anterior
Ischemic Optic
Neuropathy (NAION)
P2 Clinical Trial
Conclusion of an out-licensing and technical
cooperation agreement with Biocon, a
leading pharmaceuticals company in India (announced Dec. 2013)
Already, the SBI Group has received USD
0.5m.
Planned receipt of a total of USD 1.5m by
Oct. 2014.
Conclusion of Out-licensing Agreement, etc., Regarding
the Subsidiary’s Independent Drug Development Efforts
with Pfizer Inc. and Novartis Pharmaceuticals Corp.
①SBI Biotech
(Shares: 100%)

91
Company name Listed date
Sales for the base
fiscal year
(JPY million)
Net profit for the
base fiscal year
(JPY million)
Market cap by
the initial price
(JPY billion)
Latest market cap
(Apr. 30, 2014)
(JPY billion)
CellSeed Mar. 16, 2010 61 -650 7.5 8.3
RaQualia Pharma July 20, 2011 1,186 -1,307 19.6 6.5
SymBio Pharmaceuticals Oct. 20, 2011 1,449 -642 8.6 7.0
3-D MATRIX Oct. 24, 2011 158 -533 5.4 72.5
Chiome Bioscience Dec. 20, 2011 463 -180 5.1 39.6
Gene Techno Science Nov. 30, 2012 207 -320 3.0 4.0
UMN Pharma Dec. 11, 2012 1,000 -477 8.3 22.9
euglena Dec. 20, 2012 1,166 204 10.4 74.6
MEDRx Feb. 13, 2013 741 -433 11.2 9.0
PeptiDream June 11, 2013 269 9 101.8 82.0
ReproCELL June 26, 2013 316 -22 147.8 36.9
Oncolys BioPharma Dec. 6, 2013 396 -102 29.8 5.9
Human Metabolome
Technologies Dec. 24, 2013 496 -95 14.7 8.2
Acucela Feb. 13, 2014 4,755 427 81.9 41.6
It is often the case that bio-venture companies get listed while still unprofitable
①SBI Biotech
Newly Listed Bio-venture Companies Since 2010 in Japan

92
Advancement of R&D in Diagnostic Agent for Cancer
Treatment
②5-ALA Related Business: R&D Progress in the Medical Field-i
Brain tumor
We sell a diagnostic agent for malignant glioma, “ALAGLIO®” (from
Sept. 2013)
Carcinoma vesicae
Doctor sponsored investigation has been on going at 5
universities, led by Kochi University since Jan. 2012
Endeavoring to obtain approval by late 2014
Received the patent for mechanism of a diagnostic agent for
bladder cancer [Patent applicant] SBI Pharmaceuticals Co., Ltd., Kochi University
Designated as an orphan drug
Endeavor to increase the indications for ALAGLIO to include bladder
cancer and will proceed with preparations for an NDA
Intraoperative diagnostic drug for cancer: Easily discriminates tumors (cancer)
from normal tissue, through the oral administration of the drug to patients before
the surgical resection of tumors, and by applying a special light during surgery.

93
②5-ALA Related Business: R&D Progress in the Medical Field-ii
Joint press conference in Bahrain held
by AGU and SBI Pharmaceuticals
By leveraging AGU’s network, we
will strive to accelerate the spread
of an intraoperative diagnostic
drug using 5-ALA and medical
devices of SBI Pharmaceuticals in
the six Gulf states
Bladder cancer is the fourth most
common cancer in men and the eighth
most common in women in Gulf
Cooperation Council (GCC) countries
in the Middle East
King Abdulla Medical City, a medical center of Arabian Gulf University, a medical
university established in Bahrain by the six Gulf states in GCC countries, performed
the first successful surgical removal of bladder cancer in the world using 5-ALA as
an intraoperative diagnostic drug, along with medical devices of SBI
Pharmaceuticals. They have already succeeded in three surgeries, and are
preparing for a fourth surgical removal of bladder cancer. Additionally, preparations
are being made for the surgical removal of the cancer of the prostrate.
The First Successful Surgical Removal of Bladder
Cancer Outside Japan in Bahrain Using 5-ALA as an
Intraoperative Diagnostic Drug in the World
Attended by Ambassador Shigeki Sumi
of the Embassy of Japan in Bahrain
94
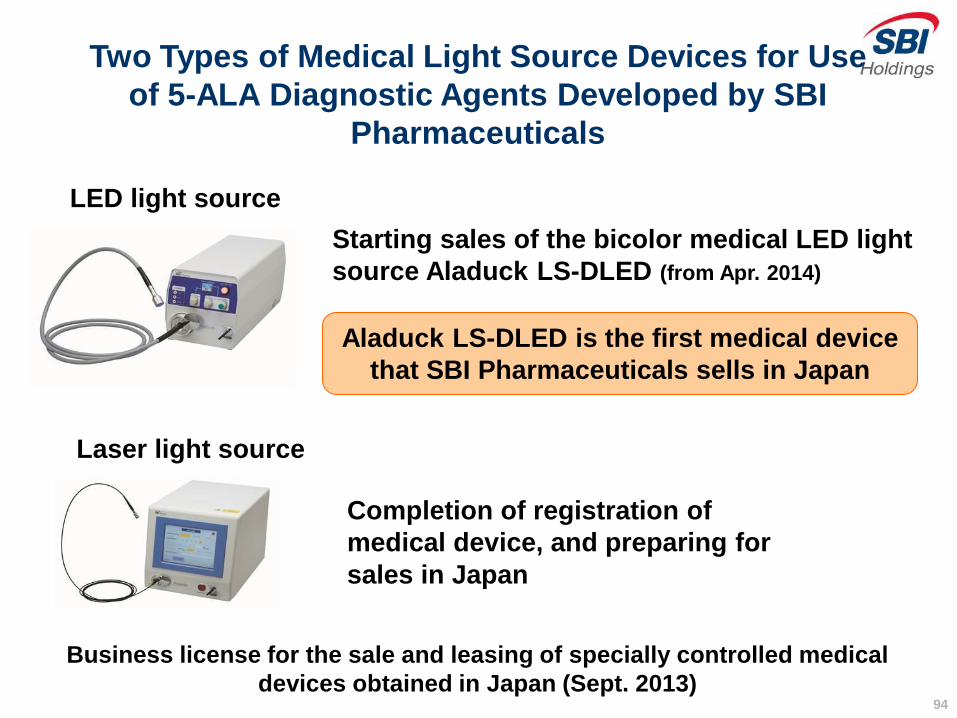
Starting sales of the bicolor medical LED light
source Aladuck LS-DLED (from Apr. 2014)
Business license for the sale and leasing of specially controlled medical
devices obtained in Japan (Sept. 2013)
Aladuck LS-DLED is the first medical device
that SBI Pharmaceuticals sells in Japan
Two Types of Medical Light Source Devices for Use
of 5-ALA Diagnostic Agents Developed by SBI
Pharmaceuticals
Laser light source
LED light source
Completion of registration of
medical device, and preparing for
sales in Japan

95
Saitama Medical University Started an
Investigator-Initiated Trial on a Drug to Treat
Cancer Chemotherapy-induced Anemia
Dec. 2012 Phase I Clinical testing started in UK
May 2013 Phase I Clinical testing completed
Owing to Japan’s cost advantages for clinical trials, Phase II
clinical trials were initiated in Japan
②5-ALA Related Business: R&D Progress in the Medical Field-iii
Saitama Medical University as the medical institution
conducting the clinical trial has started an
investigator-initiated trial, with Kitasato Academic
Research Organization as the ARO

96
Start of Clinical Studies on Type 2 Diabetes
by Using 5-ALA in Bahrain
Indications Country Progress
Type 2 Diabetes Bahrain
Received approval from the National Health
Regulatory Authority (“NHRA”) in Bahrain to
conduct clinical studies on type 2 diabetes at the
Bahrain Defense Force Royal Medical Service
Hospital (Mar. 2014)
NEW!!
Plan to confirm the safety and effectiveness of a combination drug of 5-ALA
+ Fe for type 2 diabetes patients at the Bahrain Defense Force Royal Medical
Service Hospital
Clinical studies have already been initiated in area hospitals by screening for
patients
This hospital will conduct the clinical studies using the combination drug of
5-ALA + Fe provided by SBI Pharmaceuticals. The clinical studies will be
conducted carefully while making periodic reports to the NHRA.
②5-ALA Related Business: R&D Progress in the Medical Field-iv

97
Spreading Partner Medical Institutions for Drug
Development Research and Clinical Research in Bahrain
Partner institutions for clinical study on diabetes by using 5-ALA
• Diabetes Department of the Bahrain Defense Force Royal Medical Service
Hospital (started recruitment of trial subjects)
• Arabian Gulf University Hospital (preparing)
• Royal College of Surgeons in Ireland
- Medical University of Bahrain etc.
Partner institutions for clinical study on the use of 5-ALA in the photodynamic
diagnosis of colorectal cancer
• King Hamad University Hospital Established by King Hamad in 2010, the second national general hospital in Bahrain and operated
by the Bahrain Defense Force. The hospital cooperates with the Ministry of Health of Bahrain in
matters regarding related medical centers and first aid and emergency services.
• Royal College of Surgeons in Ireland- Medical University of Bahrain etc.
AGU established a clinical development structure that complies with GCP (Good Clinical
Practice, which is a standard for performing clinical tests on pharmaceutical products) to
support Arabic people in the region. And to help treat diabetic patients, the university has
chosen a supplement containing 5-ALA as its first model of clinical research

98
②5-ALA Related Business: R&D Progress in the Medical Field-v
Research on the Effects of 5-ALA on Various Target Illnesses is
Proceeding through the Utilization of the Global Academic Network Target illnesses for which clinical research and basic research of 5-ALA and porphyrin are proceeding
Photodynamic diagnosis and therapy Chemotherapy-induced anemia
Cancer chemotherapy-induced
anemia Phase I Clinical testing completed in UK,
Phase II has started in Japan
Diabetic disease Bahrain Defense Force Royal Medical
Service Hospital, Arabian Gulf Univ ,
Hiroshima Univ., Univ. of Hawaii, etc.
Alzheimer's Disease Hokkaido Univ., etc.
Parkinson's disease Shimane Univ., etc.
Neurogenic disease
Chronic kidney disease Kochi Univ., etc.
Mitochondrial
diseases
Saitama Medical Univ.,
etc.
Malaria The Univ. of Tokyo, Tokyo Institute of
Technology, MRC National Institute for
Medical Research and SBI Pharmaceuticals
Prevented the aggravation of
influenza Tokushima Univ., etc.
Solar keratoses (cancer of skin)
photonamic GmbH & Co. KG in
Germany sells in Europe
The following target
illnesses are under
consideration for
photodynamic
diagnosis: prostate
cancer, colon cancer,
peritoneal
dissemination, liver
cancer, etc.
Glioma (malignant glioma) Product launched by SBI
Pharmaceuticals
Carcinoma vesicae Phase III Clinical testing by doctor
sponsored investigation at 5 universities
including Kochi University completed,
preparing for Notification
Metabolic disease
Others
Photodynamic
therapy
(Reference: Research related material by 5-ALA and Porphyrin Research Society)

99
②5-ALA Related Business: Acceleration of overseas development (Bahrain)
Start Sales of Health Foods in Bahrain
• Established a joint venture company
concerning local marketing of health foods
and cosmetics with Dawani Group
Holdings, a major local distributor.
• In addition to health foods for which
approval for sale in Bahrain had already
been obtained, approval for sale of health
foods containing 25 mg of 5-ALA (label at
right) obtained (Jan. 2014). We have
started selling as a mainstay product in
pharmacies, etc.
• “Promotes Sugar and Fat Metabolism”
“Promotes Energy Production” are listed
on labels of the health foods containing
25 mg 5-ALA planned to be sold in Bahrain
Label design of the health foods
* Currently, the SBI Group has no plans to sell health foods containing 25 mg of 5-ALA in Japan

100
Chinese bio-venture Suzhou Yian Biotech Co., Ltd. (SBI Group’s shareholding: 40%) plans to
start operation of an 5-ALA health food manufacturing plant during 2014 (scheduled
completion of the plant in May 2014). The company has applied in China for a materials
license to use 5-ALA in food products and a health food manufacturing license.
Agreed to form a Strategic Alliance with New Hope Group and Fudan Forward for sales
of 5-ALA products in China (Nov. 2013)
Preparations underway for establishment of an import and sales company, which
imports 5-ALA products and other products from Japan, in the Shanghai Free Trade
Zone around July, after which a business license will be applied for.
New Hope Group in China plans to sell fertilizers and forages containing 5-ALA, and
collaborative testing is being conducted for potential sales activities.
Supply structure: Imports of finished products from Japan and production at Yian
Biotech are planned
Will strengthen sales of various crops at each priority area
It is estimated by Journal of the American Medical Association (JAMA) that there are
113.93 million diabetic patients in China, and that one in two adults, or about 493.4
million people are at risk of contracting diabetes. The SBI Group has donated RMB 2m
(approx. JPY 33m) to an education fund at Fudan University in China, for the research of
the efficacy of 5-ALA on the diabetic mechanism at the Fudan University School of Life
Science.
Decision for CTO Toru Tanaka and CSO Motowo Nakajima to accept an invitation from
Fudan University to serve as visiting professors NEW!!
②5-ALA Related Business: Acceleration of overseas development (China)
Accelerating 5-ALA Related Business in China

101
52 162 216 238 229
390
599
1,005
2,078
2,501
0
500
1,000
1,500
2,000
2,500
3,000
Mar. Sept. Mar. Sept. Nov. Dec. Jan. Feb. Mar. Apr.
Consulting pharmacies and drugstores nationwide that
offer SBI ALApromo products topped 2,500 stores (as of the end of Apr. 2014)
Promotion including TV commercials and POP display at drugstores of the
ALAplus series featuring singer Hiromi Go stepped up from the end of Feb. 2014
Change in the number of stores that
offer SBI ALApromo products (Mar. 2012-Apr. 2014)
(stores)
2012 2013 2014
The number of
stores has rapidly
increased since the
start of deliveries to
distributors in the
autumn of 2013.
Start of TV
commercials (since Feb. 2014)
②5-ALA Related Business: Stepped up promotion of the health foods
(EOM)
The Number of Stores in Japan Offering 5-ALA Products is Increasing

102
ALAPlus
GOLD
ALAPlus
"Bi Chocola Enrich" (Exclusive product for mail
order by Eisai Co., Ltd ):
Containing 5-ALA of SBI
Pharmaceuticals
Existing products:
+
From Apr. 2014
ALAplus CoQ10
(Containing 5-ALA and
CoQ10)
ALAplus Biotin
(Containing 5-ALA and
Biotin)
NEW!!
(e.g.)
②5-ALA Related Business: Stepped up promotion of the health foods
Expansion of the Line of Health Foods
Containing 5-ALA Introduction of two new mail-order-only products in Apr. 2014
Launch of the ALAPLUS Beauty Series, a
new product series that contains 5-ALA and
ingredients that support beauty and health

103
(4) Under the alliances with prominent
local partners, the SBI Group has
advanced the overseas development
of its various financial services

104
Russia China
Vietnam
Phnom Penh Commercial Bank
Indonesia
Hong Kong
BNI Securities
Commercial Bank under METROPOL Group
YAR-BANK (formerly OBI BANK)
SBI Royal Securities
SW Kingsway Tianan Insurance
Nonlife Insurance
(3.0% shareholding; invested in July 2010) (2.8% shareholding; invested in Apr. 2004)
(25.0% shareholding; invested in
July 2011)
(47.6% shareholding; invested since its Sept. 2008 launch) (81.6% shareholding; established in Feb. 2010)
(50.0% shareholding; invested in June 2011)
Securities
Securities
Securities
Bank
Bank
* SBI's shareholding percentage corresponds to a total percentage based on the IFRS criteria for subsidiary companies and subsidiary
funds of the Group.
Korea
Cambodia
SBI Savings Bank
(formerly Hyundai Swiss Savings Bank)
(96.9% shareholding; initially invested in May
2002)
Bank
(As of the end of Mar. 2014)
Investments in Overseas Financial
Institutions Primarily in Asia
TPBank (formerly Tien Phong Bank)
Bank
(19.9% shareholding; invested in Aug. 2009)
FPT Securities
(20.0% shareholding; invested in Apr. 2011)
Securities

105
• On Mar. 24, 2014, established Shanghai New Successful Way Investment
Consulting Co., Ltd., a preparation company for joint development of an
online financial services business in China.
• The preparation company will promote the launch of a company engaged
in the online financial services business by carrying out feasibility studies,
license applications, and other related operations.
Lujiazui Group: Founded in 1990, the Lujiazui Group is a large state-owned
company directly managed by the Shanghai Municipal
Government and the only comprehensive financial and
real estate group that falls under the jurisdiction of the
Shanghai Municipal Government. Its group companies
include Shanghai Lujiazui Finance & Trade Zone
Development (listed on China’s A-share market), Aijian
Securities and Lujiazui International Trust Corporation.
New Hope Group: The New Hope Group, established in 1982, is
China’s largest agribusiness operator. The Group
is the top shareholder of China Minsheng
Banking Corp., the largest privately owned bank
in China, and has been the shareholder of
Minsheng Life Insurance since its inception. The
Group has more than 400 affiliated companies
and over 60,000 employees.
Preparing for Joint Development of an Online Financial
Services Business in China with the Lujiazui Group and
the New Hope Group

106
[Reference]
Recent stock price and the specific formula
for the estimation of our corporate value

107
0
200
400
600
800
1,000
1,200
1,400
1,600
1,800
2,000
Mar-11 Mar-12 Mar-13 Mar-14
SBI Holding’s Recent Stock Price
Market cap (actual value as of May 7, 2014): JPY 261.6bn
[Last 3 years]
Recent high:
Apr. 24, 2013: 1,990 yen
Record low:
Sept. 5, 2012: 463 yen
Expanded by 4.3x
Closing price on May 7, 2014: JPY 1,165
Source: Bloomberg

108
2.0
1.1
0.5
0.9 0.5 0.4 0.6
0.8 0.8
1.4
1.10.9 0.8
0.8 0.81.0
1.1
0.0
0.5
1.0
1.5
2.0
2.5
3.0 SBI
TSE 1st Section
*
Change in PBR of SBI Holdings
PBR = Closing price at the end of FY / Net assets per share at the end of FY
(x) TOPIX: 1.0
Bank: 0.5
Securities and commodities: 1.1
Other financials: 1.0
(As of Apr. 30, 2014)
(As of May 7, 2014)
The stock price of SBI
Holdings: JPY 1,165
PBR: 0.8*
[Reference]
SBI Holdings’
PER based on
forecast EPS (As of May 7, 2014)
PER:
9.1 (Nikkei
Kaisha Joho)
8.7 (Japanese
company
handbook)
End of
FY2006 End of
FY2008 End of
FY2010
End of
FY2012
End of
FY2013
May 7,
2014
*PBR of SBI Holdings for the end of FY2013 and May 7, 2014 are calculated based on the
BPS of the end of Mar. 2014.
*PBR of SBI Holdings prior to FY2011 is calculated based on J-GAAP BPS. Source: TSE website
*

109
0.0
1.0
2.0
3.0
4.0
5.0
Nomura Matsui Monex Group kabu.com JAFCO SBI
SBI 0.8
PBR Comparison with Competitors
(As of May 7, 2014)
PBR = Closing price at the end of FY / Net assets per share at the end of FY
(x)
End of
FY2006
End of
FY2008
End of
FY2010
End of
FY2012
May 7,
2014
Matsui 2.8
kabu.com 1.8
JAFCO 1.0
MONEX 1.2
Nomura 0.9
Source: Bloomberg
*PBR for May 7, 2014 is calculated based on the BPS of the end of Mar. 2014.
*PBR of Monex and SBI Holdings prior to FY2011 are calculated based on J-GAAP BPS.
110
SBIH’s market cap as of May 7 is likely to fall
below the estimated valuation of SBI SECURITIES
Valuation by Segment Estimated by SBI
(1)Financial Services Business ①SBI SECURITIES -(i)
①SBI SECURITIES
Valuation is conservatively estimated at JPY 276.3bn (based on the closing prices of May 7, 2014)
Estimation of the valuation is as follows
Calculated according to the Comparable Public Company Analysis Compares the market cap and profits of the comparable public company,
Matsui Securities.
Valuation of SBI SECURITIES is calculated as the mean of the two values [(A)
and (B)] resulting from the equations below
x SBI SECURITIES’s Net income (FY2013) ... (A) Matsui’s PER (*1)
x SBI SECURITIES’s Net asset (*3) (as of Mar 31, 2014) ... (B) Matsui’s PBR (*2)
*1 PER of Matsui is calculated by its net income per share for FY2013.
*2 PBR of Matsui is calculated by its BPS as of Mar. 31, 2014.
*3 Represents SBI SECURITIES’ balance of net asset excluding short-term loans receivable from SBIH

111
1,867
2,944
0
500
1,000
1,500
2,000
2,500
3,000
3,500
Mar. 2009 Mar. 2010 Mar. 2011 Mar. 2012 Mar. 2013 Mar. 2014
SBI SECURITES Matsui
3.0
7.6
0
1
2
3
4
5
6
7
8
Mar. 2009 Mar. 2010 Mar. 2011 Mar. 2012 Mar. 2013 Mar. 2014
SBI SECURITIES Matsui
Valuation by Segment Estimated by SBI
(1)Financial Services Business ①SBI SECURITIES -(ii)
Is SBI SECURITIES’ valuation reasonable?
Comparison of SBI SECURITIES and listed online
securities company (Matsui Securities) *Calculated by the closing prices of May 7, 2014
(FY2013) SBI SECURITIES Matsui Securities
Valuation (market cap) * JPY 276.3bn JPY 248.8bn
Deposit assets (Mar. 2014) JPY 7.6tn JPY 1.9tn
Number of accounts (As of the end of Mar. 2014)
2.94 million 940 thousand
Share of individual stock
brokerage 35.3% 11.0%
Operating income JPY 32.8bn
(up 185.7% YoY)
JPY 27.1bn (up 165.7% YoY)
No.1
No.1
No.1
No.1
(JPY trillion) Customers’ Deposit Assets Customer account (thousand )
112
②SBI Sumishin Net Bank
The excess earning power of the bank for the five fiscal years beginning in FY2012
is estimated with the assumption that the after-tax income (*) of SBI Sumishin Net
Bank will grow 20 percent annually for those five fiscal years. Then, valuation is
calculated by adding the bank’s net asset of SBIH’s shareholding as of Mar. 31,
2013 to the excess earning power.
* Under a calculation based on the ordinary income as JPY 7.9bn, and the profit after
tax for the corresponding fiscal year as JPY 4.8bn.
Estimation of the valuation is as follows:
(Shareholding of the SBI Group: 50.0%)
Valuation by Segment Estimated by SBI
(1)Financial Services Business ②SBI Sumishin Net Bank -(i)
Valuation is conservatively estimated at JPY 38.6bn
(Shareholding of the SBI Group: 50.0%)
Conservatively estimated the valuation of SBI Sumishin Net
Bank with high growth potential in terms of profitability and
scale at JPY 77.2bn JPY 38.6bn

113
The average market cap of 12 listed local banks with ordinary
income of around JPY 10.0bn: approx. JPY 77.0bn
Compared by profit
Comparison with listed local banks with equivalent level of scale
*1 Based on ordinary income and deposit balance of 75 banks including community banks and New Entrant Banks for
FY2012 and on Mar. 31, 2013, respectively.
*2 Market cap based on the closing prices of May 7, 2014
Consideration of SBI Sumishin Net Bank’s valuation (JPY 77.2bn)
Valuation by Segment Estimated by SBI
(1)Financial Services Business ②SBI Sumishin Net Bank -(ii)
- Ordinary income for 9 months FY2013 (JPY 8.0bn (+63.5% YoY))
~ Within reach of achieving ordinary income of JPY 10.0bn ~
- Deposit balance topped JPY 3.3tn (as of Dec. 26, 2013)
Of which, market cap of local banks with deposit
balances larger than JPY 3tn exceeds JPY 100bn

114
③SBI Liquidity Market
Compares the market cap and profits of a comparable public company, MONEY SQUARE JAPAN
Estimation of the valuation is as follows:
Calculated according to the Comparable Public Company Analysis
MONEY SQUARE JAPAN’s PER (*) x Net profit of SBI Liquidity Market (FY2013)
* PER of MONEY SQUARE JAPAN is calculated by its net income per share for FY2012 .
<Reference> Acquisition of CyberAgent FX by Yahoo Japan (Jan. 31, 2013)
Valuation by Segment Estimated by SBI
(1)Financial Services Business ③SBI Liquidity Market
Acquired all shares of CyberAgent FX (16,200 shares) at JPY 21.0bn
Valuation is estimated at JPY 18.1bn (based on the closing price of May 7, 2014)
CyberAgent FX (FY2011) SBI Liquidity Market (FY2013)
JPY 8,498m Operating
revenue JPY 10,524m
JPY 4,021m Operating
income JPY 1,901m
JPY 2,289m Net Profit JPY 1,165m
JPY 9,067m Net Asset JPY 4,087m
Operating
income before
allocation to
SBI
SECURITIES is
JPY 8,527m

115
SBI’s
shareholding
pct. (%)
Classificati
on Listed market
Market cap
(JPY billion)
SBI’s equity
interest
of market cap
(JPY billion)
Morningstar
Japan 49.2
Consolidated
subsidiary JASDAQ 23.5 11.6
SBI Mortgage 60.7 Consolidated
subsidiary KOSPI of KRX 33.2* 20.2
SOLXYZ 26.3 Equity-method
associate JASDAQ 6.3 1.7
Sum of the market cap of listed subsidiaries and equity-
method associates 63.0 33.5
④Other listed subsidiaries and equity-method
companies in the FS Business
Valuation by Segment Estimated by SBI
(1)Financial Services Business
④Other Financial Services Business (listed companies)
* SBI’s shareholding percentage corresponds to a figure based on the IFRS criteria that excludes a percentage of outside shareholder's interest of
subsidiary companies and subsidiary funds of the Group.
(Based on the closing price of May 7, 2014, *Calculated by the exchange rate as of May 7, 2014.)
116
①SBI SECURITIES
④Total market cap upon SBIH’s shareholding of other listed subsidiaries and
equity-method companies, in total 3 companies, in the FS Business
②SBI Sumishin Net Bank
Upon comparison with similar listed companies calculated conservatively
as JPY 276.3bn (based on the closing prices of May 7, 2014)
The sum of market caps of Morningstar Japan, SBI Mortgage and SOXYZ
(Shareholding of the SBI Group) JPY 33.5bn (based on the closing prices of May 7, 2014)
Conservatively estimated the valuation of SBI Sumishin Net Bank that has
high growth potential in terms of profitability and scale at JPY 77.2bn
JPY 38.6bn (Shareholding of the SBI Group: 50.0%)
Total of the valuation above: JPY 366.5bn (The SBI Group’s total shareholding)
Valuation by Segment Estimated by SBIH
(1) Financial Services Business Total Valuation of the
Businesses
③SBI Liquidity Market
Upon comparison with similar listed companies calculated as JPY 18.1bn (based on the closing price of May 7, 2014)

117
Valuation by Segment Estimated by SBIH
(1) FS Business ⑤Other FS Business (Profitable Entities)
Business lineup OP for FY2013
(JPY billion)
SBI’s
shareholding
pct. (%)
SBI Comparison Website Business Operation of comparison websites for
loans and insurances 1.4 100.0
SBI Japannext Growing
Business
Operation of PTS (Proprietary Trading
System) 0.9 52.8
SBI Business Support Contact center business for corporations
and a temporary staffing agency 0.1 100.0
CEM Corporation Real estate secured loans 0.5 79.7
The FS Business also consists of many other profitable business entities
* SBI’s shareholding percentage corresponds to a total percentage based on the IFRS criteria for subsidiary companies and subsidiary funds of the Group.
Based on the “Selection and Concentration” policy for the Financial
Services Business, regardless of profit contributions, a sale, an IPO or
reorganizations within the Group of non-core businesses will be
accelerated, though a judgment of the existence of strength of synergies.
Proceeds generated may be appropriated to strengthen the three core businesses

118
Asset Management Business
<Reference>
JAFCO’s Market Cap: JPY 179.7bn (based on the closing price of May 7, 2014)
Valuation by Segment Estimated by SBIH (2) Asset Management Business
①Valuation Measuring Method
Valuation for the AM Business is estimated at JPY 111.0bn
Operational investment securities and other investment securities held
are quarterly evaluated through fair value, and the calculated number
above reflects the fair value of SBIH's ownership
(ii) Value of SBI Investment (based on the closing price of May 7, 2014)
Approx. JPY 13.3bn
(i) Value of holding securities (at the end of Mar. 2014) Approx. JPY 92.4bn
Valuation estimation is the sum of the valuation (i)-(iii) below.
Calculated according to the Comparable Public Company Analysis
Compares the market cap and profit of the comparable public company, JAFCO
Provisional amount of SBI Investment’s net income that represents the actual status deducting
expenses produced relevant to the holding company function held by it x JAFCO’s PER (*)
(* Valuation excluding asset such as securities hold)
*PER of JAFCO is calculated by the estimated net income per share for FY2014.
The estimated net income per share used in the calculation is the average between that of Japanese company
handbook and Nikkei Kaisha Joho.

119
SBI’s share-
holding pct. (%) Classification Listed market
Market cap
(JPY billion)
SBI’s equity
interest of market
cap (JPY billion)
SBI AXES 42.7 Consolidated
subsidiary KOSDAQ of KRX 6.0* 2.6
SBI Investment
Korea 43.9
Equity-method
associate KOSDAQ of KRX 6.1* 2.7
Sum of the market cap of listed subsidiaries and equity-method associates 12.1 5.3
(Based on the closing price of May 7, 2014, *Calculated by the exchange rate as of May 7, 2014.)
(iii) Total market cap of listed subsidiaries and equity-method associates
Valuation by Segment Estimated by SBIH (2) AM Business ②Other Profitable Business Entities
Business lineup OP for FY2013
(JPY billion)
SBI’s shareholding
pct. (%)
Phnom Penh
Commercial Bank Overseas
Business Commercial Bank 0.5 47.6
[Other profitable businesses of the Asset Management Business]
* SBI’s shareholding percentage corresponds to a figure based on the IFRS criteria that excludes a percentage of outside shareholder‘s interest of
subsidiary companies and subsidiary funds of the Group.

120
Biotechnology-related Business
① SBI Pharmaceuticals
SBIH’s equity interest (excluding external holdings)
Based on SBIH’s equity interest (excluding external holdings) as of the end of Mar.
2014, the amount is calculated to be approx. JPY 46.6bn
Besides, the total shareholder value of this Business includes the estimated shareholder value of 1
IPO scheduled company and 1 listed company, with the estimation based on SBIH's shareholding of
paid-in capital and the market values of operational investment securities that SBIH owns.
Estimation of the valuation is as follows:
Valuation by Segment Estimated by SBIH (3) Biotechnology-related Business
Each bio-venture company has multiple promising pipelines, and the Biotechnology-
related Business will become a core business that makes a substantial contribution
through progress in areas including pharmaceutical clinical research in Japan and
overseas.
Market value at the point of partial
transference of former SBI
ALApromo’s shares
Number of
shares issued x x
Total valuation of the Biotechnology-related Business is estimated at
approx. JPY 59.8bn
SBI’s shareholding pct. * IPO target Lead manager
SBI Biotech 37.8% within 2014 Mizuho Securities
* SBI’s shareholding percentage corresponds to a figure based on the IFRS criteria that excludes a percentage of outside shareholder's interest of
subsidiary companies and subsidiary funds of the Group.
② Companies reserved for IPO in the Biotechnology-related Business

121
Housing and Real Estate Business
SBI’s share-
holding pct. (%) Classification Listed market
Market cap
(JPY billion)
SBI’s equity
interest of market
cap (JPY billion)
SBI Life Living 73.3 Consolidated
subsidiary TSE Mothers 7.4 5.4
② Market cap of a listed subsidiary in the Housing and Real Estate Business
Sum of the calculated value of the commercial real estate properties of
SBIH as of the end of Mar. 2014 were calculated, along with SBI Life
Living's market cap.
(Balance of investment real estate for SBI Savings Bank and SBI Life Living are
excluded)
Estimation of the valuation is as follows:
As of the end of Mar. 2014, valuation is approx. JPY 20.3bn
(based on the closing price of May 7, 2014)
Valuation by Segment Estimated by SBIH (4) Housing and Real Estate Business
Valuation for the Housing and Real Estate Business estimated
at approx. JPY 25.7bn
+
① Value of the commercial real estate properties
Asset
Value =
Balance of
investment real estate
Balance of real estate
included in tangible assets

122
[Appendix]

123
9,290
10,419
11,722
13,059
15,149
17,526
9,000
10,000
11,000
12,000
13,000
14,000
15,000
16,000
17,000
18,000
The SBI Group’s Customer Base
(Thousand) Breakdown of the Customer Base
(As of the end of Mar. 2014) (Thousand)
SBI SECURITIES (Accounts) 2,944
SBIH InsWeb (No. of customers) 6,104
E-LOAN (No. of customers) 1,535
Other financial websites (No. of customers) 26
MoneyLook (Total no. of customer
registrations) 894
Morningstar Japan (New portfolio customer
registrations) 119
SBI Card (Valid cards issued) 71
SBI Sumishin Net Bank (Accounts) 1,974
SBI Insurance (Total no. of
contracts) 655
Autoc one (Total no. of service
users in 2013) 950
Lifestyle-related websites (Ticket Ryutsu Center, muSBi.net)
(Total no. of customer
registrations) 1,356
Others (SBI Mortgage, etc.)
898
Total 17,526
* Repetition customers between Group companies are counted double while it is omitting repetition in each service site when it can be recognized
as a unique user.
* The total number of contracts of SBI Insurance excludes continuing contracts, expiring contracts and early-withdrawal
Mar. 2014
Mar. 2009
Mar. 2010
Mar. 2011
Mar. 2012
Mar. 2013

124
1st “Oricon customer satisfaction ranking” of 2014
[Online securities comprehensive ranking]
For 8
years!!
<Evaluation item>
12 items, such as “commissions & dealing cost,” “easy account opening,”
“variety of products,” “provision of Information” and “analytics tools,” etc.
Customer Service Center
HDI (Help Desk Institute) Certification in 2013
[Securities Industry]
“Call-center Contact Ranking”
Achieved the highest rank “three stars”
For 4
years!!
Highest
Award for
the
Category
“CCJA 2013” (10th Contact Center Award)
Received the highest award for “Best Operation” category
For 3
years!!
Award for
Excellence
Japan Telecom Users Association
17th Corporate Telephone Response Contest in 2013
Official Website
HDI (Help Desk Institute) Certification in 2013
[Securities Industry]
“Support Portal Raking (Official Website)”
Achieved the highest rank “three stars”
4th time
3 years in
a row!!
Group Companies Achieving a High Customer Satisfaction
Assessment (SBI SECURITIES)

125
1st
JCSI Customer Satisfaction Survey (Japanese
Customer Satisfaction Index)
Banking industry
For 5
years!
1st J.D. Power “Japan Investor Satisfaction Study”
Self-Directed Bank Segment *1
1st “10th Nikkei Financial Institution Ranking”
Customer Satisfaction by generations, 20s and 30s
For 2
years!
1st
JMA Research
“Assessment of Mortgage Products” by mortgage
personnel
For the
first time!
Appraised as No. 1 among the 7 banks (*2) in all 5 categories, which were: “Mortgage
which you want to utilize,” “Mortgage which you want to recommend,” “Mortgage which
interest is attractive,” “Mortgage which has best collection of ancillary services,” and
“Mortgage which is reliable in an emergency.”
*2 The number of financial institutions compared are 7 that are 4 major banks (The Bank of Tokyo-Mitsubishi UFJ, Mizuho Bank,
Sumitomo Mitsui Banking Corporation and Resona Bank) and 3 Internet banks (SBI Sumishin Net Bank, Sony Bank and Rakuten Bank)
*1 Source: J.D. Power Asia Pacific 2013 Japan Investor Satisfaction Study℠ This result was obtained from 3,224 respondents who uses investment services of Self-Directed Bank Segment. japan.jdpower.com
Group Companies Achieving a High Customer Satisfaction
Assessment (SBI Sumishin Net Bank)

126
1st Diamond Weekly
“Auto Insurance Premium Ranking”
For 6
years !
No. 1 for all surveyed patterns of insurance without physical
damage coverage!
1st
Oricon customer satisfaction ranking FY 2014
Auto Insurance Category
“Auto Insurance Premium Ranking”
For 5
years !
1st Kakaku.com / Auto Insurance Satisfaction Ranking
(2013) Premium Section
For 4
years !
HDI-Japan HDI’s Call-center Customer Satisfaction
Ratings 2013 Top “three-star” rating in the
Support Portal (Official Website) Category
For 2
years !
* In the Apr. 5, 2014 special issue
Group Companies Achieving a High Customer Satisfaction
Assessment (SBI Insurance)
Auto Insurance
Official Website

127
45.5% 45.0% 40.6%
Foreign institutions and
individuals 36.6%
17.4% 16.0% 17.9%
Domestic financial
Institutions 18.2%
1.0% 1.4% 1.0% Other domestic
Companies 1.0%
32.7% 34.7% 35.4% Individuals
37.3%
3.4% 2.9% 5.1%
Others 6.6%
0%
20%
40%
60%
80%
100%191,631 195,272
183,706 176,552
0
40,000
80,000
120,000
160,000
200,000
*
Shareholder Composition Number of Shareholders
(Persons)
(End of month)
* “Others” includes treasury stock (3.3%)
* Percentages are rounded down to one decimal place
SBI Holdings’ Shareholder Composition
Mar.
2011
Mar.
2012
Mar.
2013
Mar.
2014 Mar.
2011
Mar.
2012
Mar.
2013
Mar.
2014
(End of month)

128
Number of Consolidated Subsidiaries and
Consolidated Employees of the SBI Group
Mar. 31, 2013 Mar. 31, 2014
Consolidated subsidiaries 144 139
Consolidated partnerships 34 36
Equity-method companies 38 38
Total (companies) 216 213
Transition of the number of consolidated subsidiaries
Mar. 31, 2013 Mar. 31, 2014
Total (persons) 5,007 5,352
Transition of the number of consolidated employees

129
Assets Under Management of the SBI Group
Breakdown by region Amount
Japan 101.4
China 34.7
Korea 18.5
Taiwan 1.5
Southeast Asia 9.8
U.S. 30.0
Europe 1.5
Others 3.8
Total 201.2
Breakdown by Industry Amount
IT/Internet 26.0
Biotechnology/Health/Medical 48.4
Services 21.8
Materials/Chemicals 2.3
Environmental/Energy 15.5
Retail/Food 13.1
Construction/Real estate 0.9
Machine/Automobile 9.0
Finance 38.3
Others 25.8
Total 201.2
Private equity, etc. JPY 308.0bn
Investment trusts 103.5
Investment advisory 76.7
Investment companies 3.3
Investment trust etc. JPY 183.6bn *1 Calculated by the exchange rate as of the end of Mar. 2014
*2 Amounts are rounded to the nearest 100 million yen
*3 Composed of cash in funds and unpaid capital which is to be paid
on a capital call.
(*3)
(Including JPY 106.8bn of both cash
and commitment amount to be paid in)
130
http://www.sbigroup.co.jp/english/