sandler o’neill - interactive brokers · sandler o’neill + partners global exchange and...
TRANSCRIPT
Sandler O’Neill + PartnersGlobal Exchange and Brokerage Conference
June 3, 2015

DisclaimerThe following information contains certain forward-looking statements that reflect the Company's current views with respect to certain current and future events and financial performance. These forward-looking statements are and will be, as the case may be, subject to many risks, uncertainties and factors relating to the Company's operations and business environment which may cause the Company's actual results to be materially different from any future results, expressed or implied, in these forward-looking statements. Any forward-looking statements are based upon information available to the Company on the date of this presentation. The Company does not undertake to publicly update or revise its forward-looking statements even if experience or future changes make it clear that any statements expressed or implied therein will not be realized. Additional information on risk factors that could potentially affect the Company's financial results may be found in the Company's filings with the Securities and Exchange Commission.
2

Agenda
• Company Overview– Our business today– Diversified enterprise– Our key differentiators– Comparative growth– Financial strength
• Appendix– Cost comparison– Best execution– Competition charts– Brokerage growth charts– Recognized industry leader
3

Our Business Today
We are the largest U.S. electronic broker as measured by revenue trades
Broad global reach - Access to 100+ markets in 24 countries
Recognized industry leader - Barron’s #1 electronic broker 4 years straight
Highly efficient, scalable business model - $1.4M revenue / employee (4)(5)
4
302,000client accounts(3)
18%YoY (3)
account growth
$5.0Bequity capital(1)
648,000daily avg.
revenue trades (1)(2)
63%brokerage pretax
profit(1)(4)
Our company began as a market maker in 1977. We launched our brokerage business in 1993.
Today, brokerage accounts for 86%(1)(4) of Group pretax income.
(1) 1Q15 (2) DARTs are based on client orders (3) 4/30/15 (4) Excludes CHF client losses and GLOBAL impact (5) 1Q15 annualized

Diversified Enterprise
5
Net Revenues1Q2015
Our clients reside in nearly 200 countries
Client Equity$65.2B at 4/30/15
Accounts by Region4/30/15
Individual traders and investors
38%
Financial advisors
27%
Proprietary trading groups
18%
Hedge and mutual funds
7%
Introducing brokers
10%
Other8%
U.S.42%
Asia22%
Europe & Africa28%U.S.
47%International53%

Our Key Differentiators
6
Low Cost & Best Execution
Low execution costs:Stocks $0.0005 to $0.005/ shareOptions $0.15 to $0.70/ contract (1)
Margin rates range from 0.75% to 1.61% (1)
IB achieves the industry’s best price improvement because we do not sell client order flow to internalizers (1)
Breadth of Product
Clients can trade on 100+ market centers in 24 countries and 21 currencies
Electronic market access to stocks, options, futures, forex, bonds, funds, ETFs and CFDs from a single IB Universal AccountTM
Superior Trading Technology
Sophisticated market-maker designed technology
Multiple desktop and mobile trading platforms
Advanced trading tools
60+ order types and algos
API solutions
(1) For additional information see www.interactivebrokers.com

Market Leading Growth
7
Client Accounts Total DARTs Client Equity* Equity per Account*
1Q13 vs 1Q14
1Q14 vs 1Q15
1Q13 vs 1Q14
1Q14 vs 1Q15
1Q13 vs 1Q14
1Q14 vs 1Q15
1Q13 vs 1Q14
1Q14 vs 1Q15
IBKR 16% 18% 25% 11% 38% 25% 19%$195K
6%$206K
ETFC 4% 3% 34% -14% 23% 11% 22%$57K
8%$62K
SCHW 1% 4% 13% -7% 11% 9% 10%$202K
5%$211K
AMTD 5% 5% 30% -3% 19% 13% 14%$99K
7%$106K
* Note that many of IBKR’s clients’ deposits and assets are not in USD and accordingly these numbers are affected by the strength of the USD, our reporting currency.
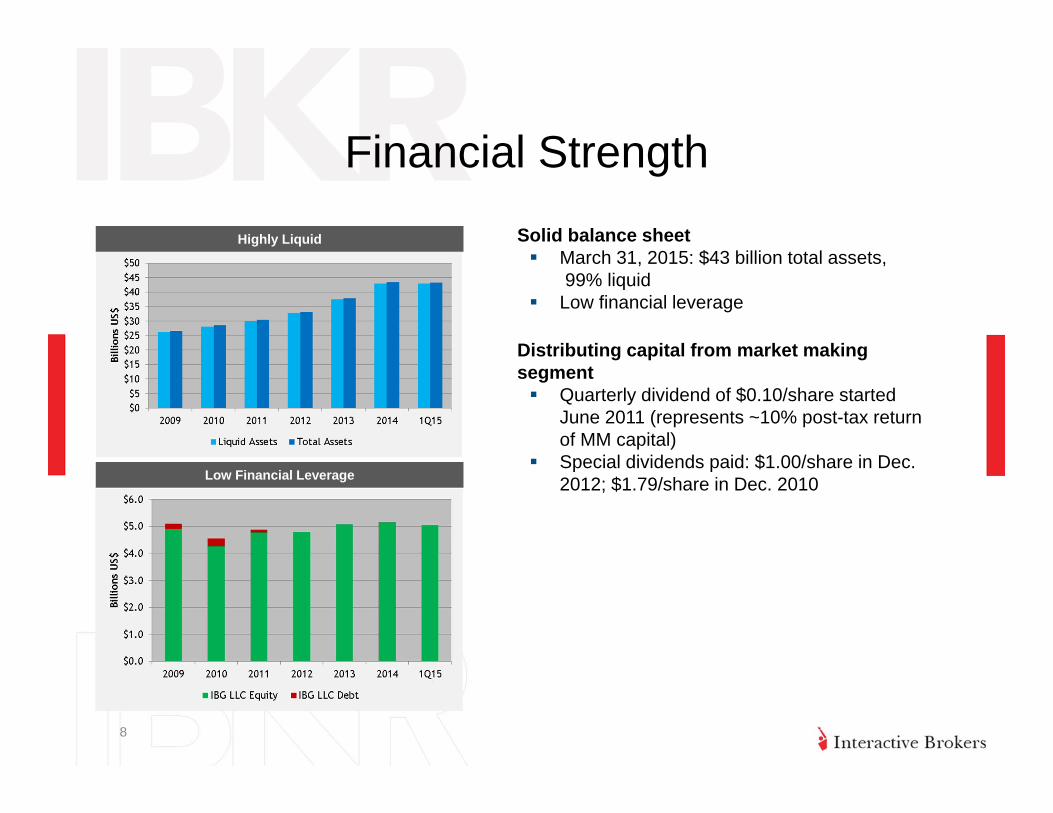
Financial Strength
8
Solid balance sheetMarch 31, 2015: $43 billion total assets, 99% liquid
Low financial leverage
Distributing capital from market making segment
Quarterly dividend of $0.10/share started June 2011 (represents ~10% post-tax return of MM capital)Special dividends paid: $1.00/share in Dec. 2012; $1.79/share in Dec. 2010
Highly Liquid
Low Financial Leverage

Appendix
9

$25K $200K $1.5M $3.5M 100 Shares1 Stock Option
1 E-mini S&P 500 Future
Interactive Brokers 1.61% 1.36% 0.98% 0.75% $1.00 $1.00 $0.85
E-Trade 7.94% 6.14% 3.89% 3.89% $7.99 $8.74 $2.99
Fidelity 7.58% 6.58% 3.75% 3.75% $7.95 $8.70 N/A
optionsXpress 8.25% 7.00% 6.00% 6.00% $8.95 $12.95 $3.50
Schwab 8.00% 6.88% 6.25% 6.00% $8.95 $9.70 N/A
TD Ameritrade 8.50% 7.25% 6.25% 6.25% $9.99 $10.74 $2.25
thinkorswim 8.50% 7.25% 6.25% 6.25% $9.99 $10.74 $2.25
US Margin Loan Rates Comparison* US Commission Rates Comparison*
Low Commissions and Financing Rates
10
Rated Lowest Margin Rates and Low Cost Broker11 years in a row by Barron’s
* Rates were obtained on March 2, 2015 from each firm’s website. Some of the firms listed may have additional fees and some firms may reduce or waive commissions or fees, depending on account activity or total account value. Supporting documentation for any claims and statistical information will be provided upon request.
Interactive Brokers has lower commission rates for larger volumes and comparable rates worldwide. Services vary by firm.

% Profit % Loss Total Accounts
Spread Markups
Interactive Brokers 45.5% 54.5% 30,398 NO
OANDA 32.5% 67.5% 20,747 YES
Gain Capital 30.0% 70.0% 12,199 YES
IBFX/TradeStation 32.5% 67.5% 1,947 YES
FXCM 33.0% 67.0% 27,520 YES
CitiFX 37.0% 63.0% 601 YES
MB Trading 29.0% 71.0% 2,700 YES
Percentage of profitable and unprofitable accounts as reported to the NFA - Q1 2015
11
Data provided by forexmagnates.com, includes the impact of any commissions
The same philosophy and technology that enable our clients to achievesuperior forex trading results also drive our clients’ trading and investing of stocks, options, futures and
bonds worldwide on over 100 market centers.
Forex – Our Clients are More Profitable

IB34%
ETFC16%
SCHW26%
AMTD24%
Effect of IB’s Low Margin Rates
12
Dec. 2007Total industry(1)
margin = $29 Billion
Mar. 2015Total industry(1)
margin = $51 Billion
(1) Total industry includes IB, AMTD, SCHW & ETFC
IB6%
ETFC25%
SCHW40%
AMTD29%

Best Price Execution
13
Unlike other routers, IB SmartRoutingSM dynamically routes and re-routes all or parts of the order for optimal execution.
We do NOT sell order flow to internalizers.
The Transaction Auditing Group, Inc., (TAG), a third-party provider of transaction analysis, has determined that Interactive Brokers’ U.S. stock and options price executions were significantly better than the industry’s during 2014.
(1) Net Dollar Improvement per Share Definition: ((# of Price Improved Shares * Price Improvement Amount) - (# of Price Disimproved Shares * Price Disimprovement Amount)) / Total Number of Executed Shares
*For more information, visit www.interactivebrokers.com
Net Dollar Price Improvement vs. Best Bid/Offer(1) – 2nd Half 2014
The IB SmartRoutingSM Advantage
US Stocks(per 100 shares)
US Options(per contract)
Interactive Brokers $0.55 $0.99
Industry $0.47 $0.49
IB Advantage $0.08 $0.50
Execution Price Improvement Comparison*

300%
-5%
-5%
-100%
-50%
0%50%
100%
150%
200%
250%
300%
350%Pretax Profits - Normalized to 4Q08
Interactive Brokers (1) Schwab TD Ameritrade
Comparative Growth
14(1) Brokerage segment only. 4Q13 excludes unusual item ($64M Singapore loss)
1Q15 excludes unusual item ($121M CHF event loss)
Making strong progress towards our goal of being the largest broker by profits
2
4
6
8
10
12
14
16
100
150
200
250
300
350
Accoun
t Add
s (000
's)
Accoun
ts (0
00's)
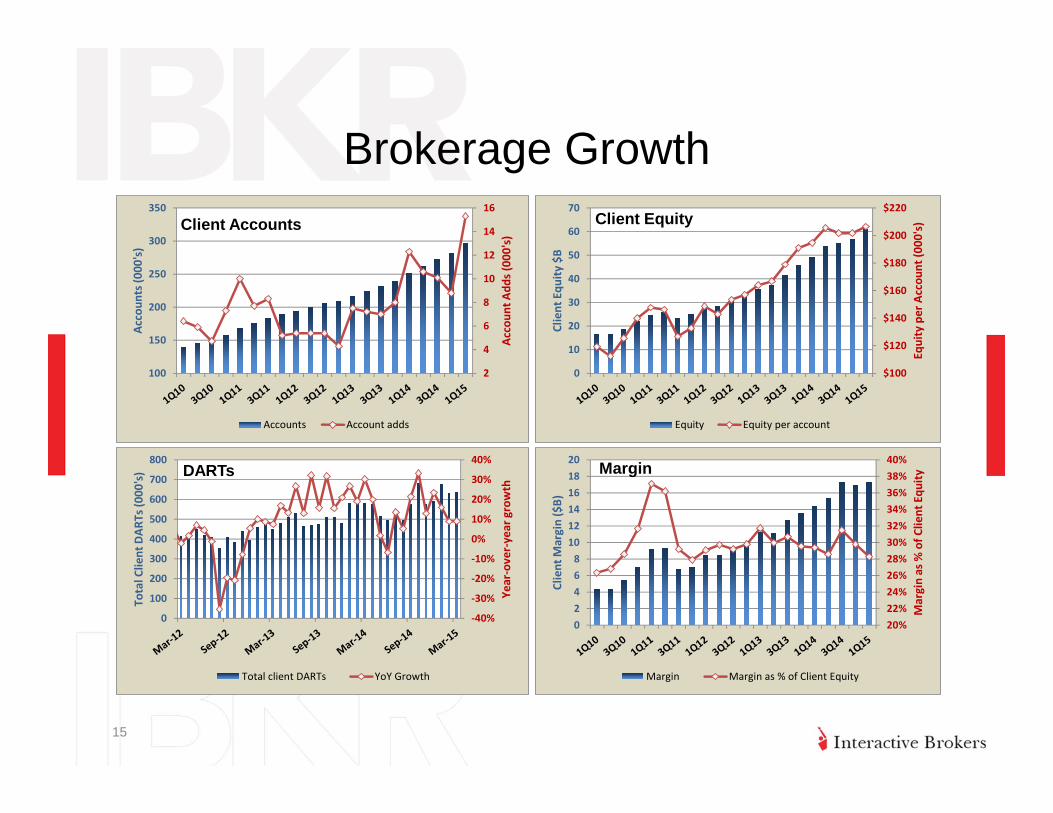
Client Accounts
Accounts Account adds
$100
$120
$140
$160
$180
$200
$220
0
10
20
30
40
50
60
70
Equity per Accou
nt (0
00's)
Client Equ
ity $B
Client Equity
Equity Equity per account
20%22%24%26%28%30%32%34%36%38%40%
02468
101214161820
Margin as % of C
lient Equ
ity
Client M
argin ($B)
Margin
Margin Margin as % of Client Equity
‐40%
‐30%
‐20%
‐10%
0%
10%
20%
30%
40%
0
100
200
300
400
500
600
700
800
Year‐over‐year growth
Total Client DAR
Ts (0
00's) DARTs
Total client DARTs YoY Growth
Brokerage Growth
15

64.2%57.0%
47.7%37.6%
56.2% 51.4%
18.3%
19.8%
22.2%
27.5%
15.5%16.8%
4.2%
3.6% 15.7%18.0%
16.8% 19.3%
0.5%0.6%
5.6% 7.3%7.4% 6.3%
12.8%19.0%
8.8% 9.6%4.1% 6.2%
Dec 2010 Apr 2015 Dec 2010 Apr 2015 2010 YTD4/30/15
Introducing brokers
Hedge and mutual funds
Proprietary trading groups
Financial advisors
Individual traders andinvestors
Client Accounts Client Equity Commissions
157.9K 302K $22.1B $65.2B $386.8M $208.8M
Client Segment Shift
16

9.5% 7.8% 13.5% 10.4% 17.8% 10.5%
15.9% 22.0% 15.8% 21.2%15.3% 23.6%
27.2%28.2%
15.1%19.6% 21.3% 23.1%
47.4% 42.0%55.6% 48.8% 45.6% 42.8%
Other Asia Europe & Africa U.S.
Client Geographic Shift
17
Client Accounts Client Equity Commissions
302K157.9K $22.1B $65.2B $386.8M $208.8M
Based on country of legal residence

Recognized Industry Leader
18
Winner 2015 “Best Cross-Asset Trading Solution”Winner 2014 “Best Broker-Dealer Overall”Winner 2014 “Best Broker-Dealer Options”
Winner 2014 Stock BrokerageWinner 2014 Futures BrokerageWinner 2014 Forex Brokerage1st Runner Up 2014 Institutional Platform1st Runner Up 2014 Options Analysis Software
IB’s multiple trading platforms, extensive suite of advanced trading tools, algos and order types continue to earn awards, year after year
* Supporting documentation for any claims and statistical information will be provided upon request.For additional information, please see www.interactivebrokers.com
Best for Options TradersBest Trading Experience & TechnologyBest for International TradersBest Range of Offerings
Best for Frequent TradersBest Portfolio Analysis & ReportsLow Cost for 11th
consecutive yearBest Overall
Rated – BEST ONLINE BROKER, AGAIN!
FOR THE FOURTH CONSECUTIVE YEAR!