sand and gravel resources of the maumee river …
TRANSCRIPT
STATE OF OHIO DEPARTMENT OF NATURAL RESOURCES
DIVISION OF GEOLOGICAL SURVEY Horace R. Collins, Chief
Report of Investigations No. 76
SAND AND GRAVEL RESOURCES OF THE MAUMEE RIVER ESTUARY,
TOLEDO TO PERRYSBURG, OHIO
by
Charles E. Herdendorf
Columbus 1970

STATE OF OHIO DEPARTMENT OF NATURAL RESOURCES
DIVISION OF GEOLOGICAL SURVEY Horace R. Collins, Chief
Report of Investigations No. 76
SAND AND GRAVEL RESOURCES OF THE MAUMEE RIVER ESTUARY,
TOLEDO TO PERRYSBURG, OHIO
by
Charles E. Herdendorf
Columbus 1970

Blank Page

Blank Page

SAND AND GRAVEL RESOURCES OF THE MAUMEE RIVER ESTUARY, TOLEDO TO PERRYSBURG, OHIO
INTRODUCTION
In January 1967 the State of Ohio designated a por-tion of the lower Maumee River in Lucas and Wood Counties as an area available for commercial dredging of sand and gravel. The Maumee-Toledo Dredging Cor-ridor, as it is called, is located between Toledo and Perrysburg, from about 6 to 13 miles upstream from Mau-mee Bay (fig. 1). The corridor is approximate! y 7 .3 miles long, and has an average width of 1, 100 feet and an area of 1.53 square miles (approximately 1,000 acres). A more detailed description of the corridor with reference to dredging restrictions can be found in the following section of this report.
Section 123.03 of the Ohio Revised Code declares: " ... the waters of Lake Erie consisting of the territory within the boundaries of the state, extending from the southerly shore of Lake Erie to the international bound-ary line between the United States and Canada, together with the soil beneath and their contents, do now and have always, since the organization of the state of Ohio, belonged to the state as proprietor in trust for the people of the state, for the public uses to which it may be adapted, subject to the powers of the United States government, to the public rights of navigation, water commerce and fishery, and further subject to the property rights of littoral owners, including the right to make reasonable use of the waters in front of or flowing past their lands.''
Geologic and hydrologic studies of the lower Mau-mee River have shown that this reach is, in actuality, an estuary of Lake Erie. Water levels in the estuary are controlled by Lake Erie as far south as the rapids at Perrysburg, where the true mouth of the Maumee River is located.
Section 1505.07 of the Ohio Revised Code states: " ... the chief of the Division of Geological Survey with the approval of the director of Natural Resources, the Attorney General, and the Governor, may issue permits and make leases to parties making application, for per-mission to take and remove sand, gravel, stone, gas, oil, and other minerals or other substances from and under the bed of Lake Erie, either upon a royalty or rental basis, as he deems best for the state. Such per-
by
Charles E. Herdendorf
mits shall be issued for terms of not less than one year nor more than ten years, and such leases shall be for a term of years or until the economic extraction of the minerals or other substances covered thereby has been completed. Such taking and removal shall be within certain fixed boundaries that do not conflict with the rights of littoral owners. Upon request from the holder of such permit, it shall be cancelled, but in the case of any permit or lease, any equipment or buildings owned by the permittee or lessee shall be held as se-curity by the chief for payment of all rentals or royal-ties due the state at the time of cancellation."
Section 1505.07 states in addition: "No person shall remove sand, gravel, stone, gas and oil or other substances from and under the bed of Lake Erie with-out first obtaining a permit or lease therefor from the chief."
Over half a million cubic yards of sand and gravel are removed commercially from the Ohio portion of Lake Erie annually. The Ohio Division of Geological Survey has designated six areas in Lake Erie as Com-mercial Sand and Gravel Dredging Areas. Six compan-ies presently hold permits for the removal of sand and gravel from one or more of the six areas: (1) Maumee Bay, (2) Cedar Point, (3) Lorain-Vermilion, (4) Fair-port, (5) Maumee River, and (6) Sandusky River. De-tailed resource studies of the first four areas have been completed by the Ohio Di vision of Shore Erosion and published in 1960 in Technical Report No. 5. "Sand Dredging Areas in Lake Erie," by Robert P. Hartley.
The objectives of the study described in this re-port are (1) to map the sand and gravel deposits of the lower Maumee River, (2) to estimate the quantity of commercial sand available, and (3) to ascertain the quality and potential uses of the sand and gravel lying within the Maumee-Toledo Dredging Corridor.
DESCRIPTION OF MAUMEE-TOLEDO DREDGING CORRIDOR
The Maumee-Toledo Dredging Corridor (fig. 2, in pocket) extends upstream from the centerline of the abandoned Fassett Street bridge (l,100 feet south of

2 SAND AND GRAVEL OF MAUMEE RIVER ESTUARY
M c H G A
------------
LUCAS
COUNTY
41°40'-i-1----------11------+---+¥--+-++----+-------~------..---'""<:---I TOLEDO
COUNTY
0 H 0 3
STUDY AREA Scale 1:120.000
4 3 2 1 0 2 4
~ I I 83°301 s3•;a5•
FIGURE 1.-Locality map of the Maumee-Toledo Dredging Corridor showing U.S. Lake Survey Navigation Chart 370 coverage of the area.
the Penn Central RR. bridge) to a line that is the pro-jection (!\. 30° ~'.) of Rte. 23 (Louisiana Avenue) in Perrysburg. The edges of the corridor are defined by lines 200 feet from the shore of the mainland or the islands. The passages between the mainland and the islands are excluded from the dredging corridor.
River crossings or manmade structures in the river will be given clearance as shown on navigation charts and as described below:
Commercial dredging activity is prohibited in the area bounded by the east edge of the turning basin and a direct northerly extension of this line approximately 500 feet east of the pipeline crossing and by a line 200 feet west of the Interstate 75 Highway bridge.
A 200-foot zone is reserved for the water pipeline crossing between Rossford and the end of Stebbins Avenue across Corbutt Island about 10, 700 feet south and west of the Penn Central R.R. bridge. The zone is marked by the wall on the east side of the Rossford Marina. The pipe line is located on the centerline of the restricted area.
An area 200 feet by 500 feet off the southern part of Clark Island is reserved by the City of Toledo. The corridor line in this area lies approximately 400 feet offshore (southeast) from Clark Island.
A zone 200 feet wide is reserved for the cable crossing approximately 15,700 feet south and west of the Penn Central RR. bridge and is located between
the Eagle Point shore and Walbridge Park. The cable occupies the centerline of this prohibited zone.
The area in the vicinity of the water intake struc-ture of the River Road filtration plant is restricted. It is about 20,500 feet south and west of the Penn Central RR. bridge. Commercial dredging is prohibited within 200 feet of the bridges of the Toledo Terminal RR. and the Ohio Turnpike.
METHODS OF INVESTIGATION
Field investigations were conducted in August and September 1964, May 1965, May and November 1967, April 1968, and September 1969.
The 1964 study included bottom profiling, sampling, and test boring. An 8,000-foot baseline was set up along the southeast shore, from Mid-States Terminal to the vicinity of Corbutt Island (fig. 2, in pocket). From this baseline, perpendicular profile sections were run from shore to shore at intervals of 500 feet. The bottom depths were recorded with a Raytheon portable fathometer mounted in a small outboard motorboat. Horizontal control for the profile lines was obtained by stretching a tag line, marked every 10 feet, across the section being profiled. Vertical control was achieved by relating all depths to feet below Low Water Datum (568.6 feet above mean water level at Father Point, Quebec, International Great Lakes Datum, 1955). Water

3 METHODS AND RESULTS OF INVESTIGATION
levels during the study period were obtained from a recording water-level gage located at the Toledo office of the U.S. Army, Corps of Engineers, in Bay View Park.
Bottom samples were taken at 500-foot intervals along each profile line. Samples were taken with a 100-cubic-inch capacity La Fond-Dietz type snapper sam-pler.
Three test borings (MR-I through MR-3) were made during the 1964 study. Subsequently, 2 borings (MR-4 and MR-5) were made in 1965 and 25 (MR-6 through MR-30) in 1967. The test borings were made by the hydraulic jetting method. This operation consists of jetting water under 40 pounds per square inch pressure through 2-inch, 1-inch, or Yi-inch aluminum pipe. The 2-inch pipe generally penetrates unconsolidated silt, clay, sand, and fine gravel; but in many cases it meets refusal in compact clay, medium gravel, and glacial till. The 1-inch or Yi-inch pipe is then used inside the larger pipe. The smaller diameter pipe can usually pen-etrate clay, till, and medium gravel but meets refusal in coarser material. Samples are taken with a hollow-tube check-valve sampler driven into the subsurface material by hand. Cores up to 3 feet in length are ob-tained by this procedure. Sampling of the subsurface material is normally performed at 5-foot intervals. Wash samples, which often come to the surface be-tween the 2-inch and smaller diameter pipe, and the resistance to penetration also give valuable informa-tion on the character of the material being penetrated.
In May 1965 a Stevens A- 35 recording water-level gage was installed at the Rossford Municipal Dock in order (I) to correlate water levels in the study area with those recorded by the Corps of Engineers at the Harbor entrance and (2) to provide vertical control for bottom deposit investigations.
In April 1968 and September 1969 current veloci-ties were measured in the river at three stations with a Hydro Products mode 1 460/465 current meter. Meas-urements were taken at 5-foot depth intervals from sur-face to bottom to determine the sediment-carrying ca-pacity of the river. The sand and gravel deposits on Ewing Island were also investigated in April 1968.
RESULTS OF INVESTIGATION
Bottom samples
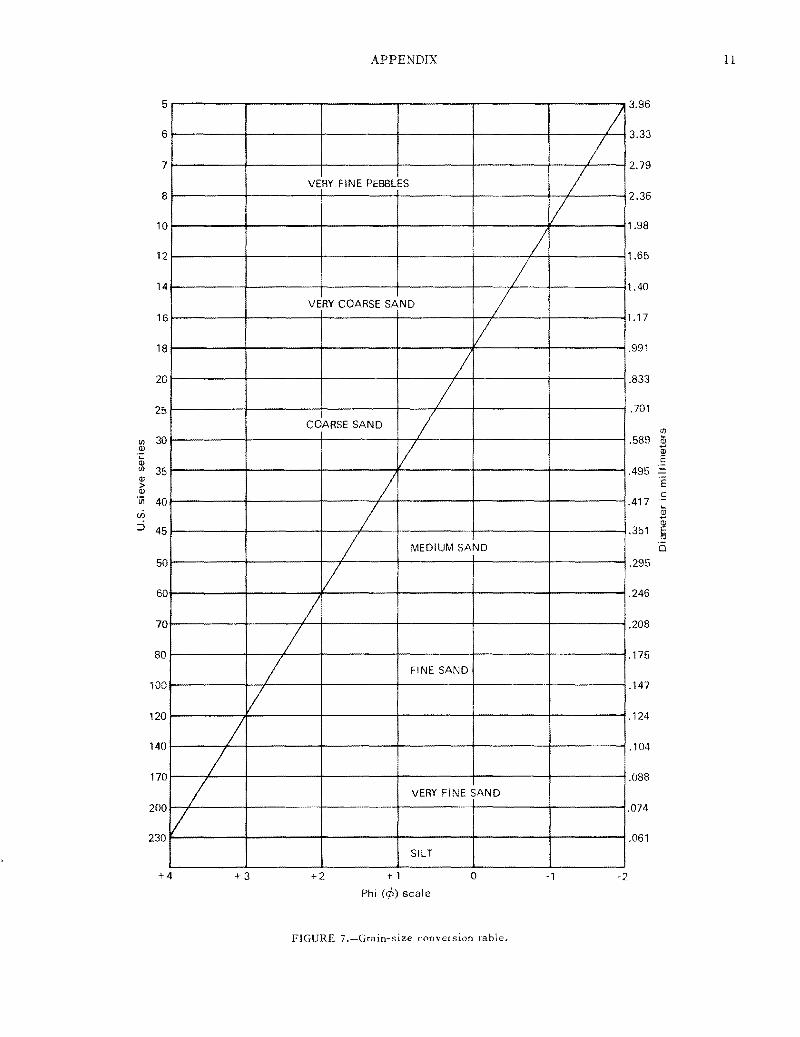
The bottom samples were mechanically analyzed for grain size by the hydrometer method. The results of these analyses and field descriptions of the sam-ples are given in table A of the Appendix. Selected sand fractions from the hydrometer tests were retained and passed through a series of sieves. The sieve grouping used for the size analyses is that used by the Ohio Highway Testing Laboratory for construction ag-gregate analyses. Specifically the sieves used were U.S. sieve series nos. 4, 8, 16, 30, 50, 100, and 200.
A conversion table from sieve numbers to millimeters and phi units is given in table B and figure 7 of the Appendix. The results of the sieve analyses, showing phi median (om) and Trask sorting coefficient (So), are given in table C of the Appendix.
The 48 bottom surface samples from the north limit of the study area upstream to Corbutt Island had the following grade distribution:
Pere en I
Mud (silt and clay sizes) 59 Sand and gravel 41
The high percentage of mud in the bottom surface sediment may be a result of the time of sampling. The samples were collected in the late summer when little coarse material is being contributed from upstream and silt has the opportunity to settle to the bottom.
Surface samples from the 30 test borings, which were taken at various times of the year throughout the study area, yield the following grade distribution:
Percent
Mud (silt and clay sizes) 21 Sand 54 Gravel 25
The distribution of surface deposits within the dredging corridor is shown in figure 2 (in pocket). Data for this map were taken both from bottom surface sam-ples and from the top sample of test boring cores.
The Trask sorting coefficient (So) is a measure of the uniformity of particle sizes in a sediment sample. It is based on the statistical spread of the first and third quartiles on the percent passing curve (Krumbein and Pettijohn, 1938). These quartiles lie on each side of the median particle diameter (¢m) or 50 percent passing and correspond to 25 and 75 percent passing. A sediment that is perfectly uniform in particle diame-ter has a sorting coefficient of 1.0. As this number in-creases the sediment is more poorly sorted. In general, Maumee River surface sand deposits are medium or well sorted. The following classification is useful in describing uniformity of diameters in the sand and gravel ranges:
Sorting coefficient Classification
l.0-1. 5 well sorted 1.5-2.5 medium sorted
>2.5 poorly sorted
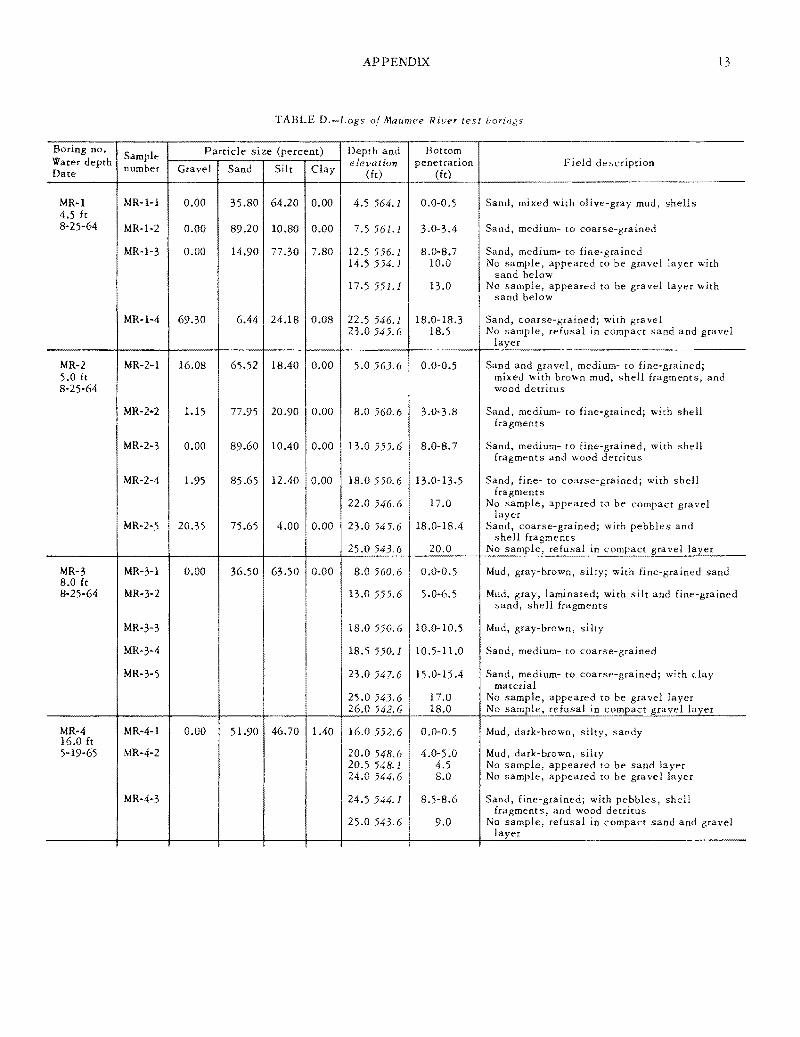
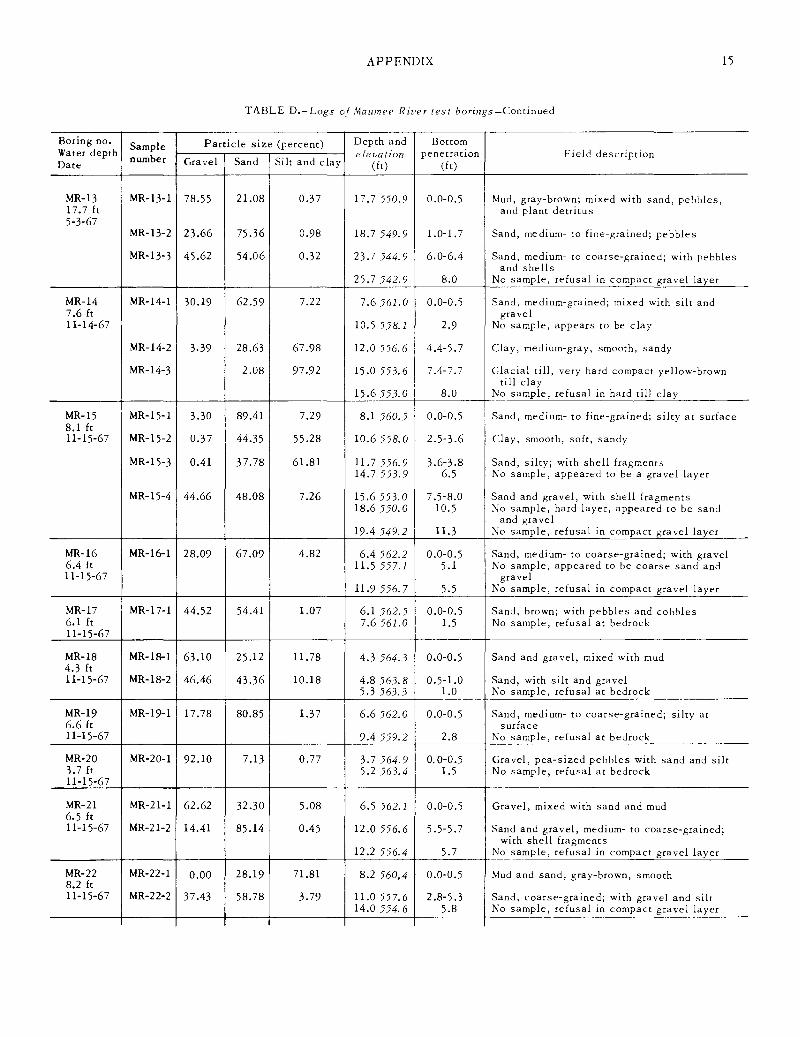
Test borings
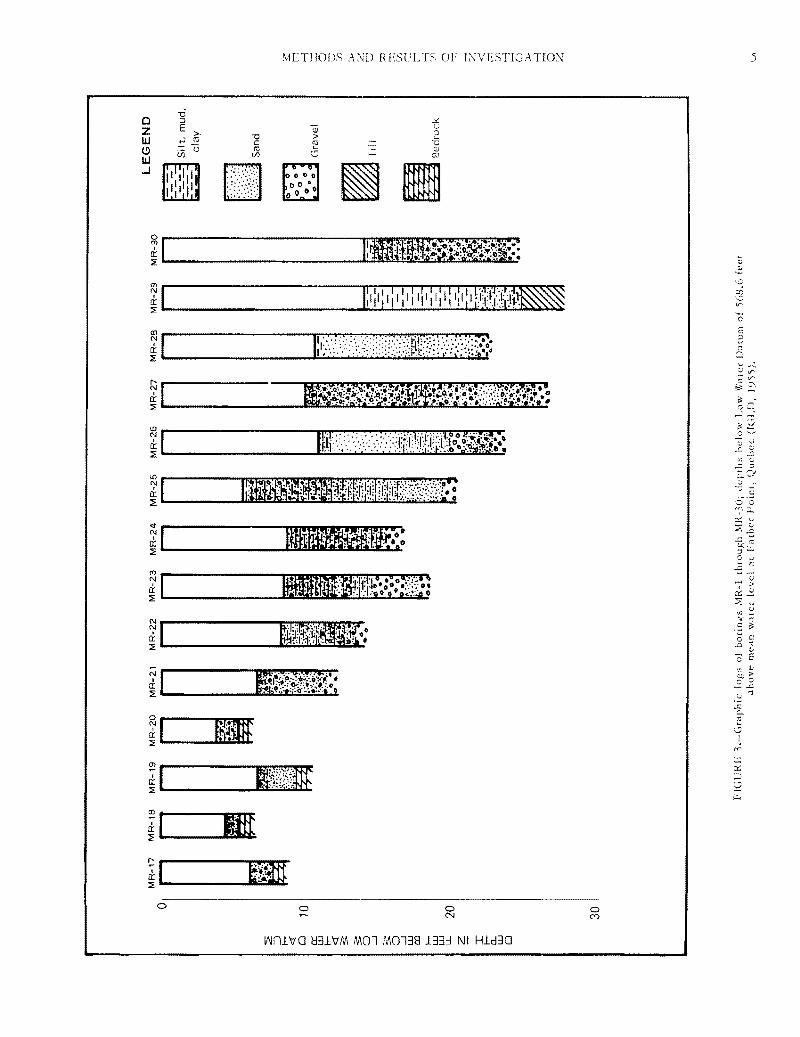
Generalized graphic logs of the 30 test borings are shown in figure 3. Detailed descriptions of test borings are given in table D of the Appendix. Eighty-two sam-ples were retrieved from the test boring cores. Samples containing predominantly fine material were analyzed

4 SAND AND GRAVEL OF MAUMEE RIVER ESTUARY
~r----------n~,.,,...~...,,.,~
i:i: ~--------..a:..........~..:.;..i;.;..:..:......., .r.,_._______ [)'.' ~-------
mr------------------.I [)'.
~-----------------------
~·1--------------------ttJ)~:,-+-~-~-~-~-~~-~~-f;-~~-:'.i-~-i-~:-~
~-1____tf_
~'-___If_ ~1_:______________mft__~ I'----------.... i:i:
~----------~,-----------~i:i: ~--------...&;,:,j.......
<tr--------------------------1 [)'.
~"---------------------£ mr----------..~
i:i: ~'-----------~ Nt-----
~ ....---_ __Jll:,·~~~1~?~~)~)~)~1~~~~8~t~&~~~~~~f~t~~~~~~~«r-~~~~~~~iL~rW~~~~~~¥~;~;.:·~·'311~~~:
0 0 0 0 N M
IAJnlva 831'efM MOl M0138 133::l NI Hld30
LE
GE
ND
MR
-17
M
R-1
8
MR
-19
M
R-2
0
MR
-21
M
R-2
2
MR
-23
M
R-2
4
MR
-25
M
R-2
6
MR
-27
M
R-2
8
MR
-29
M
R-3
0
0
~
:::>
f- <( 0
10
0:
UJ
f- <( s s
•'"o
0 _J s 0 _
J
UJ co
f- UJ
UJ
LL
20
z I f- a..
UJ 0
30
"'.::.
.
. . ..
... ::·..
...
. :·:
:: ·:::-:
·~~~·~, ...,..
~ ~ S
ilt,
mud
, cl
ay
. S
and
LEill.
:::::'.' tTJ
>-j
Gra
vel
3 '--'
Cf) ;;..
Y.
'--'
~
:;:::: './-'.
m
,...., , >-1
'fi
Bed
rock
0 "r
. 2 < l'"'
C/l - >-l - Cl > >-j 6 z
FIG
UR
E 3
.-G
rap
hic
log
s of
hor
ings
Ml\
-1 t
hrou
gh M
l\-_'
,();
dep
ths
belo
w L
ow W
at<:
r D
atum
of
568.
6 fc
·et
ahov
e m
ean
Wtt
ter
leve
l at
Fat
her
Poi
nt,
Qut
>b<'
c (l
CL
ll,
]'))
)).
Vi
6 SAND AND GRAVEL OF MAUMEE RIVER ESTUARY
/ /
/
Maumee Bay
g Bedrock I ess than three feet deep Contour interval 20 feet
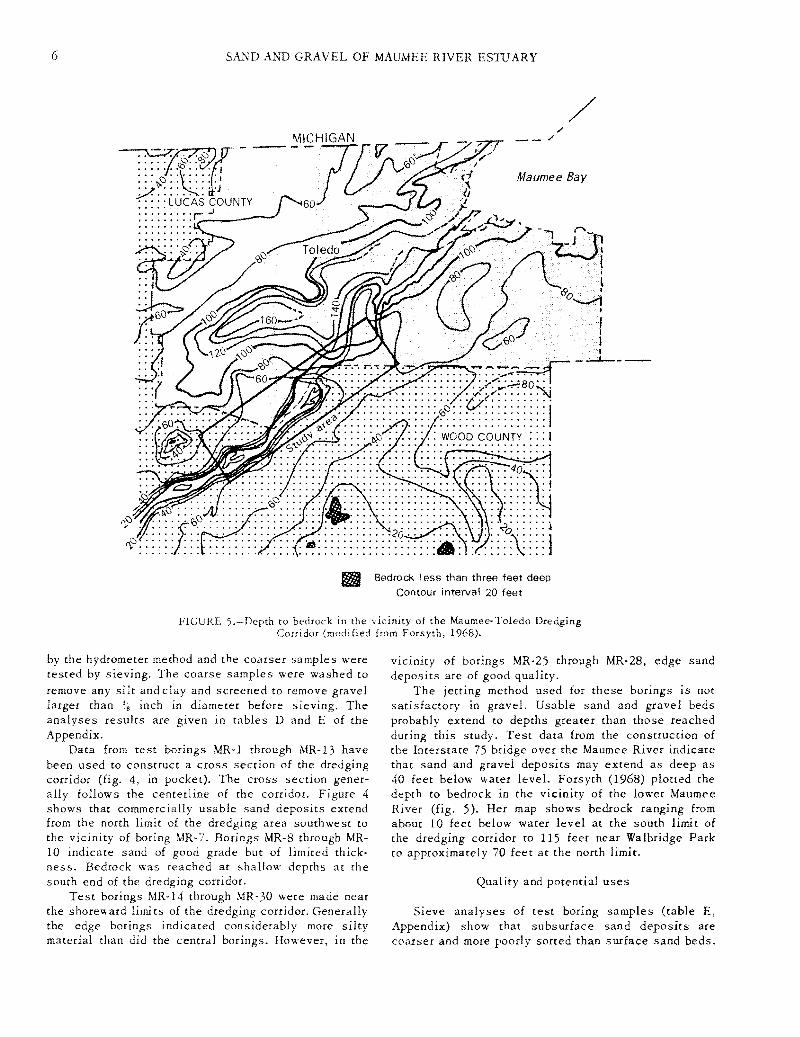
FIGURE ).-Depth to bedrock in the vicinity of the Maumee-Toledo Dredging Corridor (modified from Forsyth, 1968).
by the hydrometer method and the coarser samples were tested by sieving. The coarse samples were washed to remove any silt and clay and screened to remove gravel larger than 31,. inch in diameter before sieving. The analyses results are given in tables D and E of the Appendix.
Data from test borings MR-1 through MR-13 have been used to construct a cross section of the dredging corridor (fig. 4, in pocket). The cross section gener-ally follows the centerline of the corridor. Figure 4 shows that commercially usable sand deposits extend from the north limit of the dredging area southwest to the vicinity of boring MR- 7. Borings MR-8 through MR-10 indicate sand of good grade but of limited thick-ness. Bedrock was reached at shallow depths at the south end of the dredging corridor.
Test borings MR-14 through MR-30 were made near the shoreward lirni ts of the dredging corridor. Generally the edge borings indicated considerably more silty material than did the central borings. However, in the
vicinity of borings MR-25 through MR-28, edge sand deposits are of good quality.
The jetting method used for these borings is not satisfactory in gravel. Usable sand and gravel beds probably extend to depths greater than those reached during this study. Test data from the construction of the Interstate 75 bridge over the Maumee River indicate that sand and gravel deposits may extend as deep as 40 feet below water level. Forsyth (1968) plotted the depth to bedrock in the vicinity of the lower Maumee River (fig. 5). Her map shows bedrock ranging from about 10 feet below water level at the south limit of the dredging corridor to 115 feet near Walbridge Park to approximately 70 feet at the north limit.
Quality and potential uses
Sieve analyses of test boring samples (table E, Appendix) show that subsurface sand deposits are coarser and more poorly sorted than surface sand beds.

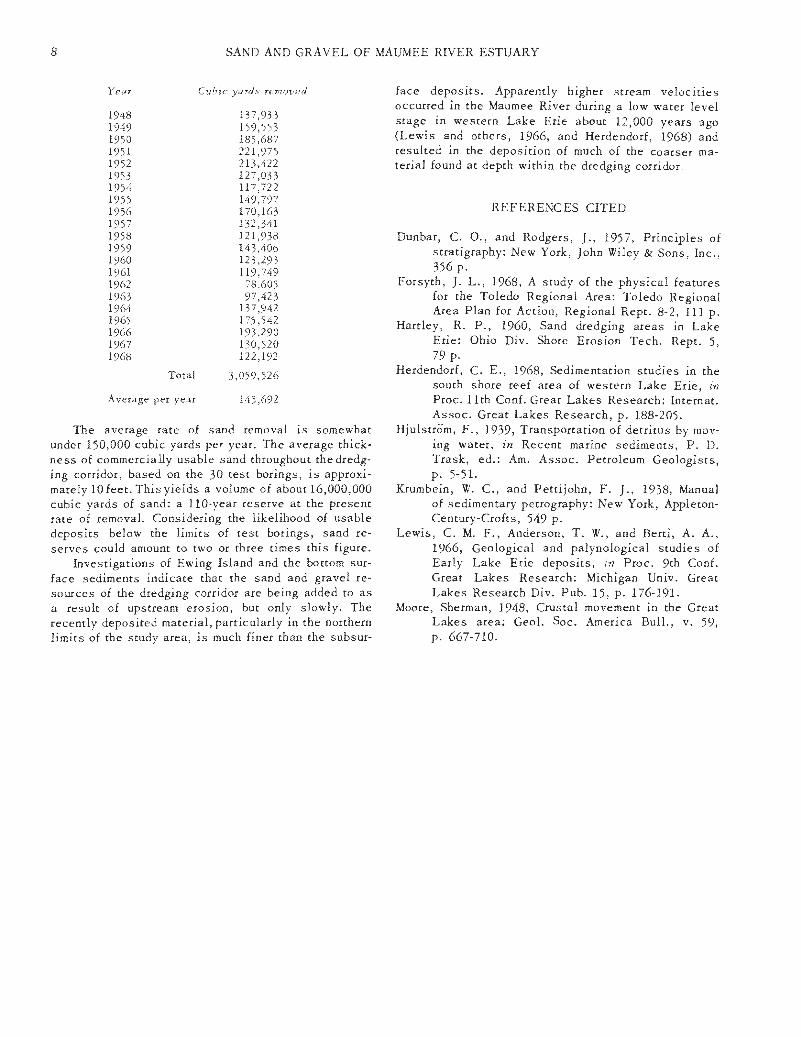
7 RESERVES
The median diameter of the test boring sand samples ranged from 0.1 mm to 7.4 mm and averaged 0. 7 mm. Gravel layers were found at the bases of two-thirds of the test holes.
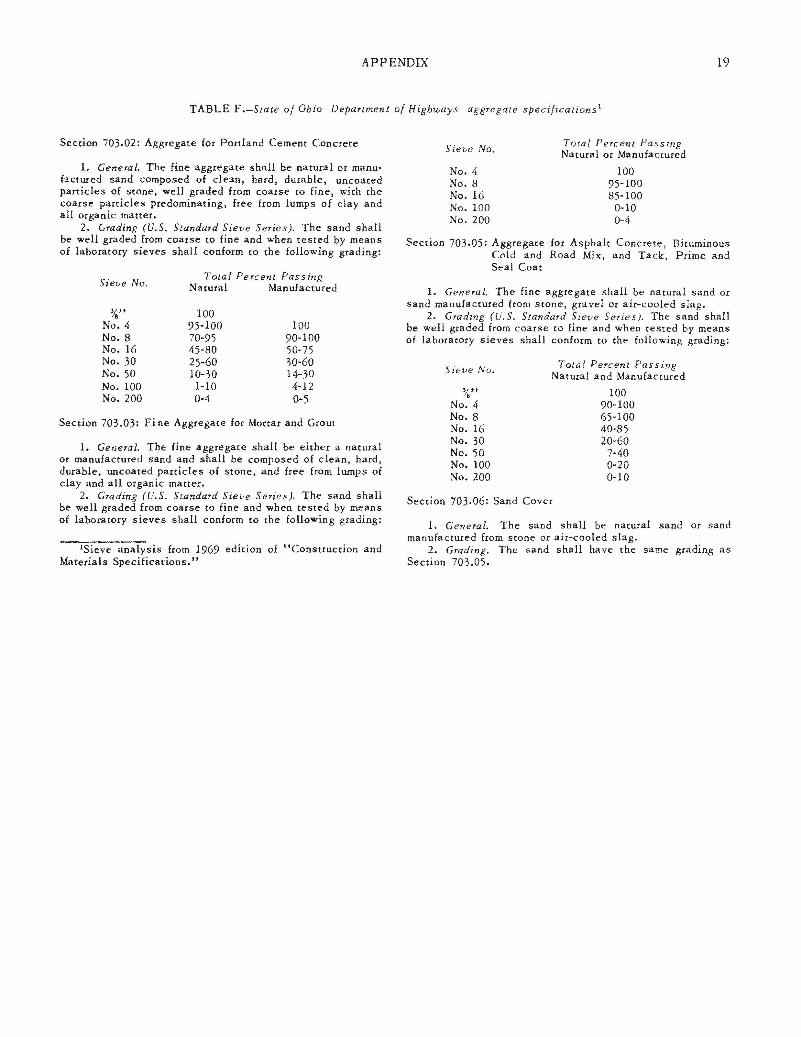
Midriver deposits (test borings MR-5 and MR-12) adjacent to Delaware and Clark Islands yielded mate-rial of the best grade for concrete sand. The best mor-tar and mason sand was found in samples (MR-1 and MR-2) from the north limit of the dredging corridor and north (MR-23) of Burns Island. Good mix and cover sand was found in samples throughout the corridor. Ohio Highway Department specifications for aggregate grading are given in table F of the Appendix.
Island sand deposits
Ewing Island, situated below the rapids of the Mau-mee River at Perrysburg, was investigated to determine (1) the composition of material forming the island, (2) the potential use of the mineral resources on the is-land, and (3) the geologic origin of the island. Samples of the island material were collected and analyzed optically for grain size and mineral composition.
The material forming the surface of the island was found to be river-deposited alluvium ranging in size from silt to large gravel. Large cobbles and boulders were found mixed with sand at the south (upstream) terminus of the island. The deposited sediment graded to finer sand and silt toward the north (downstream) end of the island.
The island appears to have been formed by the deposition of material carried by a rapidly moving stream as it flowed into the quiet water of the drowned fiver mouth. Evidence on the island, such as recently deposited coarse material, indicates that this process is continuing to build the island at the present time. Because the sand is mixed with abundant amounts of gravel and silt its extraction would demand an elabo-rate screening operation. The smaller downstream is-lands contain smaller amounts of coarse gravel and are considered better sources of commercial sand.
Maumee River mouth
The geologic mouth of the Maumee River is located just above the Maumee-Perrysburg bridge. This is the place where the bed of the river rises above Low Water Datum for Lake Erie, i.e., where Low Water Datum in-tersects the shoreline on either side of the river. A line drawn between these points is the demarcation be-tween the Maumee River and the estuary of Lake Erie.
The location of the mouth of the Maumee River in the vicinity of the Maumee-Perrysburg bridge is further supported by water levels recorded at the Rossford Marina, which is abreast of Corbutt Island. A compari-son of water levels recorded at the Rossford gage and at the U.S. Army Corps of Engineers gage at the harbor
entrance, for September 15, 1965, through November 8, 1965, indicates that the average water level in the dredging corridor is essentially the same as the aver-age level of Lake Erie. During the period of record, the average hourly level at Rossford was 0. 52 foot above Low Water Datum and the corresponding level at the harbor entrance was 0.51 foot, a difference of only 0.01 foot (fig. 6, in pocket).
Crustal movements account for the fact that water at the level of Lake Erie extends so many miles in-land. These movements have depressed the lower Mau-mee River valley to the point where Lake Erie has encroached on the valley, forming the drowned river mouth or estuary that exists today.
Moore (1948) studied crustal movements in the Great Lakes area. His measurements showed that the Toledo area was depressed at a rate of 0.72 foot per century for the period 1877 to 1944. Considering that Lake Erie has been at its present level for several thousands of years, significant drowning of the lower Maumee River valley is understandable.
Current studies
In the spring of 1968, currents were measured mid-stream near the Interstate 75 bridge, near the Rossford Municipal Dock, and between De laware and Grassy Is-lands. Current directions at each station were down-stream and within the northeast quadrant. Velocities ranged from 0. 72 foot per second to 0.17 foot per sec-ond. Surface velocities averaged 0.33 foot per second while bottom currents averaged 0.28 foot per second. These velocities are insufficient to erode sand but a velocity of only 0.23 foot per second is sufficient to transport particles as large as coarse-grained sand (Hjulstrom, 1939) once the particle is in motion.
Current measurements on September 4, 1969, at 1500 hours yielded quite different results. With wind velocities of 15 to 20 mph from NNE, the surface cur-rents near the Rossford Municipal Dock were moving upstream (210°) at 0.51 foot per second. However, at depths greater than 5 feet the direction was nearly re-versed (70°) and the flow was downstream at 0.17 foot per second. Records for this period show water level rising at a rate of 0.23 foot per hour in response to the wind. By 1600 hours the force of the wind-driven lake water was apparently strong enough to stop the down-stream river flow and currents from top to botrom were moving upstream at an average velocity of 0.23 foot per second.
RESERVES
The Ohio Department of Natural Resources has kept records of sand and gravel removal from the Mau-mee River since 1948:

APPENDIX
TABLE A.-D<>scri/1/zon of ,\laumf'f' Ri1 er bottom sampl<>s
Profile line
0+00
s+oo
10+00
lS+OO
20+00
2S+OO
30+00
3S+OO
40+00
4S+OO
50+00
SS+OO
60+00
6S+OO
Distance from
baseline (ft)
soo 1000
soo
1000
soo 1000 lSOO
soo
1000
soo 1000
soo 1000
soo 1000
lSOO
soo 1000
lSOO
soo 1000 lSOO
soo 1000 lSOO
soo
1000 lSOO
soo 1000 lSOO 2000
soo 1000
lSOO 2000
Water depth
(ft)
26.0 14.S
1.3
22.0
1. 7 3.3
l S.O
1.6
13.8
2.1 11.0
16.3 lS .2
9.9 7.7
13.8
14.0 12.0
12.3
14.0 12 .4 U.7
16.s lS.O 18. 7
lS.O
10.4 9.7
14. 7 10.S 11.S
3.1
17.0 11.0
20.3 2.0
Munsell color
s y 4/1 s y 4/1
s y 3/2
s y 4/1
SY 4/1 SY 4/1 s y 4/l
st' 3;2
s y 3/2
s y 411 s y 4/1
s y S/2 SY 4/1
s y 4/1 lOYR S/4
s y 4/1
s y 4/1 mixed colors
s y 4/1
s y 4/1 s y 4/1 s y 4/1
SY 4/1 s y 4/1 SY 4/1
s y 3/2
SY 4/1 s y 4/1
s y 4/1 s y 4/1 SY 4/1 st' 4/ 1
SY 4/1 mixed colors
SY 4/1 SY 3/2
Field description
Mud, olive-gray Mud, olive-gray
Sand, fine-fragments
Mud, olive-gray, sandy
Silt, olive-gray, sandy Mud, olive-gray Mud, olive-gray
Sand, fine- to medium-grained; shell fragments
Sand, fine- to medium-grained; shell fragments
Mud, olive-gray, sandy Silt, olive-gray, sandy
Mud, light-olive-gray Mud, olive-gray
Mud, olive-gray Pebbles and cobbles, yellowish-
brown Mud, olive-gray
(profile line through l 7S bridge abutments)
Mud, olive-gray Gravel, pebbles, cobbles, and
shells Mud, olive-gray; gravel, pebbles
and shells
Mud, olive-gray, sandy Mud, olive-gray Mud, olive-gray, sandy
Mud, olive-gray, sandy Mud, olive-gray, sandy Mud, olive-gray
Sand, fine- to medium-grained; shells and wood
Mud, olive-gray, sandy Mud, olive-gray
Mud, olive-gray Mud, olive-gray Mud, olive-gray Mud, olive-gray
Silt, olive-gray, sandy Sand, fine- to medium-grained;
gravel, pebbles, and shells Mud, olive-gray Sand, fine- to medium-grained; shell
fragments
Hydrometer analysis (percent) Sieve
sample number
Sand and
gravel Silt Clay
20.0 7 7 .1 2.9 27.0 67.2 S.8
edium-grained; shellto m 100.0 0.0 0.0 1
S2.3 2S .8 1.9 2
74.1 2S .s 0.4 3 26.6 72. 7 0.7 4 24.9 73 .8 1.3
72.7 27 .3 0.0 s
6
S 1.2 4 7. 7 1.1 7 44.0 S6.0 0.0 8
12.0 86.2 1.8 17 .6 74.9 7.s
18.2 78.2 3.6 100.0 0.0 0.0 9
l S .1 82.9 2.0
27.2 70.0 2.8 100.0 0.0 0.0 10
99.7 0.3 o.o 11
42.4 s 7 .6 0.0 22.S 70.S 7.0 34.6 61. 7 3.7 12
60.S 3 7 .s 2.0 S 1.9 46. 7 1.4 13
4.9 79. 7 lS.4
83.7 16.3 0.0 14
lS.4 80.0 4.6 10.S 86.0 3.S
22.0 43.6 1.4 S.2 93.9 0.9
21.4 77.3 1.3 27.S 71.6 0.9
S4.3 4S.l 0.6 lS 100.0 0.0 0.0 16
0.0 98.4 1.6 77.0 22.2 0.8 17
9

10 SAND AND GRAVEL OF MAUMEE RIVER ESTUARY
TABLE A.-Descriptzun oi Maumee River hottom samples-Continued
Profile line
Distance from
baseline (ft)
\\'ater depth
(ft) Munsell
color Field description
Hydrometer analysis (percent) Sieve
sample number
Sand and
gravel Silt Clay
70+00 500 10.6 mixed culors Gravel, pebbles, and shells 100.0 0.0 0.0 18 1000 6.5 SY 4. 1 Sand, fine-grained, silty 54.0 43.9 1.3 19 1500 19. 5 5} 4/1 Mud, olive-gray 2.2 96.4 1.4 2000 2.3 5y 4/1 Mud, olive-gray, sandy 34.4 64.4 1.2 20
75+00 500 16.1 5y 4; 1 Mud, olive-gray 3.6 94.0 2.4 1000 8.8 5} 4/1 Mud, olive-gray, sandy 27 .s 69.6 2.9 1500 15 .3 5y 4/1 Mud, olive-gray 0.2 96.1 3.7 2000 2.0 5y 4/1 Mud, olive-gray 21.2 77.1 1. 7
80+00 500 13.0 5 'r 4/ 1 Mud, olive-gray 8.7 86.1 5.2 1000 10.5 SGY 4; 1 Sand, fine- to coarse-grained, sticky 90.7 9.3 0.0 21 1500 4.7 SGY 411 Sand, fine- to medium-grained, sticky 46.8 51.6 1. 7 22 2000 2.4 5y 4; 1 l\fuJ, olive-gray, sandy 24.3 75.2 0.5
TABLE B.-\\'e11tu•orth sediment grade scale'
Grade limits ¢ units (-log 2Grade namemicrons diameters in mm)mm rn(approx.)
160 -124096 Very large boulders2048 80 -11 Large. boulders .................................... 1024 40 -10 Medium boulders512 20 -9 Small boulders10 -8256 Large cobbles128 -75 ···································· Small cobbles
2.)64 -6 Very coarse pebbles32 1.3 -5 Coarse pebblesl(] 0.6 -4 Medium pebbles8 0.3 -3 Fine pebbles0.16 -24
2 --+--O .08 --+---\-'e_r_y_fi_·n_e_p_e_b_b_le_s______-+----- -1 Very coarse sand1000 0 Coarse sand500 ~/2 +l Medium sand
1;4 +2250 Fine sand125 +3'1, Very fine sand +462 'l16 Coarse silt131 +5132 Medium silt1 +616 /64 Fine silt +78 Yi2s Very fine silt,, +84 7256 Coarse clayl; +92 1512 Medium clay +10'l,.014 Fine clay +11'!, '1,048 ···································· Very fine clay +12'%; ~096
'Modified from Dunbar and Rodgers (1957).
11 APPENDIX
5
6
7
8
10
12
14
16
18
20
25
V) 30 Q)
(ij V) 35 <].) ><].)
tll 40 ch ::l 45
50
60
70
80
100
120
140
170
200
230
/I
VERY FINE PEBBLES I I
/I
VERY COARSE SAND I I
/I
COARSE SAND I v I
I I MEDIUM SAND
v I
I I FINE SAND
I I
I I VERY FINE SAND
I SILT
3.96
3.33
2.79
2.36
1.98
1.65
1.40
1.17
.991
.833
.701
V)
.589 (ij +-' <].) E
.495 -E c
.417 Qi+-' \l)
.351 E (1)
0 .295
.246
.208
.175
.147
.124
.104
.088
.074
.061
+4 +3 +2 + 1 0 -1 -2 Phi (</>)scale
FIGURE 7.-Grain-size conversion table.

12 SAND AND GRAVEL OF MAUMEE RIVER ESTUARY
TABLE C.-Sieve analyses of hydrometer sand fractions from Maumee River bottom samples
WaterU.S. sieve series (percent passing) </JmSample So depth Location (mm)number 30 1004 508 I 16 (ft)
1 2
3 4
100.00 100.00
100.00 100.00
100.00 100.00
100.00 100.00
I I
100.00 100.00
100,00 100.00
98.82 100.00
98.63 100.00
77.87 88.64
82.84 97.40
12.45 26.28
33.81 70.29
2.3 2.4
2.4
1.32 1.32
1.57
1.3 22.0
l.7 3.3
5 6
100.00 100.00
97.37 100.00
93.21 96.90
78.69 89.60
24.09 67.09
8.35 17.94
1.3 2.3
l.37 1. 74
1.6 13.8
7 8
100.00 100.00
100.00 100.00
100.00 100.00
100.00 100.00
100.00 98.03
99.89 77.94
2.1 11.0
9 0.00 7.7
10 11
12
i 1.95
19.04
100.00
0.00 7.61
100.00
5.16
100.00
4.09
98.98
I I
I 2.92
85.17
1.04
32.25 2.4 1.42
12.0 12.3
13.7
13 100.00 100.00 100.00 100.00 97 .12 35.25 2.6 1.32 15.0
14 100.00 100.00 99,45 97.35 I 90.16 47.65 3.8 1.52 15.0
15 16 17
18 19 20
I I
100.00 5.45
100.00
0.00 100.00 100.00
100.00 o.oo
100.00
100.00 100.00
i I
98.99
100.00
100.00 100.00
93.48
100.00
98.48 100.00
75.07
88.90
82.85 94.45
35.13
40.34
30.76 67.67
2.4
2.4
2.4
1.62
1.42
1.42
17 .o 11.0 2.0
10.6 6.5 2.3
21 22
100.00 100.00
100.00 l 00.00
100.00 100.00 I 99.12
100.00 86.23
100.00 40.55 78.72
2.5 1.57 10.5 4.7
Profile line 5+00, 500 ft Profile line 5+00, 1000 ft
Profile line lo+OO, 500 ft Profile line lo+OO, 1000 ft
Profile line 15+00, 500 ft Profile line l 5+00, 1000 ft
Profile line 2o+OO, 500 ft Profile line 2o+OO, 1000 ft
Profile line 3o+OO, 1000 ft
Profile line 4o+OO, 1000 ft Profile line 4o+OO, 1500 ft
Profile line 45+00, 1500 ft
Profile line 50+00, 1000 ft
Profile line 55+00, 500 ft
Profile line 65+00, 500 ft Profile line 65+00, 1000 ft Profile line 65+00, 2000 ft
Profile line 70+00, 500 ft Profile line 7o+OO, 1000 ft Profile line 7o+OO, 2000 ft
Profile line 80+00, 1000 ft Profile line 8o+OO, 1500 ft
·-
13 APPENDIX
TABLE D.-Logs of Maumee River test borings
Boring no. Water depth Date
Sample number
Particle size (percent) Depth and elevation
(ft)
Bottom penetration
(ft) Field descriptionGravel Sand Silt Clay
MR-l MR-1-1 0.00 35.80 64.20 0.00 4.5 564.1 0.0-0.5 Sand, mixed with olive-gray mud, shells 4.5 ft 8-25-64 MR-1-2 0.00 89.20 10.80 0.00 7.5 561.1 3.0-3.4 Sand, medium- to coarse-grained
MR-H 0.00 14.90 77.30 7.80 12.5 556.1 8.0-8.7 Sand, medium- to fine-grained 14.5 554. 1 10.0 No sample, appeared to be gravel layer with
sand below 17.5 551.1 13.0 No sample, appeared to be gravel layer with
sand below
MR-1-4 69.30 6.44 24.18 0.08 22.5 546.1 18.0-18.3 Sand, coarse-grained; with gravel 23.0545.6 18.5 No sample, refusal in compact sand and gravel
layer
MR-2 MR-2·1 16.08 65.52 18.40 0.00 5.0 563.6 0.0-0.5 Sand and gravel, medium- to fine-grained; 5.0 ft mixed with brown mud, shell fragments, and 8-25-64 wood detritus
MR-2•2 1.15 77.95 20.90 0.00 8.0 560.6 3.0-3.8 Sand, medium- to fine-grained; with shell fragments
MR-2-3 0.00 89.60 10.40 0.00 13.0 555.6 8.0-8.7 Sand, medium- to fine-grained, with shell fragments and wood detritus
MR-2-4 l.95 85.65 12.40 0.00 18.0 550. 6 13.0-13.5 Sand, fine- to coarse-grained; with shell fragments
22.0 546.6 17.o No sample, appeared to be compact gravel layer
MR-2-5 20.35 75.65 4.00 0.00 23.0 545. 6 18.0-18.4 Sand, coarse-grained; with pebbles and shell fragments
25.0 543.6 20.0 No sample, refusal in compact gravel layer
MR-3 MR-3-1 0.00 36.50 63.50 0.00 8.0 560. 6 0.0-0.5 Mud, gray-brown, silty; with fine-grained sand 8.0 ft 8-25-64 MR-3-2 13.0 555.6 5.0-6.5 Mud, gray, laminated; with silt and fine-grained
sand, shell fragments
MR-3-3 18.0 550. 6 10.0-10.5 Mud, gray-brown, silty
MR-3-4 18.5550.1 10.5-11.0 Sand, medium- to coarse-grained
MR-3-5 23.0 547.6 15.0-15.4 Sand, medium- to coarse-grained; with day material
25.0 543. 6 17.0 No sample, appeared to be gravel layer 26.0 542.6 18.0 No sample, refusal in compact gravel !aver
MR-4 MR-4-1 0.00 51.90 46.70 1.40 16.0 552.6 0.0-0.5 Mud, dark-brown, silty, sandy 16.0 ft 5-19-65 MR-4·2 20.0 548.6 4.0-5.0 Mud, dark-brown, silty
20.5 548.1 4.5 No sample, appeared to be sand layer 24.0 544.6 8.0 No sample, appeared to be gravel layer
MR-4-3 24.5 544.1 8.5-8.6 Sand, fine-grained; with pebbles, shell fragments, and wood detritus
25.0 543.6 9.0 No sample, refusal in compact sand and gravel layer
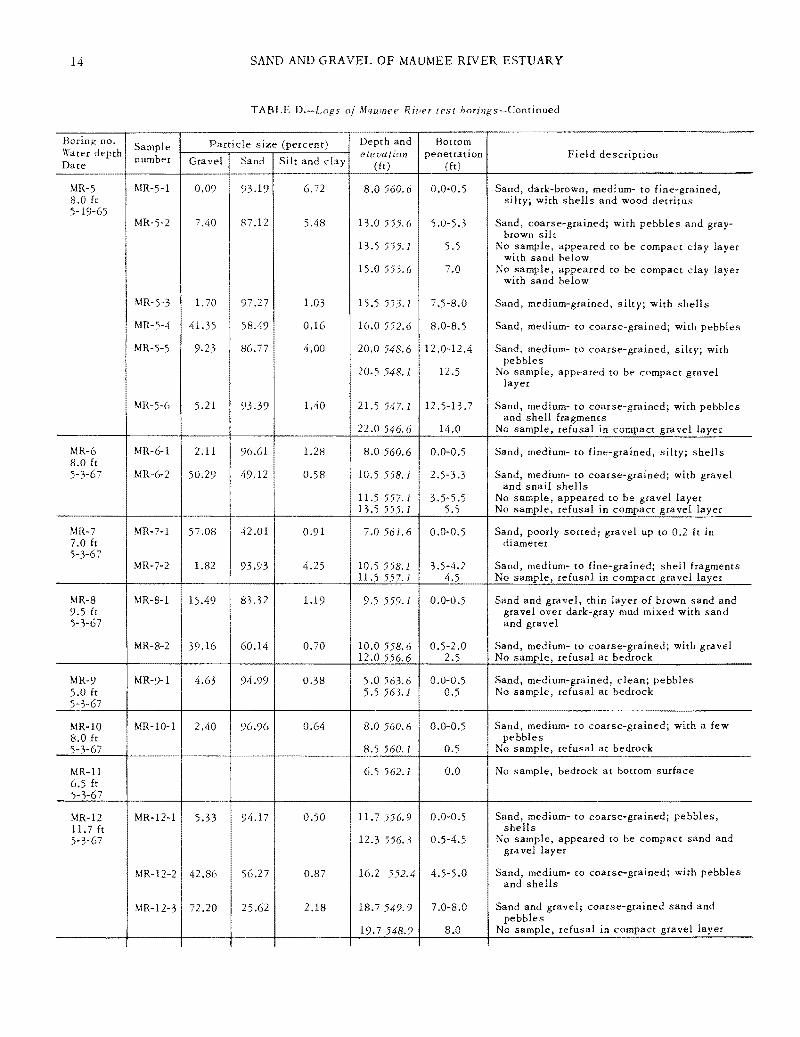
14 SAND AND GRAVEL OF MAUMEE RIVER ESTUARY
TABLE o/ ltlaumee River test borings-Continued
Boring no. Water depth Date
Sample number
MR-5 8.0 ft 5-19-65
MR-5-1
MR-5-2
MR-5-3
MR-5-4
MR-5-5
MR-5-6
MR-6 8.0 ft 5-3-67
MR-6-1
MR-6-2
MR-7 7.0 ft 5-3-67
MR-7-1
MR-7-2
MR-8 9.5 ft 5-3-67
MR-8-1
MR-8-2
MR-9 5.0 ft 5-3-67
MR-10 8.0 fr 5-3-67
MR-11 6.5 ft 5-3-67
~lR-12 11. 7 ft 5-3-67
MR-9-1
MR-10-1
MR-12-1
MR-12-2
MR-12-3
Particle size (percent) Gravel Sand Silt and clay
0.09 93.19 6.72
7.40 87 .12 5.48
1. 70 97 .27 1.03
41.35 58.49 0.16
9.23 86.77 4.00
5 .21 1.4093.39
2.11 1.2896.61
50.29 49.12 0.58
42.0157.08 0.91
1.82 4.2593.93
i 83.321 S.49 1.19 I
60.14 0.7039.16
4.63 0.3894.99
0.642.40 96.96
0.5094.175.33
0.8742.86 56.27
2.1872.20 25.62
Depth and elevation
(ft)
8.0 560.6
13.0 555.6
13.5 555.1
15.0 553.6
15.5 553.1
16.0 552.6
20.0 548.6
20.5 548.1
21.5 547.1
22.0 546. 6
8.0 560.6
10.5 558.1
11.5 557.1 13.5 555.1
7 .0 561. 6
10.5 558.1 11.5 557.1
9.5 559.1
10.0 558. 6 12.0 556.6
5.0 563.6 5.s 563.1
8.0 560.6
8.5 560. J
6.5 562.1
11. 7 556.9
12.3 556.3
16.2 552.4
18.7 549.9
19.7 548.9
Bottom penetration
(ft)
0.0-0.5
5.0-5.3
5.5
7.0
7.5-8.0
8.0-8.5
12.0-12.4
12.5
12.5-13. 7
14.0
0.0-0.5
2.5-3.3
3.5-5.5 5.5
0.0-0.5
3.5-4.2 4.5
0.0-0.5
0.5-2.0 2.5
0.0-0.5 0.5
0.0-0.5
0.5
0.0
0.0-0.5
0.5-4.5
4.5-5.0
7.0-8.0
8.0
Field description
Sand, dark-brown, med: um- to fine-grained, silty; with shells and wood detritus
Sand, coarse-grained; with pebbles and gray-brown silt
No sample, appeared to be compact clay layer with sand below
No sample, appeared to be compact clay layer with sand below
Sand, medium-grained, silty; with shells
Sand, medium- to coarse-grained; with pebbles
Sand, medium- to coarse-grained, silty; with pebbles
No sample, appeared to be compact gravel layer
Sand, medium- to coarse-grained; with pebbles and shell fragments
No sample, refusal in compact gravel layer
Sand, medium- to fine-grained, silty; shells
Sand, medium- to coarse-grained; with gravel and snail shells
No sample, appeared to be gravel layer No sample, refusal in compact gravel layer
Sand, poorly sorted; gravel up to 0.2 ft in diameter
Sand, medium- to fine-grained; shell fragments No sample, refusal in compact gravel layer
Sand and gravel, thin layer of brown sand and gravel over dark-gray mud mixed with sand and gravel
Sand, medium- to coarse-grained; with gravel No sample, refusal at bedrock
Sand, medium-grained, clean; pebbles No sample, refusal at bedrock
Sand, medium- to coarse-grained; with a few pebbles
No sample, refusal at bedrock
No sample, bedrock at bottom surface
Sand, medium- to coarse-grained; pebbles, shells
No sample, appeared to be compact sand and gravel layer
Sand, medium- to coarse-grained; with pebbles and shells
Sand and gravel; coarse-grained sand and pebbles
No sample, refusal in compact gravel layer
15
5-3-67
APPENDIX
TABLE D.-Logs of Maumee River test borings-Continued
Particle size (percent)
Gravel Sand Silt and clay
Depth and elevation
(ft)
Bottom penetration
(ft) Field description
78.55 21.08 0.37 17.7550.9 0.0-0.5 Mud, gray-brown; mixed with sand, pebbland plant detritus
es,
23.66 75.36 0.98 18.7 549. 9 1.0-1. 7 Sand, medium- to fine-grained; pebbles
45.62 54.06 0.32 23.7 544.9 6.0-6.4 Sand, medium- to coarse-grained; with peand shells
bbles
25.7 542.9 8.0 No sample, refusal in compact gravel layer
30.19 62.59 7.22 7.6 561.0 0.0-0.5 Sand, medium-grained; mixed with silt and
10.5 558.1 2.9 gravel
No sample, appears ro be clay
3.39 28.63 67.98 12.0 556.6 4.4-5.7 Clay, medium-gray, smooth, sandy
2.08 97.92 15.0 553.6 7.4-7. 7 Glacial till, very hard compact yellow-brown
15.6 553.0 8.0 till clay
No sample, refusal in hard till clay
3.30 89.41 7.29 8.1 560.5 0.0-0.5 Sand, medium- to fine-grained; silty at surface
0.37 44.35 55.28 10.6 558.0 2.5-3.6 Clay, smooth, soft, sandy
0.41 37.78 61.81 11.7 556.9 14.7 553.9
3.6-3.8 6.5
Sand, silty; with shell fragments No sample, appeared to be a gravel layer
44.66 48.08 7.26 15.6 553.0 18.6 550.0
7.5-8.0 10.5
Sand and gravel, with shell fragments No sample, hard layer, appeared to be sand
19.4 549. 2 11.3 and gravel
No sample, refusal in compact gravel layer
28.09 67.09 4.82 6.4 562. 2 11.5 557.1
0.0-0.5 5.1
Sand, medium- to coarse-grained; with grNo sample, appeared to be coarse sand a
avel nd
11.9 556. 7 5.5 gravel
No sample, refusal in compact gravel layer
44.52 54.41 1.07 6.1 562.5 7.6 561.0
0.0-0.5 1.5
Sand, brown; with pebbles and cobbles No sample, refusal at bedrock
63.10
46.46
17 .78
92.10
25.12
43.36
80.85
7.13
11.78
10.18
1.37
0.77
4.3 564. 3
4.8 563. 8 5.3 563.3
6.6 562.0
9.4 559.2
3.7 564.9 5.2 563.4
0.0-0.5
0.5-1.0 1.0
0.0-0.5
2.8
0.0-0.5 1.5
Sand and gravel, mixed with mud
Sand, with silt and gravel No sample, refusal at bedrock
Sand, medium- to coarse-grained; silty at surface
No sample, refusal at bedrock
Gravel, pea-sized pebbles with sand and No sample, refusal at bedrock
62.62 32.30 5.08 6.5 562.1 0.0-0.5 Gravel, mixed with sand and mud
silt
14.41 85.14 0.45 12.0 556.6 5.5-5.7 Sand and gravel, medium- to coarse-grained;
12.2 556.4 5.7 with shell fragments
No sample, refusal in compact gravel layer
0.00
37.43
28.19
58.78
71.81
3.79
8.2 560, 4
11.0557.6 14.0 554. 6
0.0-0.5
2.8-5.3 5.8
Mud and sand, gray-brown, smooth
Sand, coarse-grained; with gravel and silt No sample, refusal in compact gravel layer
Boring no. SampleWater depth numberDate
MR-13 MR-13-1 17.7 ft
MR-13-2
MR-13-3
MR-14 MR-14-1 7 .6 ft 11-14-67
MR-14-2
MR-14-3
MR-15-1MR-15 8.1 ft 11-15-67 MR-15-2
MR-15-3
MR-15-4
MR-16 MR-16-1 6.4 ft 11-15-67
MR-17 MR-17-1 6.1 ft 11-15-67
MR-18 MR-18-1 4.3 ft 11-15-67 MR-18-2
MR-19 MR-19-1 6.6 ft 11-15-67
MR-20 MR-20-1 3. 7 ft 11-15-67
MR-21 MR-21-1 6.5 ft 11-15-67 MR-21-2
MR-22 MR-22-1 8.2 ft 11-15-67 MR-22-2

16 SAND AND GRAVEL OF MAUMEE RIVER ESTUARY
TABLE D.-Logs of Maumee River test borings-Continued
Boring no. Water depth Date number
MR-23 8.4 ft 11-16-67
i
.\fR-23-1
MR-23-2
MR-23-3
MR-23-4
MR-23-5
MR-23-6
MR-24 8. 7 ft 11-16-67
MR-24-1
MR-24-2
MR-25 5 .6 ft 11-16-67
MR-25·1
MR-25-2
MR-25-3
MR-25-4
MR-26 10.8 ft 11-16-67
MR-26-1
MR-26-2
MR-26-3
MR-27 9.9 ft 11-16-67
MR-27-1! i
MR-27-2
MR-27-3
MR-28 10.5 ft 11-16-67
MR-28-1
MR-28-2
MR-28-3
Particle size (percent) Depth and Bottom
Gravel Sand Silt and clay elevation penetration {ft) (ft)
9.52 86.64 3.84 8.4 560.2 0.0-0.5
39.22 54.41 6.3 7 11.5 557.1 3.1-3.5
0.52 92.46 7.02 11.9556.7 3.5-3.9
33.40 61.22 5.38 12.3 556.3 3.9-4.2
0.00 46.41 53.59 12.6 556.0 4.2-4.5 14.5 554.1 6.1-8.3
1.02 96:05 2.93 16.7 551.9 8.3-8.5 17.5551.1 9.1
18.5 550.1 10.l ...
74.50 23.19 2.31 8.7 559.9 0.0-0.5
37.11 58. 72 4.17 11.5557.1 2.8-3.l
15.5 553.1 6.8
16.5 552 1 7.8
55.64 37.24 7 .12 5.6 563.0 0.0-0.5
27.45 70.45 2.10 ll.5557.1 5.9-6.2
0.54 36.47 62.99 11.8 556.8 6.2-6.7 i
19. 78 76.60 3.62 16.5 552.1 10.9-11.2 19.5 549.1 13.9
20.2 548.4 14.6
9.21 86.66 4.13 10.8 557. 8 0.0-0.5
12.79 81.30 5 .91 16.8 551.8 6.0-6.7
I t 19. 7 548. 9 8.9-9.9
68.41 29.37 2.22 I 21.8 546.8 11.0-11.5 i
23.7 544.9 12.9
81.50 11.45 7.05 9.9558.7 0.0-0.5
18.76 78.29 2.95 16.9551.7 7.0-9.0
II 100.00 21.9 546.71 12.0-12.5
23.7 544.9 13.8
26.5 542. J 16.6
0.72 85.36 13.92 l0.5558.1 o.o-o.s
3.88 93.01 3.11 16.8 551.8 6.3-8.3
51.74 46.47 1.79 I 21.8 546.8 11.3-11.5 22.3 546.8 11.8
I
Field description
Sand and gravel, medium-grained; silty at surface
Silt, gray-brown; mixed with sand and gravel
Sand, yellow-brown, fine-grained
Sand, gray-brown, very fine-grained; mixed with silt and gravel
Clay, yellow-brown, compact, sandy No sample, appeared to be compact gravel
layer
Sand, brown, medium- to coarse-grained No sample, appeared to be compact gravel
layer No sample, refusal in compact gravel layer
Sand and gravel; brown sand, cobbles; silty
Sand, with fine-grained gravel and compact clay
No sample, appeared to be compact gravel layer
No sample, refusal in compact gravel layer
Sand and gravel, 0.2 ft of brown mud at sur-face over silty sand to cobbles
Sand and gravel, coarse-grained sand and fine-grained pebbles, with shells
Sand, fine-grained; with gray-brown clay
Sand, medium- to coarse-grained; with shells No sample, appeared to be compact gravel
layer No sample, refusal in compact gravel layer
Sand, medium-grained; silty at surface; shells
Sand, medium- to fine-grained, silty; clay at base
No sample, appeared to be gravel layer
Sand, with abundant snail shells and pea-sized pebbles
No sample, refusal in gravel laver
Sand and gravel, silty; cobbles, shells
Sand, medium- to fine-grained; shells, pebbles; two thin (O.l ft) clay layers
Sand, medium- to fine-grained; shell fragments No sample, appeared to be compact sand and
gravel layer No sample, refusal in gravel layer -Mud, gray-brown; mixed with fine-grained sand
and plant detritus
Sand, medium-grained; shells; thin (0.2 ft) clay layer at 7.O ft penetration
Sand, with pebbles and shells No sample, refusal in compact gravel layer

17 APPENDIX
TABLE D.-Logs of Maumee River test borings-Continued
Boring no. Particle size (percent)SampleWater depth number GravelDate
MR-29-1 0.00MR-29 13.8 ft 11-16-67
MR-29-2 0.66
MR-29-3 7.10
MR-29-4 7.13
MR-30-1MR-30 13 .8 ft 11-16-67 MR-30-2 30.93
MR-30-3 33.04
Sand
7.77
9.73
34.16
38.64
12.86
53.31
65.30
Silt and clay
92.23 (silt only)
89.61 (silt only)
58.74 (silt only)
54.23 (silt only)
87.14
15.76
1.66
Depth and elevation
(ft)
13.8554.8
16.8 551.8
21.8 546.8
24.8 543.8
26.8 541.8
27.8 540.8
13.8 554.8
16.8 551.8
21.8 546.8
24.3 543.3
Bottom penetration
(ft)
0.0-0.5
3.0-4.5
8.0-8.3
11.0
13.0-13.7
14.0
0.0-0.5
3.0-4.0
8.0-8.3
10.5
Field description
Mud, gray-brown, sandy
Clay, gray-brown, smooth
Clay, medium-gray, compact; with fine-grained sand
No sample, hard layer, appeared to be top of till
Glacial till, reddish-gray, compact, gritty; till clay
No sample, refusal in hard till clay
Mud, gray-brown, smooth, sandy
Sand and gravel, silty
Sand and gravel, medium-grained sand to fine-grained pebbles; shells
No sample, refusal in compact gravel layer
TABLE E.-Sieve analyses of Maumee River test boring samples
Sample number
MR-1-2 MR-1-4
MR-2-1 MR-2-2 MR-2-3 MR-2-4 MR-2-5
MR-5-1 MR-5-2 MR-5-3 MR-5-4 MR-5-5 MR-5-6
MR-6-1 MR-6-2
MR-7-1 MR-7-2
MR-8-1 MR-8-2
MR-9-1
MR-10-1
%in
100.00 100.00
100.00 100.00 100.00 100.00 100.00
100.00 100.00 100.00 100.00 100.00 100.00
100.00 100.00
100.00 100.00
100.00 100.00
100.00
100.00
4
100.00 34.35
91.05 100.00 100.00 100.00 90.37
100.00 97.25 99.12 81.58 98.91
100.00
99.25 75.44
66.02 100.00
94.30 82.10
98.43
99.79
U.S. sieve series (percent passing)
8 16 30 50
100.00 91.75 54.74 8.20 8.68 1.68 0.68 0.42
84.61 73.66 50.57 24.14 98.46 97.88 94.39 54.93
100.00 99.94 98.17 62.91 97.77 94.26 83.17 48.04 85.18 75.73 63.31 36.41
99.91 99.26 95.77 65.34 92.60 87.36 79.37 33.83 98.30 97.41 92.13 39.24 59.83 35.39 10.58 0.94 90.77 79.27 52.39 18.22 94.79 52.91 19.27 2.48
97.89 95.85 92.48 42.59 75.44 36.64 21.57 8.68
46.57 34.47 20.48 7.46 98.18 84.40 50.37 21.67
88.95 83.29 72.30 28.31 66.60 53.51 36.37 6.63
95.81 87.27 56.85 5.63
97.60 90.89 66.91 8.01
100
0.31 0.20
17.98 9.77
14.68 6.16 3.49
20.24 9.41 3.31 0.22 7.39 1.81
4.41 2.82
2.00 11.60
5.11 1.82
1.04
1.04
ef>m 200
0.00 0.8 0.08 -2.9
2.94 0.8 0.79 1.8 1.19 2.1 0.78 1.6 0.39 1.3
6.72 1.9 5.48 1.3 1.03 1.5 0.16 -0.8 4.00 0.8 1.40 -0.3
1.28 1.5 0.62 -1.2
0.99 -1.4 4.25 0.7
1.25
I
1.5 0.77 -0.2
0.38 0.9
0.64 1.1
So
1.8 1.3
2.2 1.3 1.3 1.6 2.5
1.5 1.5 1.4 2.1 1.8 1.6
1.5 2.6
3.3 1. 7
1.6 2.7
1.3
1.4
Water depth
(ft)
4.5 4.5
5.0 5.0 5.0 5.0 5.0
8.0 8.0 8.0 8.0 8.0 8.0
8.0 8.0
7.0 7.0
9.5 9.5
5.0
8.0
Bottom penetration
(ft)
3.0-3.4 18.0-18.3
0.0-0.5 3.0-3.8 8.0-8.7
13.0-13.5 18.0-18.4
0.0-0.5 5.0-5.3 7.5-8.0 8.0-8.5
12 .0-12.4 13.5-13.7
0.0-0.5 2.5-3.3
0.0-0.5 3.5·4.2
0.0-0.5 0.5-2.0
0.0-0.5
0.0-0.5

18 SAND AND GRAVEL OF MAUMEE RIVER ESTUARY
TABLE E.-S1eve analyses of Maumee River test boring samples-Continued
Sample number ,..
8 In
U.S. sieve series (percent passing) ----- -· 4 8 16 30 50 100 200
¢m So Water depth
(ft)
Bottom penetration
(ft)
MR-12-1 MR-12-2 MR-12-3
100.00 100.00 100.00
98.66 79.05 56.97
94.67 61. 76 29.81
82.50 46.41 20.13
47.85 29. 71 12.80
7.23 13.09
5.86
0.82 3.32 3.58
0.50 0.94 2.34
0.7 -0.7 -2.2
1.6 3.1 --
11. 7 11. 7 11.7
0.0-0.5 4.5-5.o 7.0-8.0
MR-13-1 MR-13-2 MR-13-3
100.00 100.00 100.00
4 7.24 90.48 74.6 7
33.97 81.32 5 7.41
27 .50 72.25 44.80
20.39 58.83 32.47
10.60 29.61 10.16
2.55 4.66 1.25
0.58 1.06 0.34
-2. 7 0.8
-0.8
--2.5 2.6
17. 7 17. 7 17.7
0.0-0.5 1.0-1. 7 6.0-6.4
MR-14-1 100.00 91.65 73.95 57 .00 38.02 9.93 1. 79 0.20 0.2 2.5 7.6 0.0-0.5
MR-15-1 MR-15-4
100.00 100.00
98.27 73.45
97.09 61.18
96.33 49.28
95.62 33. 71
49.63 14.04
1.56 3.45
0.12 0.49
1. 7 -0.3
1.2 3.3
8.1 8.1
0.0-0.5 7.5-8.0
MR-16-1 100.00 92.46 76.12 61.21 36.18 11.41 2.86 0.41 0.2 2.1 6.4 0.0-0.5
MR-17-1 100.00 73.86 59.98 53.27 46.32 26.14 5.96 0.75 0.2 4.1 6.1 0.0-0.5
MR-18-1 MR-18-2
100.00 100.00
60.50 75.41
45.22 58.06
37.06 42.32
30.43 30.39
18.95 17.09
7.50 4.96
1.51 0.62
-1.8 -1.0
4.2 3.6
4.3 4.3
0.0-0.5 0.5-1.0
MR-19-1 100.00 94.47 87. 79 80.97 65.08 17.16 3.04 0.89 1.2 1.6 6.6 0.0-0.5
MR-20-1 100.00 29.48 12. 51 8.82 6.55 3.57 1.29 0.32 -- -- 3.7 0.0-0.5
MR-21-1 MR-21-2
100.00 100 .00
64.17 92.92
53.55 68.50
50.38 28.62
47.80 4.36
32.94 0.86
6.69 0.06
1.21 --
0.4 -0.8
2.0 2.0
6.5 6.5
0.0-0.5 5.5-5.7
MR-22-2 100.00 87 .55 73. 74 60.16 42.46 25.05 4.40 0.40 1.8 1.4 8.2 2.8-5.3
MR-23-1 MR-23-2 MR-23-3 MR-23-4 MR-23-6
100.00 100.00 100.00 100.00 100.00
95.11 81.52
100.00 85.85
100.00
90.77 66.58 99.55 74.40 99.64
88.80 55.97 98.96 66.91 95.59
85.97 41.06 97 .48 54.87 75.62
74.17 19.99 91.08 34.32 33.08
31.52 5.86
21.52 9.21 7 .13
2.22 0.54 2.09 1.09 0.63
2.3 1.8 2.6 1.1 1.5
1.5 1.2 1.1 3.1 1.5
8.4 8.4 8.4 8.4 8.4
0.0-0.5 3.1-3.5 3.5-3.9 3.9-4.2 8.3-8.5
MR-24-1 MR-24-2
100.00 100.00
64.08 87.03
4 7.17 68.91
38.50 51.94
29.29 35.95
11.19 17 .10
3.05 4.03
0.39 0.29
-1.7 0.3
3.5 2.7
8.7 8.7
0.0-0.5 2.8-3.l
MR-25-1 MR-2~-2 MR-25-4
100.00 100.00 100.00
86.20 93.07 92.64
69.03 79.55 83.79
56.70 60.91 76.75
47.67 42.80 68.12
26.94 18.92 44.24
4.70 4.26 9.02
2.27 0.51 1.23
1.5 0.3 2.5
4.0 2.4 2.2
5.6 5.6 5.6
0.0-0.5 5.9-6.2
10.9-11.2
MR-26-1 MR-26-2 MR-26-3
100.00 100.00 100.00
95.07 94.40 71.81
91.60 91.00 41.23
87.32 88.24 33.14
74.79 80.63 27.12
21.49 33.51 18. 73
1.25 3.40 3.93
0.11 0.43 0.42
1.5 1.4
-1.9
2.8 1.4 3.3
10.8 10.8 10.8
0.0-0.5 6.0-6.7
11.0-11.5
MR-27-1 MR-2 7-2
100.00 100.00
53.29 92.68
31.68 82.79
25.69 74.02
21.59 55.04
14.84 22.70
5.98 4.18
1.13 0.71
-2.4 0.9
---2.1
9.9 9,9
0.0-0.5 7.0-9.0
MR-28-1 MR-28-2 MR-28-3
100 .00 100.00 100.00
100.00 98.95 79.34
99.59 97 .28 58.91
98.80 92.76 45.63
96.70 80.46 31.94
89.51 41.14 11.32
76.97 7.15 2.35
18.15 0.83 0.34
3.3 1.6
-0.8
1.3 1.6 1. 7
10.5 10.5 10.5
0.0-0.5 6.3-8.3
11.3-11.5
MR-30-2 MR-30-3
100.00 100.00
86.31 96.43
76.02 75.26
66.58 54.90
50.75 34.76
13.54 9.67
3.43 1.98
0.56 0.26
0.7 0.0
2.5 2.2
13.8 13.8
3.0-4.0 8.0-8.3
APPENDIX 19
TABLE F .-State of Ohio Department of Highways aggregate specifications 1
Section 703.02: Aggregate for Portland Cement Concrete
1. Genera I. The fine aggregate shall be natural or manufactured sand composed of clean, hard, durable, uncoated particles of stone, well graded from coarse to fine, with the coarse particles predominating, free from lumps of clay and all organic matter.
2. Grading (U.S. Standard Sieve Series). The sand shall be well graded from coarse to fine and when tested by means of laboratory sieves shall conform co the following grading:
Sieve No.
¾" No. 4 No. 8 No. 16 No. 30 No. 50 No. 100 No. 200
Total Percent Passing Natural Manufactured
100 95-100 70-95 45-80 25-60 10-30 1-10 0-4
100 90-100 50-75 30-60 14-30 4-12 0-5
Section 703,03: Fine Aggregate for Mortar and Grout
1. General. The fine aggregate shall be either a natural or manufactured sand and shall be composed of clean, hard, durable, uncoated particles of scone, and free from lumps of clay and all organic matter,
2. Grading (U.S. Standard Sieve S erie s). The sand shall be well graded from coarse to fine and when tested by means of laboratory sieves shall conform co the following grading:
1Sieve analysis from 1969 edition of "Construction and Materials Specifications."
Sieve No.
No. 4 No. 8 No. 16 No. 100 No. 200
Total Percent Passing Natural or Manufactured
100 95-100 85-100
0-10 0-4
Section 703.05: Aggregate for Asphalt Concrete, Bituminous Cold and Road Mix, and Tack, Prime and Seal Coat
1. General. The fine aggregate shall be natural sand or sand manufactured from scone, gravel or air-cooled slag.
2. Grading (U.S. Standard Sieve Series). The sand shall be well graded from coarse co fine and when cesred by means of laboratory sieves shall conform to the following grading:
Sieve No.
3/g,,
No. 4 No. 8 No. 16 No. 30 No. 50 No. 100 No. 200
Total Percent Passing Natural and Manufactured
100 90-100 65-100 40-85 20-60
7-40 0-20 0-10
Section 703,06: Sand Cover
l. General. The sand shall be natural sand or sand manufactured from scone or air-cooled slag.
2. Grading. The sand shall have the same grading as Section 703.05.

