san joaquin river bedload sampling summary january 4 and 5, 2011 april 1 and 2, 2011 ledger island
TRANSCRIPT
San Joaquin River Bedload Sampling summary
January 4 and 5, 2011April 1 and 2, 2011
Ledger Island
Purpose of Bedload Sampling at Ledger Island
• Contribute to understanding mobility thresholds of different grain sizes (sandgravel)
• Estimate sand transport rates in Reach 1A to evaluate fine sediment budget, will inform future fine sediment management for spawning and rearing habitat
• Estimate coarse sediment transport rates in Reach 1A to inform future spawning gravel augmentation needs
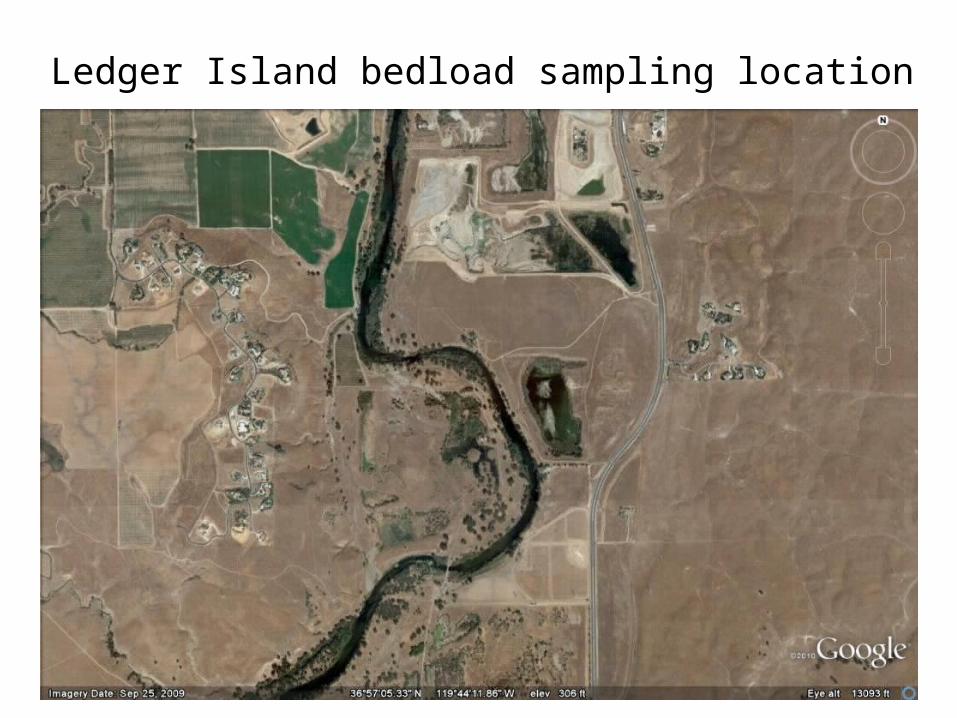
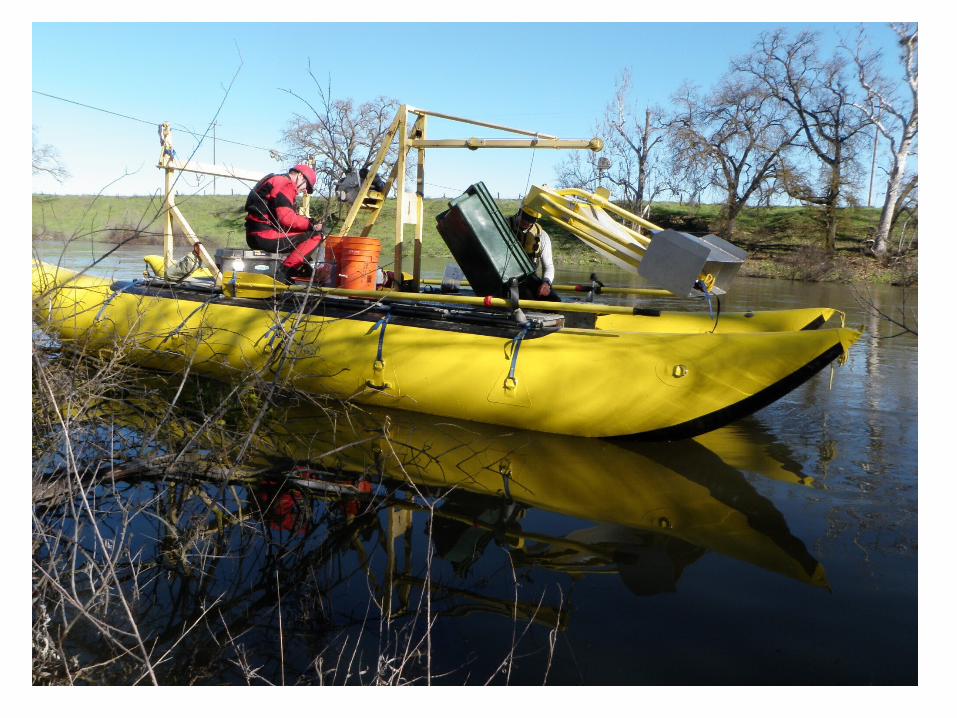
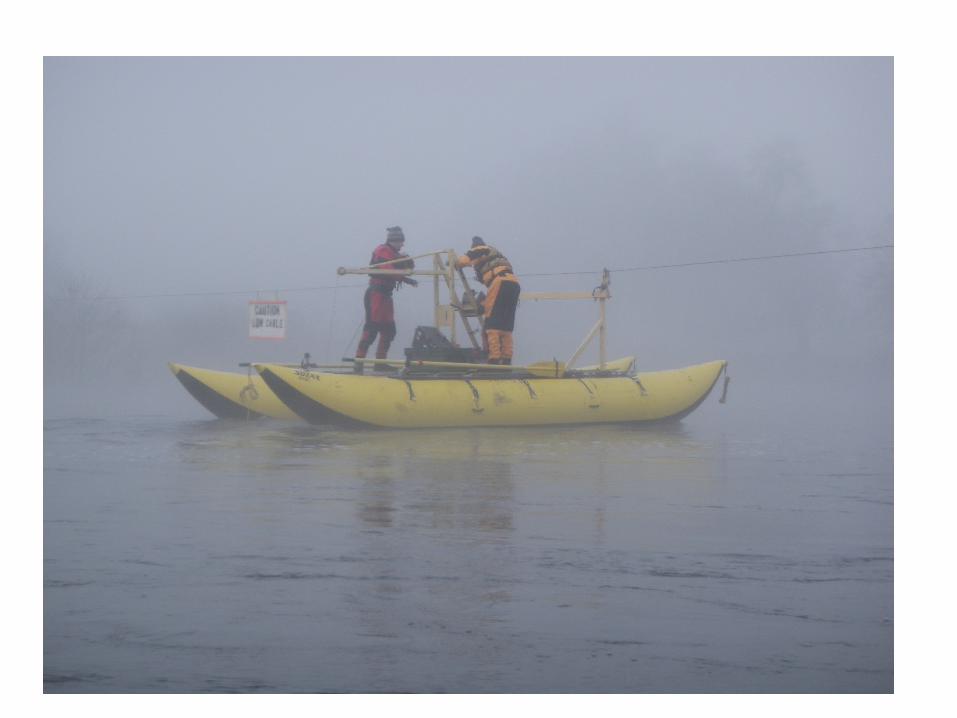
Ledger Island bedload sampling location
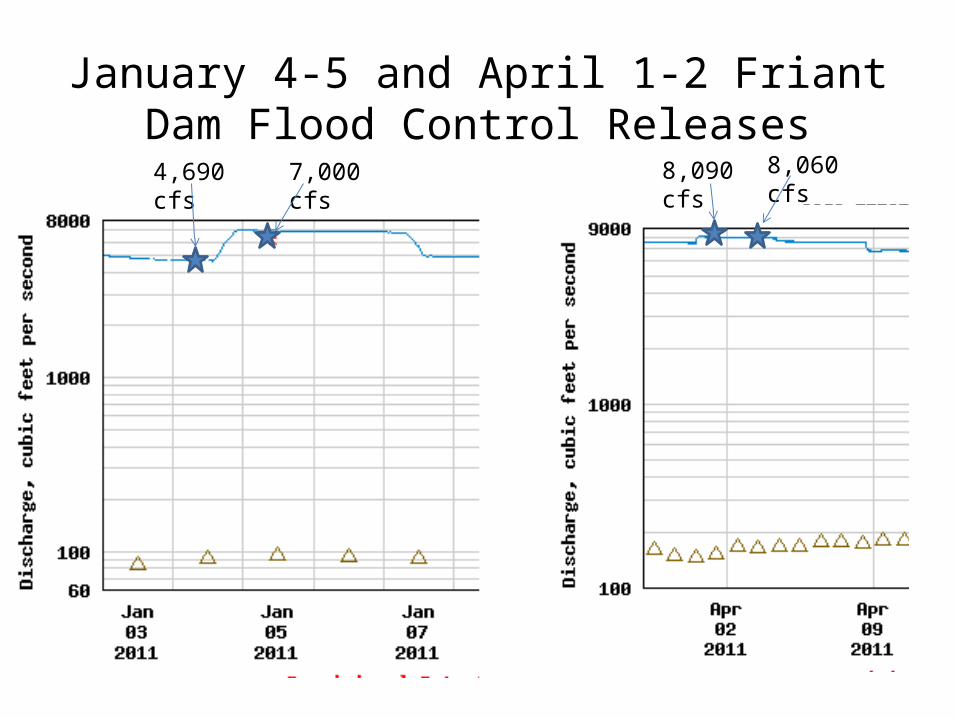
January 4-5 and April 1-2 Friant Dam Flood Control Releases
4,690 cfs 7,000 cfs 8,090 cfs 8,060 cfs
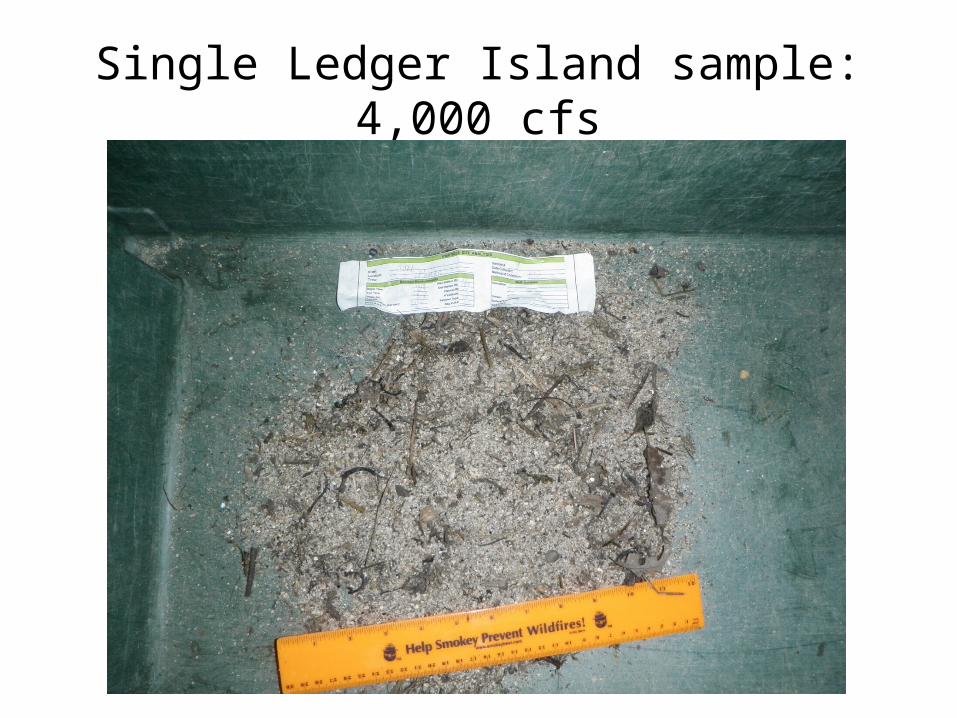
Single Ledger Island sample: 4,000 cfs
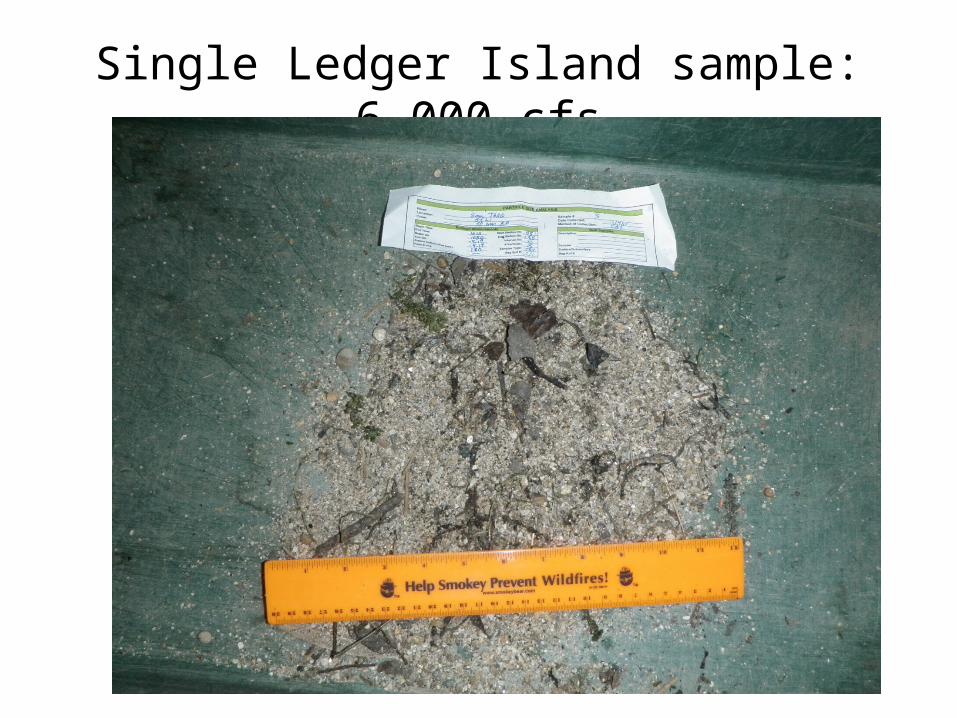
Single Ledger Island sample: 6,000 cfs
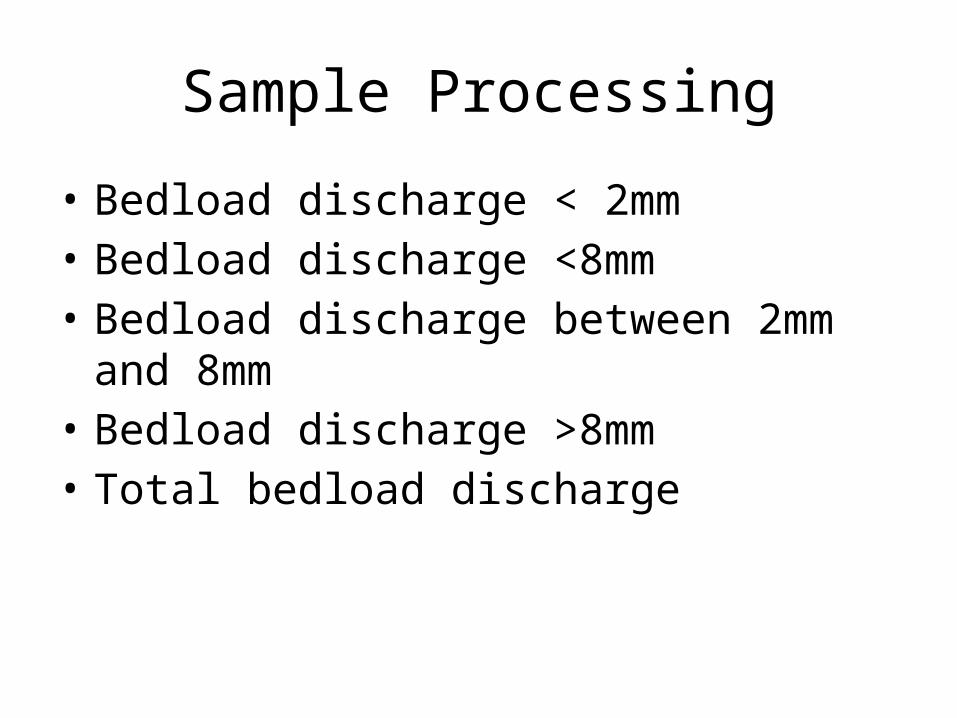
Sample Processing
• Bedload discharge < 2mm• Bedload discharge <8mm• Bedload discharge between 2mm and 8mm• Bedload discharge >8mm• Total bedload discharge
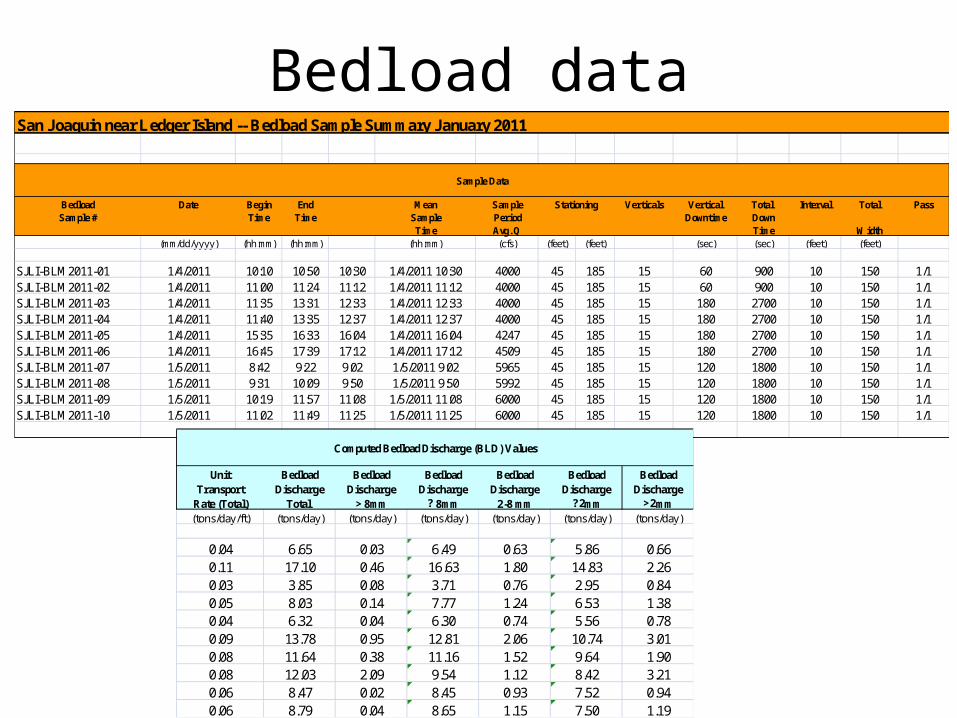
Bedload data
Bedload Date Begin End Mean Sample Verticals Vertical Total Interval Total PassSample # Time Time Sample Period Downtime Down
Time Avg. Q Time Width(mm/dd/yyyy) (hh:mm) (hh:mm) (hh:mm) (cfs) (feet) (feet) (sec) (sec) (feet) (feet)
SJLI-BLM2011-01 1/4/2011 10:10 10:50 10:30 1/4/2011 10:30 4000 45 185 15 60 900 10 150 1/1SJLI-BLM2011-02 1/4/2011 11:00 11:24 11:12 1/4/2011 11:12 4000 45 185 15 60 900 10 150 1/1SJLI-BLM2011-03 1/4/2011 11:35 13:31 12:33 1/4/2011 12:33 4000 45 185 15 180 2700 10 150 1/1SJLI-BLM2011-04 1/4/2011 11:40 13:35 12:37 1/4/2011 12:37 4000 45 185 15 180 2700 10 150 1/1SJLI-BLM2011-05 1/4/2011 15:35 16:33 16:04 1/4/2011 16:04 4247 45 185 15 180 2700 10 150 1/1SJLI-BLM2011-06 1/4/2011 16:45 17:39 17:12 1/4/2011 17:12 4509 45 185 15 180 2700 10 150 1/1SJLI-BLM2011-07 1/5/2011 8:42 9:22 9:02 1/5/2011 9:02 5965 45 185 15 120 1800 10 150 1/1SJLI-BLM2011-08 1/5/2011 9:31 10:09 9:50 1/5/2011 9:50 5992 45 185 15 120 1800 10 150 1/1SJLI-BLM2011-09 1/5/2011 10:19 11:57 11:08 1/5/2011 11:08 6000 45 185 15 120 1800 10 150 1/1SJLI-BLM2011-10 1/5/2011 11:02 11:49 11:25 1/5/2011 11:25 6000 45 185 15 120 1800 10 150 1/1
Stationing
San Joaquin near Ledger Island -- Bedload Sample Summary January 2011
Sample Data
Unit Bedload Bedload Bedload Bedload Bedload BedloadTransport Discharge Discharge Discharge Discharge Discharge Discharge
Rate (Total) Total > 8mm ? 8mm 2-8 mm ?2mm >2mm(tons/day/ft) (tons/day) (tons/day) (tons/day) (tons/day) (tons/day) (tons/day)
0.04 6.65 0.03 6.49 0.63 5.86 0.660.11 17.10 0.46 16.63 1.80 14.83 2.260.03 3.85 0.08 3.71 0.76 2.95 0.840.05 8.03 0.14 7.77 1.24 6.53 1.380.04 6.32 0.04 6.30 0.74 5.56 0.780.09 13.78 0.95 12.81 2.06 10.74 3.010.08 11.64 0.38 11.16 1.52 9.64 1.900.08 12.03 2.09 9.54 1.12 8.42 3.210.06 8.47 0.02 8.45 0.93 7.52 0.940.06 8.79 0.04 8.65 1.15 7.50 1.19
Computed Bedload Discharge (BLD) Values
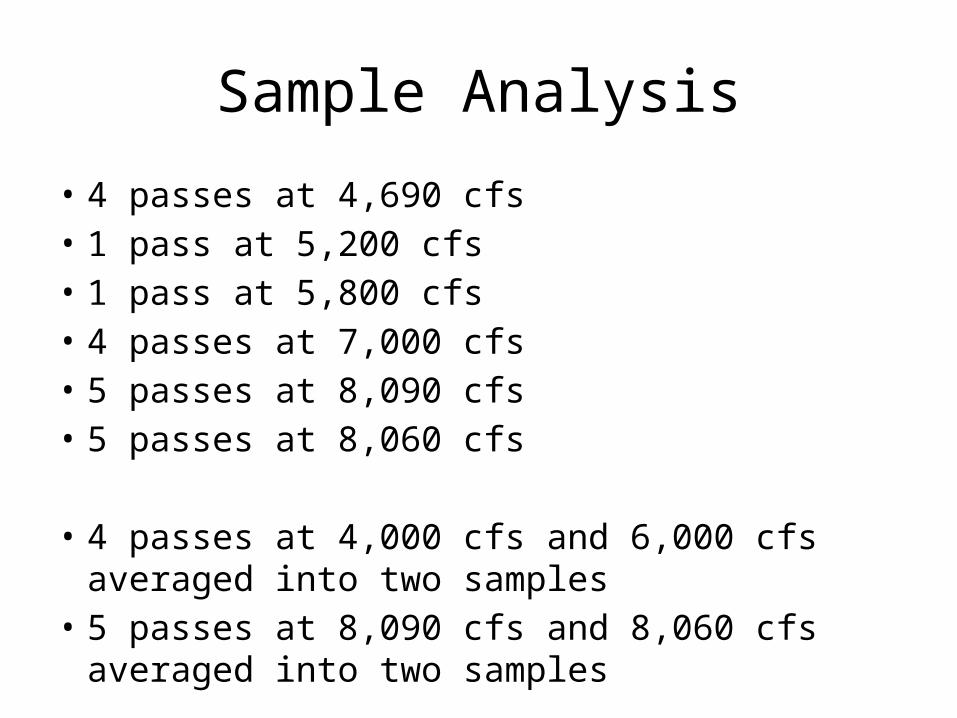
Sample Analysis
• 4 passes at 4,690 cfs• 1 pass at 5,200 cfs• 1 pass at 5,800 cfs• 4 passes at 7,000 cfs• 5 passes at 8,090 cfs• 5 passes at 8,060 cfs
• 4 passes at 4,000 cfs and 6,000 cfs averaged into two samples
• 5 passes at 8,090 cfs and 8,060 cfs averaged into two samples
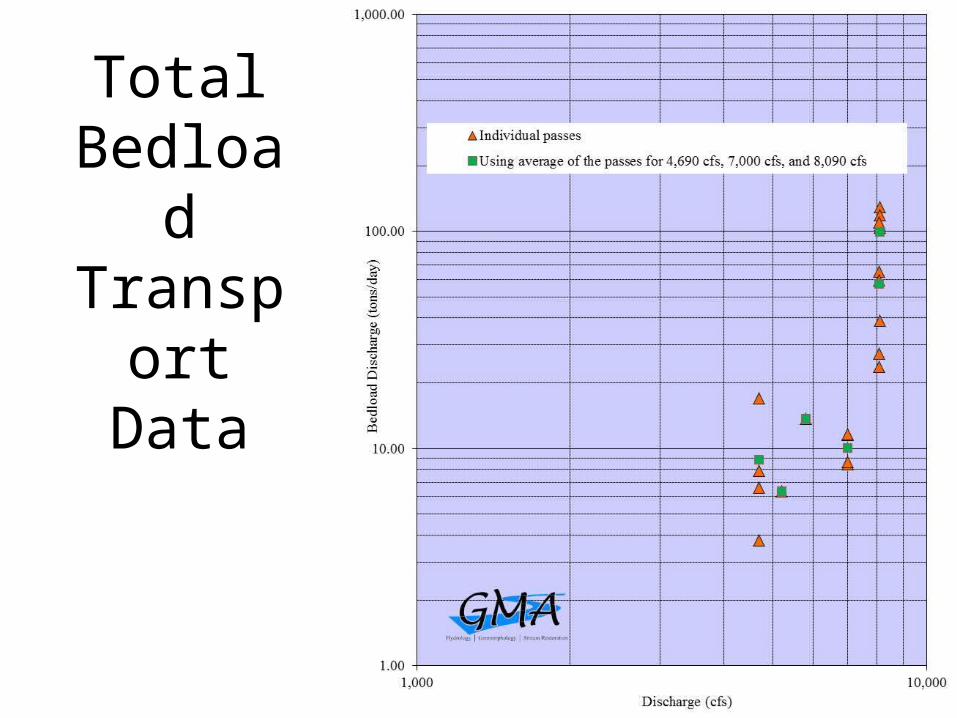
Total Bedload
Transport Data
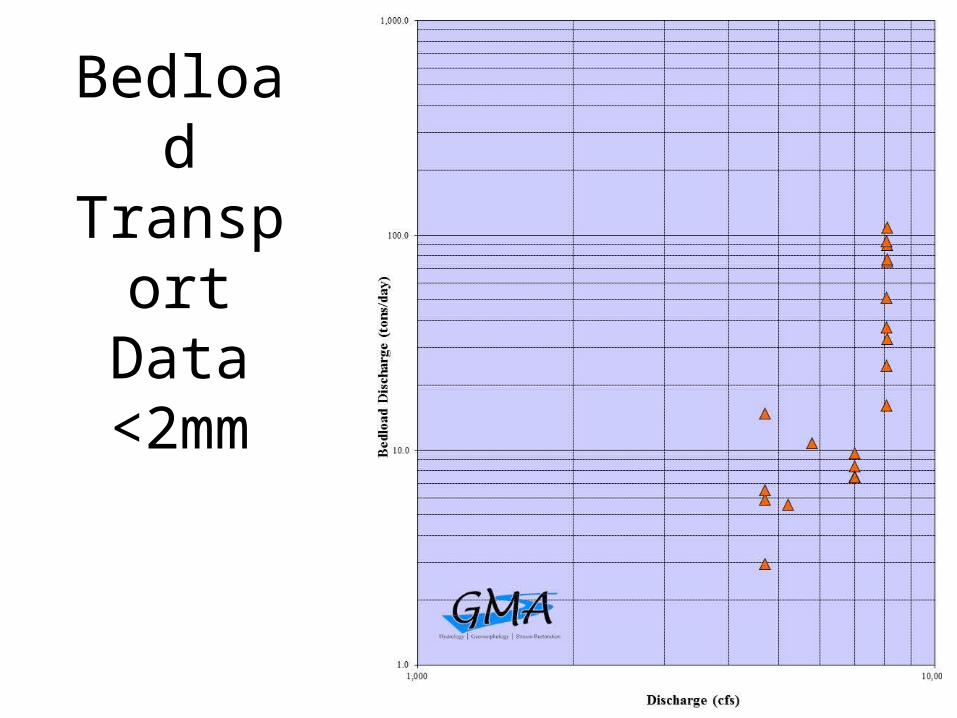
Bedload Transport
Data <2mm
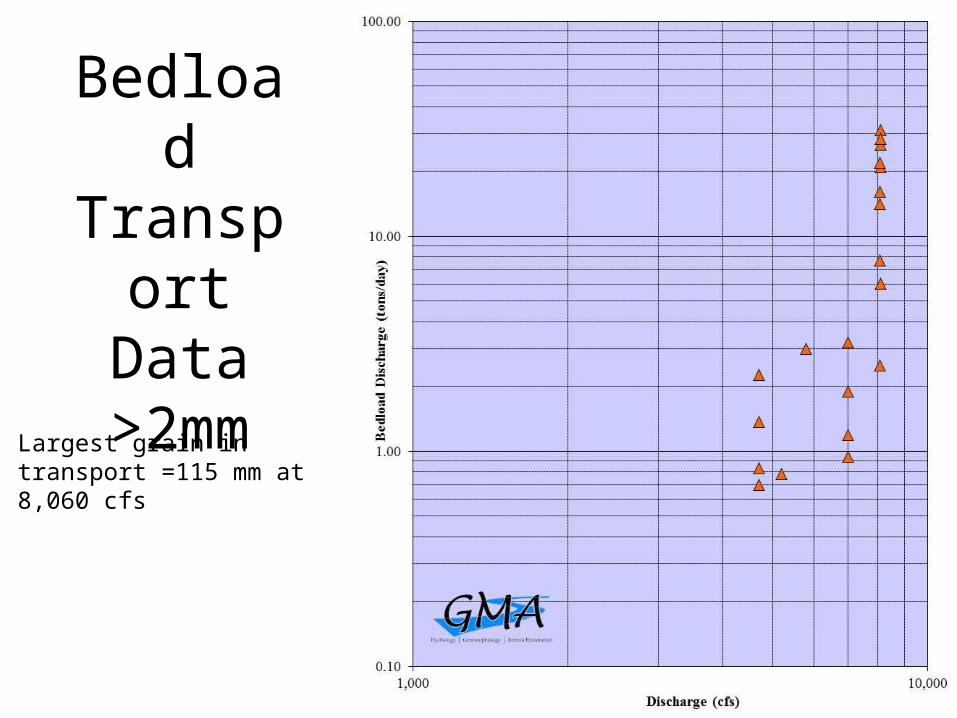
Bedload Transport
Data >2mm
Largest grain in transport =115 mm at 8,060 cfs
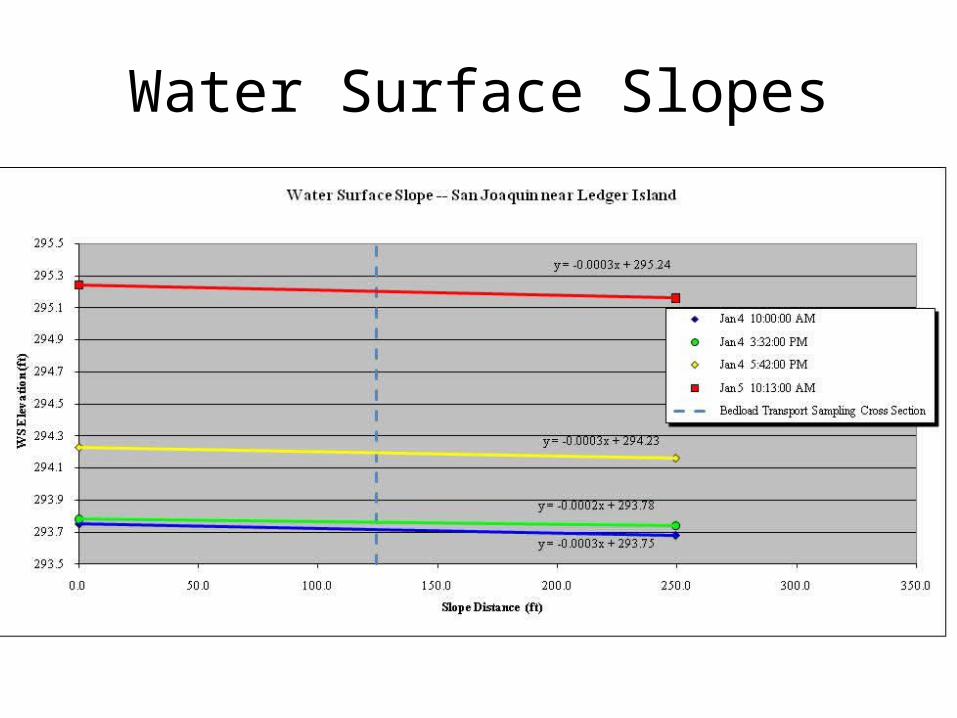
Water Surface Slopes
Next Steps
• Prepare short tech memo summarizing methods and results
• Send bedload data to SJRRP (Erin?) for distribution to Program technical staff and consultants
• Technical discussion of additional sampling needs– Sampling location– Target flows
• Considerations for RA/TAC Recommendations