samanage benchmarking: better service performance starts here
TRANSCRIPT
© 2015 MetricNet & Samanage | Confidential | All Rights Reserved
Giving benchmarking a total redesign.(And redefining service and support in the process.)
© 2015 MetricNet & Samanage | Confidential | All Rights Reserved
© 2015 MetricNet & Samanage | Confidential | All Rights Reserved
Page 2
© 2015 MetricNet & Samanage | Confidential | All Rights Reserved
Page 3
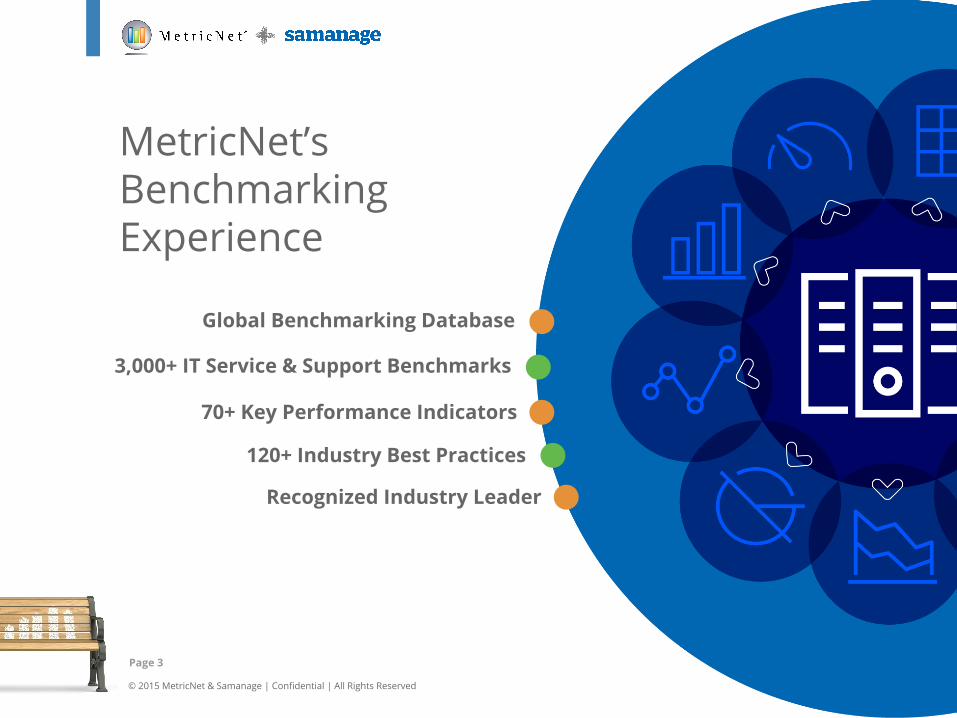
MetricNet’s Benchmarking Experience
Global Benchmarking Database
3,000+ IT Service & Support Benchmarks
70+ Key Performance Indicators
120+ Industry Best Practices
Recognized Industry Leader
© 2015 MetricNet & Samanage | Confidential | All Rights Reserved
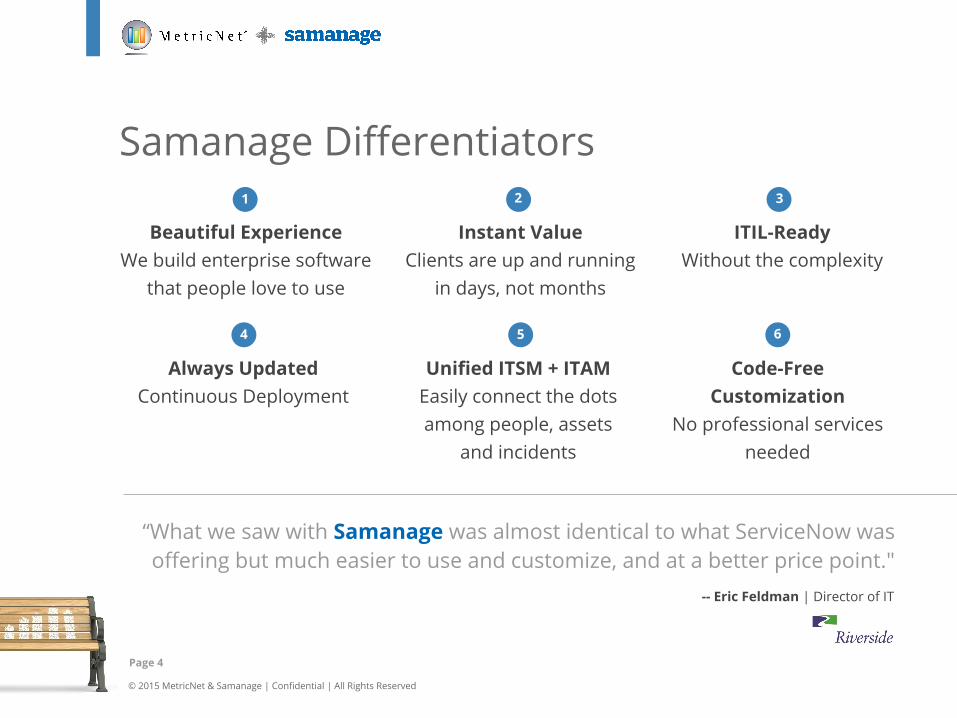
Samanage Differentiators
Page 4
Beautiful Experience We build enterprise software
that people love to use
Instant Value Clients are up and running
in days, not months
ITIL-ReadyWithout the complexity
Always UpdatedContinuous Deployment
Unified ITSM + ITAM Easily connect the dots among people, assets
and incidents
Code-Free Customization
No professional services needed
1 2 3
4 5 6
“What we saw with Samanage was almost identical to what ServiceNow was offering but much easier to use and customize, and at a better price point."
-- Eric Feldman | Director of IT
© 2015 MetricNet & Samanage | Confidential | All Rights Reserved
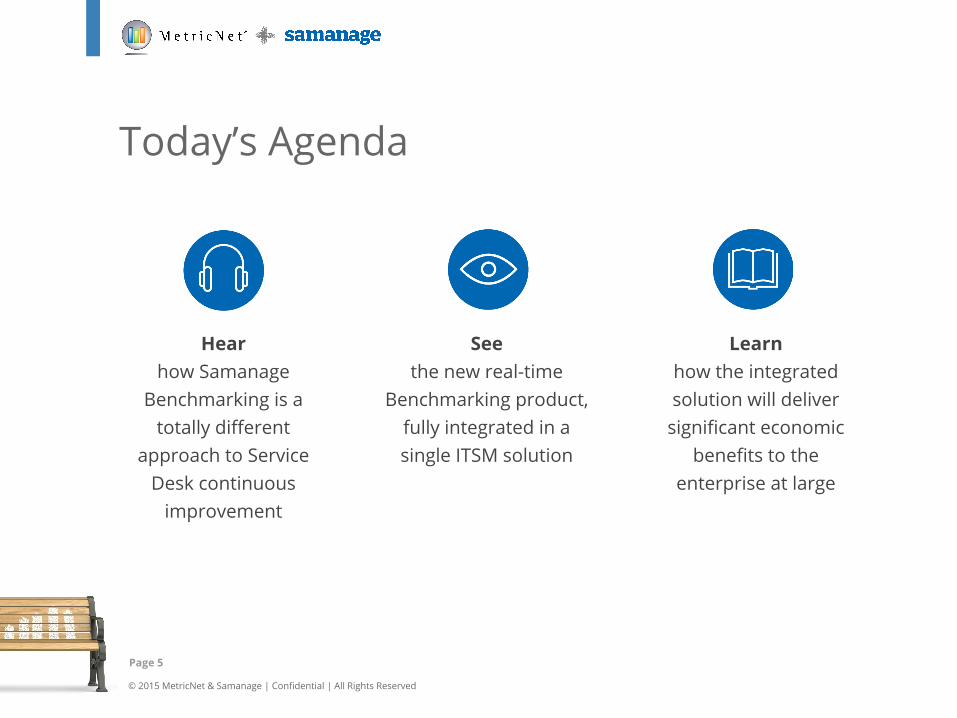
Today’s Agenda
Page 5
Learn how the integrated solution will deliver
significant economic benefits to the
enterprise at large
Hear how Samanage
Benchmarking is a totally different
approach to Service Desk continuous
improvement
See the new real-time
Benchmarking product, fully integrated in a single ITSM solution

© 2015 MetricNet & Samanage | Confidential | All Rights Reserved
Why Real-Time Benchmarking?
6
Page 6
COMPAREPerformance of Benchmarking
Peer Group
Company XYZService DeskPerformance
Determine How Best in Class Achieve
Superiority
Adopt Selected Practices of Best in Class
Build a Sustainable Advantage through
Continuous Improvement
Ultimate Objective
© 2015 MetricNet & Samanage | Confidential | All Rights Reserved
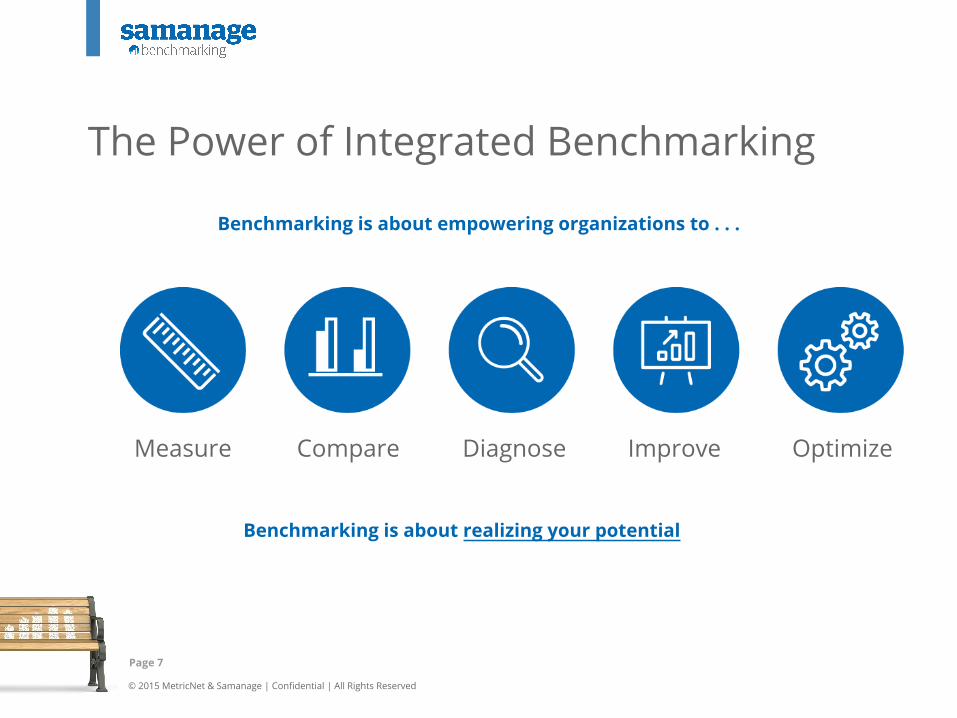
The Power of Integrated Benchmarking
Page 7
Benchmarking is about empowering organizations to . . .
Measure Compare Diagnose Improve Optimize
Benchmarking is about realizing your potential

© 2015 MetricNet & Samanage | Confidential | All Rights Reserved
Goal of BenchmarkingCu
stom
er S
atis
fact
ion
+
_
+_ Cost Per Ticket
Starting Point:Before Benchmarking
After Benchmarking
Best-in-Class Performance Curve Average Performance Curve
Page 8

© 2015 MetricNet & Samanage | Confidential | All Rights Reserved
But Most Service Organizations are Flying Blind . . .
Page 9
?What are my Costs?
?What’s my Quality? ?How am I
Performing?
?How am I Trending? ?What’s my
ROI?
?How Can I do Better?
© 2015 MetricNet & Samanage | Confidential | All Rights Reserved
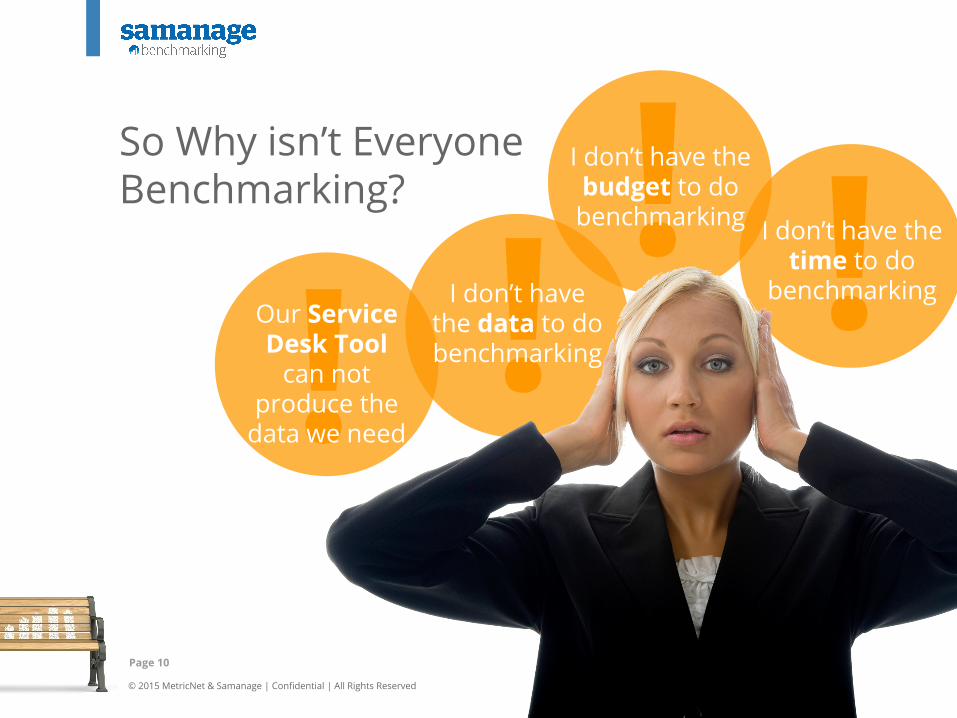
So Why isn’t Everyone Benchmarking?
Page 10
! !I don’t have the data to do benchmarking
!I don’t have the time to do
benchmarking
!I don’t have the budget to do benchmarking
Our Service Desk Tool
can not produce the
data we need

© 2015 MetricNet & Samanage | Confidential | All Rights Reserved
How Do We Overcome These Challenges?
Page 11
Automate the data
collection process
1
Integrate Benchmarking into Samanage
2
Provide tools to
measure economic value (ROI)
3
Make price a non-issue
4
Remove all barriers and
provide a viable path to
continuous improvement
5

© 2015 MetricNet & Samanage | Confidential | All Rights Reserved
Page 12
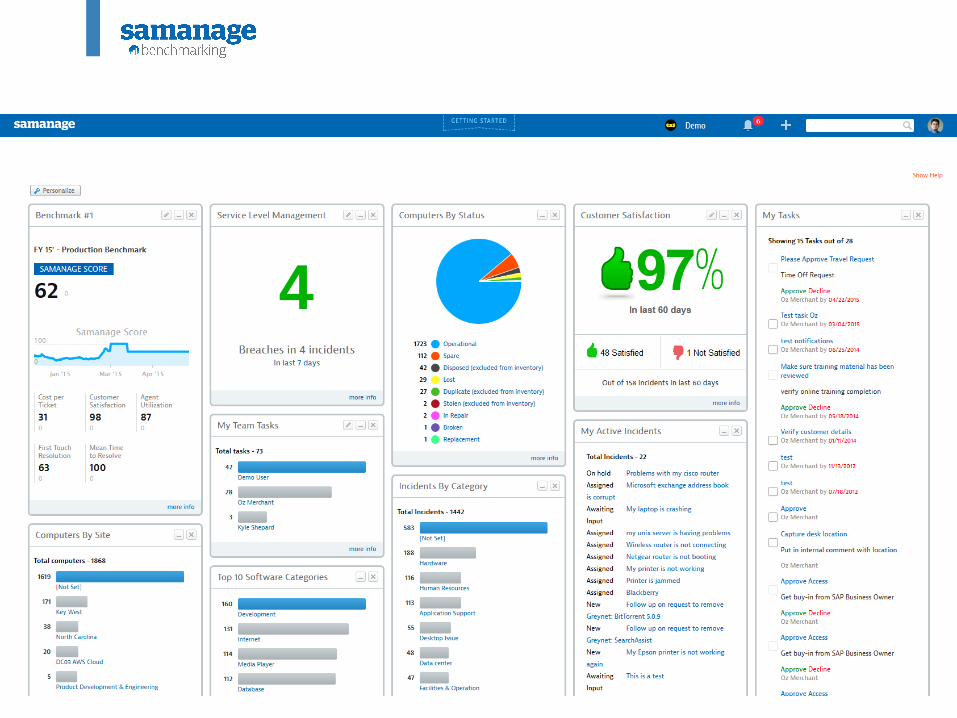
Demonstration
© 2015 MetricNet & Samanage | Confidential | All Rights Reserved
Page 13
© 2015 MetricNet & Samanage | Confidential | All Rights Reserved
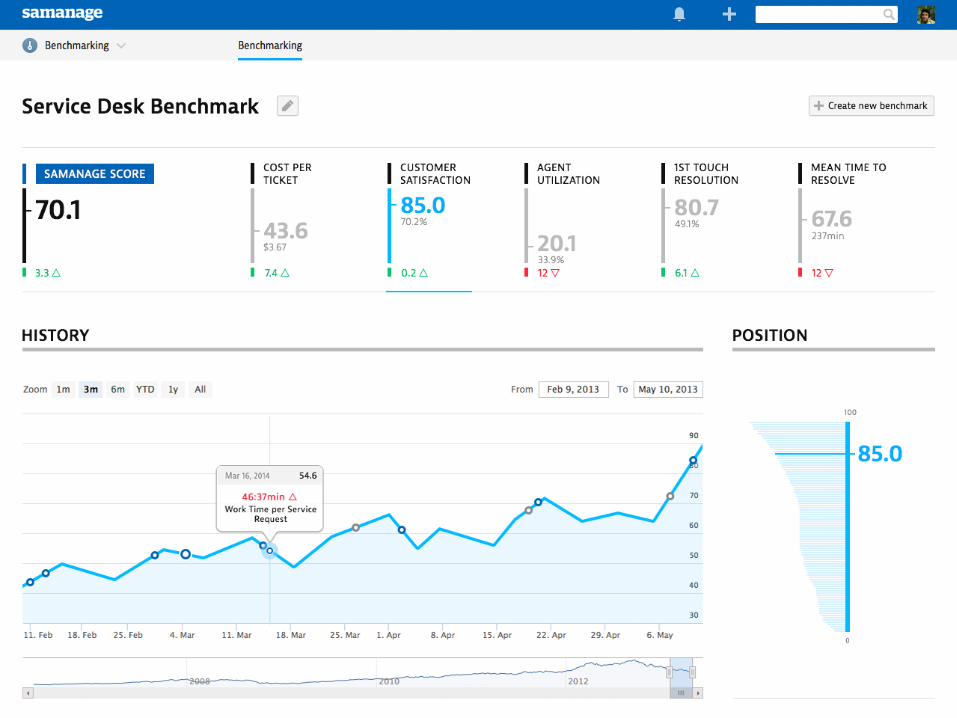
Samanage Benchmarking
Page 14
© 2015 MetricNet & Samanage | Confidential | All Rights Reserved
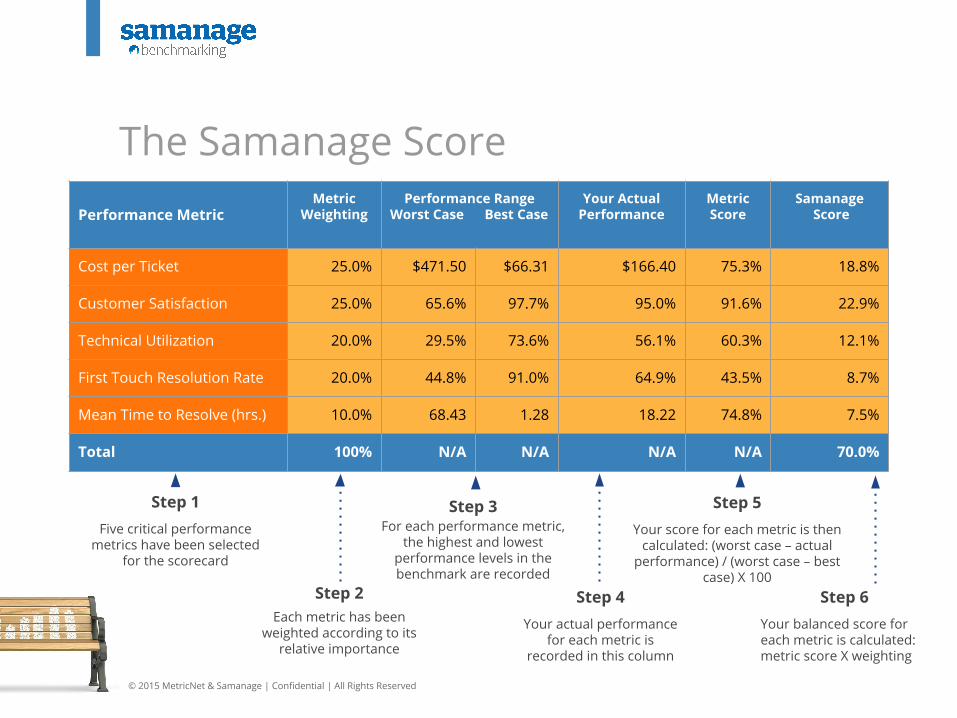
Performance MetricMetric
WeightingPerformance Range
Worst Case Best CaseYour Actual
PerformanceMetric Score
Samanage Score
Cost per Ticket 25.0% $471.50 $66.31 $166.40 75.3% 18.8%
Customer Satisfaction 25.0% 65.6% 97.7% 95.0% 91.6% 22.9%
Technical Utilization 20.0% 29.5% 73.6% 56.1% 60.3% 12.1%
First Touch Resolution Rate 20.0% 44.8% 91.0% 64.9% 43.5% 8.7%
Mean Time to Resolve (hrs.) 10.0% 68.43 1.28 18.22 74.8% 7.5%
Total 100% N/A N/A N/A N/A 70.0%
The Samanage Score
Step 2Each metric has been
weighted according to its relative importance
Step 1Five critical performance
metrics have been selected for the scorecard
Step 4Your actual performance
for each metric is recorded in this column
Step 5Your score for each metric is then
calculated: (worst case – actual performance) / (worst case – best
case) X 100
Step 3For each performance metric,
the highest and lowest performance levels in the benchmark are recorded
Step 6Your balanced score for each metric is calculated: metric score X weighting
© 2015 MetricNet & Samanage | Confidential | All Rights Reserved
Page 16
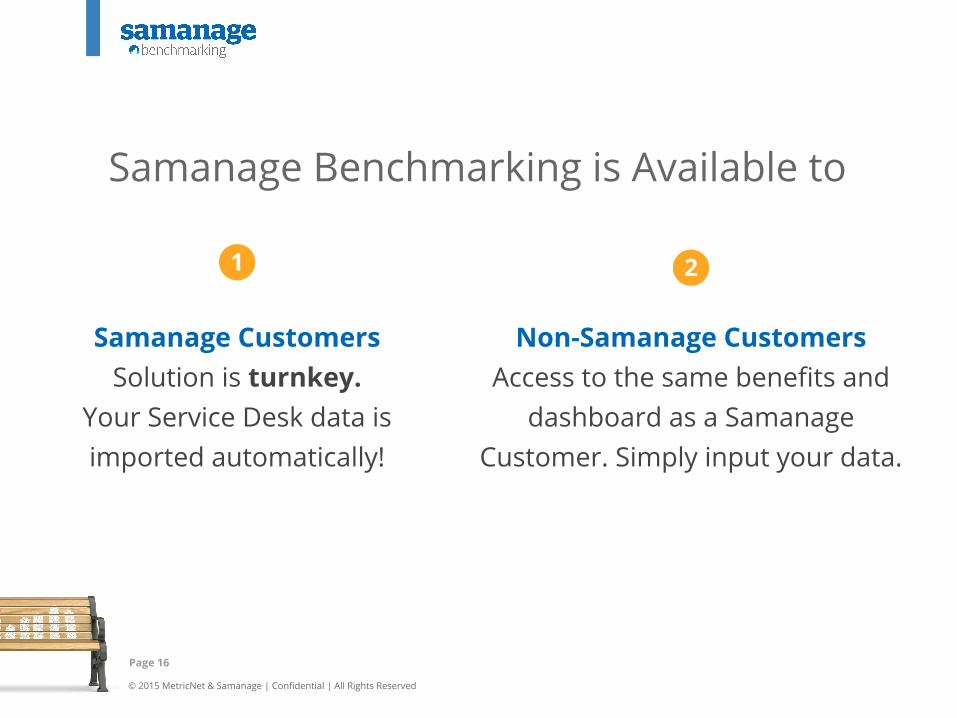
Samanage Benchmarking is Available to
Samanage CustomersSolution is turnkey.
Your Service Desk data is imported automatically!
Non-Samanage Customers Access to the same benefits and
dashboard as a Samanage Customer. Simply input your data.
1 2
© 2015 MetricNet & Samanage | Confidential | All Rights Reserved
Page 17
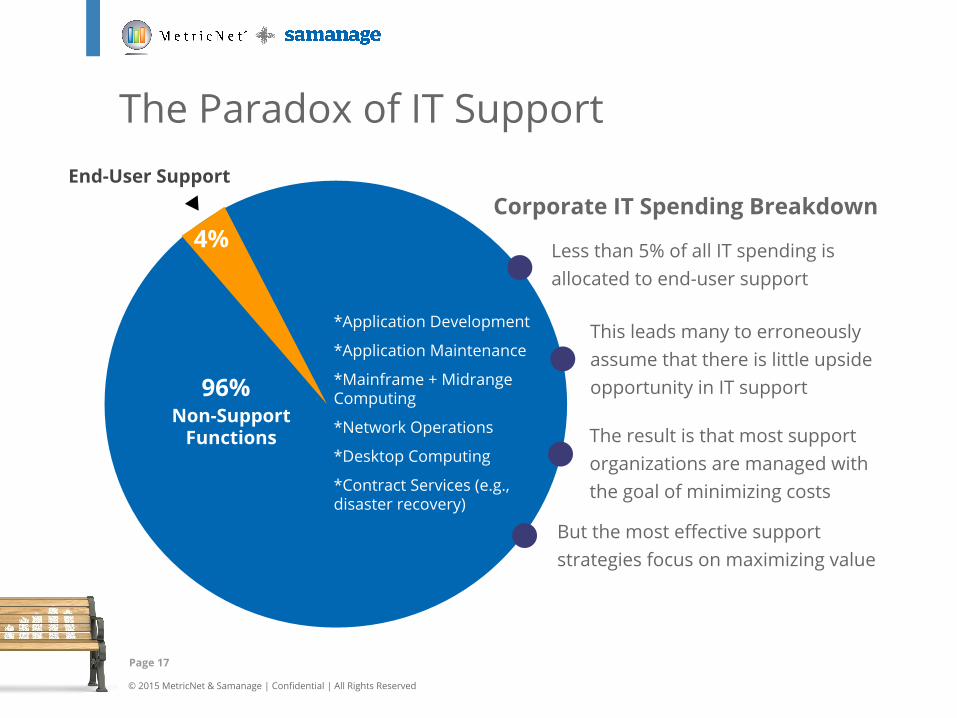
4%
End-User Support
Less than 5% of all IT spending is allocated to end-user support
But the most effective support strategies focus on maximizing value
This leads many to erroneously assume that there is little upside opportunity in IT support
The result is that most support organizations are managed with the goal of minimizing costs
96%Non-Support
Functions
*Application Development
*Application Maintenance
*Mainframe + Midrange Computing
*Network Operations
*Desktop Computing
*Contract Services (e.g., disaster recovery)
Corporate IT Spending Breakdown
The Paradox of IT Support
© 2015 MetricNet & Samanage | Confidential | All Rights Reserved
Page 18
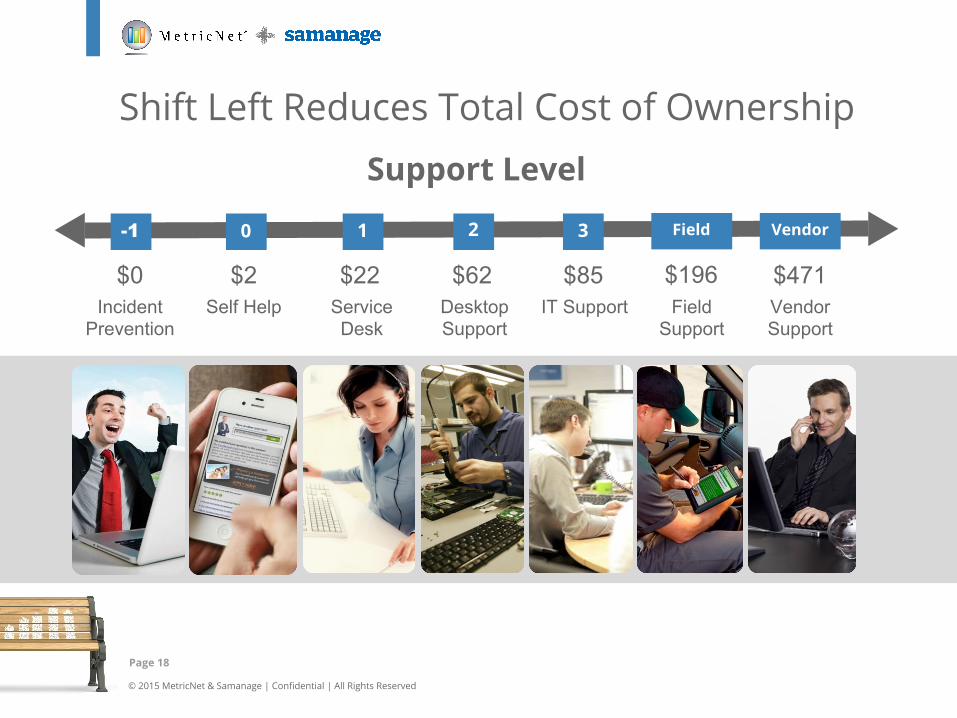
Shift Left Reduces Total Cost of Ownership Support Level
$0
-1
$2
0
$22
1
$62
2
$85
3 Field Vendor
$196 $471Incident
PreventionSelf Help Service
DeskDesktopSupport
IT Support FieldSupport
VendorSupport

© 2015 MetricNet & Samanage | Confidential | All Rights Reserved
Page 19
Support Function Key Performance Indicator
Performance Quartile
1 (top) 2 3 4 (bottom)
Service Desk
Customer Satisfaction 93.5% 84.5% 76.1% 69.3%
First Contact Resolution Rate 90.1% 83.0% 72.7% 66.4%
Mean Time to Resolve (hours) 0.8 1.2 3.6 5.0
Desktop Support
Customer Satisfaction 94.4% 89.2% 79.0% 71.7%
First Contact Resolution Rate 89.3% 85.6% 80.9% 74.5%
Mean Time to Resolve (hours) 2.9 4.8 9.4 12.3
Average Productive Hours Lost per Employee per Year 17.1 25.9 37.4 46.9
Quality of Support Drives End-User Productivity
© 2015 MetricNet & Samanage | Confidential | All Rights Reserved
Page 20
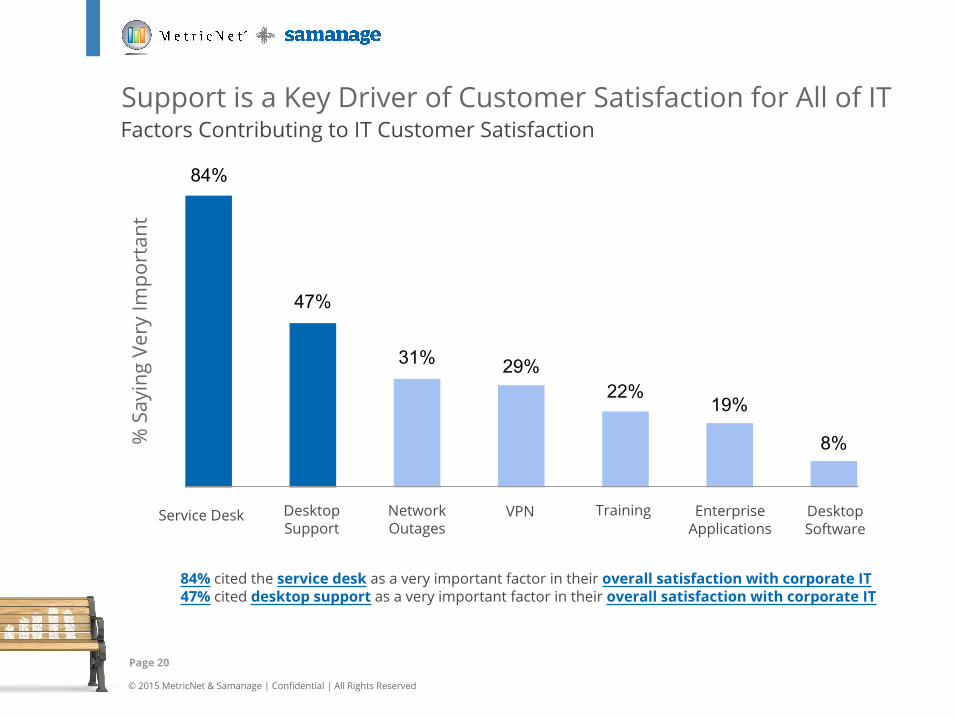
Support is a Key Driver of Customer Satisfaction for All of IT
84% cited the service desk as a very important factor in their overall satisfaction with corporate IT 47% cited desktop support as a very important factor in their overall satisfaction with corporate IT
84%
47%
31% 29%22%
19%
8%
Service Desk DesktopSupport
Network Outages
VPN Training EnterpriseApplications
Desktop Software
% S
ayin
g Ve
ry Im
port
ant
Factors Contributing to IT Customer Satisfaction
© 2015 MetricNet & Samanage | Confidential | All Rights Reserved
Get your personalized Samanage Benchmarking Activation Call
pages.samanage.com/benchmarking-activation
Page 21
© 2015 MetricNet & Samanage | Confidential | All Rights Reserved
Page 22
Questions
Change Transform Disrupt
© 2015 MetricNet & Samanage | Confidential | All Rights Reserved
Poised to
the Service + Support Industry