sales leadership study
TRANSCRIPT
CHARACTERISTICS AND QUALITIESOF TOP PERFORMERS
THE RACE TO ACHIEVE SUPERIOR RESULTS
T H E R E AG A N C O N S U LT I N G L E A D E R S H I P S E R I E S
P a g e | 1
R e a g a n C o n s u l t i n g L e a d e r s h i p
S e r i e s
Table of Contents
Introduction ....................................................................................................................... 2
Methodology ..................................................................................................................... 4
What is Sales Leadership? ................................................................................................. 8
Essential Element #1: Equipping Producers for Success ........................................... 11
Essential Element #2: Creating a Culture of Accountability ...................................... 22
Essential Element #3: Recruiting and Developing New Producers ........................... 29
The Impact of “DNA” ....................................................................................................... 35
Key Findings ..................................................................................................................... 39
How Agents and Brokers Can Benefit From This Study ................................................... 43
Acknowledgements ......................................................................................................... 47
P a g e | 2
R e a g a n C o n s u l t i n g L e a d e r s h i p S e r i e s
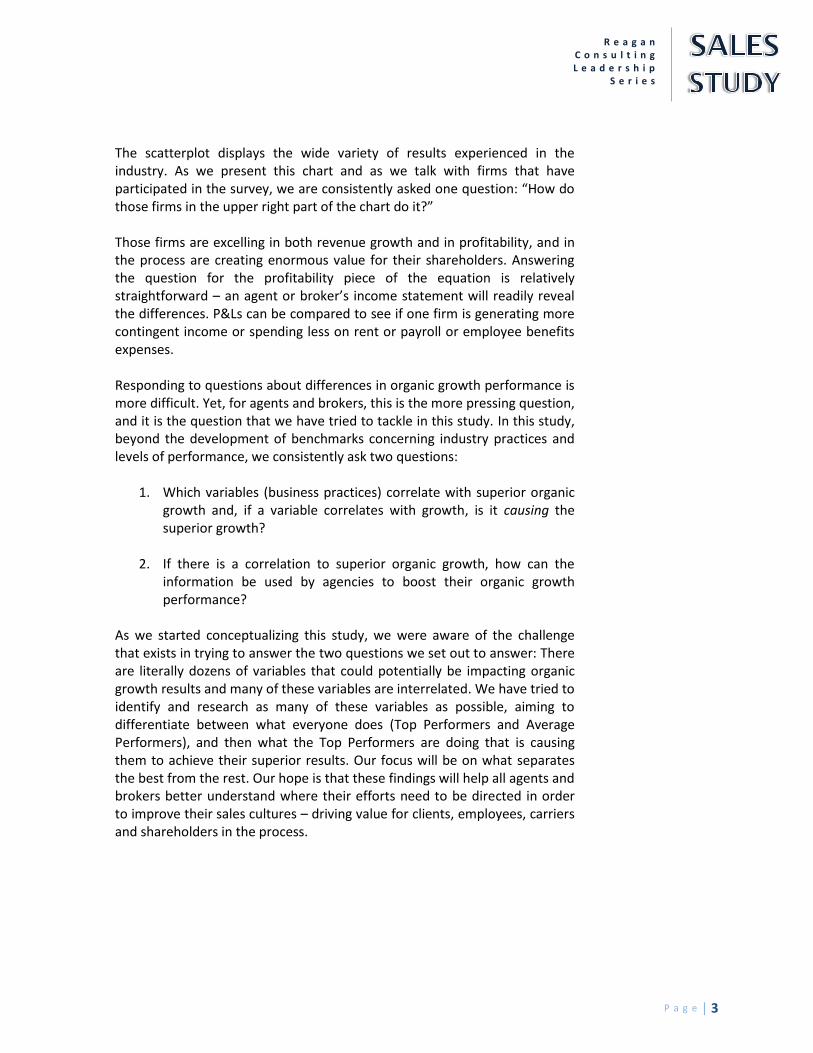
Introduction Four years ago, in late 2008, we developed the Organic Growth & Profitability Survey (OGP), a quarterly survey of large agents and brokers that tracks, in real time, the two primary drivers of agency value: organic growth (percentage change in revenues over the prior period excluding acquisitions and divestitures) and profit margin (EBITDA as a percentage of revenues). Over 125 agents and brokers participate in the survey quarterly, receiving comparisons of their firm’s performance in these two areas versus their peers in the industry. In the report provided to each OGP participant we provide a scatterplot of all firms that participated for that quarter, charting each firm’s organic growth and profitability. The scatterplot for the year end 2011 OGP Survey is shown below.
Q4 2011 OGP Survey Scatterplot of All Participating Firms & Public Brokers
Key to Public Brokers: AJG – Arthur J. Gallagher & Co.; AON – Aon Corporation; BRO – Brown & Brown; MMC – Marsh & McLennan; WSH – Willis Group Holdings
Surveyed firms with annual revenues less than $10 million
Surveyed firms with annual revenues between $10 million and $25 million
Surveyed firms with annual revenues greater than $25 million
Top and Bottom 25% of all firms
Rule of 20 line (All points on this line indicate a Rule of 20 score of 20, i.e., growth plus
1/2 EBITDA margin = 20% or higher)
0.0%
5.0%
10.0%
15.0%
20.0%
25.0%
30.0%
35.0%
40.0%
-20.0% -15.0% -10.0% -5.0% 0.0% 5.0% 10.0% 15.0% 20.0%
Pro
fita
bili
ty (
EBIT
DA
Mar
gin
)
Organic Growth
Top 25% Growth
Bottom 25% Growth
Bottom 25% Profitability
Top 25%
Profitability
MMC
AJG
AON
BRO
WSH
P a g e | 3
R e a g a n C o n s u l t i n g L e a d e r s h i p
S e r i e s
The scatterplot displays the wide variety of results experienced in the industry. As we present this chart and as we talk with firms that have participated in the survey, we are consistently asked one question: “How do those firms in the upper right part of the chart do it?” Those firms are excelling in both revenue growth and in profitability, and in the process are creating enormous value for their shareholders. Answering the question for the profitability piece of the equation is relatively straightforward – an agent or broker’s income statement will readily reveal the differences. P&Ls can be compared to see if one firm is generating more contingent income or spending less on rent or payroll or employee benefits expenses. Responding to questions about differences in organic growth performance is more difficult. Yet, for agents and brokers, this is the more pressing question, and it is the question that we have tried to tackle in this study. In this study, beyond the development of benchmarks concerning industry practices and levels of performance, we consistently ask two questions:
1. Which variables (business practices) correlate with superior organic growth and, if a variable correlates with growth, is it causing the superior growth?
2. If there is a correlation to superior organic growth, how can the information be used by agencies to boost their organic growth performance?
As we started conceptualizing this study, we were aware of the challenge that exists in trying to answer the two questions we set out to answer: There are literally dozens of variables that could potentially be impacting organic growth results and many of these variables are interrelated. We have tried to identify and research as many of these variables as possible, aiming to differentiate between what everyone does (Top Performers and Average Performers), and then what the Top Performers are doing that is causing them to achieve their superior results. Our focus will be on what separates the best from the rest. Our hope is that these findings will help all agents and brokers better understand where their efforts need to be directed in order to improve their sales cultures – driving value for clients, employees, carriers and shareholders in the process.
P a g e | 4
R e a g a n C o n s u l t i n g L e a d e r s h i p S e r i e s
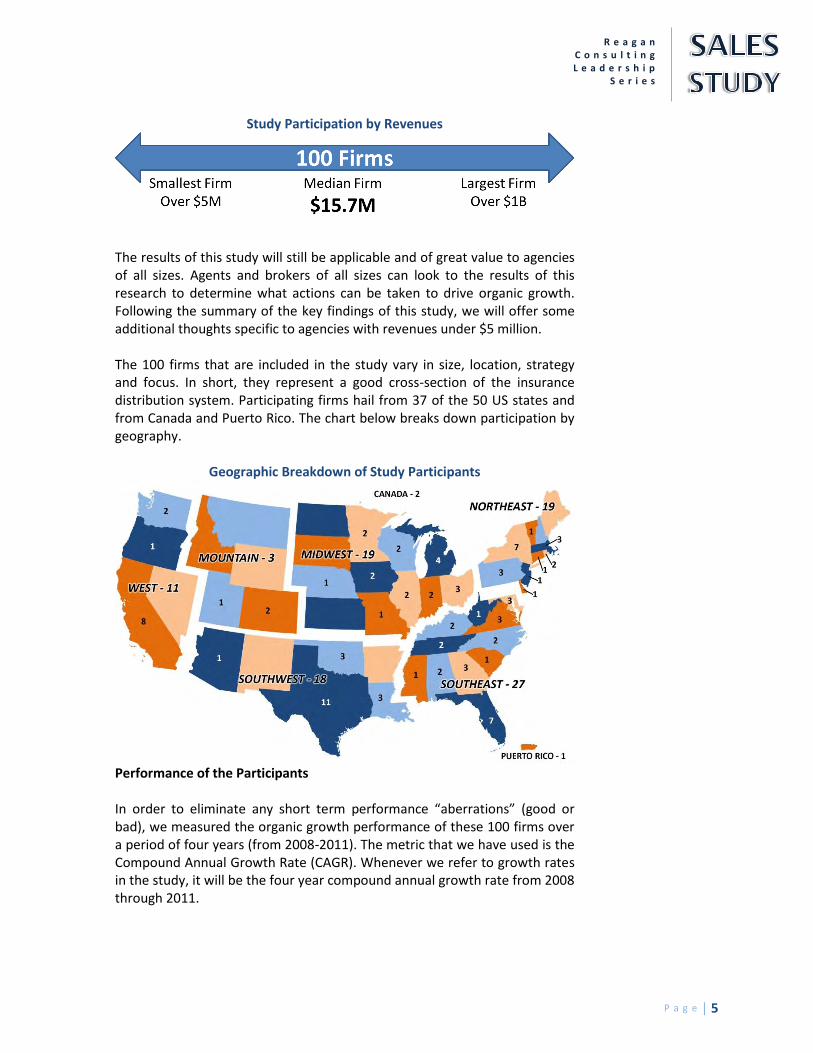
Methodology Our aim was to uncover what successful sales organizations are doing to drive superior growth performance. To pursue this question properly, we needed two groups of participants: firms with superior growth performance and quality firms with average growth performance. Without some sort of control group, identifying what the top performers are doing differently would prove impossible. Thus, we sought to compile sales results and sales leadership decisions from a large group of quality agents and brokers. Our initial step in the process of gathering data for this study was to reach out to industry leaders to have them nominate firms that they know to be the best sales organizations in the industry. Carriers, technology partners, sales consultants and industry associations all weighed in with nominations. We compiled these nominations and added to them a number of quality firms from throughout the insurance agent and broker ranks. We then asked this combined group of firms to complete a survey on their sales performance and leadership. We are extremely grateful to these firms for their willingness to invest the time needed to participate and, most importantly, to share a great deal of information on how they are doing business. Participating Firms The initial group of participants included a broad range of firms from a revenue perspective. Some firms reported just over a half a million dollars in annual revenues while others reported over half a billion. The median 2011 revenue for this initial group of firms was approximately $14 million. However, in order to draw clear and applicable conclusions from the data, we focused on firms with revenues of $5 million or more. We believe that the elements of sales leadership and organic growth for these firms is different than for firms below $5 million. Specifically, the larger firms generally possess a larger group of producers, are unlikely to be influenced as significantly by the results of one producer and are more dependent upon organizational sales leadership (recruiting, development, resources, accountability) as opposed to individual performance. We therefore narrowed our focus and selected 100 of these firms to include in the study, all having annual revenues in excess of $5 million. The median revenue of these firms is over $15 million.
P a g e | 5
R e a g a n C o n s u l t i n g L e a d e r s h i p
S e r i e s
Study Participation by Revenues
The results of this study will still be applicable and of great value to agencies of all sizes. Agents and brokers of all sizes can look to the results of this research to determine what actions can be taken to drive organic growth. Following the summary of the key findings of this study, we will offer some additional thoughts specific to agencies with revenues under $5 million. The 100 firms that are included in the study vary in size, location, strategy and focus. In short, they represent a good cross-section of the insurance distribution system. Participating firms hail from 37 of the 50 US states and from Canada and Puerto Rico. The chart below breaks down participation by geography.
Geographic Breakdown of Study Participants
Performance of the Participants In order to eliminate any short term performance “aberrations” (good or bad), we measured the organic growth performance of these 100 firms over a period of four years (from 2008-2011). The metric that we have used is the Compound Annual Growth Rate (CAGR). Whenever we refer to growth rates in the study, it will be the four year compound annual growth rate from 2008 through 2011.
P a g e | 6
R e a g a n C o n s u l t i n g L e a d e r s h i p S e r i e s
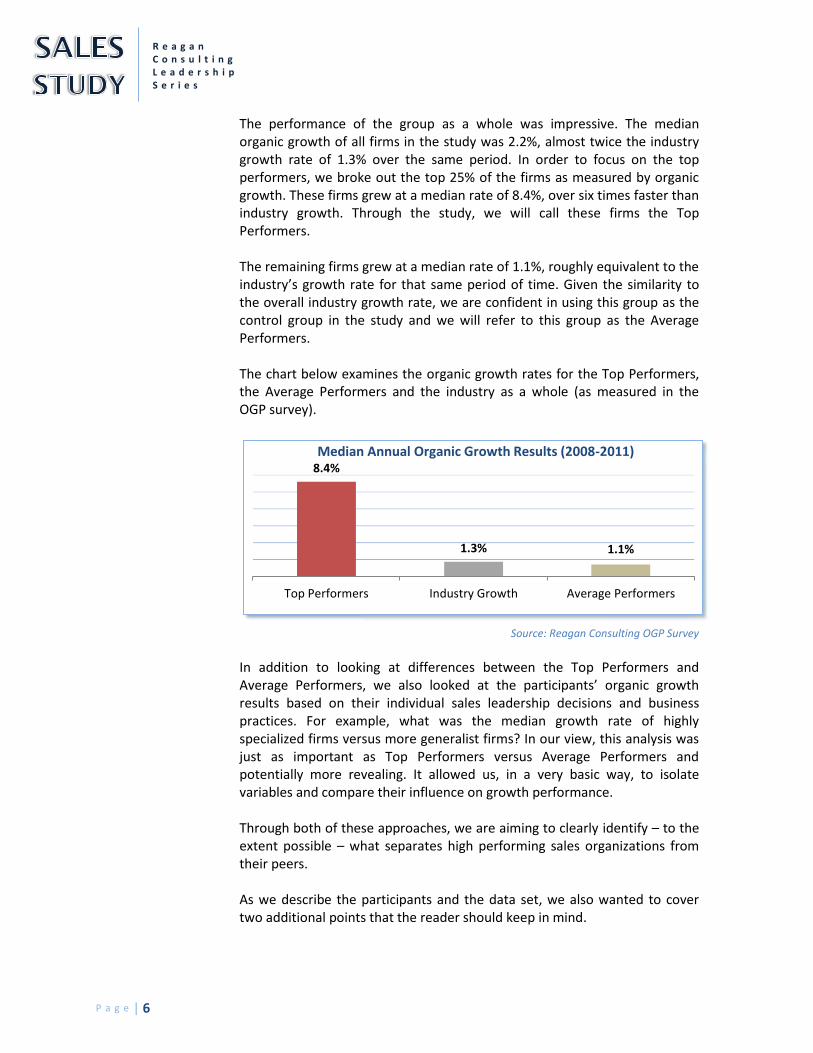
The performance of the group as a whole was impressive. The median organic growth of all firms in the study was 2.2%, almost twice the industry growth rate of 1.3% over the same period. In order to focus on the top performers, we broke out the top 25% of the firms as measured by organic growth. These firms grew at a median rate of 8.4%, over six times faster than industry growth. Through the study, we will call these firms the Top Performers. The remaining firms grew at a median rate of 1.1%, roughly equivalent to the industry’s growth rate for that same period of time. Given the similarity to the overall industry growth rate, we are confident in using this group as the control group in the study and we will refer to this group as the Average Performers. The chart below examines the organic growth rates for the Top Performers, the Average Performers and the industry as a whole (as measured in the OGP survey).
Source: Reagan Consulting OGP Survey In addition to looking at differences between the Top Performers and Average Performers, we also looked at the participants’ organic growth results based on their individual sales leadership decisions and business practices. For example, what was the median growth rate of highly specialized firms versus more generalist firms? In our view, this analysis was just as important as Top Performers versus Average Performers and potentially more revealing. It allowed us, in a very basic way, to isolate variables and compare their influence on growth performance. Through both of these approaches, we are aiming to clearly identify – to the extent possible – what separates high performing sales organizations from their peers. As we describe the participants and the data set, we also wanted to cover two additional points that the reader should keep in mind.
1.1% 1.3%
8.4%
Average PerformersIndustry GrowthTop Performers
Median Annual Organic Growth Results (2008-2011)
P a g e | 7
R e a g a n C o n s u l t i n g L e a d e r s h i p
S e r i e s
High Growth’s Impact on Profitability
First, we want to address the profitability reported by firms in the study. The Top Performers are not sacrificing profitability for growth. The Top Performers actually report a median EBITDA margin (19.6%) that is approximately a point higher than the Average Performers (18.5%). In short, “buying” growth through higher expenses and lower profits is not a requirement for industry-leading growth performance.
The Source of Superior Growth
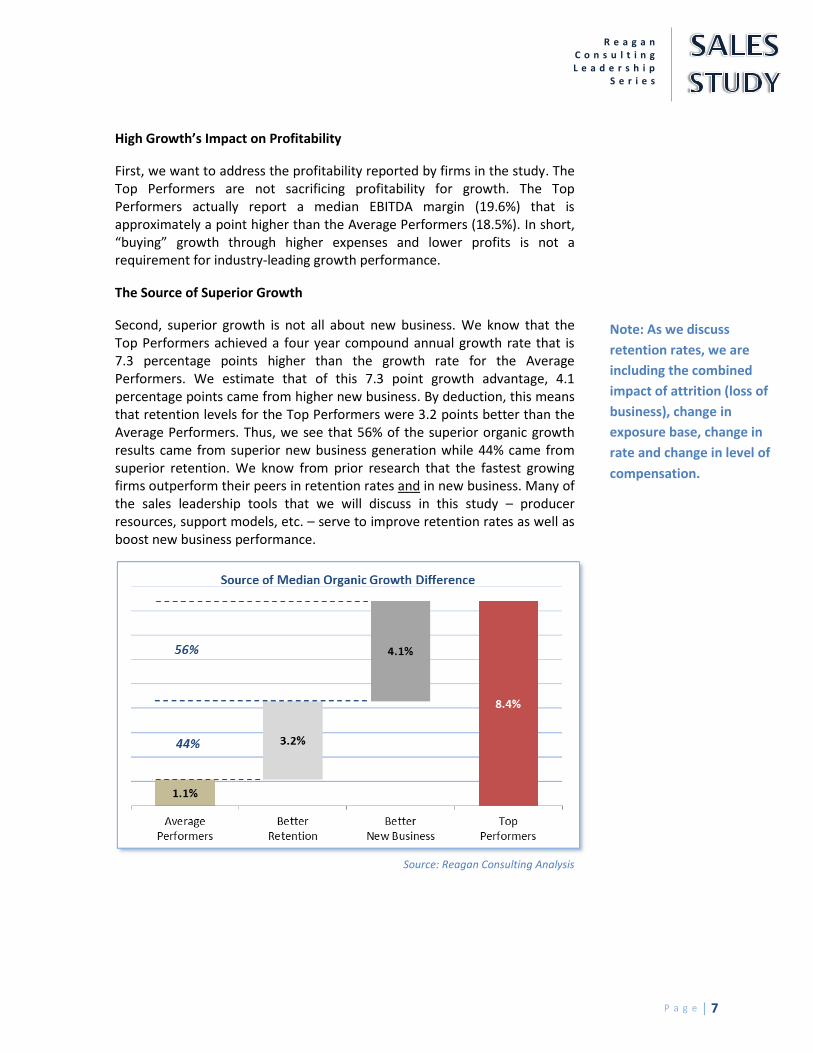
Second, superior growth is not all about new business. We know that the Top Performers achieved a four year compound annual growth rate that is 7.3 percentage points higher than the growth rate for the Average Performers. We estimate that of this 7.3 point growth advantage, 4.1 percentage points came from higher new business. By deduction, this means that retention levels for the Top Performers were 3.2 points better than the Average Performers. Thus, we see that 56% of the superior organic growth results came from superior new business generation while 44% came from superior retention. We know from prior research that the fastest growing firms outperform their peers in retention rates and in new business. Many of the sales leadership tools that we will discuss in this study – producer resources, support models, etc. – serve to improve retention rates as well as boost new business performance.
Source: Reagan Consulting Analysis
Note: As we discuss
retention rates, we are
including the combined
impact of attrition (loss of
business), change in
exposure base, change in
rate and change in level of
compensation.
P a g e | 8
R e a g a n C o n s u l t i n g L e a d e r s h i p S e r i e s
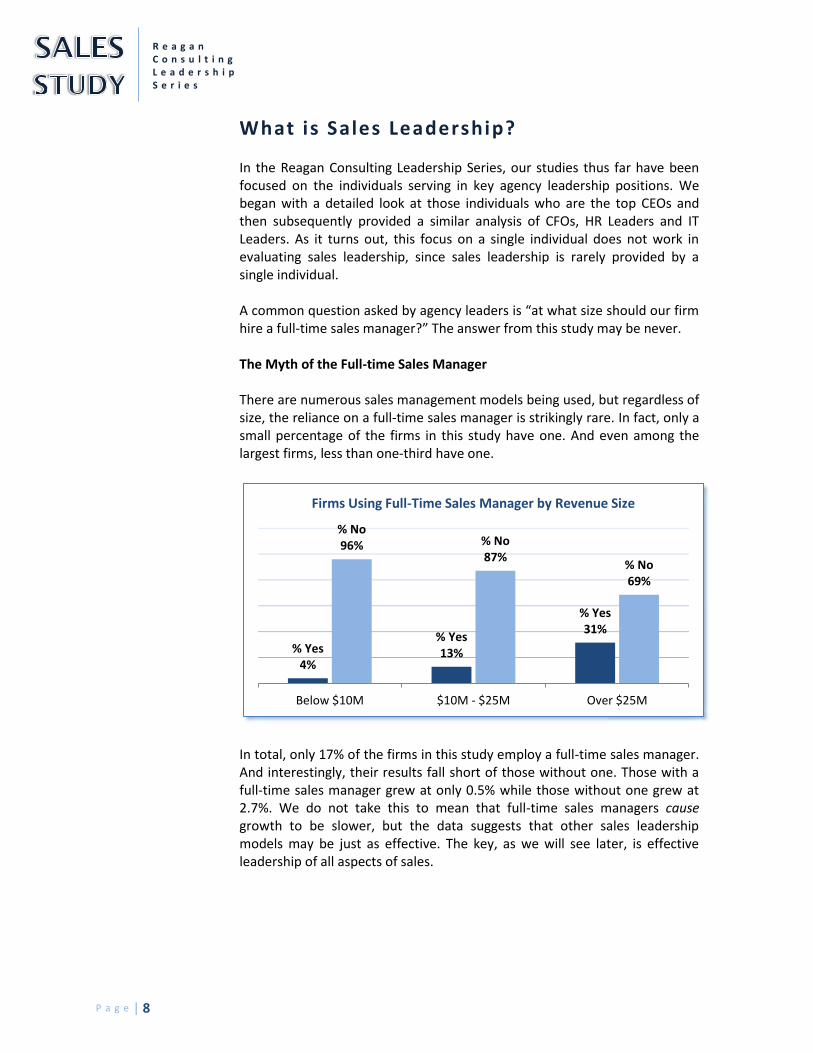
What is Sales Leadership? In the Reagan Consulting Leadership Series, our studies thus far have been focused on the individuals serving in key agency leadership positions. We began with a detailed look at those individuals who are the top CEOs and then subsequently provided a similar analysis of CFOs, HR Leaders and IT Leaders. As it turns out, this focus on a single individual does not work in evaluating sales leadership, since sales leadership is rarely provided by a single individual. A common question asked by agency leaders is “at what size should our firm hire a full-time sales manager?” The answer from this study may be never. The Myth of the Full-time Sales Manager There are numerous sales management models being used, but regardless of size, the reliance on a full-time sales manager is strikingly rare. In fact, only a small percentage of the firms in this study have one. And even among the largest firms, less than one-third have one.
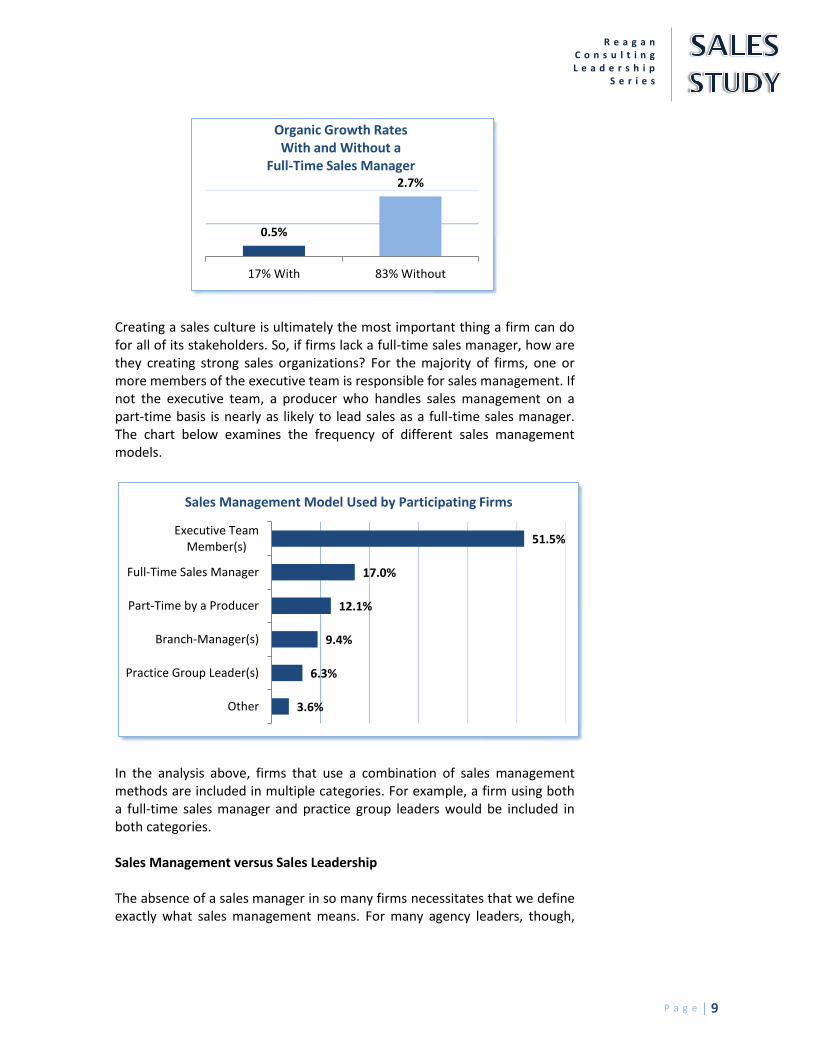
In total, only 17% of the firms in this study employ a full-time sales manager. And interestingly, their results fall short of those without one. Those with a full-time sales manager grew at only 0.5% while those without one grew at 2.7%. We do not take this to mean that full-time sales managers cause growth to be slower, but the data suggests that other sales leadership models may be just as effective. The key, as we will see later, is effective leadership of all aspects of sales.
% Yes 4%
% Yes 13%
% Yes 31%
% No 96% % No
87% % No 69%
Below $10M $10M - $25M Over $25M
Firms Using Full-Time Sales Manager by Revenue Size
P a g e | 9
R e a g a n C o n s u l t i n g L e a d e r s h i p
S e r i e s
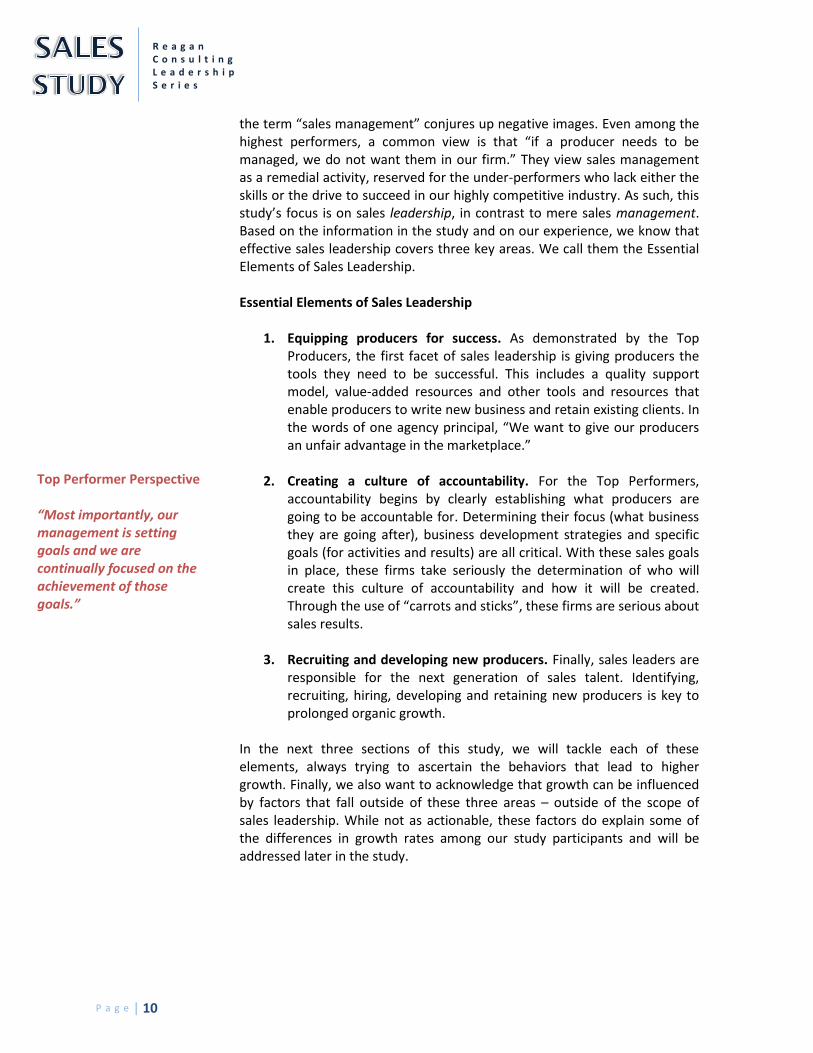
Creating a sales culture is ultimately the most important thing a firm can do for all of its stakeholders. So, if firms lack a full-time sales manager, how are they creating strong sales organizations? For the majority of firms, one or more members of the executive team is responsible for sales management. If not the executive team, a producer who handles sales management on a part-time basis is nearly as likely to lead sales as a full-time sales manager. The chart below examines the frequency of different sales management models.
In the analysis above, firms that use a combination of sales management methods are included in multiple categories. For example, a firm using both a full-time sales manager and practice group leaders would be included in both categories. Sales Management versus Sales Leadership The absence of a sales manager in so many firms necessitates that we define exactly what sales management means. For many agency leaders, though,
0.5%
2.7%
17% With 83% Without
Organic Growth Rates With and Without a
Full-Time Sales Manager
51.5%
17.0%
12.1%
9.4%
6.3%
3.6%
Executive TeamMember(s)
Full-Time Sales Manager
Part-Time by a Producer
Branch-Manager(s)
Practice Group Leader(s)
Other
Sales Management Model Used by Participating Firms
P a g e | 10
R e a g a n C o n s u l t i n g L e a d e r s h i p S e r i e s
the term “sales management” conjures up negative images. Even among the highest performers, a common view is that “if a producer needs to be managed, we do not want them in our firm.” They view sales management as a remedial activity, reserved for the under-performers who lack either the skills or the drive to succeed in our highly competitive industry. As such, this study’s focus is on sales leadership, in contrast to mere sales management. Based on the information in the study and on our experience, we know that effective sales leadership covers three key areas. We call them the Essential Elements of Sales Leadership. Essential Elements of Sales Leadership
1. Equipping producers for success. As demonstrated by the Top Producers, the first facet of sales leadership is giving producers the tools they need to be successful. This includes a quality support model, value-added resources and other tools and resources that enable producers to write new business and retain existing clients. In the words of one agency principal, “We want to give our producers an unfair advantage in the marketplace.”
2. Creating a culture of accountability. For the Top Performers, accountability begins by clearly establishing what producers are going to be accountable for. Determining their focus (what business they are going after), business development strategies and specific goals (for activities and results) are all critical. With these sales goals in place, these firms take seriously the determination of who will create this culture of accountability and how it will be created. Through the use of “carrots and sticks”, these firms are serious about sales results.
3. Recruiting and developing new producers. Finally, sales leaders are responsible for the next generation of sales talent. Identifying, recruiting, hiring, developing and retaining new producers is key to prolonged organic growth.
In the next three sections of this study, we will tackle each of these elements, always trying to ascertain the behaviors that lead to higher growth. Finally, we also want to acknowledge that growth can be influenced by factors that fall outside of these three areas – outside of the scope of sales leadership. While not as actionable, these factors do explain some of the differences in growth rates among our study participants and will be addressed later in the study.
Top Performer Perspective “Most importantly, our management is setting goals and we are continually focused on the achievement of those goals.”
P a g e | 11
R e a g a n C o n s u l t i n g L e a d e r s h i p
S e r i e s
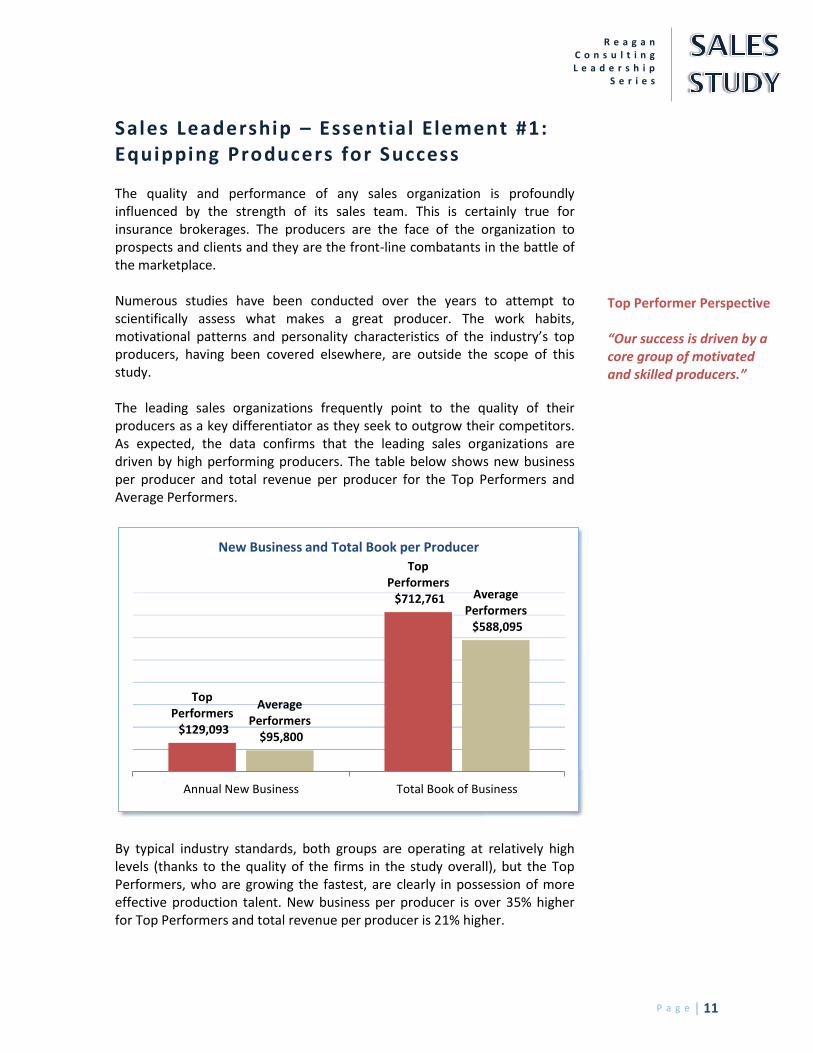
Sales Leadership – Essentia l Element #1: Equipping Producers for Success The quality and performance of any sales organization is profoundly influenced by the strength of its sales team. This is certainly true for insurance brokerages. The producers are the face of the organization to prospects and clients and they are the front-line combatants in the battle of the marketplace. Numerous studies have been conducted over the years to attempt to scientifically assess what makes a great producer. The work habits, motivational patterns and personality characteristics of the industry’s top producers, having been covered elsewhere, are outside the scope of this study. The leading sales organizations frequently point to the quality of their producers as a key differentiator as they seek to outgrow their competitors. As expected, the data confirms that the leading sales organizations are driven by high performing producers. The table below shows new business per producer and total revenue per producer for the Top Performers and Average Performers.
By typical industry standards, both groups are operating at relatively high levels (thanks to the quality of the firms in the study overall), but the Top Performers, who are growing the fastest, are clearly in possession of more effective production talent. New business per producer is over 35% higher for Top Performers and total revenue per producer is 21% higher.
Top Performers $129,093
Top Performers $712,761
Average Performers
$95,800
Average Performers $588,095
Annual New Business Total Book of Business
New Business and Total Book per Producer
Top Performer Perspective “Our success is driven by a core group of motivated and skilled producers.”
P a g e | 12
R e a g a n C o n s u l t i n g L e a d e r s h i p S e r i e s
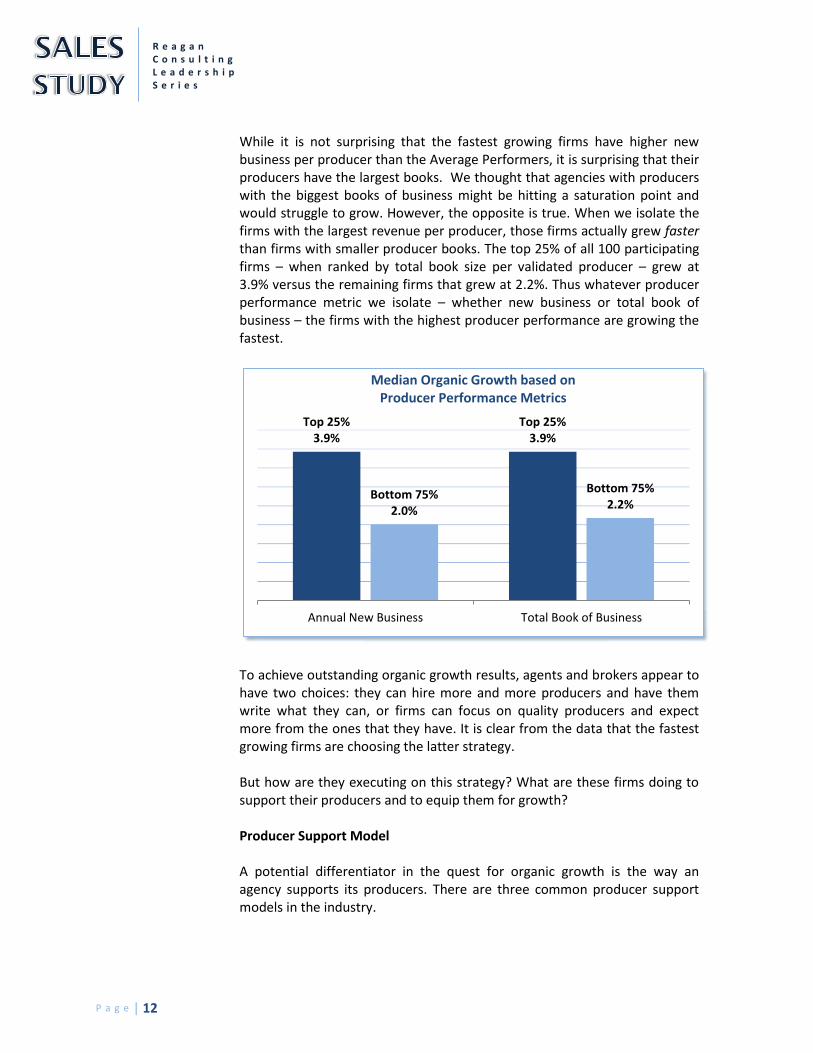
While it is not surprising that the fastest growing firms have higher new business per producer than the Average Performers, it is surprising that their producers have the largest books. We thought that agencies with producers with the biggest books of business might be hitting a saturation point and would struggle to grow. However, the opposite is true. When we isolate the firms with the largest revenue per producer, those firms actually grew faster than firms with smaller producer books. The top 25% of all 100 participating firms – when ranked by total book size per validated producer – grew at 3.9% versus the remaining firms that grew at 2.2%. Thus whatever producer performance metric we isolate – whether new business or total book of business – the firms with the highest producer performance are growing the fastest.
To achieve outstanding organic growth results, agents and brokers appear to have two choices: they can hire more and more producers and have them write what they can, or firms can focus on quality producers and expect more from the ones that they have. It is clear from the data that the fastest growing firms are choosing the latter strategy. But how are they executing on this strategy? What are these firms doing to support their producers and to equip them for growth? Producer Support Model A potential differentiator in the quest for organic growth is the way an agency supports its producers. There are three common producer support models in the industry.
Top 25% 3.9%
Top 25% 3.9%
Bottom 75% 2.0%
Bottom 75% 2.2%
Annual New Business Total Book of Business
Median Organic Growth based on Producer Performance Metrics
P a g e | 13
R e a g a n C o n s u l t i n g L e a d e r s h i p
S e r i e s
1. Do-it-yourself model. This is common in small agencies handling small accounts. The producer receives nothing but basic administrative support and personally handles most of the day-to-day service work on their accounts.
2. Customer Support Representative (CSR) model. This is the industry’s
most common middle-market approach to servicing. One or more CSRs are teamed up with a producer to provide some technical and administrative support. The producer remains significantly involved with the clients, but is relieved of the burden of day-to-day servicing.
3. Account Executive (AE) model. This is a more advanced model of
servicing which is most commonly used for larger middle-market accounts (e.g., over $25k in annual commissions/fees). An AE is a deeply experienced professional with strong technical and relationship skills. The AE often works in conjunction with (not in lieu of) CSRs and administrative staff to efficiently handle the technical needs of clients. The profile of an AE is frequently similar to that of a producer, except that an AE does not typically have the new business generation skills of a producer. Agencies hire AEs for one simple purpose – to free up producers to sell more business.
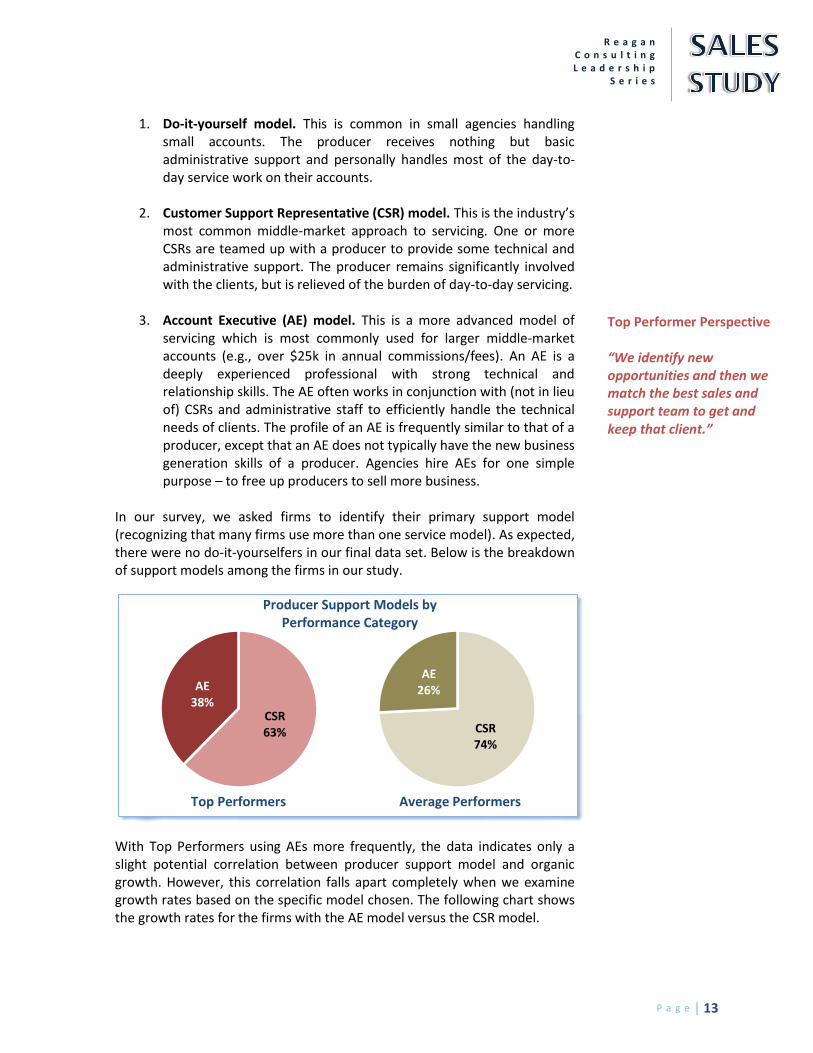
In our survey, we asked firms to identify their primary support model (recognizing that many firms use more than one service model). As expected, there were no do-it-yourselfers in our final data set. Below is the breakdown of support models among the firms in our study.
With Top Performers using AEs more frequently, the data indicates only a slight potential correlation between producer support model and organic growth. However, this correlation falls apart completely when we examine growth rates based on the specific model chosen. The following chart shows the growth rates for the firms with the AE model versus the CSR model.
CSR 63%
AE 38%
Top Performers
CSR 74%
AE 26%
Average Performers
Producer Support Models by Performance Category
Top Performer Perspective “We identify new opportunities and then we match the best sales and support team to get and keep that client.”

P a g e | 14
R e a g a n C o n s u l t i n g L e a d e r s h i p S e r i e s
Is there an advantage to one model over another? Our gut reaction was to assume that the AE model facilitates faster growth, but that does not appear to be the case. We would note that the AE model appears more frequently in firms with higher revenue per producer and higher new business per producer, but the data does not seem to establish a relationship where the AE model causes these results. In fact, of the top 25% of all firms ranked by commission and fees per producer, 46% have the CSR model. Of the top 25% of all firms ranked by new business per producer, 42% have the CSR model. It appears to us that the AE model is the more likely choice for firms with larger producer books and is less used in firms with smaller producer books, but that the choice of model does not in itself drive growth. A small number of firms that have adopted the AE model have tried to take the concept even further. In order to maximize their producers’ time to spend on new business, they do a “complete hand-off” of an account, once written, from the producer to an AE. The data from the study indicates this is very rare among top performers. Of the firms in our study using AEs, only two firms are doing this as a normal practice. And in our experience, while this can be an effective way to leverage a rain-maker producer’s unique door-opening skills, this is a difficult model to adopt agency-wide since true rain-maker producers are so rare. The support model is often the delivery mechanism for a wide range of client services, and agencies frequently refer to the quality of their client service as a key differentiator and reason for their success. We were intrigued, however, to find that while many list service as highly important to organic growth, neither the self-perceived quality of client service nor the delivery mechanism (support model) is a consistent difference-maker in terms of organic growth. We hypothesize that this may be because a high level of client service is being provided by most professional agencies. We recognize the importance of the quality, breadth and depth of the support model and that it will have an impact on a producer’s performance over time, but it does not appear to be a key differentiator. With the bar set pretty high, agencies cannot outgrow their peers simply by providing “better” client support. The top firms are going far beyond that.
Growth Based on Producer Support Model
P a g e | 15
R e a g a n C o n s u l t i n g L e a d e r s h i p
S e r i e s
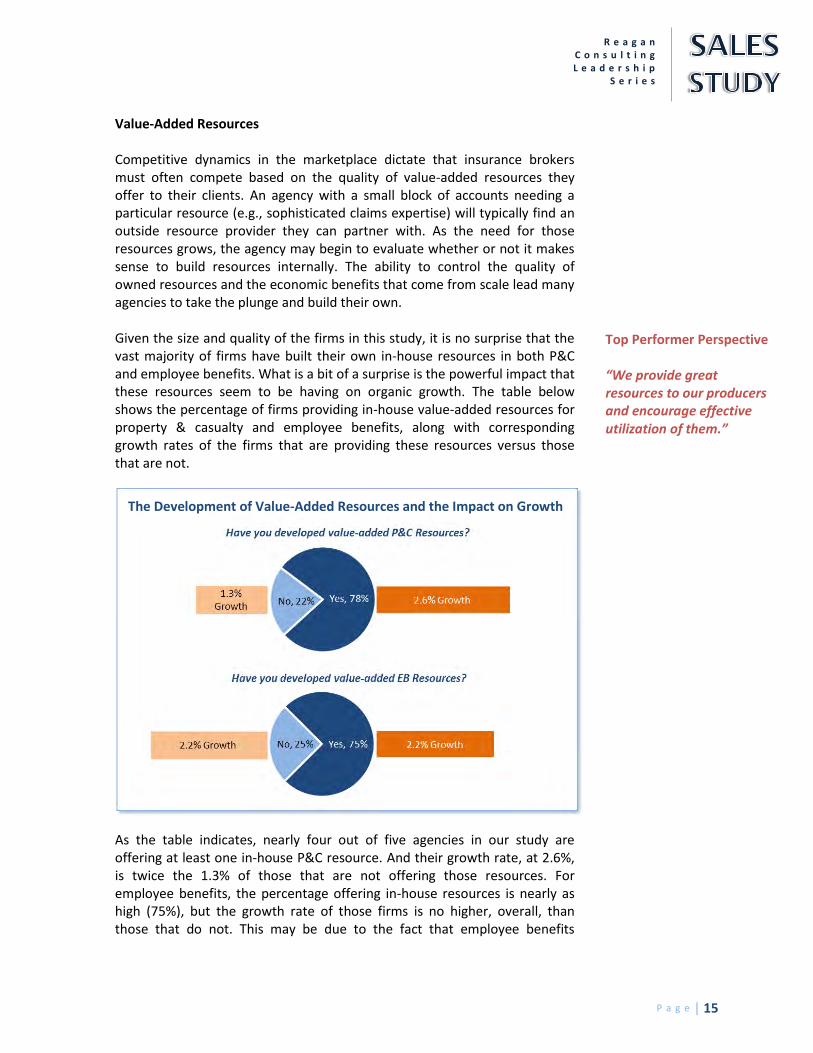
Value-Added Resources Competitive dynamics in the marketplace dictate that insurance brokers must often compete based on the quality of value-added resources they offer to their clients. An agency with a small block of accounts needing a particular resource (e.g., sophisticated claims expertise) will typically find an outside resource provider they can partner with. As the need for those resources grows, the agency may begin to evaluate whether or not it makes sense to build resources internally. The ability to control the quality of owned resources and the economic benefits that come from scale lead many agencies to take the plunge and build their own. Given the size and quality of the firms in this study, it is no surprise that the vast majority of firms have built their own in-house resources in both P&C and employee benefits. What is a bit of a surprise is the powerful impact that these resources seem to be having on organic growth. The table below shows the percentage of firms providing in-house value-added resources for property & casualty and employee benefits, along with corresponding growth rates of the firms that are providing these resources versus those that are not.
As the table indicates, nearly four out of five agencies in our study are offering at least one in-house P&C resource. And their growth rate, at 2.6%, is twice the 1.3% of those that are not offering those resources. For employee benefits, the percentage offering in-house resources is nearly as high (75%), but the growth rate of those firms is no higher, overall, than those that do not. This may be due to the fact that employee benefits
Top Performer Perspective “We provide great resources to our producers and encourage effective utilization of them.”
The Development of Value-Added Resources and the Impact on Growth
P a g e | 16
R e a g a n C o n s u l t i n g L e a d e r s h i p S e r i e s
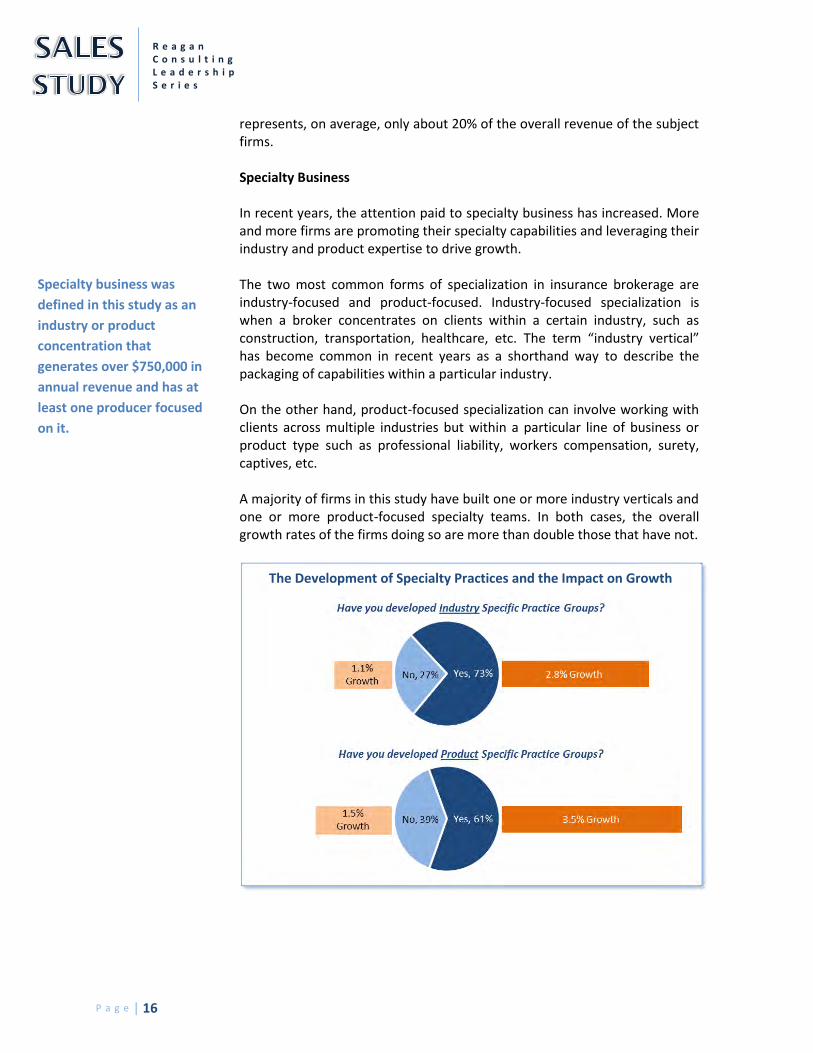
represents, on average, only about 20% of the overall revenue of the subject firms. Specialty Business In recent years, the attention paid to specialty business has increased. More and more firms are promoting their specialty capabilities and leveraging their industry and product expertise to drive growth. The two most common forms of specialization in insurance brokerage are industry-focused and product-focused. Industry-focused specialization is when a broker concentrates on clients within a certain industry, such as construction, transportation, healthcare, etc. The term “industry vertical” has become common in recent years as a shorthand way to describe the packaging of capabilities within a particular industry. On the other hand, product-focused specialization can involve working with clients across multiple industries but within a particular line of business or product type such as professional liability, workers compensation, surety, captives, etc. A majority of firms in this study have built one or more industry verticals and one or more product-focused specialty teams. In both cases, the overall growth rates of the firms doing so are more than double those that have not.
Specialty business was
defined in this study as an
industry or product
concentration that
generates over $750,000 in
annual revenue and has at
least one producer focused
on it.
The Development of Specialty Practices and the Impact on Growth
P a g e | 17
R e a g a n C o n s u l t i n g L e a d e r s h i p
S e r i e s
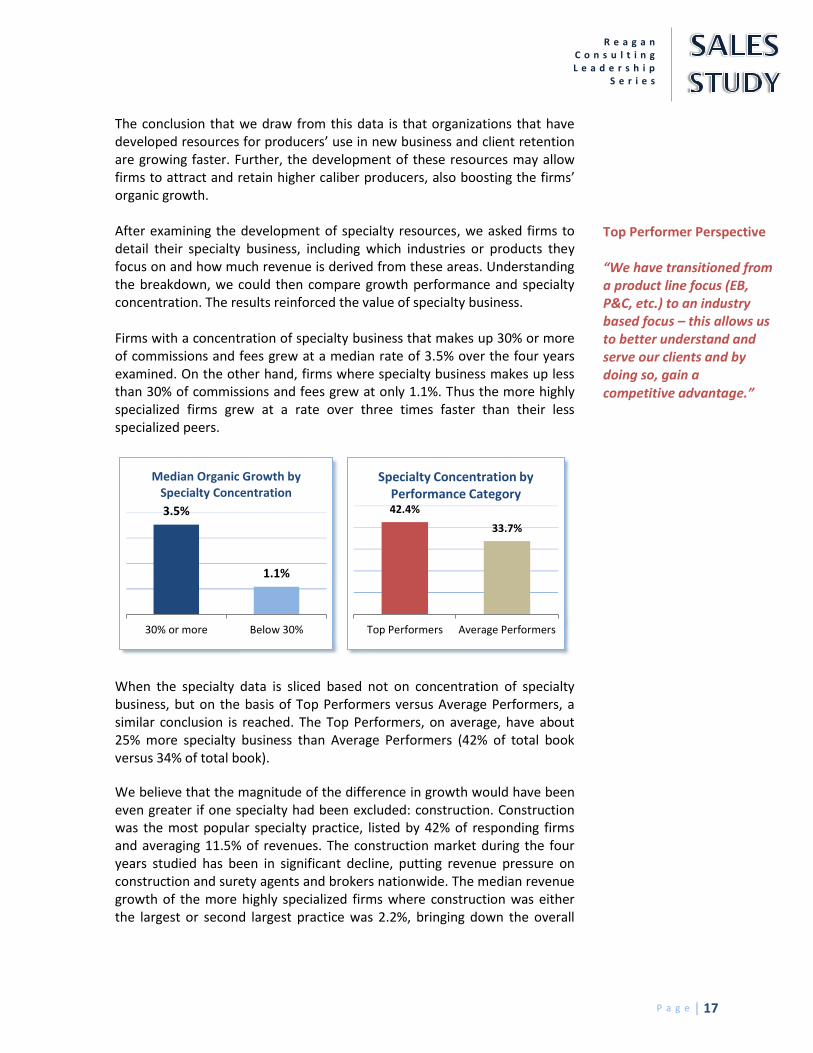
The conclusion that we draw from this data is that organizations that have developed resources for producers’ use in new business and client retention are growing faster. Further, the development of these resources may allow firms to attract and retain higher caliber producers, also boosting the firms’ organic growth. After examining the development of specialty resources, we asked firms to detail their specialty business, including which industries or products they focus on and how much revenue is derived from these areas. Understanding the breakdown, we could then compare growth performance and specialty concentration. The results reinforced the value of specialty business. Firms with a concentration of specialty business that makes up 30% or more of commissions and fees grew at a median rate of 3.5% over the four years examined. On the other hand, firms where specialty business makes up less than 30% of commissions and fees grew at only 1.1%. Thus the more highly specialized firms grew at a rate over three times faster than their less specialized peers.
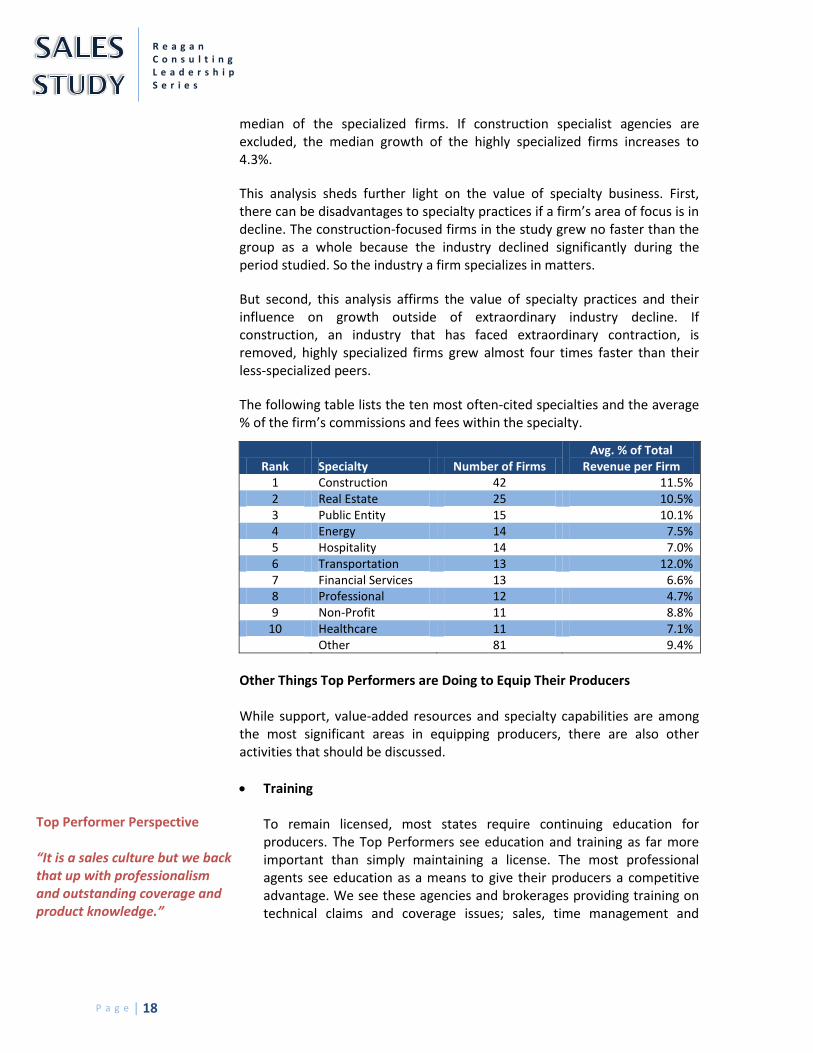
When the specialty data is sliced based not on concentration of specialty business, but on the basis of Top Performers versus Average Performers, a similar conclusion is reached. The Top Performers, on average, have about 25% more specialty business than Average Performers (42% of total book versus 34% of total book).
We believe that the magnitude of the difference in growth would have been even greater if one specialty had been excluded: construction. Construction was the most popular specialty practice, listed by 42% of responding firms and averaging 11.5% of revenues. The construction market during the four years studied has been in significant decline, putting revenue pressure on construction and surety agents and brokers nationwide. The median revenue growth of the more highly specialized firms where construction was either the largest or second largest practice was 2.2%, bringing down the overall
3.5%
1.1%
30% or more Below 30%
Median Organic Growth by Specialty Concentration
42.4%
33.7%
Top Performers Average Performers
Specialty Concentration by Performance Category
Top Performer Perspective “We have transitioned from a product line focus (EB, P&C, etc.) to an industry based focus – this allows us to better understand and serve our clients and by doing so, gain a competitive advantage.”
P a g e | 18
R e a g a n C o n s u l t i n g L e a d e r s h i p S e r i e s
median of the specialized firms. If construction specialist agencies are excluded, the median growth of the highly specialized firms increases to 4.3%.
This analysis sheds further light on the value of specialty business. First, there can be disadvantages to specialty practices if a firm’s area of focus is in decline. The construction-focused firms in the study grew no faster than the group as a whole because the industry declined significantly during the period studied. So the industry a firm specializes in matters.
But second, this analysis affirms the value of specialty practices and their influence on growth outside of extraordinary industry decline. If construction, an industry that has faced extraordinary contraction, is removed, highly specialized firms grew almost four times faster than their less-specialized peers.
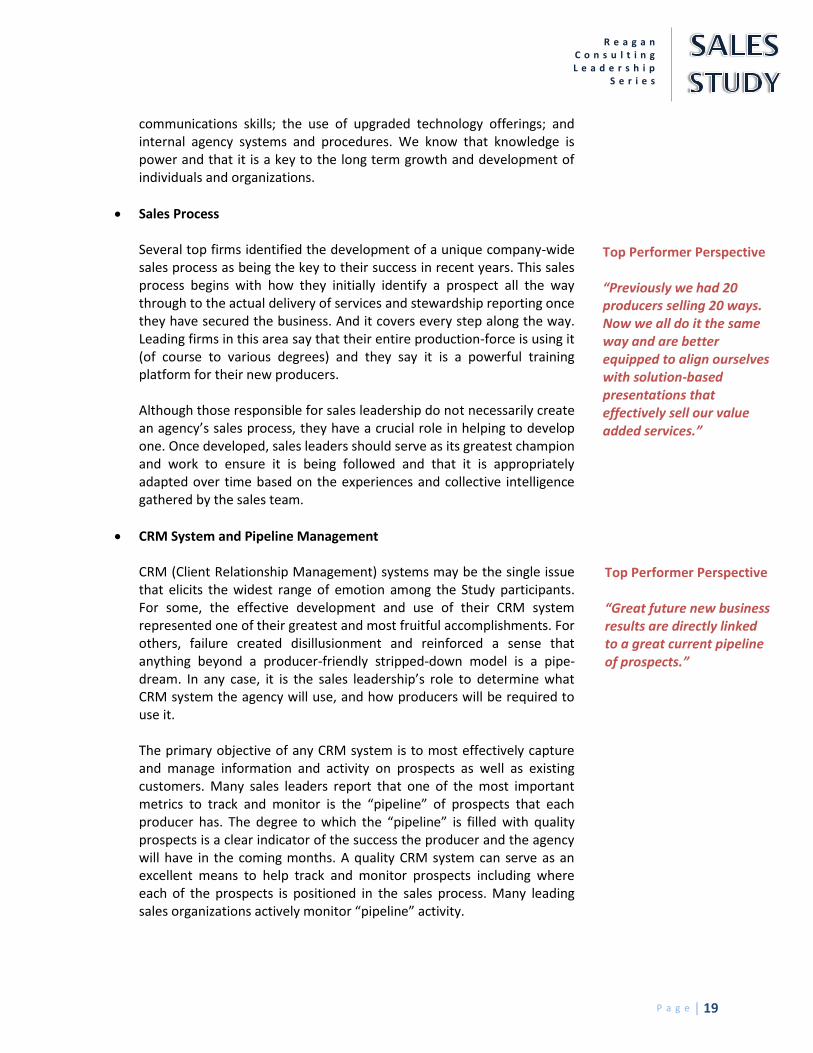
The following table lists the ten most often-cited specialties and the average % of the firm’s commissions and fees within the specialty.
Rank Specialty Number of Firms Avg. % of Total
Revenue per Firm 1 Construction 42 11.5% 2 Real Estate 25 10.5% 3 Public Entity 15 10.1% 4 Energy 14 7.5% 5 Hospitality 14 7.0% 6 Transportation 13 12.0% 7 Financial Services 13 6.6% 8 Professional 12 4.7% 9 Non-Profit 11 8.8%
10 Healthcare 11 7.1%
Other 81 9.4%
Other Things Top Performers are Doing to Equip Their Producers While support, value-added resources and specialty capabilities are among the most significant areas in equipping producers, there are also other activities that should be discussed.
Training
To remain licensed, most states require continuing education for producers. The Top Performers see education and training as far more important than simply maintaining a license. The most professional agents see education as a means to give their producers a competitive advantage. We see these agencies and brokerages providing training on technical claims and coverage issues; sales, time management and
Top Performer Perspective “It is a sales culture but we back that up with professionalism and outstanding coverage and product knowledge.”
P a g e | 19
R e a g a n C o n s u l t i n g L e a d e r s h i p
S e r i e s
communications skills; the use of upgraded technology offerings; and internal agency systems and procedures. We know that knowledge is power and that it is a key to the long term growth and development of individuals and organizations.
Sales Process
Several top firms identified the development of a unique company-wide sales process as being the key to their success in recent years. This sales process begins with how they initially identify a prospect all the way through to the actual delivery of services and stewardship reporting once they have secured the business. And it covers every step along the way. Leading firms in this area say that their entire production-force is using it (of course to various degrees) and they say it is a powerful training platform for their new producers.
Although those responsible for sales leadership do not necessarily create an agency’s sales process, they have a crucial role in helping to develop one. Once developed, sales leaders should serve as its greatest champion and work to ensure it is being followed and that it is appropriately adapted over time based on the experiences and collective intelligence gathered by the sales team.
CRM System and Pipeline Management
CRM (Client Relationship Management) systems may be the single issue that elicits the widest range of emotion among the Study participants. For some, the effective development and use of their CRM system represented one of their greatest and most fruitful accomplishments. For others, failure created disillusionment and reinforced a sense that anything beyond a producer-friendly stripped-down model is a pipe-dream. In any case, it is the sales leadership’s role to determine what CRM system the agency will use, and how producers will be required to use it. The primary objective of any CRM system is to most effectively capture and manage information and activity on prospects as well as existing customers. Many sales leaders report that one of the most important metrics to track and monitor is the “pipeline” of prospects that each producer has. The degree to which the “pipeline” is filled with quality prospects is a clear indicator of the success the producer and the agency will have in the coming months. A quality CRM system can serve as an excellent means to help track and monitor prospects including where each of the prospects is positioned in the sales process. Many leading sales organizations actively monitor “pipeline” activity.
Top Performer Perspective “Previously we had 20 producers selling 20 ways. Now we all do it the same way and are better equipped to align ourselves with solution-based presentations that effectively sell our value added services.”
Top Performer Perspective “Great future new business results are directly linked to a great current pipeline of prospects.”
P a g e | 20
R e a g a n C o n s u l t i n g L e a d e r s h i p S e r i e s
Branding
Many agencies aspire to little more than simply being a home for a group of producers who can leverage carrier relationships and back-office resources. Leading firms, on the other hand, recognize that the development of a real brand – a unifying concept by which they are recognized by customers, carriers and throughout the community – can lead to significantly higher growth. The sales leadership teams of leading firms take branding seriously, knowing that it impacts their ability to write new business, retain renewals and recruit producers. The ideal brand is not a function of an ad campaign but is based on the reality of better people, service, capabilities, etc. If the firm has these qualities, then the competitive advantage is truly gained by helping the entire staff believe in and understand how to consistently and fairly communicate their brand and what sets it apart.
Cross Selling, Client Referrals and Center of Influence Referrals
A lot of producers believe that cold calling is a difficult and perhaps even only marginally beneficial. Even if that is the case, the best producers do make cold calls when they have no other option. They also do everything they can to find other options and avoid the necessity of cold-calling. The most accessible and historically fruitful sources of opportunities are those customers the agency is already doing business with. Cross-selling within the agency is an obvious but frequently “not fully tapped” source of qualified business leads. A great additional source of leads is from existing customers who can, if effectively asked, provide qualified openings to their friends or peers within their industry. This is a source of business that many firms in the study believe could be better tapped. Finally, Centers of Influence (COIs) can also provide numerous leads and preferred access to fruitful opportunities. Common COIs include bankers, lawyers, accountants, investment bankers, business brokers, and real estate agents. Getting leads from these COIs involves more than simply knowing or having a relationship with them. They need to know what represents a qualified opportunity and proactively refer a client based on a high level of confidence in the referral’s capabilities.
The leading firms see the value in each of these sources of new business development and take the steps necessary to succeed in each. Success comes from (1) putting in place a process to facilitate leads and referrals, (2) training producers and staff on how to do it most successfully and (3) holding people accountable to do it. Success also comes when the party
Top Performer Perspective “It is pretty simple for us – we focus on specialization and cross selling.”
Top Performer Perspective “Our brand differentiation efforts have paid off as they have allowed us to differentiate ourselves from the traditional insurance broker.”
P a g e | 21
R e a g a n C o n s u l t i n g L e a d e r s h i p
S e r i e s
on the other side (producer handling the account, a customer or the COI) is motivated to get the opportunity to the producer. This happens most frequently when they have the confidence that an outstanding job will be done and they will not be embarrassed. Quality producers that can deliver superior products and services have an obvious advantage. The producers that are most successful in getting referrals also recognize that there is a “quid pro quo.” If they are going to ask people to do something for them, they need to be willing to do something in return, such as referring opportunities back to them. The successful producers invest in each of these areas and, as a result, get more qualified opportunities and write more business.
Top Performer Perspective “The majority of our new business comes from referrals from centers of influence and current clients. We ask for referrals constantly.”
P a g e | 22
R e a g a n C o n s u l t i n g L e a d e r s h i p S e r i e s
Sales Leadership – Essentia l Element #2: Creating a Culture of Accountabil i ty Once a firm’s producers are equipped with the tools and resources they need, the Top Performers do an outstanding job of holding their producers accountable. Accountability can take many forms. It includes a wide range of factors including to whom producers report and the tactics used to motivate and reward them for achieving results. It begins by clearly establishing the things for which they will be held accountable. Developing a Sales Plan As Stephen Covey recommended years ago in Seven Habits of Highly Effective People, “begin with the end in mind.” Sales leadership starts with this same objective by getting all of the producers in the organization to set specific and acceptable goals. The goal setting process was one of the activities most highly correlated to the success of the Top Performers. Agencies that are effective at goal setting grow roughly twice as fast as those that are not. Done properly, goal setting involves much more than just establishing a number for new business or for the size of the total book of business. Sales leaders also work with the producers to determine where each producer needs to focus his or her efforts (type, location and size of business to go after) and to determine what strategies they will use to go after it. With the demonstrated success of specialization (having producers sell in niches or practice groups), an effective goal-setting process gets producers focused in the areas holding the best potential for them. The coordination of sales plans for all producers in an agency assures that they are not “stepping on each other” and that opportunities are not being missed. The best sales plans include both activity goals and result goals. It is difficult to hold a producer accountable or even to know how best to support and equip them without effective goal setting. Producer Compensation Agency leadership teams have traditionally used a variety of tactics to try to motivate their producers to achieve superior results. Many have viewed the producer compensation model as a key to driving results. The theory is that a producer compensation program, if it includes just the right balance of rewards for high performance and punishments for poor performance, will lead to good results. This theory has been contradicted by numerous studies by behavioral psychologists (outside of our industry) that have shown that
Top Performer Perspective “The key has been to get our producers to sell smart – go after the right accounts, in the right way.”
P a g e | 23
R e a g a n C o n s u l t i n g L e a d e r s h i p
S e r i e s
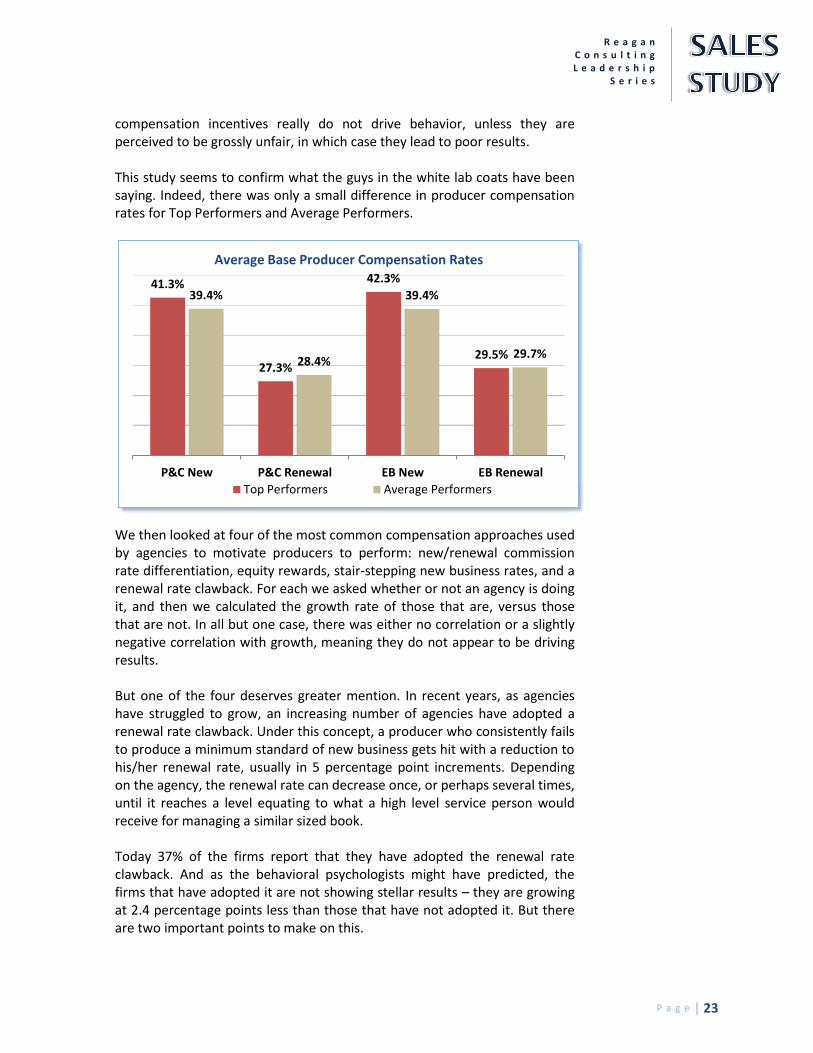
compensation incentives really do not drive behavior, unless they are perceived to be grossly unfair, in which case they lead to poor results. This study seems to confirm what the guys in the white lab coats have been saying. Indeed, there was only a small difference in producer compensation rates for Top Performers and Average Performers.
We then looked at four of the most common compensation approaches used by agencies to motivate producers to perform: new/renewal commission rate differentiation, equity rewards, stair-stepping new business rates, and a renewal rate clawback. For each we asked whether or not an agency is doing it, and then we calculated the growth rate of those that are, versus those that are not. In all but one case, there was either no correlation or a slightly negative correlation with growth, meaning they do not appear to be driving results. But one of the four deserves greater mention. In recent years, as agencies have struggled to grow, an increasing number of agencies have adopted a renewal rate clawback. Under this concept, a producer who consistently fails to produce a minimum standard of new business gets hit with a reduction to his/her renewal rate, usually in 5 percentage point increments. Depending on the agency, the renewal rate can decrease once, or perhaps several times, until it reaches a level equating to what a high level service person would receive for managing a similar sized book. Today 37% of the firms report that they have adopted the renewal rate clawback. And as the behavioral psychologists might have predicted, the firms that have adopted it are not showing stellar results – they are growing at 2.4 percentage points less than those that have not adopted it. But there are two important points to make on this.
41.3%
27.3%
42.3%
29.5%
39.4%
28.4%
39.4%
29.7%
P&C New P&C Renewal EB New EB Renewal
Average Base Producer Compensation Rates
Top Performers Average Performers
P a g e | 24
R e a g a n C o n s u l t i n g L e a d e r s h i p S e r i e s
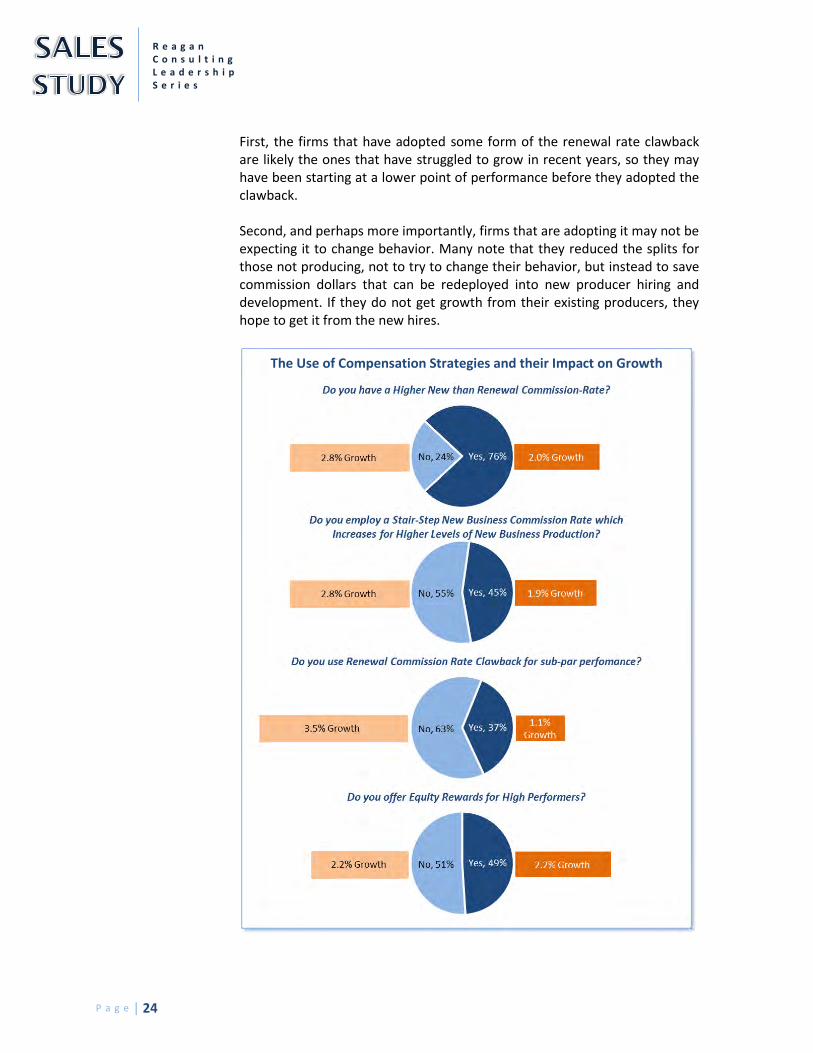
First, the firms that have adopted some form of the renewal rate clawback are likely the ones that have struggled to grow in recent years, so they may have been starting at a lower point of performance before they adopted the clawback. Second, and perhaps more importantly, firms that are adopting it may not be expecting it to change behavior. Many note that they reduced the splits for those not producing, not to try to change their behavior, but instead to save commission dollars that can be redeployed into new producer hiring and development. If they do not get growth from their existing producers, they hope to get it from the new hires.
The Use of Compensation Strategies and their Impact on Growth
P a g e | 25
R e a g a n C o n s u l t i n g L e a d e r s h i p
S e r i e s
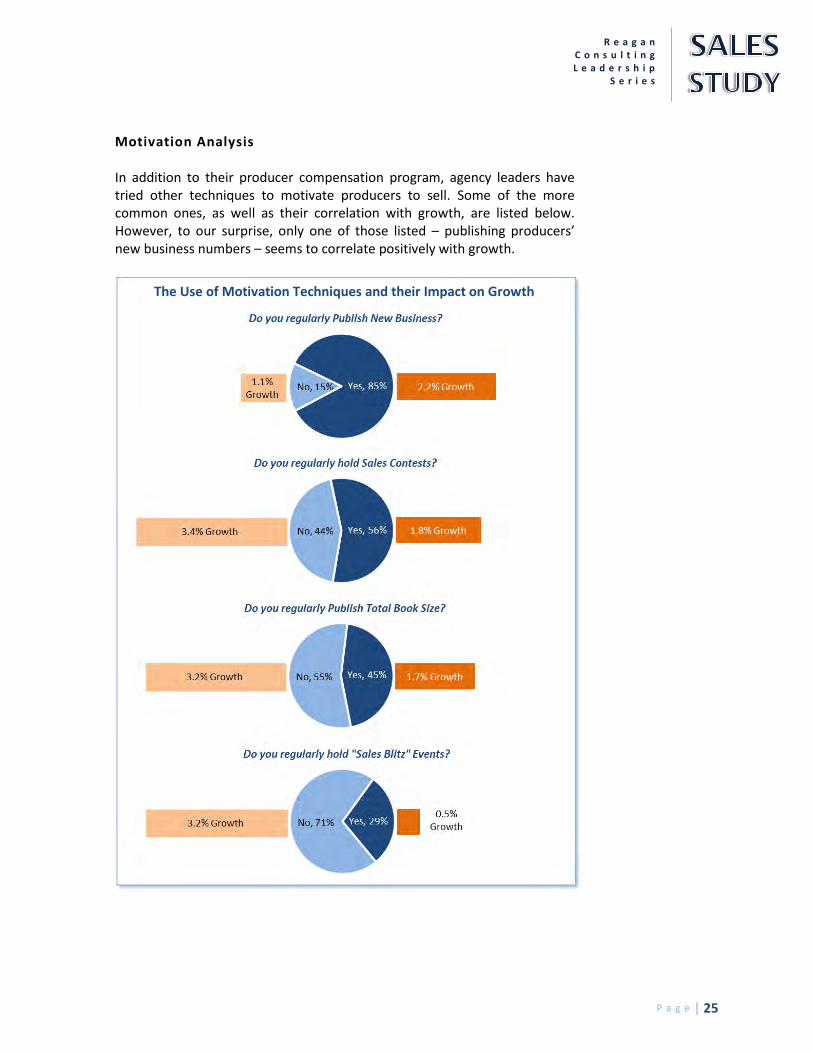
Motivation Analysis In addition to their producer compensation program, agency leaders have tried other techniques to motivate producers to sell. Some of the more common ones, as well as their correlation with growth, are listed below. However, to our surprise, only one of those listed – publishing producers’ new business numbers – seems to correlate positively with growth.
The Use of Motivation Techniques and their Impact on Growth
P a g e | 26
R e a g a n C o n s u l t i n g L e a d e r s h i p S e r i e s
Does a negative correlation suggest that a motivational technique regularly backfires and actually causes a lower level of growth? For example, does a “sales blitz” where an agency designates, say, one day a month for its producers to dedicate to prospecting, cause an agency’s producers to sell less? We think the answer is probably no. Rather, we suspect that firms that deploy these motivational tactics may be trying to address a recognized weakness in their sales culture and are thus starting at a lower base level of growth than the others in the study. Thus these time-honored tactics may be useful, but are more commonly used by struggling firms than by those that are prospering. In our experience, the highest performing firms are those that set high performance standards and then hold their producers accountable to those high standards. And it all starts with the agency’s leadership. If the leadership team of an agency is openly accountable to the standards it sets, the producers typically follow suit. In the end, accountability is less about motivational rewards and punishments than it is about upholding a standard that is lived out by the leadership team. How Top Performers Create a Culture of Accountability Thus far we have identified several things that, perhaps surprisingly, fail in differentiating the Top Performers from everybody else. So what are the real differentiators? The study results and our own experience with many of the Top Performers reveal seven things the Top Performers do to create a culture of accountability. The Top Performers are not necessarily similar in how they execute these seven practices, but they are consistent in getting them done and achieving superior results. The seven key business practices are as follows: 1. Someone has to own sales leadership – As noted earlier, the
participants in this study allow a lot of different people within their organizations to provide sales leadership. The common key to success is to have someone (or more than one) that is fully empowered with the authority to take responsibility for addressing each of the three key components of sales leadership. Some firms fall short by having a full-time sales manager that is not empowered and supported by the owners. Others have a person that has the authority but does not give these important functions the time or attention needed. Still others have the authority and invest the time, but unfortunately invest it in areas that do not drive positive results. The right person (or people), with the necessary authority, focused on the actions and business practices that drive results is key to creating the desired culture of accountability.
Top Performer Perspective “Our success is driven by the strength of our young producers, with sales management being provided by one of our management team members.”
P a g e | 27
R e a g a n C o n s u l t i n g L e a d e r s h i p
S e r i e s
2. Measure what you want to manage – Unless an agency has the ability
to measure key business development activities and results, it is very difficult to manage them. Top Performers measure results with a level of detail that allows them to understand what is happening. In addition to tracking new business written, they also track what accounts they have failed to write and why they failed. Further, while renewal results are important, Top Performers also want to know how changes in rate, exposure base, compensation and attrition (losing accounts) are impacting results. This is key because problems with renewal results are difficult to address without understanding the source of the problem. In addition to the results, it is also important to have the ability to measure and monitor the activity that will be needed to achieve the results. Many of these firms have increased the attention they give to pipeline management (both prospects and suspects), recognizing the pipeline is a key predictor of future sales success. Having the needed data requires developing the means to track the targeted activities and results and having the producers and staff disciplined enough to comply with the procedures put in place to gather that data. Many have found it easier to develop their own means of tracking activity than to get producers and staff to populate the CRM system with the needed data.
3. Manage what you measure – The Top Performers hold their producers accountable for results. If results are not being achieved, leading firms ratchet up accountability, monitoring and focusing on the activity that drives results. This is done in a number of different ways. Some sales leaders meet with producers on a weekly or monthly basis. Some have weekly, bi-weekly or monthly sales meetings to review and discuss results and performance. Some provide written feedback on the performance of each and all of the producers, which can have the added benefit of simultaneously providing perspective on how each producer compares with their peers. Many firms use a combination of these methods and frequently tailor the frequency and means to the needs of the individual producer.
4. Provide the Help Needed – When producers are falling short, the first
step is to find out why and provide them the help needed. For some this is more training or education. For others, it may need to be a change in their sales focus or strategy. Still others may need additional support or to be partnered with another sales person or technical resource that will help complement their weaknesses (and strengths). The best sales organizations find ways to help their producers succeed which may involve removing organizational obstacles the producer is facing or personal habits or actions that are limiting their success.
Top Performer Perspective “We have our entire team (Sales Execs and CL, Sales and Marketing Managers) focusing weekly on new business opportunities and the strategy to go after them.”
P a g e | 28
R e a g a n C o n s u l t i n g L e a d e r s h i p S e r i e s
5. Have the Courage/Will to Act – This is frequently the Achilles heel for quality agencies that are not achieving superior results. Too many firms are too tolerant of poor performance, particularly when it is coming from a senior producer or an owner. The Top Performers recognize that until they are willing to address non-performance their words and threats are hollow and ineffective. The willingness to act also involves properly recognizing the superior performance of the agency’s top producers. Treating the best and worst the same is a formula for mediocrity.
6. Elevating Expectations – Many of the Average Performers in this study
have average results because their producers are allowed to set average goals and management has average expectations. The Top Performers, on the other hand, have gotten there by “raising the bar” on performance. One of the best ways to make such a transition is to introduce into a sleepy group of producers a “race horse” or high performing producer who will redefine potential and excellence and light a fire under the rest of the producers. Complacency, comfort and acceptance of poor results are a common problem within many Average Performers. Great sales leadership frequently involves raising the bar on the definition of acceptable behavior and results.
7. Get Everyone Going in the Same Direction – Leading sales
organizations cannot be successful unless there is institutional buy-in to the need to be a real sales organization and to create a true sales culture. Those providing the actual sales leadership must be committed to it, but the ownership group must be totally committed as well. Trying to create superior sales results in an organization with a non-performing ownership group or senior producer group is extremely difficult, if not impossible. Top Performers’ senior officers and owners recognize they must not only support the creation of a sales culture, but they must also personally engage in and contribute to the sales culture.
Top Performer Perspective “The key to our success is a stronger focus on sales throughout the organization and increased accountability of producers for new business development.”
Top Performer Perspective “We changed our culture which required us to remove those sales and service staff that were not willing to make that change with us.”
P a g e | 29
R e a g a n C o n s u l t i n g L e a d e r s h i p
S e r i e s
Sales Leadership – Essentia l Element #3: Recruit ing and Developing New Producers The final piece of sales leadership is building the next generation of sales talent, which is an issue that has been front and center for the insurance distribution system recently. Over the past four years, agencies have faced the most challenging organic growth environment in a generation. In addition, with the Baby Boomer generation now retiring, many agencies are experiencing a decline in production capacity at a time when they can ill-afford it. In response, many have recently stepped up their efforts to invest in more producers. Reagan Consulting has developed a producer investment benchmark called the NUPP (Net-Unvalidated Producer Payroll). It is a simple metric that allows for comparisons in producer investments between agencies. It treats unvalidated producers as an investment portfolio and measures the difference between what an agency pays them and what their production would earn under the agency’s normal commission schedule. To benchmark between firms of various sizes, we then express the NUPP as a percentage of revenue. Based on data gathered, we have estimated the NUPP for each firm in this study. As many firms have learned, however, the NUPP is only part of the picture, since simply hiring producers carries with it no guarantee of success. In fact, those that abruptly ratchet up their hiring often see their efforts backfire, as a lack of experience and/or lack of resources for developing producers lead to failure. Thus, a high NUPP does not guarantee an effective investment in next-generation talent. The other key element in measuring producer investments is a firm’s success rate in developing producers. Another benchmark we have developed is the Producer Hire Success Rate, which measures the percentage of producers hired over the past five years who have, in the view of management, met the goals established when they were hired and are considered successful. This is a crucial concept because it captures three key variables.
1. Effectiveness in screening potential hires 2. Developing the producers who are hired 3. Retaining the producers who are hired
The best measure of a firm’s investment in producers is a combination of the NUPP and the Producer Hire Success Rate, since this captures both the magnitude of investment that firms are making in new producers as well as their ability to deploy that investment successfully. We call this metric the
NUPP Calculation
Formula:
Actual Payroll of
Unvalidated Producers
Minus
(Total Book of Business
for Unvalidated
Producers
Multiplied by
Agency Blended
Commission Rate)
P a g e | 30
R e a g a n C o n s u l t i n g L e a d e r s h i p S e r i e s
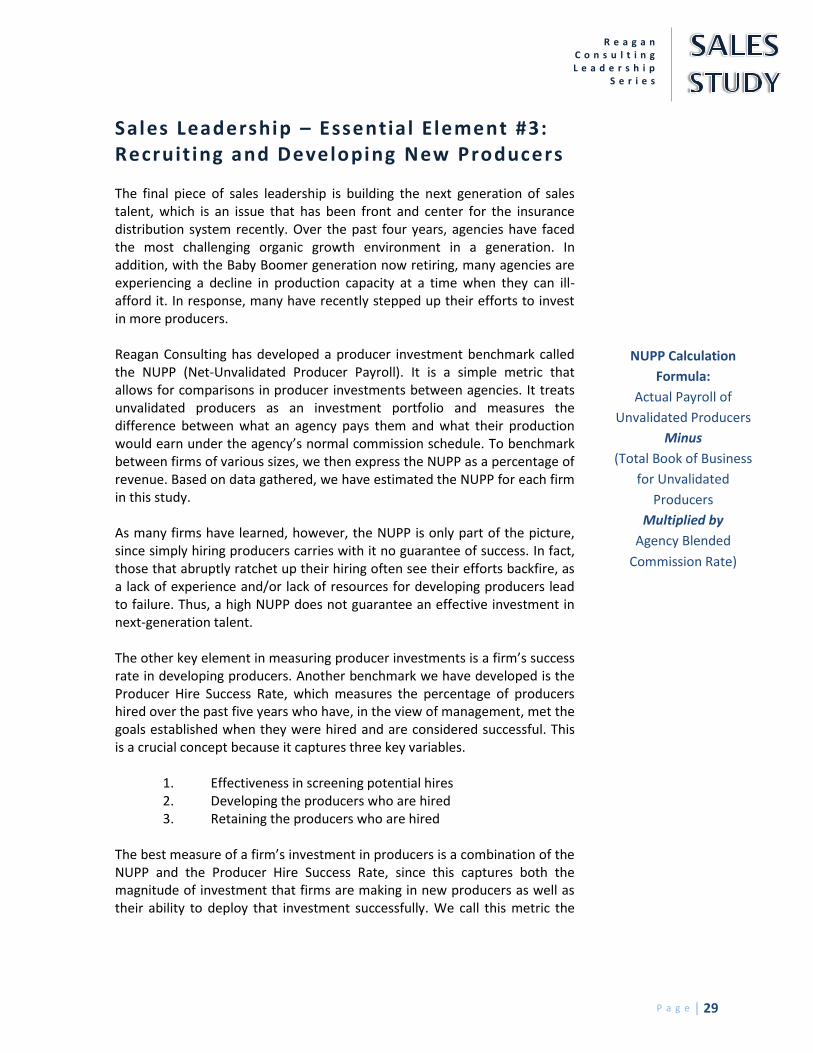
Effective NUPP, and it is calculated simply by multiplying the NUPP by the Success Rate. As we examined organic growth performance based on a firm’s Effective NUPP, a clear trend emerged – and not a surprising one: The Top Performers were superior in both parts of the Effective NUPP calculation. The chart below compares producer investment for Top Performers and Average Performers.
Making an Effective Producer Investment
Top Performers
2.0% x 58% = 1.2% NUPP Producer Hire
Success Rate Effective
NUPP
Average Performers
1.7% x 51% = 0.8% NUPP Producer Hire
Success Rate Effective
NUPP
The data seems to strongly suggest that a key to strong organic growth is an aggressive, but also effective, new producer hiring program. We corroborated this data by ranking the firms based on our estimated Effective NUPP calculations. The Top 25% of firms, based on Effective NUPP, grew almost twice as fast as the others. Where are the new producers coming from? Our survey asked participants about their targets for new producer hires. Specifically, we asked if they are targeting individuals within the insurance industry (frequently from a competing broker or carrier) or from some other industry. We also asked whether they are targeting individuals under the age of 30 or over 30. Since most firms tend to hire from a variety of sources rather than only one, we asked for their primary target for producer hiring. We view the primary target for producer hires as important because it becomes the focal point for investments in recruiting and for the development path. It is important to note, however, that firms also frequently hire producers outside of their primary target as opportunities arise.
Top Performer Perspective “We are hiring young producers from outside of the insurance industry and making them into superstars – we have proven we can do it.”
P a g e | 31
R e a g a n C o n s u l t i n g L e a d e r s h i p
S e r i e s
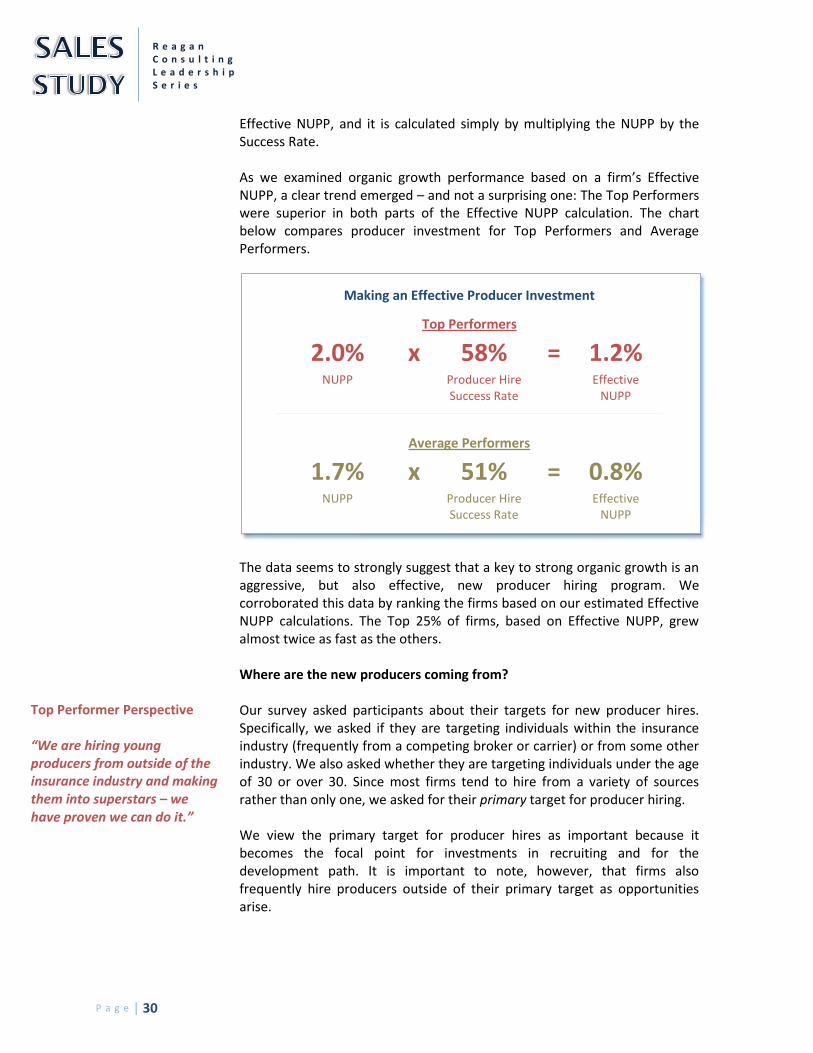
Firms were almost equally split in both categories. It was almost an identical split of inside/outside the industry and under/over age 30. However, within each bucket, there are clear preferences. Firms hiring producers under age 30 clearly prefer to hire from outside the industry while firms hiring producers over age 30 predominantly pursue candidates from inside the industry.
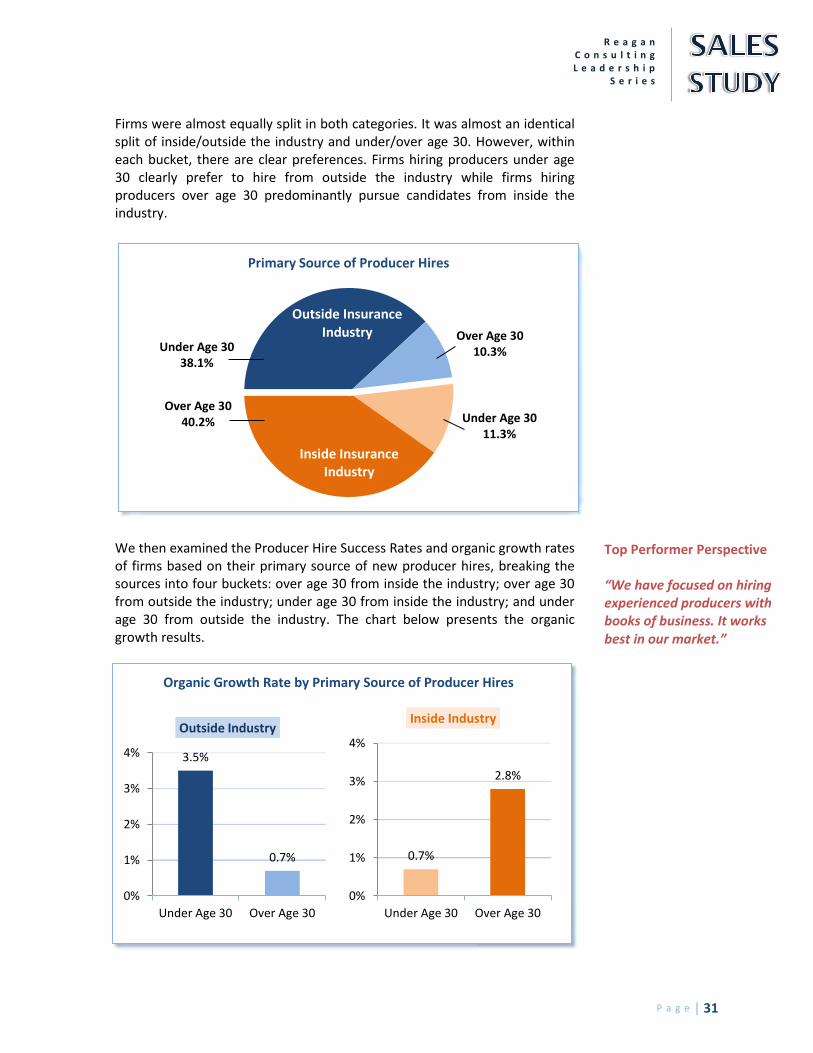
We then examined the Producer Hire Success Rates and organic growth rates of firms based on their primary source of new producer hires, breaking the sources into four buckets: over age 30 from inside the industry; over age 30 from outside the industry; under age 30 from inside the industry; and under age 30 from outside the industry. The chart below presents the organic growth results.
Primary Source of Producer Hires
3.5%
0.7%
0%
1%
2%
3%
4%
Under Age 30 Over Age 30
Outside Industry
0.7%
2.8%
0%
1%
2%
3%
4%
Under Age 30 Over Age 30
Inside Industry
Top Performer Perspective “We have focused on hiring experienced producers with books of business. It works best in our market.”
Outside Insurance Industry
Inside Insurance Industry
Over Age 30 10.3%
Under Age 30 11.3%
Over Age 30 40.2%
Under Age 30 38.1%
Organic Growth Rate by Primary Source of Producer Hires
P a g e | 32
R e a g a n C o n s u l t i n g L e a d e r s h i p S e r i e s
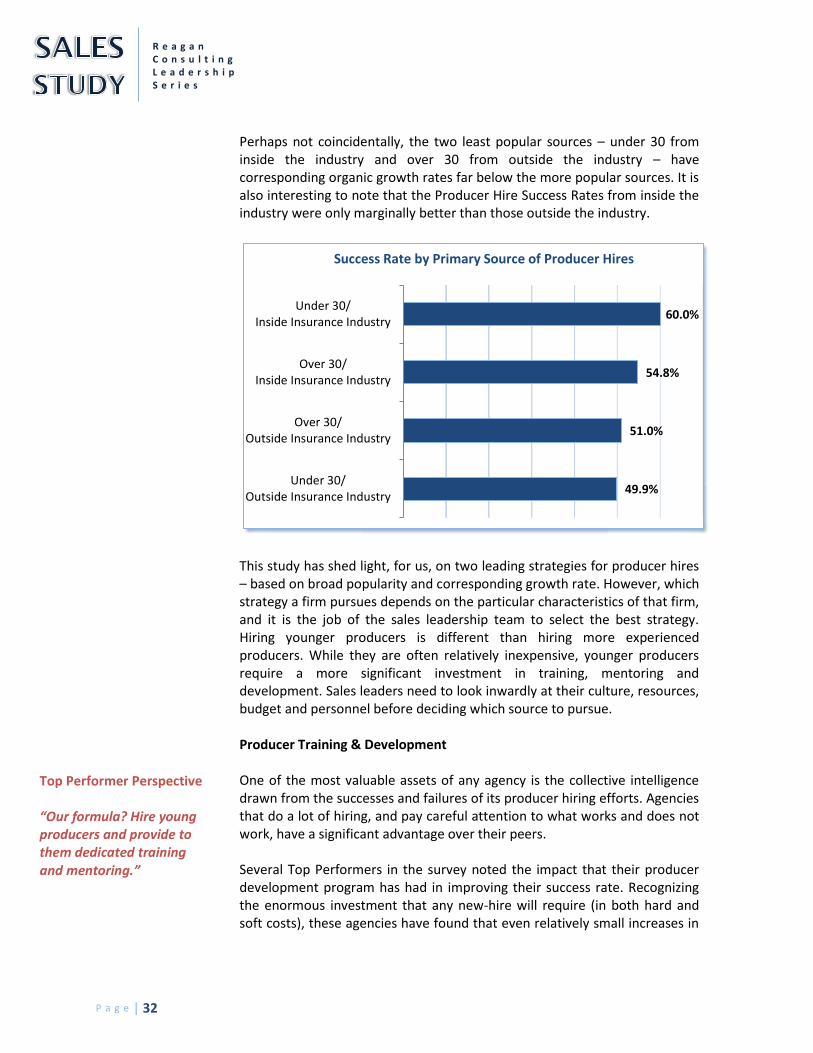
Perhaps not coincidentally, the two least popular sources – under 30 from inside the industry and over 30 from outside the industry – have corresponding organic growth rates far below the more popular sources. It is also interesting to note that the Producer Hire Success Rates from inside the industry were only marginally better than those outside the industry.
This study has shed light, for us, on two leading strategies for producer hires – based on broad popularity and corresponding growth rate. However, which strategy a firm pursues depends on the particular characteristics of that firm, and it is the job of the sales leadership team to select the best strategy. Hiring younger producers is different than hiring more experienced producers. While they are often relatively inexpensive, younger producers require a more significant investment in training, mentoring and development. Sales leaders need to look inwardly at their culture, resources, budget and personnel before deciding which source to pursue. Producer Training & Development One of the most valuable assets of any agency is the collective intelligence drawn from the successes and failures of its producer hiring efforts. Agencies that do a lot of hiring, and pay careful attention to what works and does not work, have a significant advantage over their peers. Several Top Performers in the survey noted the impact that their producer development program has had in improving their success rate. Recognizing the enormous investment that any new-hire will require (in both hard and soft costs), these agencies have found that even relatively small increases in
49.9%
51.0%
54.8%
60.0%
Under 30/Outside Insurance Industry
Over 30/Outside Insurance Industry
Over 30/Inside Insurance Industry
Under 30/Inside Insurance Industry
Success Rate by Primary Source of Producer Hires
Top Performer Perspective “Our formula? Hire young producers and provide to them dedicated training and mentoring.”
P a g e | 33
R e a g a n C o n s u l t i n g L e a d e r s h i p
S e r i e s
success rates can result in large investment returns. Gone are the days of simply giving a new producer an office and a phone book and telling them to go write something. Many of today’s Top Performers build sophisticated training and mentoring programs that cover a wide range of technical and sales skills and often reach into other areas as well, depending on the needs of the individual. A few observations about the leaders in producer development:
One of the advantages of client and/or product specialization is that each allows for faster and more meaningful producer development.
A producer development program should be built around the unique needs of the type of producer(s) being targeted. For example, the needs of those with insurance industry experience will differ from those without.
Establishing a mentoring program whereby experienced producers take responsibility for the development and success of one or more younger producers can materially enhance success rates.
Providing Sales Leadership - Producer Recruiting and Development As has been established, producer recruitment and development is a primary role of the sales leaders, but it is very important to put this responsibility in context. Full-time sales managers have achieved mixed success with a number of the failures coming as a result of firms hiring a sales manager and turning the entire sales leadership process over to them and expecting them to deliver. No single person is capable of doing it all, in any size organization. Sales Leadership may fall on one person which ideally means that there is one person that will own and drive the process, but the sales leader will also involve the active participation of the rest of the management and production team. While this concept is particularly important for producer recruiting and development, it further applies to all the essential elements of sales leadership. Sales leaders need to help the firm determine the plans, process and timing for producer recruitment– who are you going after (young inexperienced candidates, older experienced producers with books, etc.), how many should be targeted for hire, how you will position them in the organization, etc. The sales leader also needs to challenge and hold the other members of the firm accountable to help in identifying and screening candidates that will fit within that plan. Once hired, the responsibility to train, mentor and develop the producers should be overseen by the sales leader but it will be necessary to get many others involved in actually delivering the training and mentoring. If it falls just on the sales leader, the success will be limited.
P a g e | 34
R e a g a n C o n s u l t i n g L e a d e r s h i p S e r i e s
The sales leader needs to be the one within the agency/brokerage who is constantly thinking about, developing strategy for, and driving the recruiting activities of the firm. The firms that are able to have sales leaders devote this type of energy and effort to recruiting and development and the firms that are able to have sales leaders that get the other key members of the organization supporting and aiding the recruiting and development process will have a material competitive advantage that will go a long way in helping them to become a top performing sales organization. This is unlikely to happen without sales leadership.
P a g e | 35
R e a g a n C o n s u l t i n g L e a d e r s h i p
S e r i e s
The Impact of “DNA” When your doctor gives you a check-up, he or she investigates two types of factors that influence your health. One set of factors was given to you – inherited at birth – and you can do very little to change it. These factors may include how your body produces cholesterol or a family history of heart problems. The second set of factors, on the other hand, can often be changed based on your behavior. These factors may include your diet, exercise and stress level. Both sets of factors come together to create the total picture of your health. In discussing agency growth, we wondered whether a similar phenomenon exists. Specifically, is there a set of agency characteristics that, while beyond a management team’s immediate control, can influence growth? Can the basic “DNA” of a firm determine growth performance? In this final piece of the study, we investigated a few agency characteristics that are analogous to “DNA.” Specifically, we looked at a firm’s geographic presence and its book of business breakdown. While not quite as permanent as an individual’s genetic makeup, these characteristics are very difficult to change – especially in the short term. A management team can change its producer compensation schedule or its hiring practices tomorrow, but it cannot diversify its large concentration of benefits business in the same manner. Because of this, the “DNA” is viewed outside the scope of sales leadership, but it still exerts influence on growth. Location, Location . . . Location? For years, we have heard agents and brokers rationalize below-average growth performance by pointing to the struggles of their local economies. And certainly, these arguments are not without merit. We have tracked the influence of the U.S. recession on industry organic growth as reported in the OGP survey and there is certainly a correlation. Agent and broker organic growth dipped approximately six months after the recession began and slowly recovered after the economy began to slowly recover. This study corroborates this relationship in some ways, but also frees agents and brokers from it in others. We do not have a large enough sample size to analyze all 50 states but by focusing on three states which had several participating firms and also very diverse economic data, we can see how geography can influence growth performance.
Top Performer Perspective “It is all about sales culture and new business initiatives. There is no place for excuses about the state of the market or the economy.”
P a g e | 36
R e a g a n C o n s u l t i n g L e a d e r s h i p S e r i e s
State # of
Firms Included
State GDP Growth
(2007 – 2011)
Average State Unemployment (2008 – 2011)
Median Participant
Growth
% of Participants with Negative
Growth
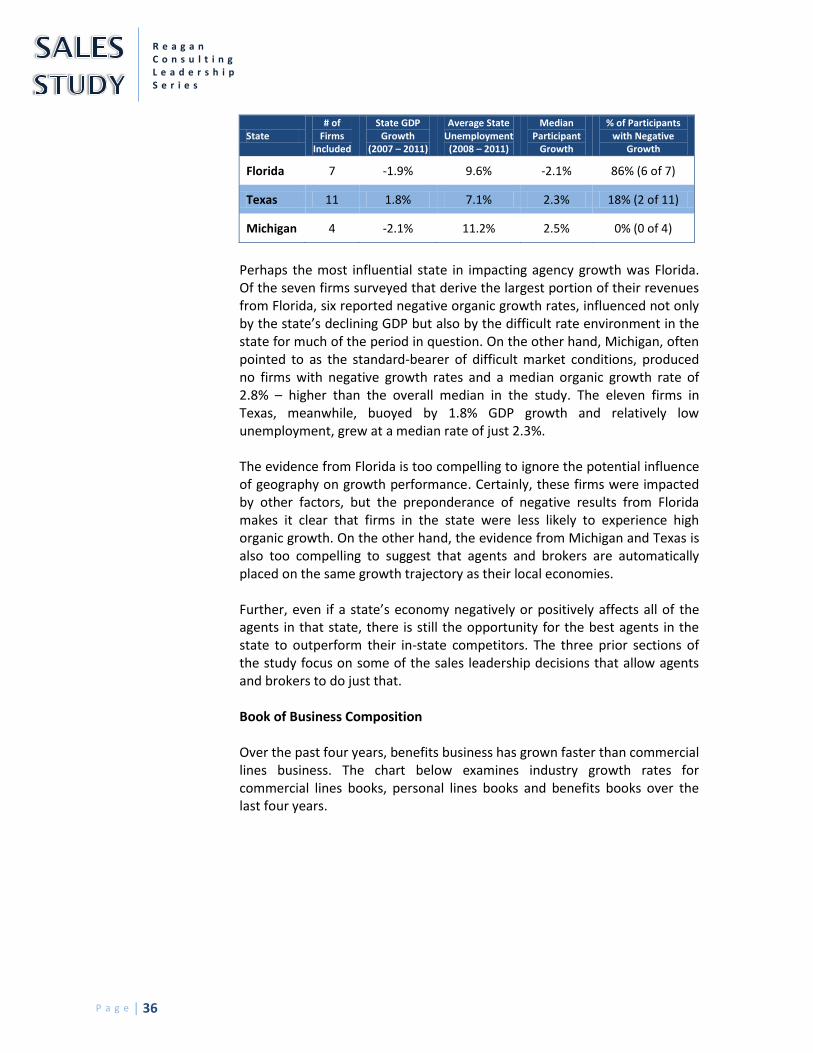
Florida 7 -1.9% 9.6% -2.1% 86% (6 of 7)
Texas 11 1.8% 7.1% 2.3% 18% (2 of 11)
Michigan 4 -2.1% 11.2% 2.5% 0% (0 of 4)
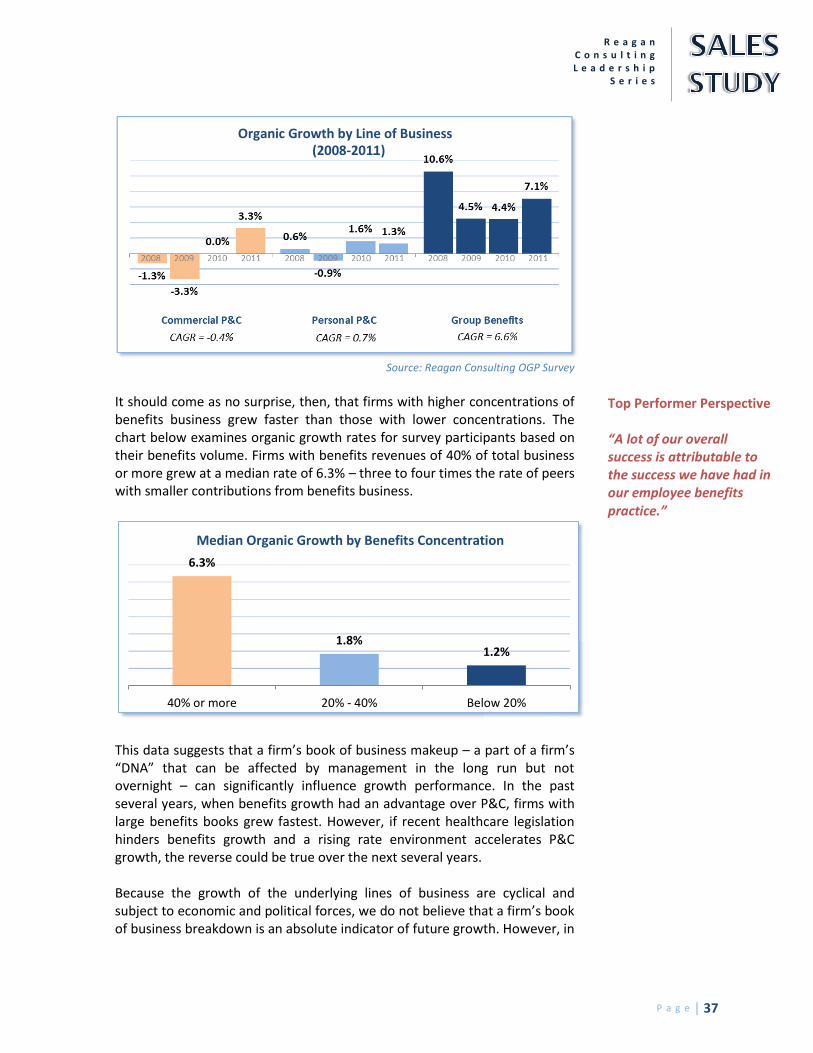
Perhaps the most influential state in impacting agency growth was Florida. Of the seven firms surveyed that derive the largest portion of their revenues from Florida, six reported negative organic growth rates, influenced not only by the state’s declining GDP but also by the difficult rate environment in the state for much of the period in question. On the other hand, Michigan, often pointed to as the standard-bearer of difficult market conditions, produced no firms with negative growth rates and a median organic growth rate of 2.8% – higher than the overall median in the study. The eleven firms in Texas, meanwhile, buoyed by 1.8% GDP growth and relatively low unemployment, grew at a median rate of just 2.3%. The evidence from Florida is too compelling to ignore the potential influence of geography on growth performance. Certainly, these firms were impacted by other factors, but the preponderance of negative results from Florida makes it clear that firms in the state were less likely to experience high organic growth. On the other hand, the evidence from Michigan and Texas is also too compelling to suggest that agents and brokers are automatically placed on the same growth trajectory as their local economies. Further, even if a state’s economy negatively or positively affects all of the agents in that state, there is still the opportunity for the best agents in the state to outperform their in-state competitors. The three prior sections of the study focus on some of the sales leadership decisions that allow agents and brokers to do just that. Book of Business Composition Over the past four years, benefits business has grown faster than commercial lines business. The chart below examines industry growth rates for commercial lines books, personal lines books and benefits books over the last four years.
P a g e | 37
R e a g a n C o n s u l t i n g L e a d e r s h i p
S e r i e s
Source: Reagan Consulting OGP Survey
It should come as no surprise, then, that firms with higher concentrations of benefits business grew faster than those with lower concentrations. The chart below examines organic growth rates for survey participants based on their benefits volume. Firms with benefits revenues of 40% of total business or more grew at a median rate of 6.3% – three to four times the rate of peers with smaller contributions from benefits business.
This data suggests that a firm’s book of business makeup – a part of a firm’s “DNA” that can be affected by management in the long run but not overnight – can significantly influence growth performance. In the past several years, when benefits growth had an advantage over P&C, firms with large benefits books grew fastest. However, if recent healthcare legislation hinders benefits growth and a rising rate environment accelerates P&C growth, the reverse could be true over the next several years. Because the growth of the underlying lines of business are cyclical and subject to economic and political forces, we do not believe that a firm’s book of business breakdown is an absolute indicator of future growth. However, in
6.3%
1.8% 1.2%
40% or more 20% - 40% Below 20%
Top Performer Perspective “A lot of our overall success is attributable to the success we have had in our employee benefits practice.”
Organic Growth by Line of Business (2008-2011)
Median Organic Growth by Benefits Concentration

P a g e | 38
R e a g a n C o n s u l t i n g L e a d e r s h i p S e r i e s
a historical examination of growth, this “DNA” feature was one of the most powerfully correlated characteristics studied. As we saw earlier in the study, effective cross selling is a driver of better organic growth. This certainly correlates to firms with higher percentages of employee benefits business as a large benefits book is often driven by cross selling with commercial P&C.
P a g e | 39
R e a g a n C o n s u l t i n g L e a d e r s h i p
S e r i e s
Key Findings When we started the Leadership Series research over a year ago, we did so with the express purpose of understanding what superior leadership looks like in the insurance brokerage industry. We decided to start with the senior leadership role and looked closely at those that were considered to be the best CEOs within our industry. We followed that with a look at those considered to be the best CFOs and those considered to provide the best Human Resource (HR) and Information Technology (IT) leadership. The final part of this series, and perhaps the most important part, is a look at sales leadership. As we got into researching superior sales leadership, it quickly became apparent that the majority of the firms that are achieving superior sales results (outstanding organic growth) are doing so without the benefit of a full-time sales manager. Recognizing this fact and wanting to take a broader look at what is driving the success of the top performers, we expanded the focus of this study beyond the best “Sales Managers” to a broader look at what the top performing sales firms are doing differently from their peers to achieve superior results. From the start we recognized that such a study would not be easy. We can readily determine who is achieving the superior results but there are dozens of interrelated variables that have the potential to impact those results and it is difficult to know what factors are actually causing the results to be achieved and how much of the results they are responsible for. We have theories and impressions about the behaviors that drive superior results but, as an industry, we really do not know. The research that we have done as a part of this study gives us a look inside these organizations that we have not seen before. Adding this new information to the research we have done in the past and the significant amount of knowledge that we have from our consulting work with many of the firms included in this study has given us the ability to draw some conclusions and establish some findings that we feel will be of great value to any firm wanting to know how to improve their performance as a sales organization. It is important for any firm to know where they should and should not make investments to improve their sales results. With this as a backdrop, here are the things that we discovered to be the Key Findings from this research:
P a g e | 40
R e a g a n C o n s u l t i n g L e a d e r s h i p S e r i e s
Don’t assume the answer to your growth woes is hiring a full-time sales manager.
There are some firms in this study that have excellent full-time sales managers and who are achieving superior results. Unfortunately, however, the majority of the firms with full-time sales managers are underperforming. In many of these firms this happens because they hire a sales manager and expect results to be achieved without having an institutional (sales leadership) commitment to do what it takes to turn sales around. At the same time, there are far more of the firms with excellent results that are providing sales leadership in a different but successful way. This is great news for many firms that have struggled with finding the right sales manager or are wondering whether they can afford one. Success in sales is achieved by addressing the three Essential Elements of sales leadership – and this is most commonly done by the existing senior management team.
The key question for most agencies, then, is determining who among the executive team is best suited to lead in the three Essential Elements and to ensure they have sufficient time to dedicate to sales leadership to ensure each is done well. For many, this may involve reorganizing some responsibilities to free up the necessary time to give sales leadership the attention it deserves.
Top Performers focus on building a core competency in producer recruiting and development.
The fastest-growing firms have made a commitment to producer recruiting and development despite the high cost – in both dollars and time – of doing so. These firms recognize that the financial returns of a producer investment program can be extraordinary. In this study, we found that the Top Performers had an effective investment in new producers that was 50% higher than the Average Performers. Top Performers both spent more on hiring producers and were more successful in converting these unvalidated producers to validated ones.
Success in producer hiring comes first from strategically selecting recruiting targets (young inexperienced producers, older experienced producers, etc.) based on what the market offers and what a firm is best equipped to handle. As a result, different hiring strategies will work best for different agencies, but the strong emphasis on producer hiring and development will be consistent. Following the hire, successful firms commit to developing producers through training, mentoring and effective sales leadership. Those agencies that focus on the ability to successfully recruit and develop new producers will have a long term competitive advantage.
P a g e | 41
R e a g a n C o n s u l t i n g L e a d e r s h i p
S e r i e s
Producer compensation may be a problem but it is definitely not the answer.
As this research (and other research) has confirmed, the answer to superior sales results does not come from having a better or more incentive-based compensation program. That said, we have seen compensation programs that have caused problems and have led to poor results. If compensation is too low, it can stymie an agency’s recruiting, or lead to producer attrition. If it is too high, it may limit a firm’s ability to provide the support and services producers need and will ultimately result in inadequate profitability. If compensation programs encourage wrong behavior (like not using value added services because it lowers the producer’s compensation) it can lead to poor sales. And if an agency pays “producer wages” to non-producing servicers, it will find organic growth increasingly difficult to achieve.
The Top Performers have compensation programs that are competitive and that encourage healthy behavior. They don’t fall prey to the illusion that a compensation program “tweak” will turn a bad producer into a good one or will, in itself, be a driver of excellent results.
And beyond compensation, the study shows that firms that emphasize certain sales activities such as sales blitzes, sales contests, and telemarketing seemed to have more than their fair share of poor organic growth. Upon consideration of this, we don’t believe these activities caused bad results or that they are negative in themselves. We theorize that many of the firms relying on these activities may be suffering from weak sales and are trying to stimulate better results.
Specialization is one of the clearest drivers of sustained organic growth.
Specialization, if done properly, can lead to increased account retention, better hit ratios and production of new business and improved profitability. We see a wide range of application of this strategy ranging from agents starting with a handful of accounts that they call a specialty to those firms that have dedicated producers and support staff and amplified product and service offerings within an area of specialization. The Top Performers find ways to provide a deep and sustained level of competitive advantage within their areas of specialization, and they are able to do so because their focus allows them to gain unique insights into clients’ needs.
Of course there is a downside to specialization. Too much focus on a single product or industry (e.g. construction) can lead to excessive vulnerability to the dynamics of a single industry. The answer to this challenge, of course, is not to remain a generalist but rather to avoid putting all of your “eggs in one basket.” Larger agencies have the ability to develop multiple areas of
P a g e | 42
R e a g a n C o n s u l t i n g L e a d e r s h i p S e r i e s
specialization and by doing so insulate themselves from industry specific challenges. Smaller firms cannot as easily diversify and must be a bit more cautious in looking at the health of the areas of specialization they choose.
Quality and professionalism of a firm’s producers may be the most important sustainable competitive advantage in the marketplace.
The Top Performers in this study said it and the data and statistics confirmed it: Organic growth begins with the quality of a firm’s producers. As we saw earlier in the study, the fastest-growing firms had producers with higher average book size and higher new business. This is not news, of course, and there are myriad other factors that contribute to organic growth. But in the end, producer quality – including their capabilities, professionalism and drive – may be the single greatest driver of organic growth.
We would also note that producer resources and support likely play a role in quality production. First, accessible, effective value-added resources facilitate producers’ delivery of professional service – and resource-building firms in the study grew significantly faster than their peers. In addition, it may be easier for firms to attract quality producers if they boast a powerful support and value-added resource platform.
Top Performers elevate sales to the point that it becomes the centerpiece of their culture.
The final question that we asked these 25 Top Performers was to identify the single greatest factor contributing to their sales success. One of the most frequent answers was their ability to create and sustain a “sales culture.” It was not a surprise that this was one of the most frequent answers given but, to the reader that does not have a sales culture and wants one, this answer may not seem very helpful. It is a bit like being told to be happy. What we have found from this study and from our work with leading agents and brokers is that sales cultures are the by-product of a number of steps beginning with having the “right person” within the firm take ownership of sales and delivering each of the Essential Elements of sales leadership.
As we have shared in the study, those providing sales leadership need to “measure what they want to manage” and “manage what they measure.” Sales leaders need to have the courage and will to make the tough decisions to address non-performers and elevate those that are able to perform. They need to stretch and push, encourage and support and give their producers the help they need to succeed. And by doing this over time, with consistency, they begin to raise the performance bar and elevate the results being achieved. For the Top Performers, sales is the lens through which all other decisions are made. It is at this point that they have set the foundation to create a “sales culture” that can in fact be a defining difference between the Top Performers and those that are not.
P a g e | 43
R e a g a n C o n s u l t i n g L e a d e r s h i p
S e r i e s
How Agents and Brokers Can Benefit From This Study We initiated this study not knowing exactly where it would lead us. Some of our assumptions about effective sales management were confirmed. Additionally, we identified a number of practices that, while not harmful, do not appear to be driving superior results. For the agency principal reading this study, being aware of both the things that are and are not driving superior results is of value. In addition to our Key Findings, here are a number of things for you to consider: Know yourself For any agency principal, the starting point is self-assessment. What have you been doing, what are you doing and what kind of results are being achieved? For some, this will require a much deeper look than has taken place historically and a better analysis of operating metrics. How does your historical organic growth compare? What about new business versus retention rates? What kind of investments have you made in new producers (NUPP) and what kind of success rates have you had in the investments you have made? The analysis sections of this study will provide some useful incites as you self-assess. But we would also recommend taking time with each of the Key Findings to assess where you are today versus where you feel you need to be. We would encourage you to involve your team in that process. Your producers and staff will appreciate being asked and being involved and they may have better insights on many of these issues than you or other members of the senior management team will have. In addition, if changes need to be made, which is likely, they will better support those changes if they have been a part of the process. We would note that this study identifies the factors that differentiate the Top Performers. It is beyond the scope of this study to provide a comprehensive manual on how to execute within each of the areas addressed. There are other resources available through Reagan Consulting and other sources throughout our industry that can help provide the greater level of detail within each area. Superior organic growth comes from two places We see from the research that over the last four years the Top Performers had organic growth results that were 7.3 percentage points higher than the average of the rest. We also saw that 56% of this superior growth came from higher new business generation, with the remaining 44% coming from
P a g e | 44
R e a g a n C o n s u l t i n g L e a d e r s h i p S e r i e s
superior renewal and retention results. Whether it is 40/60, 50/50 or 60/40 splits, the Top Performers find a way to achieve superior results in both areas. It is not all just new business. It is almost impossible to outrun poor retention results. Also, high new and low renewal results most typically lead to a big reduction in profitability. Conversely, extremely high retention and low new business results can positively impact profitability but they rarely result in outstanding growth and long term profitability. It doesn’t matter what kind of market you are in The results of this study and other research we have done, confirms that there are factors affecting agent’s organic growth results that are largely beyond their control. If you have an agency in a state that has very unfavorable economic conditions, there is not much that you can do about that (other than move or develop sales initiatives in other markets). Those economic conditions may affect your ability to achieve the growth rates being achieved by Top Performers in other parts of the country. But they will not affect your ability to materially outperform the agents and brokers in your state and that is all you really need to care about. You can still do what is within your control to achieve superior results relative to the firms in your market. They may not be industry leading results but they will be superior results relative to what your peers and competitors in your market are achieving. The economics of superior growth As the data validates, the ability to achieve superior organic growth results does not have to come at the expense of operating profitably. These Top Performers are typically operating at profit levels at or above their lower performing peers. The higher performance of the Top Performers’ producers provides the funding for outstanding support and value added services for producers without compromising profitability. If you have an agency in which your producers (all of them or just a portion) are underperforming and you don’t have the economic margin to provide the support and value added services that your producers ideally need, you are at an impasse. This lack of economic margin will also affect your ability to invest in the recruiting, hiring and development of new producers. Agencies in this situation may have to take a step backwards on current profitability and make the investments needed to elevate performance. When that performance is achieved, the margins should improve.
P a g e | 45
R e a g a n C o n s u l t i n g L e a d e r s h i p
S e r i e s
Employee Benefits As for investments in Employee Benefits, the future is obviously clouded as a result of health care reform. Reagan Consulting is not of the opinion that the “end is near” but we do recognize that change has come and is coming and agents and brokers will need to be ready to adapt and perhaps enhance their product offerings and their servicing strategies. Historically, change creates opportunity and those that are best equipped to embrace and adapt to those changes will be best positioned to prosper. This ability to embrace and adapt will be a material factor in determining who will be positioned to achieve sales success in this space in the future. There are answers that are right for you It is important to also recognize that of the high performing firms that we looked at in this study, none of them have achieved their success in exactly the same ways as the others. There are a lot of common traits and characteristics which we have highlighted but every firm has a unique combination and application of those traits and characteristics based on their history, marketplace, personnel and goals and objectives. Our encouragement is to learn from the experience of the Top Performers but to find the combination of strategies that is right for you. We would also note that none of the firms that we have looked at in the study would ever suggest that they are “hitting on all cylinders.” As many things as they are doing right, they recognize that there are a lot of things that they are still not doing as well as they could. This is not offered as a criticism but really an encouragement. If they can achieve industry leading results and still have room to improve, just think what they can do when they really get their act together. What smaller agencies do with these Findings The primary research conducted for this study focused on 100 firms all with commission revenues of over $5 million. We investigated the larger firms because they provide a greater opportunity to test the relative impact of various sales and growth strategies. However, the results and finding of this study are immensely applicable for smaller firms. While they are more susceptible to the success (or failure) of one or two producers, firms under $5 million in revenues can also learn from this study. We believe that all of the key findings outlined earlier in this study are relevant for smaller firms. But below we have identified particular takeaways for smaller firms, highlighting any differences in applicability from larger firms.
P a g e | 46
R e a g a n C o n s u l t i n g L e a d e r s h i p S e r i e s
Just like larger firms, smaller firms do not need a sales manager but do need sales leadership. In fact, a $1.5 million commission revenue agency needs sales leadership just as much as a $30 million agency. Smaller firms often have smaller executive teams, and the key owners and leaders in a smaller firm can find themselves being pulled in many different directions. However, sales leadership is the most important task for these executives.
Specialization is relevant but perhaps more difficult. Smaller firms can realize the same benefits of specialization as larger firms. If you are a small firm looking at building specialty practice groups, it is important to realize that you will not likely be able to build the same number of practices – complete with resources and producer focus – as larger firms. And the practices that are built will likely represent a larger portion of revenues. As a result, smaller firms that seek to specialize should choose wisely. A specialty practice in a struggling industry – like construction – is likely to have a greater influence on a small firm than a larger, more diversified firm.
Sales strategy is critical. It may not be wise to have a benefits producer in a small firm develop a business plan to go after self-funded accounts needing actuarial, claims adjudication and loss control services if your agency is not of a size to be able to provide or secure those services. The sales leaders in smaller firms must play a critical role in focusing the firm’s production force.
Producer recruiting may not be as frequent in smaller firms, but it is no less important. Larger firms may hire classes of producers every year while a smaller firm may hire a producer every other year or even less often. However, each producer hire in a smaller firm is critical, as it represents a significant investment in growth. Smaller firms need to pay special attention to their primary hiring strategy. If your firm needs to hire a new producer but does not have the time or ability to put together a training program, the firm’s focus should probably be on producers that have sales and insurance experience
Producer compensation may be more important in smaller firms. Attracting quality producers usually comes down to a mix of compensation, resources, equity opportunity and brand. While smaller firms do not have to be at a disadvantage in any of these areas, it is often easier for larger firms to compete on the basis of resources and branding. As such, it is important that smaller firms not be deficient in producer compensation and the opportunity for equity.
Perspective From a High Performing Smaller Firm “We started our agency from scratch 5 years ago. We hired great people. We were smart in how we set it up. We are going after business we are well suited to write. Our future looks great.”
P a g e | 47
R e a g a n C o n s u l t i n g L e a d e r s h i p
S e r i e s
Acknowledgements The Reagan Consulting Leadership Series was conceived, conducted, written and produced by Reagan Consulting in an effort to stimulate meaningful discussions concerning leadership and to provide information and resources that can help senior officers of insurance agencies improve their performance. In addition, it is our intent to provide information and resources that help in the successful development and selection of the next generation of agency leaders. The future of our industry and, more specifically, the future of every agency and brokerage depends upon the quality of its future leadership. It would not have been possible for us to conduct and produce this study without the backing and support of the following key strategic partners to the agent and broker community. These firms, through their financial commitment to this study, have tangibly demonstrated their support for the agents and brokers they serve and for our industry as a whole.
We also want to express our thanks and appreciation to The Council of Insurance Agents & Brokers for its sponsorship and support of this study.
In addition, we want to thank the many insurance industry leaders that provided thoughtful nominations of the top sales leaders. And finally, to the individuals that participated in the study, we offer our gratitude for your willingness to thoughtfully and candidly respond to our exhaustive questions. Congratulations to each of you for being recognized as an outstanding industry leader.
P a g e | 48
R e a g a n C o n s u l t i n g L e a d e r s h i p S e r i e s
This study was conceived, conducted, written and produced by Reagan Consulting, with the financial support of the study sponsors. Reagan Consulting and the sponsors have produced this study in order to motivate, guide and enable agents and brokers to become outstanding sales organizations for the benefit of all of their stakeholders – their customers, employees, owners and carrier trading partners. Copies of the Sales Study can be obtained from the sponsors of the study or from Reagan Consulting. All rights to this study and all research performed by Reagan Consulting are reserved. Reagan Consulting has produced other research and on-going studies including:
The IIABA Best Practices Study (performed annually)
The ABIA Study of Banks In Insurance (performed biannually)
The Organic Growth and Profitability Study (performed quarterly)
The Young Producer Study (2009)
The Young Producer Study Update (2012)
The Private Ownership Study (2010)
Leadership Series – CEOs (2011)
Leadership Series – CFOs (2012)
Leadership Series – IT and HR Leaders (2012)

www.ReaganConsulting.com
One Piedmont Center, Suite 500 • Atlanta, Georgia 30305Phone: 404.233.5545 • Email: [email protected]