sales force optimization: a self...
TRANSCRIPT
Copyright 2011, All Rights Reserved Page 1
Sales Force Optimization: A Self Assessment
Glen S. Petersen

Sales Force Optimization: A Self Assessment
Copyright 2011, All Rights Reserved Page 2
Table of Contents
Chapter 1 Introduction ................................................................................................................ 3 Chapter 2 Sales Force Optimization ........................................................................................... 5 Chapter 3 Trends That Impact Sales Force Performance ......................................................... 6 Chapter 4 Stakeholder and Customer Needs ............................................................................ 9 Chapter 5 Foundational Concepts and Terminology ................................................................11 Chapter 6 The Drivers of Sales Force Optimization .................................................................16 Chapter 7 Assessment Model Overview....................................................................................19 Chapter 8 The Assessment .......................................................................................................21 Chapter 9 Interpreting the Results ............................................................................................32 Chapter 10 Innovation ...............................................................................................................33

Sales Force Optimization: A Self Assessment
Copyright 2011, All Rights Reserved Page 3
Chapter 1 Introduction The profession of sales has traditionally operated with a certain mystique, lending an aura as an art form. At some level, this mystique is probably accurate in that many sales organizations are often unaware of what is working and why. This condition is reflected in budgeting and planning processes where revenue increases are loosely tied to strategies and budgeting is extrapolated on history as opposed to cause and effect. Though these techniques have worked in the past, the competitive landscape is changing at a speed that demands insight and will penalize those who operate on hope. Success will be predicted on the ability to position a relevant value proposition and deliver said value at a superior level of profitability. These demands imply the ability to maximize the impact of the sales force, in other words, create and sustain optimal performance. Historically, Chief Sales Officers (CSOs) have been held accountable for the following:
• Achieving a revenue target • Successfully launching new products • Acquiring new customers • Leading the sales force • Expanding business with existing customers • Increasing market share • Developing people • Managing sales expense • Being a cheerleader for the sales force • Being a senior level contact for customers • Championing the needs of customers
Though these responsibilities remain important to the CSO, organizations increasingly need more insight regarding customer needs and business models to effectively create competitive strategy and tactics. Sustained success will depend on the ability of organizations to out-innovate competition. This implies more than simply new products and services but the entire mode of doing business. Where is the insight to make such transitions going to come from? The CSO must be in a position to provide input to this process and have the ability to morph the sales function into the value add capacity demanded by new strategies and do so while optimizing performance. This is a quantum leap in capability for any CSO and it will not be accomplished without establishing tools and disciplines today that form a foundation for the future. These challenges are significant in their own right. However, there is a bewildering layer of technology that offers opportunities while injecting equally potential dangers. Watching events play out may not be a viable option in the future. Insight and action are the operational demands of the future. Technology can be a component of success but only if it is applied in a manner that leverages how one desires to operate the business. This book (assessment) is meant to be a work in progress in that it is the author’s desire to offer a framework for organizations to use as a basis for stimulating dialogue regarding competitive and operational needs. Though the assessment is fairly lengthy, it undoubtedly misses some key components for certain industries and the author encourages feedback or questions regarding any aspect of its content.

Sales Force Optimization: A Self Assessment
Copyright 2011, All Rights Reserved Page 4
The assessment itself is the creation of the author based on insights gained from clients and seminar participants. The assessment is included in Chapter 8 and is followed by a chapter that discusses the interpretation of the results. Obviously, the reader can proceed directly to the assessment but doing so will diminish the value of the results because the structure and content of the assessment are based on principles that are outlined in Chapter 2 through Chapter 7. Chapter 2 introduces the concept of optimization and provides a perspective for identifying constraints that interfere with optimization. Some of these constraints may be justified while others may not even be recognized as constraints (that reinforces the need for an assessment type format to challenge one’s thinking). Chapter 3 reviews major trends that impact sales performance and will accentuate the liability of unaddressed constraints. Chapter 4 introduces the first set of principles that form the framework for the assessment. These principles are based on the perceived needs of stakeholder groups and customers. The reason for including this perspective is to reinforce the idea that optimization entails more than simply productivity metric. Chapter 5 is designed to clarify terminology used in the assessment. This is a key chapter because terms like sales process can have many meanings according to one’s training and experience. The assessment consists of 100 statements that are built on the principles set forth in this chapter. Without the perspective of this chapter, the reader may misinterpret the intention of various statements. Chapter 6 summarizes the preceding chapters and organizes the concepts as they will be presented and applied in the assessment. The assessment is structured into ten categories. The categories are based on operational themes that are intended to offer an intuitive framework for taking action. Though the assessment attempts to segregate issues into categories, it is virtually impossible to be surgical in this endeavor. Chapter 7 is dedicated to providing instructions regarding the mechanics of completing the assessment. Although the interface is simple, the assessment is structured to capture the input in a specific manner so as to provide the maximum benefit. Chapter 8 contains the actual assessment and it is designed to provide basic arithmetic functions for the user. Once completed, the reader should think about the implications and refer to Chapter 9. Chapter 9 reinforces the maxim that the assessment is about creating dialogue, not matching numbers. There are likely to be some low hanging fruit that can be acted upon quickly; on the other side of the equation there will be items that require more time to assess and correct. The important issue is to gain consensus and more ahead in a disciplined manner. Chapter 10 wraps up the book with an admonition to seek insight and act upon it. Competitive superiority in the longer term is created by insight and action. Sales force optimization is not about the numbers as much as it is about the insights and leveraging opportunities.

Sales Force Optimization: A Self Assessment
Copyright 2011, All Rights Reserved Page 5
Chapter 2 Sales Force Optimization The idea of optimization is to generate the maximum benefit from a given resource subject to certain constraints. For start-up companies, the constraints are often painfully evident; these relate to cash, productive capacity, investor expectations, and finding early adaptors. Sales force optimization becomes obvious; how much revenue can a sales person bring in and how many can we afford? As businesses grow, the complexity of these decisions expand substantially as cause and effect become clouded in a myriad of products/services and customer types. Many organizations settle into a comfort zone of budgeting sales requirements on the basis of a percentage of revenue; this is a control mindset as opposed to maximization. The real danger of this management perspective is that the underlying assumption is the validity of extrapolation on historical behavior. Certainly, this is not a path to competitive advantage. Optimization demands an understanding of what elements of the sales force are more productive and why. It also demands using this insight to leverage current effort and create winning strategies in the future. How an organization accomplishes this task is unique to the organization and therefore represents one of the most powerful means to competitive advantage because the create use of people is difficult to duplicate. One analogy that may help to understand the dynamics of the sales force is that of a pipeline. The flow through the pipeline represents revenue. To make the point, assume that each sales person is a separate pipe so the total revenue is the collective throughput of the pipes. All of the things that dilute sales effort (including the skills and motivation of the sales person) can be thought of as choke points that narrow the diameter of the pipe and slow the flow. Since the diameter of the pipe dictates flow, the stars of sales have managed to minimize chokepoints that impact the other sales people. Initiatives that treat symptoms of choke points but do not remove the most restrictive ones will have little to no effect. Optimization implies removing all of the choke points. As observed earlier, how an organization reaches optimization is not a cookie cutter issue. However, the impediments (choke points) tend to fall into certain categories and this allows the creation of a meaningful assessment for a wide assortment of industries. The assessment consists of a series of statements that reflect generally accepted best practices/sound principles; the reader is then challenged to assess whether the statement applies to her organization/industry, if yes, then how close are current practices to the implied standard? Perceived separation in alignment are recorded as a gap score; the larger the number, the larger the gap. At the end of the assessment, the reader or a group of stakeholders can relate specific situations to the gap scores and start to develop a game plan for improving performance.

Sales Force Optimization: A Self Assessment
Copyright 2011, All Rights Reserved Page 6
Chapter 3 Trends That Impact Sales Force Performance The purpose of this chapter is to briefly review the sources of change in the competitive marketplace and the constraints/opportunities that these pressures represent to the role and conduct of the sales force.
1. Globalization Multi-national corporations have existed for decades but what has changed is the trend to concentrate unique responsibilities within individual countries. This complicates sales strategy and coordination logistically and affects how one does business. Decision making and the interdependence of economies also impact the sophistication of the sales response. For example, companies in the auto industry have concentrated design and manufacturing for certain types of autos close to the markets that buy the most of that vehicle. 2. Outsourcing Many companies are following cost reduction strategies that essentially outsource all functions that are not considered core to the business. This change impacts where one can sell certain products/services and may impact the definition of a viable solution. On the other hand, outsourcing seldom occurs without complications and this could represent an opportunity. For example, when companies started outsourcing to China and India, consulting companies sprang up that offered services to connect the two parties. 3. Regulation/Deregulation Regulation introduces constraints, policies, and reporting which typically add cost. Streamlining these processes add value and productivity. For the sales force, the existence of regulation can be managed to minimize cost or it can represent an opportunity for value add. Deregulation typically implies moving from a non-competitive market position to a competitive market environment. Opportunities often revolve around being first in the market with new ideas. For example, used aircraft parts represent a huge cost savings versus new; however, safety regulations demand tracking the source and worthiness of these parts. Managing the reporting regulations for customers offers a competitive advantage. 4. Buying Strategies During the 1990s, there was a movement that recognized the strategic importance of the purchasing function. This led to the creation of Materials Management and changed many facets of procurement processes and policies. Some of these changes involved selection committees and the reduction in the number of suppliers. In the retail industry, Wal-Mart championed the concept of forcing supplier’s with multiple divisions to represent these businesses with a single point of contact. Another example is hospitals that have consolidated purchasing into buying groups. These changes have dramatically challenged sales force sophistication and placed increased pressure on the value/price relationship. 5. Beyond Sizing During the 1980s and early 1990s most companies went through a process affectionately referred to as right-sizing, reengineering, or simply down-sizing. Ultimately, companies realized that they were left with a staff that no longer had key

Sales Force Optimization: A Self Assessment
Copyright 2011, All Rights Reserved Page 7
insights and knowledge to run the company. Former employees were rehired as “consultants” to ensure that the company had the expertise to continue running. Under these conditions, employees assumed the posture that there was not enough time in the day to handle all the work. In today’s economic times, companies have reduced staff even more and are reluctant to hire due to uncertainty regarding regulation and strength of any recovery. Thus, employees are further stressed and reluctant to entertain new ideas due to risks of suggesting that they have the bandwidth to manage other initiatives. For the sales force, these conditions challenge quota setting and quota achievement. On the positive side, sales forces that operate with a convincing value proposition are more likely to gain access to decision makers that have the pain addressed by the supplier. Likewise, in a down economy, initiatives that have a solid ROI have a greater potential for successful sales than those that do not. 6. Ethical/Environmental Concerns There is increased sensitivity to the environment and how business is conducted today. Mis-cues can gain instantaneous notoriety through the formal and informal links of social networking. The sales force must be equipped to have meaningful dialogue regarding these issues. 7. Technology The advance and proliferation of technology is a fact of life. For the sales force, there is a vast array of software and hardware that have the potential to leverage effort. However, these same technologies enable customers and prospects to form opinions regarding companies, products, and individuals that can be positive or negative and act accordingly. Fair or unfair, these technologies impact the buy process, selling process, and the nature of products and services. 8. The Rate of Change As this e-book will demonstrate, the management of a sales force is a very complex challenge. Some changes to the sales force require a three year time-horizon to fully evaluate; yet business may change even faster, operating on an assumption of steady-state is ludicrous. The sales force and its management must be able to operate from a position of adaptation as an element of optimization.
Recognizing these trends versus effectively managing in this environment are two separate issues. It is generally understood that the VP of Sales must morph into a CSO role. This type of shift has occurred in marketing (CMO), technology (CTO), security (CSO), and information technology (CTO). The drivers for these changes are the need for an enterprise perspective and the ability to impact corporate strategy and policy. The CSO role is vital to communicating the realities of the marketplace to the entire organization and that the delivery of value encompasses virtually the entire enterprise. However, the current level of initiatives is failing to create consequential results as reflected by the following statistics:
• 73% of CMOs say that solution value messages are not reaching customers • 92% of product managers have difficulty defining the customer’s problems and causes • 90% of sales people have difficulty with the business solution conversation

Sales Force Optimization: A Self Assessment
Copyright 2011, All Rights Reserved Page 8
• 90% of marketing collateral is considered useless by sales • 70% of the leads generated by marketing are never followed up on
These statistics suggest that there is a huge gap separating where organizations wish to be operationally. The question is, where to begin and what to fix? Completing the assessment helps to differentiate symptoms from causes. It does not offer solutions directly, but it will provide a sense of the relative importance of each issue which is a first step to creating an action plan.

Sales Force Optimization: A Self Assessment
Copyright 2011, All Rights Reserved Page 9
Chapter 4 Stakeholder and Customer Needs Sales force optimization occurs in a context and is subject to various constraints. One approach to optimization would be to simply view it as a productivity issue; but this would be short-sighted. Who are the beneficiaries of sales force optimization and what are their needs and expectations? If optimization is approached as simply a productivity issue, then the approach will follow a pure economic line of thinking. However, if optimization is approached from a value prospective, the issue becomes one of delivering required value add in the most cost effective manner. This perspective is consistent with long-term competitive advantage. For discussion purposes, the relevant constituencies will be defined as:
• Shareholders • Senior Management • Functional Management • Channel Partners • Prospects and Customers
For the remainder of this book and the assessment, it will be assumed that the selling environment is business to business (B2B). The reason for this choice is simply one of commonality of issues. The reader should keep in mind that consumer goods companies often sell products through wholesalers, distributors, vendors, and retailers; each of these entities are businesses and therefore the transaction is B2B. In keeping with the notion of being customer centric, the above list will be discussed in inverse order.
Partners, Prospects, and Customers Channel partners are customers and therefore they should be treated as such. Likewise, they are a component of your distribution system and they should be viewed as an extension of your company’s value chain. Partners and customers are businesses and have competitive needs and strategies. Your ability to sell them something is dependent on their ability to compete. If your product/service does not offer a relevant value/price relationship, they will either suffer competitively or use an alternative. This perspective is used as a foundational thought for the assessment as follows: Proposition No. 1: Partners and customers view value in the
context of contributing to their competitive position.
For the sake of argument, assume that your product is a pure commodity. How does Proposition No. 1 hold true? There are many ways to add value even when the product is a commodity; the following are just a few:
• Automate the ordering process • Maintain or manage the customer’s inventory • Package or configure the product to conform to the customer’s processes • Guarantee delivery time • Provide access to technical support
Sales Force Optimization: A Self Assessment
Copyright 2011, All Rights Reserved Page 10
Functional Managers Functional managers that interface with the sales function operate using budgets, processes and policy constraints. Some may have productivity and quality standards. For most functions, the ability to plan workloads and minimize exceptions are key to operating efficiently. This leads to the framework for the next proposition: Proposition No. 2: Functional managers view value as predictability
and adherence to standards.
Senior Management Senior managers, by definition, should be planning on a longer time horizon than functional managers but due to the short-term perspective of many investors, they are obliged to keep a tight rein on near-term results. Therefore, two factors are critical: (1) predictability and (2) understanding cause and effect. In truth, the two factors are intertwined. In order to effectively plan and deliver over a 1-3 year time horizon, one must be able to understand cause and effect. Unfortunately, most companies do most planning on the basis of an extrapolation of history and the sales force is asked to deliver results with only a foggy notion of cause and effect. This often leads to using discounting as a mechanism to generate short-term revenue. Such tactics dilute value perceptions and can create counter-productive precedents. Proposition No. 3: Senior management views value as
predictability through the insight of cause and effect.
Shareholders The motives for shareholder investment vary and are complex. Shareholder motives include risk avoidance, short-term gains, long-term gains, impact on taxes, dividend policies, industry, and so on. However, as a general rule of thumb it is difficult to argue against long-term profitable growth for driving return on investment. Proposition No. 4: Shareholders view value as sustained profitable
growth which drives return on investment.
Based on these propositions, the CSO is expected to optimize sales force performance by:
• Selling via a relevant value proposition • Leading and mentoring through an understanding of cause and effect • Generating predictable and quality outcomes • Contributing to sustained profitability
Are these objectives feasible to meet? Probably not, in the absolute sense. The marketplace is not a laboratory where one can control conditions; however, it is reasonable to reduce the gap between the current state and the ideal while moving closer to optimization. Ultimately, you must be the judge.
Sales Force Optimization: A Self Assessment
Copyright 2011, All Rights Reserved Page 11
Chapter 5 Foundational Concepts and Terminology Communication of management concepts inside and outside of a corporate context can best be described as murky. If you doubt this, just ask a few of your associates what the term decentralization means or closer to the sales force, ask what the sales process means? Since the remainder of the book will address the elements of the assessment, it is essential to define some terms and concepts so that the intention of the language will be as clear as practical. In keeping with the customer focus established in the previous chapter, we will start with the concept of the buy process.
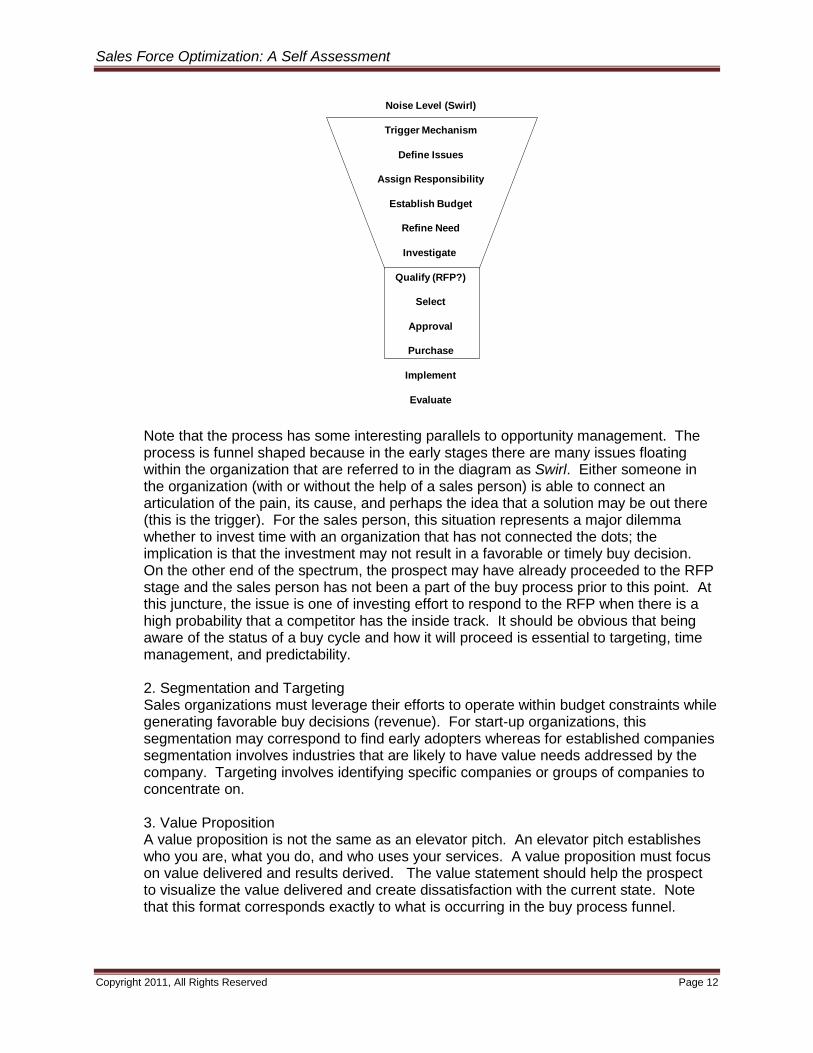
1. The Buy Process For every purchase transaction, there is a corresponding buy process. The process can be an automatic reorder based on an evergreen contract or a protracted system purchase that involves board approval. Sometimes, prospects come to the sales person essentially ready to buy. At the other end of the spectrum are situations where the sales person must invest a great deal of sweat equity to enlighten the buying organization and guide them to complete their own internal process so that a win (favorable buy decision) can be accomplished. One cannot accurately assess the role and capabilities of the sales person without understanding the range of buy processes they may encounter and the value proposition needed to secure a win. Further, there is only one way to reduce the sales cycle and that is by reducing the buy cycle and associated internal transaction processes such as proposals, quotations, approvals, etc. Buy processes take many shapes. Some processes are routine where for instance there is a contract renewal. In this case, the sales person needs to monitor contract dates and know when to start contacting decision makers. Other situations occur almost randomly such as the prospect is experiencing a unique problem or the company has just completed a merger or decided to enter a new market; these situations are referred to as event driven. In these cases, the sales person must monitor business and industry news sources and keep in touch with industry contacts. With these situations, the prospect does not always aware of potential solutions but they are acutely aware of the pain and perhaps the cause. The most complex buy cycle occurs when the organization is vaguely aware of an issue but there has been no attempt to bring it into focus. The diagram provided below offers an internal view as to how this buy cycle might materialize:
Sales Force Optimization: A Self Assessment
Copyright 2011, All Rights Reserved Page 12
Note that the process has some interesting parallels to opportunity management. The process is funnel shaped because in the early stages there are many issues floating within the organization that are referred to in the diagram as Swirl. Either someone in the organization (with or without the help of a sales person) is able to connect an articulation of the pain, its cause, and perhaps the idea that a solution may be out there (this is the trigger). For the sales person, this situation represents a major dilemma whether to invest time with an organization that has not connected the dots; the implication is that the investment may not result in a favorable or timely buy decision. On the other end of the spectrum, the prospect may have already proceeded to the RFP stage and the sales person has not been a part of the buy process prior to this point. At this juncture, the issue is one of investing effort to respond to the RFP when there is a high probability that a competitor has the inside track. It should be obvious that being aware of the status of a buy cycle and how it will proceed is essential to targeting, time management, and predictability. 2. Segmentation and Targeting Sales organizations must leverage their efforts to operate within budget constraints while generating favorable buy decisions (revenue). For start-up organizations, this segmentation may correspond to find early adopters whereas for established companies segmentation involves industries that are likely to have value needs addressed by the company. Targeting involves identifying specific companies or groups of companies to concentrate on. 3. Value Proposition A value proposition is not the same as an elevator pitch. An elevator pitch establishes who you are, what you do, and who uses your services. A value proposition must focus on value delivered and results derived. The value statement should help the prospect to visualize the value delivered and create dissatisfaction with the current state. Note that this format corresponds exactly to what is occurring in the buy process funnel.
Noise Level (Swirl)
Trigger Mechanism
Define Issues
Assign Responsibility
Establish Budget
Refine Need
Investigate
Qualify (RFP?)
Select
Approval
Purchase
Implement
Evaluate

Sales Force Optimization: A Self Assessment
Copyright 2011, All Rights Reserved Page 13
The value proposition should be outcome focused, it should address the source of the pain and its cause, and have a clear vision of the future state, reinforced with tangible value defined in terms of relevant metrics. If the value proposition can be reinforced with customer examples, this makes the proposition real and valid. If prospects have potentially different value needs, then a value proposition should be established for each grouping. 4. Sales Process Terminology The term sales process means different things to different people. For example, if five sales people were asked to describe their sales process, one could reasonably expect the following responses:
• We don’t have one • It is how I manage my territory • It is how I do a needs assessment • It is our sales methodology • It is the steps in the opportunity management process
Given this range of potential responses, it is likely that a conversation regarding the sales process could be quite confusing. Therefore, it is essential that each concept be defined with a specific name and definition before we address the assessment.
a. Sales Process When this term is used, it will refer to the definition of how a sales person manages his territory. The process can be envisioned as consisting of six steps as graphically illustrated below.
In this simplified diagram, the Plan refers to a territory plan that identifies the potential of the territory and how the sales person intends to hit her quota. The Qualify step refers to qualifying prospects that are identified in the plan. Once the prospect is qualified there should be an agreement with the prospect to Assess needs and make recommendations. The Close entails all the details of getting signatures on contracts, release of the purchase order etc. During implementation and/or use of the product/service the sales person must check that the customer’s needs are satisfied (Follow-Up). The last step is Proof of Value (POV). This step represents a presentation or report that the customer gained the value promised in the value proposition. Without this step, your company’s value proposition remains a hope and may leave your company vulnerable in the account. Effective
POVPlan Qualify Assess Close Follow-Up
Target Commit Value Add Contract Verify
Expand

Sales Force Optimization: A Self Assessment
Copyright 2011, All Rights Reserved Page 14
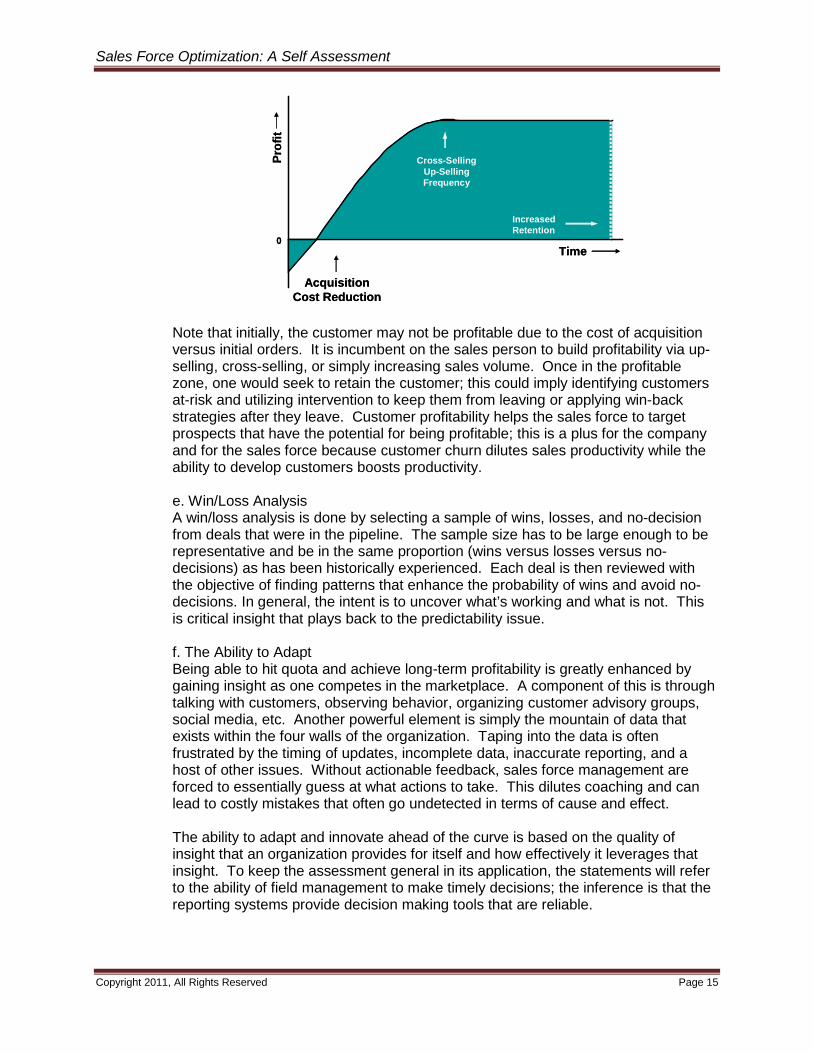
presentation of proof of value should get the sales person invited to explore other opportunities (hence the arrow returning to the Assess step. It is noteworthy that some CRM vendors have created a field position whose role is to follow up on installs with the expressed intent of helping customers leverage the use (value) of their system. In addition to leveraging the POV, the customer interaction provides useful input to the design process for future software releases. b. Best Practices Methodology Each step in the Sales Process must be accompanied with a defined script and tools that are used to implement that step. Best practices can be uniquely defined by the sales organization or incorporate syndicated techniques such as Power Based Selling, Miller Heiman, Target Account Selling, etc. Defining a sales process without defining best practices is essentially a waste of time because the company still lacks the framework to use for coaching and communicating with other functions such as Marketing. c. Opportunity Management When a sales force is engaged in selling large deals that require a significant number of calls and span weeks or months to complete, it is necessary to detail the steps associated with the Qualify and Close steps. The reasons for adding granularity to the process are numerous but the central issue is one of managing the progress of the deal and forecasting closes. It is common to incorporate best practices into the specific steps represented by the opportunity management process and establish a specific outcome for each step in the process. If there is to be predictability relative to using the opportunity management process, the outcomes need to match movement in the Buy Process. d. Customer Profitability Profitability addresses two issues, (1) what type of customers do we really want and (2) how can the efforts of sales and marketing be more tightly aligned? Customer profitability implies defining the costs required to serve a customer versus the revenues and margins their purchases represent. Most companies have very little insight regarding profitability and their gut instincts are typically wrong. For instance, one would intuitively assume that the customers with the largest purchase volume are the most profitable; however, when one factors in the cost to acquire the customer, price concessions, added services, returned product, etc. the profit all but disappears. For B2B businesses, customer profitability over time takes on the following form.
Sales Force Optimization: A Self Assessment
Copyright 2011, All Rights Reserved Page 15
Note that initially, the customer may not be profitable due to the cost of acquisition versus initial orders. It is incumbent on the sales person to build profitability via up-selling, cross-selling, or simply increasing sales volume. Once in the profitable zone, one would seek to retain the customer; this could imply identifying customers at-risk and utilizing intervention to keep them from leaving or applying win-back strategies after they leave. Customer profitability helps the sales force to target prospects that have the potential for being profitable; this is a plus for the company and for the sales force because customer churn dilutes sales productivity while the ability to develop customers boosts productivity. e. Win/Loss Analysis A win/loss analysis is done by selecting a sample of wins, losses, and no-decision from deals that were in the pipeline. The sample size has to be large enough to be representative and be in the same proportion (wins versus losses versus no-decisions) as has been historically experienced. Each deal is then reviewed with the objective of finding patterns that enhance the probability of wins and avoid no-decisions. In general, the intent is to uncover what’s working and what is not. This is critical insight that plays back to the predictability issue. f. The Ability to Adapt Being able to hit quota and achieve long-term profitability is greatly enhanced by gaining insight as one competes in the marketplace. A component of this is through talking with customers, observing behavior, organizing customer advisory groups, social media, etc. Another powerful element is simply the mountain of data that exists within the four walls of the organization. Taping into the data is often frustrated by the timing of updates, incomplete data, inaccurate reporting, and a host of other issues. Without actionable feedback, sales force management are forced to essentially guess at what actions to take. This dilutes coaching and can lead to costly mistakes that often go undetected in terms of cause and effect. The ability to adapt and innovate ahead of the curve is based on the quality of insight that an organization provides for itself and how effectively it leverages that insight. To keep the assessment general in its application, the statements will refer to the ability of field management to make timely decisions; the inference is that the reporting systems provide decision making tools that are reliable.
Time
Prof
it
0
AcquisitionCost Reduction
Cross-SellingUp-SellingFrequency
IncreasedRetention
Time
Prof
it
0
AcquisitionCost Reduction
Cross-SellingUp-SellingFrequency
IncreasedRetention

Sales Force Optimization: A Self Assessment
Copyright 2011, All Rights Reserved Page 16
Chapter 6 The Drivers of Sales Force Optimization In order to create an assessment that addresses optimization, one must create a list of conditions that either enhance or dilute the performance of the sales people. The objective is to strengthen the positives and minimize the sources of dilution. The categories used in the assessment are a mirror image of those presented in this chapter. The purpose of this chapter is to present an underlying perspective that is used to create the statements that will be presented in the actual assessment. In other words, this chapter attempts to frame the desired capabilities associated with optimization so that the reader will be able to visualize them and therefore be in a better position to complete the assessment in an objective manner.
1. Strategy and Planning To quote the Cheshire Cat from Alice in Wonderland, “if you don’t know where you are going, any road will get you there.” Hope is not a strategy and a sales force without discipline and direction will flounder (will waste time due to a lack of focus). A sales strategy can be thought of as market segmentation, a value proposition, and a sales process. Given that it is difficult to discuss segmentation without a value proposition, the section starts with the elements of the strategy and ends with integration of the strategy into territory plans. 2. Structure and Staffing Optimization implies some level of constraint but one cannot assume that because budgeting is done on a percentage basis that this is an optimum balance of output versus input. Due to ramp up costs and learning curves, sizing decisions are best accomplished on a three year time horizon. In addition to sizing, optimization also implies the right mix of positions; for some organizations, inside and outside sales people are effective while others may be able to leverage key account and/or support staff such as sales engineers. The existence of a strong operations staff can help field productivity by managing headquarter requests and reducing administrative workload. Sales operations can also serve as a conduit for reducing turn-around time for approvals etc. For the CSO, a strong sales operations function can address process and policy issues that would otherwise dilute her attention. The role of sales management is crucial to sales optimization. Having a reasonable number of direct reports and the bandwidth to effectively coach and mentor sales people is essential to productivity and the reduction of turnover which increases costs while diluting organizational performance. 4. Selection and Training of Sales People There are managers who have an innate capacity for selecting good people but for the vast majority of management, the answer is defining what works and following a process that is repeatable as possible. This implies a disciplined selection process followed with training and mentoring. 5. Processes Sales is part art and part science. If an organization has 100 sales people and the assumption is that sales is an art, then there will be 100 processes in operation. Assuming that some sales people are successful, does this mean that hiring was correct

Sales Force Optimization: A Self Assessment
Copyright 2011, All Rights Reserved Page 17
or that they intuitively follow an effective process? Defined process represents the science component of selling. Process is reproducible and one can extrapolate on the basis of what proves to be best practice. Understanding cause and effect in the context of a process adds predictability to decision making and makes optimization a potential reality. 6. Technology The question that needs to be addressed is whether applied technology is leveraging sales productivity? Does the technology help sales people to spend more time selling and to improve focus? Do sales people use the system? Are there applications that help the sales people add value to their customers? Does the technology help managers to provide just in time coaching and identify patterns that make the sales force more productive? If the answer to the above questions is yes, then one can reasonably assume that the technology is contributing to optimization. 7. Quality Quality is a topic that is relatively new to the field of sales management. Objective measures of quality can be applied to processes that impact the customer experience. Errors and omissions that occur in processes that touch the customer erode customer confidence and dilute sales effort by reducing perceived value and forcing the sales person to assume the role of service versus sales, consulting, or partnering. Quality issues also impact internal processes that interject delays and added communication raising costs and increasing lead-times. Errors and omissions affect the accuracy of reports thereby diluting the effectiveness of decision making. 8. Compensation One can question why compensation is placed near the end of the drivers, is it not a major source of motivation? The answer is of course yes, compensation is a major component of optimization but it is rare when one can solve performance issues by merely adjusting the compensation plan. A compensation plan is best formulated when the other elements of sales force optimization have been addressed. 9. Organizational Alignment Alignment is most often used in the context of supporting the business strategy which implies generating revenue, managing functional productivity, ensuring adequate capacity, and maintaining costs at budget levels. Though each function contributes to the strategy in terms of meeting its control objectives, this does not mean that the whole is greater than the sum of the parts. For example, sales and marketing often differ substantially regarding messaging, the use of promotional funds, and the quality of leads. Even when both functions meet their strategic objective this does not suggest performance that it is anywhere near optimum. Though sales and marketing may have a more vocal demonstration of alignment issues, other functions can contribute even more dilution to sales effort. Consider inventory policy; availability of product can lead to diminished orders or loss in share of wallet. Lead-times for creating prototypes or proof of concept can result in lost opportunities for new product sales. Returned product policy may reduce exposure to risk but does it impact product trial?

Sales Force Optimization: A Self Assessment
Copyright 2011, All Rights Reserved Page 18
The trade-offs for non-sales functions is frequently made on the basis of risk, cost, and variance control; it is the responsibility of sales to identify the impact that these decisions have on revenue potential. 10. Innovation Innovation is key to continued profitable growth. Although there is always the possibility of serendipity (accidental innovation), sustained innovation is derived through insight and action. Insight can be gained through customer interfaces and by examining one’s own industry. The question is, who controls margins in the industry and how can the company be positioned to leverage this position?
This completes the framework used to create the assessment. There are ten major categories that have been selected on the basis of providing a clear perspective for action. Within these categories, there are approximately 100 statements to consider. If you encounter confusion regarding the applicability or intent of a statement, please refer back to this chapter.

Sales Force Optimization: A Self Assessment
Copyright 2011, All Rights Reserved Page 19
Chapter 7 Assessment Model Overview The objective of the model is to stimulate organizational dialogue regarding the opportunity to leverage sales force performance and competitive advantage. The assessment consists of a series of statements categorized by the ten drivers listed in Chapter 6. The statements represent desired capabilities that are linked with sales force optimization. Each statement is associated with two responses:
1. How does my organization compare with this statement? The options are scored on a scale of 0 to 5.
• 0-Not applicable • 5-Our organization matches precisely • 1- Our organization is very far from meeting this definition • 2 through 4- Varying levels of approximation
2. What is the potential impact of improving our performance if your sales force reached the level 5? Obviously, if you ranked your performance as a NA or 5 then the incremental improvement is zero. For all other rankings you will be requested to estimate the potential impact as a percentage in terms of:
• Productivity = $ Revenue/$ Sales Cost • Margin Contribution = Revenue – Cost of Goods Sold – Sales Costs
Note that the preciseness of your estimates is not as important as is the relative weighting. Input your estimate as a decimal e.g. .008 = .8%.
Example: The first section of the assessment addresses issues pertaining to your value proposition. The effective communication of the value proposition can increase sales force productivity by contributing to more wins and shortening the sales cycle (handle more deals). Likewise, a weak or inconsistent presentation of the value proposition can contribute to concessions on pricing that dilute margins. Assume that you scored this area with 1s and 2s and that your perception that bringing these areas up to 5s would result in a fifteen percent increase in productivity and a five percent increase in margin dollars. These estimates would be entered into the assessment as:
Productivity Potential Gain: 15.0% Margin Potential Gain: 5.0%
In the summary section of the assessment, you will be requested to input your current annual revenue ($), cost of goods sold (%), and sales cost ($). The assessment will use this input to calculate margin contribution in terms of dollars. For our example, assume the following input: Current Revenue (Millions $) 50.0 Cost of Goods Sold (%) 60.0 Sales Costs (Millions $) 10.0 Margin Contribution = $ Revenue x (1 – CGS) – Sales Cost = $50 M x (1 - .6) - $10 M = $ 10 M A 5% gain yields an incremental $.5 M contribution (.05 x $10 M)
Sales Force Optimization: A Self Assessment
Copyright 2011, All Rights Reserved Page 20
A 15% gain in productivity also impacts margin contribution as follows: Productivity gain = (1 + gain%) x $ Revenue x (1 – CGS%) – Sales Costs – Margin Contribution = 1.15 x $50 M x (1 - .6) - $10 M - $ 10 M = $3 M A 15% gain in productivity yields an incremental $3 M in margin contribution. These figures are additive, so this combination (productivity + margin contribution) of improvements yield a $3.5 M gain in margin. It is recommended that you complete the assessment at a time and place where there will be minimal distractions and you will be able to complete it without interruption. Sharing the assessment with others in the organization will help to create a common perspective relative to need although it should be expected that assessments may vary significantly in terms of scores. The goal is not highly consistent numbers as much as creating awareness of opportunities and dissatisfaction with the status quo.
Sales Force Optimization: A Self Assessment
Copyright 2011, All Rights Reserved Page 21
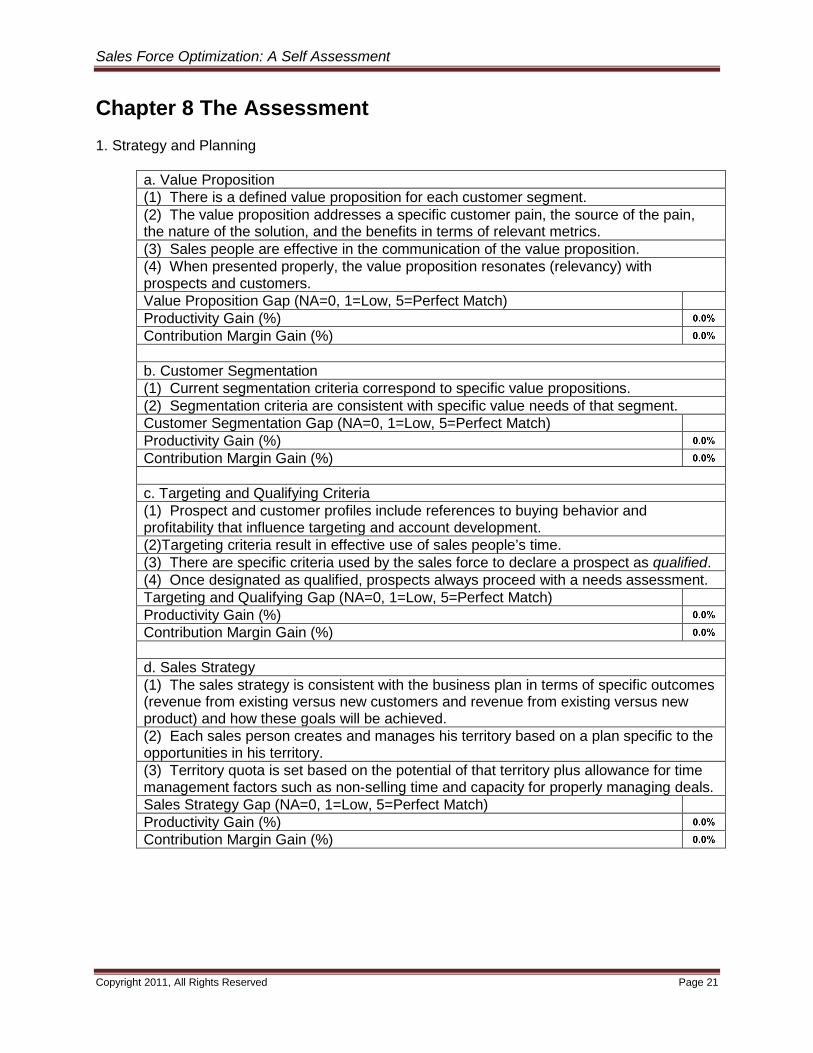
Chapter 8 The Assessment 1. Strategy and Planning
a. Value Proposition (1) There is a defined value proposition for each customer segment. (2) The value proposition addresses a specific customer pain, the source of the pain, the nature of the solution, and the benefits in terms of relevant metrics. (3) Sales people are effective in the communication of the value proposition. (4) When presented properly, the value proposition resonates (relevancy) with prospects and customers. Value Proposition Gap (NA=0, 1=Low, 5=Perfect Match) Productivity Gain (%) Contribution Margin Gain (%) b. Customer Segmentation (1) Current segmentation criteria correspond to specific value propositions. (2) Segmentation criteria are consistent with specific value needs of that segment. Customer Segmentation Gap (NA=0, 1=Low, 5=Perfect Match) Productivity Gain (%) Contribution Margin Gain (%) c. Targeting and Qualifying Criteria (1) Prospect and customer profiles include references to buying behavior and profitability that influence targeting and account development. (2)Targeting criteria result in effective use of sales people’s time. (3) There are specific criteria used by the sales force to declare a prospect as qualified. (4) Once designated as qualified, prospects always proceed with a needs assessment. Targeting and Qualifying Gap (NA=0, 1=Low, 5=Perfect Match) Productivity Gain (%) Contribution Margin Gain (%) d. Sales Strategy (1) The sales strategy is consistent with the business plan in terms of specific outcomes (revenue from existing versus new customers and revenue from existing versus new product) and how these goals will be achieved. (2) Each sales person creates and manages his territory based on a plan specific to the opportunities in his territory. (3) Territory quota is set based on the potential of that territory plus allowance for time management factors such as non-selling time and capacity for properly managing deals. Sales Strategy Gap (NA=0, 1=Low, 5=Perfect Match) Productivity Gain (%) Contribution Margin Gain (%)

Sales Force Optimization: A Self Assessment
Copyright 2011, All Rights Reserved Page 22
2. Structure and Staffing a. Sales Force Sizing (1) An objective and analytical method has been used to validate the number of sales people required to optimize revenue generation. (2) The ratio of inside and outside sales people maximizes the productivity of both resources. (3) The reporting relationship used to manage inside and outside sales people results in coordinated and productive sales efforts. (4) Account specialists are assigned to prospects and customers that have business needs that are dissimilar to most other industries served and would dilute coverage, value add, and/or focus if assigned to regular territories. Sales Force Sizing Gap (NA=0, 1=Low, 5=Perfect Match) Productivity Gain (%) Contribution Margin Gain (%) b. Sales Operations (1) Sales operations has adequate staff to manage coordination with field resources. (2) Sales operations manages communication with field sales resources in a manner that eliminates information overload and maximizes clarity of focus and action. (3) Sales operations reduces field management workload and provides useful feedback. (4) Sales operations is effective in minimizing field sales administrative workload. Sales Operations Gap (NA=0, 1=Low, 5=Perfect Match) Productivity Gain (%) Contribution Margin Gain (%) c. Major or Strategic Accounts (1) Accounts that require extraordinary or unique expertise or extensive coordination across geographic areas are managed by dedicated staff with named accounts. (2) Major account sales people generate strategies that are integrated into territory plans as required. (3) Major account sales people provide effective communication relative to actions needed at the territory level. Major or Strategic Accounts Gap (NA=0, 1=Low, 5=Perfect Match) Productivity Gain (%) Contribution Margin Gain (%) d. Sales Support Staff (e.g. Sales Engineers, Product Specialists, etc.) (1) Sufficient support staff is available to move deals ahead in a timely manner. (2) Reporting relationships, goal setting, and performance metrics are conducive to effective utilization of resources. Sales Support Staff Gap (NA=0, 1=Low, 5=Perfect Match) Productivity Gain (%) Contribution Margin Gain (%)
Sales Force Optimization: A Self Assessment
Copyright 2011, All Rights Reserved Page 23
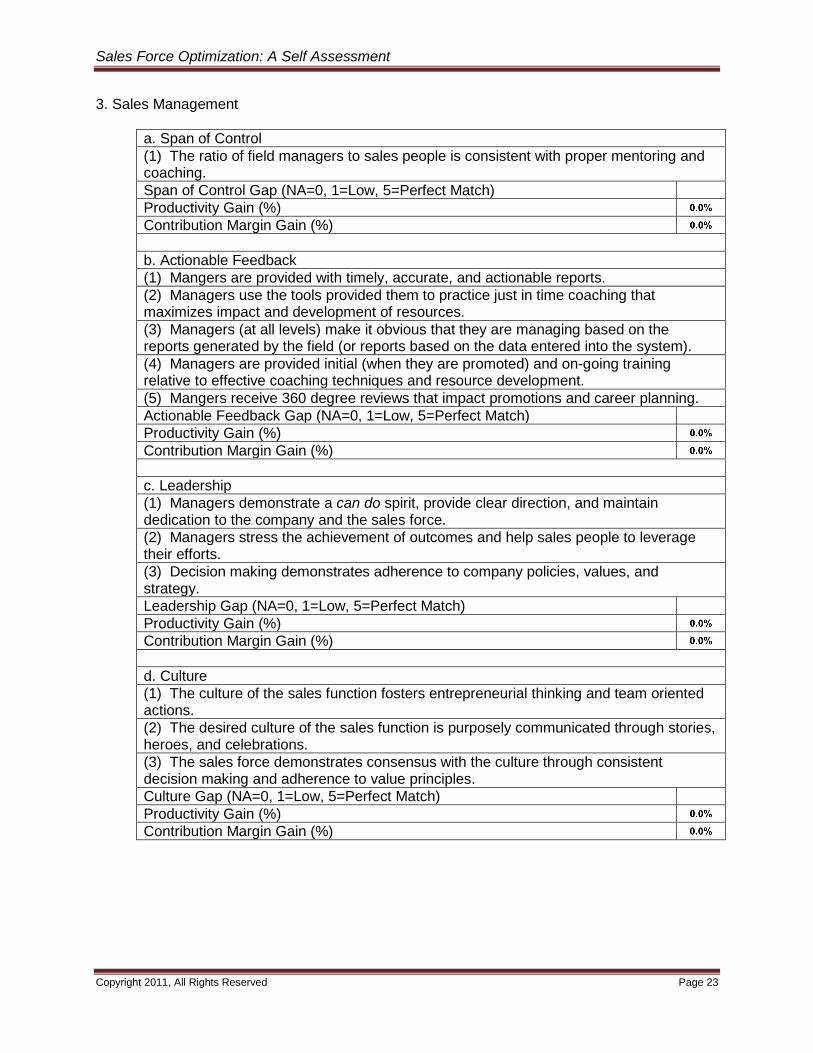
3. Sales Management
a. Span of Control (1) The ratio of field managers to sales people is consistent with proper mentoring and coaching. Span of Control Gap (NA=0, 1=Low, 5=Perfect Match) Productivity Gain (%) Contribution Margin Gain (%) b. Actionable Feedback (1) Mangers are provided with timely, accurate, and actionable reports. (2) Managers use the tools provided them to practice just in time coaching that maximizes impact and development of resources. (3) Managers (at all levels) make it obvious that they are managing based on the reports generated by the field (or reports based on the data entered into the system). (4) Managers are provided initial (when they are promoted) and on-going training relative to effective coaching techniques and resource development. (5) Mangers receive 360 degree reviews that impact promotions and career planning. Actionable Feedback Gap (NA=0, 1=Low, 5=Perfect Match) Productivity Gain (%) Contribution Margin Gain (%) c. Leadership (1) Managers demonstrate a can do spirit, provide clear direction, and maintain dedication to the company and the sales force. (2) Managers stress the achievement of outcomes and help sales people to leverage their efforts. (3) Decision making demonstrates adherence to company policies, values, and strategy. Leadership Gap (NA=0, 1=Low, 5=Perfect Match) Productivity Gain (%) Contribution Margin Gain (%) d. Culture (1) The culture of the sales function fosters entrepreneurial thinking and team oriented actions. (2) The desired culture of the sales function is purposely communicated through stories, heroes, and celebrations. (3) The sales force demonstrates consensus with the culture through consistent decision making and adherence to value principles. Culture Gap (NA=0, 1=Low, 5=Perfect Match) Productivity Gain (%) Contribution Margin Gain (%)

Sales Force Optimization: A Self Assessment
Copyright 2011, All Rights Reserved Page 24
e. Retention of Staff (1) Management practices and culture minimize the loss (turnover) of key sales force resources. Retention of Staff Gap (NA=0, 1=Low, 5=Perfect Match) Productivity Gain (%) Contribution Margin Gain (%)
4. Selection and Training of Sales People
a. Selection Criteria (1) Job descriptions are maintained for all sales positions and are used for recruitment and screening purposes. (2) Competencies are defined for all sales positions and are used for structured interviews. Value Proposition Gap (NA=0, 1=Low, 5=Perfect Match) Productivity Gain (%) Contribution Margin Gain (%) b. New Hire Training (1) Adequate and effective training is provided relative to company policy, values, and administrative practices. (2) Adequate and effective training is provided for company values, products, pricing, and services. (3) Adequate and effective training is provided for competitive strengths and weaknesses. (4) Adequate and effective training is provided for positioning of solutions. (5) Adequate and effective training is provided for technology based reporting and sales tools. (6) Adequate and effective training for access to reference and refresher materials. New Hire Training Gap (NA=0, 1=Low, 5=Perfect Match) Productivity Gain (%) Contribution Margin Gain (%) c. Ramp-Up Time (1) The new hire selection process and training contribute to a learning curve that is shorter than the competition. Ramp-up Time Gap (NA=0, 1=Low, 5=Perfect Match) Productivity Gain (%) Contribution Margin Gain (%) d. Sales Person Turnover (1) The selection process, training, and coaching techniques used by the company reduce turnover associated with low-performance issues are below that experienced by competition. (2) Field managers utilize strategies that minimize the impact of open territories. Sales Person Turnover Gap (NA=0, 1=Low, 5=Perfect Match) Productivity Gain (%) Contribution Margin Gain (%)

Sales Force Optimization: A Self Assessment
Copyright 2011, All Rights Reserved Page 25
5. Processes
a. Planning and Budgeting (1) Planning and budgeting is based on an understanding of cause and effect. Planning and Budgeting Gap (NA=0, 1=Low, 5=Perfect Match) Productivity Gain (%) Contribution Margin Gain (%) b. Lead Management (1) Marketing and Sales have established a mutually agreed process for passing leads to field sales. (2) Marketing and Sales jointly manage a lead scoring format for nurturing leads prior to submission to field sales. (3) The sales organization is responsible for determining the qualification of leads and has committed to responding to all leads submitted by marketing based on points 1 and 2 above. (4) Marketing and Sales jointly support the use of a self-qualifying tool (prospect qualifies them self) as part of the lead management process. Reference example: an ROI type of tool to determine if a technology is economically viable e.g. the use of EDI. Lead Management Gap (NA=0, 1=Low, 5=Perfect Match) Productivity Gain (%) Contribution Margin Gain (%) c. Selling (1) There is a defined process, it is kept up to date by a specific person or group chartered for that responsibility, the process is integrated into all relevant training materials, and this terminology and context is used by field management for coaching and training purposes. Processes included in this definition are: Sales process, sales cycle, opportunity management, territory plan, proof of value, forecasting, proposals, contracts, pricing, prototyping (or equivalent), and lead management, Selling Gap (NA=0, 1=Low, 5=Perfect Match) Productivity Gain (%) Contribution Margin Gain (%) d. New Product Launch (1) Marketing and Sales follow a mutually agreed process that effectively equips the sales force to target, position, and support new product launches. (2) New product launches are integrated into territory plans, forecasts, and compensation plans. (3) The sales force has access to training materials that completely equip them for the launch. (4) Sales management effectively supports the launch with coaching, training, and SPIFFs. New Product Launch Gap (NA=0, 1=Low, 5=Perfect Match) Productivity Gain (%) Contribution Margin Gain (%)

Sales Force Optimization: A Self Assessment
Copyright 2011, All Rights Reserved Page 26
e. Proof of Concept (1) All processes that support the field in terms of proof of concept (demonstration concepts, prototypes, samples, designs, trial usage, etc.) have been streamlined to minimize turnaround time and balanced from a cost versus impact on new business closed perspective. (2) Processes used to control field inventory accurately maintain ownership and minimize losses. (3) A relevant list of reference customers is maintained and carefully managed by the sales organization. Proof of Concept Gap (NA=0, 1=Low, 5=Perfect Match) Productivity Gain (%) Contribution Margin Gain (%) f. Fulfillment (1) Fulfillment processes have been designed to minimize lead-times, maximize accuracy, and simplicity of interface for all users. Fulfillment Gap (NA=0, 1=Low, 5=Perfect Match) Productivity Gain (%) Contribution Margin Gain (%) g. Administration (1) All field administrative processes (e.g. expense reports, activity reports, vehicle usage, inventory, etc.) are designed to speed completion, accuracy, and minimize non-selling time. Administration Gap (NA=0, 1=Low, 5=Perfect Match) Productivity Gain (%) Contribution Margin Gain (%)
6. Technology
a. Usage (1) All levels within the sales function have the necessary training, equipment, software, and access to utilize applications designated for their purpose. (2) Refresher and on-line help is available to assist individuals with varying technology skill levels. (3) Expert assistance is available before, after, and during business hours. (4) All field sales people are entering data and using the system for its intended purpose. Usage Gap (NA=0, 1=Low, 5=Perfect Match) Productivity Gain (%) Contribution Margin Gain (%) b. Management Intent (1) The design and content of the system is to provide value add to the sales force in the context of helping them to sell more effectively. Management Intent Gap (NA=0, 1=Low, 5=Perfect Match) Productivity Gain (%) Contribution Margin Gain (%)

Sales Force Optimization: A Self Assessment
Copyright 2011, All Rights Reserved Page 27
c. Maintenance (1) The system is updated in a timely manner such that pricing, specifications, reports etc. are accurate. Maintenance Gap (NA=0, 1=Low, 5=Perfect Match) Productivity Gain (%) Contribution Margin Gain (%) d. Management Use (1) All levels of field management use the formal system as their primary tool for decision making. (2) The use of the formal system by management (decision making) is recognized by all users of the system Management Use Gap (NA=0, 1=Low, 5=Perfect Match) Productivity Gain (%) Contribution Margin Gain (%) e. Sales Tool Applications (1) Computer based sales tools provided to the sales force are effective (lead to closed deals, shorten the sales process, and minimize non-selling time). (2) All economically viable technology based tools have been provided to the sales force. Reference examples: product/pricing configurators, white papers, order entry, proposal generators, electronic signature, contracts, approval processes, presentations, forecasting, marketing encyclopedia, compensation tracking, ROI calculator, web based meetings, team collaboration, bulletin boards, analytics, case studies, prospect/customer portals, and checklists. Sales Tool Applications Gap (NA=0, 1=Low, 5=Perfect Match) Productivity Gain (%) Contribution Margin Gain (%) f. Forecasting (1) Senior management has committed to managing the company based on one forecast (that generated by the sales force). (2) Field management, at all levels, provide feedback to sales people using the forecast as a framework for the discussion. (3)Statistical methods are applied to the forecasting model to improve predictability. Forecasting Gap (NA=0, 1=Low, 5=Perfect Match) Productivity Gain (%) Contribution Margin Gain (%)

Sales Force Optimization: A Self Assessment
Copyright 2011, All Rights Reserved Page 28
7. Quality
a. Data Base (1) The data bases used by the sales force for reference and decision making are accurate, consistent, and up to date. Data Base Gap (NA=0, 1=Low, 5=Perfect Match) Productivity Gain (%) Contribution Margin Gain (%) b. Fulfillment Documents (1) Order entry, order status, production, fulfillment, billing, returns, shipping, etc. documentation are free of errors. Fulfillment Documents Gap (NA=0, 1=Low, 5=Perfect Match) Productivity Gain (%) Contribution Margin Gain (%) c. Process Controls (1) Statistical quality techniques are applied and managed on all processes that impact the customer experience. Process Controls Gap (NA=0, 1=Low, 5=Perfect Match) Productivity Gain (%) Contribution Margin Gain (%)
8. Compensation
a. Framework (1) The system designates the correct positions to be eligible for incentive/bonus pay. (2) The right level of compensation is at-risk relative to the impact that the individual has on the sale. (3) The system used for tracking performance and rewarding compensation is accurate and timely. Framework Gap (NA=0, 1=Low, 5=Perfect Match) Productivity Gain (%) Contribution Margin Gain (%) b. Design (1) The compensation plan supports business objectives (e.g. revenue based on existing versus new customers and product categories or mix). (2) The plan reinforces the interactions that are involved in how work gets done (e.g. team selling). (3) The plan represents value add to the recruitment process. (4) The plan rewards performance in a manner that creates employee loyalty and retention. (5) The plan uses metrics that reinforce behaviors that improve productivity over time. (6) The plan maintains the cost of sales at target levels. Design Gap (NA=0, 1=Low, 5=Perfect Match) Productivity Gain (%) Contribution Margin Gain (%)
Sales Force Optimization: A Self Assessment
Copyright 2011, All Rights Reserved Page 29
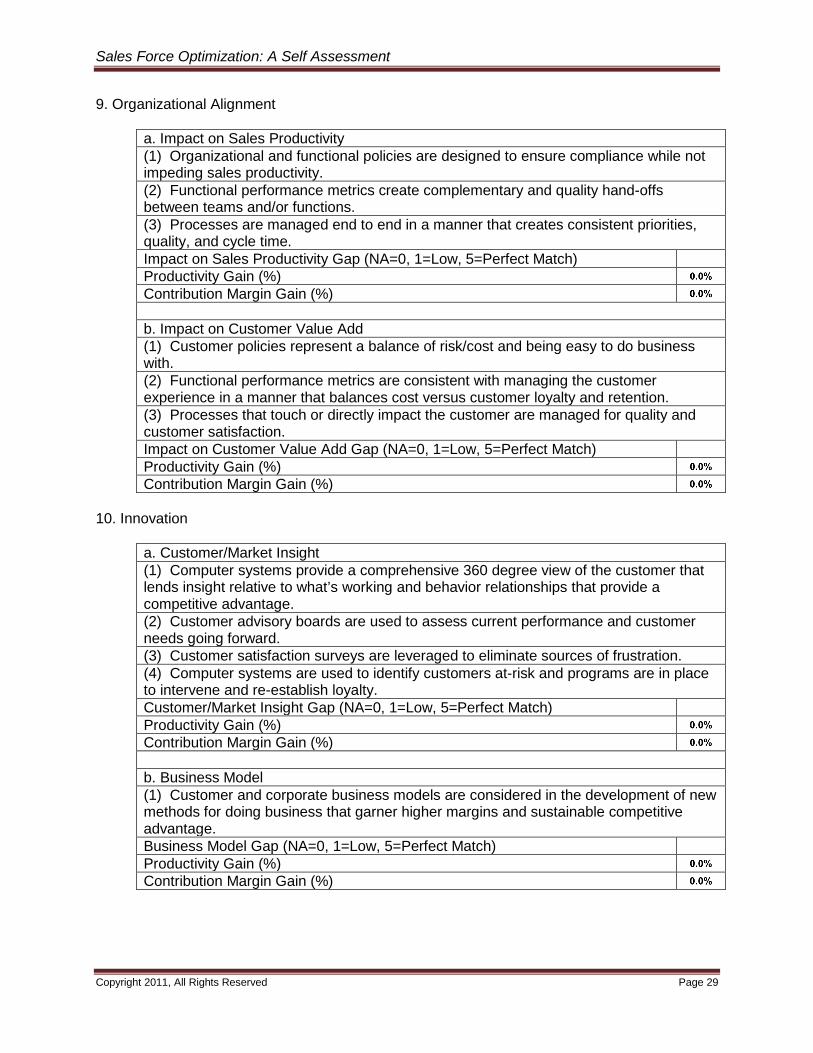
9. Organizational Alignment
a. Impact on Sales Productivity (1) Organizational and functional policies are designed to ensure compliance while not impeding sales productivity. (2) Functional performance metrics create complementary and quality hand-offs between teams and/or functions. (3) Processes are managed end to end in a manner that creates consistent priorities, quality, and cycle time. Impact on Sales Productivity Gap (NA=0, 1=Low, 5=Perfect Match) Productivity Gain (%) Contribution Margin Gain (%) b. Impact on Customer Value Add (1) Customer policies represent a balance of risk/cost and being easy to do business with. (2) Functional performance metrics are consistent with managing the customer experience in a manner that balances cost versus customer loyalty and retention. (3) Processes that touch or directly impact the customer are managed for quality and customer satisfaction. Impact on Customer Value Add Gap (NA=0, 1=Low, 5=Perfect Match) Productivity Gain (%) Contribution Margin Gain (%)
10. Innovation
a. Customer/Market Insight (1) Computer systems provide a comprehensive 360 degree view of the customer that lends insight relative to what’s working and behavior relationships that provide a competitive advantage. (2) Customer advisory boards are used to assess current performance and customer needs going forward. (3) Customer satisfaction surveys are leveraged to eliminate sources of frustration. (4) Computer systems are used to identify customers at-risk and programs are in place to intervene and re-establish loyalty. Customer/Market Insight Gap (NA=0, 1=Low, 5=Perfect Match) Productivity Gain (%) Contribution Margin Gain (%) b. Business Model (1) Customer and corporate business models are considered in the development of new methods for doing business that garner higher margins and sustainable competitive advantage. Business Model Gap (NA=0, 1=Low, 5=Perfect Match) Productivity Gain (%) Contribution Margin Gain (%)

Sales Force Optimization: A Self Assessment
Copyright 2011, All Rights Reserved Page 30
Summary Results The summary will extrapolate the financial impact of your estimates if you provide the following reference numbers: Current Revenue ($ Millions) Cost of Goods Sold (%) Sales Costs ($ Millions) Margin Contribution ($ Millions) Productivity $ Impact on Margin = (1 + % Gain) x $ Revenue x (1- % CGS) – $ Cost of Sales – $ Margin Contribution Margin Contribution $ Impact = % Gain x ($ Revenue - $ Cost of Goods Sold - $ Cost of Sales) The $ impact on productivity and margin contribution are additive and reflect an approximation of incremental upside profit potential. Obviously, there are investments in programs and systems that would be required to gain these benefits. The $ impact is provided to identify areas that have large potential.
Category Gap Productivity Margin Contribution 1. Strategy and Planning Score % Gain $ Impact % Gain $ Impact
a. Value Proposition b. Customer Segmentation c. Targeting and Qualification Criteria d. Sales Strategy
2. Structure and Staffing a. Sales Force Sizing b. Sales Operations c. Major or Strategic Accounts d. Sales Support Staff
3. Sales Management a. Span of Control b. Actionable Feedback c. Leadership d. Culture e. Retention of Staff
4. Selection and Training of Sales People a. Selection Criteria b. New Hire Training c. Ramp-up Time d. Sales Person Turnover

Sales Force Optimization: A Self Assessment
Copyright 2011, All Rights Reserved Page 31
Category Gap Productivity Margin Contribution 5. Processes Score % Gain $ Impact % Gain $ Impact
a. Planning and Budgeting b. Lead Management c. Selling d. New Product Launch e. Proof of Concept f. Fulfillment g. Administration
6. Technology a. Usage b. Management Intent c. Maintenance d. Management Use e. Sales Tool Applications f. Forecasting
7. Quality a. Data Base b. Fulfillment Documents c. Process Controls
8. Compensation a. Framework b. Design
9. Organizational Alignment a. Impact on Sales Productivity b. Impact on Customer Value Add
10. Innovation a. Customer/Market Insight b. Business Model
If you use a Reader 8 and later, you should be able to print your results.

Sales Force Optimization: A Self Assessment
Copyright 2011, All Rights Reserved Page 32
Chapter 9 Interpreting the Results The use of this assessment is enhanced by sharing it with other stakeholders and comparing results. It is very likely that everyone who completes the assessment will have a bias based on their experience, strengths, and role in the organization. However, the objective is not consistent numerical results but to stimulate a discussion regarding sales force potential. If the consensus of the participants indicates large gaps with relatively small level of potential then I would like to hear from you because this suggests that there are voids in the assessment. If you have low gap scores (1s and 2s) and low impact estimates, this suggests minor tune-ups. If your results indicate large gaps and significant potential, you need to organize and prioritize your efforts. The first step is to brainstorm the causes of the gaps corresponding with the greatest potential for improvement. Next, map these ideas according to the four quadrants listed below:
Examine the items that fall into quadrant 4; by definition these items can be implemented rather quickly with a high level of benefit. One caveat should be observed, if fundamental issues have high gap scores (e.g. value proposition and sales process) then care needs to be exercised in that you may be fixing something that will need to be changed in the near term. In addition to being wasteful, introducing change without addressing more fundamental issues can send the wrong message to the sales force. For all other gap areas, it is recommended that you approach these in the order of the assessment. For example, if your value proposition is weak, you do not know how to identify profitable customers, and/or you have not identified the buy process, then how will you be able to make judgments regarding structure and processes? If processes are not defined, how can you have constructive discussions regarding alignment or technology? This does not mean everything has to be done in lock step with the assessment hierarchy but intent and outcomes must be in place before the means to these ends can be considered.
1
2
3
4
Complexity
High
Low
Low HighImpact

Sales Force Optimization: A Self Assessment
Copyright 2011, All Rights Reserved Page 33
Chapter 10 Innovation It is difficult to envision sales force optimization in the absence of innovation. Innovation can be thought of as bringing new value add to the marketplace. Innovation is not something that occurs solely in a laboratory in the basement of the research lab. More broadly, innovation can be thought of as connecting dots that other people don’t see or are unwilling to act on. Consider no frills airlines, this involves a business model that serves a significant segment of the marketplace and it is done profitably. The sales function is in a unique position to observe customers, identify points of pain, and envision ways to create solutions that address that pain. As a matter of fact, this is a key idea regarding the notion of the CSO. However, one person cannot reasonably be expected to be the repository of all these ideas, it must be an agenda item of meetings the CSO has with customers and staff. The subject of innovation is also closely aligned with the idea of sales force optimization. If feedback systems are properly designed and managed, they should reveal patterns that are not apparent from direct observation. Further, optimization involves removing constraints that limit productivity and dilute value add. The two concepts are potentially joined at the hip but leveraging the benefits occurs by design and follow-through. This assessment can be the launch point. It is meant to stimulate thoughts and ideas. There are basic principles involved with optimization but the road to profitability and innovation is a result of your own unique design.
Sales Force Optimization: A Self Assessment
Copyright 2011, All Rights Reserved Page 34
About the Author Glen S. Petersen is an internationally recognized speaker, writer, practitioner, and thought leader in the Customer Relationship Management (CRM) and Sales performance industries. He has held senior level management positions with systems integration and end user organizations and has been active in the SFA and CRM field since its inception, a period of over 20 years. During this period, Glen has developed a number of proprietary facilitation techniques, which help organizations to better understand the potential of these technologies, and how to rally the organization around a single threaded, phased implementation approach. Glen is the author of many articles and white papers that span a wide breath of topics ranging from organizational strategy, the alignment of organizational effort, return on investment, and the effective use of technology. He has authored and published seven other books, some of which have been translated and published in other countries: High-Impact Sales Force Automation: A Strategic Perspective Customer Relationship Management Systems: ROI & Results Measurement CRM: Leadership and Alignment in a Customer Centric World ROI: Building the CRM Business Case CRM Best Practices: A Self Assessment Making CRM an Operational Reality The Sales Maximization Paradox: Cracking the Marketing/Sales Alignment Code Glen can be reached at [email protected].