saas - q1 2015 market review
TRANSCRIPT


Deep domain expertise in three inter-related sectors… … and broad industry networks
A market-leading corporate finance advisory firm…
• Founded in 1991
• Entrepreneurial and owner-managed
• 40 person team; 250+ completed transactions
• Broad global network
• Creative solutions
• Senior level focus on every transaction
…with global reach
About Results International
1

Results International Global SaaS Indices
2
1.9%
16.7%
6.2%
(23.2%)
(0.2%)
Q1 2015 Performance
Large Cap 5.7%
Mid Cap (1.0%)
Small Cap 12.0%
Global SaaS 5.1%
Note: Based on share prices as at 31 March 2015
Note: Indices weighted by market capitalisation
Sources: Capital IQ and Results analysis
50
60
70
80
90
100
110
120
130
140
150
Mar 14 Apr 14 May 14 Jun 14 Jul 14 Aug 14 Sep 14 Oct 14 Nov 14 Dec 14 Jan 15 Feb 15 Mar 15
Large Cap Mid Cap Small Cap Global SaaS Index NASDAQ Comp

Global SaaS Universe: Large & Mid Cap Share Price Performance
3
Q1
-20
15
Last
12 M
on
ths
Large Cap Mid Cap
Note: Share price performance as at 31 March 2015
Sources: Capital IQ and Results analysis
(25.5%) (18.4%)
(2.2%)
(21.7%)
17.0%
31.5% 24.1%
(7.7%)
(22.6%)
56.2%
(4.9%)
1.1%
(4.4%)
(39.6%)
(9.8%)
10.9%
(21.6%)
34.1%
91.8%
24.7%
(15.2%)
(60.0%)
(40.0%)
(20.0%)
0.0%
20.0%
40.0%
60.0%
80.0%
100.0%
(18.1%)
0.9%
(15.0%) (13.1%)
12.6% 16.1% 15.8%
3.4%
(29.7%)
4.1% 5.8%
(13.1%)
(3.3%)
(17.9%)
2.7%
(8.3%)
(21.7%)
26.4%
37.2%
13.5%
(27.4%)
(40.0%)
(30.0%)
(20.0%)
(10.0%)
0.0%
10.0%
20.0%
30.0%
40.0%
50.0%

Global SaaS Universe: Small Cap Share Price Performance
4
Q1
-20
15
Last
12 M
on
ths
Small Cap
Note: Share price performance as at 31 March 2015
Sources: Capital IQ and Results analysis
12.0%
(55.1%)
0.7%
(14.9%)
49.2%
18.7%
(4.5%)
(25.7%)
23.1% 17.2% 18.5%
12.9% 8.0%
38.0%
8.3%
(80.0%)
(60.0%)
(40.0%)
(20.0%)
0.0%
20.0%
40.0%
60.0%
(21.7%)
(74.3%)
(22.4%)
(36.0%) (38.8%)
n.a. 7.8%
(40.5%)
82.8%
(37.3%)
9.2% 1.9%
(5.8%)
17.3%
(8.2%)
(100.0%)
(80.0%)
(60.0%)
(40.0%)
(20.0%)
0.0%
20.0%
40.0%
60.0%
80.0%
100.0%

Global SaaS: Valuation Benchmarks
5
EBITDA Margin 2015E EV / EBITDA 2015E
Revenue Growth (2015-16E) EV / Revenue 2015E
Note: EV = Enterprise Value; Financials calendarised to December year end
Note: Median values reported; excludes negative multiples
Note: See Selected Publicly Traded Companies (slides 6 & 7) for details of companies included in each category
Source: Capital IQ
21.6%
19.8% 19.5%
21.2%
0.0%
5.0%
10.0%
15.0%
20.0%
25.0%
30.0%
Large Cap Mid Cap Small Cap Global SaaS
7.4 x
4.6 x
3.6 x
5.1 x
0.0 x
1.0 x
2.0 x
3.0 x
4.0 x
5.0 x
6.0 x
7.0 x
8.0 x
Large Cap Mid Cap Small Cap Global SaaS
30.7 x
19.4 x
39.0 x
24.2 x
0.0 x
5.0 x
10.0 x
15.0 x
20.0 x
25.0 x
30.0 x
35.0 x
40.0 x
45.0 x
Large Cap Mid Cap Small Cap Global SaaS
16.7%
18.0%
0.4%
13.3%
0.0%
2.0%
4.0%
6.0%
8.0%
10.0%
12.0%
14.0%
16.0%
18.0%
20.0%
Large Cap Mid Cap Small Cap Global SaaS
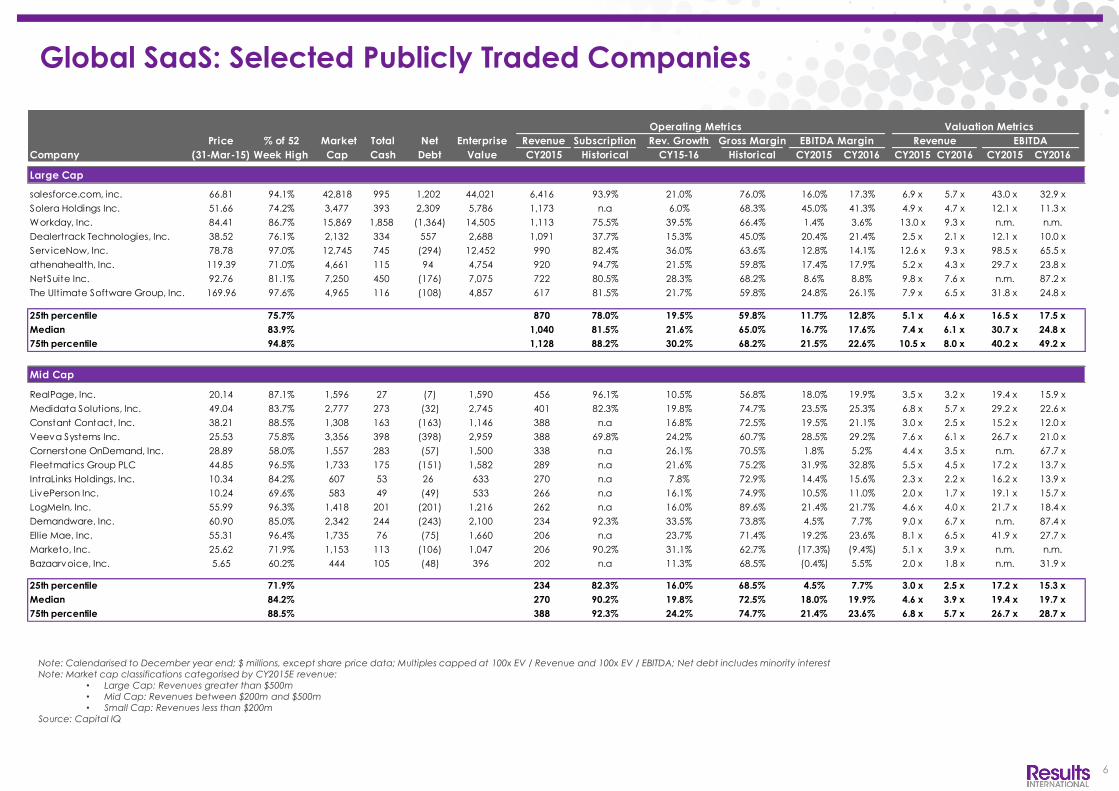
Operating Metrics Valuation Metrics
Price % of 52 Market Total Net Enterprise Revenue Subscription Rev. Growth Gross Margin EBITDA Margin Revenue EBITDA
Company (31-Mar-15) Week High Cap Cash Debt Value CY2015 Historical CY15-16 Historical CY2015 CY2016 CY2015 CY2016 CY2015 CY2016
Large Cap
salesforce.com, inc. 66.81 94.1% 42,818 995 1,202 44,021 6,416 93.9% 21.0% 76.0% 16.0% 17.3% 6.9 x 5.7 x 43.0 x 32.9 x
Solera Holdings Inc. 51.66 74.2% 3,477 393 2,309 5,786 1,173 n.a 6.0% 68.3% 45.0% 41.3% 4.9 x 4.7 x 12.1 x 11.3 x
Workday, Inc. 84.41 86.7% 15,869 1,858 (1,364) 14,505 1,113 75.5% 39.5% 66.4% 1.4% 3.6% 13.0 x 9.3 x n.m. n.m.
Dealertrack Technologies, Inc. 38.52 76.1% 2,132 334 557 2,688 1,091 37.7% 15.3% 45.0% 20.4% 21.4% 2.5 x 2.1 x 12.1 x 10.0 x
Serv iceNow, Inc. 78.78 97.0% 12,745 745 (294) 12,452 990 82.4% 36.0% 63.6% 12.8% 14.1% 12.6 x 9.3 x 98.5 x 65.5 x
athenahealth, Inc. 119.39 71.0% 4,661 115 94 4,754 920 94.7% 21.5% 59.8% 17.4% 17.9% 5.2 x 4.3 x 29.7 x 23.8 x
NetSuite Inc. 92.76 81.1% 7,250 450 (176) 7,075 722 80.5% 28.3% 68.2% 8.6% 8.8% 9.8 x 7.6 x n.m. 87.2 x
The Ultimate Software Group, Inc. 169.96 97.6% 4,965 116 (108) 4,857 617 81.5% 21.7% 59.8% 24.8% 26.1% 7.9 x 6.5 x 31.8 x 24.8 x
25th percentile 75.7% 870 78.0% 19.5% 59.8% 11.7% 12.8% 5.1 x 4.6 x 16.5 x 17.5 x
Median 83.9% 1,040 81.5% 21.6% 65.0% 16.7% 17.6% 7.4 x 6.1 x 30.7 x 24.8 x
75th percentile 94.8% 1,128 88.2% 30.2% 68.2% 21.5% 22.6% 10.5 x 8.0 x 40.2 x 49.2 x
Mid Cap
RealPage, Inc. 20.14 87.1% 1,596 27 (7) 1,590 456 96.1% 10.5% 56.8% 18.0% 19.9% 3.5 x 3.2 x 19.4 x 15.9 x
Medidata Solutions, Inc. 49.04 83.7% 2,777 273 (32) 2,745 401 82.3% 19.8% 74.7% 23.5% 25.3% 6.8 x 5.7 x 29.2 x 22.6 x
Constant Contact, Inc. 38.21 88.5% 1,308 163 (163) 1,146 388 n.a 16.8% 72.5% 19.5% 21.1% 3.0 x 2.5 x 15.2 x 12.0 x
Veeva Systems Inc. 25.53 75.8% 3,356 398 (398) 2,959 388 69.8% 24.2% 60.7% 28.5% 29.2% 7.6 x 6.1 x 26.7 x 21.0 x
Cornerstone OnDemand, Inc. 28.89 58.0% 1,557 283 (57) 1,500 338 n.a 26.1% 70.5% 1.8% 5.2% 4.4 x 3.5 x n.m. 67.7 x
Fleetmatics Group PLC 44.85 96.5% 1,733 175 (151) 1,582 289 n.a 21.6% 75.2% 31.9% 32.8% 5.5 x 4.5 x 17.2 x 13.7 x
IntraLinks Holdings, Inc. 10.34 84.2% 607 53 26 633 270 n.a 7.8% 72.9% 14.4% 15.6% 2.3 x 2.2 x 16.2 x 13.9 x
LivePerson Inc. 10.24 69.6% 583 49 (49) 533 266 n.a 16.1% 74.9% 10.5% 11.0% 2.0 x 1.7 x 19.1 x 15.7 x
LogMeIn, Inc. 55.99 96.3% 1,418 201 (201) 1,216 262 n.a 16.0% 89.6% 21.4% 21.7% 4.6 x 4.0 x 21.7 x 18.4 x
Demandware, Inc. 60.90 85.0% 2,342 244 (243) 2,100 234 92.3% 33.5% 73.8% 4.5% 7.7% 9.0 x 6.7 x n.m. 87.4 x
Ellie Mae, Inc. 55.31 96.4% 1,735 76 (75) 1,660 206 n.a 23.7% 71.4% 19.2% 23.6% 8.1 x 6.5 x 41.9 x 27.7 x
Marketo, Inc. 25.62 71.9% 1,153 113 (106) 1,047 206 90.2% 31.1% 62.7% (17.3%) (9.4%) 5.1 x 3.9 x n.m. n.m.
Bazaarvoice, Inc. 5.65 60.2% 444 105 (48) 396 202 n.a 11.3% 68.5% (0.4%) 5.5% 2.0 x 1.8 x n.m. 31.9 x
25th percentile 71.9% 234 82.3% 16.0% 68.5% 4.5% 7.7% 3.0 x 2.5 x 17.2 x 15.3 x
Median 84.2% 270 90.2% 19.8% 72.5% 18.0% 19.9% 4.6 x 3.9 x 19.4 x 19.7 x
75th percentile 88.5% 388 92.3% 24.2% 74.7% 21.4% 23.6% 6.8 x 5.7 x 26.7 x 28.7 x
Note: Calendarised to December year end; $ millions, except share price data; Multiples capped at 100x EV / Revenue and 100x EV / EBITDA; Net debt includes minority interest
Note: Market cap classifications categorised by CY2015E revenue:
• Large Cap: Revenues greater than $500m
• Mid Cap: Revenues between $200m and $500m
• Small Cap: Revenues less than $200m
Source: Capital IQ
Global SaaS: Selected Publicly Traded Companies
6

Operating Metrics Valuation Metrics
Price % of 52 Market Total Net Enterprise Revenue Subscription Rev. Growth Gross Margin EBITDA Margin Revenue EBITDA
Company (31-Mar-15) Week High Cap Cash Debt Value CY2015 Historical CY15-16 Historical CY2015 CY2016 CY2015 CY2016 CY2015 CY2016
Small Cap
Jive Software, Inc. 5.13 58.6% 384 114 (108) 276 197 88.7% 12.0% 68.2% 0.4% 3.2% 1.4 x 1.2 x n.m. 38.9 x
Cvent, Inc. 28.04 76.9% 1,229 168 (168) 1,061 178 90.2% 22.9% 70.2% 10.2% 12.0% 6.0 x 4.8 x 58.4 x 40.3 x
Benefitfocus, Inc. 36.79 74.6% 1,117 56 (2) 1,115 174 93.3% 23.4% 36.3% (22.5%) (11.3%) 6.4 x 5.2 x n.m. n.m.
Qualys, Inc. 46.48 93.0% 1,832 127 (127) 1,704 168 n.a 23.8% 77.2% 25.9% 27.1% 10.1 x 8.2 x 39.0 x 30.2 x
HubSpot, Inc. 39.90 90.0% 1,435 124 (124) 1,311 161 58.4% 26.3% 68.0% (22.2%) (15.9%) 8.1 x 6.4 x n.m. n.m.
SPS Commerce, Inc. 67.10 95.3% 1,153 131 (131) 1,022 157 n.a 19.5% 68.7% 13.8% 14.9% 6.5 x 5.5 x 47.2 x 36.7 x
Xero Limited. 18.06 60.3% 2,444 128 (128) 2,316 144 94.9% 59.1% 65.7% (26.0%) (8.7%) 16.1 x 10.1 x n.m. n.m.
Marin Software Incorporated 6.29 49.7% 231 68 (65) 166 115 n.a 17.0% 64.2% (9.8%) (4.1%) 1.4 x 1.2 x n.m. n.m.
SciQuest, Inc. 16.93 61.6% 468 131 (131) 337 108 n.a 11.7% 69.1% 20.6% 21.6% 3.1 x 2.8 x 15.2 x 12.9 x
Rally Software Development Corp. 15.69 99.4% 410 67 (67) 344 103 77.8% 21.6% 77.6% (18.4%) (2.7%) 3.3 x 2.7 x n.m. n.m.
Textura Corporation 27.18 89.0% 729 67 (66) 663 99 n.a 40.1% 79.6% 11.7% 11.5% 6.7 x 4.8 x 57.3 x 41.4 x
ChannelAdvisor Corporation 9.69 24.6% 242 68 (65) 178 96 n.a 16.3% 71.5% (17.1%) (10.5%) 1.9 x 1.6 x n.m. n.m.
Halogen Software Inc. 7.25 91.9% 162 44 (44) 117 67 87.7% 19.4% 71.8% (13.6%) (9.4%) 1.7 x 1.5 x n.m. n.m.
Craneware plc 7.99 95.6% 216 36 (36) 179 50 87.3% 8.2% 95.4% 30.4% 30.7% 3.6 x 3.3 x 11.9 x 10.9 x
StatPro Group plc 1.17 87.2% 79 4 (4) 75 48 n.a. 3.9% n.a. 14.4% 15.3% 1.6 x 1.5 x 10.7 x 9.7 x
25th percentile 60.9% 97 84.9% 14.2% 68.1% (17.7%) (9.1%) 1.8 x 1.5 x 13.5 x 12.4 x
Median 87.2% 115 88.2% 19.5% 69.6% 0.4% 3.2% 3.6 x 3.3 x 39.0 x 33.5 x
75th percentile 92.4% 165 91.0% 23.6% 75.8% 14.1% 15.1% 6.6 x 5.3 x 52.3 x 39.2 x
7
Global SaaS: Selected Publicly Traded Companies
Note: Calendarised to December year end; $ millions, except share price data; Multiples capped at 100x EV / Revenue and 100x EV / EBITDA; Net debt includes minority interest
Note: Market cap classifications categorised by CY2015E revenue:
• Large Cap: Revenues greater than $500m
• Mid Cap: Revenues between $200m and $500m
• Small Cap: Revenues less than $200m
Source: Capital IQ

8
Disclaimer:
This document has been produced by Results International Group LLP (“Results”) and is furnished to you solely for your information and may not be reproduced or redistributed, in whole or in part, to any other person. No representation or warranty (expressed or implied) is made as to, and no reliance should be placed on, the fairness, accuracy or completeness of the information contained herein and, accordingly, none of Results’ officers or employees accepts any liability whatsoever arising directly or indirectly from the use of this document.
Authorised and regulated by the Financial Conduct Authority.
Contact Us
27 Soho Square, London, W1D 3AY
t +44 20 7629 7575 | f +44 20 7629 2233
www.resultsig.com
Julie Langley
Partner
Di: +44 (0) 20 7514 8247
Chris Lewis
Managing Director
Di: +44 (0) 20 7514 8236
588 Broadway, Suite 1010, New York, NY 10012
t +1 646 747 6500
www.resultsig.com
Pierre-Georges Roy
Partner
Di: +1 646 747 6505
Maurice Watkins
Partner
Di: +1 646 747 6500