saas - 2014 market review
TRANSCRIPT


Deep domain expertise in three inter-related sectors… … and broad industry networks
A market-leading corporate finance advisory firm…
• Founded in 1991
• Entrepreneurial and owner-managed
• 40 person team; 250+ completed transactions
• Broad global network
• Creative solutions
• Senior level focus on every transaction
…with global reach
About Results International
1

Results International Global SaaS Indices
2
-3.1%
+13.4%
+3.8%
-30.1%
-11.6%
Q4 2014 Performance
Large Cap 7.3%
Mid Cap 13.2%
Small Cap 3.8%
Global SaaS 7.9%
Note: Based on share prices as at 31 December 2014
Note: Indices weighted by market capitalisation
Sources: Capital IQ and Results analysis
60
70
80
90
100
110
120
130
140
150
Dec 13 Jan 14 Feb 14 Mar 14 Apr 14 May 14 Jun 14 Jul 14 Aug 14 Sep 14 Oct 14 Nov 14 Dec 14
Large Cap Mid Cap Small Cap Global SaaS Index NASDAQ Comp

Global SaaS Universe: Large & Mid Cap Share Price Performance
3
Q4
-20
14
Last
12 M
on
ths
Large Cap Mid Cap
10.6%
-9.2%
21.9%
2.1% 3.1%
15.4%
3.7%
-1.1%
8.8%
35.2%
13.0% 16.4%
-6.2%
2.3%
7.8%
41.7%
23.7%
46.9%
3.4%
12.0%
7.1%
-20.0%
-10.0%
0.0%
10.0%
20.0%
30.0%
40.0%
50.0%
8.3%
-27.7%
6.0%
-7.8%
7.5%
21.1%
-4.2% -1.9%
1.5%
18.1%
-10.3%
-17.9% -17.7%
-34.0%
-21.1%
-6.1%
50.1%
-1.7%
-46.4%
-4.9%
47.1%
-60.0%
-40.0%
-20.0%
0.0%
20.0%
40.0%
60.0%
Note: Share price performance as at 31 December 2014
Sources: Capital IQ and Results analysis
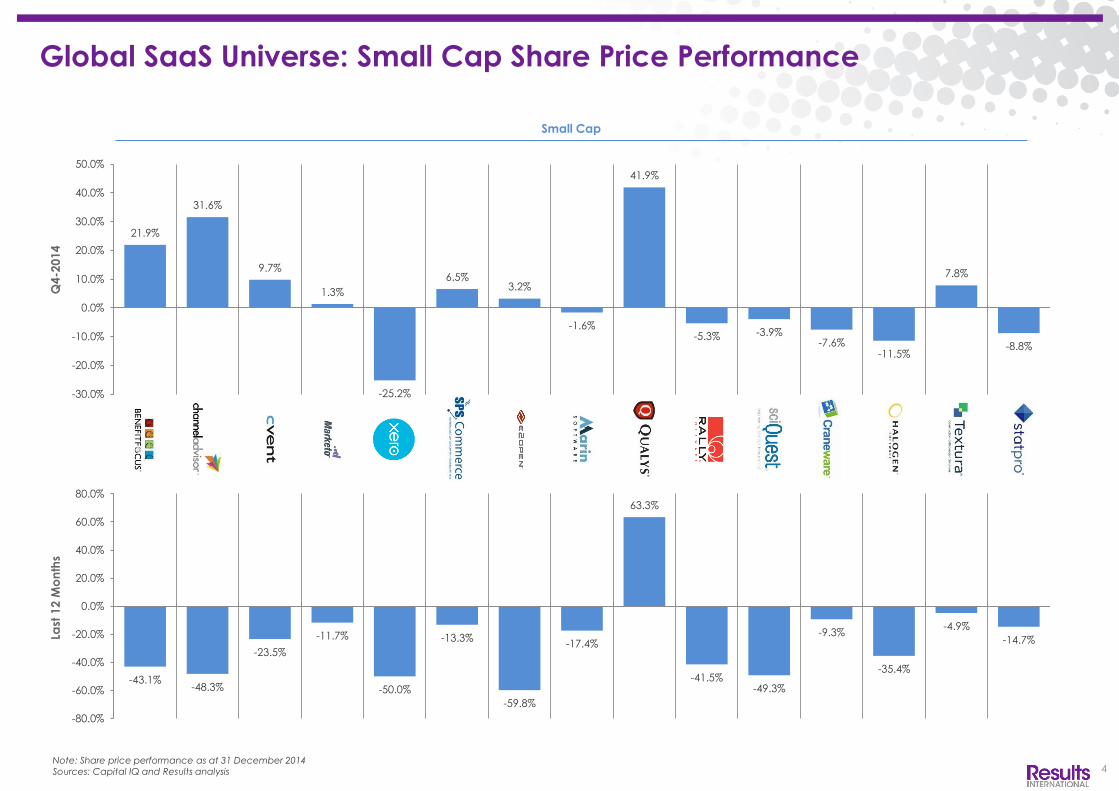
Global SaaS Universe: Small Cap Share Price Performance
4
Q4
-20
14
Last
12 M
on
ths
Small Cap
21.9%
31.6%
9.7%
1.3%
-25.2%
6.5% 3.2%
-1.6%
41.9%
-5.3% -3.9% -7.6%
-11.5%
7.8%
-8.8%
-30.0%
-20.0%
-10.0%
0.0%
10.0%
20.0%
30.0%
40.0%
50.0%
-43.1% -48.3%
-23.5%
-11.7%
-50.0%
-13.3%
-59.8%
-17.4%
63.3%
-41.5% -49.3%
-9.3%
-35.4%
-4.9%
-14.7%
-80.0%
-60.0%
-40.0%
-20.0%
0.0%
20.0%
40.0%
60.0%
80.0%
Note: Share price performance as at 31 December 2014
Sources: Capital IQ and Results analysis

Global SaaS: Valuation Benchmarks
5
EBITDA Margin 2014E EV / EBITDA 2014E
Revenue Growth (2014-15E) EV / Revenue 2014E
8.1x
4.8x
5.6x
6.5 x
0.0x
1.0x
2.0x
3.0x
4.0x
5.0x
6.0x
7.0x
8.0x
9.0x
Large Cap Mid Cap Small Cap Global SaaS
17.5% 16.6%
-15.8%
11.9%
-20.0%
-15.0%
-10.0%
-5.0%
0.0%
5.0%
10.0%
15.0%
20.0%
Large Cap Mid Cap Small Cap Global SaaS
35.3 x
25.9 x
31.0 x 28.9 x
0.0 x
5.0 x
10.0 x
15.0 x
20.0 x
25.0 x
30.0 x
35.0 x
40.0 x
Large Cap Mid Cap Small Cap Global SaaS
Note: EV = Enterprise Value; Financials calendarised to December year end
Note: Median values reported; exclude negative multiples
Note: See Selected Publicly Traded Companies (slides 6 & 7) for details of companies included in each category
Source: Capital IQ
22.4% 21.4% 20.9%
21.9%
0.0%
5.0%
10.0%
15.0%
20.0%
25.0%
30.0%
Large Cap Mid Cap Small Cap Global SaaS

Note: Calendarised to December year end; $ millions, except share price data; Multiples capped at 100x EV / Revenue and 100x EV / EBITDA; Net debt includes minority interest
Note: Market cap classifications categorised by CY2014E revenue:
• Large Cap: Revenues greater than $500m
• Mid Cap: Revenues between $150m and $500m
• Small Cap: Revenues less than $150m
Source: Capital IQ
Global SaaS: Selected Publicly Traded Companies
6
Operating Metrics Valuation Metrics
Price % of 52 Market Total Net Enterprise Revenue Subscription Rev. Growth Gross Margin EBITDA Margin Revenue EBITDA
Company (31-Dec-14) Week High Cap Cash Debt Value CY2014 Historical CY14-15 Historical CY2014 CY2015 CY2014 CY2015 CY2014 CY2015
Large Cap
Salesforce.com, Inc 59.31 88.5% 37,429 845 1,503 38,932 5,262 93.9% 21.9% 76.2% 16.4% 18.1% 7.4 x 6.1 x 45.2 x 33.6 x
Solera Holdings Inc. 51.18 71.9% 3,515 838 1,422 4,937 1,073 n.a 12.2% 68.9% 39.7% 41.2% 4.6 x 4.1 x 11.6 x 10.0 x
Dealertrack Technologies, Inc. 44.31 75.3% 2,472 134 593 3,064 846 37.7% 20.4% 42.4% 22.6% 22.6% 3.6 x 3.0 x 16.0 x 13.3 x
athenahealth, Inc. 145.70 70.5% 5,761 105 108 5,868 747 94.7% 23.0% 59.9% 18.6% 18.0% 7.9 x 6.4 x 42.2 x 35.5 x
Workday, Inc. 81.61 70.1% 15,179 1,822 (1,337) 13,842 758 75.5% 45.4% 62.3% (0.6%) 3.3% 18.3 x 12.6 x n.m. n.m.
Serv iceNow, Inc. 67.85 94.5% 11,261 646 (210) 11,051 678 82.4% 39.9% 63.4% 6.4% 8.8% 16.3 x 11.6 x n.m. n.m.
NetSuite Inc. 109.17 90.4% 8,480 431 (169) 8,311 554 80.5% 30.6% 67.4% 8.7% 8.9% 15.0 x 11.5 x n.m. n.m.
The Ultimate Software Group, Inc. 146.82 85.4% 4,275 89 (81) 4,194 506 81.5% 21.9% 58.9% 23.5% 24.7% 8.3 x 6.8 x 35.3 x 27.5 x
25th percentile 71.6% 647 78.0% 21.5% 59.6% 8.1% 8.9% 6.7 x 5.6 x 16.0 x 13.3 x
Median 80.3% 753 81.5% 22.4% 62.9% 17.5% 18.0% 8.1 x 6.6 x 35.3 x 27.5 x
75th percentile 89.0% 903 88.2% 32.9% 67.8% 22.8% 23.2% 15.3 x 11.5 x 42.2 x 33.6 x
Mid Cap
RealPage, Inc. 21.96 93.6% 1,760 39 (14) 1,745 405 96.1% 9.6% 60.7% 16.6% 18.5% 4.3 x 3.9 x 25.9 x 21.3 x
Medidata Solutions, Inc. 47.75 70.0% 2,665 218 17 2,682 337 82.3% 21.4% 74.7% 22.3% 24.0% 8.0 x 6.6 x 35.7 x 27.3 x
Constant Contact, Inc. 36.70 94.5% 1,249 154 (154) 1,095 331 n.a 17.0% 71.4% 18.3% 19.6% 3.3 x 2.8 x 18.1 x 14.4 x
Veeva Systems Inc. 26.41 66.3% 3,429 350 (350) 3,079 303 69.8% 26.7% 60.7% 27.6% 27.4% 10.2 x 8.0 x 36.8 x 29.2 x
Cornerstone OnDemand, Inc. 35.20 56.9% 1,972 228 (4) 1,968 261 n.a 30.8% 71.1% 1.1% 3.9% 7.5 x 5.8 x n.m. n.m.
IntraLinks Holdings, Inc. 11.90 97.5% 695 45 34 728 255 n.a 6.7% 72.3% 14.6% 16.7% 2.9 x 2.7 x 19.5 x 16.0 x
Fleetmatics Group PLC 35.49 79.7% 1,384 161 (136) 1,248 232 n.a 24.3% 75.3% 30.6% 31.3% 5.4 x 4.3 x 17.6 x 13.9 x
LogMeIn, Inc. 49.34 92.4% 1,257 196 (196) 1,060 221 n.a 16.8% 88.7% 22.3% 22.2% 4.8 x 4.1 x 21.6 x 18.6 x
LivePerson Inc. 14.10 92.5% 802 87 (87) 715 209 n.a 27.1% 76.1% 10.2% 10.8% 3.4 x 2.7 x 33.7 x 24.9 x
Bazaarvoice, Inc. 8.04 92.1% 630 93 (66) 564 184 n.a 13.4% 65.6% (10.1%) (5.2%) 3.1 x 2.7 x n.m. n.m.
Jive Software, Inc. 6.03 52.8% 436 98 (92) 345 178 90.2% 15.6% 62.1% (3.1%) 0.1% 1.9 x 1.7 x n.m. n.m.
Ellie Mae, Inc. 40.32 94.5% 1,238 78 (77) 1,161 157 n.a 26.2% 74.5% 25.7% 18.2% 7.4 x 5.9 x 28.9 x 32.3 x
Demandware, Inc. 57.54 70.0% 2,214 258 (256) 1,958 155 92.3% 38.1% 73.0% 6.3% 7.1% 12.6 x 9.1 x n.m. n.m.
25th percentile 70.0% 184 82.3% 15.6% 65.6% 6.3% 7.1% 3.3 x 2.7 x 19.5 x 16.0 x
Median 92.1% 232 90.2% 21.4% 72.3% 16.6% 18.2% 4.8 x 4.1 x 25.9 x 21.3 x
75th percentile 93.6% 303 92.3% 26.7% 74.7% 22.3% 22.2% 7.5 x 5.9 x 33.7 x 27.3 x

7
Global SaaS: Selected Publicly Traded Companies
Note: Calendarised to December year end; $ millions, except share price data; Multiples capped at 100x EV / Revenue and 100x EV / EBITDA; Net debt includes minority interest
Note: Market cap classifications categorised by CY2014E revenue:
• Large Cap: Revenues greater than $500m
• Mid Cap: Revenues between $150m and $500m
• Small Cap: Revenues less than $150m
Source: Capital IQ
Operating Metrics Valuation Metrics
Price % of 52 Market Total Net Enterprise Revenue Subscription Rev. Growth Gross Margin EBITDA Margin Revenue EBITDA
Company (31-Dec-14) Week High Cap Cash Debt Value CY2014 Historical CY14-15 Historical CY2014 CY2015 CY2014 CY2015 CY2014 CY2015
Small Cap
Marketo, Inc. 32.72 72.7% 1,508 119 (112) 1,396 149 88.7% 35.4% 60.4% (17.1%) (11.8%) 9.4 x 6.9 x n.m. n.m.
Cvent, Inc. 27.84 62.8% 1,257 190 (190) 1,067 142 90.2% 25.4% 71.0% 11.9% 11.3% 7.5 x 6.0 x 63.1 x 53.1 x
Benefitfocus, Inc. 32.84 42.6% 917 72 (33) 883 136 93.3% 26.7% 40.4% (36.2%) (24.2%) 6.5 x 5.1 x n.m. n.m.
Qualys, Inc. 37.75 92.7% 1,461 109 (109) 1,351 133 n.a 20.7% 77.2% 21.0% 21.1% 10.2 x 8.4 x 48.3 x 39.9 x
SPS Commerce, Inc. 56.63 78.9% 962 141 (141) 821 127 n.a 21.9% 69.6% 13.6% 14.0% 6.5 x 5.3 x 47.4 x 37.9 x
SciQuest, Inc. 14.45 44.2% 397 115 (115) 282 103 n.a 6.1% 69.6% 18.7% 20.3% 2.7 x 2.6 x 14.6 x 12.7 x
Xero Limited. 12.61 91.8% 1,600 164 (164) 1,436 88 94.9% 72.9% 65.7% (40.4%) (27.4%) 16.4 x 9.5 x n.m. n.m.
Marin Software Incorporated 8.46 66.9% 304 84 (79) 224 98 n.a 19.1% 59.8% (19.8%) (10.3%) 2.3 x 1.9 x n.m. n.m.
Rally Software Development Corp. 11.37 47.4% 289 77 (77) 212 86 77.8% 19.4% 77.6% (25.3%) (20.4%) 2.5 x 2.1 x n.m. n.m.
ChannelAdvisor Corporation 21.58 43.2% 564 85 (80) 484 87 n.a 28.2% 73.4% (21.3%) (11.3%) 5.6 x 4.3 x n.m. n.m.
E2open, Inc. 9.61 32.2% 281 30 (24) 256 82 58.4% 20.0% 59.6% (19.0%) (10.0%) 3.1 x 2.6 x n.m. n.m.
Textura Corporation 28.47 78.4% 724 68 (67) 657 69 n.a 43.0% 62.1% (3.9%) 12.4% 9.5 x 6.6 x n.m. 53.4 x
Halogen Software Inc. 7.34 59.6% 165 52 (52) 113 56 87.7% 20.9% 74.8% (15.8%) (12.9%) 2.0 x 1.6 x n.m. n.m.
StatPro Group plc 1.13 78.8% 76 5 (5) 71 49 n.a. 2.8% n.a. 13.6% 14.9% 1.5 x 1.4 x 10.7 x 9.5 x
Craneware plc 7.42 74.7% 200 33 (33) 167 44 87.3% 12.4% 95.0% 28.8% 29.0% 3.8 x 3.4 x 13.1 x 11.6 x
25th percentile 45.8% 75 84.9% 19.3% 60.8% (20.5%) (12.4%) 2.6 x 2.3 x 13.5 x 12.1 x
Median 66.9% 88 88.2% 20.9% 69.6% (15.8%) (10.0%) 5.6 x 4.3 x 31.0 x 37.9 x
75th percentile 78.6% 130 91.0% 27.5% 74.5% 13.6% 14.4% 8.5 x 6.3 x 48.1 x 46.5 x

27 Soho Square, London, W1D 3AY
t +44 20 7629 7575 | f +44 20 7629 2233
www.resultsig.com
Chris Lewis
Managing Director
Di: +44 (0) 20 7514 8236
8
Julie Langley
Partner
Di: +44 (0) 20 7514 8247
Disclaimer:
This document has been produced by Results International Group LLP (“Results”) and is furnished to you solely for your information and may not be reproduced or redistributed, in whole or in part, to any other person. No representation or warranty (expressed or implied) is made as to, and no reliance should be placed on, the fairness, accuracy or completeness of the information contained herein and, accordingly, none of Results’ officers or employees accepts any liability whatsoever arising directly or indirectly from the use of this document.
Authorised and regulated by the Financial Conduct Authority.
Contact Us