saab interim report january-june 2018 · 15,358 15,719 jan-jun 2015 jan-jun 2016 jan-jun 2017...
TRANSCRIPT
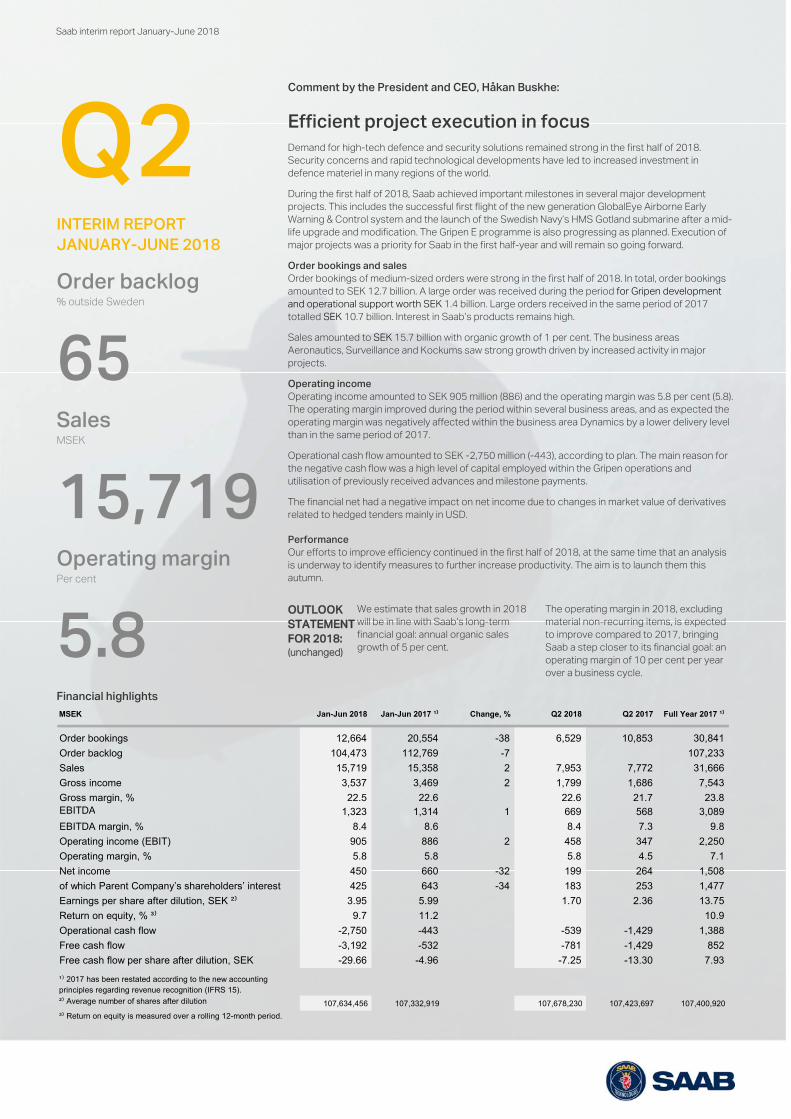
Financial highlights MSEK Jan-Jun 2018 Jan-Jun 2017 ¹⁾ Change, % Q2 2018 Q2 2017 Full Year 2017 ¹⁾
Order bookings 12,664 20,554 -38 6,529 10,853 30,841
Order backlog 104,473 112,769 -7 107,233
Sales 15,719 15,358 2 7,953 7,772 31,666
Gross income 3,537 3,469 2 1,799 1,686 7,543
Gross margin, % 22.5 22.6 22.6 21.7 23.8EBITDA 1,323 1,314 1 669 568 3,089
EBITDA margin, % 8.4 8.6 8.4 7.3 9.8
Operating income (EBIT) 905 886 2 458 347 2,250
Operating margin, % 5.8 5.8 5.8 4.5 7.1
Net income 450 660 -32 199 264 1,508
of which Parent Company’s shareholders’ interest 425 643 -34 183 253 1,477
Earnings per share after dilution, SEK ²⁾ 3.95 5.99 1.70 2.36 13.75
Return on equity, % ³⁾ 9.7 11.2 10.9
Operational cash flow -2,750 -443 -539 -1,429 1,388
Free cash flow -3,192 -532 -781 -1,429 852
Free cash flow per share after dilution, SEK -29.66 -4.96 -7.25 -13.30 7.93
¹⁾ 2017 has been restated according to the new accounting principles regarding revenue recognition (IFRS 15).
²⁾ Average number of shares after dilution 107,634,456 107,332,919 107,678,230 107,423,697 107,400,920
³⁾ Return on equity is measured over a rolling 12-month period.
Saab interim report January-June 2018
Q2 INTERIM REPORT JANUARY-JUNE 2018
Comment by the President and CEO, Håkan Buskhe:
Efficient project execution in focus Demand for high-tech defence and security solutions remained strong in the first half of 2018. Security concerns and rapid technological developments have led to increased investment in defence materiel in many regions of the world. During the first half of 2018, Saab achieved important milestones in several major development projects. This includes the successful first flight of the new generation GlobalEye Airborne Early Warning & Control system and the launch of the Swedish Navy’s HMS Gotland submarine after a mid-life upgrade and modification. The Gripen E programme is also progressing as planned. Execution of major projects was a priority for Saab in the first half-year and will remain so going forward. Order bookings and sales Order bookings of medium-sized orders were strong in the first half of 2018. In total, order bookings amounted to SEK 12.7 billion. A large order was received during the period for Gripen development and operational support worth SEK 1.4 billion. Large orders received in the same period of 2017 totalled SEK 10.7 billion. Interest in Saab’s products remains high. Sales amounted to SEK 15.7 billion with organic growth of 1 per cent. The business areas Aeronautics, Surveillance and Kockums saw strong growth driven by increased activity in major projects. Operating income Operating income amounted to SEK 905 million (886) and the operating margin was 5.8 per cent (5.8). The operating margin improved during the period within several business areas, and as expected the operating margin was negatively affected within the business area Dynamics by a lower delivery level than in the same period of 2017. Operational cash flow amounted to SEK -2,750 million (-443), according to plan. The main reason for the negative cash flow was a high level of capital employed within the Gripen operations and utilisation of previously received advances and milestone payments. The financial net had a negative impact on net income due to changes in market value of derivatives related to hedged tenders mainly in USD.
Performance Our efforts to improve efficiency continued in the first half of 2018, at the same time that an analysis is underway to identify measures to further increase productivity. The aim is to launch them this autumn.
Order backlog % outside Sweden
65 Sales MSEK
15,719 Operating margin Per cent
5.8 OUTLOOK STATEMENT FOR 2018: (unchanged)
We estimate that sales growth in 2018 will be in line with Saab’s long-term financial goal: annual organic sales growth of 5 per cent.
The operating margin in 2018, excluding material non-recurring items, is expected to improve compared to 2017, bringing Saab a step closer to its financial goal: an operating margin of 10 per cent per year over a business cycle.
2 2018: Q2
Saab interim report January-June 2018
The comparative year 2017 is restated to reflect the new accounting principle that applies as of 2018 for revenue recognition, IFRS 15 Revenue from Contracts with Customers. For more information, see note 2.
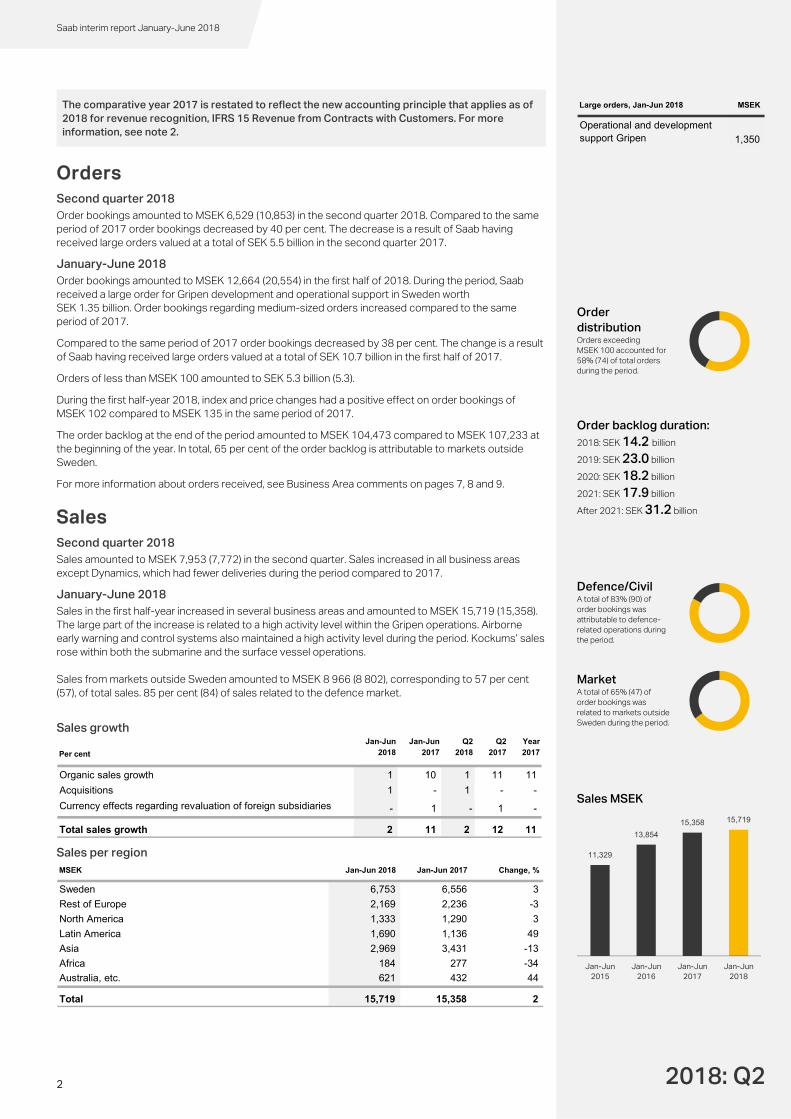
Orders Second quarter 2018 Order bookings amounted to MSEK 6,529 (10,853) in the second quarter 2018. Compared to the same period of 2017 order bookings decreased by 40 per cent. The decrease is a result of Saab having received large orders valued at a total of SEK 5.5 billion in the second quarter 2017. January-June 2018 Order bookings amounted to MSEK 12,664 (20,554) in the first half of 2018. During the period, Saab received a large order for Gripen development and operational support in Sweden worth SEK 1.35 billion. Order bookings regarding medium-sized orders increased compared to the same period of 2017. Compared to the same period of 2017 order bookings decreased by 38 per cent. The change is a result of Saab having received large orders valued at a total of SEK 10.7 billion in the first half of 2017. Orders of less than MSEK 100 amounted to SEK 5.3 billion (5.3). During the first half-year 2018, index and price changes had a positive effect on order bookings of MSEK 102 compared to MSEK 135 in the same period of 2017. The order backlog at the end of the period amounted to MSEK 104,473 compared to MSEK 107,233 at the beginning of the year. In total, 65 per cent of the order backlog is attributable to markets outside Sweden. For more information about orders received, see Business Area comments on pages 7, 8 and 9.
Sales Second quarter 2018 Sales amounted to MSEK 7,953 (7,772) in the second quarter. Sales increased in all business areas except Dynamics, which had fewer deliveries during the period compared to 2017. January-June 2018 Sales in the first half-year increased in several business areas and amounted to MSEK 15,719 (15,358). The large part of the increase is related to a high activity level within the Gripen operations. Airborne early warning and control systems also maintained a high activity level during the period. Kockums’ sales rose within both the submarine and the surface vessel operations. Sales from markets outside Sweden amounted to MSEK 8 966 (8 802), corresponding to 57 per cent (57), of total sales. 85 per cent (84) of sales related to the defence market. Sales growth
Sales per region
Per cent
Jan-Jun 2018
Jan-Jun 2017
Q2 2018
Q2 2017
Year 2017
Organic sales growth 1 10 1 11 11
Acquisitions 1 - 1 - -
Currency effects regarding revaluation of foreign subsidiaries - 1 - 1 -
Total sales growth 2 11 2 12 11
MSEK Jan-Jun 2018 Jan-Jun 2017 Change, %
Sweden 6,753 6,556 3
Rest of Europe 2,169 2,236 -3
North America 1,333 1,290 3
Latin America 1,690 1,136 49
Asia 2,969 3,431 -13
Africa 184 277 -34
Australia, etc. 621 432 44
Total 15,719 15,358 2
Order distribution Orders exceeding MSEK 100 accounted for 58% (74) of total orders during the period.
Order backlog duration: 2018: SEK 14.2 billion 2019: SEK 23.0 billion 2020: SEK 18.2 billion 2021: SEK 17.9 billion After 2021: SEK 31.2 billion
Defence/Civil A total of 83% (90) of order bookings was attributable to defence-related operations during the period.
Market A total of 65% (47) of order bookings was related to markets outside Sweden during the period.
Sales MSEK
Large orders, Jan-Jun 2018 MSEK
Operational and development support Gripen 1,350
11,329
13,854
15,358 15,719
Jan-Jun2015
Jan-Jun2016
Jan-Jun2017
Jan-Jun2018
3 2018: Q2
Saab interim report January-June 2018
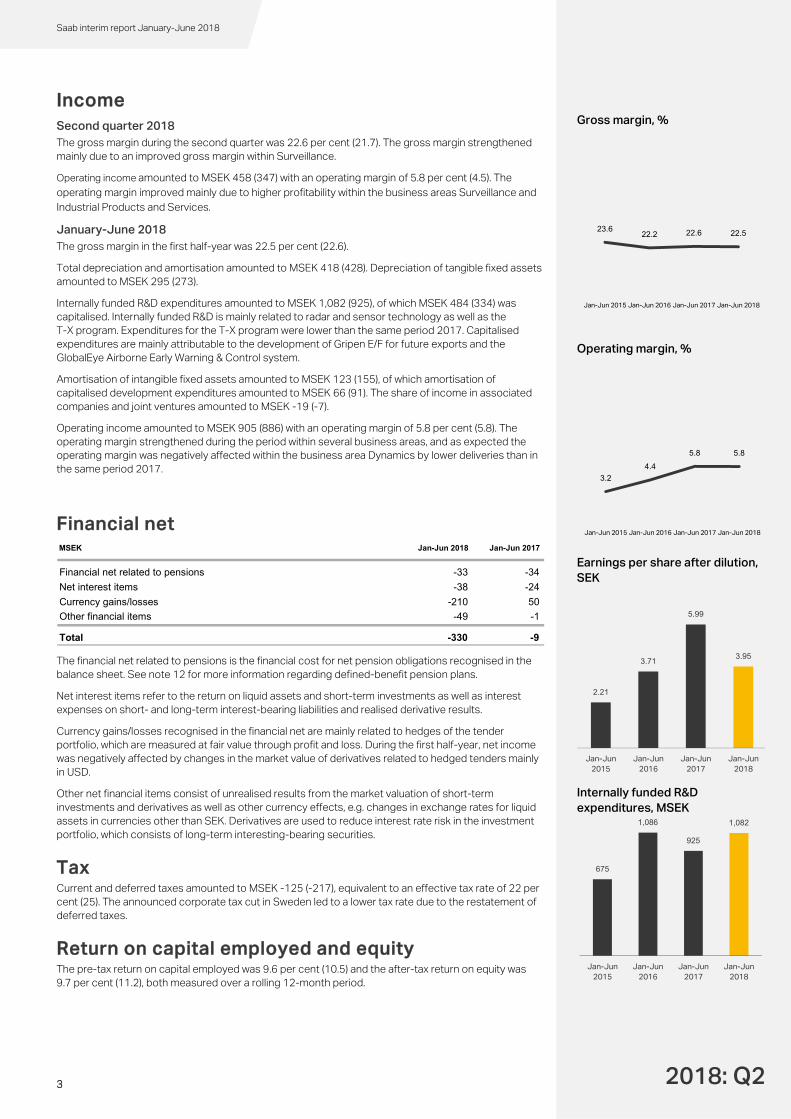
Income Second quarter 2018 The gross margin during the second quarter was 22.6 per cent (21.7). The gross margin strengthened mainly due to an improved gross margin within Surveillance. Operating income amounted to MSEK 458 (347) with an operating margin of 5.8 per cent (4.5). The operating margin improved mainly due to higher profitability within the business areas Surveillance and Industrial Products and Services. January-June 2018 The gross margin in the first half-year was 22.5 per cent (22.6). Total depreciation and amortisation amounted to MSEK 418 (428). Depreciation of tangible fixed assets amounted to MSEK 295 (273). Internally funded R&D expenditures amounted to MSEK 1,082 (925), of which MSEK 484 (334) was capitalised. Internally funded R&D is mainly related to radar and sensor technology as well as the T-X program. Expenditures for the T-X program were lower than the same period 2017. Capitalised expenditures are mainly attributable to the development of Gripen E/F for future exports and the GlobalEye Airborne Early Warning & Control system. Amortisation of intangible fixed assets amounted to MSEK 123 (155), of which amortisation of capitalised development expenditures amounted to MSEK 66 (91). The share of income in associated companies and joint ventures amounted to MSEK -19 (-7). Operating income amounted to MSEK 905 (886) with an operating margin of 5.8 per cent (5.8). The operating margin strengthened during the period within several business areas, and as expected the operating margin was negatively affected within the business area Dynamics by lower deliveries than in the same period 2017.
Financial net
The financial net related to pensions is the financial cost for net pension obligations recognised in the balance sheet. See note 12 for more information regarding defined-benefit pension plans. Net interest items refer to the return on liquid assets and short-term investments as well as interest expenses on short- and long-term interest-bearing liabilities and realised derivative results. Currency gains/losses recognised in the financial net are mainly related to hedges of the tender portfolio, which are measured at fair value through profit and loss. During the first half-year, net income was negatively affected by changes in the market value of derivatives related to hedged tenders mainly in USD. Other net financial items consist of unrealised results from the market valuation of short-term investments and derivatives as well as other currency effects, e.g. changes in exchange rates for liquid assets in currencies other than SEK. Derivatives are used to reduce interest rate risk in the investment portfolio, which consists of long-term interesting-bearing securities.
Tax Current and deferred taxes amounted to MSEK -125 (-217), equivalent to an effective tax rate of 22 per cent (25). The announced corporate tax cut in Sweden led to a lower tax rate due to the restatement of deferred taxes.
Return on capital employed and equity The pre-tax return on capital employed was 9.6 per cent (10.5) and the after-tax return on equity was 9.7 per cent (11.2), both measured over a rolling 12-month period.
MSEK Jan-Jun 2018 Jan-Jun 2017
Financial net related to pensions -33 -34
Net interest items -38 -24
Currency gains/losses -210 50
Other financial items -49 -1
Total -330 -9
Gross margin, %
Operating margin, %
Earnings per share after dilution, SEK
Internally funded R&D expenditures, MSEK
23.622.2 22.6 22.5
Jan-Jun 2015 Jan-Jun 2016 Jan-Jun 2017 Jan-Jun 2018
3.2
4.4
5.8 5.8
Jan-Jun 2015 Jan-Jun 2016 Jan-Jun 2017 Jan-Jun 2018
2.21
3.71
5.99
3.95
Jan-Jun2015
Jan-Jun2016
Jan-Jun2017
Jan-Jun2018
675
1,086
925
1,082
Jan-Jun2015
Jan-Jun2016
Jan-Jun2017
Jan-Jun2018
4 2018: Q2
Saab interim report January-June 2018
Financial position and liquidity At the end of June 2018, net debt was MSEK 6,489, an increase of MSEK 4,655 compared to year-end 2017, when net debt amounted to MSEK 1,834. Cash flow from operating activities amounted to MSEK -2,003. Accounts receivable decreased by MSEK 687 during the period due to deliveries mainly made within the business areas Dynamics and Surveillance. Due to the level of completion of large projects, contractual assets increased by MSEK 2,384 during the period at the same time that the contractual liabilities decreased by MSEK 1,484. Inventories increased by MSEK 869 during the period. The increase mainly relates to future deliveries within the business area Dynamics. Net provisions for pensions, excluding the special employer’s contribution, amounted to MSEK 3,429 as of 30 June 2018, compared to MSEK 2,646 at year-end 2017. The change had a negative effect on net debt of MSEK 783. The increase in provisions is mainly due to a reduction in the discount rate used to calculate the pension obligation to 2,25 per cent from 2,50 per cent during the period and an increase in the inflation assumption to 2,00 per cent from 1,75 per cent. For further information on Saab’s defined-benefit pension plans, see note 12. Tangible fixed assets amounted to MSEK 5,693 at the end of the period. As of 1 January 2018, investment properties are no longer recognised as a separate item and are included in tangible fixed assets. During the period, net investments amounted to approximately MSEK 1,247 (955). Investments in tangible fixed assets amounted to MSEK 667 (556). Investments in intangible fixed assets amounted to MSEK 586 (421), of which MSEK 484 (334) related to capitalised R&D expenditures and MSEK 102 (87) to other intangible fixed assets. In addition, a dividend of MSEK 588 was paid to the Parent Company’s shareholders. Capitalised development expenditures on the balance sheet increased by MSEK 380. The increase is mainly related to investments to develop Gripen E/F for future exports. As of 30 June 2018, short-term investments and liquid assets amounted to MSEK 5,616, a decrease of MSEK 1,055 compared to year-end 2017. MSEK 2,750 in funding was raised during the first half of 2018. For further information on Saab’s liabilities to credit institutions, see note 7. In total, capital employed increased by MSEK 3,011 during the period to MSEK 26,310. Currency exchange rate differences in liquid assets and unrealised results from financial investments had a negative effect on net debt of MSEK 42.
Key indicators of financial position and liquidity
Change in net debt Jan-Jun 2018
MSEK
Net liquidity (+) / net debt (-), 31 Dec 2017 -1,834
Cash flow from operating activities -2,003
Change in net pension obligation -783
Net investments -1,247
Sale of subsidiaries and acquisitions of operations 8
Dividend -588
Currency impact and unrealised results from financial investments -42
Net liquidity (+) / net debt (-), 30 Jun 2018 -6,489
MSEK 30 Jun 2018 31 Dec 2017 Change 30 Jun 2017
Net liquidity / debt ²⁾ -6,489 -1,834 -4,655 -3,196
Intangible fixed assets 8,407 7,862 545 7,276
Goodwill 5,294 5,177 117 5,120
Capitalised development costs 2,740 2,360 380 1,893
Other intangible fixed assets 373 325 48 263
Tangible fixed assets, etc ³⁾ 6,045 5,663 382 5,360
Inventories 9,116 8,247 869 8,101
Accounts receivable 3,655 4,342 -687 3,711
Contract assets ⁴⁾ 10,384 8,000 2,384 7,308
Contract liabilities ⁴⁾ 8,028 9,512 -1,484 7,422
Equity/assets ratio, % 28.7 31.7 32.3
Return on equity, % 9.7 10.9 11.2
Equity per share, SEK ¹⁾ 126.17 131.96 -5.79 122.15
1) Number of shares excluding treasury shares 107,051,054 106,823,782 106,605,294
3) Including tangible fixed assets and biological assets.
4) Relate to long-term customer contracts and services according to IFRS 15 revenue recognition over time.
2) The Group's net liquidity/debt refers to liquid assets, short-term investments and interest-bearing receivables less interest-bearing liabilities and provisions for pensions excluding provisions for pensions attributable to special employers' contribution. For a detailed break-down of interest-bearing receivables and interest-bearing liabilities, see note 7.
5 2018: Q2
Saab interim report January-June 2018
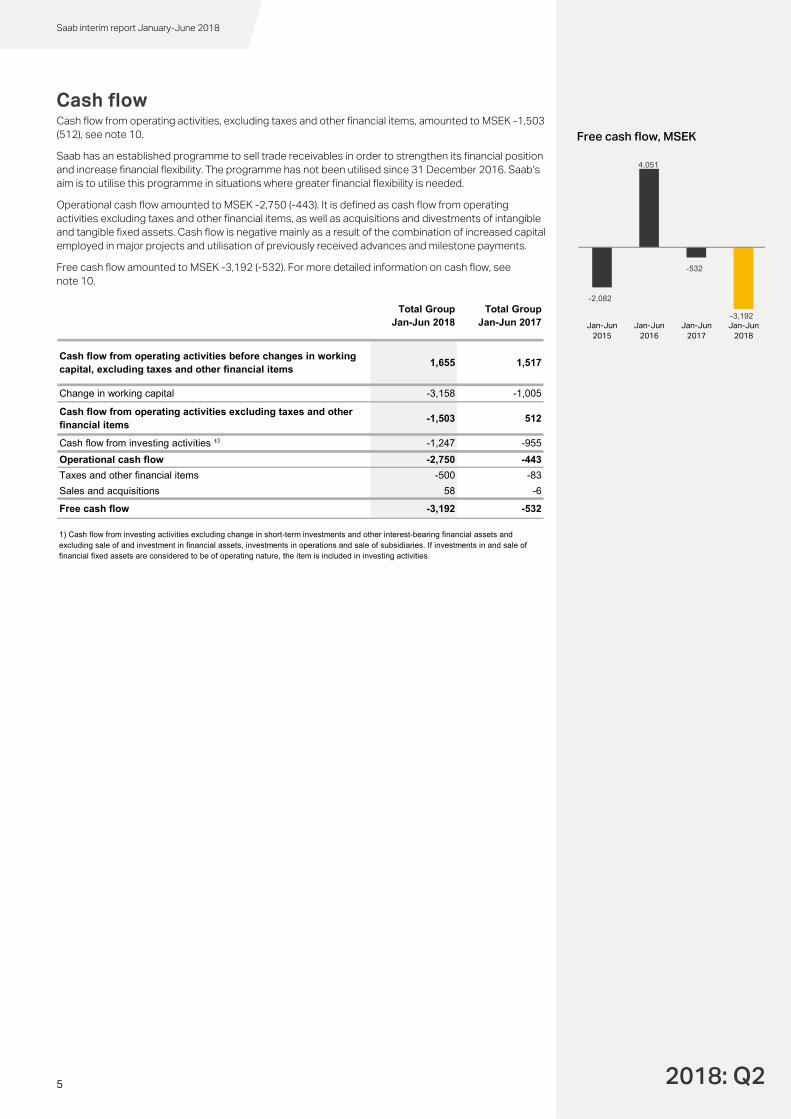
Cash flow Cash flow from operating activities, excluding taxes and other financial items, amounted to MSEK -1,503 (512), see note 10. Saab has an established programme to sell trade receivables in order to strengthen its financial position and increase financial flexibility. The programme has not been utilised since 31 December 2016. Saab’s aim is to utilise this programme in situations where greater financial flexibility is needed. Operational cash flow amounted to MSEK -2,750 (-443). It is defined as cash flow from operating activities excluding taxes and other financial items, as well as acquisitions and divestments of intangible and tangible fixed assets. Cash flow is negative mainly as a result of the combination of increased capital employed in major projects and utilisation of previously received advances and milestone payments. Free cash flow amounted to MSEK -3,192 (-532). For more detailed information on cash flow, see note 10.
Total Group Jan-Jun 2018
Total Group Jan-Jun 2017
Cash flow from operating activities before changes in working capital, excluding taxes and other financial items
1,655 1,517
Change in working capital -3,158 -1,005
Cash flow from operating activities excluding taxes and other financial items
-1,503 512
Cash flow from investing activities ¹⁾ -1,247 -955
Operational cash flow -2,750 -443
Taxes and other financial items -500 -83
Sales and acquisitions 58 -6
Free cash flow -3,192 -532
1) Cash flow from investing activities excluding change in short-term investments and other interest-bearing financial assets and excluding sale of and investment in financial assets, investments in operations and sale of subsidiaries. If investments in and sale of financial fixed assets are considered to be of operating nature, the item is included in investing activities.
Free cash flow, MSEK
-2,082
4,051
-532
-3,192 Jan-Jun
2015Jan-Jun
2016Jan-Jun
2017Jan-Jun
2018
6 2018: Q2
Saab interim report January-June 2018
Operating segments For more information about the operating segments, see note 3. Page
7 Business Area Aeronautics
Aeronautics is a world-leading manufacturer of innovative air systems and is engaged in development of military aviation technology.
Business Area Dynamics Dynamics offers a market-leading product portfolio comprising ground combat
weapons, missile systems, torpedoes, unmanned underwater vehicles, training systems and signature management systems for armed forces around the world.
8
Business Area Surveillance Surveillance’s product portfolio includes airborne, ground-based and naval
radar systems, electronic warfare systems, combat systems and C4I solutions.
Business Area Support and Services Support and Services offers reliable, cost-efficient service and support for all
of Saab’s markets. This primarily includes support solutions, technical maintenance and logistics as well as products, solutions and services for military and civil missions.
9 Business Area Industrial Products and Services The business units within Industrial Products and Services are focused on
mainly civilian customers. The business units Aerostructures, Avionics, Traffic Management, and the wholly owned, independent subsidiary Combitech are included in the business area.
Business Area Kockums Kockums’ portfolio includes submarine systems with the Stirling system for
air-independent propulsion, surface combatants, mine hunting systems and autonomous vessels.
7 2018: Q2
Saab interim report January-June 2018
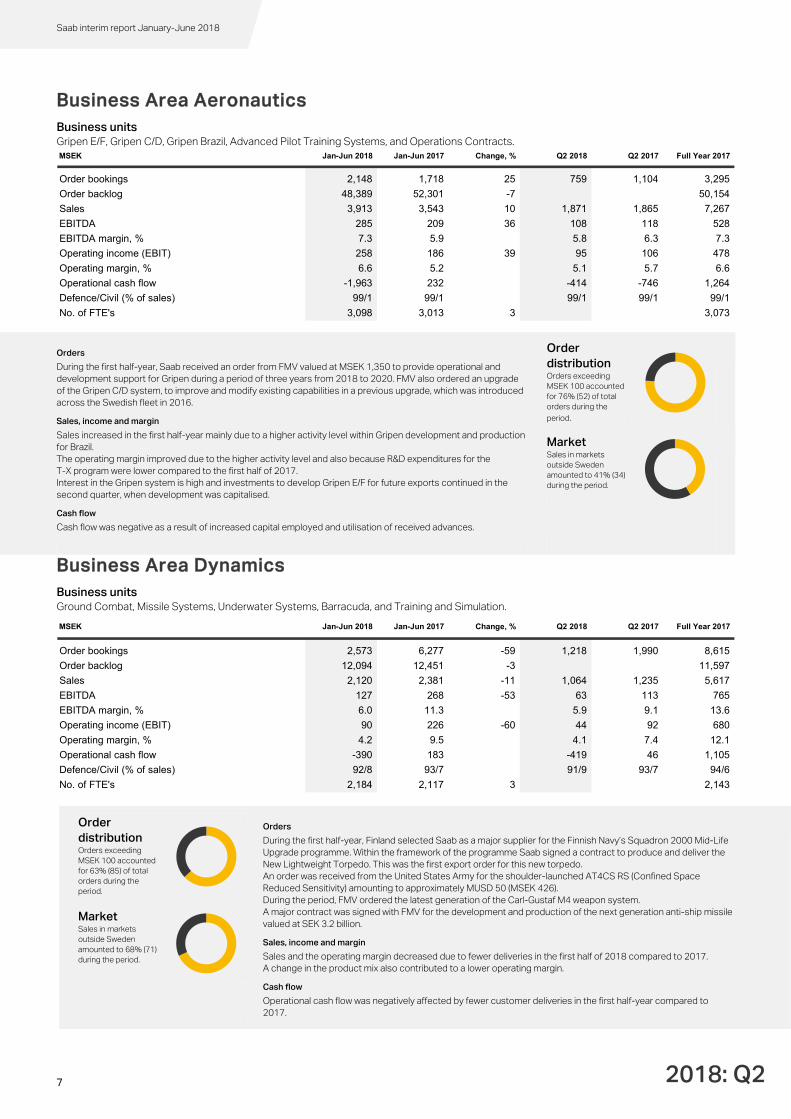
Business Area Aeronautics Business units Gripen E/F, Gripen C/D, Gripen Brazil, Advanced Pilot Training Systems, and Operations Contracts.
Business Area Dynamics Business units Ground Combat, Missile Systems, Underwater Systems, Barracuda, and Training and Simulation.
MSEK Jan-Jun 2018 Jan-Jun 2017 Change, % Q2 2018 Q2 2017 Full Year 2017
Order bookings 2,148 1,718 25 759 1,104 3,295
Order backlog 48,389 52,301 -7 50,154
Sales 3,913 3,543 10 1,871 1,865 7,267
EBITDA 285 209 36 108 118 528
EBITDA margin, % 7.3 5.9 5.8 6.3 7.3
Operating income (EBIT) 258 186 39 95 106 478
Operating margin, % 6.6 5.2 5.1 5.7 6.6
Operational cash flow -1,963 232 -414 -746 1,264
Defence/Civil (% of sales) 99/1 99/1 99/1 99/1 99/1
No. of FTE's 3,098 3,013 3 3,073
MSEK Jan-Jun 2018 Jan-Jun 2017 Change, % Q2 2018 Q2 2017 Full Year 2017
Order bookings 2,573 6,277 -59 1,218 1,990 8,615
Order backlog 12,094 12,451 -3 11,597
Sales 2,120 2,381 -11 1,064 1,235 5,617
EBITDA 127 268 -53 63 113 765
EBITDA margin, % 6.0 11.3 5.9 9.1 13.6
Operating income (EBIT) 90 226 -60 44 92 680
Operating margin, % 4.2 9.5 4.1 7.4 12.1
Operational cash flow -390 183 -419 46 1,105
Defence/Civil (% of sales) 92/8 93/7 91/9 93/7 94/6
No. of FTE's 2,184 2,117 3 2,143
Orders
During the first half-year, Saab received an order from FMV valued at MSEK 1,350 to provide operational and development support for Gripen during a period of three years from 2018 to 2020. FMV also ordered an upgrade of the Gripen C/D system, to improve and modify existing capabilities in a previous upgrade, which was introduced across the Swedish fleet in 2016. Sales, income and margin Sales increased in the first half-year mainly due to a higher activity level within Gripen development and production for Brazil. The operating margin improved due to the higher activity level and also because R&D expenditures for the T-X program were lower compared to the first half of 2017. Interest in the Gripen system is high and investments to develop Gripen E/F for future exports continued in the second quarter, when development was capitalised. Cash flow Cash flow was negative as a result of increased capital employed and utilisation of received advances.
Order distribution Orders exceeding MSEK 100 accounted for 76% (52) of total orders during the period.
Market Sales in markets outside Sweden amounted to 41% (34) during the period.
Order distribution Orders exceeding MSEK 100 accounted for 63% (85) of total orders during the period.
Orders During the first half-year, Finland selected Saab as a major supplier for the Finnish Navy’s Squadron 2000 Mid-Life Upgrade programme. Within the framework of the programme Saab signed a contract to produce and deliver the New Lightweight Torpedo. This was the first export order for this new torpedo. An order was received from the United States Army for the shoulder-launched AT4CS RS (Confined Space Reduced Sensitivity) amounting to approximately MUSD 50 (MSEK 426). During the period, FMV ordered the latest generation of the Carl-Gustaf M4 weapon system. A major contract was signed with FMV for the development and production of the next generation anti-ship missile valued at SEK 3.2 billion. Sales, income and margin Sales and the operating margin decreased due to fewer deliveries in the first half of 2018 compared to 2017. A change in the product mix also contributed to a lower operating margin. Cash flow Operational cash flow was negatively affected by fewer customer deliveries in the first half-year compared to 2017.
Market Sales in markets outside Sweden amounted to 68% (71) during the period.
8 2018: Q2
Saab interim report January-June 2018
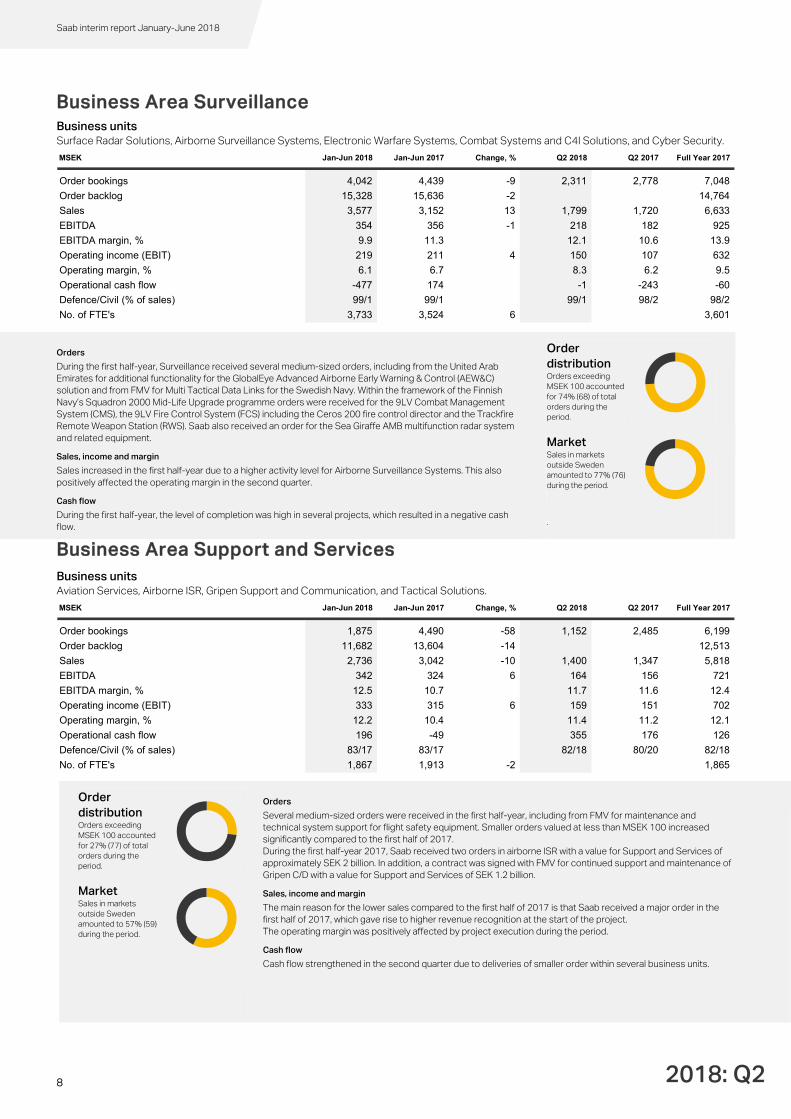
Business Area Surveillance Business units Surface Radar Solutions, Airborne Surveillance Systems, Electronic Warfare Systems, Combat Systems and C4I Solutions, and Cyber Security.
Business Area Support and Services Business units Aviation Services, Airborne ISR, Gripen Support and Communication, and Tactical Solutions.
MSEK Jan-Jun 2018 Jan-Jun 2017 Change, % Q2 2018 Q2 2017 Full Year 2017
Order bookings 4,042 4,439 -9 2,311 2,778 7,048
Order backlog 15,328 15,636 -2 14,764
Sales 3,577 3,152 13 1,799 1,720 6,633
EBITDA 354 356 -1 218 182 925
EBITDA margin, % 9.9 11.3 12.1 10.6 13.9
Operating income (EBIT) 219 211 4 150 107 632
Operating margin, % 6.1 6.7 8.3 6.2 9.5
Operational cash flow -477 174 -1 -243 -60
Defence/Civil (% of sales) 99/1 99/1 99/1 98/2 98/2
No. of FTE's 3,733 3,524 6 3,601
MSEK Jan-Jun 2018 Jan-Jun 2017 Change, % Q2 2018 Q2 2017 Full Year 2017
Order bookings 1,875 4,490 -58 1,152 2,485 6,199
Order backlog 11,682 13,604 -14 12,513
Sales 2,736 3,042 -10 1,400 1,347 5,818
EBITDA 342 324 6 164 156 721
EBITDA margin, % 12.5 10.7 11.7 11.6 12.4
Operating income (EBIT) 333 315 6 159 151 702
Operating margin, % 12.2 10.4 11.4 11.2 12.1
Operational cash flow 196 -49 355 176 126
Defence/Civil (% of sales) 83/17 83/17 82/18 80/20 82/18
No. of FTE's 1,867 1,913 -2 1,865
Orders
During the first half-year, Surveillance received several medium-sized orders, including from the United Arab Emirates for additional functionality for the GlobalEye Advanced Airborne Early Warning & Control (AEW&C) solution and from FMV for Multi Tactical Data Links for the Swedish Navy. Within the framework of the Finnish Navy’s Squadron 2000 Mid-Life Upgrade programme orders were received for the 9LV Combat Management System (CMS), the 9LV Fire Control System (FCS) including the Ceros 200 fire control director and the Trackfire Remote Weapon Station (RWS). Saab also received an order for the Sea Giraffe AMB multifunction radar system and related equipment. Sales, income and margin Sales increased in the first half-year due to a higher activity level for Airborne Surveillance Systems. This also positively affected the operating margin in the second quarter. Cash flow During the first half-year, the level of completion was high in several projects, which resulted in a negative cash flow.
Order distribution Orders exceeding MSEK 100 accounted for 74% (68) of total orders during the period.
Market Sales in markets outside Sweden amounted to 77% (76) during the period.
.
Order distribution Orders exceeding MSEK 100 accounted for 27% (77) of total orders during the period.
Orders Several medium-sized orders were received in the first half-year, including from FMV for maintenance and technical system support for flight safety equipment. Smaller orders valued at less than MSEK 100 increased significantly compared to the first half of 2017. During the first half-year 2017, Saab received two orders in airborne ISR with a value for Support and Services of approximately SEK 2 billion. In addition, a contract was signed with FMV for continued support and maintenance of Gripen C/D with a value for Support and Services of SEK 1.2 billion. Sales, income and margin The main reason for the lower sales compared to the first half of 2017 is that Saab received a major order in the first half of 2017, which gave rise to higher revenue recognition at the start of the project. The operating margin was positively affected by project execution during the period. Cash flow Cash flow strengthened in the second quarter due to deliveries of smaller order within several business units.
Market Sales in markets outside Sweden amounted to 57% (59) during the period.
9 2018: Q2
Saab interim report January-June 2018
Business Area Industrial Products and Services Business units Aerostructures, Avionics Systems, Traffic Management, and Combitech.
Business Area Kockums Business units Submarines and Surface Ships.
MSEK Jan-Jun 2018 Jan-Jun 2017 Change, % Q2 2018 Q2 2017 Full Year 2017
Order bookings 2,645 3,274 -19 1,543 1,830 5,842
Order backlog 11,513 11,954 -4 11,697
Sales 2,950 2,834 4 1,559 1,450 5,635
EBITDA 124 105 18 74 25 213
EBITDA margin, % 4.2 3.7 4.7 1.7 3.8
Operating income (EBIT) 81 56 45 54 0 116
Operating margin, % 2.7 2.0 3.5 - 2.1
Operational cash flow -144 -367 -192 -228 -296
Defence/Civil (% of sales) 31/69 29/71 30/70 28/72 29/71
No. of FTE's 3,470 3,525 -2 3,488
MSEK Jan-Jun 2018 Jan-Jun 2017 Change, % Q2 2018 Q2 2017 Full Year 2017
Order bookings 530 1,834 -71 149 1,685 2,129
Order backlog 7,724 9,360 -17 8,815
Sales 1,625 1,384 17 880 706 2,712
EBITDA 99 87 14 50 46 180
EBITDA margin, % 6.1 6.3 5.7 6.5 6.6
Operating income (EBIT) 84 75 12 42 40 157
Operating margin, % 5.2 5.4 4.8 5.7 5.8
Operational cash flow 423 -140 434 -254 206
Defence/Civil (% of sales) 100/0 100/0 100/0 100/0 100/0
No. of FTE's 1,175 939 25 1,115
Orders
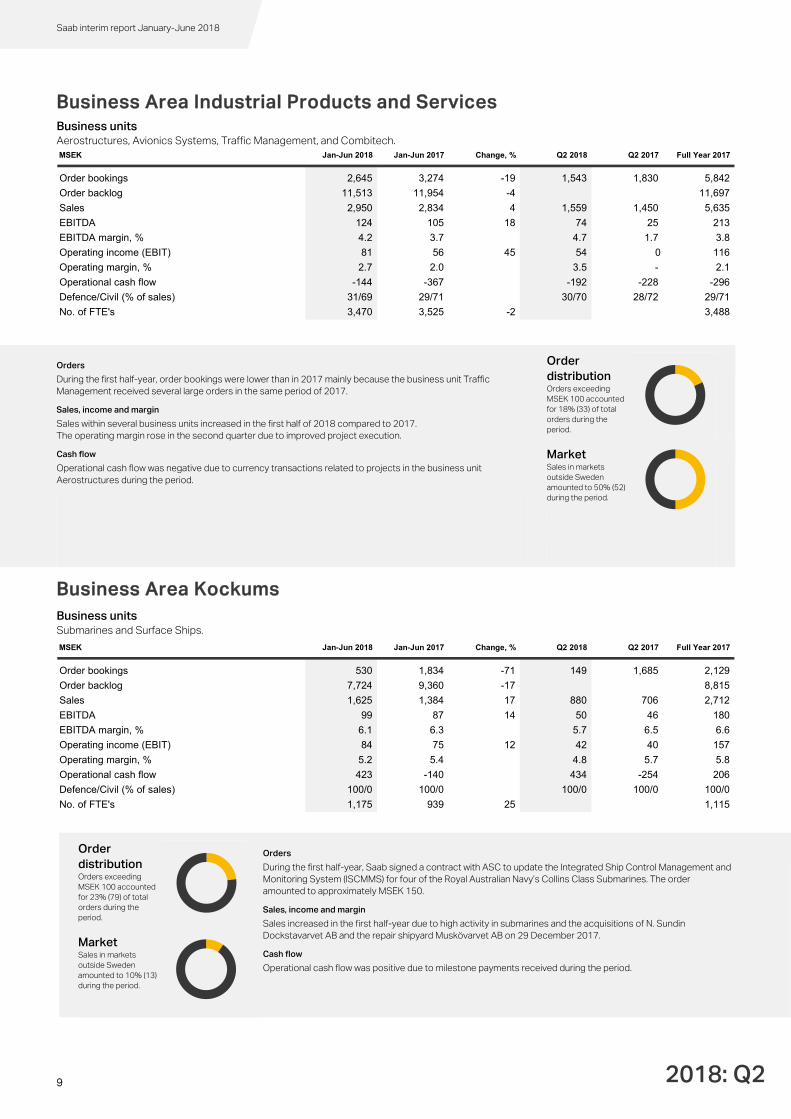
During the first half-year, order bookings were lower than in 2017 mainly because the business unit Traffic Management received several large orders in the same period of 2017. Sales, income and margin Sales within several business units increased in the first half of 2018 compared to 2017. The operating margin rose in the second quarter due to improved project execution. Cash flow Operational cash flow was negative due to currency transactions related to projects in the business unit Aerostructures during the period.
Order distribution Orders exceeding MSEK 100 accounted for 18% (33) of total orders during the period.
Market Sales in markets outside Sweden amounted to 50% (52) during the period.
Order distribution Orders exceeding MSEK 100 accounted for 23% (79) of total orders during the period.
Orders During the first half-year, Saab signed a contract with ASC to update the Integrated Ship Control Management and Monitoring System (ISCMMS) for four of the Royal Australian Navy’s Collins Class Submarines. The order amounted to approximately MSEK 150. Sales, income and margin Sales increased in the first half-year due to high activity in submarines and the acquisitions of N. Sundin Dockstavarvet AB and the repair shipyard Muskövarvet AB on 29 December 2017. Cash flow Operational cash flow was positive due to milestone payments received during the period.
Market Sales in markets outside Sweden amounted to 10% (13) during the period.
10 2018: Q2
Saab interim report January-June 2018
Corporate Corporate comprises Group staff, Group departments, and other operations outside the core operations. Since 1 January 2018, Saab’s minority portfolio is also reported in Corporate. This portfolio contains the interests in Vricon Inc, UMS Skeldar AG and Ventures. Corporate reported income of MSEK -160 (-183) during the first half-year 2018. Operational cash flow attributable to Corporate amounted to MSEK -395 (-476) in the period.
Acquisitions and divestments 2018 No significant acquisitions or divestments were made during the period.
Share repurchase Saab held 2,099,290 treasury shares as of 30 June 2018, compared to 2,326,562 at year-end 2017. The Annual General Meeting on 10 April 2018 authorised the Board of Directors to repurchase up to 10 per cent of Saab’s shares to hedge Saab’s long-term incentive programmes. In June, the Board decided to utilise its authorisation to repurchase series B shares in order to secure delivery of shares to participants in Saab’s long-term Share Matching Plan, Performance Share Plan and Special Projects Incentive. Shares can be acquired as of 23 July 2018 until the Annual General Meeting 2019.
Risks and uncertainties Saab’s operations primarily involve the development, production and supply of technologically advanced hardware and software to military and civilian customers around the world. Projects generally entail significant investments, long periods of time and technological development or refinement of products. In addition to customer and supplier relations, international operations involve joint ventures and collaborations with other industries as well as the establishment of operations abroad. Operations can entail various degrees of risk. The key risk areas are political, operating and financial. Various policies and instructions govern the management of material risks. Saab today conducts more projects involving major development than before, and their inherent complexity raises risk in several dimensions. The market is characterised by challenging conditions where orders are deferred to the future partly for financial reasons, at the same time that customers are also dealing with shorter timeframes. For a general description of the risk areas, see the annual report 2017, pages 54-57.
Owners Saab’s largest shareholders as of 30 June 2018:
Source: Modular Finance The percentage of votes is calculated on the number of shares excluding treasury shares at the end of the period.
Personnel
% of % of
capital votes
Investor AB 30.0 40.2
Knut and Alice Wallenberg Foundation 8.8 7.7
Swedbank Robur funds 4.7 4.1
AFA Insurance 2.8 2.5
Handelsbanken funds 2.2 1.9Norges Bank 2.0 1.8Unionen 1.7 1.5
Livförsäkringsbolaget Skandia 1.7 1.5
Fidelity 1.6 1.4Lannebo funds 1.1 0.9
30 Jun 2018 31 Dec 2017
Number of employees 16,733 16,427
FTE's 16,426 16,171
11 2018: Q2
Saab interim report January-June 2018
Other events January-June 2018 • Saab announced that it would demonstrate its anti-submarine warfare (ASW) training system, the
AUV62-AT, for the U.S. Navy (USN). The AUV62-AT is an artificial acoustic system that mimics a submarine.
• In January, Saab inaugurated a new development centre, STC (Saab Technology Centre), in Tampere, Finland. For the first stage, Saab established a unit at the STC with a focus on Electronic Warfare (EW).
• Saab and Lund University signed a strategic collaboration agreement. Together, they will develop activities within education and research for the benefit of both parties, and make competence, resources and facilities available to both parties. Among the focus areas of the collaboration are electromagnetic field theory, computer sciences, energy sciences and structural mechanics.
• Saab announced in March that Ann-Kristin Adolfsson, Chief Strategy Officer, has been appointed Head of Saab Ventures. Due to her new role, Ann-Kristin Adolfsson left Group Management.
• Saab received an order from the Defence Material Organisation, DMO, for support and update of simulators to the Netherlands Army’s Mobile Combat Training Centre. The order value amounted to MSEK 115.
• On March 14, Saab successfully completed the first flight of the new GlobalEye Airborne Early Warning & Control aircraft, in Linköping, Sweden. GlobalEye combines air, maritime and ground surveillance in one swing-role solution. The system provides users with extended radar range with the Erieye ER radar and better range with the Global 6000 jet platform, combined with the ability to perform multiple roles using a single solution, including search and rescue, border surveillance and military operations.
• The Annual General Meeting on 10 April 2018 resolved to pay shareholders a dividend of SEK 5.50 per share (total MSEK 588). The record date was 12 April 2018 and the dividend was paid out on 17 April 2018.
• The Annual General Meeting resolved to re-elect Håkan Buskhe, Sten Jakobsson, Danica Kragic Jensfelt, Sara Mazur, Daniel Nodhäll, Bert Nordberg, Cecilia Stegö Chilò, Erika Söderberg Johnson, and Joakim Westh and to re-elect Marcus Wallenberg as Chairman of the Board.
• Saab Digital Air Traffic Solutions AB announced that it had been selected by Scandinavian Mountains Airport to install and operate digital towers at its airport. This is the first time digital tower services will be put into operation at a new airport. It also marks the first time Saab will deliver true digital air navigation service provider capabilities. The contract includes the installation of the Saab R-TWR system at the airport in 2018-19 and initial operations from the digital tower centre in Sundsvall from December 2019 for a period of ten years. The airport primarily serves destinations within the region, including the Sälen and Trysil ski resorts, mainly during the winter season, thus enabling the airport to make use of the flexibility of digital tower services from a centralised location.
• In May, Saab unveiled a manufacturing facility for Gripen aerostructures: Saab Aeronáutica Montagens (SAM), in the city of São Bernardo do Campo, in São Paulo state, Brazil.
For more information on significant order received in the first half-year, see page 2 and the comments on the business areas on pages 7-9 and in note 3. All press releases can be found on http://saabgroup.com/Media/news-press/.
Events after the conclusion of the period • In July, FMV extended Saab’s support and maintenance contract for Helicopter 15 in Sweden.
Helicopter 15 (HKP 15) has been in operation in the Swedish Armed Forces for almost 15 years and, since 2012, Saab has had an exclusive agreement to ensure flight time availability. FMV has now chosen to call another option to extend Saab's agreement until the end of 2021.
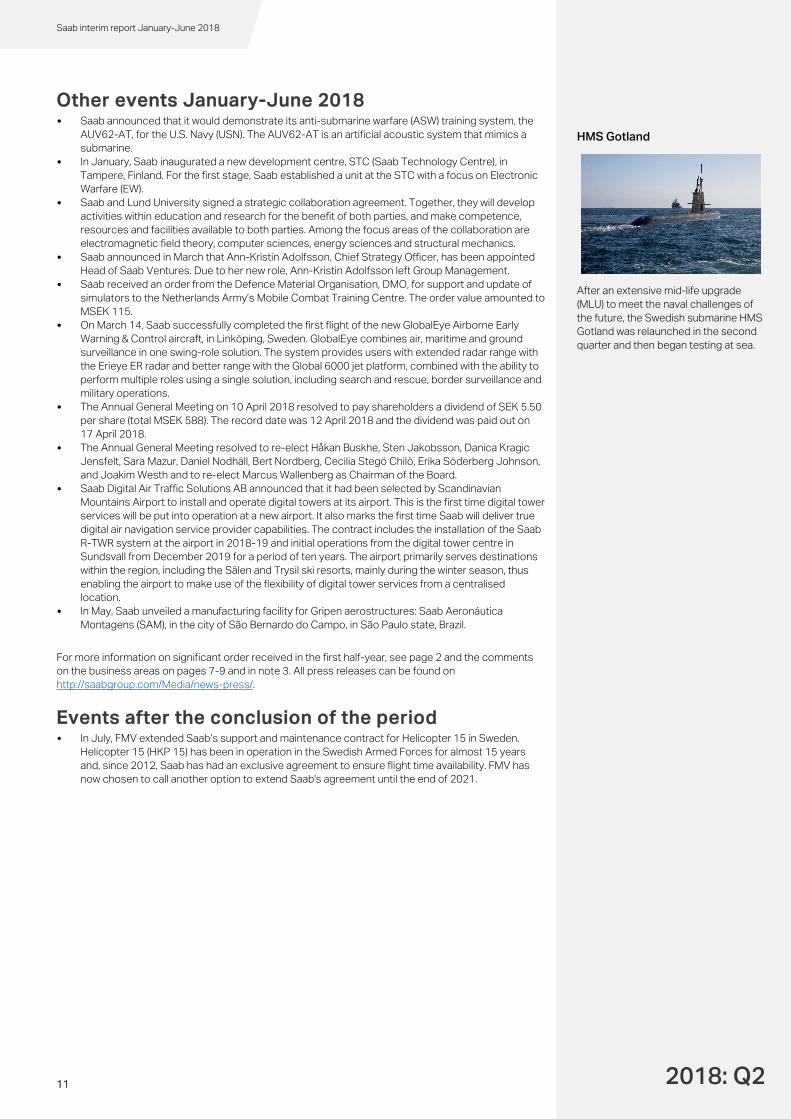
HMS Gotland
After an extensive mid-life upgrade (MLU) to meet the naval challenges of the future, the Swedish submarine HMS Gotland was relaunched in the second quarter and then began testing at sea.
12 2018: Q2
Saab interim report January-June 2018
About Saab Saab serves the global market with world-leading products, services and solutions ranging from military defence to civil security. The company has operations and employees on all continents and constantly develops, adapts and improves new technology to meet customers’ changing needs.
Short facts Saab’s series B share is listed on Nasdaq Stockholm Large Cap Ticker: SAAB B. • Saab has approximately 16,700 employees • Local presence in approximately 35 countries • Customers in more than 100 countries Vision It is a human right to feel safe.
Mission To make people safe by pushing intellectual and technological boundaries. Business concept Saab constantly develops, adapts and improves new technology to meet changing customer needs. Saab serves the global market of governments, authorities and corporations with products, services and solutions for defence, aviation and civil security.
Organisation Saab’s operations are divided into six operating segments for control and reporting purposes: the business areas Aeronautics, Dynamics, Surveillance, Support and Services, Industrial Products and Services, and Kockums. In addition, Corporate comprises Group staff, Group departments and secondary operations. To ensure a presence in key local markets, Saab also has five market areas: Europe, Middle East & Africa, North America, Latin America and Asia Pacific.
Revenue model Saab’s sales are primarily generated from long-term customer contracts, service assignments and the sale of goods. Sales, income and cash flow fluctuate over the course of the year depending on the nature of the project. Long-term customer contracts relate to the development and manufacture of complex systems that stretch over several reporting periods. Long-term customer contracts are recognised in revenue as the project is completed, while cash flows depend on the timing of deliveries, advances and milestone payments during the contract period. Service assignments consist of consulting and support services. Examples include education and ongoing maintenance associated with previous deliveries. Revenue from service assignments is normally recognised when the services are rendered. The third part of the revenue model is the sale of products and spare parts that Saab manufactures and stocks or purchases on behalf of customers. This revenue is recognised when ownership has been transferred to the buyer.
Financial goals Sales Average organic sales growth of 5 per cent per year over a business cycle. Operating margin Average operating margin (EBIT) of at least 10 per cent per year over a business cycle. Equity/assets ratio The equity/assets ratio will exceed 30 per cent. Dividend The long-term dividend goal is to distribute 20–40 per cent of net income to the shareholders over a business cycle.
Saab’s strategy To stay a step ahead in an optimal way and meet our customers’ needs, we have based our strategy on three priorities: market, efficiency and innovation. The aim is to create long-term value by working to achieve them. Sustainability issues affect our entire business, and engaged employees are the key to success. Saab will also maintain a solid balance sheet, focus on capital efficiency and generate strong cash flow. Market We focus on areas where we have a strong market position and on strengthening our position in areas with good growth opportunities. Our global presence and diversity will be strengthened in part through partnerships and local collaborations. We have zero tolerance for corruption and work actively to create a thoroughly transparent defence market. Efficiency The focus is on making functional processes more efficient, developing an even more business-oriented culture and developing leaders and employees. Innovation We concentrate our product portfolio on innovations in five core areas and feel that diversity and engaged employees drive innovation. The five core areas are: aeronautics, advanced weapon systems, command and control systems, sensors and underwater systems.

13 2018: Q2
Saab interim report January-June 2018
Consolidated income statement
Consolidated statement of comprehensive income
MSEK Note Jan-Jun 2018 Jan-Jun 2017 Rolling 12 Months Full Year 2017
Sales 4 15,719 15,358 32,027 31,666
Cost of goods sold -12,182 -11,889 -24,416 -24,123
Gross income 3,537 3,469 7,611 7,543
Gross margin, % 22.5 22.6 23.8 23.8
Other operating income 89 66 127 104
Marketing expenses -1,298 -1,192 -2,536 -2,430
Administrative expenses -723 -731 -1,485 -1,493
Research and development costs -664 -682 -1,330 -1,348
Other operating expenses -17 -37 -67 -87
Share in income of associated companies and joint ventures -19 -7 -51 -39
Operating income (EBIT) ¹⁾ 3 905 886 2,269 2,250
Operating margin, % 5.8 5.8 7.1 7.1
Financial income 32 113 40 121
Financial expenses -362 -122 -512 -272
Net financial items -330 -9 -472 -151
Income before taxes 575 877 1,797 2,099
Taxes -125 -217 -499 -591
Net income for the period 450 660 1,298 1,508
of which Parent Company’s shareholders’ interest 425 643 1,259 1,477
of which non-controlling interest 25 17 39 31
Earnings per share before dilution, SEK ²⁾ 3.98 6.04 11.79 13.86
Earnings per share after dilution, SEK ³⁾ 3.95 5.99 11.70 13.75
1) Includes depreciation/amortisation and write-downs -418 -428 -829 -839
2) Average number of shares before dilution 106,918,084 106,488,262 106,816,584 106,601,672
3) Average number of shares after dilution 107,634,456 107,332,919 107,597,675 107,400,920
MSEK Jan-Jun 2018 Jan-Jun 2017 Rolling 12 Months Full Year 2017
Net income for the period 450 660 1,298 1,508
Other comprehensive income/loss:
Items that will not be reversed in the income statement:
Revaluation of net pension obligations -941 -304 -827 -190
Tax attributable to revaluation of net pension obligations 149 67 125 43
Total -792 -237 -702 -147
Items that may be reversed in the income statement:
Translation differences 265 -218 228 -255
Cash flow hedges 43 467 207 631
Tax attributable to cash flow hedges -11 -104 -44 -137
Total 297 145 391 239
Other comprehensive income/loss for the period -495 -92 -311 92
Net comprehensive income/loss for the period -45 568 987 1,600
of which Parent Company’s shareholders’ interest -64 542 947 1,553
of which non-controlling interest 19 26 40 47
14 2018: Q2
Saab interim report January-June 2018
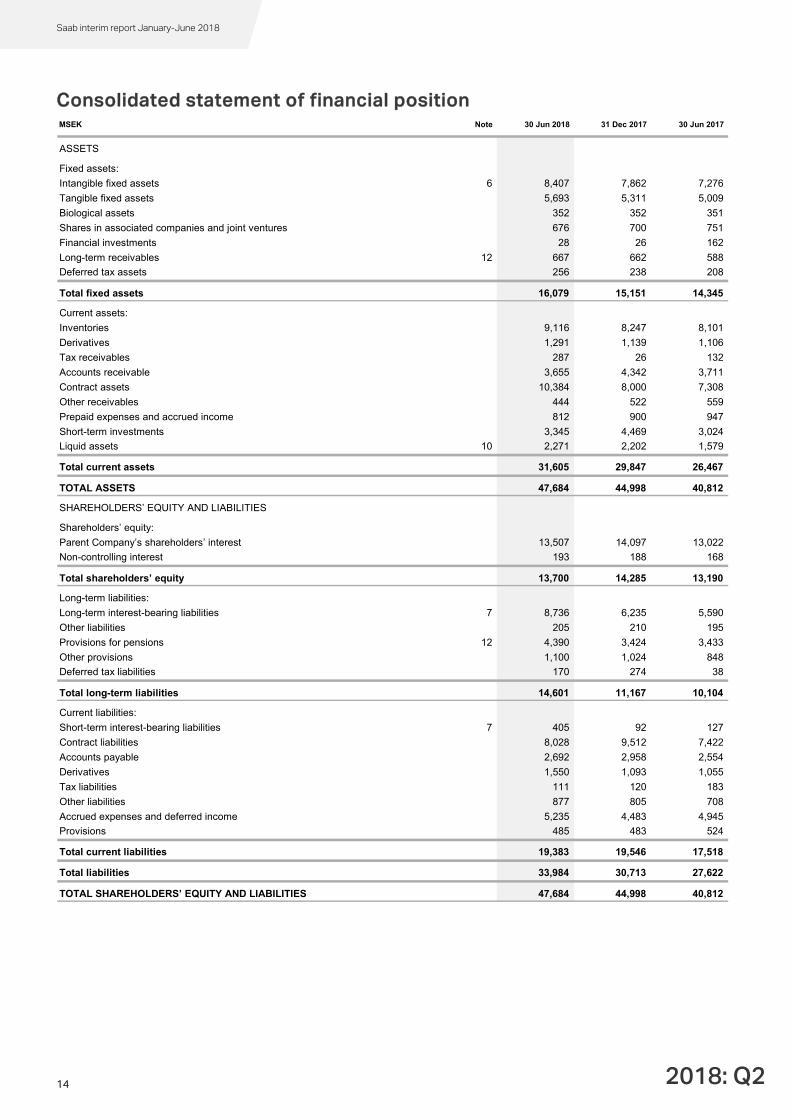
Consolidated statement of financial position
MSEK Note 30 Jun 2018 31 Dec 2017 30 Jun 2017
ASSETS
Fixed assets:
Intangible fixed assets 6 8,407 7,862 7,276
Tangible fixed assets 5,693 5,311 5,009
Biological assets 352 352 351
Shares in associated companies and joint ventures 676 700 751
Financial investments 28 26 162
Long-term receivables 12 667 662 588
Deferred tax assets 256 238 208
Total fixed assets 16,079 15,151 14,345
Current assets:
Inventories 9,116 8,247 8,101
Derivatives 1,291 1,139 1,106
Tax receivables 287 26 132
Accounts receivable 3,655 4,342 3,711
Contract assets 10,384 8,000 7,308
Other receivables 444 522 559
Prepaid expenses and accrued income 812 900 947
Short-term investments 3,345 4,469 3,024
Liquid assets 10 2,271 2,202 1,579
Total current assets 31,605 29,847 26,467
TOTAL ASSETS 47,684 44,998 40,812
SHAREHOLDERS’ EQUITY AND LIABILITIES
Shareholders’ equity:
Parent Company’s shareholders’ interest 13,507 14,097 13,022
Non-controlling interest 193 188 168
Total shareholders’ equity 13,700 14,285 13,190
Long-term liabilities:
Long-term interest-bearing liabilities 7 8,736 6,235 5,590
Other liabilities 205 210 195
Provisions for pensions 12 4,390 3,424 3,433
Other provisions 1,100 1,024 848
Deferred tax liabilities 170 274 38
Total long-term liabilities 14,601 11,167 10,104
Current liabilities:
Short-term interest-bearing liabilities 7 405 92 127
Contract liabilities 8,028 9,512 7,422
Accounts payable 2,692 2,958 2,554
Derivatives 1,550 1,093 1,055
Tax liabilities 111 120 183
Other liabilities 877 805 708
Accrued expenses and deferred income 5,235 4,483 4,945
Provisions 485 483 524
Total current liabilities 19,383 19,546 17,518
Total liabilities 33,984 30,713 27,622
TOTAL SHAREHOLDERS’ EQUITY AND LIABILITIES 47,684 44,998 40,812
15 2018: Q2
Saab interim report January-June 2018
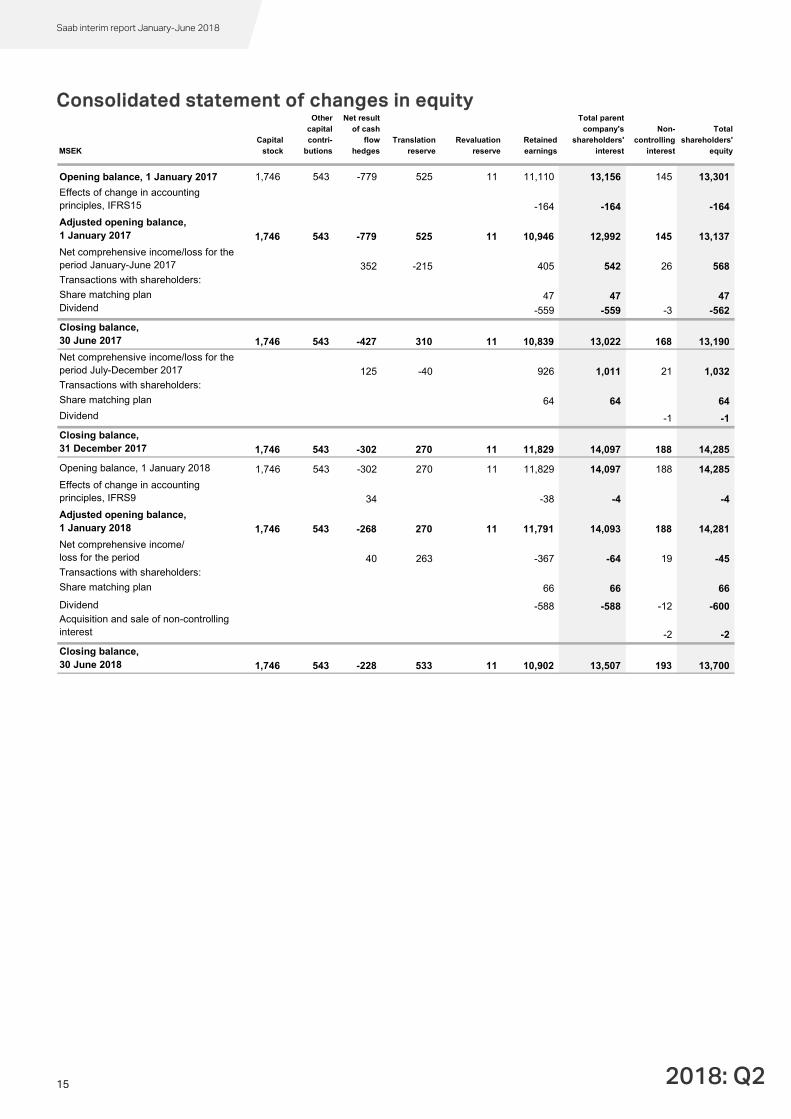
Consolidated statement of changes in equity
MSEK Capital
stock
Other capital contri-
butions
Net result of cash
flow hedges
Translation reserve
Revaluation reserve
Retained earnings
Total parent company's
shareholders' interest
Non-controlling
interest
Total shareholders'
equity
Opening balance, 1 January 2017 1,746 543 -779 525 11 11,110 13,156 145 13,301
Effects of change in accounting principles, IFRS15 -164 -164 -164
Adjusted opening balance, 1 January 2017 1,746 543 -779 525 11 10,946 12,992 145 13,137
Net comprehensive income/loss for the period January-June 2017 352 -215 405 542 26 568Transactions with shareholders:
Share matching plan 47 47 47Dividend -559 -559 -3 -562
Closing balance, 30 June 2017 1,746 543 -427 310 11 10,839 13,022 168 13,190
Net comprehensive income/loss for the period July-December 2017 125 -40 926 1,011 21 1,032Transactions with shareholders:
Share matching plan 64 64 64
Dividend -1 -1
Closing balance, 31 December 2017 1,746 543 -302 270 11 11,829 14,097 188 14,285
Opening balance, 1 January 2018 1,746 543 -302 270 11 11,829 14,097 188 14,285
Effects of change in accounting principles, IFRS9 34 -38 -4 -4
Adjusted opening balance, 1 January 2018 1,746 543 -268 270 11 11,791 14,093 188 14,281
Net comprehensive income/loss for the period 40 263 -367 -64 19 -45Transactions with shareholders:
Share matching plan 66 66 66
Dividend -588 -588 -12 -600Acquisition and sale of non-controlling interest -2 -2
Closing balance, 30 June 2018 1,746 543 -228 533 11 10,902 13,507 193 13,700
16 2018: Q2
Saab interim report January-June 2018
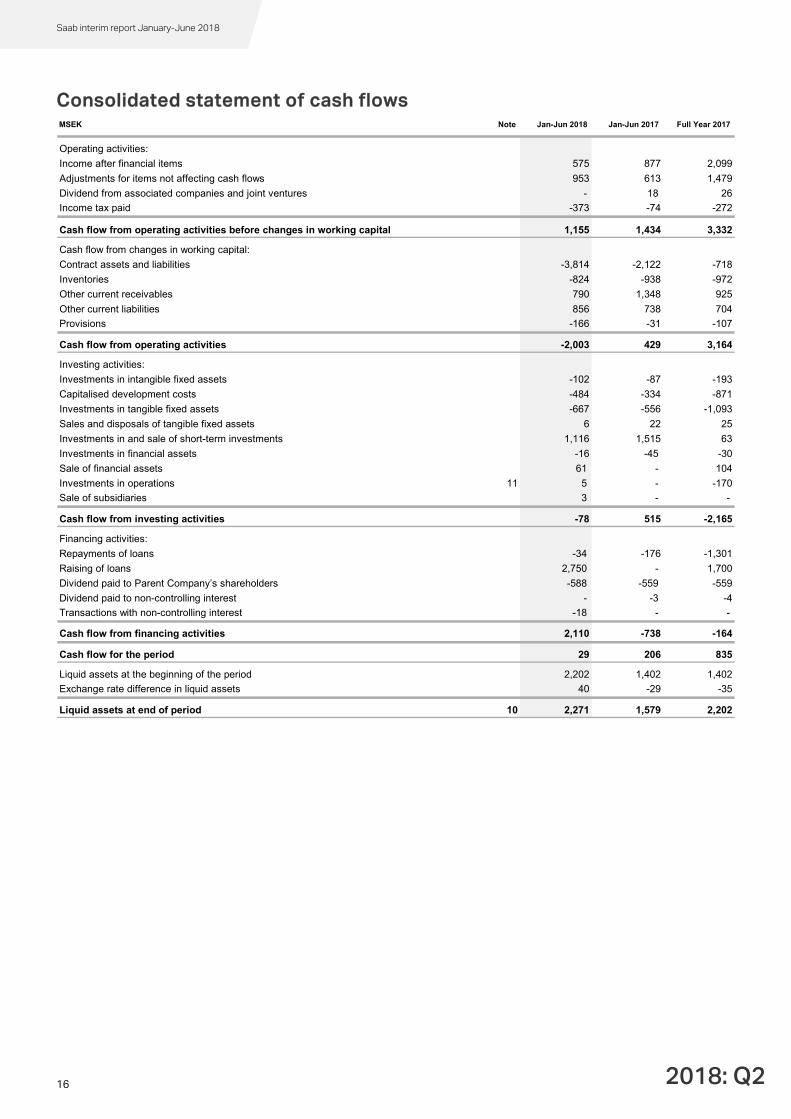
Consolidated statement of cash flows
MSEK Note Jan-Jun 2018 Jan-Jun 2017 Full Year 2017
Operating activities:
Income after financial items 575 877 2,099
Adjustments for items not affecting cash flows 953 613 1,479
Dividend from associated companies and joint ventures - 18 26
Income tax paid -373 -74 -272
Cash flow from operating activities before changes in working capital 1,155 1,434 3,332
Cash flow from changes in working capital:
Contract assets and liabilities -3,814 -2,122 -718
Inventories -824 -938 -972
Other current receivables 790 1,348 925
Other current liabilities 856 738 704
Provisions -166 -31 -107
Cash flow from operating activities -2,003 429 3,164
Investing activities:
Investments in intangible fixed assets -102 -87 -193
Capitalised development costs -484 -334 -871
Investments in tangible fixed assets -667 -556 -1,093
Sales and disposals of tangible fixed assets 6 22 25
Investments in and sale of short-term investments 1,116 1,515 63
Investments in financial assets -16 -45 -30
Sale of financial assets 61 - 104
Investments in operations 11 5 - -170
Sale of subsidiaries 3 - -
Cash flow from investing activities -78 515 -2,165
Financing activities:
Repayments of loans -34 -176 -1,301
Raising of loans 2,750 - 1,700
Dividend paid to Parent Company’s shareholders -588 -559 -559
Dividend paid to non-controlling interest - -3 -4
Transactions with non-controlling interest -18 - -
Cash flow from financing activities 2,110 -738 -164
Cash flow for the period 29 206 835
Liquid assets at the beginning of the period 2,202 1,402 1,402
Exchange rate difference in liquid assets 40 -29 -35
Liquid assets at end of period 10 2,271 1,579 2,202
17 2018: Q2
Saab interim report January-June 2018
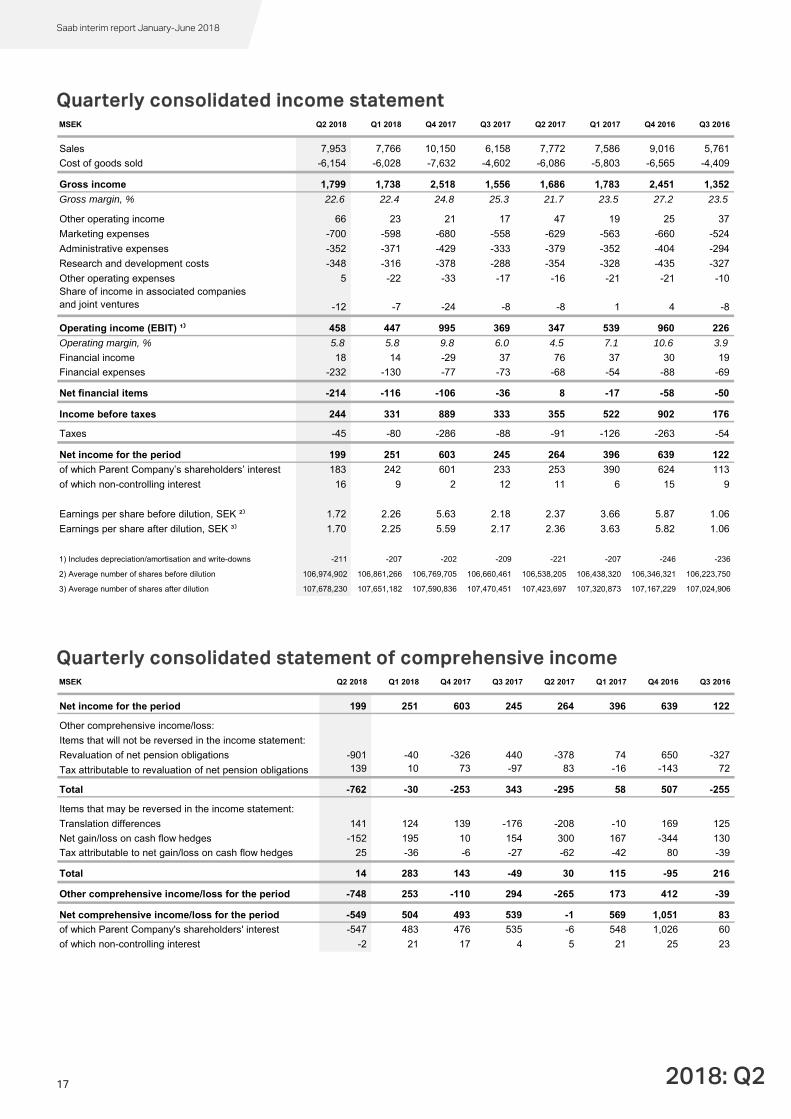
Quarterly consolidated income statement
Quarterly consolidated statement of comprehensive income
MSEK Q2 2018 Q1 2018 Q4 2017 Q3 2017 Q2 2017 Q1 2017 Q4 2016 Q3 2016
Sales 7,953 7,766 10,150 6,158 7,772 7,586 9,016 5,761
Cost of goods sold -6,154 -6,028 -7,632 -4,602 -6,086 -5,803 -6,565 -4,409
Gross income 1,799 1,738 2,518 1,556 1,686 1,783 2,451 1,352
Gross margin, % 22.6 22.4 24.8 25.3 21.7 23.5 27.2 23.5
Other operating income 66 23 21 17 47 19 25 37
Marketing expenses -700 -598 -680 -558 -629 -563 -660 -524
Administrative expenses -352 -371 -429 -333 -379 -352 -404 -294
Research and development costs -348 -316 -378 -288 -354 -328 -435 -327
Other operating expenses 5 -22 -33 -17 -16 -21 -21 -10Share of income in associated companies and joint ventures -12 -7 -24 -8 -8 1 4 -8
Operating income (EBIT) ¹⁾ 458 447 995 369 347 539 960 226
Operating margin, % 5.8 5.8 9.8 6.0 4.5 7.1 10.6 3.9
Financial income 18 14 -29 37 76 37 30 19
Financial expenses -232 -130 -77 -73 -68 -54 -88 -69
Net financial items -214 -116 -106 -36 8 -17 -58 -50
Income before taxes 244 331 889 333 355 522 902 176
Taxes -45 -80 -286 -88 -91 -126 -263 -54
Net income for the period 199 251 603 245 264 396 639 122
of which Parent Company’s shareholders’ interest 183 242 601 233 253 390 624 113
of which non-controlling interest 16 9 2 12 11 6 15 9
Earnings per share before dilution, SEK ²⁾ 1.72 2.26 5.63 2.18 2.37 3.66 5.87 1.06
Earnings per share after dilution, SEK ³⁾ 1.70 2.25 5.59 2.17 2.36 3.63 5.82 1.06
1) Includes depreciation/amortisation and write-downs -211 -207 -202 -209 -221 -207 -246 -236
2) Average number of shares before dilution 106,974,902 106,861,266 106,769,705 106,660,461 106,538,205 106,438,320 106,346,321 106,223,750
3) Average number of shares after dilution 107,678,230 107,651,182 107,590,836 107,470,451 107,423,697 107,320,873 107,167,229 107,024,906
MSEK Q2 2018 Q1 2018 Q4 2017 Q3 2017 Q2 2017 Q1 2017 Q4 2016 Q3 2016
Net income for the period 199 251 603 245 264 396 639 122
Other comprehensive income/loss:
Items that will not be reversed in the income statement:
Revaluation of net pension obligations -901 -40 -326 440 -378 74 650 -327
Tax attributable to revaluation of net pension obligations 139 10 73 -97 83 -16 -143 72
Total -762 -30 -253 343 -295 58 507 -255
Items that may be reversed in the income statement:
Translation differences 141 124 139 -176 -208 -10 169 125
Net gain/loss on cash flow hedges -152 195 10 154 300 167 -344 130
Tax attributable to net gain/loss on cash flow hedges 25 -36 -6 -27 -62 -42 80 -39
Total 14 283 143 -49 30 115 -95 216
Other comprehensive income/loss for the period -748 253 -110 294 -265 173 412 -39
Net comprehensive income/loss for the period -549 504 493 539 -1 569 1,051 83
of which Parent Company's shareholders' interest -547 483 476 535 -6 548 1,026 60
of which non-controlling interest -2 21 17 4 5 21 25 23

18 2018: Q2
Saab interim report January-June 2018
Key ratios by quarter
Quarterly information per operating segment
MSEK Q2 2018 Q1 2018 Q4 2017 Q3 2017 Q2 2017 Q1 2017 Q4 2016 Q3 2016
Equity/assets ratio, (%) 28.7 31.5 31.7 33.0 32.3 32.8 32.3 32.5
Return on capital employed, % ³⁾ 9.6 9.4 10.5 11.0 10.5 9.8 8.9 11.8
Return on equity, % ³⁾ 9.7 9.6 10.9 11.9 11.2 10.2 9.0 13.8
Equity per share, SEK ¹⁾ ³⁾ 126.17 136.64 131.96 127.33 122.15 127.38 123.64 113.88
Free cash flow, MSEK ³⁾ -781 -2,411 1,772 -388 -1,429 897 619 -2,311
Free cash flow per share after dilution, SEK ²⁾ ³⁾ -7.25 -22.40 16.47 -3.61 -13.30 8.36 5.78 -21.59
1) Number of shares excluding treasury shares 107,051,054 106,898,750 106,823,782 106,715,627 106,605,294 106,471,116 106,405,523 106,287,119
2) Average number of shares after dilution 107,678,230 107,651,182 107,590,836 107,470,451 107,423,697 107,320,873 107,167,229 107,024,906
3) For more information and explanations regarding the usage of these key ratios, please see saabgroup.com, investor, financial data, key ratios.
MSEK Q2 2018 Operating
margin Q1 2018 Operating
margin Q4 2017 Operating
margin Q3 2017 Operating
margin
Sales
Aeronautics 1,871 2,042 2,373 1,351
Dynamics 1,064 1,056 2,450 786
Surveillance 1,799 1,778 1,966 1,515
Support and Services 1,400 1,336 1,656 1,120
Industrial Products and Services 1,559 1,391 1,623 1,178
Kockums 880 745 763 565
Internal sales -620 -582 -681 -357
Total 7,953 7,766 10,150 6,158
Operating income/loss
Aeronautics 95 5.1% 163 8.0% 184 7.8% 108 8.0%
Dynamics 44 4.1% 46 4.4% 393 16.0% 61 7.8%
Surveillance 150 8.3% 69 3.9% 281 14.3% 140 9.2%
Support and Services 159 11.4% 174 13.0% 253 15.3% 134 12.0%
Industrial Products and Services 54 3.5% 27 1.9% 76 4.7% -16 -1.4%
Kockums 42 4.8% 42 5.6% 47 6.2% 35 6.2%
Corporate -86 -74 -239 -93
Total 458 5.8% 447 5.8% 995 9.8% 369 6.0%
MSEK Q2 2017 Operating
margin Q1 2017 Operating
margin Q4 2016 Operating
margin Q3 2016 Operating
margin
Sales
Aeronautics 1,865 1,678 2216 1,562
Dynamics 1,235 1,146 2035 775
Surveillance 1,720 1,432 916 1,584
Support and Services 1,347 1,695 1287 967
Industrial Products and Services 1,450 1,384 2572 697
Kockums 706 678 647 543
Internal sales -551 -427 -657 -367
Total 7,772 7,586 9016 5,761
Operating income/loss
Aeronautics 106 5.7% 80 4.8% 216 0.09747292 150 9.6%
Dynamics 92 7.4% 134 11.7% 374 0.18378378 -7 -0.9%
Surveillance 107 6.2% 104 7.3% 250 0.27292576 90 5.7%
Support and Services 151 11.2% 164 9.7% 218 0.16938617 21 2.2%
Industrial Products and Services - 0.0% 56 4.0% 50 0.01944012 -5 -0.7%
Kockums 40 5.7% 35 5.2% 49 0.07573416 27 5.0%
Corporate -149 -34 -197 -50
Total 347 4.5% 539 7.1% 960 0.10647737 226 3.9%
2017 has been restated according to the structural changes described in the annual report 2017, pages 47-52.
19 2018: Q2
Saab interim report January-June 2018
Multi-year overview
Key ratios and goals
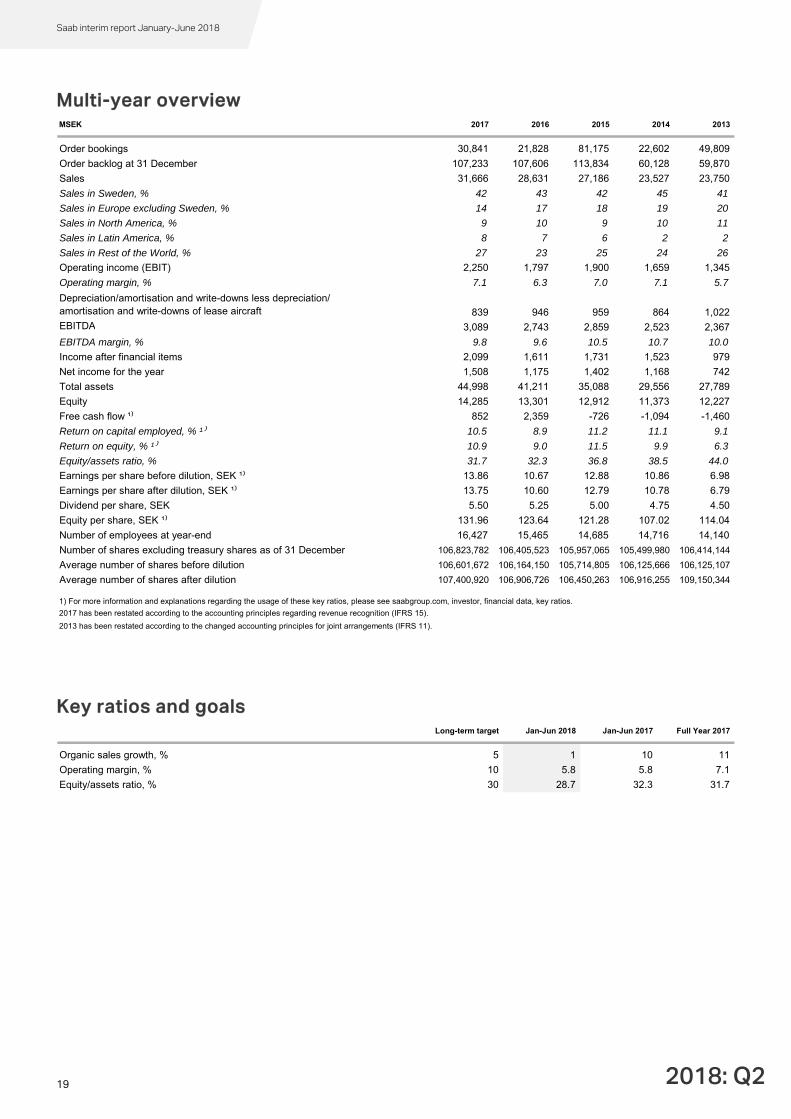
MSEK 2017 2016 2015 2014 2013
Order bookings 30,841 21,828 81,175 22,602 49,809
Order backlog at 31 December 107,233 107,606 113,834 60,128 59,870
Sales 31,666 28,631 27,186 23,527 23,750
Sales in Sweden, % 42 43 42 45 41
Sales in Europe excluding Sweden, % 14 17 18 19 20
Sales in North America, % 9 10 9 10 11
Sales in Latin America, % 8 7 6 2 2
Sales in Rest of the World, % 27 23 25 24 26
Operating income (EBIT) 2,250 1,797 1,900 1,659 1,345
Operating margin, % 7.1 6.3 7.0 7.1 5.7
Depreciation/amortisation and write-downs less depreciation/amortisation and write-downs of lease aircraft 839 946 959 864 1,022EBITDA 3,089 2,743 2,859 2,523 2,367
EBITDA margin, % 9.8 9.6 10.5 10.7 10.0
Income after financial items 2,099 1,611 1,731 1,523 979
Net income for the year 1,508 1,175 1,402 1,168 742
Total assets 44,998 41,211 35,088 29,556 27,789
Equity 14,285 13,301 12,912 11,373 12,227
Free cash flow ¹⁾ 852 2,359 -726 -1,094 -1,460
Return on capital employed, % ¹⁾ 10.5 8.9 11.2 11.1 9.1
Return on equity, % ¹⁾ 10.9 9.0 11.5 9.9 6.3
Equity/assets ratio, % 31.7 32.3 36.8 38.5 44.0
Earnings per share before dilution, SEK ¹⁾ 13.86 10.67 12.88 10.86 6.98
Earnings per share after dilution, SEK ¹⁾ 13.75 10.60 12.79 10.78 6.79
Dividend per share, SEK 5.50 5.25 5.00 4.75 4.50
Equity per share, SEK ¹⁾ 131.96 123.64 121.28 107.02 114.04
Number of employees at year-end 16,427 15,465 14,685 14,716 14,140
Number of shares excluding treasury shares as of 31 December 106,823,782 106,405,523 105,957,065 105,499,980 106,414,144
Average number of shares before dilution 106,601,672 106,164,150 105,714,805 106,125,666 106,125,107
Average number of shares after dilution 107,400,920 106,906,726 106,450,263 106,916,255 109,150,344
1) For more information and explanations regarding the usage of these key ratios, please see saabgroup.com, investor, financial data, key ratios.
2017 has been restated according to the accounting principles regarding revenue recognition (IFRS 15).
2013 has been restated according to the changed accounting principles for joint arrangements (IFRS 11).
Long-term target Jan-Jun 2018 Jan-Jun 2017 Full Year 2017
Organic sales growth, % 5 1 10 11
Operating margin, % 10 5.8 5.8 7.1
Equity/assets ratio, % 30 28.7 32.3 31.7
20 2018: Q2
Saab interim report January-June 2018
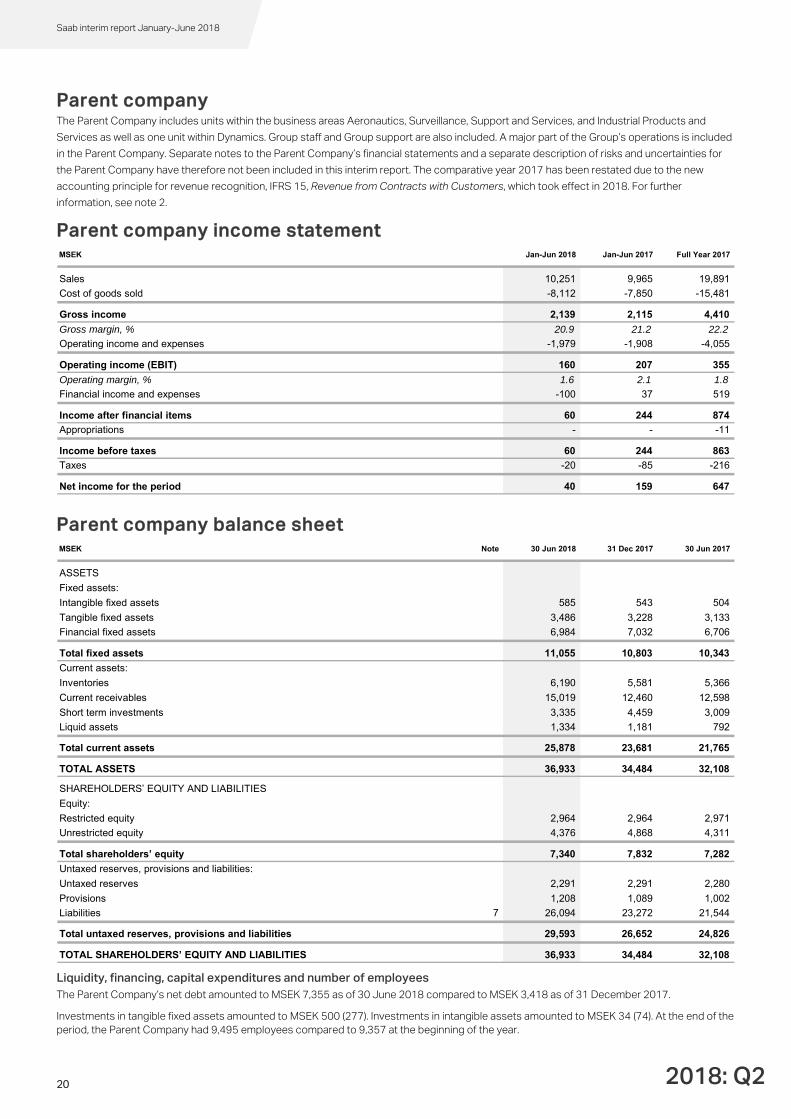
Parent company The Parent Company includes units within the business areas Aeronautics, Surveillance, Support and Services, and Industrial Products and Services as well as one unit within Dynamics. Group staff and Group support are also included. A major part of the Group’s operations is included in the Parent Company. Separate notes to the Parent Company’s financial statements and a separate description of risks and uncertainties for the Parent Company have therefore not been included in this interim report. The comparative year 2017 has been restated due to the new accounting principle for revenue recognition, IFRS 15, Revenue from Contracts with Customers, which took effect in 2018. For further information, see note 2.
Parent company income statement
Parent company balance sheet
Liquidity, financing, capital expenditures and number of employees The Parent Company’s net debt amounted to MSEK 7,355 as of 30 June 2018 compared to MSEK 3,418 as of 31 December 2017. Investments in tangible fixed assets amounted to MSEK 500 (277). Investments in intangible assets amounted to MSEK 34 (74). At the end of the period, the Parent Company had 9,495 employees compared to 9,357 at the beginning of the year.
MSEK Jan-Jun 2018 Jan-Jun 2017 Full Year 2017
Sales 10,251 9,965 19,891
Cost of goods sold -8,112 -7,850 -15,481
Gross income 2,139 2,115 4,410
Gross margin, % 20.9 21.2 22.2
Operating income and expenses -1,979 -1,908 -4,055
Operating income (EBIT) 160 207 355
Operating margin, % 1.6 2.1 1.8
Financial income and expenses -100 37 519
Income after financial items 60 244 874
Appropriations - - -11
Income before taxes 60 244 863
Taxes -20 -85 -216
Net income for the period 40 159 647
MSEK Note 30 Jun 2018 31 Dec 2017 30 Jun 2017
ASSETS
Fixed assets:
Intangible fixed assets 585 543 504
Tangible fixed assets 3,486 3,228 3,133
Financial fixed assets 6,984 7,032 6,706
Total fixed assets 11,055 10,803 10,343
Current assets:
Inventories 6,190 5,581 5,366
Current receivables 15,019 12,460 12,598
Short term investments 3,335 4,459 3,009
Liquid assets 1,334 1,181 792
Total current assets 25,878 23,681 21,765
TOTAL ASSETS 36,933 34,484 32,108
SHAREHOLDERS’ EQUITY AND LIABILITIES
Equity:
Restricted equity 2,964 2,964 2,971
Unrestricted equity 4,376 4,868 4,311
Total shareholders’ equity 7,340 7,832 7,282
Untaxed reserves, provisions and liabilities:
Untaxed reserves 2,291 2,291 2,280
Provisions 1,208 1,089 1,002
Liabilities 7 26,094 23,272 21,544
Total untaxed reserves, provisions and liabilities 29,593 26,652 24,826
TOTAL SHAREHOLDERS’ EQUITY AND LIABILITIES 36,933 34,484 32,108
21 2018: Q2
Saab interim report January-June 2018
Notes To the financial statements NOTE 1 Corporate information Saab AB (publ.), corporate identity no. 556036-0793, with registered office in Linköping, Sweden. The company’s head office is located at Olof Palmes gata 17, 5tr, SE-111 22 Stockholm, Sweden, and the telephone number +46-8-463 00 00. Saab’s B shares are listed on Nasdaq Stockholm since 1998 and on the large cap list as of October 2006. The company’s operations, including subsidiaries, associated companies and joint ventures, are described in the annual report 2017. NOTE 2 Accounting principles The consolidated accounts for the first half-year of 2018 have been prepared in accordance with IAS 34 Interim Reporting and the Annual Accounts Act. The Parent Company’s accounts have been prepared in accordance with the Annual Accounts Act and the Swedish Financial Reporting Board’s recommendation RFR 2, Accounting for Legal Entities. The Group’s accounting principles are described on pages 84-85, and concerning significant income statement and balance sheet items in each note disclosure in the annual report 2017. The interim report is condensed and does not contain all the information and disclosures in the annual report and should therefore be read together with the annual report 2017. All the information on pages 1-29 constitutes the interim report for the period 1 January to 30 June 2018. The Group and the Parent Company use the accounting principles and calculation methods as described in the annual report 2017 with the exception that two new standards have entered into force for financial years beginning 1 January 2018: IFRS 15 Revenue from Contracts with Customers and IFRS 9 Financial Instruments. For effects of changes in accounting principles, IAS 8 and the transition rules in each standard have been applied. IFRS 15 Revenue from Contracts with Customers IFRS 15 Revenue from Contracts with Customers governs the recognition of revenue and replaces IAS 18 Revenue and IAS 11 Construction Contracts. The principles that IFRS 15 are built on give users of financial reports more useful information on the company’s revenue. According to IFRS 15, revenue is recognised when the customer obtains control over the good or service and has the ability to use or obtain the benefits from the good or the service. The main principles of revenue recognition are based on a five-step model:
1. Identify the contract 2. Identify the performance obligations 3. Determine the transaction price 4. Allocate the transaction price to each obligation 5. Recognise revenue when the obligation is satisfied.
A performance obligation is satisfied according to the standard at a given point in time or over time. If a performance obligation is satisfied over time, one of the following criteria must be met:
a) the customer must obtain immediate benefits when the obligation is satisfied,
b) the company’s performance creates or improves an asset that the customer controls, or
c) the company’s performance creates an asset without an alternative use for the company and the company has the right to payment for costs incurred to date, including profit.
Long-term customer contracts A large part of the Group’s operations involves long-term customer contracts with the development and manufacture of complex systems that stretch over several reporting periods. The analysis of these contracts according to the five-step model has mainly meant determining the number of performance obligations and when they are fulfilled, i.e. over time or at a given point in time. Since Saab’s long-term customer contracts involve a considerable amount of customisation
and integration of goods and services, it usually means that a performance obligation has been identified, and because the cost to adapt the asset and sell it to a new customer would not be insignificant, the conclusion is that the asset is not deemed to have an alternative use. Since the contracts also normally contain clauses that cover the right to payment plus a reasonable profit for costs incurred, it means that the criteria for recognising long-term customer contracts over time are satisfied. Assignment revenue and costs are recognised as revenue or expenses in the income statement in relation to the contract’s stage of completion. The stage of completion is based on a determination of the relationship between expenditures incurred for services rendered as of the closing day and estimated total expenditures to satisfy the contract. Of the total revenue, the portion corresponding to the stage of completion is recognised in each period. The stage of completion can also be determined in certain cases based on milestones or deliveries. An anticipated loss is recognised in profit or loss as soon as it is identified. Service assignments For Saab’s service assignments, which include the sale of consulting hours and support services, at a fixed price or on current account, the customer normally obtains the benefits when the obligation is satisfied. Revenue is mainly recognised over time as the assignment is performed according to the contract. Products A percentage of Saab’s revenue is attributable to products where development, customisation and integration are relatively minor and relates for the most part only to the manufacture of products, as well as the resale of spare parts, for example. Revenue from these contracts is recognised at a point in time, i.e. normally when control of the good has transferred to the customer in accordance with the terms of the contract. Effects of changes in accounting principles with regard to revenue recognition Saab applies the full retroactive approach for the transition to IFRS 15 from 2018. For a few customer contracts, the method for recognition has been adjusted. The main reason for the change is that a few long-term customer contracts cannot recognise revenue over time, due to non-compliance with the right to payment including earnings for work performed. Transition effects that arise for IFRS 15 affect the opening equity balance for the comparative year 2017 by MSEK -164 and the opening balance for 2018 by MSEK -92. Sales increase in 2017 by MSEK 272, operating income is positively affected by MSEK 95 and net income for the year by MSEK 70. Sales for the first half-year 2017 increase by MSEK 5, operating income is positively affected by MSEK 1 and net income for the period by MSEK 1. For more information, see Saab’s annual report 2017, note 46. For the Parent Company, Saab AB, transition effects on the opening equity balance for 2017 amount to MSEK -8 and the opening balance for 2018 to MSEK -11. Sales are affected by MSEK -67 for the full-year 2017 and MSEK -33 for the first half-year 2017. Net income for the period was affected by MSEK -2 for the full-year 2017 and by MSEK 0 for the first half-year 2017. IFRS 9 Financial Instruments IFRS 9 Financial Instruments sets out the requirements for classification, measurement and accounting of financial assets and liabilities and introduces new rules for hedge accounting and impairment of financial assets and replaces most of the guidance in IAS 39. According to the standard, hedge accounting will be applied prospectively and a company does not have to restate previous periods, and Saab has not done so.
The Group’s financial assets are classified in accordance with IFRS 9 in three categories: amortised cost, fair value through other comprehensive income and fair value through profit or loss, depending on whether they are financial receivables, derivatives or equity instruments and in accordance with what is described below.
22 2018: Q2
Saab interim report January-June 2018
Measurement of the Group’s financial receivables is based on the company’s choice of business model for management of financial assets. Short-term investments are held mainly for trading to invest surplus liquidity, and sales are made frequently to manage liquidity needs and maximise the return. Monitoring and measurement are done continuously at fair value through profit or loss. Assets held to collect contractual cash flows, which consist of principal and interest from operating activities such as liquid assets, accounts receivable, loans receivable, other receivables and contract assets in accordance with IFRS 15 are measured at amortised cost. Impairment of financial receivables such as accounts receivable, contract assets and receivables from associated companies and joint ventures are calculated based on expected credit losses for the entire expected maturity instead of when there is objective information indicating that the Group will not receive full payment as in the previous standards.
Derivatives are measured at fair value through profit or loss, except when hedge accounting for cash flow hedges is applied, in which case the portion determined to be an effective hedge is recognised in other comprehensive income.
Equity instruments such as shares and participations are measured continuously at fair value with changes in value recognised through profit or loss. Effects of changes in accounting principles with regard to financial instruments IFRS 9 does not have a significant impact on the Group’s income statement or financial position. Hedge accounting is not affected, but Saab will transition to IFRS 9’s hedge accounting, which is an option in the standard. The new rules for classification of financial assets do not entail any changes with the exception that a loan to an associated company is recognised according to IFRS 9 at fair value through profit or loss instead of at amortised cost. The loan amounted to MSEK 26 on 1 January 2018. The effect on the opening equity balance for 2018 amounts to MSEK -4, which is due to impairment of receivables from associated companies and joint ventures. For more information, see Saab’s annual report 2017, note 46. For the Parent Company, Saab AB, the opening equity balance for 2018 is affected by MSEK -9 due to impairment of receivables from subsidiaries, associated companies and joint ventures. IFRS 16 Leases IFRS 16 Leases will apply to financial years beginning 1 January 2019. IFRS 16 is a new standard for reporting lease agreements that replaces IAS17 Leasing. Basically, the new standard means that for lessees the current classification of operating and finance leases disappears and is replaced by an approach where assets and liabilities for all leases are recognised in the balance sheet. During 2018, Saab continues its analysis and evaluation and prepares for the introduction of the standard as of 2019. For more information, see note 1 in the annual report 2017. NOTE 3 Segment reporting Saab is a leading high-technology company, with its main operations in defence, aviation and civil security. Operations are primarily focused on well-defined areas in defence electronics, missile systems, and naval systems as well as military and commercial aviation. Saab is also active in technical services and maintenance. Saab has a strong position in Sweden and the main part of sales is generated in Europe. In addition, Saab has a local presence in South Africa, Australia, the US, and in other selected countries. Saab’s operating and management structure is divided into six business areas, which are also operating segments: Aeronautics, Dynamics, Surveillance, Support and Services, Industrial Products and Services, and Kockums. In addition, Corporate comprises Group staff and departments, a minority portfolio containing Saab’s ownership interests in companies in various stages of development as well as other operations outside the core operations.
Aeronautics Aeronautics is a world-leading manufacturer of innovative aerial systems and is engaged in development of military aviation technology. It also conducts long-term future studies of manned and unmanned aircraft as preparation for new systems and further development of existing products. Dynamics Dynamics offers a market-leading product portfolio comprising ground combat weapons, missile systems, torpedoes, unmanned underwater vehicles, systems for training and simulation, signature management systems for armed forces around the world, and niche products for the civil and defence markets. Surveillance Surveillance provides efficient solutions for safety and security, for surveillance and decision support, and for threat detection, location, and protection. The portfolio covers airborne, ground-based and naval radar, electronic warfare and combat systems and C4I solutions. Support and Services Support and Services offers reliable, cost-efficient service and support for all of Saab’s markets. This includes support solutions, technical maintenance and logistics as well as products, solutions and services for military and civil missions. Industrial Products and Services The business units within Industrial Products and Services are focused on mainly civilian customers. Kockums Kockums develops, delivers, and maintains world-class solutions for naval environments. Its portfolio includes submarines with the Stirling system for air independent propulsion, surface combatants, mine hunting systems and autonomous vessels. Kockums’ unique competence is in signature management, impact strength and advanced stealth technology. Order bookings per operating segment
Order bookings per region
Jan-Jun Jan-Jun Q2 Q2 Full Year
MSEK 2018 2017 2018 2017 2017
Aeronautics 2,148 1,718 25 759 1,104 3,295
Dynamics 2,573 6,277 -59 1,218 1,990 8,615
Surveillance 4,042 4,439 -9 2,311 2,778 7,048
Support and Services 1,875 4,490 -58 1,152 2,485 6,199Industrial Products and Services 2,645 3,274 -19 1,543 1,830 5,842
Kockums 530 1,834 -71 149 1,685 2,129Internal -1,149 -1,478 -603 -1,019 -2,287
Total 12,664 20,554 -38 6,529 10,853 30,841
Change, %
MSEK
Jan-Jun 2018
Jan-Jun 2017
Change, %
Full Year 2017
Sweden 4,477 10,818 -59 13,963
Rest of Europe 2,890 2,707 7 5,116
North America 2,038 1,255 62 2,712
Latin America 75 134 -45 898
Asia 1,532 4,301 -64 5,721
Africa 72 145 -50 529
Australia, etc. 1,580 1,194 32 1,902
Total 12,664 20,554 -38 30,841
23 2018: Q2
Saab interim report January-June 2018
Order backlog per operating segment
Order backlog per region
Sales per operating segment
Sales per region
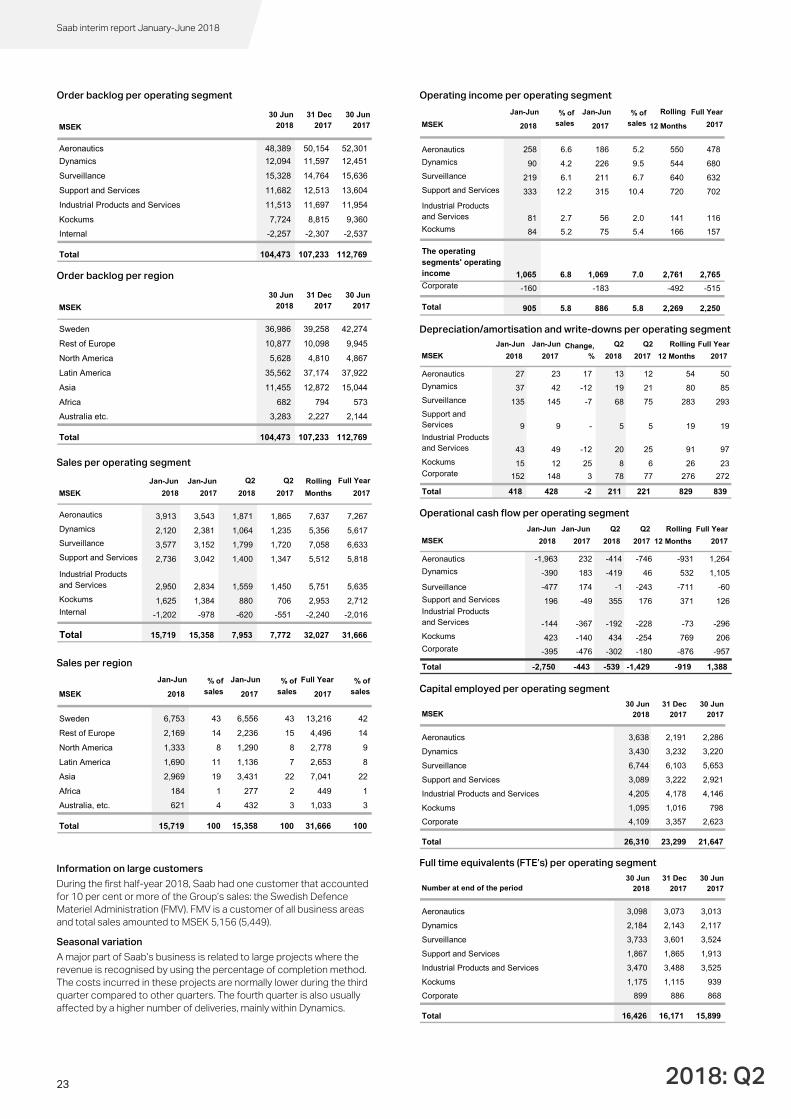
Information on large customers During the first half-year 2018, Saab had one customer that accounted for 10 per cent or more of the Group’s sales: the Swedish Defence Materiel Administration (FMV). FMV is a customer of all business areas and total sales amounted to MSEK 5,156 (5,449). Seasonal variation A major part of Saab’s business is related to large projects where the revenue is recognised by using the percentage of completion method. The costs incurred in these projects are normally lower during the third quarter compared to other quarters. The fourth quarter is also usually affected by a higher number of deliveries, mainly within Dynamics.
Operating income per operating segment
Depreciation/amortisation and write-downs per operating segment
Operational cash flow per operating segment
Capital employed per operating segment
Full time equivalents (FTE’s) per operating segment
MSEK
30 Jun 2018
31 Dec 2017
30 Jun 2017
Aeronautics 48,389 50,154 52,301
Dynamics 12,094 11,597 12,451
Surveillance 15,328 14,764 15,636
Support and Services 11,682 12,513 13,604
Industrial Products and Services 11,513 11,697 11,954
Kockums 7,724 8,815 9,360
Internal -2,257 -2,307 -2,537
Total 104,473 107,233 112,769
MSEK
30 Jun 2018
31 Dec 2017
30 Jun 2017
Sweden 36,986 39,258 42,274
Rest of Europe 10,877 10,098 9,945
North America 5,628 4,810 4,867
Latin America 35,562 37,174 37,922
Asia 11,455 12,872 15,044
Africa 682 794 573
Australia etc. 3,283 2,227 2,144
Total 104,473 107,233 112,769
Jan-Jun Jan-Jun Q2 Q2 Rolling Full Year
MSEK 2018 2017 2018 2017 Months 2017
Aeronautics 3,913 3,543 1,871 1,865 7,637 7,267
Dynamics 2,120 2,381 1,064 1,235 5,356 5,617
Surveillance 3,577 3,152 1,799 1,720 7,058 6,633
Support and Services 2,736 3,042 1,400 1,347 5,512 5,818
Industrial Products and Services 2,950 2,834 1,559 1,450 5,751 5,635
Kockums 1,625 1,384 880 706 2,953 2,712Internal -1,202 -978 -620 -551 -2,240 -2,016
Total 15,719 15,358 7,953 7,772 32,027 31,666
Jan-Jun Jan-Jun Full Year
MSEK 2018 2017 2017
Sweden 6,753 43 6,556 43 13,216 42
Rest of Europe 2,169 14 2,236 15 4,496 14
North America 1,333 8 1,290 8 2,778 9
Latin America 1,690 11 1,136 7 2,653 8
Asia 2,969 19 3,431 22 7,041 22
Africa 184 1 277 2 449 1
Australia, etc. 621 4 432 3 1,033 3
Total 15,719 100 15,358 100 31,666 100
% of sales
% of sales
% of sales
Jan-Jun Jan-Jun Rolling Full Year
MSEK 2018 2017 12 Months 2017
Aeronautics 258 6.6 186 5.2 550 478
Dynamics 90 4.2 226 9.5 544 680
Surveillance 219 6.1 211 6.7 640 632
Support and Services 333 12.2 315 10.4 720 702
Industrial Products and Services 81 2.7 56 2.0 141 116Kockums 84 5.2 75 5.4 166 157
The operating segments' operating income 1,065 6.8 1,069 7.0 2,761 2,765Corporate -160 -183 -492 -515
Total 905 5.8 886 5.8 2,269 2,250
% of sales
% of sales
Jan-Jun Jan-Jun Q2 Q2 Rolling Full Year
MSEK 2018 2017 2018 2017 12 Months 2017
Aeronautics 27 23 17 13 12 54 50
Dynamics 37 42 -12 19 21 80 85
Surveillance 135 145 -7 68 75 283 293
Support and Services 9 9 - 5 5 19 19Industrial Products and Services 43 49 -12 20 25 91 97
Kockums 15 12 25 8 6 26 23Corporate 152 148 3 78 77 276 272
Total 418 428 -2 211 221 829 839
Change, %
Jan-Jun Jan-Jun Q2 Q2 Rolling Full Year
MSEK 2018 2017 2018 2017 12 Months 2017
Aeronautics -1,963 232 -414 -746 -931 1,264
Dynamics -390 183 -419 46 532 1,105
Surveillance -477 174 -1 -243 -711 -60
Support and Services 196 -49 355 176 371 126Industrial Products and Services -144 -367 -192 -228 -73 -296
Kockums 423 -140 434 -254 769 206Corporate -395 -476 -302 -180 -876 -957
Total -2,750 -443 -539 -1,429 -919 1,388
MSEK30 Jun
201831 Dec
201730 Jun
2017
Aeronautics 3,638 2,191 2,286
Dynamics 3,430 3,232 3,220
Surveillance 6,744 6,103 5,653
Support and Services 3,089 3,222 2,921
Industrial Products and Services 4,205 4,178 4,146
Kockums 1,095 1,016 798
Corporate 4,109 3,357 2,623
Total 26,310 23,299 21,647
Number at end of the period30 Jun
201831 Dec
201730 Jun
2017
Aeronautics 3,098 3,073 3,013
Dynamics 2,184 2,143 2,117
Surveillance 3,733 3,601 3,524
Support and Services 1,867 1,865 1,913
Industrial Products and Services 3,470 3,488 3,525
Kockums 1,175 1,115 939
Corporate 899 886 868
Total 16,426 16,171 15,899
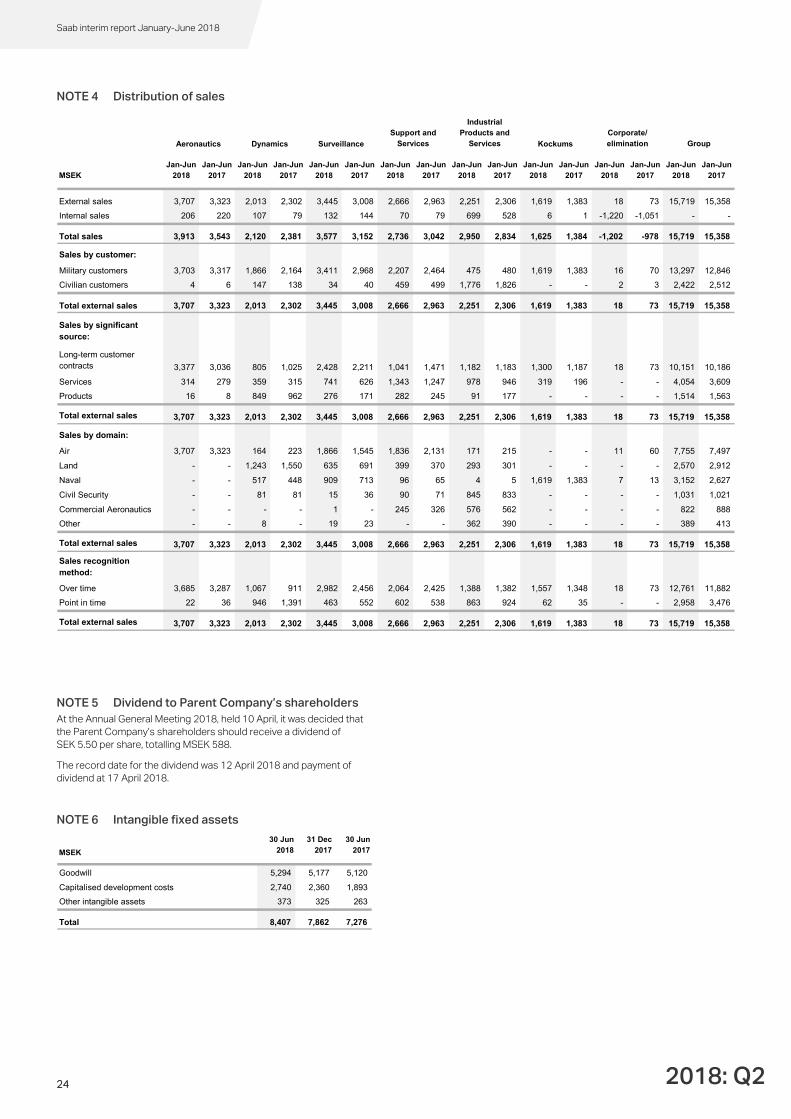
24 2018: Q2
Saab interim report January-June 2018
NOTE 4 Distribution of sales
NOTE 5 Dividend to Parent Company’s shareholders At the Annual General Meeting 2018, held 10 April, it was decided that the Parent Company’s shareholders should receive a dividend of SEK 5.50 per share, totalling MSEK 588. The record date for the dividend was 12 April 2018 and payment of dividend at 17 April 2018. NOTE 6 Intangible fixed assets
MSEK Jan-Jun
2018 Jan-Jun
2017 Jan-Jun
2018 Jan-Jun
2017 Jan-Jun
2018 Jan-Jun
2017 Jan-Jun
2018 Jan-Jun
2017 Jan-Jun
2018 Jan-Jun
2017 Jan-Jun
2018 Jan-Jun
2017 Jan-Jun
2018 Jan-Jun
2017 Jan-Jun
2018 Jan-Jun
2017
External sales 3,707 3,323 2,013 2,302 3,445 3,008 2,666 2,963 2,251 2,306 1,619 1,383 18 73 15,719 15,358
Internal sales 206 220 107 79 132 144 70 79 699 528 6 1 -1,220 -1,051 - -
Total sales 3,913 3,543 2,120 2,381 3,577 3,152 2,736 3,042 2,950 2,834 1,625 1,384 -1,202 -978 15,719 15,358
Sales by customer:
Military customers 3,703 3,317 1,866 2,164 3,411 2,968 2,207 2,464 475 480 1,619 1,383 16 70 13,297 12,846
Civilian customers 4 6 147 138 34 40 459 499 1,776 1,826 - - 2 3 2,422 2,512
Total external sales 3,707 3,323 2,013 2,302 3,445 3,008 2,666 2,963 2,251 2,306 1,619 1,383 18 73 15,719 15,358
Sales by significant source:
Long-term customer contracts 3,377 3,036 805 1,025 2,428 2,211 1,041 1,471 1,182 1,183 1,300 1,187 18 73 10,151 10,186
Services 314 279 359 315 741 626 1,343 1,247 978 946 319 196 - - 4,054 3,609
Products 16 8 849 962 276 171 282 245 91 177 - - - - 1,514 1,563
Total external sales 3,707 3,323 2,013 2,302 3,445 3,008 2,666 2,963 2,251 2,306 1,619 1,383 18 73 15,719 15,358
Sales by domain:
Air 3,707 3,323 164 223 1,866 1,545 1,836 2,131 171 215 - - 11 60 7,755 7,497
Land - - 1,243 1,550 635 691 399 370 293 301 - - - - 2,570 2,912
Naval - - 517 448 909 713 96 65 4 5 1,619 1,383 7 13 3,152 2,627
Civil Security - - 81 81 15 36 90 71 845 833 - - - - 1,031 1,021
Commercial Aeronautics - - - - 1 - 245 326 576 562 - - - - 822 888
Other - - 8 - 19 23 - - 362 390 - - - - 389 413
Total external sales 3,707 3,323 2,013 2,302 3,445 3,008 2,666 2,963 2,251 2,306 1,619 1,383 18 73 15,719 15,358
Sales recognition method:
Over time 3,685 3,287 1,067 911 2,982 2,456 2,064 2,425 1,388 1,382 1,557 1,348 18 73 12,761 11,882
Point in time 22 36 946 1,391 463 552 602 538 863 924 62 35 - - 2,958 3,476
Total external sales 3,707 3,323 2,013 2,302 3,445 3,008 2,666 2,963 2,251 2,306 1,619 1,383 18 73 15,719 15,358
Corporate/ elimination Group Aeronautics Dynamics Surveillance
Support and Services
Industrial Products and
Services Kockums
MSEK
30 Jun 2018
31 Dec 2017
30 Jun 2017
Goodwill 5,294 5,177 5,120
Capitalised development costs 2,740 2,360 1,893
Other intangible assets 373 325 263
Total 8,407 7,862 7,276
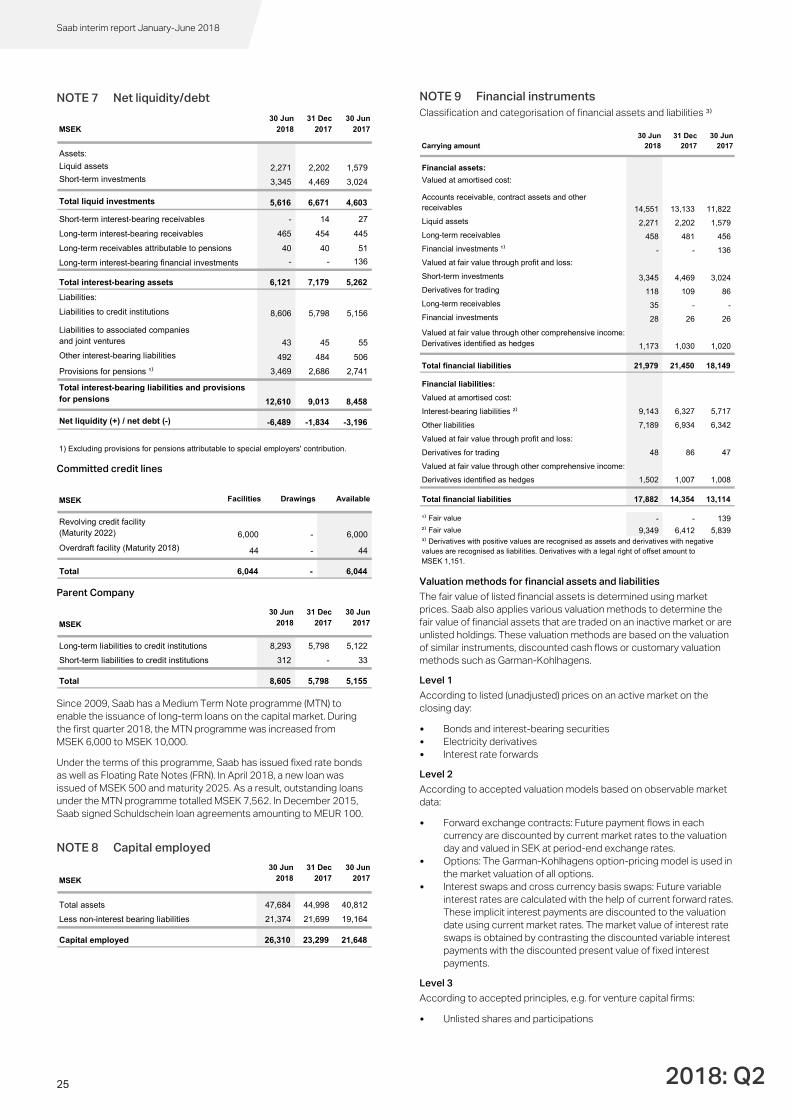
25 2018: Q2
Saab interim report January-June 2018
NOTE 7 Net liquidity/debt
Committed credit lines
Parent Company
Since 2009, Saab has a Medium Term Note programme (MTN) to enable the issuance of long-term loans on the capital market. During the first quarter 2018, the MTN programme was increased from MSEK 6,000 to MSEK 10,000. Under the terms of this programme, Saab has issued fixed rate bonds as well as Floating Rate Notes (FRN). In April 2018, a new loan was issued of MSEK 500 and maturity 2025. As a result, outstanding loans under the MTN programme totalled MSEK 7,562. In December 2015, Saab signed Schuldschein loan agreements amounting to MEUR 100.
NOTE 8 Capital employed
NOTE 9 Financial instruments Classification and categorisation of financial assets and liabilities ³⁾
Valuation methods for financial assets and liabilities The fair value of listed financial assets is determined using market prices. Saab also applies various valuation methods to determine the fair value of financial assets that are traded on an inactive market or are unlisted holdings. These valuation methods are based on the valuation of similar instruments, discounted cash flows or customary valuation methods such as Garman-Kohlhagens. Level 1 According to listed (unadjusted) prices on an active market on the closing day: • Bonds and interest-bearing securities • Electricity derivatives • Interest rate forwards Level 2 According to accepted valuation models based on observable market data: • Forward exchange contracts: Future payment flows in each
currency are discounted by current market rates to the valuation day and valued in SEK at period-end exchange rates.
• Options: The Garman-Kohlhagens option-pricing model is used in the market valuation of all options.
• Interest swaps and cross currency basis swaps: Future variable interest rates are calculated with the help of current forward rates. These implicit interest payments are discounted to the valuation date using current market rates. The market value of interest rate swaps is obtained by contrasting the discounted variable interest payments with the discounted present value of fixed interest payments.
Level 3 According to accepted principles, e.g. for venture capital firms: • Unlisted shares and participations
MSEK 30 Jun
2018 31 Dec
2017 30 Jun
2017
Assets:
Liquid assets 2,271 2,202 1,579Short-term investments 3,345 4,469 3,024
Total liquid investments 5,616 6,671 4,603
Short-term interest-bearing receivables - 14 27
Long-term interest-bearing receivables 465 454 445
Long-term receivables attributable to pensions 40 40 51
Long-term interest-bearing financial investments - - 136
Total interest-bearing assets 6,121 7,179 5,262
Liabilities:
Liabilities to credit institutions 8,606 5,798 5,156
Liabilities to associated companies and joint ventures 43 45 55
Other interest-bearing liabilities 492 484 506
Provisions for pensions ¹⁾ 3,469 2,686 2,741
Total interest-bearing liabilities and provisions for pensions 12,610 9,013 8,458
Net liquidity (+) / net debt (-) -6,489 -1,834 -3,196
1) Excluding provisions for pensions attributable to special employers' contribution.
MSEK Facilities Drawings Available
Revolving credit facility(Maturity 2022) 6,000 - 6,000
Overdraft facility (Maturity 2018) 44 - 44
Total 6,044 - 6,044
MSEK
30 Jun 2018
31 Dec 2017
30 Jun 2017
Long-term liabilities to credit institutions 8,293 5,798 5,122
Short-term liabilities to credit institutions 312 - 33
Total 8,605 5,798 5,155
MSEK
30 Jun 2018
31 Dec 2017
30 Jun 2017
Total assets 47,684 44,998 40,812
Less non-interest bearing liabilities 21,374 21,699 19,164
Capital employed 26,310 23,299 21,648
Carrying amount 30 Jun
2018 31 Dec
2017 30 Jun
2017
Financial assets:
Valued at amortised cost:
Accounts receivable, contract assets and other receivables 14,551 13,133 11,822
Liquid assets 2,271 2,202 1,579
Long-term receivables 458 481 456
Financial investments ¹⁾ - - 136
Valued at fair value through profit and loss:
Short-term investments 3,345 4,469 3,024
Derivatives for trading 118 109 86
Long-term receivables 35 - -
Financial investments 28 26 26
Valued at fair value through other comprehensive income:Derivatives identified as hedges 1,173 1,030 1,020
Total financial liabilities 21,979 21,450 18,149
Financial liabilities:
Valued at amortised cost:
Interest-bearing liabilities ²⁾ 9,143 6,327 5,717
Other liabilities 7,189 6,934 6,342
Valued at fair value through profit and loss:
Derivatives for trading 48 86 47
Valued at fair value through other comprehensive income:
Derivatives identified as hedges 1,502 1,007 1,008
Total financial liabilities 17,882 14,354 13,114
¹⁾ Fair value - - 139
²⁾ Fair value 9,349 6,412 5,839³⁾ Derivatives with positive values are recognised as assets and derivatives with negative values are recognised as liabilities. Derivatives with a legal right of offset amount to MSEK 1,151.
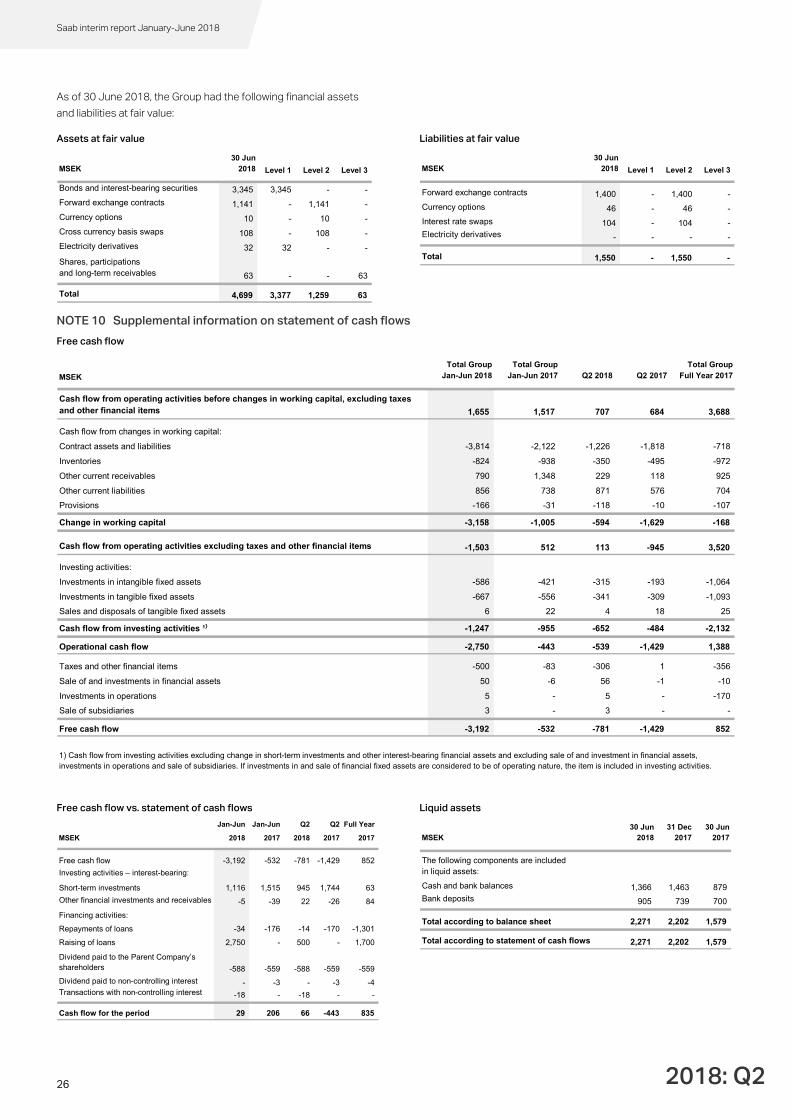
26 2018: Q2
Saab interim report January-June 2018
As of 30 June 2018, the Group had the following financial assets and liabilities at fair value: Assets at fair value
Liabilities at fair value
NOTE 10 Supplemental information on statement of cash flows Free cash flow
Free cash flow vs. statement of cash flows
Liquid assets
MSEK 30 Jun
2018 Level 1 Level 2 Level 3
Bonds and interest-bearing securities 3,345 3,345 - -
Forward exchange contracts 1,141 - 1,141 -
Currency options 10 - 10 -
Cross currency basis swaps 108 - 108 -
Electricity derivatives 32 32 - -
Shares, participations and long-term receivables 63 - - 63
Total 4,699 3,377 1,259 63
MSEK 30 Jun
2018 Level 1 Level 2 Level 3
Forward exchange contracts 1,400 - 1,400 -
Currency options 46 - 46 -
Interest rate swaps 104 - 104 -Electricity derivatives - - - -
Total 1,550 - 1,550 -
MSEK
Total Group Jan-Jun 2018
Total Group Jan-Jun 2017 Q2 2018 Q2 2017
Total Group Full Year 2017
Cash flow from operating activities before changes in working capital, excluding taxes and other financial items 1,655 1,517 707 684 3,688
Cash flow from changes in working capital:
Contract assets and liabilities -3,814 -2,122 -1,226 -1,818 -718
Inventories -824 -938 -350 -495 -972
Other current receivables 790 1,348 229 118 925
Other current liabilities 856 738 871 576 704
Provisions -166 -31 -118 -10 -107
Change in working capital -3,158 -1,005 -594 -1,629 -168
Cash flow from operating activities excluding taxes and other financial items -1,503 512 113 -945 3,520
Investing activities:
Investments in intangible fixed assets -586 -421 -315 -193 -1,064
Investments in tangible fixed assets -667 -556 -341 -309 -1,093
Sales and disposals of tangible fixed assets 6 22 4 18 25
Cash flow from investing activities ¹⁾ -1,247 -955 -652 -484 -2,132
Operational cash flow -2,750 -443 -539 -1,429 1,388
Taxes and other financial items -500 -83 -306 1 -356
Sale of and investments in financial assets 50 -6 56 -1 -10
Investments in operations 5 - 5 - -170
Sale of subsidiaries 3 - 3 - -
Free cash flow -3,192 -532 -781 -1,429 852
1) Cash flow from investing activities excluding change in short-term investments and other interest-bearing financial assets and excluding sale of and investment in financial assets, investments in operations and sale of subsidiaries. If investments in and sale of financial fixed assets are considered to be of operating nature, the item is included in investing activities.
Jan-Jun Jan-Jun Q2 Q2 Full Year
MSEK 2018 2017 2018 2017 2017
Free cash flow -3,192 -532 -781 -1,429 852
Investing activities – interest-bearing:
Short-term investments 1,116 1,515 945 1,744 63
Other financial investments and receivables -5 -39 22 -26 84
Financing activities:
Repayments of loans -34 -176 -14 -170 -1,301
Raising of loans 2,750 - 500 - 1,700
Dividend paid to the Parent Company’s shareholders -588 -559 -588 -559 -559
Dividend paid to non-controlling interest - -3 - -3 -4Transactions with non-controlling interest -18 - -18 - -
Cash flow for the period 29 206 66 -443 835
MSEK 30 Jun
2018 31 Dec
2017 30 Jun
2017
The following components are included in liquid assets:
Cash and bank balances 1,366 1,463 879Bank deposits 905 739 700
Total according to balance sheet 2,271 2,202 1,579
Total according to statement of cash flows 2,271 2,202 1,579
27 2018: Q2
Saab interim report January-June 2018
NOTE 11 Business combinations No significant acquisitions through business combinations were made in the period. NOTE 12 Defined-benefit plans Saab has defined-benefit pension plans where post-employment compensation is based on a percentage of the recipient’s salary. Pension obligation according to IAS 19
NOTE 13 Contingent liabilities No additional significant commitments have arisen during the period. With regard to the Group’s so-called performance guarantees for commitments to customers, the likelihood of an outflow of resources is estimated as remote and, as a result, no value is recognised. NOTE 14 Transactions with related parties No significant transactions have occurred during the period. Related parties with which the Group has transactions are described in the annual report 2017, note 40. NOTE 15 Definitions Below are definitions of financial key ratios that are used in the report. For more information and explanations regarding the usage of these key ratios, please see saabgroup.com, investor, financial data, key ratios. Capital employed Total assets less non-interest-bearing liabilities. Earnings per share Net income for the period attributable to the Parent Company’s shareholders, divided by the average number of shares before and after full dilution. EBITDA Operating income before depreciation/amortisation and write-downs. EBITDA margin Operating income before depreciation/amortisation and write-downs as a percentage of sales. Effective tax rate Current and deferred taxes as a percentage of income before tax. Equity/assets ratio Equity in relation to total assets. Equity per share Equity attributable to the Parent Company’s shareholders divided by the number of shares, excluding treasury shares, at the end of the period. Free cash flow Cash flow from operating activities and from investing activities, excluding acquisitions and divestments of short-term investments and other interest-bearing financial assets.
Free cash flow per share Free cash flow divided by the average number of shares after dilution. Gross margin Gross income as a percentage of sales. Net investments Acquisitions and divestments of intangible and tangible fixed assets, and acquisitions and divestments of non-interest-bearing financial assets. Net liquidity/net debt Liquid assets, short-term investments and interest-bearing receivables less interest-bearing liabilities and provisions for pensions excluding provisions for pensions attributable to special employers’ contribution. Non-recurring items Non-recurring items of profit with a significant impact on the results and which are important for understanding the underlying business development. Operating margin Operating income (EBIT) as a percentage of sales. Operational cash flow Cash flow from operating activities, excluding taxes and other financial items, and acquisitions and divestments of intangible and tangible fixed assets. Order backlog Total value of orders at the end of the period. Order bookings Total value of orders received during the period. Organic sales growth Change in sales in percentage adjusted for effects from exchange rate due to the translation of foreign subsidiaries, and structural changes such as acquisitions and divestments of subsidiaries. Return on capital employed Operating income plus financial income (rolling 12 months) as a percentage of average capital employed. Return on equity Net income for the period (rolling 12 months) as a percentage of average equity.
MSEK
30 Jun 2018
31 Dec 2017
30 Jun 2017
Defined-benefit obligation 10,277 9,341 9,087
Special employers' contribution 921 738 692
Less plan assets 6,848 6,695 6,397
Total provisions for pensions 4,350 3,384 3,382
of which reported as long-term receivable 40 40 51
28 2018: Q2
Saab interim report January-June 2018
Glossary FMV Swedish Defence Materiel Administration FRN Floating Rate Note FTE Full Time Equivalent, corresponds to one employee
working full-time for one year
IAS
International Accounting Standards
IFRS International Financial Reporting Standards MTN Medium Term Note, bonds with a duration of 1-15 years
The Board of Directors and the President have ensured that the six-month report provides an accurate overview of the Parent Company’s and the Group’s operations, financial position and results, and that it describes the significant risks and uncertainties faced by the Parent Company and the companies in
the Group.
Linköping 20 July 2018
Marcus Wallenberg
Chairman
Sten Jakobsson Deputy chairman
Danica Kragic Jensfelt Board member
Sara Mazur Board member
Daniel Nodhäll Board member
Bert Nordberg Board member
Erika Söderberg Johnson Board member
Cecilia Stegö Chiló Board member
Joakim Westh Board member
Stefan Andersson
Board member Göran Gustavsson
Board member
Nils Lindskog Board member
Håkan Buskhe President and CEO and Board member
2018: Q2
This interim report has not been subject to review by the company’s auditors.
Contact Calendar Media: Saab press center ph +46 734 18 00 18 Petter Larsson, Media Relations Manager ph +46 734 18 70 37 Financial market: Ann-Sofi Jönsson, Head of Investor Relations ph +46 734 18 72 14 Press and financial analyst conference 20 July 2018 at 10.00 (CET), Saab AB, floor 5 Olof Palmes gata 17, 111 22 Stockholm Contact Marie Bergström to register and for more information, ph +46 8 463 02 45 You are welcome to participate on site at Saab AB, watch the live webcast or dial in to the conference call. It is possible to post questions also over the web and conference call. Live webcast: http://saab-interimreport.creo.se/180720/ Conference call: Please, dial in using one of the numbers below: Sweden: +46 856642696 UK: +44 2030089815 US: +1 8557532237 The interim report, the presentation material and the webcast will be available on saabgroup.com.
Interim report January–September 2018 Published 23 October 2018 Year-end report 2018 Published 15 February 2019 Interim report January–March 2019 Published 26 April 2019 Interim report January–June 2019 Published 19 July 2019