s550 eclipse lb user's manual - us department of … site-wide...s550 eclipse lb user’s...
TRANSCRIPT
S550Eclipse LBUser’s Manual
9231577G V3.1
Copyright 2003, Canberra Industries, Inc. All rights reserved.
The material in this document, including all information, pictures,graphics and text, is the property of Canberra Industries, Inc. andis protected by U.S. copyright laws and international copyrightconventions. No material in this document may be reproduced,published, translated, distributed or displayed by any meanswithout written permission from Canberra Industries.
The information in this document describes the product asaccurately as possible, but is subject to change without notice.
Printed in the United States of America.
Microsoft, Windows, and Windows NT, are trademarks or registered trademarks of Microsoft Corporation in theUnited States and/or other countries.Pentium is a trademark or registered trademark of Intel Corporation in the United States and/or other countries.Crystal Report is a registered trademark of Crystal Decisions, Inc.pcAnywhere32 is a trademark of Symantec Corporation.
Canberra Industries, 800 Research Parkway, Meriden, CT 06450Tel: 203-238-2351 FAX: 203-235-1347 http://www.canberra.com
Table of Contents
Read Me First . . . . . . . . . . . . . . . . . . . . . . . . . . . . . . 1
Eclipse LB Database Conversion Utility . . . . . . . . . . . . . . . . . . . . . . . . . . . . . . 1
Overview . . . . . . . . . . . . . . . . . . . . . . . . . . . . . . . . . . . . . . . . . . . . 1
Operation . . . . . . . . . . . . . . . . . . . . . . . . . . . . . . . . . . . . . . . . . . . . 1
Important Notes . . . . . . . . . . . . . . . . . . . . . . . . . . . . . . . . . . . . . . . . . 4
1. Introduction . . . . . . . . . . . . . . . . . . . . . . . . . . . . . 5About this Manual . . . . . . . . . . . . . . . . . . . . . . . . . . . . . . . . . . . . . . . . . . 5
Typographic Conventions . . . . . . . . . . . . . . . . . . . . . . . . . . . . . . . . . . . . 6
Getting Help . . . . . . . . . . . . . . . . . . . . . . . . . . . . . . . . . . . . . . . . . . . . . 7
2. Getting Started . . . . . . . . . . . . . . . . . . . . . . . . . . . 8Pre-Configured Software . . . . . . . . . . . . . . . . . . . . . . . . . . . . . . . . . . . . . . 8
IEEE Interface and Driver Software Installation . . . . . . . . . . . . . . . . . . . . . . . . . . 8
USB Type Interface . . . . . . . . . . . . . . . . . . . . . . . . . . . . . . . . . . . . . . . 8
Plug and Play Type Interface . . . . . . . . . . . . . . . . . . . . . . . . . . . . . . . . . . 8
Jumper or DIP Switch Type Cards . . . . . . . . . . . . . . . . . . . . . . . . . . . . . . . 8
Software Installation . . . . . . . . . . . . . . . . . . . . . . . . . . . . . . . . . . . . . . . . 10
Computer Requirements . . . . . . . . . . . . . . . . . . . . . . . . . . . . . . . . . . . . 11
First Time Installation . . . . . . . . . . . . . . . . . . . . . . . . . . . . . . . . . . . . . 11
Modify, Repair, or Remove Eclipse LB . . . . . . . . . . . . . . . . . . . . . . . . . . . . . . 17
Updating Previous Versions of Eclipse . . . . . . . . . . . . . . . . . . . . . . . . . . . . . . 20
Upgraded Systems . . . . . . . . . . . . . . . . . . . . . . . . . . . . . . . . . . . . . . . . . 20
Starting Eclipse. . . . . . . . . . . . . . . . . . . . . . . . . . . . . . . . . . . . . . . . . . . 21
3. Software Environment . . . . . . . . . . . . . . . . . . . . . . 22Eclipse Main Screen . . . . . . . . . . . . . . . . . . . . . . . . . . . . . . . . . . . . . . . . 22
Eclipse Batch Window . . . . . . . . . . . . . . . . . . . . . . . . . . . . . . . . . . . . . . . 24
The Title Bar . . . . . . . . . . . . . . . . . . . . . . . . . . . . . . . . . . . . . . . . . . . . 27
The Menu Bar . . . . . . . . . . . . . . . . . . . . . . . . . . . . . . . . . . . . . . . . . . . 27
File . . . . . . . . . . . . . . . . . . . . . . . . . . . . . . . . . . . . . . . . . . . . . . . 27
No Batch Data Displayed . . . . . . . . . . . . . . . . . . . . . . . . . . . . . . . . . 28
Batch Data Displayed . . . . . . . . . . . . . . . . . . . . . . . . . . . . . . . . . . . 29
View . . . . . . . . . . . . . . . . . . . . . . . . . . . . . . . . . . . . . . . . . . . . . . 31
Manage. . . . . . . . . . . . . . . . . . . . . . . . . . . . . . . . . . . . . . . . . . . . . 31
Count. . . . . . . . . . . . . . . . . . . . . . . . . . . . . . . . . . . . . . . . . . . . . . 31
Reports . . . . . . . . . . . . . . . . . . . . . . . . . . . . . . . . . . . . . . . . . . . . . 32
QC . . . . . . . . . . . . . . . . . . . . . . . . . . . . . . . . . . . . . . . . . . . . . . . 32
System . . . . . . . . . . . . . . . . . . . . . . . . . . . . . . . . . . . . . . . . . . . . . 33
DB Utilities . . . . . . . . . . . . . . . . . . . . . . . . . . . . . . . . . . . . . . . . . . 37
Window . . . . . . . . . . . . . . . . . . . . . . . . . . . . . . . . . . . . . . . . . . . . 38
Help . . . . . . . . . . . . . . . . . . . . . . . . . . . . . . . . . . . . . . . . . . . . . . 38
The Toolbar . . . . . . . . . . . . . . . . . . . . . . . . . . . . . . . . . . . . . . . . . . . . 38
Required Data . . . . . . . . . . . . . . . . . . . . . . . . . . . . . . . . . . . . . . . . . . . 40
4. Setting Up to Count Samples. . . . . . . . . . . . . . . . . . . 41Setting Up the Sample Changer . . . . . . . . . . . . . . . . . . . . . . . . . . . . . . . . . . 41
Entering Calibration Standards. . . . . . . . . . . . . . . . . . . . . . . . . . . . . . . . . . . 42
Determining Operating Voltages. . . . . . . . . . . . . . . . . . . . . . . . . . . . . . . . . . 44
Creating a Plateau Procedure . . . . . . . . . . . . . . . . . . . . . . . . . . . . . . . . . 44
Generating Alpha, Beta, and Gamma Plateaus . . . . . . . . . . . . . . . . . . . . . . . . 48
Spillover Correction . . . . . . . . . . . . . . . . . . . . . . . . . . . . . . . . . . . . . . . . 53
Alpha/Beta Amplifier Discriminator Adjustment . . . . . . . . . . . . . . . . . . . . . . . 53
Gamma Amplifier Discriminator Adjustment . . . . . . . . . . . . . . . . . . . . . . . . . . . 56
System Background . . . . . . . . . . . . . . . . . . . . . . . . . . . . . . . . . . . . . . . . 58
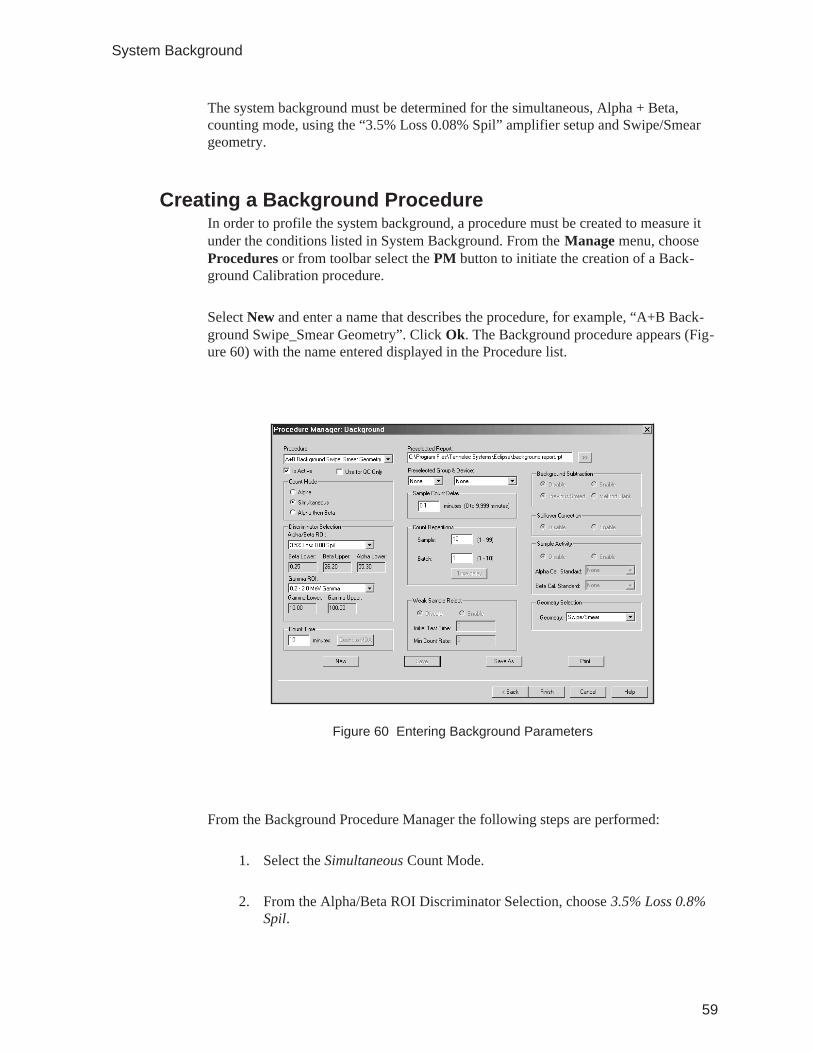
Creating a Background Procedure . . . . . . . . . . . . . . . . . . . . . . . . . . . . . . . 59
Measuring the System Background . . . . . . . . . . . . . . . . . . . . . . . . . . . . . . 60
System Efficiency . . . . . . . . . . . . . . . . . . . . . . . . . . . . . . . . . . . . . . . . . 62
Creating an Efficiency Procedure . . . . . . . . . . . . . . . . . . . . . . . . . . . . . . . 62
Measuring the System Efficiency . . . . . . . . . . . . . . . . . . . . . . . . . . . . . . . 64
Counting Samples . . . . . . . . . . . . . . . . . . . . . . . . . . . . . . . . . . . . . . . . . 67
Creating an Unknown Sample Counting Procedure . . . . . . . . . . . . . . . . . . . . . . 67
Counting Unknown Samples . . . . . . . . . . . . . . . . . . . . . . . . . . . . . . . . . 69
ii
5. Creating System Counting Procedures . . . . . . . . . . . . . 71System Options. . . . . . . . . . . . . . . . . . . . . . . . . . . . . . . . . . . . . . . . . . . 71
Procedure Manager. . . . . . . . . . . . . . . . . . . . . . . . . . . . . . . . . . . . . . . . . 71
Calibration Procedures. . . . . . . . . . . . . . . . . . . . . . . . . . . . . . . . . . . . . 72
Plateau Procedure . . . . . . . . . . . . . . . . . . . . . . . . . . . . . . . . . . . . . 72
Background Procedure . . . . . . . . . . . . . . . . . . . . . . . . . . . . . . . . . . 76
Efficiency Procedure . . . . . . . . . . . . . . . . . . . . . . . . . . . . . . . . . . . 81
Attenuation Procedure . . . . . . . . . . . . . . . . . . . . . . . . . . . . . . . . . . . 85
Sample Counting Procedures . . . . . . . . . . . . . . . . . . . . . . . . . . . . . . . . . 89
Unknown Procedure . . . . . . . . . . . . . . . . . . . . . . . . . . . . . . . . . . . . 89
SMS Procedure . . . . . . . . . . . . . . . . . . . . . . . . . . . . . . . . . . . . . . 94
6. Archiving Batch Data . . . . . . . . . . . . . . . . . . . . . . 101Creating an Archive. . . . . . . . . . . . . . . . . . . . . . . . . . . . . . . . . . . . . . . . 101
Viewing an Archive. . . . . . . . . . . . . . . . . . . . . . . . . . . . . . . . . . . . . . . . 105
Deleting Batches . . . . . . . . . . . . . . . . . . . . . . . . . . . . . . . . . . . . . . . . . 106
7. Database Utilities . . . . . . . . . . . . . . . . . . . . . . . . 107Devices . . . . . . . . . . . . . . . . . . . . . . . . . . . . . . . . . . . . . . . . . . . . . . 107
Standards and Nuclides . . . . . . . . . . . . . . . . . . . . . . . . . . . . . . . . . . . . . . 110
Plateaus . . . . . . . . . . . . . . . . . . . . . . . . . . . . . . . . . . . . . . . . . . . . . . 114
Background Averages . . . . . . . . . . . . . . . . . . . . . . . . . . . . . . . . . . . . . . 116
Efficiency Averages . . . . . . . . . . . . . . . . . . . . . . . . . . . . . . . . . . . . . . . 118
Spillover Averages . . . . . . . . . . . . . . . . . . . . . . . . . . . . . . . . . . . . . . . . 122
Attenuation Averages . . . . . . . . . . . . . . . . . . . . . . . . . . . . . . . . . . . . . . . 125
MDA Calculator . . . . . . . . . . . . . . . . . . . . . . . . . . . . . . . . . . . . . . . . . 128
Calculate Count Time . . . . . . . . . . . . . . . . . . . . . . . . . . . . . . . . . . . . 128
Calculate MDA . . . . . . . . . . . . . . . . . . . . . . . . . . . . . . . . . . . . . . . . 129
8. Sample Manager . . . . . . . . . . . . . . . . . . . . . . . . . 132Opening the Sample Manager . . . . . . . . . . . . . . . . . . . . . . . . . . . . . . . . . . 132
Previously Counted Batches of Samples . . . . . . . . . . . . . . . . . . . . . . . . . . . 132
Uncounted Batches of Samples . . . . . . . . . . . . . . . . . . . . . . . . . . . . . . . 133
Creating a Batch for Non-Repetitive Samples . . . . . . . . . . . . . . . . . . . . . . . . . . 134
iii
Creating a Batch Template . . . . . . . . . . . . . . . . . . . . . . . . . . . . . . . . . . . . 135
Adding Duplicate Samples . . . . . . . . . . . . . . . . . . . . . . . . . . . . . . . . . . 138
Editing a Sample Manager Template Batch . . . . . . . . . . . . . . . . . . . . . . . . . . . 140
Printing a Sample Manager Batch . . . . . . . . . . . . . . . . . . . . . . . . . . . . . . . . 141
Analyzing Sample Manager Batch Samples . . . . . . . . . . . . . . . . . . . . . . . . . . . 143
9. Eclipse QC Chart Program . . . . . . . . . . . . . . . . . . . 145Opening the QC Chart Program . . . . . . . . . . . . . . . . . . . . . . . . . . . . . . . . . 145
Creating a QC Profile. . . . . . . . . . . . . . . . . . . . . . . . . . . . . . . . . . . . . 145
Create a QC Chart . . . . . . . . . . . . . . . . . . . . . . . . . . . . . . . . . . . . . . 150
10. Sequence Manager . . . . . . . . . . . . . . . . . . . . . . . 154Calibration Sequence (AutoCal) . . . . . . . . . . . . . . . . . . . . . . . . . . . . . . . . . 155
QC Sequence (AutoQC) . . . . . . . . . . . . . . . . . . . . . . . . . . . . . . . . . . . . . 158
Super Sequence . . . . . . . . . . . . . . . . . . . . . . . . . . . . . . . . . . . . . . . . . . 160
Starting a AutoCal, AutoQC, or Super Sequence. . . . . . . . . . . . . . . . . . . . . . . . . 163
Creating an Auto ROI Procedure . . . . . . . . . . . . . . . . . . . . . . . . . . . . . . . . . 165
11. Security Setup . . . . . . . . . . . . . . . . . . . . . . . . . . 168New/Edit User Button . . . . . . . . . . . . . . . . . . . . . . . . . . . . . . . . . . . . . . 169
Delete User . . . . . . . . . . . . . . . . . . . . . . . . . . . . . . . . . . . . . . . . . . . . 170
New/Edit Group Button. . . . . . . . . . . . . . . . . . . . . . . . . . . . . . . . . . . . . . 170
Delete Group . . . . . . . . . . . . . . . . . . . . . . . . . . . . . . . . . . . . . . . . . . . 173
12. System Overview . . . . . . . . . . . . . . . . . . . . . . . . 174Sample Changer . . . . . . . . . . . . . . . . . . . . . . . . . . . . . . . . . . . . . . . . . 174
Sample Changer Mechanism . . . . . . . . . . . . . . . . . . . . . . . . . . . . . . . . . 174
Sample Reader . . . . . . . . . . . . . . . . . . . . . . . . . . . . . . . . . . . . . . . . 175
Sample Changer Operation . . . . . . . . . . . . . . . . . . . . . . . . . . . . . . . . . . 176
Lead Shield . . . . . . . . . . . . . . . . . . . . . . . . . . . . . . . . . . . . . . . . . . . . 176
Gas System . . . . . . . . . . . . . . . . . . . . . . . . . . . . . . . . . . . . . . . . . . . . 177
Gas Regulation and Control . . . . . . . . . . . . . . . . . . . . . . . . . . . . . . . . . 177
Detectors . . . . . . . . . . . . . . . . . . . . . . . . . . . . . . . . . . . . . . . . . . . . . 178
Sample and Guard Detector . . . . . . . . . . . . . . . . . . . . . . . . . . . . . . . . . 178
iv
Preamplifier . . . . . . . . . . . . . . . . . . . . . . . . . . . . . . . . . . . . . . . . . . . . 178
Amplifier/SCA . . . . . . . . . . . . . . . . . . . . . . . . . . . . . . . . . . . . . . . . . . 178
System Controller. . . . . . . . . . . . . . . . . . . . . . . . . . . . . . . . . . . . . . . . . 179
IEEE-488 Address . . . . . . . . . . . . . . . . . . . . . . . . . . . . . . . . . . . . . . 179
Control Panel . . . . . . . . . . . . . . . . . . . . . . . . . . . . . . . . . . . . . . . . . . . 180
System Status . . . . . . . . . . . . . . . . . . . . . . . . . . . . . . . . . . . . . . . . . 180
Sample Changer Control . . . . . . . . . . . . . . . . . . . . . . . . . . . . . . . . . . . 180
Power Supply . . . . . . . . . . . . . . . . . . . . . . . . . . . . . . . . . . . . . . . . . . . 181
13. Upgraded System Instructions . . . . . . . . . . . . . . . . . 182System Addressing . . . . . . . . . . . . . . . . . . . . . . . . . . . . . . . . . . . . . . . . 182
Non-NIM Bin Based Instruments. . . . . . . . . . . . . . . . . . . . . . . . . . . . . . . . . 182
NIM Bin Based Instruments . . . . . . . . . . . . . . . . . . . . . . . . . . . . . . . . . . . 182
Automatic Gas Flow Regulation . . . . . . . . . . . . . . . . . . . . . . . . . . . . . . . 182
ROI Setup - Spillover . . . . . . . . . . . . . . . . . . . . . . . . . . . . . . . . . . . . 183
Upgraded Hardware Specifics . . . . . . . . . . . . . . . . . . . . . . . . . . . . . . . . . . 184
Detector Replacement (LB5100-W-GWD) . . . . . . . . . . . . . . . . . . . . . . . . . 184
Detector Replacement (LB5100-W) . . . . . . . . . . . . . . . . . . . . . . . . . . . . . 186
Detector Replacement (NIM-based system) . . . . . . . . . . . . . . . . . . . . . . . . . 187
Sample Changer Considerations . . . . . . . . . . . . . . . . . . . . . . . . . . . . . . . 189
14. Gas System. . . . . . . . . . . . . . . . . . . . . . . . . . . . 192Gas Management . . . . . . . . . . . . . . . . . . . . . . . . . . . . . . . . . . . . . . . . . 192
Gas Specifications . . . . . . . . . . . . . . . . . . . . . . . . . . . . . . . . . . . . . . 192
Gas Mode. . . . . . . . . . . . . . . . . . . . . . . . . . . . . . . . . . . . . . . . . . . 192
Gas Stat Gas Conservation System. . . . . . . . . . . . . . . . . . . . . . . . . . . . . . 193
Gas Operational Modes and Front Panel Displays . . . . . . . . . . . . . . . . . . . . . . 195
15. Counting with Gas-Flow Proportional Detectors . . . . . . . 197Proportional Counting . . . . . . . . . . . . . . . . . . . . . . . . . . . . . . . . . . . . . . 197
How a Gas Detector Works . . . . . . . . . . . . . . . . . . . . . . . . . . . . . . . . . . . . 198
Operating Regions of Gas Detectors . . . . . . . . . . . . . . . . . . . . . . . . . . . . . . . 199
Recombination Region . . . . . . . . . . . . . . . . . . . . . . . . . . . . . . . . . . . . 200
Ionization Region. . . . . . . . . . . . . . . . . . . . . . . . . . . . . . . . . . . . . . . 200
v
Proportional Region . . . . . . . . . . . . . . . . . . . . . . . . . . . . . . . . . . . . . 200
Geiger-Müller (GM) Region . . . . . . . . . . . . . . . . . . . . . . . . . . . . . . . . . 200
Continuous Discharge Region . . . . . . . . . . . . . . . . . . . . . . . . . . . . . . . . 200
Proportional Detectors . . . . . . . . . . . . . . . . . . . . . . . . . . . . . . . . . . . . . . 200
Gas Multiplication in Proportional Detectors . . . . . . . . . . . . . . . . . . . . . . . . 201
Relationship of Plateau Voltage to Charge Collection . . . . . . . . . . . . . . . . . . . . 201
Alpha Particle Interactions with Proportional Detectors . . . . . . . . . . . . . . . . . . . 201
Beta Particle Interactions with Proportional Detectors . . . . . . . . . . . . . . . . . . . . 202
Operating Voltage In Relation To The Type Of Radiation. . . . . . . . . . . . . . . . . . 202
Simultaneous Alpha and Beta Measurements . . . . . . . . . . . . . . . . . . . . . . . . 203
Discussion of Count Modes . . . . . . . . . . . . . . . . . . . . . . . . . . . . . . . . . . . 203
Alpha Only . . . . . . . . . . . . . . . . . . . . . . . . . . . . . . . . . . . . . . . . . . 203
Alpha then Beta . . . . . . . . . . . . . . . . . . . . . . . . . . . . . . . . . . . . . . . 204
Simultaneous (Alpha and Beta) . . . . . . . . . . . . . . . . . . . . . . . . . . . . . . . 205
Factors Affecting Sample Measurements. . . . . . . . . . . . . . . . . . . . . . . . . . . . . 205
Gas Composition and Quenching . . . . . . . . . . . . . . . . . . . . . . . . . . . . . . 205
Gas Quality . . . . . . . . . . . . . . . . . . . . . . . . . . . . . . . . . . . . . . . . . . 206
Sources of Background in Gas Proportional Detectors . . . . . . . . . . . . . . . . . . . 206
Instrument Methods to Reduce System Background . . . . . . . . . . . . . . . . . . . . . 207
Spillover Effects . . . . . . . . . . . . . . . . . . . . . . . . . . . . . . . . . . . . . . . . . 208
Region Discrimination to Minimize Spillover . . . . . . . . . . . . . . . . . . . . . . . . 209
Sample Self-absorption and Scattering . . . . . . . . . . . . . . . . . . . . . . . . . . . . . . 209
Detector Geometry . . . . . . . . . . . . . . . . . . . . . . . . . . . . . . . . . . . . . . . . 210
Gamma and X-ray Sensitivity of Proportional Detectors. . . . . . . . . . . . . . . . . . . . . 210
Quantitative Measurements with Gas-flow Proportional Counting Systems . . . . . . . . . . . 210
16. Troubleshooting . . . . . . . . . . . . . . . . . . . . . . . . . 211System Status Indicator . . . . . . . . . . . . . . . . . . . . . . . . . . . . . . . . . . . . . . 211
Gas Flow Problems . . . . . . . . . . . . . . . . . . . . . . . . . . . . . . . . . . . . . . . . 211
Gas Pressure Low . . . . . . . . . . . . . . . . . . . . . . . . . . . . . . . . . . . . . . 211
Gas Tubing Crimped or Secondary of Regulator not Open . . . . . . . . . . . . . . . . . 211
Bubble Test . . . . . . . . . . . . . . . . . . . . . . . . . . . . . . . . . . . . . . . . . . . . 212
Plateau Problems . . . . . . . . . . . . . . . . . . . . . . . . . . . . . . . . . . . . . . . . . 212
Background Problems . . . . . . . . . . . . . . . . . . . . . . . . . . . . . . . . . . . . . . 212
vi
Efficiency/Spillover Problems . . . . . . . . . . . . . . . . . . . . . . . . . . . . . . . . . . 213
Sr-90 Efficiency too high. . . . . . . . . . . . . . . . . . . . . . . . . . . . . . . . . . . 213
Alpha Spillover too High . . . . . . . . . . . . . . . . . . . . . . . . . . . . . . . . . . . 213
Count Timer Not Incrementing . . . . . . . . . . . . . . . . . . . . . . . . . . . . . . . . . . 214
Data Reproducibility . . . . . . . . . . . . . . . . . . . . . . . . . . . . . . . . . . . . . . . 215
Report Generation Problems . . . . . . . . . . . . . . . . . . . . . . . . . . . . . . . . . . . 215
Software Error Messages . . . . . . . . . . . . . . . . . . . . . . . . . . . . . . . . . . . . . 215
Database Error Messages . . . . . . . . . . . . . . . . . . . . . . . . . . . . . . . . . . . 216
Divide by Zero Errors . . . . . . . . . . . . . . . . . . . . . . . . . . . . . . . . . . . . 216
Memory Errors . . . . . . . . . . . . . . . . . . . . . . . . . . . . . . . . . . . . . . . . 217
Plateau Error Messages. . . . . . . . . . . . . . . . . . . . . . . . . . . . . . . . . . . . 218
A. References . . . . . . . . . . . . . . . . . . . . . . . . . . . . 219
B. Glossary of Terms . . . . . . . . . . . . . . . . . . . . . . . . 220
Index . . . . . . . . . . . . . . . . . . . . . . . . . . . . . . . . . 243
vii
Read Me First
Eclipse LB Database Conversion Utility
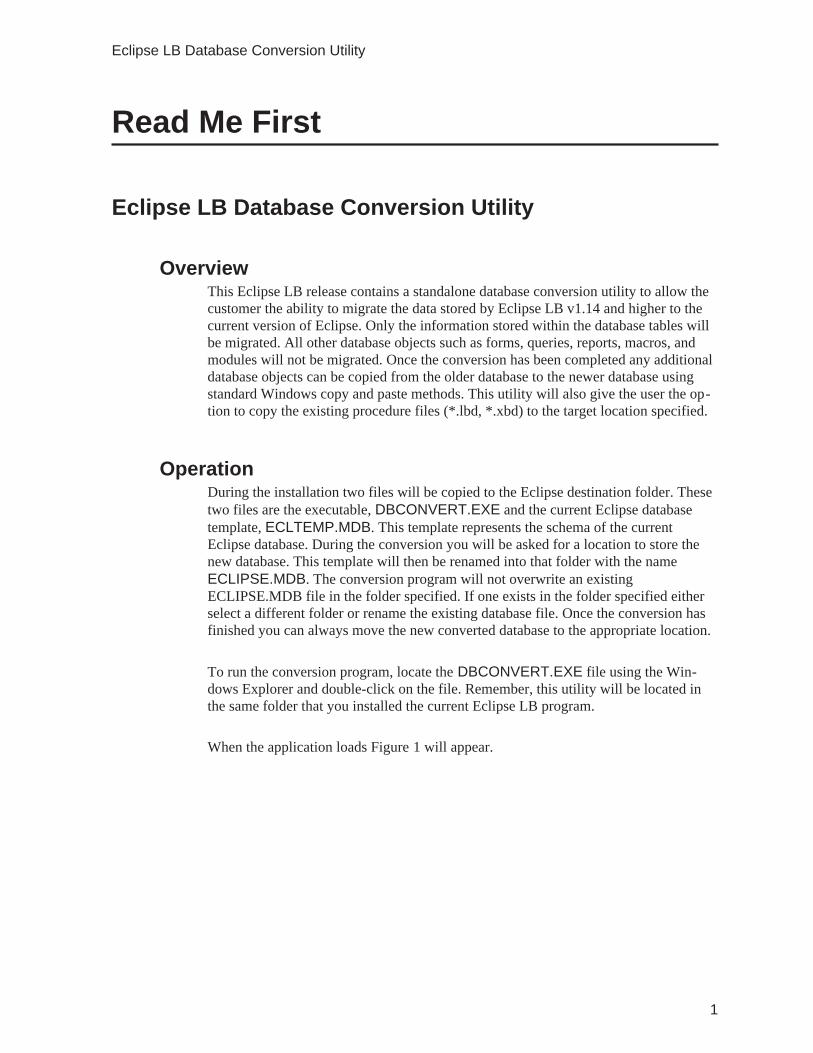
OverviewThis Eclipse LB release contains a standalone database conversion utility to allow thecustomer the ability to migrate the data stored by Eclipse LB v1.14 and higher to thecurrent version of Eclipse. Only the information stored within the database tables willbe migrated. All other database objects such as forms, queries, reports, macros, andmodules will not be migrated. Once the conversion has been completed any additionaldatabase objects can be copied from the older database to the newer database usingstandard Windows copy and paste methods. This utility will also give the user the op-tion to copy the existing procedure files (*.lbd, *.xbd) to the target location specified.
OperationDuring the installation two files will be copied to the Eclipse destination folder. Thesetwo files are the executable, DBCONVERT.EXE and the current Eclipse databasetemplate, ECLTEMP.MDB. This template represents the schema of the currentEclipse database. During the conversion you will be asked for a location to store thenew database. This template will then be renamed into that folder with the nameECLIPSE.MDB. The conversion program will not overwrite an existingECLIPSE.MDB file in the folder specified. If one exists in the folder specified eitherselect a different folder or rename the existing database file. Once the conversion hasfinished you can always move the new converted database to the appropriate location.
To run the conversion program, locate the DBCONVERT.EXE file using the Win-dows Explorer and double-click on the file. Remember, this utility will be located inthe same folder that you installed the current Eclipse LB program.
When the application loads Figure 1 will appear.
1
Eclipse LB Database Conversion Utility
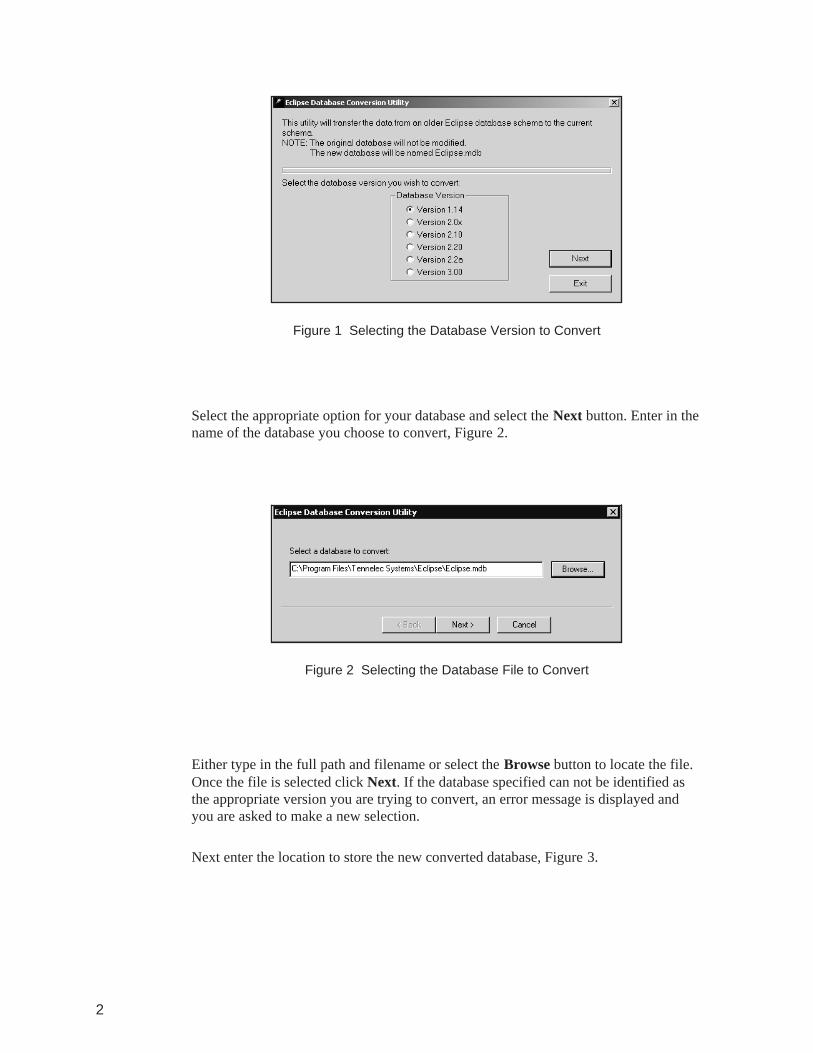
Select the appropriate option for your database and select the Next button. Enter in thename of the database you choose to convert, Figure 2.
Either type in the full path and filename or select the Browse button to locate the file.Once the file is selected click Next. If the database specified can not be identified asthe appropriate version you are trying to convert, an error message is displayed andyou are asked to make a new selection.
Next enter the location to store the new converted database, Figure 3.
2
Figure 1 Selecting the Database Version to Convert
Figure 2 Selecting the Database File to Convert
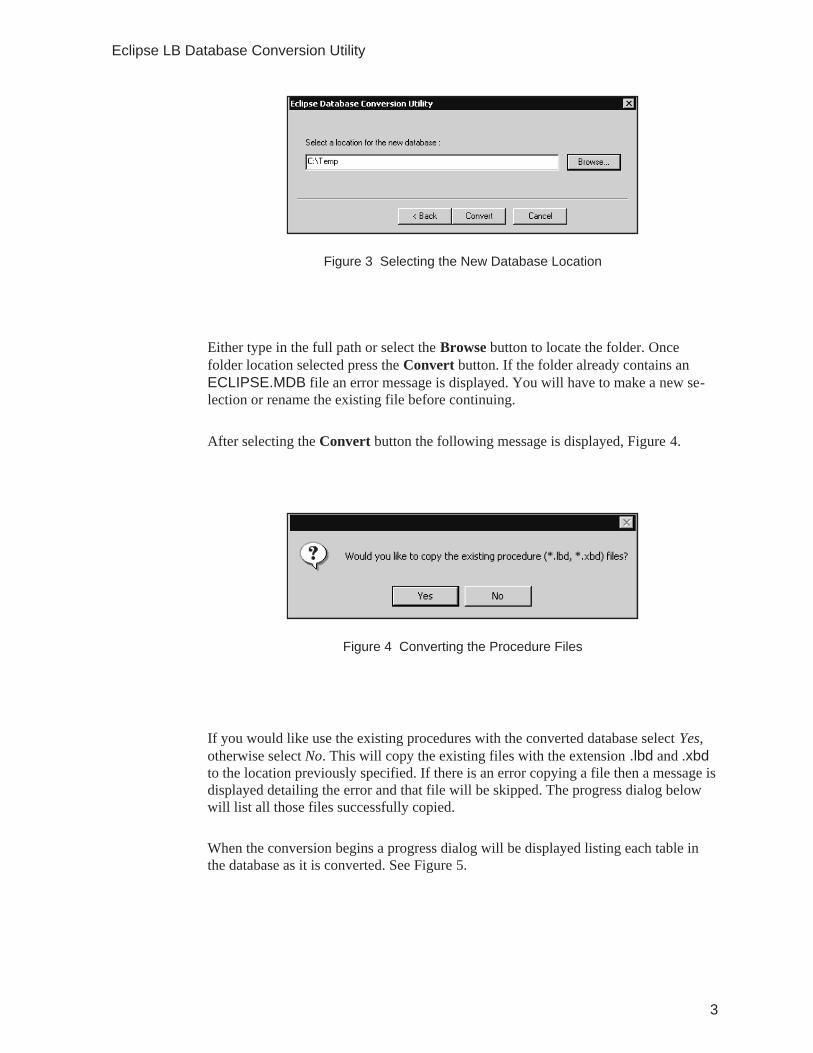
Either type in the full path or select the Browse button to locate the folder. Oncefolder location selected press the Convert button. If the folder already contains anECLIPSE.MDB file an error message is displayed. You will have to make a new se-lection or rename the existing file before continuing.
After selecting the Convert button the following message is displayed, Figure 4.
If you would like use the existing procedures with the converted database select Yes,otherwise select No. This will copy the existing files with the extension .lbd and .xbdto the location previously specified. If there is an error copying a file then a message isdisplayed detailing the error and that file will be skipped. The progress dialog belowwill list all those files successfully copied.
When the conversion begins a progress dialog will be displayed listing each table inthe database as it is converted. See Figure 5.
3
Eclipse LB Database Conversion Utility
Figure 3 Selecting the New Database Location
Figure 4 Converting the Procedure Files
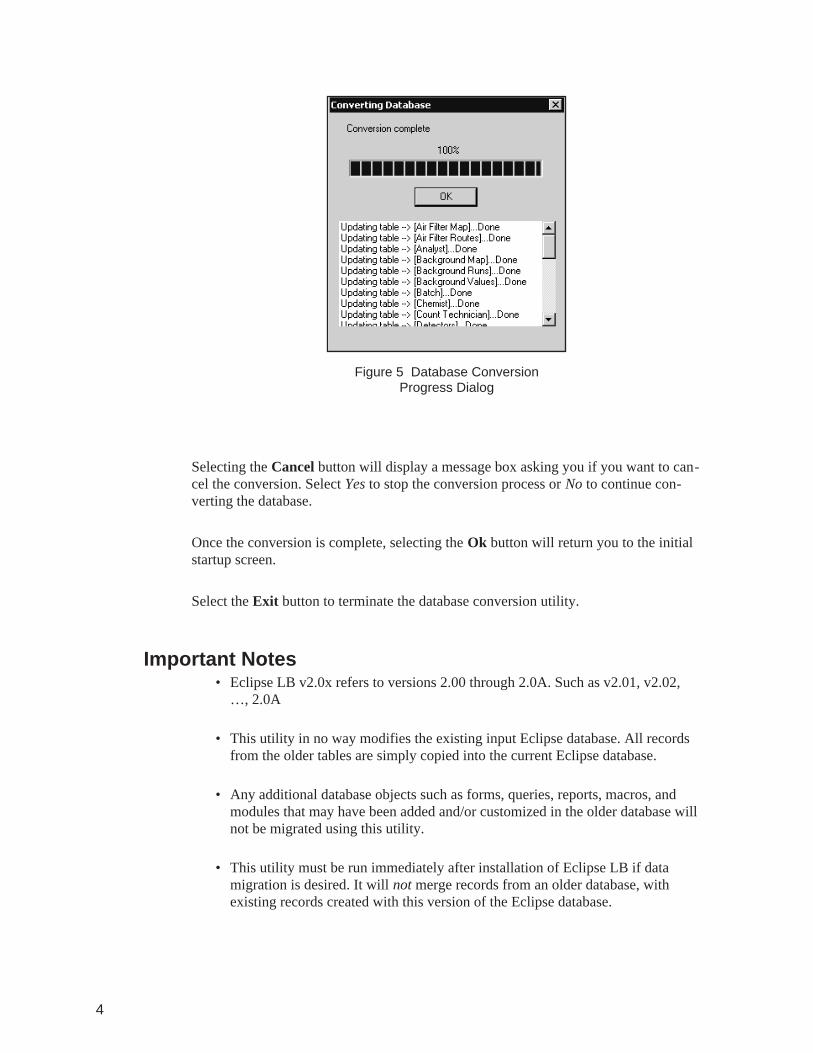
Selecting the Cancel button will display a message box asking you if you want to can-cel the conversion. Select Yes to stop the conversion process or No to continue con-verting the database.
Once the conversion is complete, selecting the Ok button will return you to the initialstartup screen.
Select the Exit button to terminate the database conversion utility.
Important Notes• Eclipse LB v2.0x refers to versions 2.00 through 2.0A. Such as v2.01, v2.02,
…, 2.0A
• This utility in no way modifies the existing input Eclipse database. All recordsfrom the older tables are simply copied into the current Eclipse database.
• Any additional database objects such as forms, queries, reports, macros, andmodules that may have been added and/or customized in the older database willnot be migrated using this utility.
• This utility must be run immediately after installation of Eclipse LB if datamigration is desired. It will not merge records from an older database, withexisting records created with this version of the Eclipse database.
4
Figure 5 Database ConversionProgress Dialog
1. Introduction
Welcome to Eclipse LB Software
This manual introduces you to Eclipse LB software and the Tennelec Series 5. It pres-ents all of the information you will need to operate the system and analyze your data.It shows you how to do the most common operations, provides you with tips, andpoints you to the many new features that are part of Eclipse LB. Some information inthis user’s manual covers hardware information unique for specific Tennelec lowbackground counting systems including those that have been upgraded to work withEclipse. Specific hardware related information will be contained in the installationmanual that was originally provided with the system.
About this ManualThis manual contains the following chapters and appendices:
Chapter 1, Introduction (this chapter), this chapter is an introduction to the manual.
Chapter 2, Getting Started, provides information about how to install the softwareonto your computer.
Chapter 3, Software Environment, describes the appearance and function of the mainEclipse LB window.
Chapter 4, Setting Up to Count Samples, describes how to calibrate the system.
Chapter 5, Creating System Counting Procedures, describes how to use the ProcedureManager to create calibration and sample counting procedures.
Chapter 6, Archiving Batch Data, describes how to create, view, and delete archivedbatch data.
Chapter 7, DB Utilities, describes how to use the DB Utilities to add/edit devices, stan-dards/nuclides, as well as how to edit plateaus, background averages, efficiency aver-ages, spillover average, and attenuation averages.
Chapter 8, Sample Manager, describes how to use the Sample Manger to enter sampleinformation needed for analysis of that sample.
Chapter 9, Eclipse QC Chart Programs, describes the how to use the QC Chart Pro-gram.
5
About this Manual
Chapter 10, Sequence Manager, describes how to use the Sequence Manager to definea series of procedures to run in a specified order.
Chapter 11, Security Setup, how the System Administrator can create and maintain adatabase of users, their group assignments and the security objects each group can ac-cess.
Chapter 12, System Overview, describes hardware specifics, focused on the Series 5.
Chapter 13, Upgraded System Instructions, contains information about how to useEclipse LB software with older systems that employ both NIM and non-NIM electron-ics.
Chapter 14, Gas Management System, provides information on Gas Stat and other gasconservation features in the Series 5 systems.
Chapter 15, Gas Flow Proportional Counting, presents an introduction to the theoryand practice of using gas flow proportional detectors for alpha and beta measurements.
Chapter 16, Troubleshooting, answers questions about installation, gas flow, plateau,discriminator, background, efficiency, attenuation and data reasonability problems thatare occasionally encountered.
Appendix A, References, provides a list of references.
Appendix B, Glossary of Terms, provides definitions of technical, nuclear, computerand software terms used in this manual.
Typographic Conventions
Windows CommandsWindows commands are shown in bold type (View).
Key NamesThis manual shows the names of keyboard keys as they usually appear on the key-board and are seen in small capital letters (for example, ESC, ENTER, CTRL).
Key CombinationsA plus sign (+) between two key names means that these keys must be pressed at thesame time. For example, Press “ALT+ESC” means that you should press the ALT keyand hold it down while you press the ESC key.
6
Introduction

User EntriesText you are expected to type in shown in Courier (typewriter style) type.
TitlesTitle of books and of manual chapters are shown in italics; titles of manual sectionsare enclosed in “quotes”.
Getting HelpThe Tennelec Eclipse LB software program contains an easy to use help system toguide you through the learning process of the software. You can get help for anyEclipse function by pressing the F1 key or by selecting Help from the Eclipse MenuBar and then Help Topics.
7
Getting Help
2. Getting Started
Pre-Configured SoftwareFactory supplied computer systems are normally configured with the IEEE interfaceand Eclipse LB software pre-installed and ready to run. It will not be necessary to loadthe software again unless updating versions, replacing the personal computer (PC), orrepairing a PC hardware or software failure. It is recommended that the hard drive bebacked-up regularly.
IEEE Interface and Driver Software InstallationIn the event that Canberra does not supply the computer, it will be necessary for theField Service Engineer or the end user to install the IEEE interface.
USB Type InterfaceIf the IEEE Interface is of the “USB” type (like the National Instruments GPIB-USB-B), follow the directions provided by the manufacture for installation and configura-tion of the driver software.
After the IEEE driver software is installed on the computer, follow the manufacture’sinstructions for connecting the interface to the computer.
Plug and Play Type InterfaceIf the IEEE Interface is of the “Plug and Play” type (like the National InstrumentsPCI-GPIB), then the card does not require any jumpers or DIP switches to be config-ured before the card is installed in the computer.
Follow the card manufactures instructions for installing the card into the computer.
After the IEEE Card is installed in the computer, follow the interface manufactures in-structions for installing the card into the computer.
Jumper or DIP Switch Type CardsIf the IEEE Card is of the older style with jumpers or DIP switches (like the NationalInstruments GPIB-PCII/IIA), then the card should be configured before it is installedin the computer. Configure the card as follows:
8
Getting Started
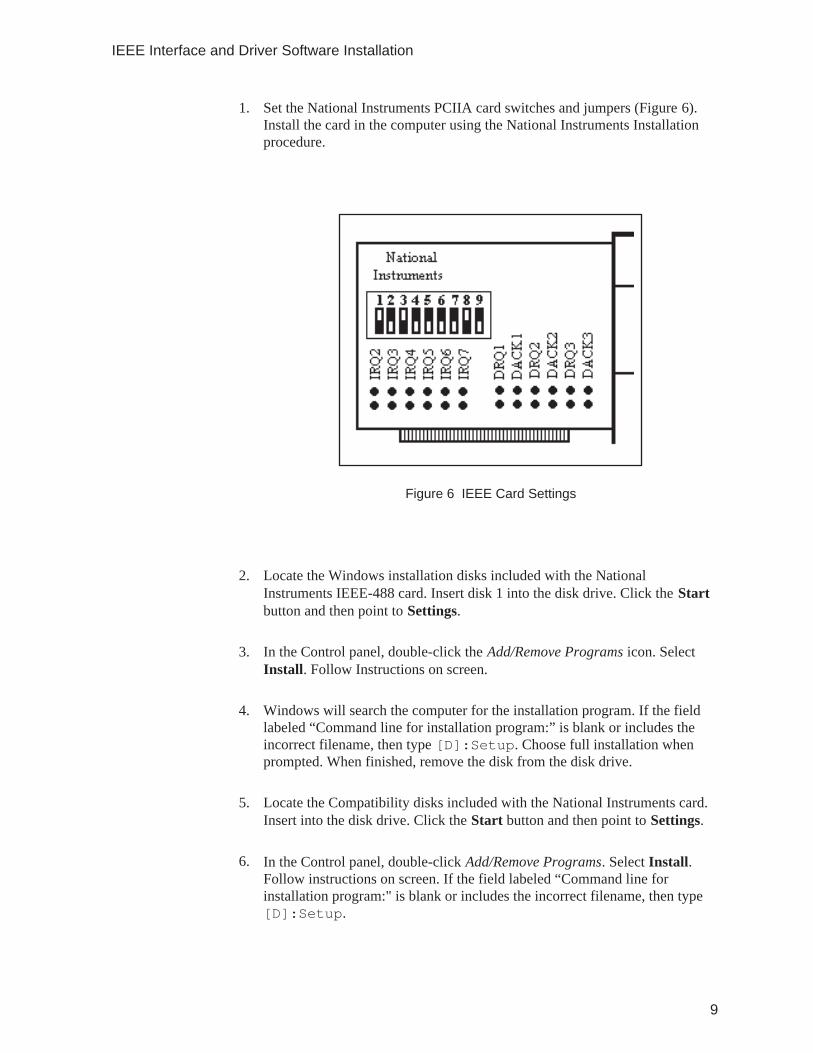
1. Set the National Instruments PCIIA card switches and jumpers (Figure 6).Install the card in the computer using the National Instruments Installationprocedure.
2. Locate the Windows installation disks included with the NationalInstruments IEEE-488 card. Insert disk 1 into the disk drive. Click the Startbutton and then point to Settings.
3. In the Control panel, double-click the Add/Remove Programs icon. SelectInstall. Follow Instructions on screen.
4. Windows will search the computer for the installation program. If the fieldlabeled “Command line for installation program:” is blank or includes theincorrect filename, then type [D]:Setup. Choose full installation whenprompted. When finished, remove the disk from the disk drive.
5. Locate the Compatibility disks included with the National Instruments card.Insert into the disk drive. Click the Start button and then point to Settings.
6. In the Control panel, double-click Add/Remove Programs. Select Install.Follow instructions on screen. If the field labeled “Command line forinstallation program:" is blank or includes the incorrect filename, then type[D]:Setup.
9
IEEE Interface and Driver Software Installation
Figure 6 IEEE Card Settings
7. Windows will search the computer for the installation program. If the fieldlabeled “Command line for installation program:” is blank or includes theincorrect filename, then type [D]:Setup. When asked for the sub-directory where the installed program should be placed, choose“Compatibility.” When finished, remove the disk from the disk drive.
8. Run the Windows Explorer program from the Start button. From the Viewmenu, choose Options. Select “Show all files” then clear “Hide MS-DOSfile extension for files that are registered". Click OK.
9. On the Explorer screen, locate the Windows folder. Double click it. Locatethe System folder. Double click it.
10. Click the “Up one level” button twice. Double-click on the Compatibilityfolder. Click once on the file GPIB-16.DLL. While holding the CTRL button,click once on the file GPIB-32.DLL. While continuing to hold the CTRL
button, drag the highlighted files to the [D:]Windows\System folder. Releasethe mouse and the CTRL button simultaneously.
11. If everything was performed in the correct order, a message should appearasking whether to overwrite existing files because they already exist. Answeryes for both files.
12. Double-click the GPIB icon on the control panel. Select GPIB0 and clickConfigure. The hardware settings should be as follows:
Use this Board = Yes
Base I/O Address = 0x02e1
Interrupt Level = None
DMA Channel = None
Timing = 500nsec
Software InstallationThe Eclipse LB installation program will automatically execute when the CD is placedin the CD-ROM drive and the auto-run feature of Windows is enabled.
10
Getting Started
Computer RequirementsThe minimum specification for the computer system include the following:
• Pentium® Class 200 MHz processor or faster
• 32 MB RAM
• 850 MB or larger HD with at least 50 MB free
• SVGA monitor with a minimum or 800 x 600 pixel resolution and 256 colors
• Microsoft® Windows NT® V4.0, Windows 2000 or Windows XP
• 4X or faster CD ROM Drive
In addition, the following optional hardware and software is recommended:
• Microsoft® Access 97/2000
• Crystal Reports® V7.0 or higher (if custom reports are required)
• pcAnywhere™ 32 for Remote Link
• 28.8 KBPS or faster modem
• Iomega ZIP drive or other high capacity backup media
• Un-interruptible Power Supply
First Time InstallationWhen the Eclipse LB installation is run for the first time on a computer it will take youthrough a series of screens. Once the Eclipse LB CD has been inserted into the CD-ROM drive, the InstallShield Wizard will install the components necessary to performthe system software installation.
11
Software Installation
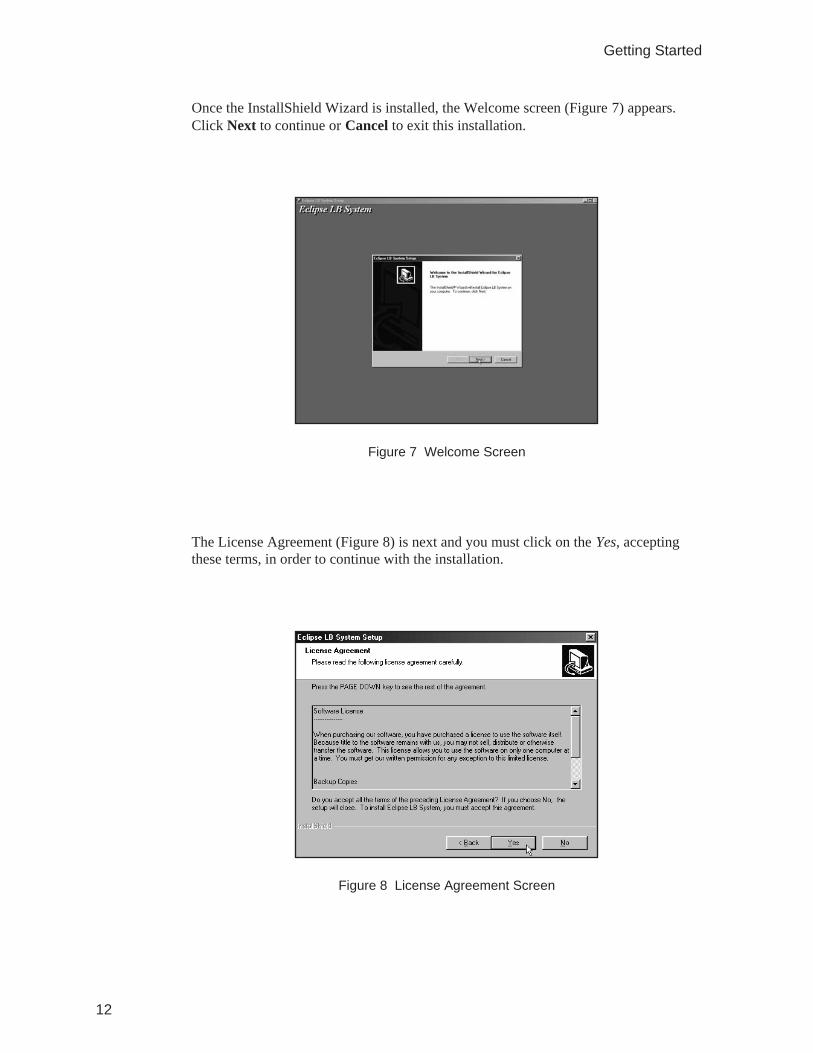
Once the InstallShield Wizard is installed, the Welcome screen (Figure 7) appears.Click Next to continue or Cancel to exit this installation.
The License Agreement (Figure 8) is next and you must click on the Yes, acceptingthese terms, in order to continue with the installation.
12
Getting Started
Figure 7 Welcome Screen
Figure 8 License Agreement Screen
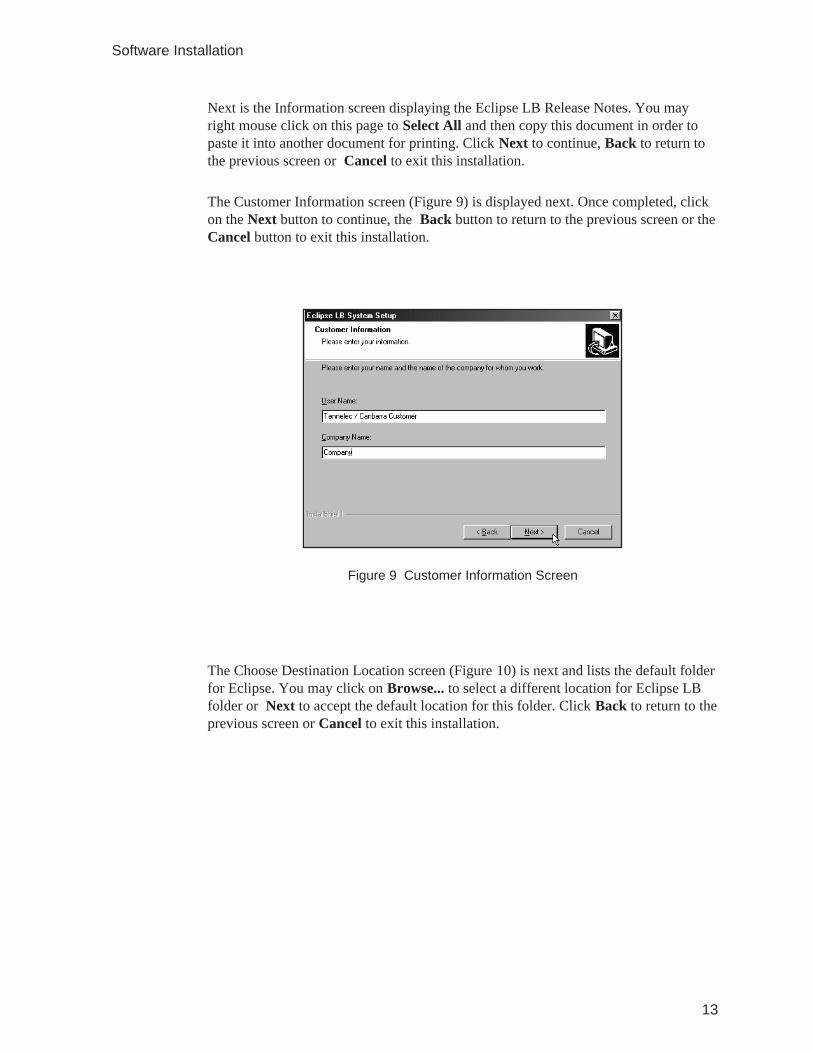
Next is the Information screen displaying the Eclipse LB Release Notes. You mayright mouse click on this page to Select All and then copy this document in order topaste it into another document for printing. Click Next to continue, Back to return tothe previous screen or Cancel to exit this installation.
The Customer Information screen (Figure 9) is displayed next. Once completed, clickon the Next button to continue, the Back button to return to the previous screen or theCancel button to exit this installation.
The Choose Destination Location screen (Figure 10) is next and lists the default folderfor Eclipse. You may click on Browse... to select a different location for Eclipse LBfolder or Next to accept the default location for this folder. Click Back to return to theprevious screen or Cancel to exit this installation.
13
Software Installation
Figure 9 Customer Information Screen
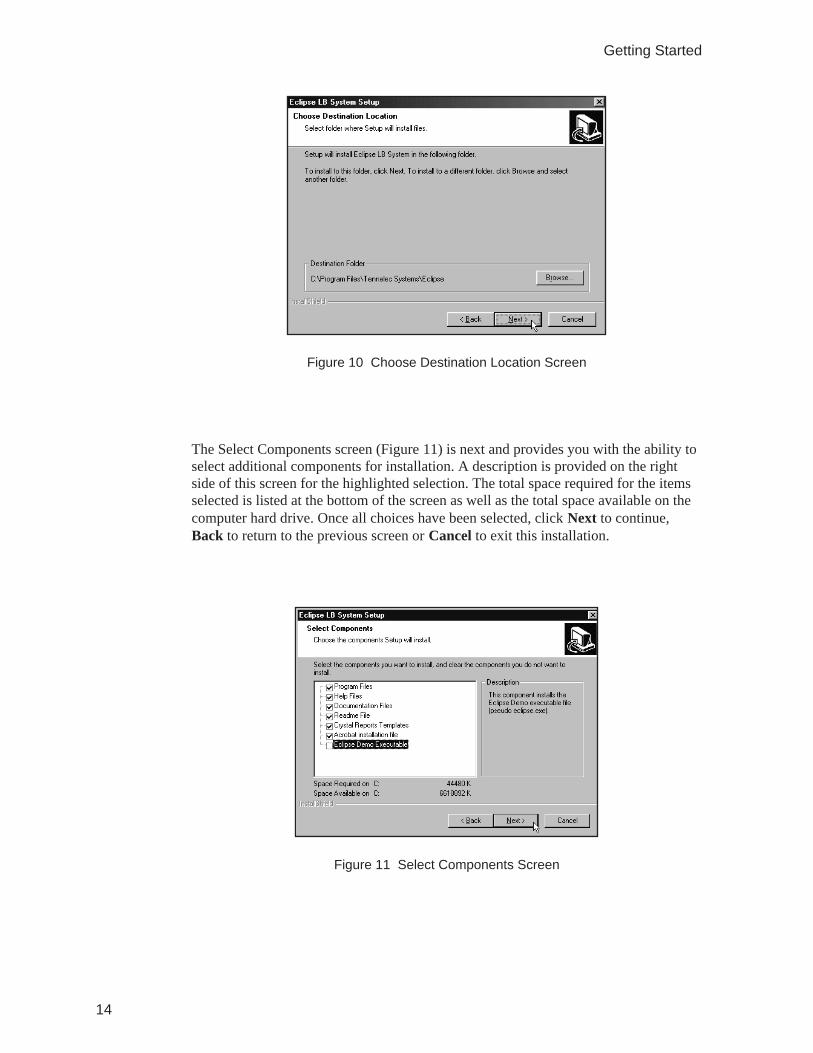
The Select Components screen (Figure 11) is next and provides you with the ability toselect additional components for installation. A description is provided on the rightside of this screen for the highlighted selection. The total space required for the itemsselected is listed at the bottom of the screen as well as the total space available on thecomputer hard drive. Once all choices have been selected, click Next to continue,Back to return to the previous screen or Cancel to exit this installation.
14
Getting Started
Figure 10 Choose Destination Location Screen
Figure 11 Select Components Screen
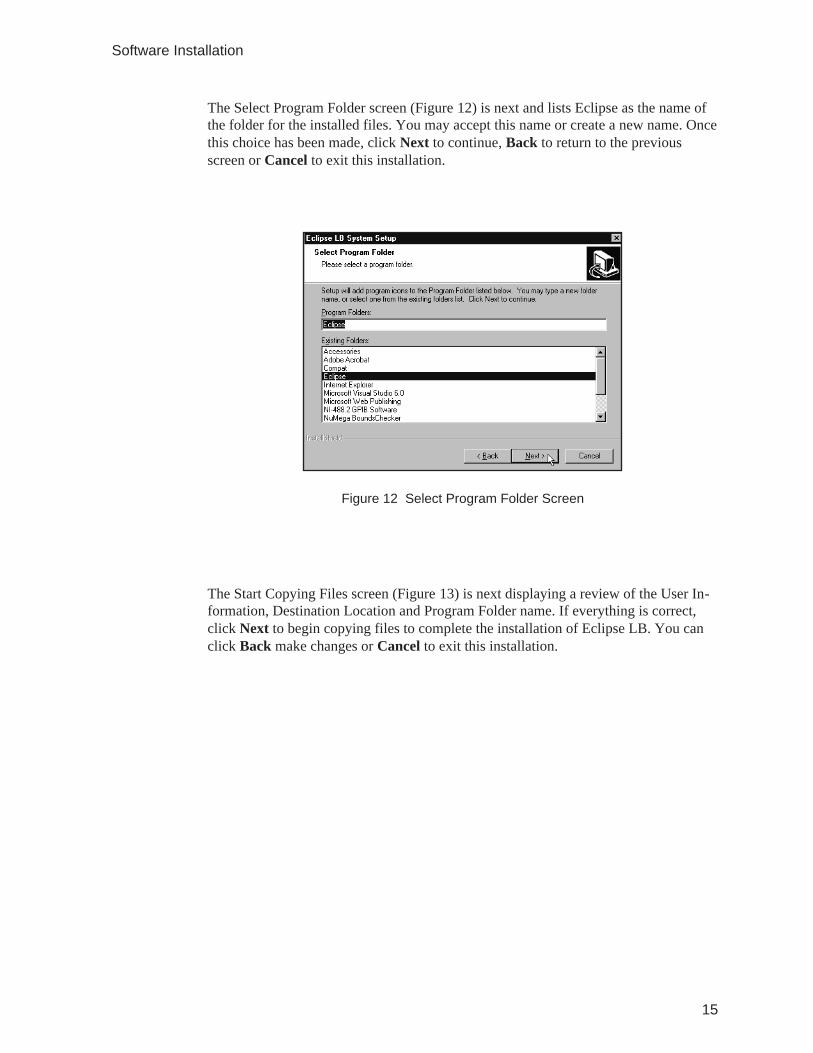
The Select Program Folder screen (Figure 12) is next and lists Eclipse as the name ofthe folder for the installed files. You may accept this name or create a new name. Oncethis choice has been made, click Next to continue, Back to return to the previousscreen or Cancel to exit this installation.
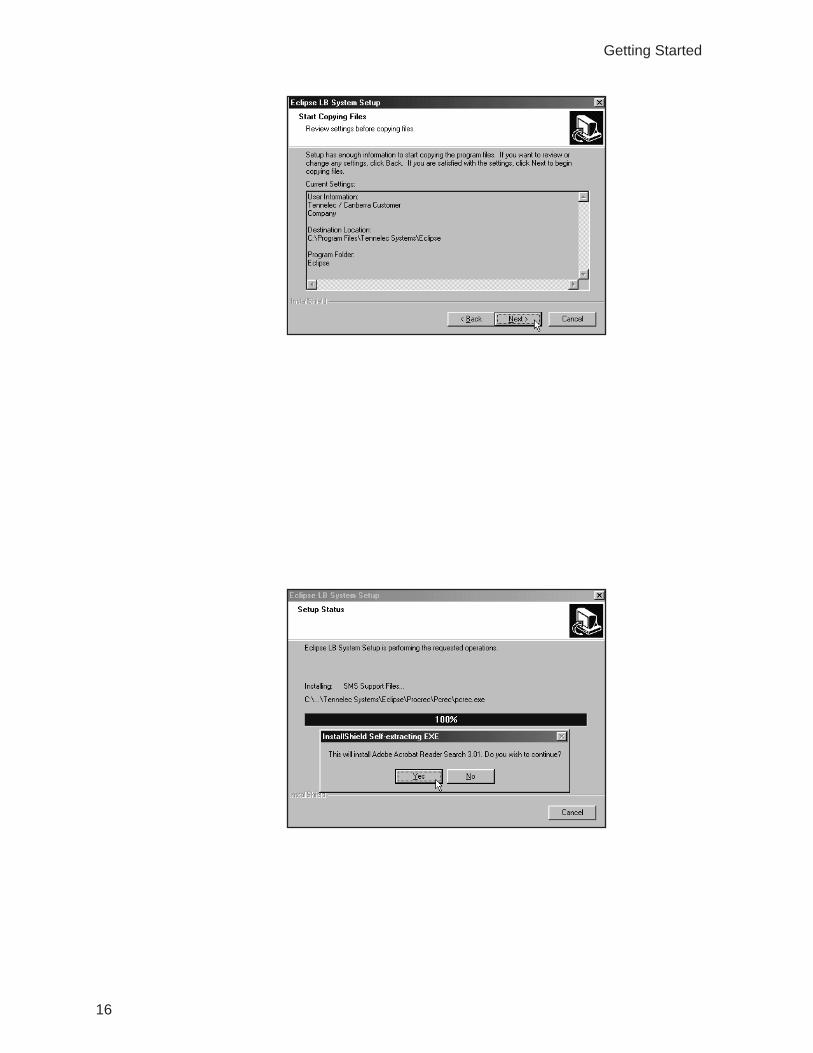
The Start Copying Files screen (Figure 13) is next displaying a review of the User In-formation, Destination Location and Program Folder name. If everything is correct,click Next to begin copying files to complete the installation of Eclipse LB. You canclick Back make changes or Cancel to exit this installation.
15
Software Installation
Figure 12 Select Program Folder Screen
16
Getting Started
Once all files have been installed, the following screen, Eclipse LB System Setup, ap-pears. Click Finish to finalize this installation of Eclipse LB.
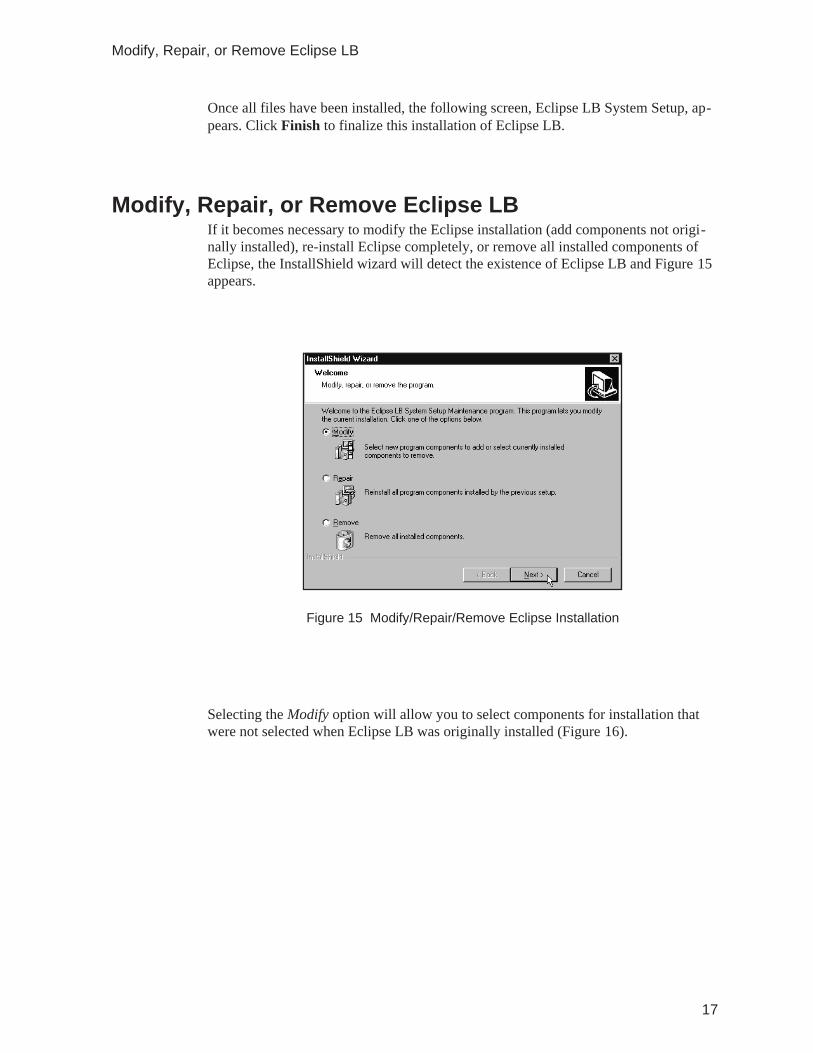
Modify, Repair, or Remove Eclipse LBIf it becomes necessary to modify the Eclipse installation (add components not origi-nally installed), re-install Eclipse completely, or remove all installed components ofEclipse, the InstallShield wizard will detect the existence of Eclipse LB and Figure 15appears.
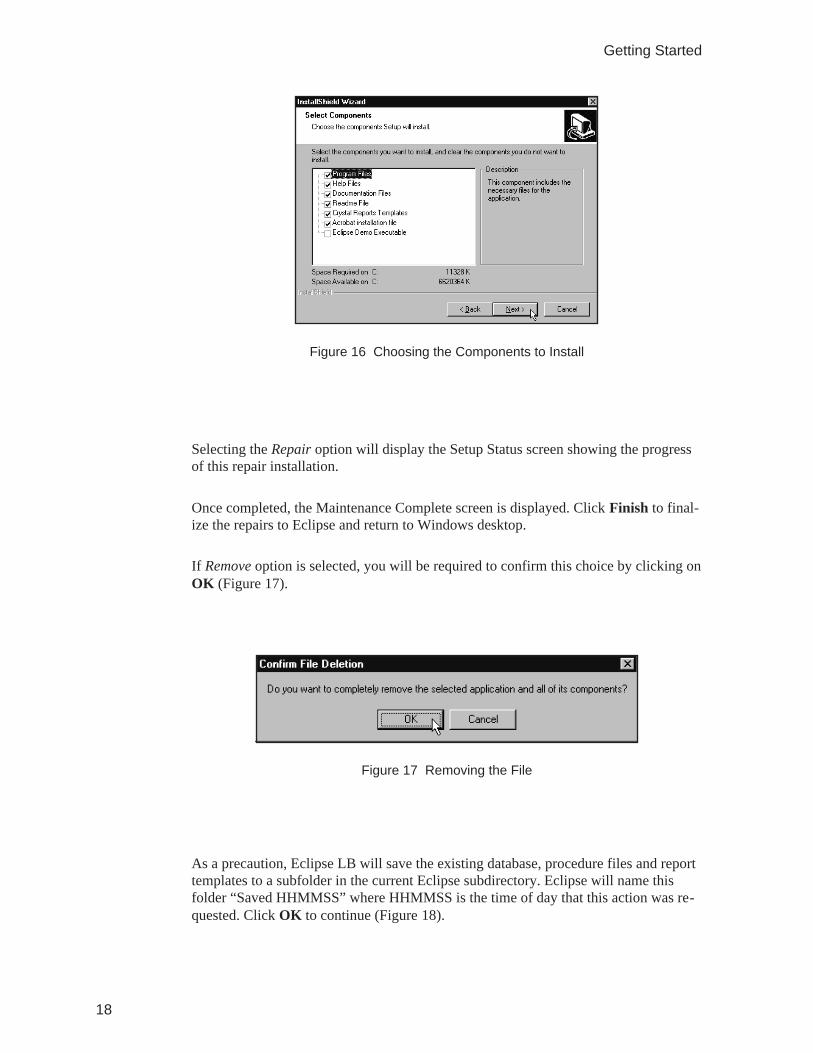
Selecting the Modify option will allow you to select components for installation thatwere not selected when Eclipse LB was originally installed (Figure 16).
17
Modify, Repair, or Remove Eclipse LB
Figure 15 Modify/Repair/Remove Eclipse Installation
Selecting the Repair option will display the Setup Status screen showing the progressof this repair installation.
Once completed, the Maintenance Complete screen is displayed. Click Finish to final-ize the repairs to Eclipse and return to Windows desktop.
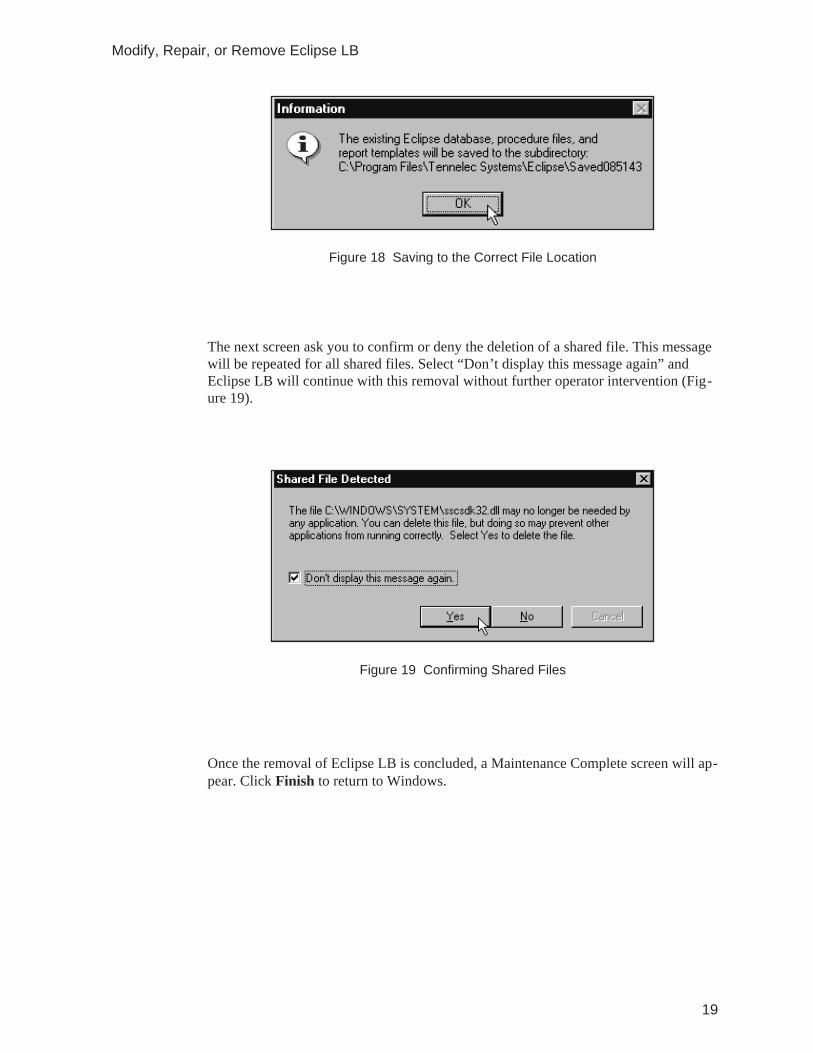
If Remove option is selected, you will be required to confirm this choice by clicking onOK (Figure 17).
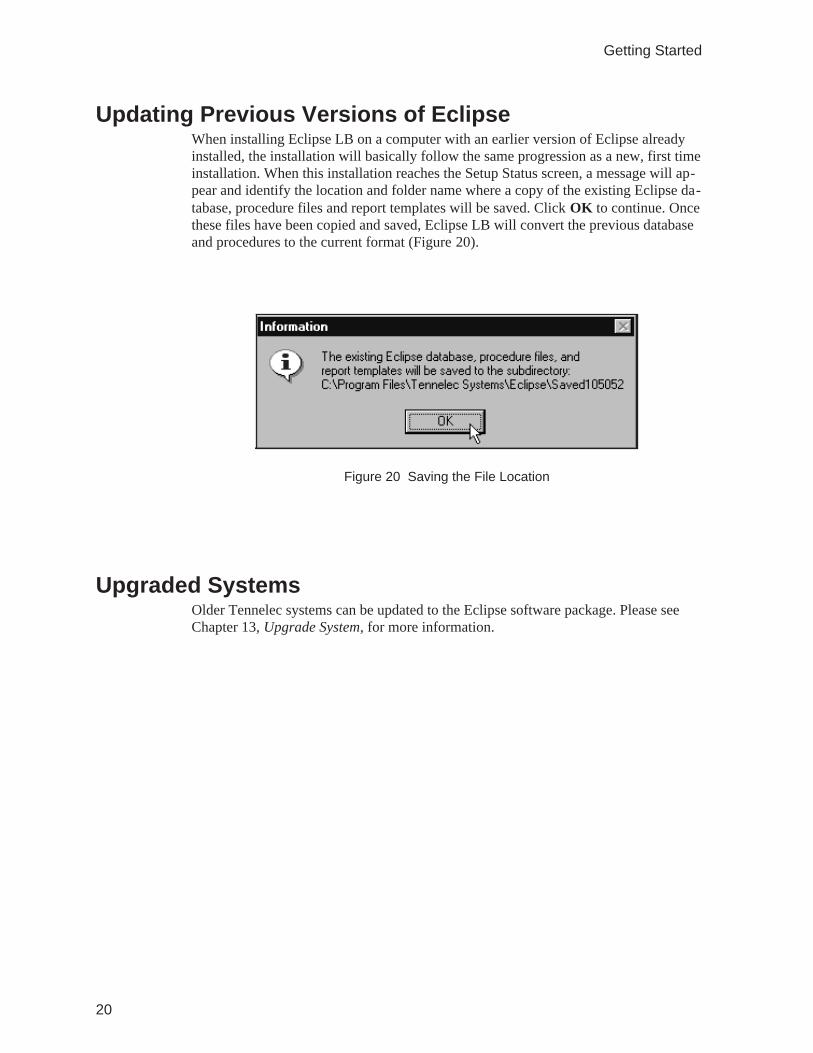
As a precaution, Eclipse LB will save the existing database, procedure files and reporttemplates to a subfolder in the current Eclipse subdirectory. Eclipse will name thisfolder “Saved HHMMSS” where HHMMSS is the time of day that this action was re-quested. Click OK to continue (Figure 18).
18
Getting Started
Figure 16 Choosing the Components to Install
Figure 17 Removing the File
The next screen ask you to confirm or deny the deletion of a shared file. This messagewill be repeated for all shared files. Select “Don’t display this message again” andEclipse LB will continue with this removal without further operator intervention (Fig-ure 19).
Once the removal of Eclipse LB is concluded, a Maintenance Complete screen will ap-pear. Click Finish to return to Windows.
19
Modify, Repair, or Remove Eclipse LB
Figure 18 Saving to the Correct File Location
Figure 19 Confirming Shared Files
Updating Previous Versions of EclipseWhen installing Eclipse LB on a computer with an earlier version of Eclipse alreadyinstalled, the installation will basically follow the same progression as a new, first timeinstallation. When this installation reaches the Setup Status screen, a message will ap-pear and identify the location and folder name where a copy of the existing Eclipse da-tabase, procedure files and report templates will be saved. Click OK to continue. Oncethese files have been copied and saved, Eclipse LB will convert the previous databaseand procedures to the current format (Figure 20).
Upgraded SystemsOlder Tennelec systems can be updated to the Eclipse software package. Please seeChapter 13, Upgrade System, for more information.
20
Getting Started
Figure 20 Saving the File Location
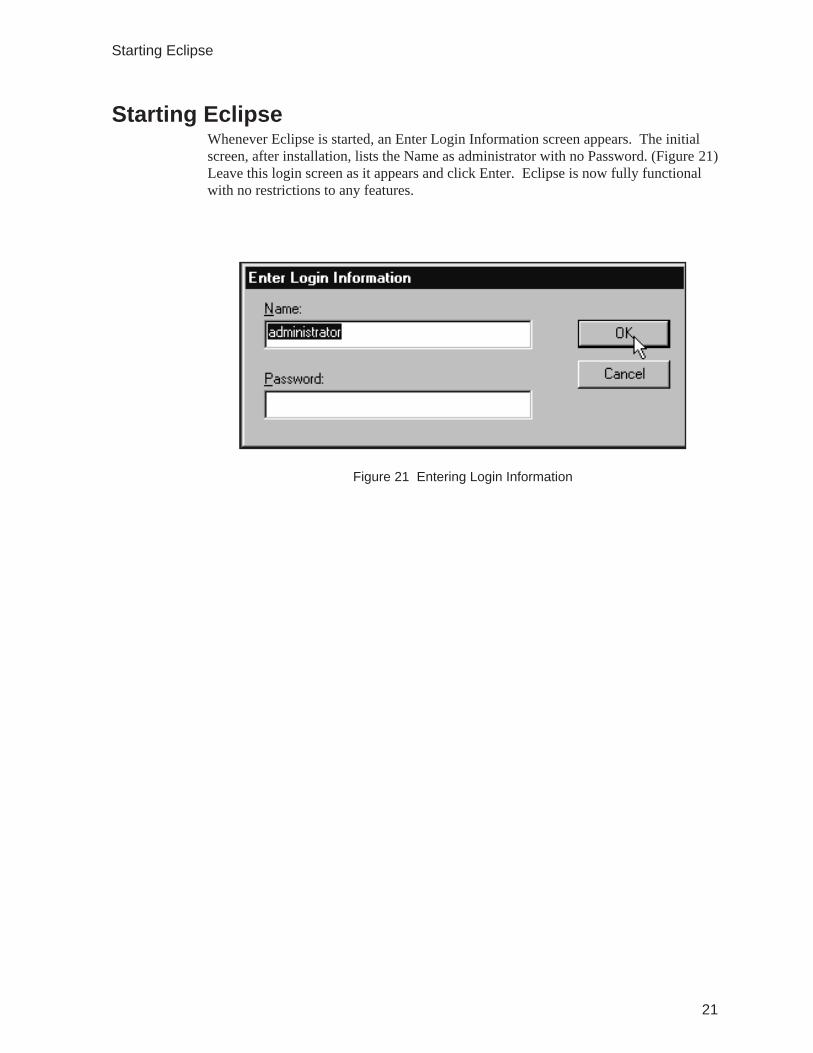
Starting EclipseWhenever Eclipse is started, an Enter Login Information screen appears. The initialscreen, after installation, lists the Name as administrator with no Password. (Figure 21)Leave this login screen as it appears and click Enter. Eclipse is now fully functionalwith no restrictions to any features.
21
Starting Eclipse
Figure 21 Entering Login Information
3. Software Environment
Eclipse LB is a powerful, flexible, and easy to use software interface for Tennelec Au-tomatic Low Background Alpha/Beta Counting Systems. Eclipse is designed to oper-ate Series 5 and LB5500 systems, as well as the earlier series of LB5100 and LB5500systems previously upgraded to operate under Windows. The software is designed toaddress most counting applications including: health physics, nuclear power, environ-mental re-mediation, and radiochemistry.
Eclipse LB is designed to run under Windows NT/2000/XP. A working knowledge ofproportional counting systems, Microsoft Windows and Microsoft Access will providea good foundation for understanding Eclipse LB software. Tutorials included withMicrosoft Windows and Microsoft Access are good starting places for this informa-tion. Users requiring custom reports for the output of results should also be familiarwith Crystal Reports V7.0 or higher.
Users are encouraged to refresh their knowledge of nuclear decay processes, nuclearinstrumentation, and counting statistics. Understanding these concepts will expeditefamiliarization with Eclipse LB. Good sources of information can be found in varioustextbooks. References for several are provided at the end of this manual.
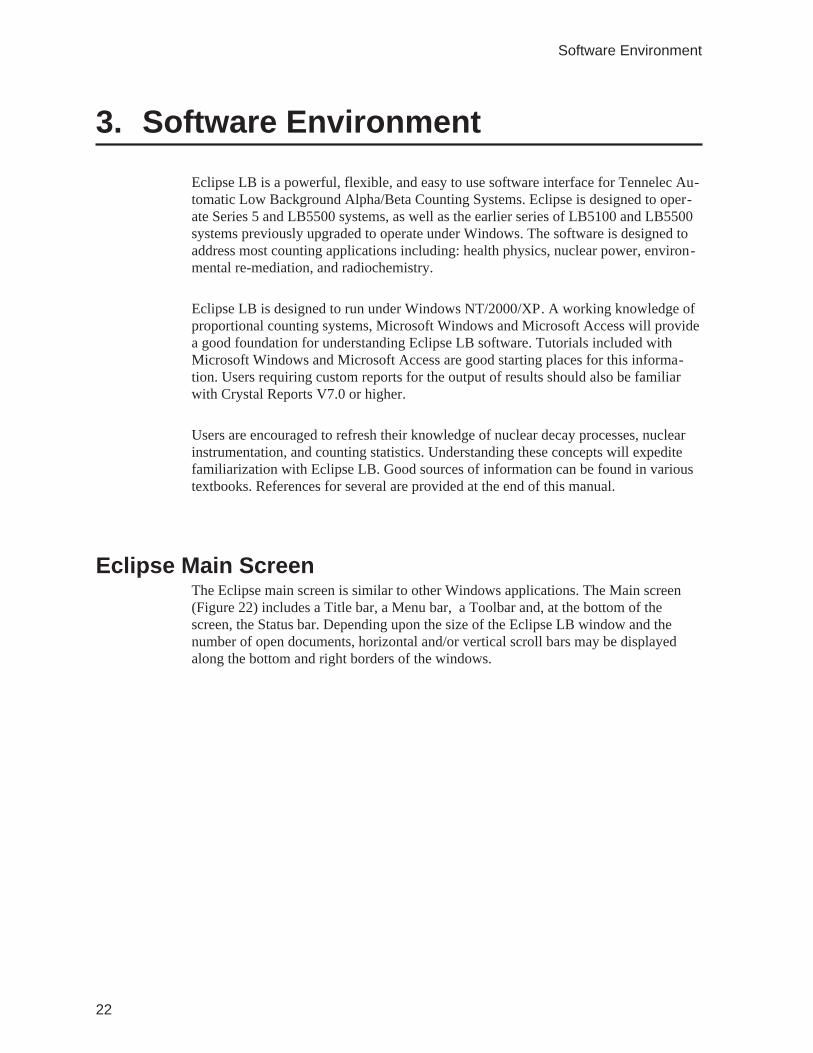
Eclipse Main ScreenThe Eclipse main screen is similar to other Windows applications. The Main screen(Figure 22) includes a Title bar, a Menu bar, a Toolbar and, at the bottom of thescreen, the Status bar. Depending upon the size of the Eclipse LB window and thenumber of open documents, horizontal and/or vertical scroll bars may be displayedalong the bottom and right borders of the windows.
22
Software Environment
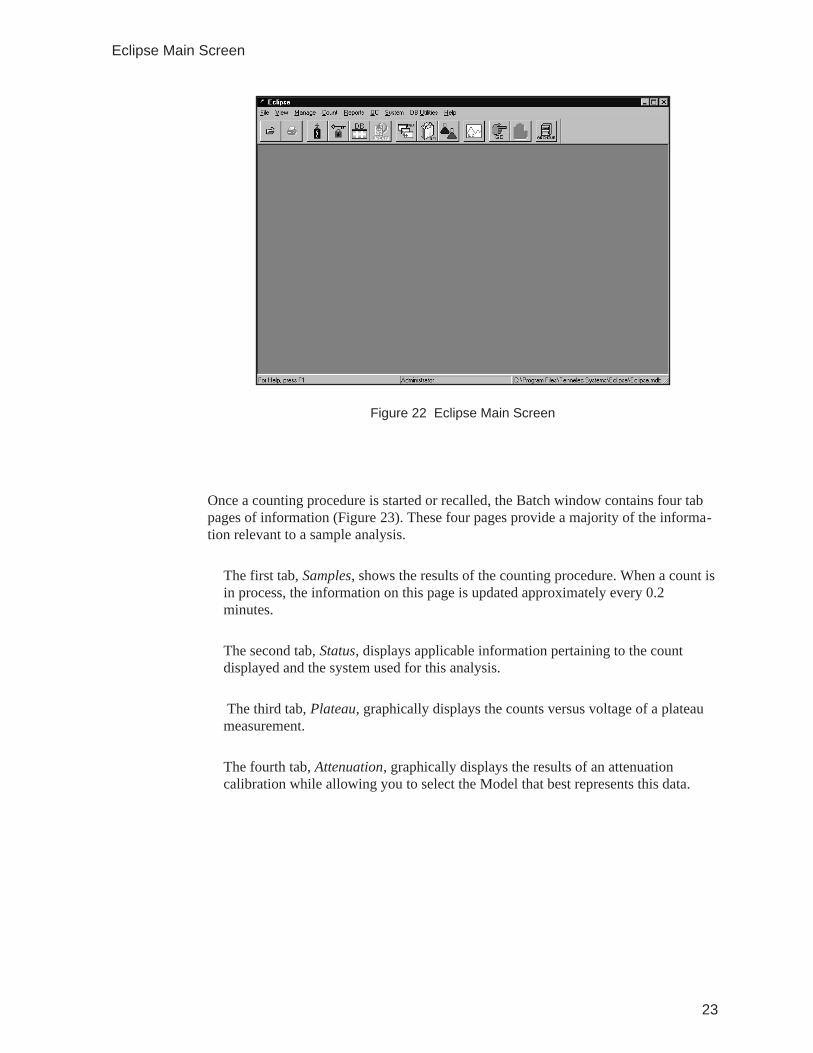
Once a counting procedure is started or recalled, the Batch window contains four tabpages of information (Figure 23). These four pages provide a majority of the informa-tion relevant to a sample analysis.
The first tab, Samples, shows the results of the counting procedure. When a count isin process, the information on this page is updated approximately every 0.2minutes.
The second tab, Status, displays applicable information pertaining to the countdisplayed and the system used for this analysis.
The third tab, Plateau, graphically displays the counts versus voltage of a plateaumeasurement.
The fourth tab, Attenuation, graphically displays the results of an attenuationcalibration while allowing you to select the Model that best represents this data.
23
Eclipse Main Screen
Figure 22 Eclipse Main Screen
Sample data is stored in a Microsoft Access database. Eclipse LB allows you to recallany analysis, examine the acquired data, and print the results in a Crystal Reports for-mat.
Eclipse Batch WindowFrom the Eclipse LB Batch Window you can be modify the Sample Display screen’ssize, column widths and the foreground and background colors.
To access this configuration menu, right click on the title bar of a Batch window thathas been recalled or is counting. If the title bar is not displayed, the window has beenmaximized. To minimize the window and access the toolbar, click on the Minimizebutton located in the upper right hand corner of the screen.
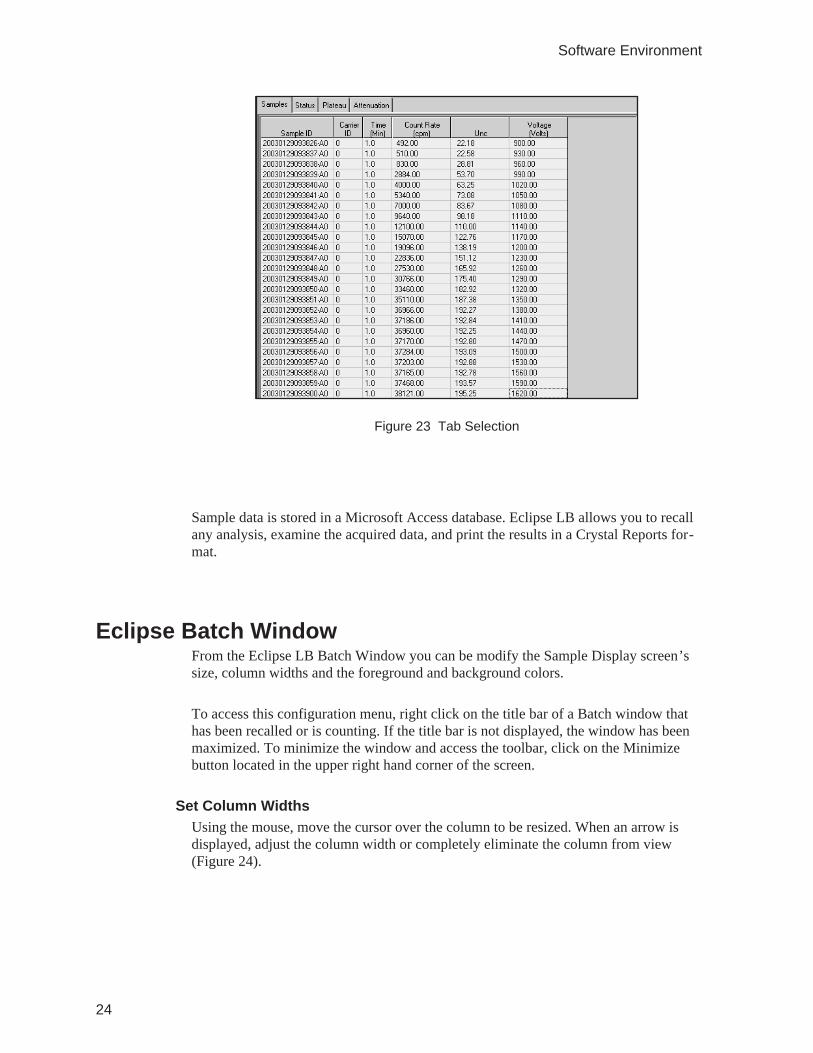
Set Column WidthsUsing the mouse, move the cursor over the column to be resized. When an arrow isdisplayed, adjust the column width or completely eliminate the column from view(Figure 24).
24
Software Environment
Figure 23 Tab Selection
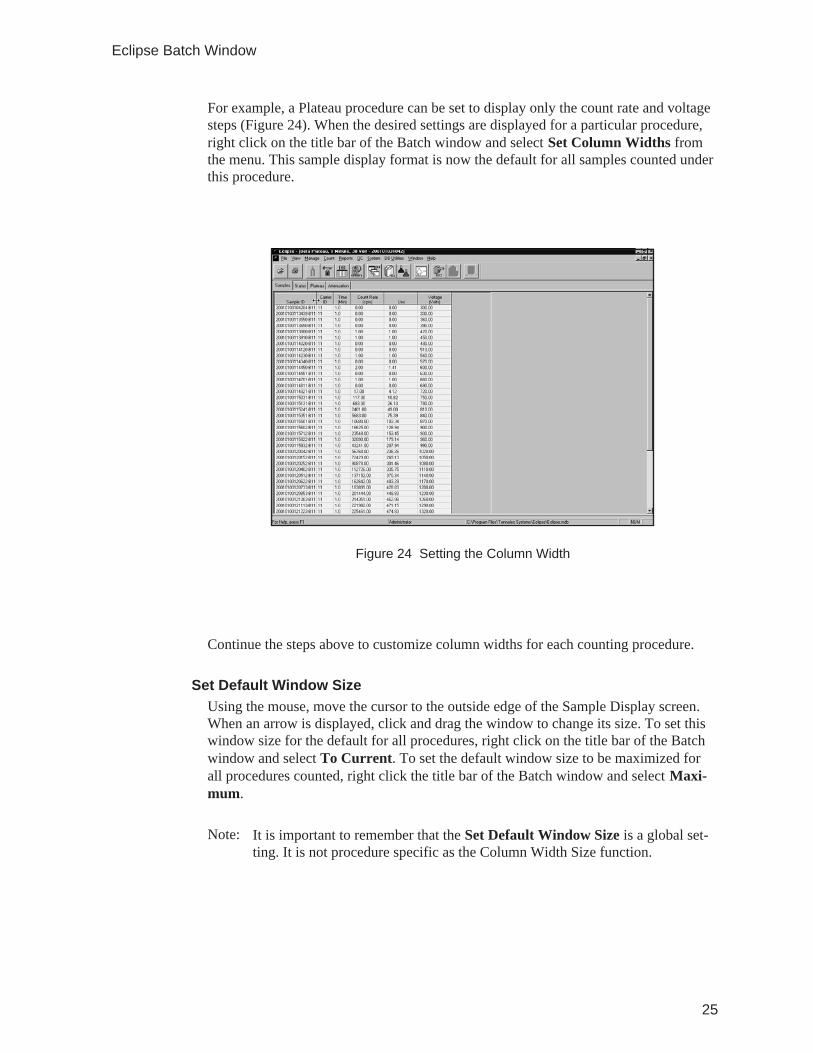
For example, a Plateau procedure can be set to display only the count rate and voltagesteps (Figure 24). When the desired settings are displayed for a particular procedure,right click on the title bar of the Batch window and select Set Column Widths fromthe menu. This sample display format is now the default for all samples counted underthis procedure.
Continue the steps above to customize column widths for each counting procedure.
Set Default Window SizeUsing the mouse, move the cursor to the outside edge of the Sample Display screen.When an arrow is displayed, click and drag the window to change its size. To set thiswindow size for the default for all procedures, right click on the title bar of the Batchwindow and select To Current. To set the default window size to be maximized forall procedures counted, right click the title bar of the Batch window and select Maxi-mum.
Note: It is important to remember that the Set Default Window Size is a global set-ting. It is not procedure specific as the Column Width Size function.
25
Eclipse Batch Window
Figure 24 Setting the Column Width
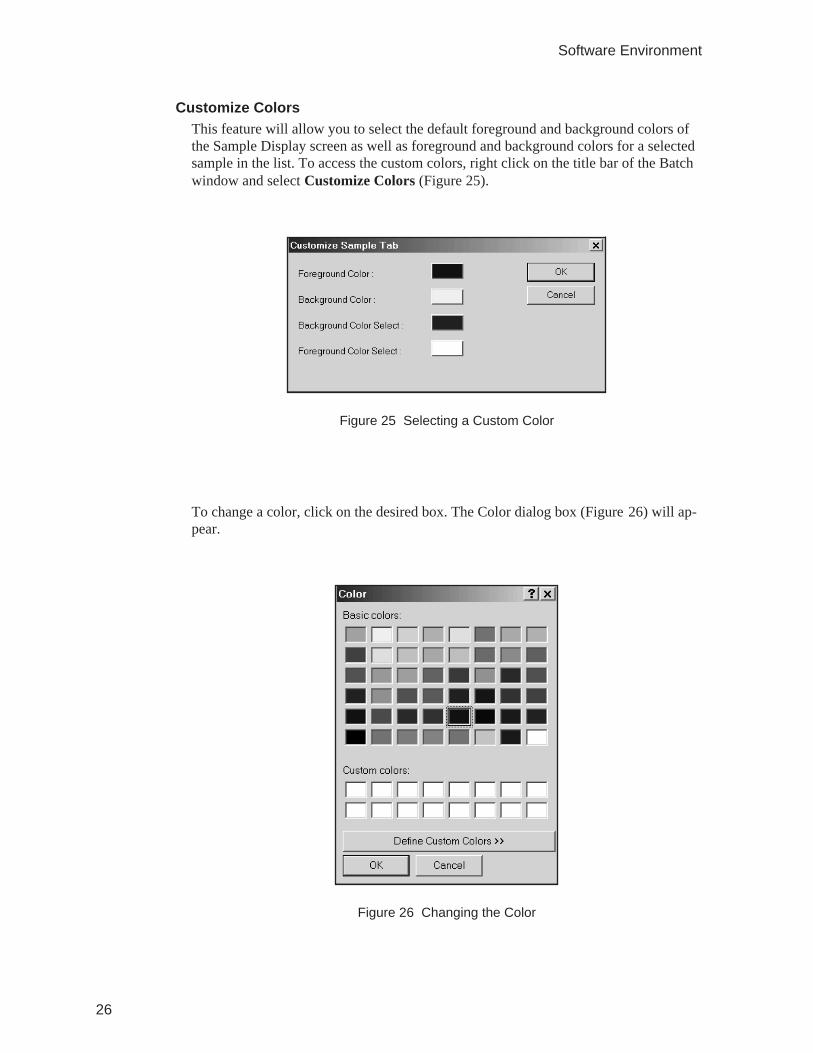
Customize ColorsThis feature will allow you to select the default foreground and background colors ofthe Sample Display screen as well as foreground and background colors for a selectedsample in the list. To access the custom colors, right click on the title bar of the Batchwindow and select Customize Colors (Figure 25).
To change a color, click on the desired box. The Color dialog box (Figure 26) will ap-pear.
26
Software Environment
Figure 25 Selecting a Custom Color
Figure 26 Changing the Color

Select the color of your choice and click OK. The selected color will now be the de-fault for all counting procedures. Continue the above steps to modify colors for the re-maining parameters.
Note: It is important to remember that the Customize Colors feature is a global set-ting. It is not procedure specific as the Column Width Size function.
The Title BarThe Title Bar contains Minimize, Maximize, and Close buttons at the upper right cor-ner of the screen depending on whether or not the Batch window is minimized or max-imized. An Eclipse Icon is displayed at the upper left corner of the screen. Clicking onit will display a program menu with options to change the size and to exit the program.If a batch is being counted, the name of the Count Procedure is displayed. If a previ-ously counted batch is being displayed, the name of the Count Procedure followed bythe date and time of the analysis is displayed.
The Menu BarThe Menu Bar provides for both mouse and keyboard operation. For keyboard opera-tion, menu commands can be accessed by pressing the ALT key and the underlined let-ter of the menu command. Each menu contains related functions that can behighlighted by using the up and down arrow keys or by pressing the underlined letterof the menu function.
Using a mouse, position the pointer on the menu command and then click the leftmouse button. The options of that menu command will be displayed.
FileThere are several unavailable commands on the File menu. They will appear grayedout.
27
The Title Bar
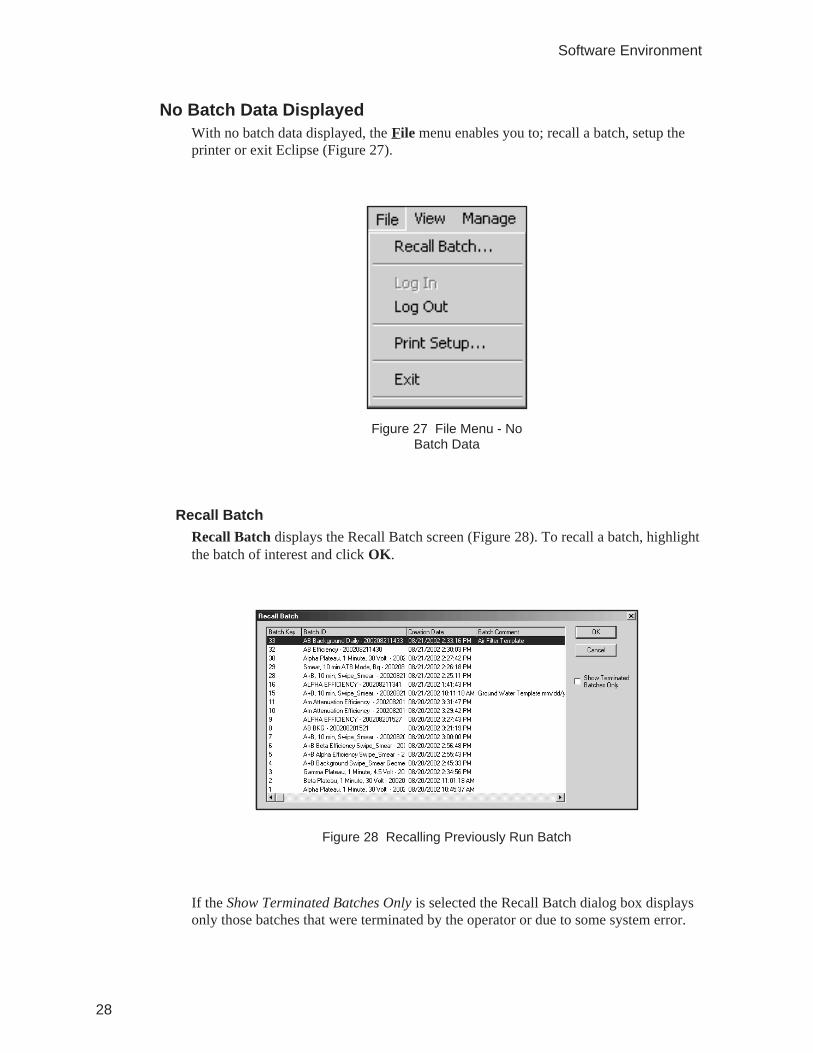
No Batch Data DisplayedWith no batch data displayed, the File menu enables you to; recall a batch, setup theprinter or exit Eclipse (Figure 27).
Recall BatchRecall Batch displays the Recall Batch screen (Figure 28). To recall a batch, highlightthe batch of interest and click OK.
If the Show Terminated Batches Only is selected the Recall Batch dialog box displaysonly those batches that were terminated by the operator or due to some system error.
28
Software Environment
Figure 27 File Menu - NoBatch Data
Figure 28 Recalling Previously Run Batch
Log InThis item is only avaiable when there is no user logged in to the system. Selecting itwill allow a user to login.
Log OutThis item only available when a user is logged into the system. Selecting it will log thecurrent user out of the system, disable system operation and remove all security accessrights.
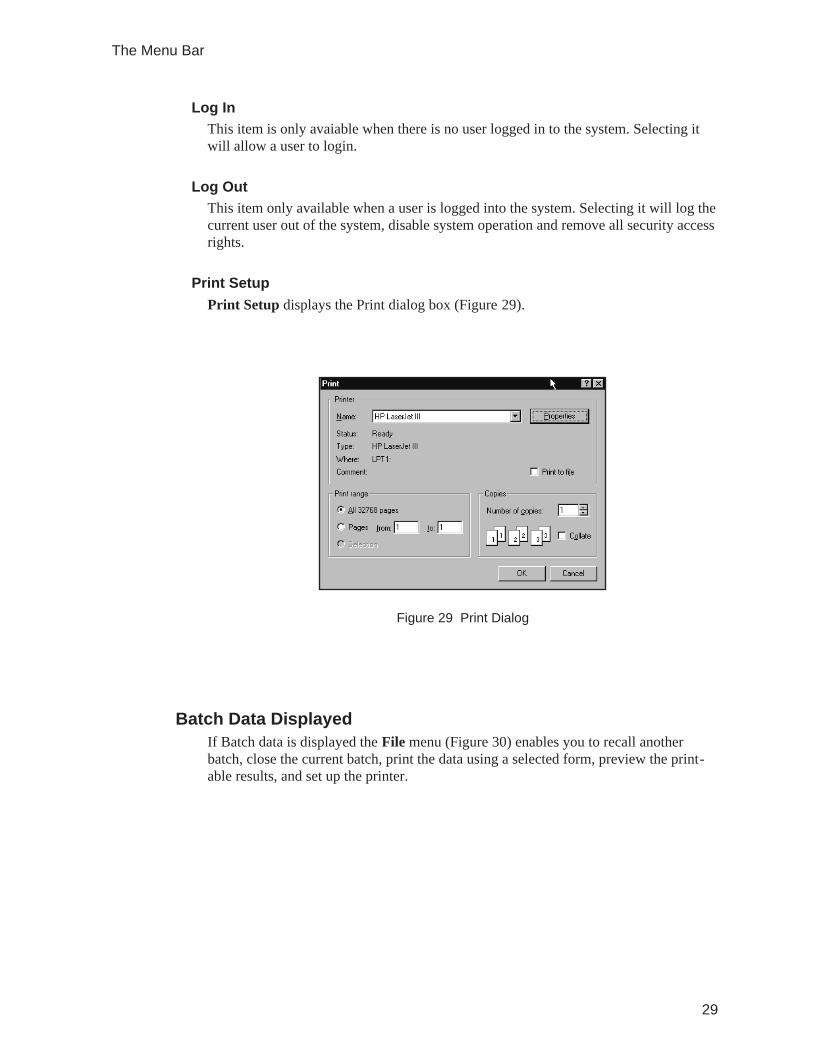
Print SetupPrint Setup displays the Print dialog box (Figure 29).
Batch Data DisplayedIf Batch data is displayed the File menu (Figure 30) enables you to recall anotherbatch, close the current batch, print the data using a selected form, preview the print-able results, and set up the printer.
29
The Menu Bar
Figure 29 Print Dialog
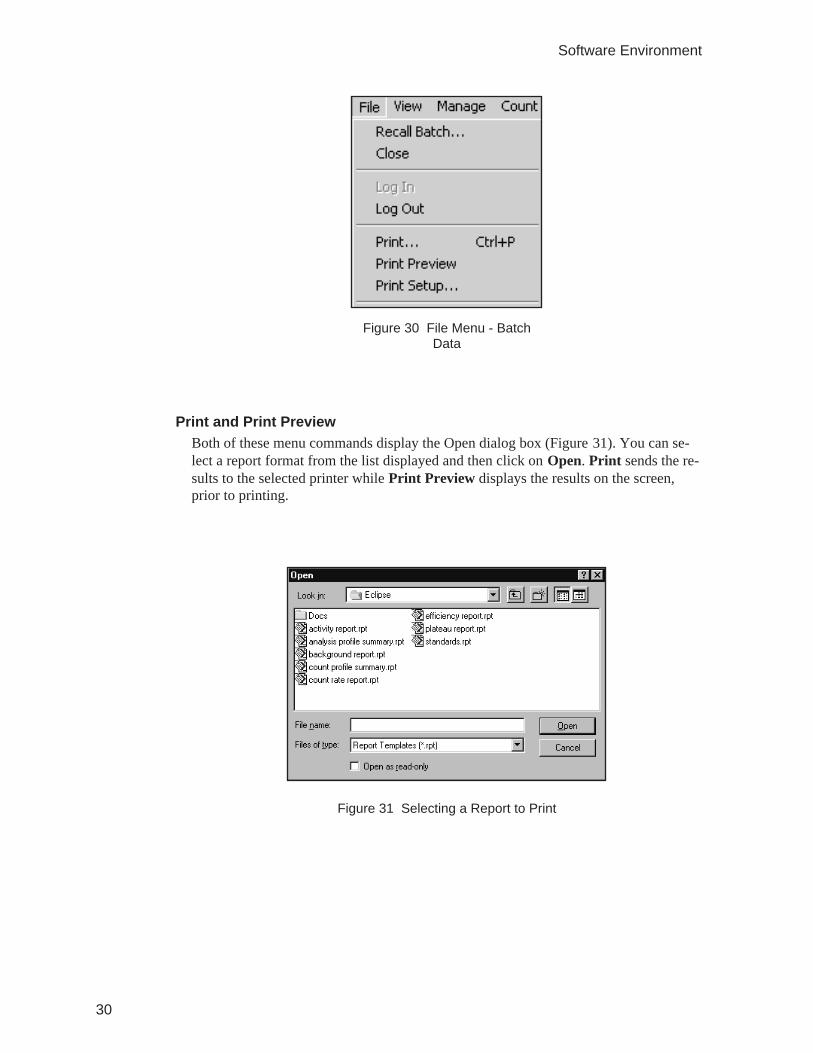
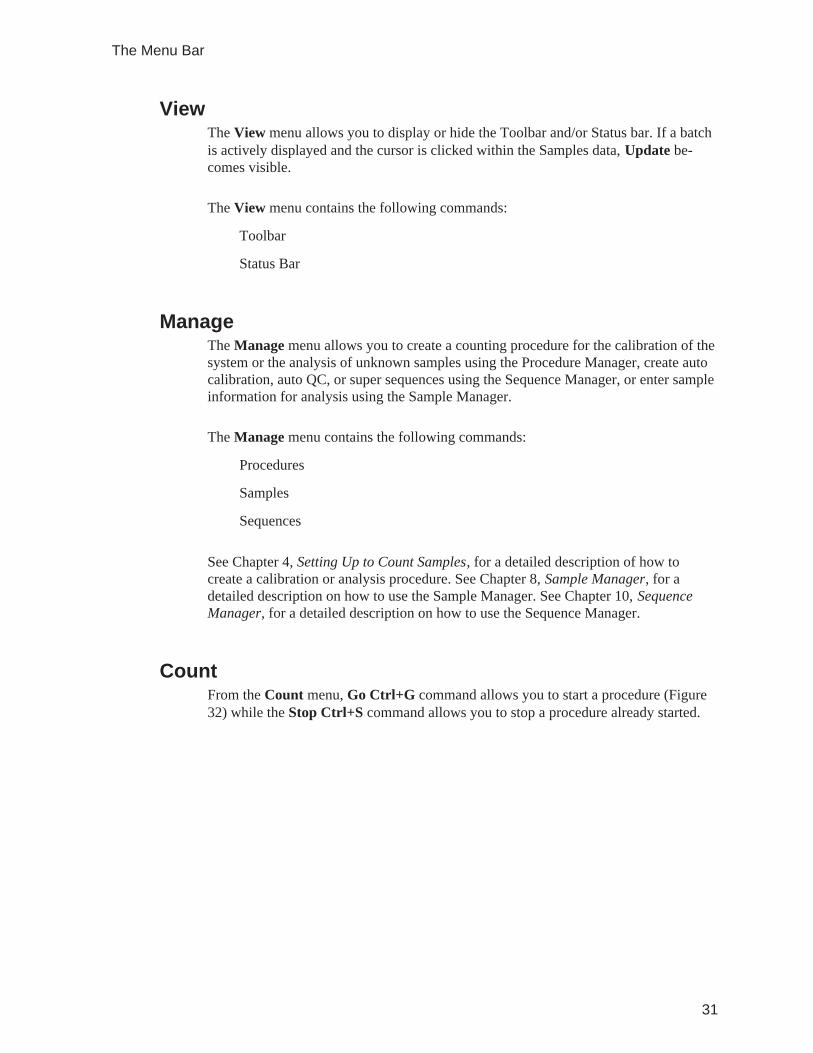
Print and Print PreviewBoth of these menu commands display the Open dialog box (Figure 31). You can se-lect a report format from the list displayed and then click on Open. Print sends the re-sults to the selected printer while Print Preview displays the results on the screen,prior to printing.
30
Software Environment
Figure 30 File Menu - BatchData
Figure 31 Selecting a Report to Print
ViewThe View menu allows you to display or hide the Toolbar and/or Status bar. If a batchis actively displayed and the cursor is clicked within the Samples data, Update be-comes visible.
The View menu contains the following commands:
Toolbar
Status Bar
ManageThe Manage menu allows you to create a counting procedure for the calibration of thesystem or the analysis of unknown samples using the Procedure Manager, create autocalibration, auto QC, or super sequences using the Sequence Manager, or enter sampleinformation for analysis using the Sample Manager.
The Manage menu contains the following commands:
Procedures
Samples
Sequences
See Chapter 4, Setting Up to Count Samples, for a detailed description of how tocreate a calibration or analysis procedure. See Chapter 8, Sample Manager, for adetailed description on how to use the Sample Manager. See Chapter 10, SequenceManager, for a detailed description on how to use the Sequence Manager.
CountFrom the Count menu, Go Ctrl+G command allows you to start a procedure (Figure32) while the Stop Ctrl+S command allows you to stop a procedure already started.
31
The Menu Bar
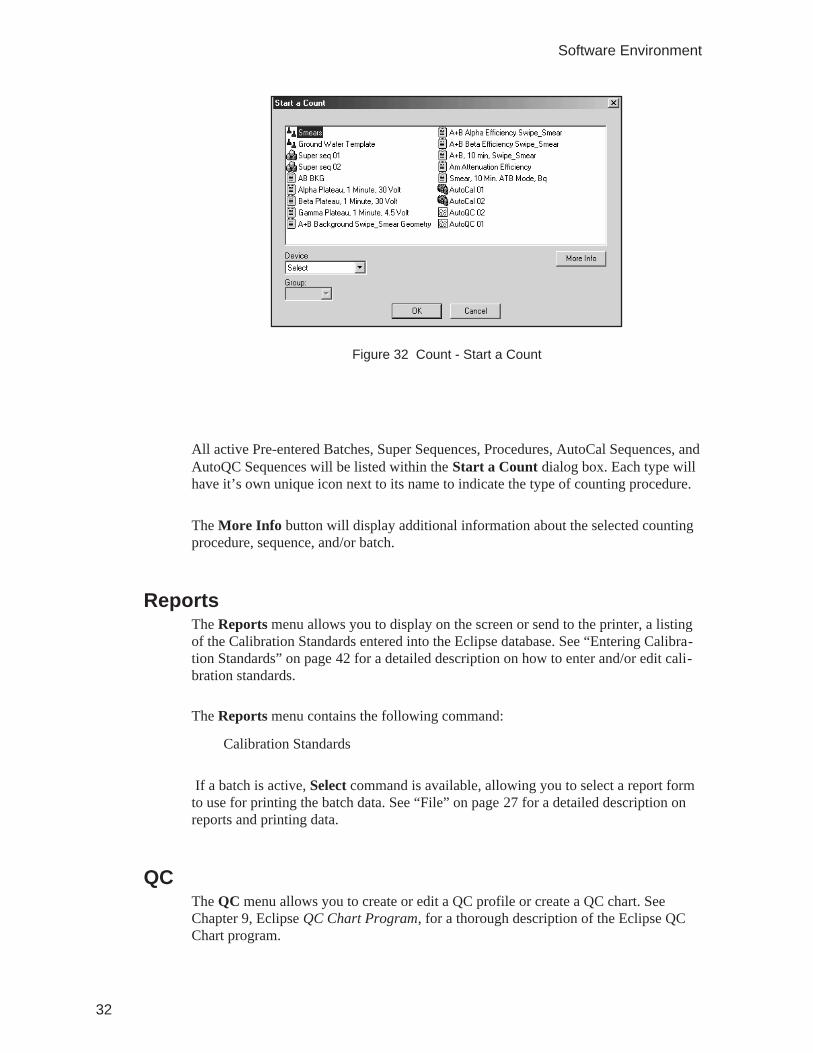
All active Pre-entered Batches, Super Sequences, Procedures, AutoCal Sequences, andAutoQC Sequences will be listed within the Start a Count dialog box. Each type willhave it’s own unique icon next to its name to indicate the type of counting procedure.
The More Info button will display additional information about the selected countingprocedure, sequence, and/or batch.
ReportsThe Reports menu allows you to display on the screen or send to the printer, a listingof the Calibration Standards entered into the Eclipse database. See “Entering Calibra-tion Standards” on page 42 for a detailed description on how to enter and/or edit cali-bration standards.
The Reports menu contains the following command:
Calibration Standards
If a batch is active, Select command is available, allowing you to select a report formto use for printing the batch data. See “File” on page 27 for a detailed description onreports and printing data.
QCThe QC menu allows you to create or edit a QC profile or create a QC chart. SeeChapter 9, Eclipse QC Chart Program, for a thorough description of the Eclipse QCChart program.
32
Software Environment
Figure 32 Count - Start a Count
The QC menu contains the following command:
Create/Edit Profiles
Create Charts
SystemThe System menu, if no batch is actively counting or displayed, will allow you tosetup different items, depending on the configuration of the system(s). If Eclipse iscontrolling a Series 5 XLB or a Series 5 HP equipped with GasStat, then the AmplifierSetup and Gas Con. Setup functions will be available. If the Series 5 HP is equippedonly with Gas Mode, then the Amplifier Setup and Gas Flow Setup items are avail-able. For pre-Series 5 systems neither the Amplifier Setup nor Gas Con. Setup nor GasFlow Setup functions are available. Since it is possible to operate multiple types ofsystems at the same time, all three of these items can be available concurrently. Hard-ware Status is available, regardless of the batch status, but only for Series 5 systems.
The System menu contains the following commands:
Alpha/Beta Amplifier Setup
Gamma Amplifier Setup
Gas Con. Setup
Gas Flow Setup
Hardware Status
Security
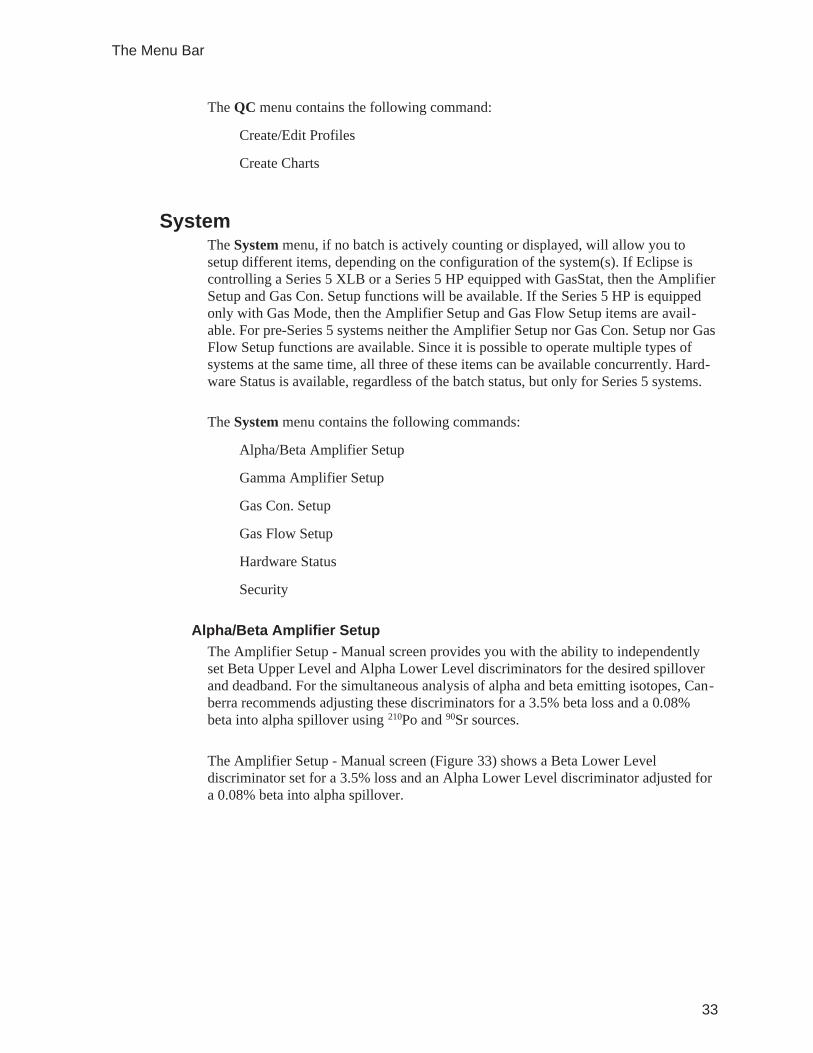
Alpha/Beta Amplifier SetupThe Amplifier Setup - Manual screen provides you with the ability to independentlyset Beta Upper Level and Alpha Lower Level discriminators for the desired spilloverand deadband. For the simultaneous analysis of alpha and beta emitting isotopes, Can-berra recommends adjusting these discriminators for a 3.5% beta loss and a 0.08%beta into alpha spillover using 210Po and 90Sr sources.
The Amplifier Setup - Manual screen (Figure 33) shows a Beta Lower Leveldiscriminator set for a 3.5% loss and an Alpha Lower Level discriminator adjusted fora 0.08% beta into alpha spillover.
33
The Menu Bar
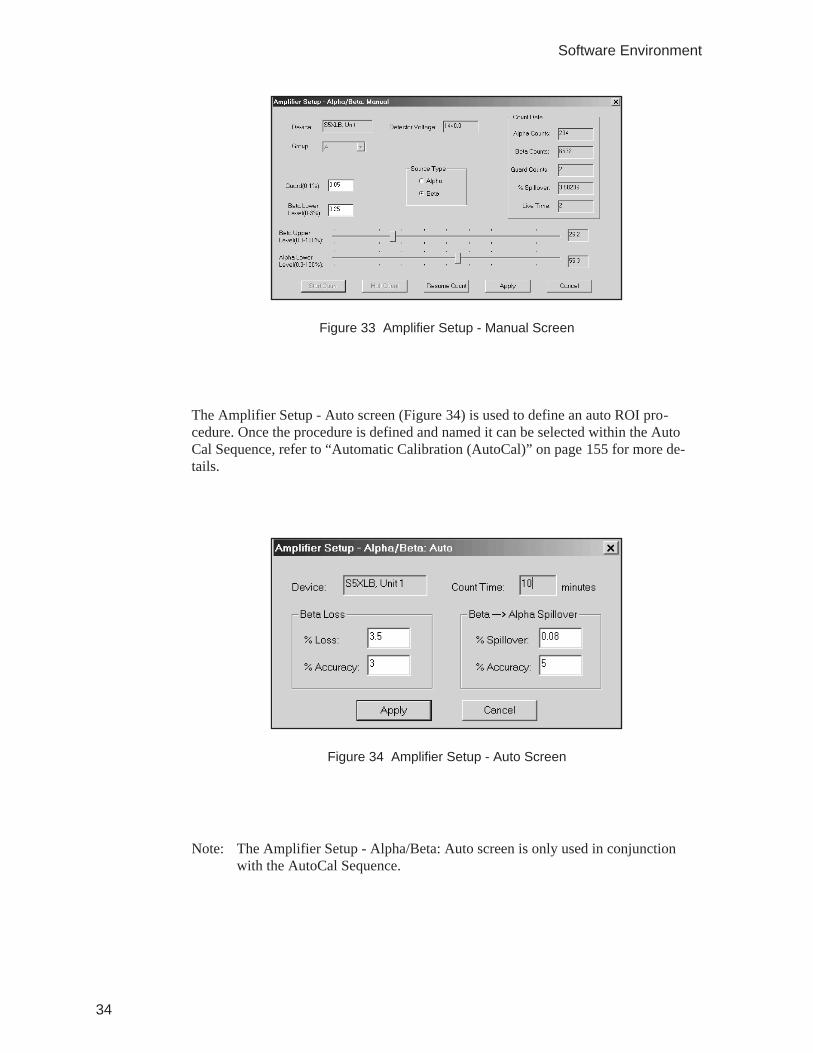
The Amplifier Setup - Auto screen (Figure 34) is used to define an auto ROI pro-cedure. Once the procedure is defined and named it can be selected within the AutoCal Sequence, refer to “Automatic Calibration (AutoCal)” on page 155 for more de-tails.
Note: The Amplifier Setup - Alpha/Beta: Auto screen is only used in conjunctionwith the AutoCal Sequence.
34
Software Environment
Figure 33 Amplifier Setup - Manual Screen
Figure 34 Amplifier Setup - Auto Screen
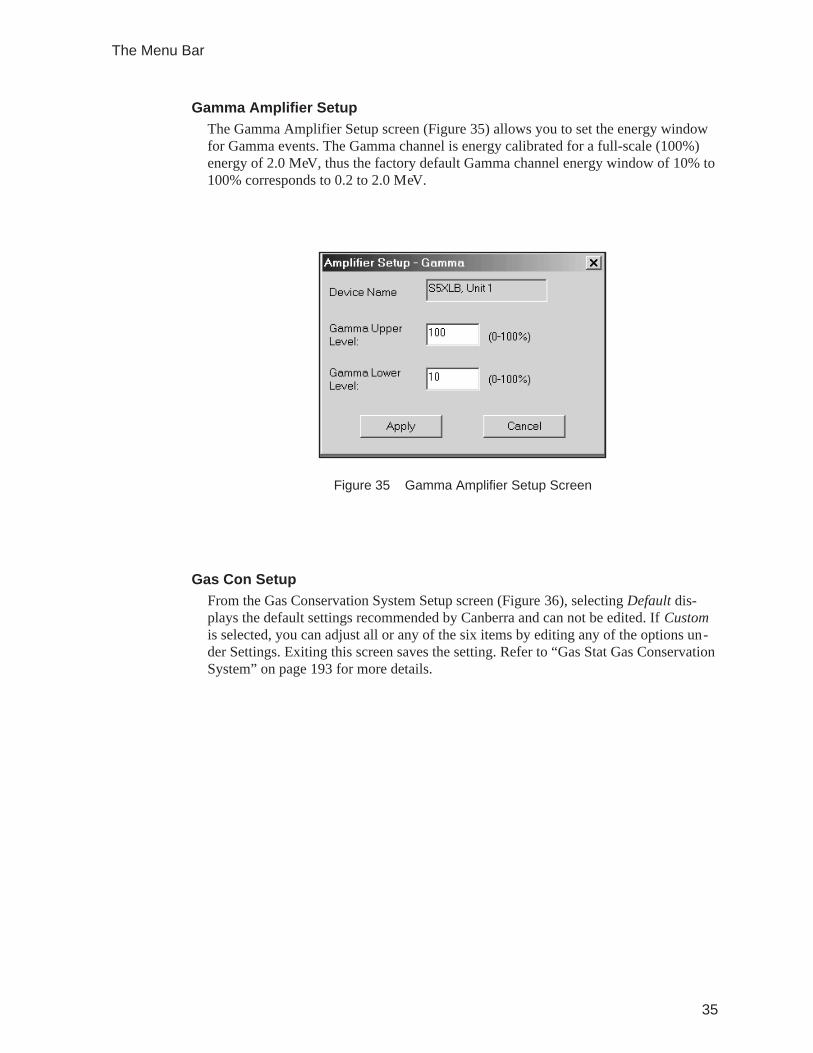
Gamma Amplifier SetupThe Gamma Amplifier Setup screen (Figure 35) allows you to set the energy windowfor Gamma events. The Gamma channel is energy calibrated for a full-scale (100%)energy of 2.0 MeV, thus the factory default Gamma channel energy window of 10% to100% corresponds to 0.2 to 2.0 MeV.
Gas Con SetupFrom the Gas Conservation System Setup screen (Figure 36), selecting Default dis-plays the default settings recommended by Canberra and can not be edited. If Customis selected, you can adjust all or any of the six items by editing any of the options un-der Settings. Exiting this screen saves the setting. Refer to “Gas Stat Gas ConservationSystem” on page 193 for more details.
35
The Menu Bar
Figure 35 Gamma Amplifier Setup Screen
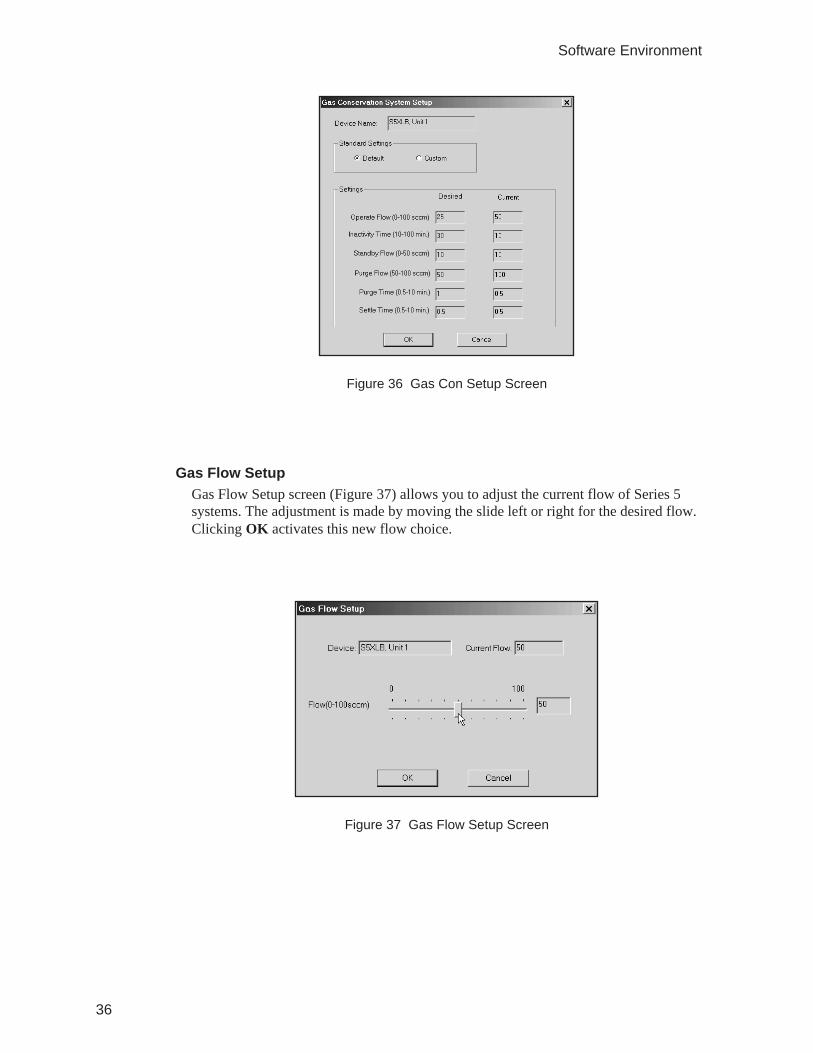
Gas Flow SetupGas Flow Setup screen (Figure 37) allows you to adjust the current flow of Series 5systems. The adjustment is made by moving the slide left or right for the desired flow.Clicking OK activates this new flow choice.
36
Software Environment
Figure 36 Gas Con Setup Screen
Figure 37 Gas Flow Setup Screen
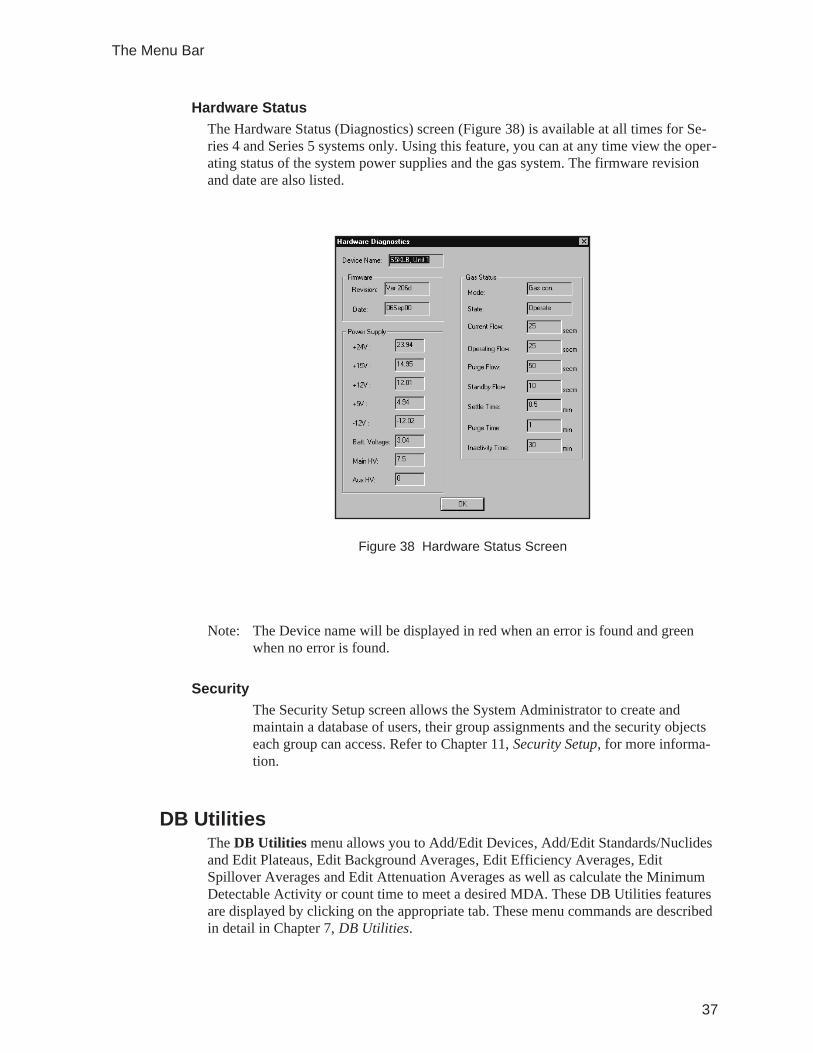
Hardware StatusThe Hardware Status (Diagnostics) screen (Figure 38) is available at all times for Se-ries 4 and Series 5 systems only. Using this feature, you can at any time view the oper-ating status of the system power supplies and the gas system. The firmware revisionand date are also listed.
Note: The Device name will be displayed in red when an error is found and greenwhen no error is found.
SecurityThe Security Setup screen allows the System Administrator to create andmaintain a database of users, their group assignments and the security objectseach group can access. Refer to Chapter 11, Security Setup, for more informa-tion.
DB UtilitiesThe DB Utilities menu allows you to Add/Edit Devices, Add/Edit Standards/Nuclidesand Edit Plateaus, Edit Background Averages, Edit Efficiency Averages, EditSpillover Averages and Edit Attenuation Averages as well as calculate the MinimumDetectable Activity or count time to meet a desired MDA. These DB Utilities featuresare displayed by clicking on the appropriate tab. These menu commands are describedin detail in Chapter 7, DB Utilities.
37
The Menu Bar
Figure 38 Hardware Status Screen
You can also Create an Archive of batch records, View an Archive of batch records,Delete batch records, or Restore the Active Database. The first three options are avail-able when no batch data is displayed. The last option is available only when viewingan archived database. Refer to Chapter 6, Archiving Batch Data, for more details.
WindowThe Window menu is only available when batches are displayed.
CascadeThe Cascade submenu allows you to display multiple batches in a Cascade format.
Tile HorizontallyThe Tile Horizontally submenu allows you to display multiple batches in a Tile Hori-zontally format.
HelpThe Help menu displays either Help Topics for a better understanding of Eclipse LBsoftware or About Eclipse which identifies the version of the software in use pluscopyright information.
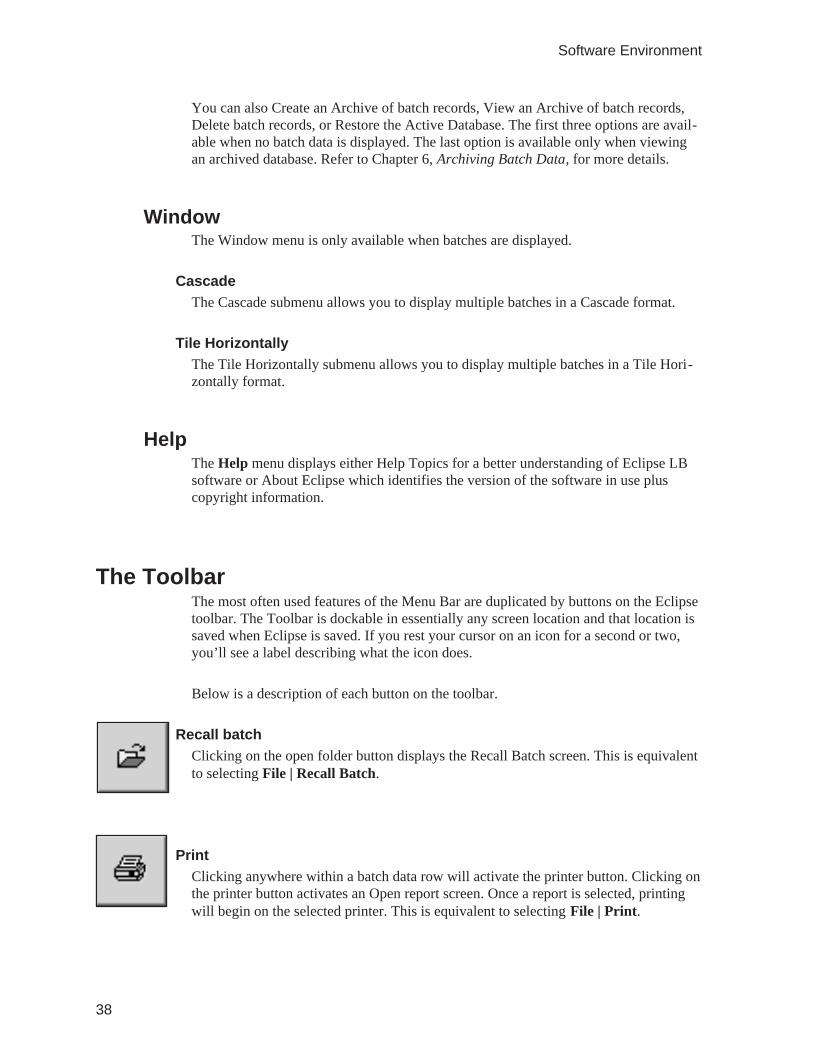
The ToolbarThe most often used features of the Menu Bar are duplicated by buttons on the Eclipsetoolbar. The Toolbar is dockable in essentially any screen location and that location issaved when Eclipse is saved. If you rest your cursor on an icon for a second or two,you’ll see a label describing what the icon does.
Below is a description of each button on the toolbar.
Recall batchClicking on the open folder button displays the Recall Batch screen. This is equivalentto selecting File | Recall Batch.
PrintClicking anywhere within a batch data row will activate the printer button. Clicking onthe printer button activates an Open report screen. Once a report is selected, printingwill begin on the selected printer. This is equivalent to selecting File | Print.
38
Software Environment
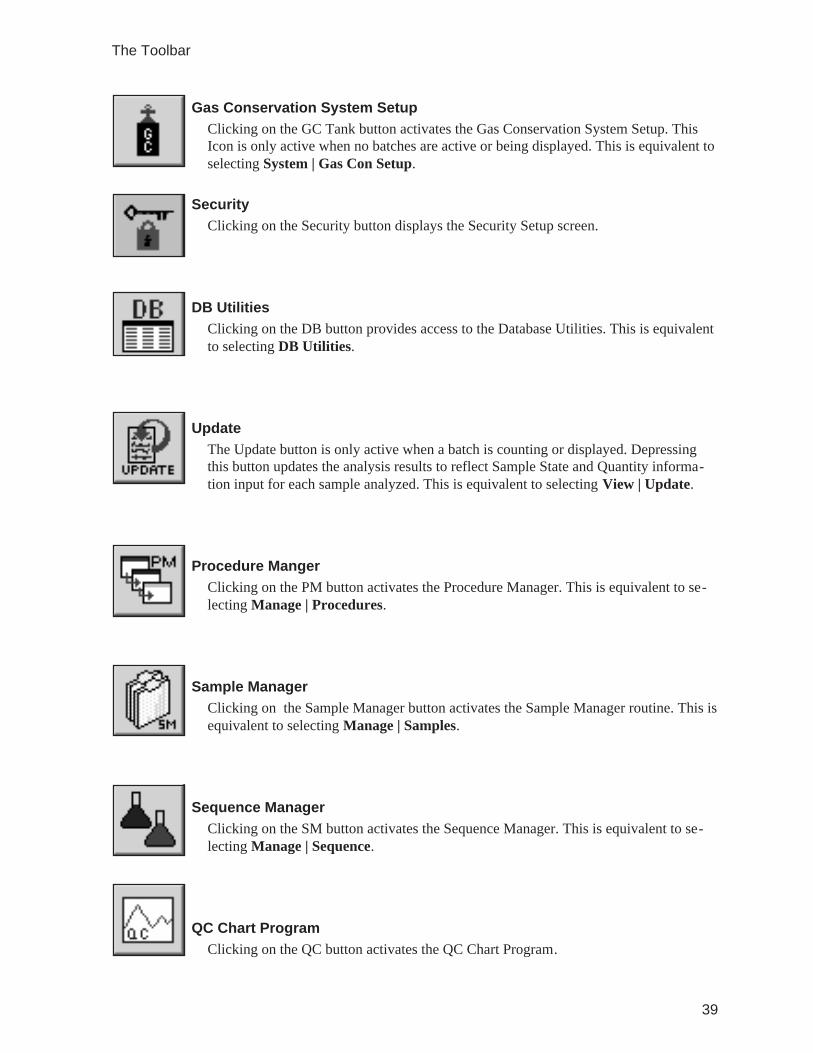
Gas Conservation System SetupClicking on the GC Tank button activates the Gas Conservation System Setup. ThisIcon is only active when no batches are active or being displayed. This is equivalent toselecting System | Gas Con Setup.
SecurityClicking on the Security button displays the Security Setup screen.
DB UtilitiesClicking on the DB button provides access to the Database Utilities. This is equivalentto selecting DB Utilities.
UpdateThe Update button is only active when a batch is counting or displayed. Depressingthis button updates the analysis results to reflect Sample State and Quantity informa-tion input for each sample analyzed. This is equivalent to selecting View | Update.
Procedure MangerClicking on the PM button activates the Procedure Manager. This is equivalent to se-lecting Manage | Procedures.
Sample ManagerClicking on the Sample Manager button activates the Sample Manager routine. This isequivalent to selecting Manage | Samples.
Sequence ManagerClicking on the SM button activates the Sequence Manager. This is equivalent to se-lecting Manage | Sequence.
QC Chart ProgramClicking on the QC button activates the QC Chart Program.
39
The Toolbar
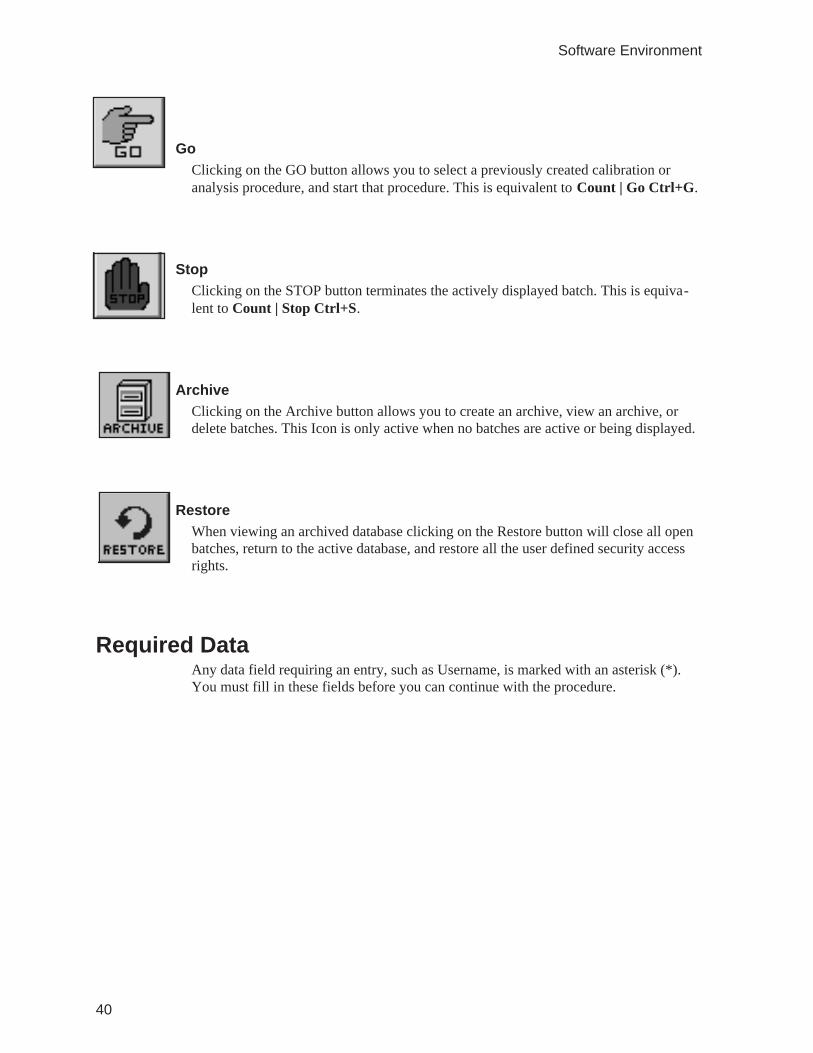
GoClicking on the GO button allows you to select a previously created calibration oranalysis procedure, and start that procedure. This is equivalent to Count | Go Ctrl+G.
StopClicking on the STOP button terminates the actively displayed batch. This is equiva-lent to Count | Stop Ctrl+S.
ArchiveClicking on the Archive button allows you to create an archive, view an archive, ordelete batches. This Icon is only active when no batches are active or being displayed.
RestoreWhen viewing an archived database clicking on the Restore button will close all openbatches, return to the active database, and restore all the user defined security accessrights.
Required DataAny data field requiring an entry, such as Username, is marked with an asterisk (*).You must fill in these fields before you can continue with the procedure.
40
Software Environment
4. Setting Up to Count Samples
This chapter is intended to guide the first time Eclipse LB software user through themanual calibration of their system. See Chapter 10, Sequence Manager, for details onthe automatic calibration of your system. This process makes several assumptions thatmay or may not be applicable to your specific counting needs, which can be modifiedto meet those needs. The following assumptions have been made:
1. 210Po (Polonium) will be used as an Alpha emitting calibration standard.
2. 90Sr/90Yr (Strontium/Yttrium) will be used as a Beta emitting calibrationstandard.
3. 137Cs will be used as a Gamma emitting calibration standard.
4. Swipes will be counted in a 5/16 in. deep insert.
5. Samples will be counted in the simultaneous, Alpha + Beta, counting mode.
6. Results will be efficiency corrected to report findings in Bequerels.
7. Results will be corrected for alpha into Beta and Beta into Alpha spillover.
8. Results will be corrected for system background contributions.
Setting Up the Sample ChangerBefore beginning the calibration of your Tennelec Automatic Low BackgroundCounting System, it will prove most convenient to first set-up your sample changer.With the system sample changer empty, place an End plate under the receive (left)stack reader, a blank carrier under the send (right) stack reader and another blank car-rier in the center, insertion, position.
Next, place the GROUP A carrier in the bottom position of the send (right) stack.Place the 210Po standard in a 5/16 in. deep insert and then place this insert in any num-bered carrier. Place this carrier on top of the GROUP A carrier.
Place the GROUP B carrier on top of the carrier containing the alpha standard. Placethe 90Sr source in a 5/16 in. deep insert and then place this insert in a numbered carrier.Place this carrier on top of the GROUP B carrier.
41
Setting Up the Sample Changer
Place the GROUP C carrier on top of the carrier containing the beta standard. Placethe 137Cs source in a 5/16 in. deep insert and then place this insert in a numbered car-rier. Place this carrier on top of the GROUP C carrier.
Place the GROUP D carrier on top of the carrier containing the gamma standard. Placea clean, uncontaminated, smear in a 5/16 in. deep insert in a carrier and then place thiscarrier on top of the GROUP D carrier.
Finally, place the END Carrier on top of the carrier containing the blank insert. Thesample changer is now set up for calibration.
Entering Calibration StandardsCalibrated (NIST Traceable or equivalent) standards are required for the accurate cali-bration of your Tennelec Automatic Low Background Alpha/Beta Counting Systems.Before these calibrations can be made, the sources that will be used must be enteredinto the Eclipse LB database. Access to the Eclipse screen used to input the informa-tion for standards is accomplished using either of these two methods.
From the DB Utilities menu, choose Add/Edit Standards/Nuclides or from thetoolbar select the DB Utilities button.
The Devices screen will appear. Select the Standards and Nuclides tab, click on NewStandard and fill in the information for your 210Po alpha standard (Figure 39).
42
Setting Up to Count Samples
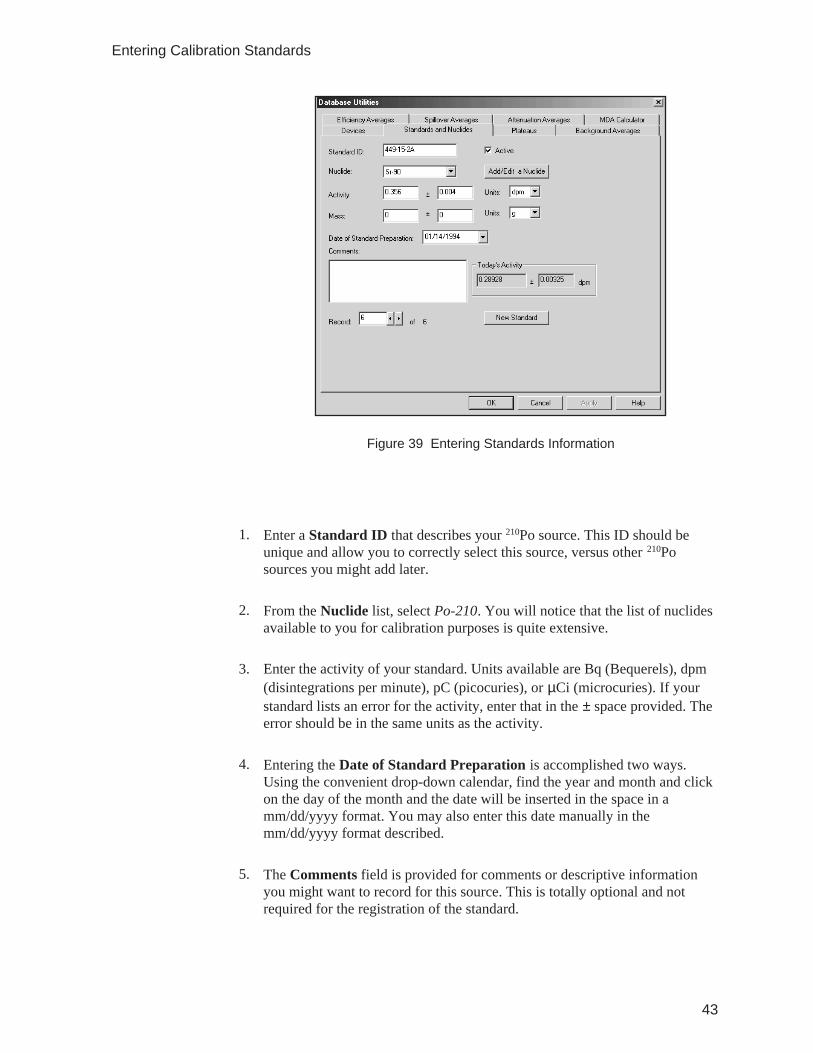
1. Enter a Standard ID that describes your 210Po source. This ID should beunique and allow you to correctly select this source, versus other 210Posources you might add later.
2. From the Nuclide list, select Po-210. You will notice that the list of nuclidesavailable to you for calibration purposes is quite extensive.
3. Enter the activity of your standard. Units available are Bq (Bequerels), dpm(disintegrations per minute), pC (picocuries), or µCi (microcuries). If yourstandard lists an error for the activity, enter that in the ± space provided. Theerror should be in the same units as the activity.
4. Entering the Date of Standard Preparation is accomplished two ways.Using the convenient drop-down calendar, find the year and month and clickon the day of the month and the date will be inserted in the space in amm/dd/yyyy format. You may also enter this date manually in themm/dd/yyyy format described.
5. The Comments field is provided for comments or descriptive informationyou might want to record for this source. This is totally optional and notrequired for the registration of the standard.
43
Entering Calibration Standards
Figure 39 Entering Standards Information
6. Once you have entered all of the information for your 210Po source, click onApply to enter it into the Eclipse LB database.
7. Current activity for the entered source is displayed as “Today’s Activity”.Today’s activity corresponds to the computer’s current date and time setting.
Follow this same procedure to enter your 90Sr/90Y beta and 137Cs gamma sources intothe Eclipse LB database.
Determining Operating VoltagesEclipse LB offers three modes of operation; Alpha and Beta Simultaneous, AlphaOnly, and Alpha then Beta. Each mode requires that an appropriate operating voltageor voltages, in the case of the Alpha then Beta mode, be determined. In order to deter-mine these voltages, alpha and beta plateaus must be generated. The alpha plateau willdetermine the operating voltage at which the proportional counter is sensitive only toalphas and the beta plateau will determine the operating voltage at which alphas andbeta are detected and separated based on pulse height. Both of these two operatingvoltages are required for the three modes of operation.
Creating a Plateau ProcedureAlpha, beta, and gamma plateau procedures must be created in order to generate theplateaus required to determine the correct operating voltages. Access to the Eclipsescreen used to create these procedures is accomplished using either of these two meth-ods.
From the Manage menu, choose Procedures or from the toolbar select the ProcedureManager (PM) button. The initial Procedure Manager screen (Figure 40) appears. Aplateau calibration procedure is initiated by clicking on Plateau procedure and thenNext.
44
Setting Up to Count Samples
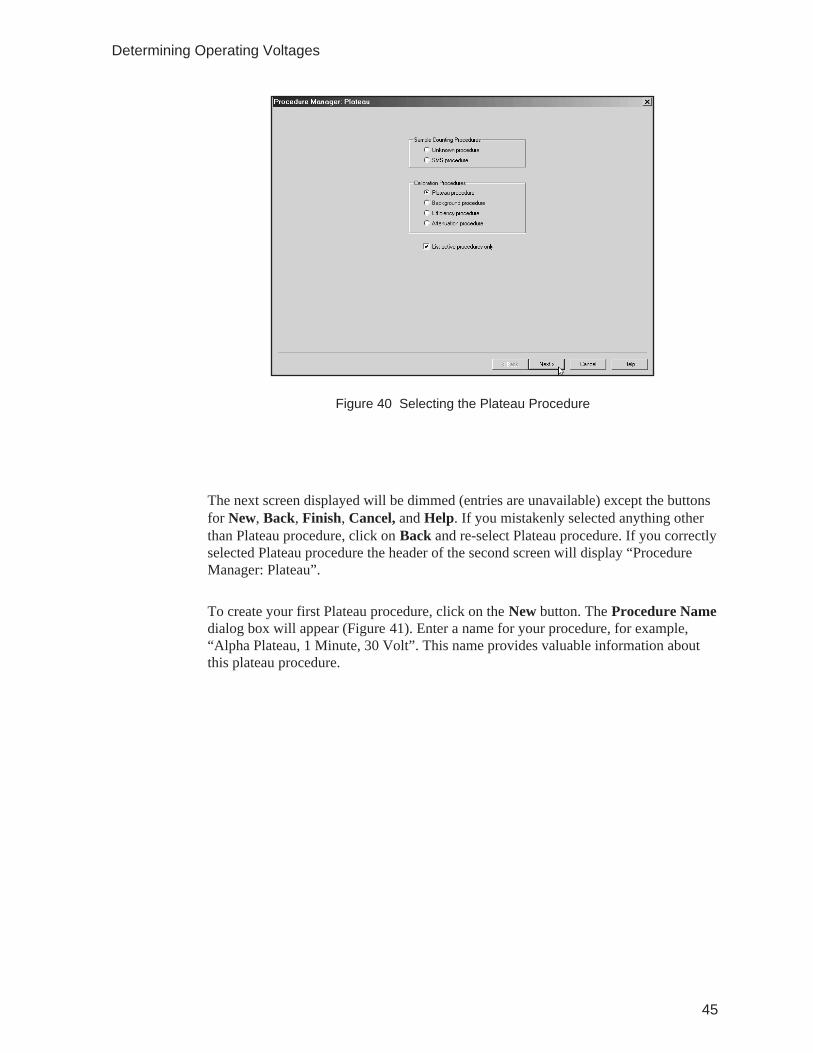
The next screen displayed will be dimmed (entries are unavailable) except the buttonsfor New, Back, Finish, Cancel, and Help. If you mistakenly selected anything otherthan Plateau procedure, click on Back and re-select Plateau procedure. If you correctlyselected Plateau procedure the header of the second screen will display “ProcedureManager: Plateau”.
To create your first Plateau procedure, click on the New button. The Procedure Namedialog box will appear (Figure 41). Enter a name for your procedure, for example,“Alpha Plateau, 1 Minute, 30 Volt”. This name provides valuable information aboutthis plateau procedure.
45
Determining Operating Voltages
Figure 40 Selecting the Plateau Procedure
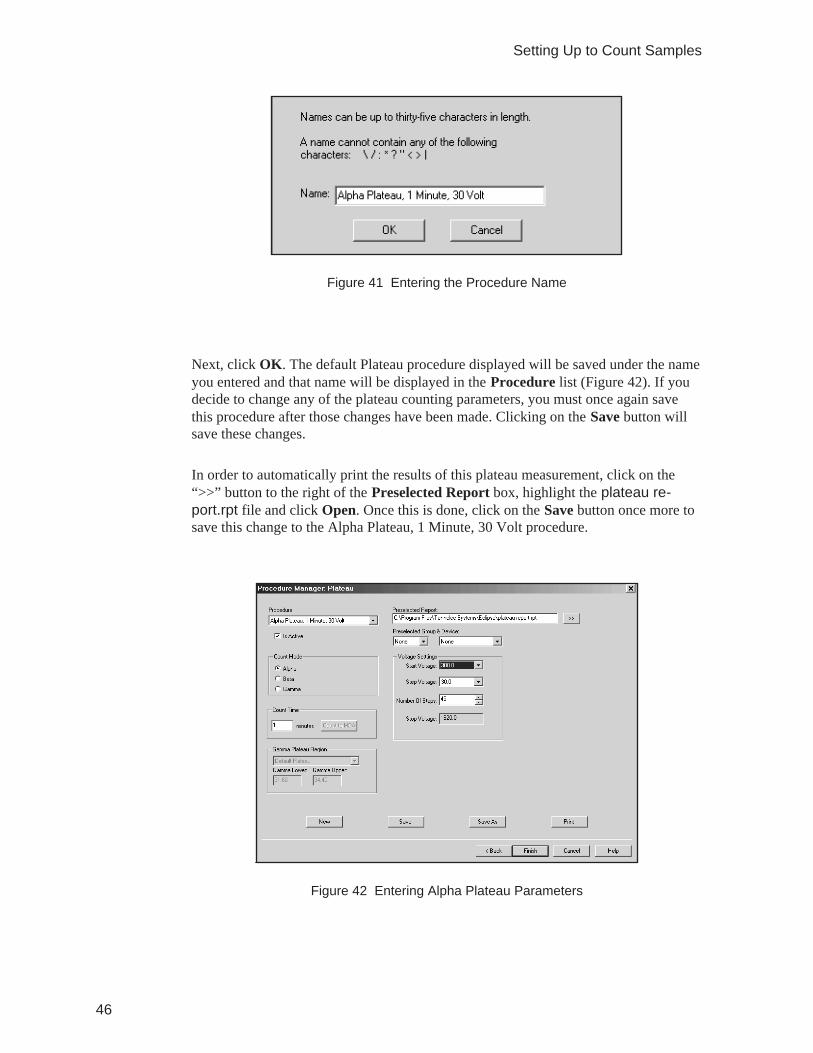
Next, click OK. The default Plateau procedure displayed will be saved under the nameyou entered and that name will be displayed in the Procedure list (Figure 42). If youdecide to change any of the plateau counting parameters, you must once again savethis procedure after those changes have been made. Clicking on the Save button willsave these changes.
In order to automatically print the results of this plateau measurement, click on the“>>” button to the right of the Preselected Report box, highlight the plateau re-port.rpt file and click Open. Once this is done, click on the Save button once more tosave this change to the Alpha Plateau, 1 Minute, 30 Volt procedure.
46
Setting Up to Count Samples
Figure 41 Entering the Procedure Name
Figure 42 Entering Alpha Plateau Parameters
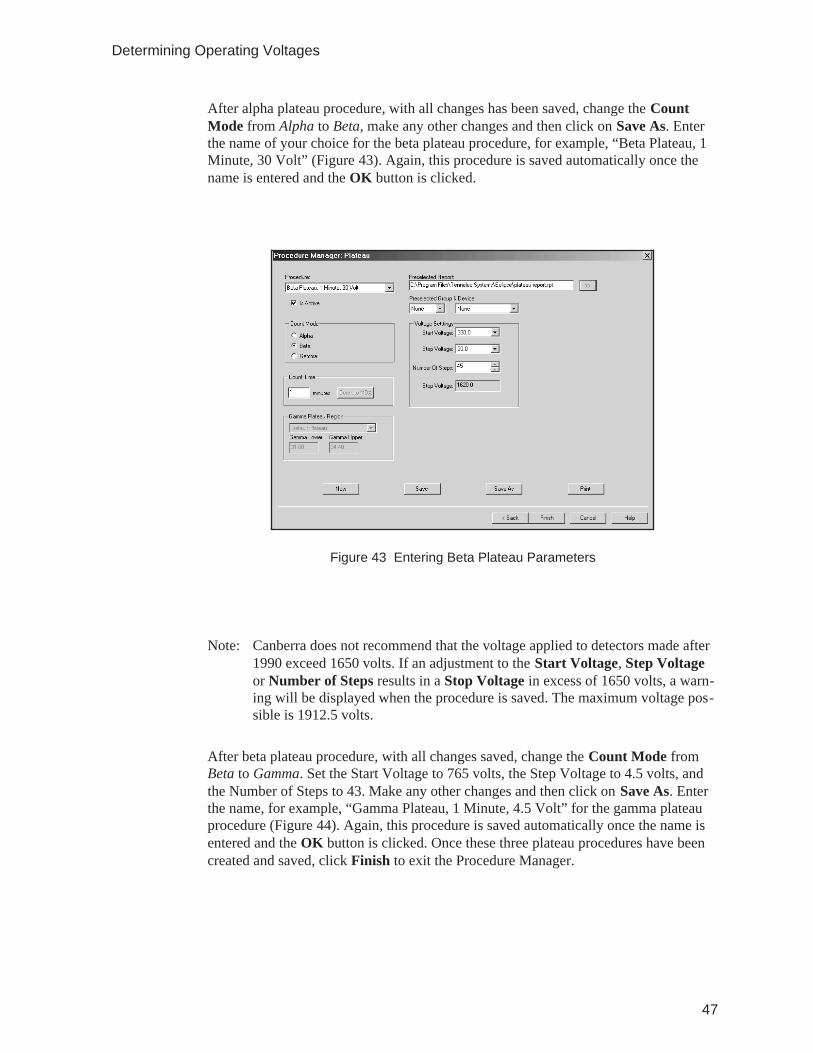
After alpha plateau procedure, with all changes has been saved, change the CountMode from Alpha to Beta, make any other changes and then click on Save As. Enterthe name of your choice for the beta plateau procedure, for example, “Beta Plateau, 1Minute, 30 Volt” (Figure 43). Again, this procedure is saved automatically once thename is entered and the OK button is clicked.
Note: Canberra does not recommend that the voltage applied to detectors made after1990 exceed 1650 volts. If an adjustment to the Start Voltage, Step Voltageor Number of Steps results in a Stop Voltage in excess of 1650 volts, a warn-ing will be displayed when the procedure is saved. The maximum voltage pos-sible is 1912.5 volts.
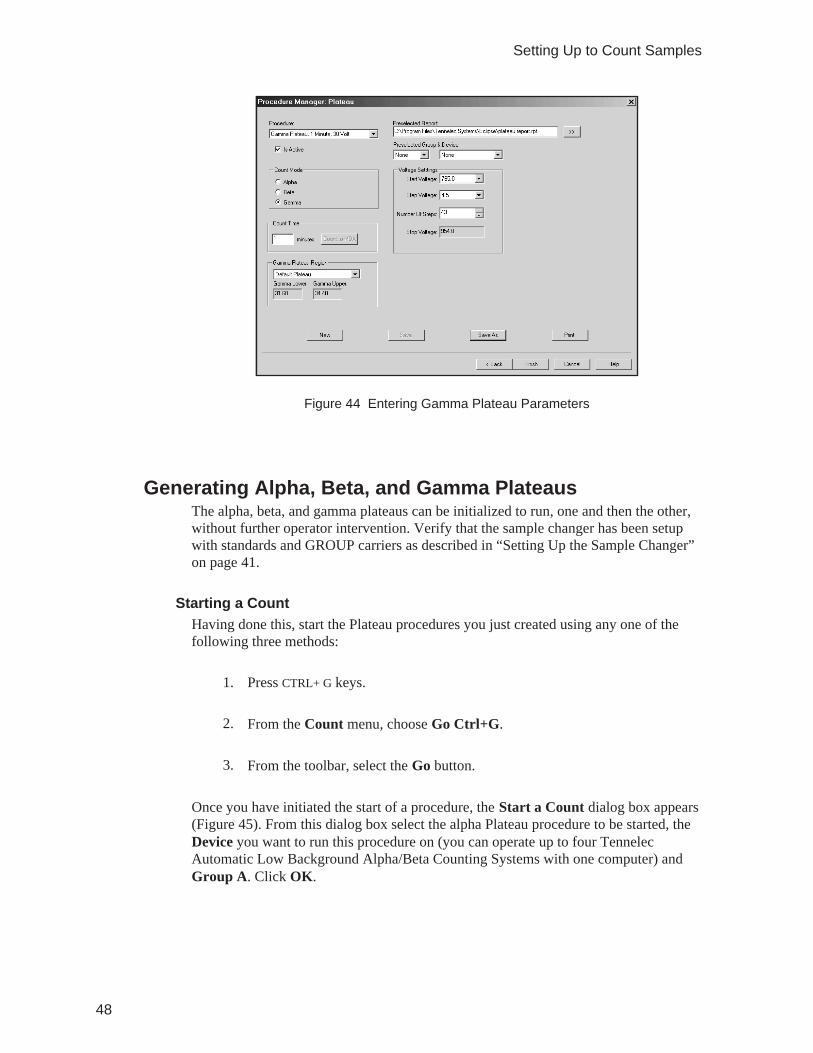
After beta plateau procedure, with all changes saved, change the Count Mode fromBeta to Gamma. Set the Start Voltage to 765 volts, the Step Voltage to 4.5 volts, andthe Number of Steps to 43. Make any other changes and then click on Save As. Enterthe name, for example, “Gamma Plateau, 1 Minute, 4.5 Volt” for the gamma plateauprocedure (Figure 44). Again, this procedure is saved automatically once the name isentered and the OK button is clicked. Once these three plateau procedures have beencreated and saved, click Finish to exit the Procedure Manager.
47
Determining Operating Voltages
Figure 43 Entering Beta Plateau Parameters
Generating Alpha, Beta, and Gamma PlateausThe alpha, beta, and gamma plateaus can be initialized to run, one and then the other,without further operator intervention. Verify that the sample changer has been setupwith standards and GROUP carriers as described in “Setting Up the Sample Changer”on page 41.
Starting a CountHaving done this, start the Plateau procedures you just created using any one of thefollowing three methods:
1. Press CTRL+ G keys.
2. From the Count menu, choose Go Ctrl+G.
3. From the toolbar, select the Go button.
Once you have initiated the start of a procedure, the Start a Count dialog box appears(Figure 45). From this dialog box select the alpha Plateau procedure to be started, theDevice you want to run this procedure on (you can operate up to four TennelecAutomatic Low Background Alpha/Beta Counting Systems with one computer) andGroup A. Click OK.
48
Setting Up to Count Samples
Figure 44 Entering Gamma Plateau Parameters
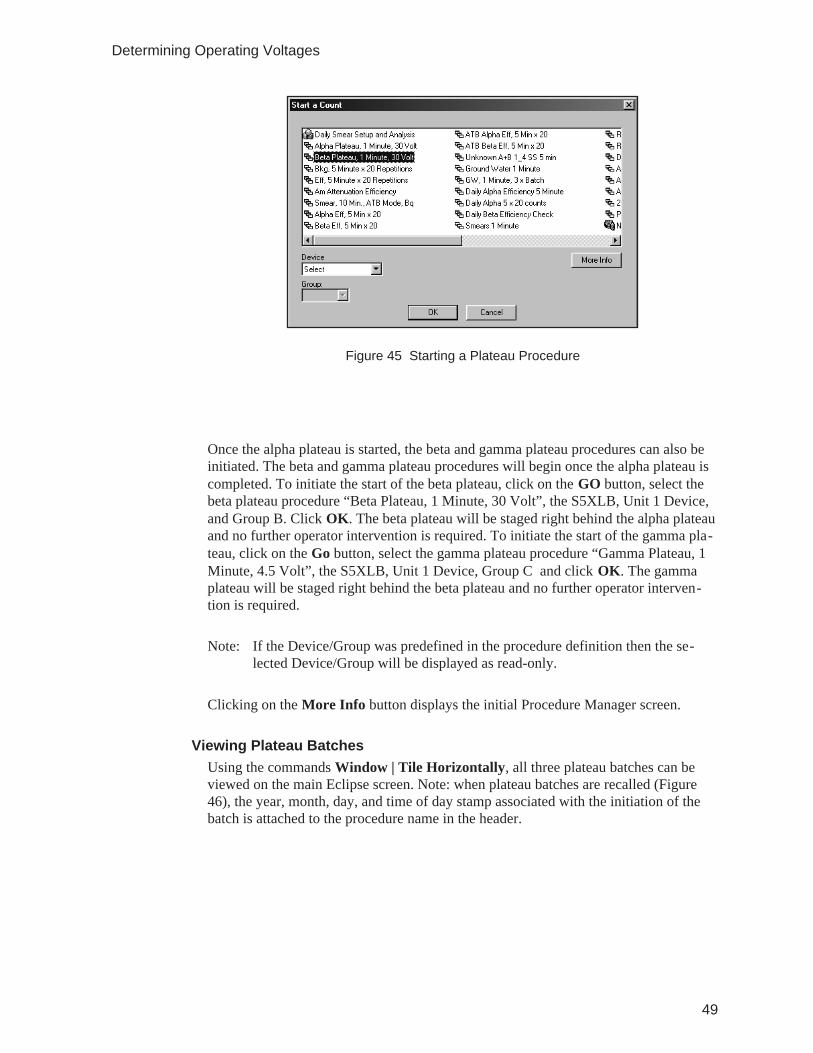
Once the alpha plateau is started, the beta and gamma plateau procedures can also beinitiated. The beta and gamma plateau procedures will begin once the alpha plateau iscompleted. To initiate the start of the beta plateau, click on the GO button, select thebeta plateau procedure “Beta Plateau, 1 Minute, 30 Volt”, the S5XLB, Unit 1 Device,and Group B. Click OK. The beta plateau will be staged right behind the alpha plateauand no further operator intervention is required. To initiate the start of the gamma pla-teau, click on the Go button, select the gamma plateau procedure “Gamma Plateau, 1Minute, 4.5 Volt”, the S5XLB, Unit 1 Device, Group C and click OK. The gammaplateau will be staged right behind the beta plateau and no further operator interven-tion is required.
Note: If the Device/Group was predefined in the procedure definition then the se-lected Device/Group will be displayed as read-only.
Clicking on the More Info button displays the initial Procedure Manager screen.
Viewing Plateau BatchesUsing the commands Window | Tile Horizontally, all three plateau batches can beviewed on the main Eclipse screen. Note: when plateau batches are recalled (Figure46), the year, month, day, and time of day stamp associated with the initiation of thebatch is attached to the procedure name in the header.
49
Determining Operating Voltages
Figure 45 Starting a Plateau Procedure
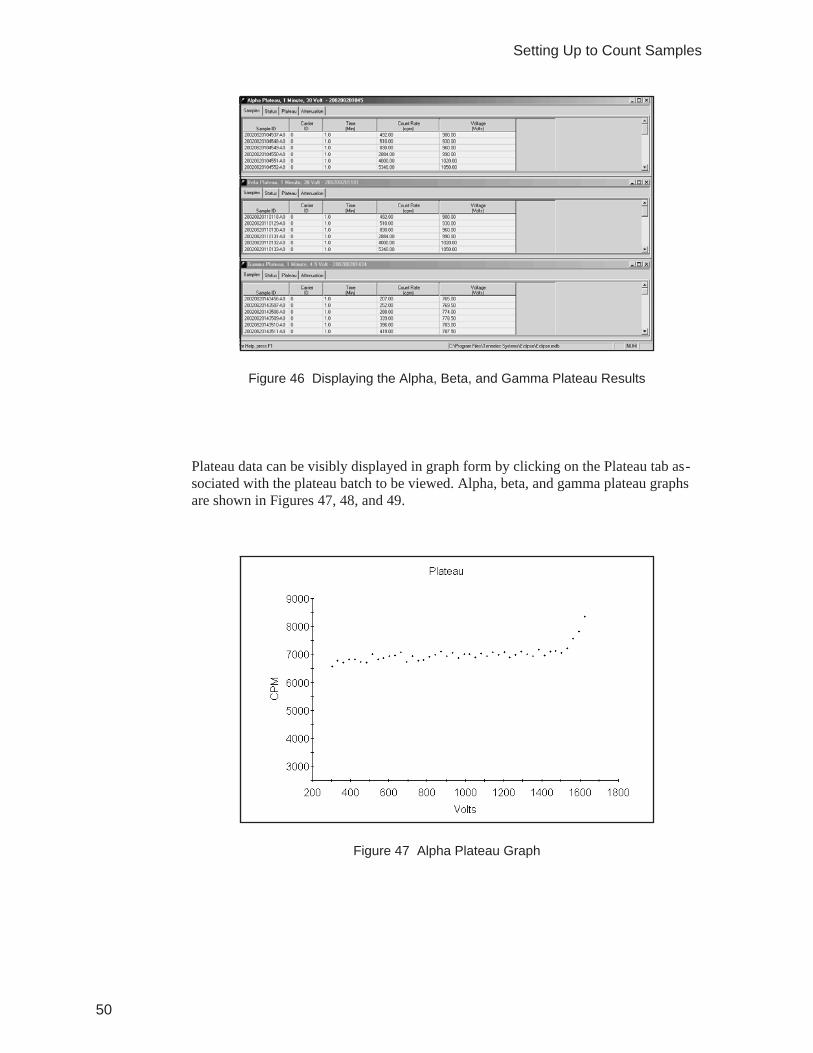
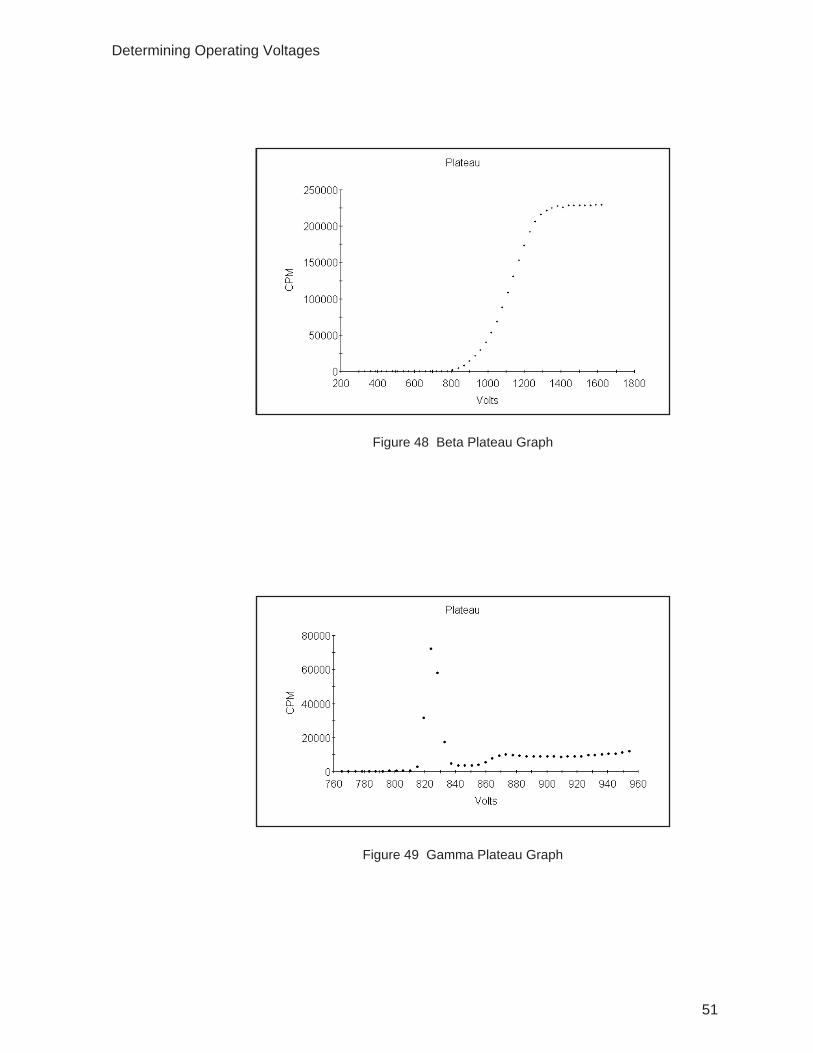
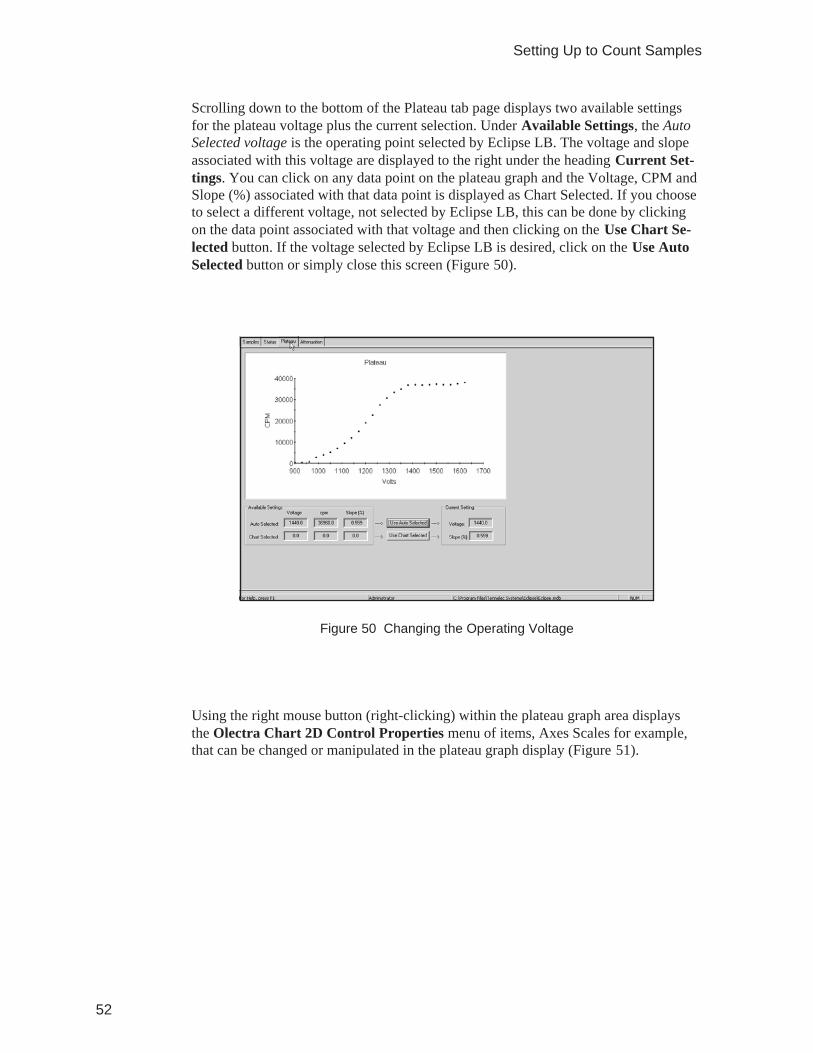
Plateau data can be visibly displayed in graph form by clicking on the Plateau tab as-sociated with the plateau batch to be viewed. Alpha, beta, and gamma plateau graphsare shown in Figures 47, 48, and 49.
50
Setting Up to Count Samples
Figure 46 Displaying the Alpha, Beta, and Gamma Plateau Results
Figure 47 Alpha Plateau Graph
51
Determining Operating Voltages
Figure 48 Beta Plateau Graph
Figure 49 Gamma Plateau Graph
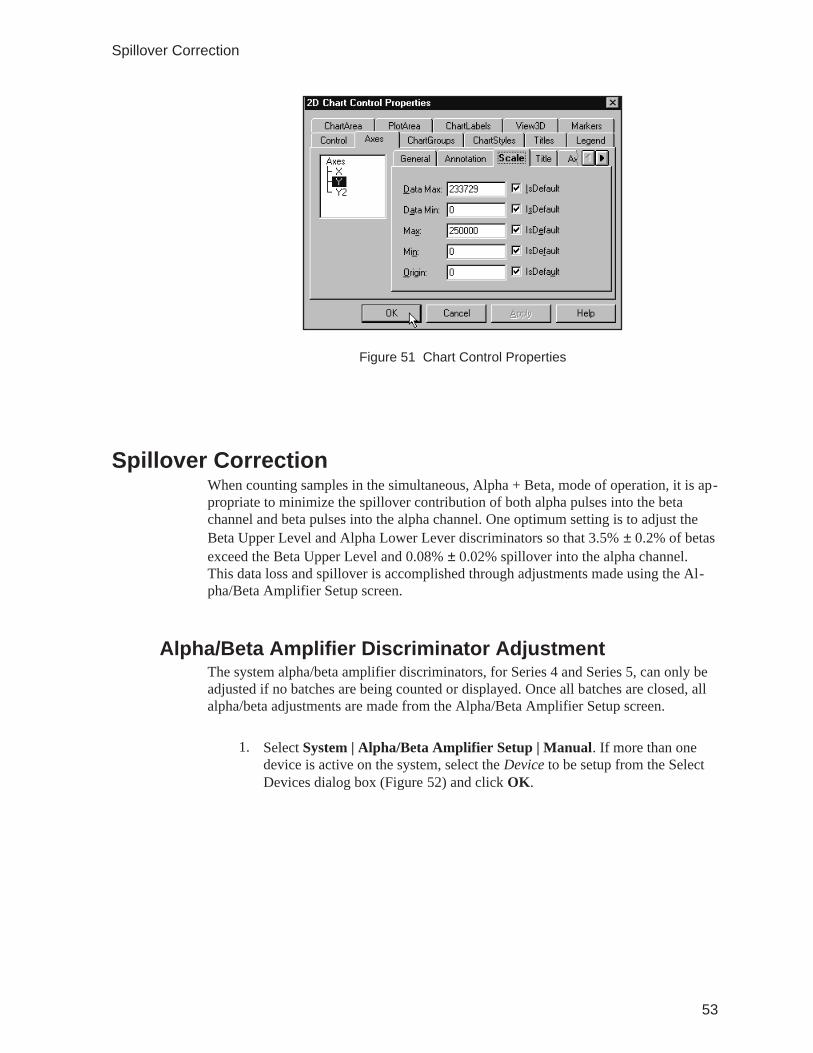
Scrolling down to the bottom of the Plateau tab page displays two available settingsfor the plateau voltage plus the current selection. Under Available Settings, the AutoSelected voltage is the operating point selected by Eclipse LB. The voltage and slopeassociated with this voltage are displayed to the right under the heading Current Set-tings. You can click on any data point on the plateau graph and the Voltage, CPM andSlope (%) associated with that data point is displayed as Chart Selected. If you chooseto select a different voltage, not selected by Eclipse LB, this can be done by clickingon the data point associated with that voltage and then clicking on the Use Chart Se-lected button. If the voltage selected by Eclipse LB is desired, click on the Use AutoSelected button or simply close this screen (Figure 50).
Using the right mouse button (right-clicking) within the plateau graph area displaysthe Olectra Chart 2D Control Properties menu of items, Axes Scales for example,that can be changed or manipulated in the plateau graph display (Figure 51).
52
Setting Up to Count Samples
Figure 50 Changing the Operating Voltage
Spillover CorrectionWhen counting samples in the simultaneous, Alpha + Beta, mode of operation, it is ap-propriate to minimize the spillover contribution of both alpha pulses into the betachannel and beta pulses into the alpha channel. One optimum setting is to adjust theBeta Upper Level and Alpha Lower Lever discriminators so that 3.5% ± 0.2% of betasexceed the Beta Upper Level and 0.08% ± 0.02% spillover into the alpha channel.This data loss and spillover is accomplished through adjustments made using the Al-pha/Beta Amplifier Setup screen.
Alpha/Beta Amplifier Discriminator AdjustmentThe system alpha/beta amplifier discriminators, for Series 4 and Series 5, can only beadjusted if no batches are being counted or displayed. Once all batches are closed, allalpha/beta adjustments are made from the Alpha/Beta Amplifier Setup screen.
1. Select System | Alpha/Beta Amplifier Setup | Manual. If more than onedevice is active on the system, select the Device to be setup from the SelectDevices dialog box (Figure 52) and click OK.
53
Spillover Correction
Figure 51 Chart Control Properties
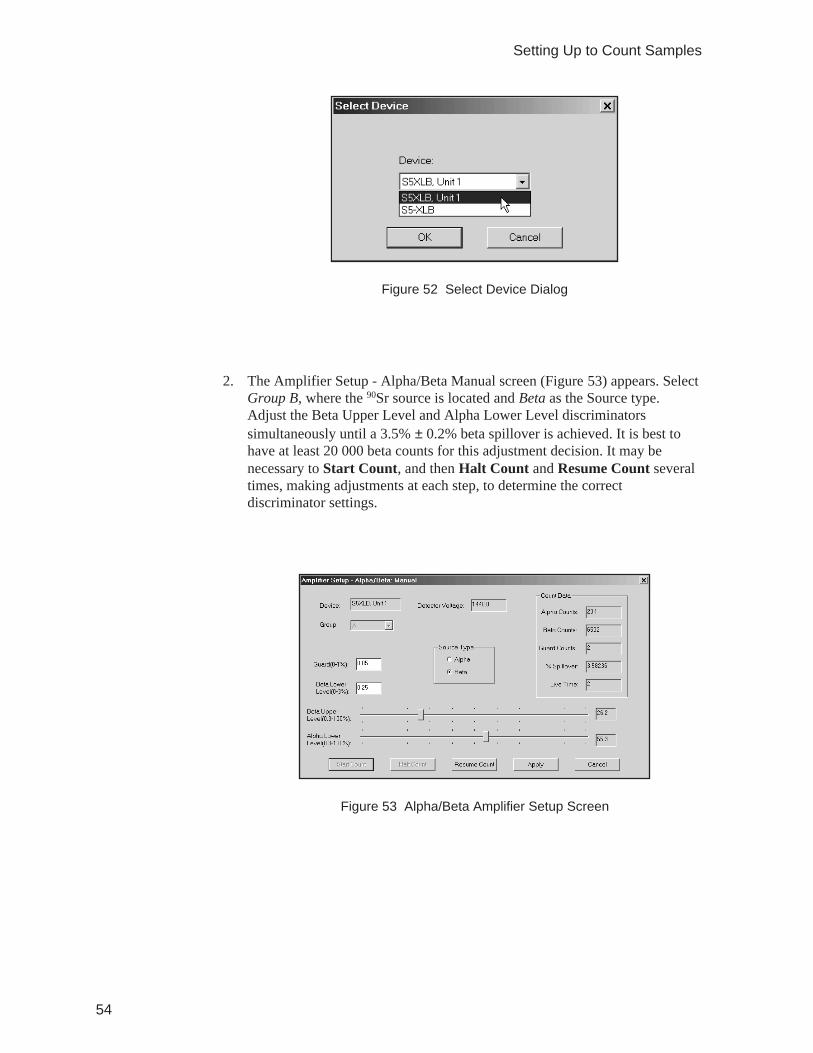
2. The Amplifier Setup - Alpha/Beta Manual screen (Figure 53) appears. SelectGroup B, where the 90Sr source is located and Beta as the Source type.Adjust the Beta Upper Level and Alpha Lower Level discriminatorssimultaneously until a 3.5% ± 0.2% beta spillover is achieved. It is best tohave at least 20 000 beta counts for this adjustment decision. It may benecessary to Start Count, and then Halt Count and Resume Count severaltimes, making adjustments at each step, to determine the correctdiscriminator settings.
54
Setting Up to Count Samples
Figure 52 Select Device Dialog
Figure 53 Alpha/Beta Amplifier Setup Screen
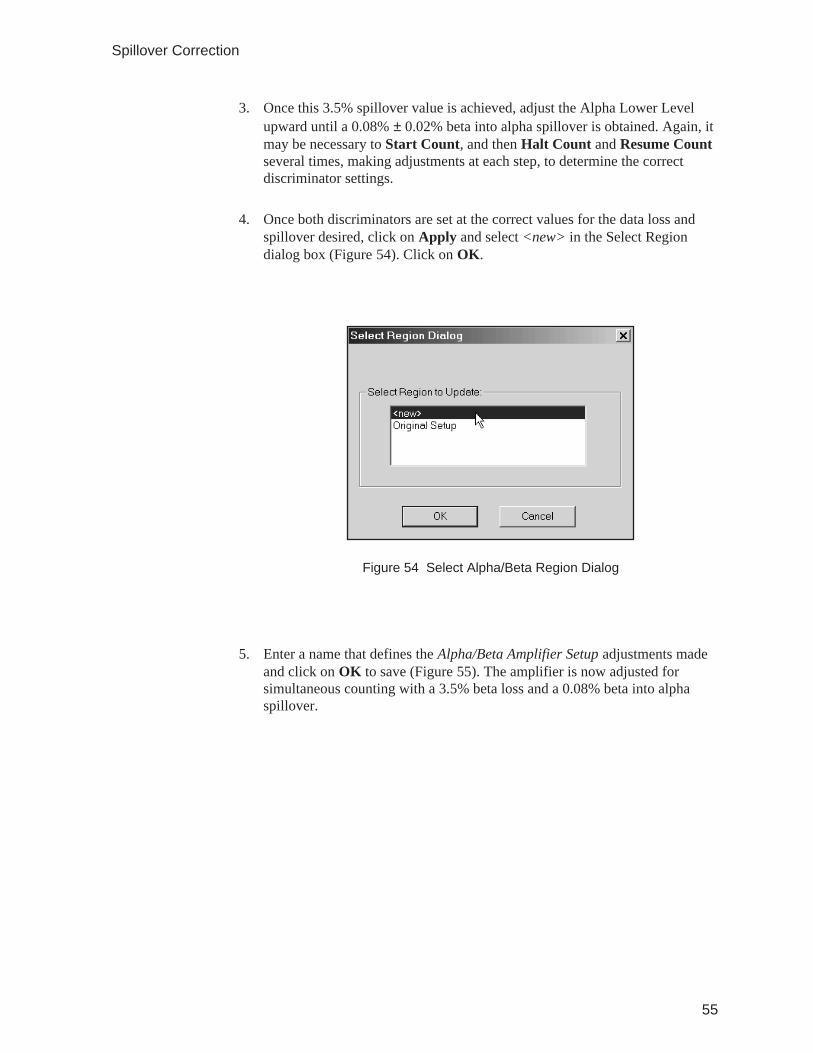
3. Once this 3.5% spillover value is achieved, adjust the Alpha Lower Levelupward until a 0.08% ± 0.02% beta into alpha spillover is obtained. Again, itmay be necessary to Start Count, and then Halt Count and Resume Countseveral times, making adjustments at each step, to determine the correctdiscriminator settings.
4. Once both discriminators are set at the correct values for the data loss andspillover desired, click on Apply and select <new> in the Select Regiondialog box (Figure 54). Click on OK.
5. Enter a name that defines the Alpha/Beta Amplifier Setup adjustments madeand click on OK to save (Figure 55). The amplifier is now adjusted forsimultaneous counting with a 3.5% beta loss and a 0.08% beta into alphaspillover.
55
Spillover Correction
Figure 54 Select Alpha/Beta Region Dialog
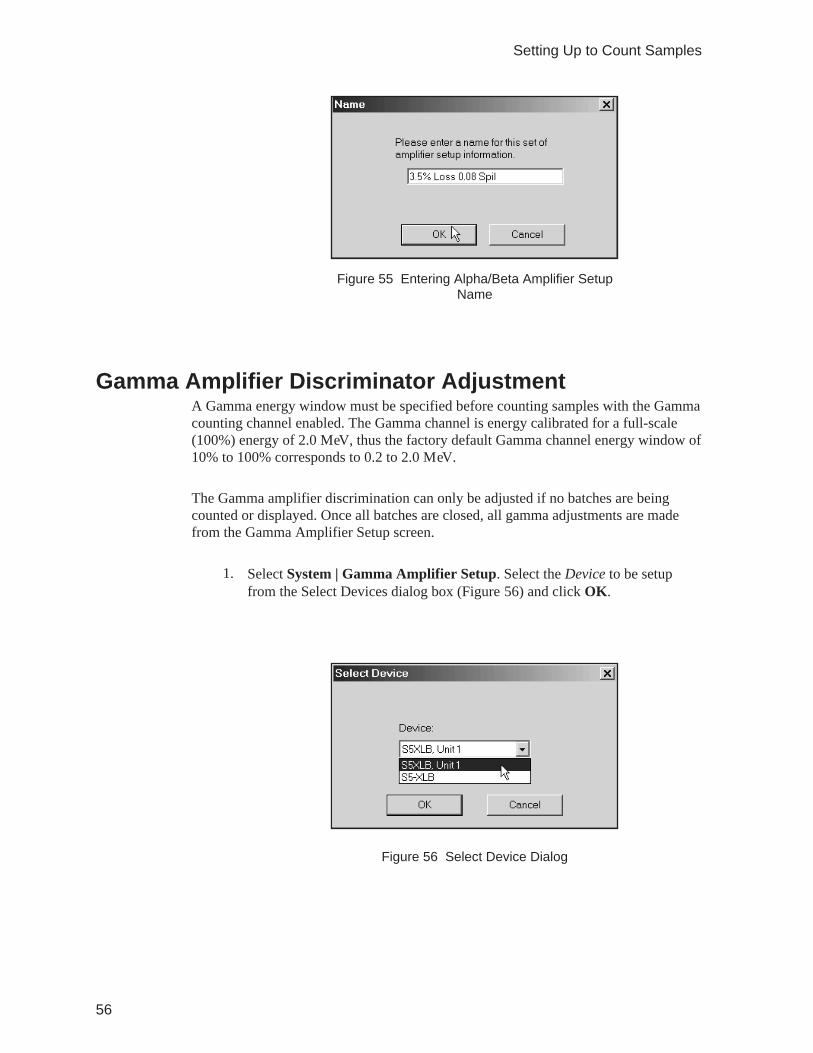
Gamma Amplifier Discriminator AdjustmentA Gamma energy window must be specified before counting samples with the Gammacounting channel enabled. The Gamma channel is energy calibrated for a full-scale(100%) energy of 2.0 MeV, thus the factory default Gamma channel energy window of10% to 100% corresponds to 0.2 to 2.0 MeV.
The Gamma amplifier discrimination can only be adjusted if no batches are beingcounted or displayed. Once all batches are closed, all gamma adjustments are madefrom the Gamma Amplifier Setup screen.
1. Select System | Gamma Amplifier Setup. Select the Device to be setupfrom the Select Devices dialog box (Figure 56) and click OK.
56
Setting Up to Count Samples
Figure 55 Entering Alpha/Beta Amplifier SetupName
Figure 56 Select Device Dialog
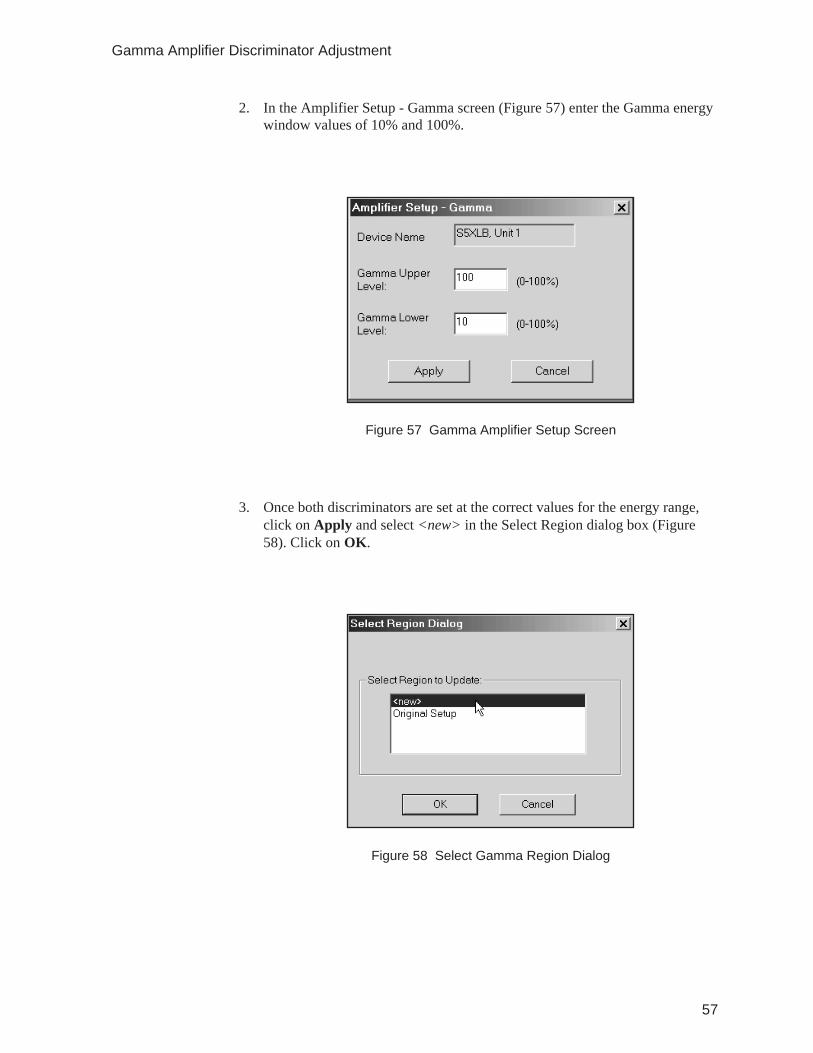
2. In the Amplifier Setup - Gamma screen (Figure 57) enter the Gamma energywindow values of 10% and 100%.
3. Once both discriminators are set at the correct values for the energy range,click on Apply and select <new> in the Select Region dialog box (Figure58). Click on OK.
57
Gamma Amplifier Discriminator Adjustment
Figure 57 Gamma Amplifier Setup Screen
Figure 58 Select Gamma Region Dialog
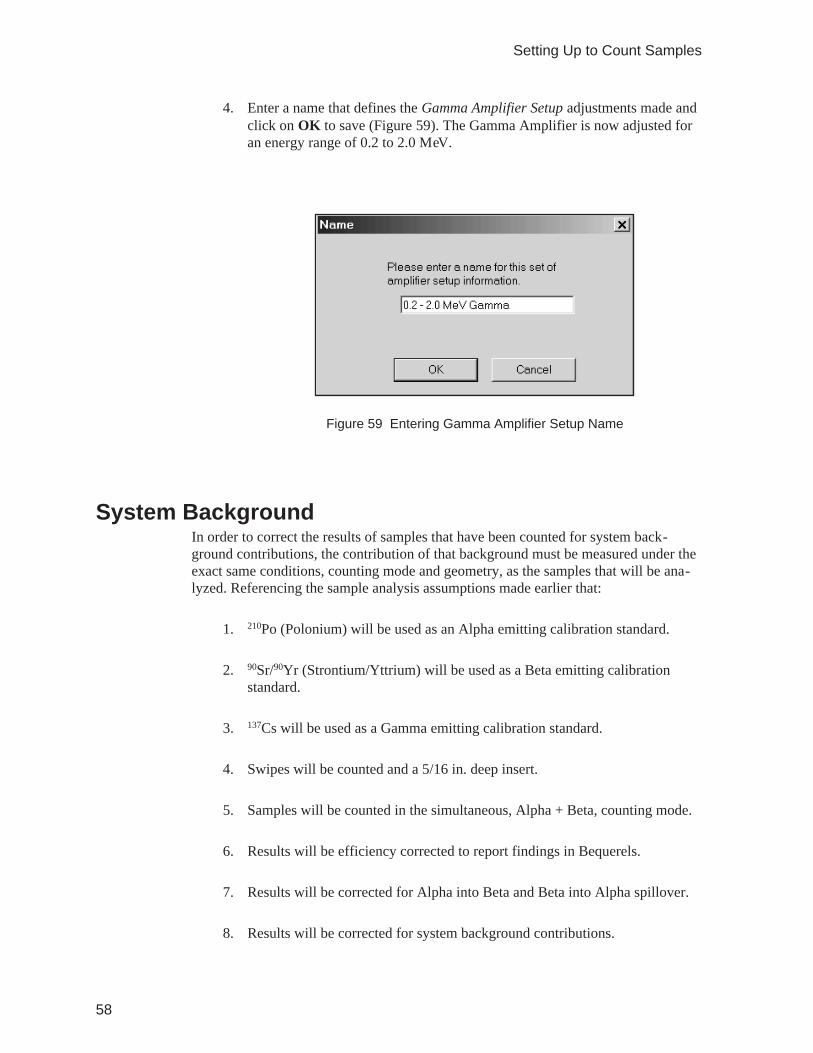
4. Enter a name that defines the Gamma Amplifier Setup adjustments made andclick on OK to save (Figure 59). The Gamma Amplifier is now adjusted foran energy range of 0.2 to 2.0 MeV.
System BackgroundIn order to correct the results of samples that have been counted for system back-ground contributions, the contribution of that background must be measured under theexact same conditions, counting mode and geometry, as the samples that will be ana-lyzed. Referencing the sample analysis assumptions made earlier that:
1. 210Po (Polonium) will be used as an Alpha emitting calibration standard.
2. 90Sr/90Yr (Strontium/Yttrium) will be used as a Beta emitting calibrationstandard.
3. 137Cs will be used as a Gamma emitting calibration standard.
4. Swipes will be counted and a 5/16 in. deep insert.
5. Samples will be counted in the simultaneous, Alpha + Beta, counting mode.
6. Results will be efficiency corrected to report findings in Bequerels.
7. Results will be corrected for Alpha into Beta and Beta into Alpha spillover.
8. Results will be corrected for system background contributions.
58
Setting Up to Count Samples
Figure 59 Entering Gamma Amplifier Setup Name
The system background must be determined for the simultaneous, Alpha + Beta,counting mode, using the “3.5% Loss 0.08% Spil” amplifier setup and Swipe/Smeargeometry.
Creating a Background ProcedureIn order to profile the system background, a procedure must be created to measure itunder the conditions listed in System Background. From the Manage menu, chooseProcedures or from toolbar select the PM button to initiate the creation of a Back-ground Calibration procedure.
Select New and enter a name that describes the procedure, for example, “A+B Back-ground Swipe_Smear Geometry”. Click Ok. The Background procedure appears (Fig-ure 60) with the name entered displayed in the Procedure list.
From the Background Procedure Manager the following steps are performed:
1. Select the Simultaneous Count Mode.
2. From the Alpha/Beta ROI Discriminator Selection, choose 3.5% Loss 0.8%Spil.
59
System Background
Figure 60 Entering Background Parameters
3. From the Gamma ROI Discriminator Selection, choose 0.2-2.0 MeV Gamma.
4. Select a Count Time of 10 minutes.
5. From the Preselected Report, choose background report.rpt.
6. Select 10 Sample Count Repetitions.
7. Select Swipe/Smear as the Geometry Selection.
Leave all other selection unchanged. Since some changes have been made to the initialdefault settings, click on the Save button to save these background procedure changes.Click Finish to exit the Procedure Manager.
Measuring the System BackgroundFrom the Count menu, choose Go Ctrl+G or from the toolbar select the GO button.From the Start a Count dialog box click on the “A+B Background Swipe_Smear Ge-ometry” procedure. From the device list select the correct device (in this case theS5XLB, Unit 1) and from the Group list select D. Click on OK. The background pro-cedure will begin with the system searching for the Group D carrier and then insertingthe next valid sample carrier.
Once this procedure is complete, Eclipse LB will automatically print the results usingthe selected background report form. Clicking on the Samples tab (Figure 61) displaysthe counting results of the background measurement.
60
Setting Up to Count Samples
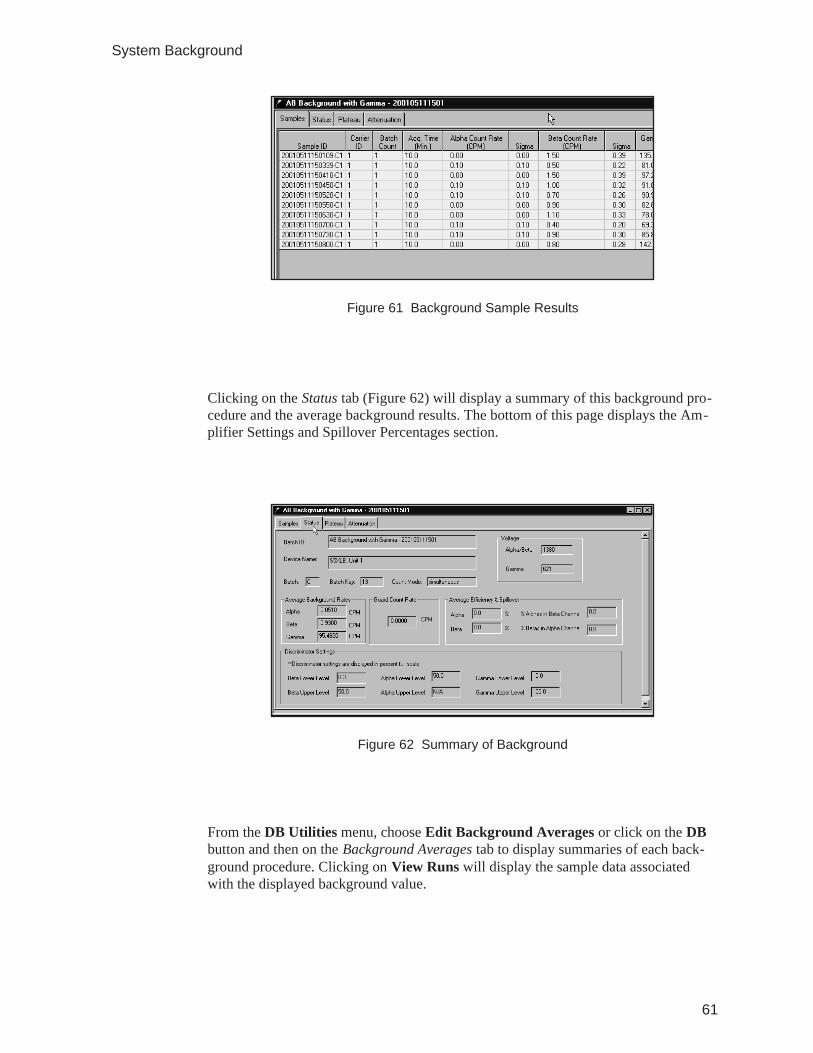
Clicking on the Status tab (Figure 62) will display a summary of this background pro-cedure and the average background results. The bottom of this page displays the Am-plifier Settings and Spillover Percentages section.
From the DB Utilities menu, choose Edit Background Averages or click on the DBbutton and then on the Background Averages tab to display summaries of each back-ground procedure. Clicking on View Runs will display the sample data associatedwith the displayed background value.
61
System Background
Figure 61 Background Sample Results
Figure 62 Summary of Background
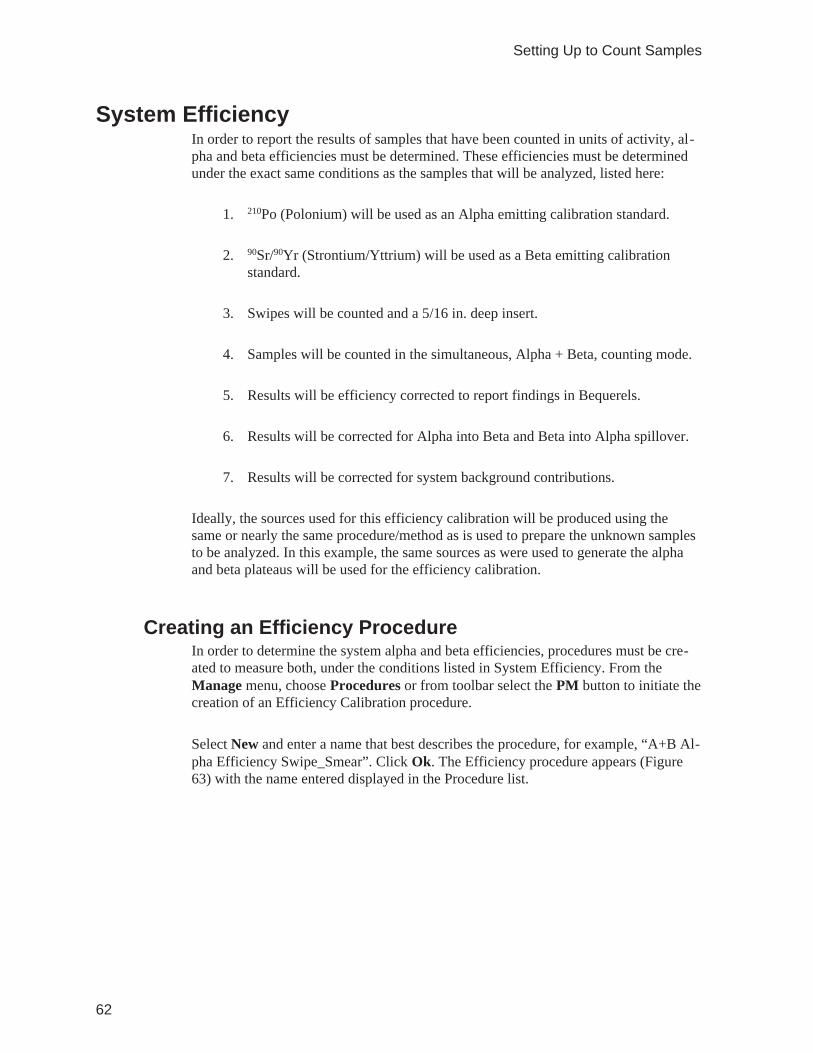
System EfficiencyIn order to report the results of samples that have been counted in units of activity, al-pha and beta efficiencies must be determined. These efficiencies must be determinedunder the exact same conditions as the samples that will be analyzed, listed here:
1. 210Po (Polonium) will be used as an Alpha emitting calibration standard.
2. 90Sr/90Yr (Strontium/Yttrium) will be used as a Beta emitting calibrationstandard.
3. Swipes will be counted and a 5/16 in. deep insert.
4. Samples will be counted in the simultaneous, Alpha + Beta, counting mode.
5. Results will be efficiency corrected to report findings in Bequerels.
6. Results will be corrected for Alpha into Beta and Beta into Alpha spillover.
7. Results will be corrected for system background contributions.
Ideally, the sources used for this efficiency calibration will be produced using thesame or nearly the same procedure/method as is used to prepare the unknown samplesto be analyzed. In this example, the same sources as were used to generate the alphaand beta plateaus will be used for the efficiency calibration.
Creating an Efficiency ProcedureIn order to determine the system alpha and beta efficiencies, procedures must be cre-ated to measure both, under the conditions listed in System Efficiency. From theManage menu, choose Procedures or from toolbar select the PM button to initiate thecreation of an Efficiency Calibration procedure.
Select New and enter a name that best describes the procedure, for example, “A+B Al-pha Efficiency Swipe_Smear”. Click Ok. The Efficiency procedure appears (Figure63) with the name entered displayed in the Procedure list.
62
Setting Up to Count Samples
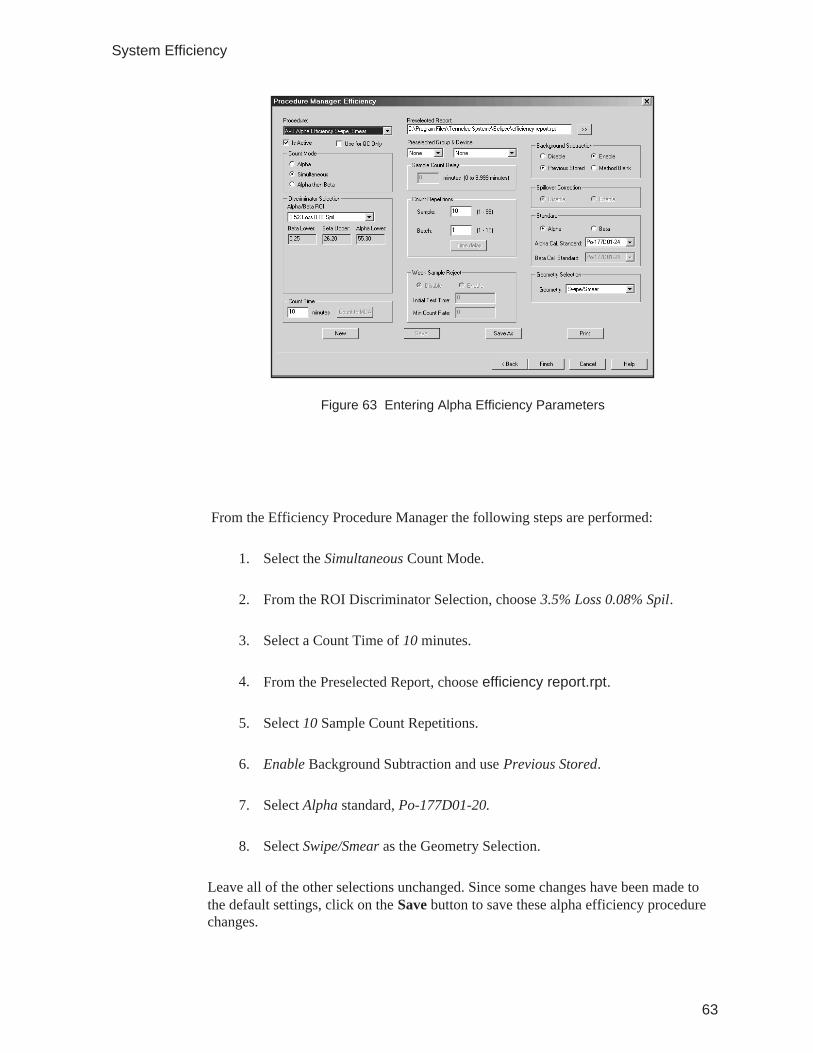
From the Efficiency Procedure Manager the following steps are performed:
1. Select the Simultaneous Count Mode.
2. From the ROI Discriminator Selection, choose 3.5% Loss 0.08% Spil.
3. Select a Count Time of 10 minutes.
4. From the Preselected Report, choose efficiency report.rpt.
5. Select 10 Sample Count Repetitions.
6. Enable Background Subtraction and use Previous Stored.
7. Select Alpha standard, Po-177D01-20.
8. Select Swipe/Smear as the Geometry Selection.
Leave all of the other selections unchanged. Since some changes have been made tothe default settings, click on the Save button to save these alpha efficiency procedurechanges.
63
System Efficiency
Figure 63 Entering Alpha Efficiency Parameters
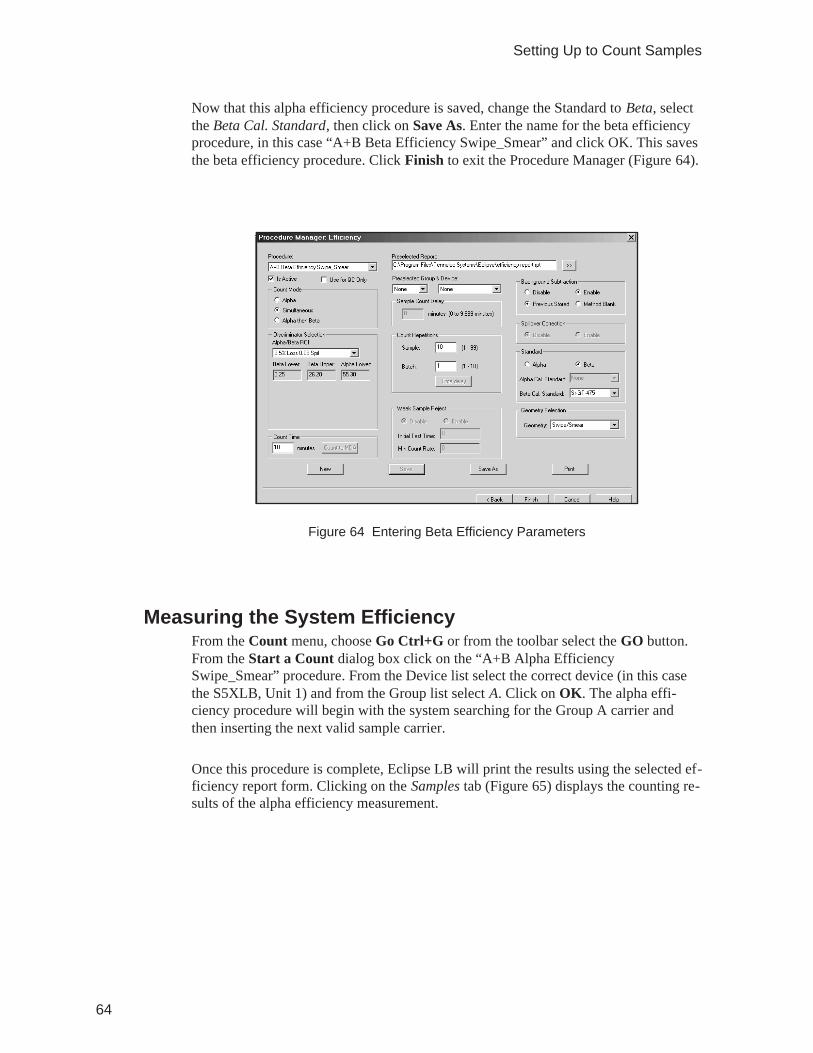
Now that this alpha efficiency procedure is saved, change the Standard to Beta, selectthe Beta Cal. Standard, then click on Save As. Enter the name for the beta efficiencyprocedure, in this case “A+B Beta Efficiency Swipe_Smear” and click OK. This savesthe beta efficiency procedure. Click Finish to exit the Procedure Manager (Figure 64).
Measuring the System EfficiencyFrom the Count menu, choose Go Ctrl+G or from the toolbar select the GO button.From the Start a Count dialog box click on the “A+B Alpha EfficiencySwipe_Smear” procedure. From the Device list select the correct device (in this casethe S5XLB, Unit 1) and from the Group list select A. Click on OK. The alpha effi-ciency procedure will begin with the system searching for the Group A carrier andthen inserting the next valid sample carrier.
Once this procedure is complete, Eclipse LB will print the results using the selected ef-ficiency report form. Clicking on the Samples tab (Figure 65) displays the counting re-sults of the alpha efficiency measurement.
64
Setting Up to Count Samples
Figure 64 Entering Beta Efficiency Parameters
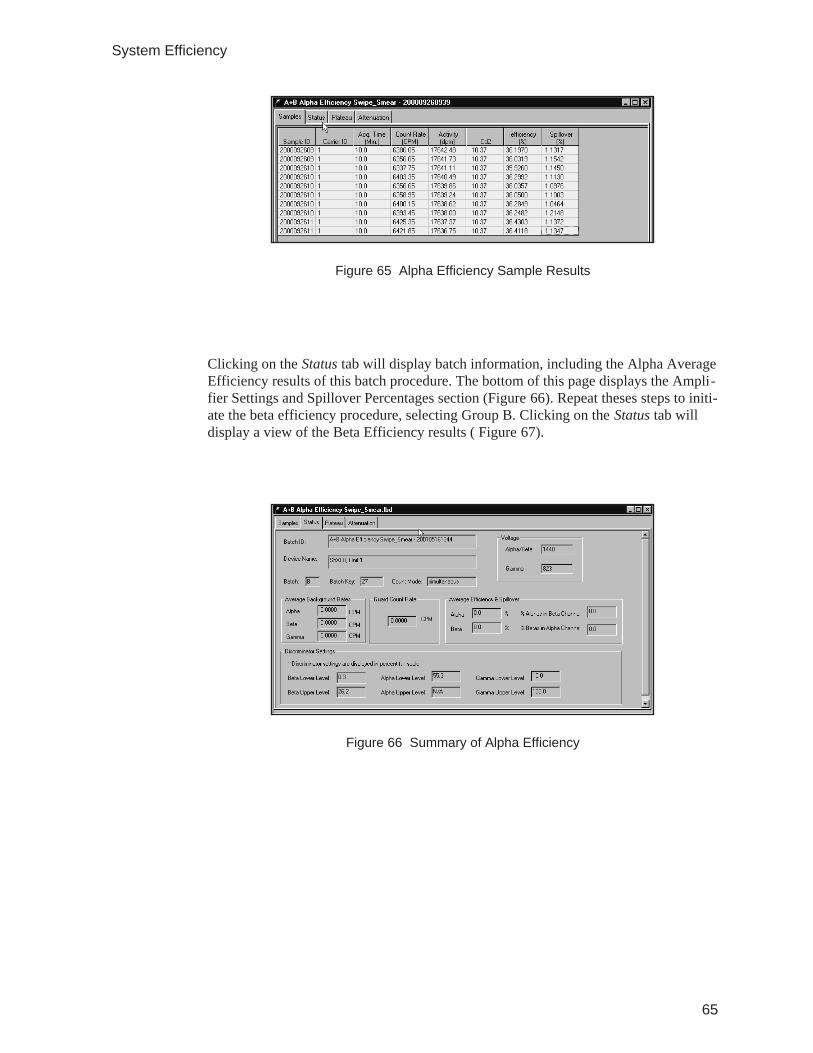
Clicking on the Status tab will display batch information, including the Alpha AverageEfficiency results of this batch procedure. The bottom of this page displays the Ampli-fier Settings and Spillover Percentages section (Figure 66). Repeat theses steps to initi-ate the beta efficiency procedure, selecting Group B. Clicking on the Status tab willdisplay a view of the Beta Efficiency results ( Figure 67).
65
System Efficiency
Figure 65 Alpha Efficiency Sample Results
Figure 66 Summary of Alpha Efficiency
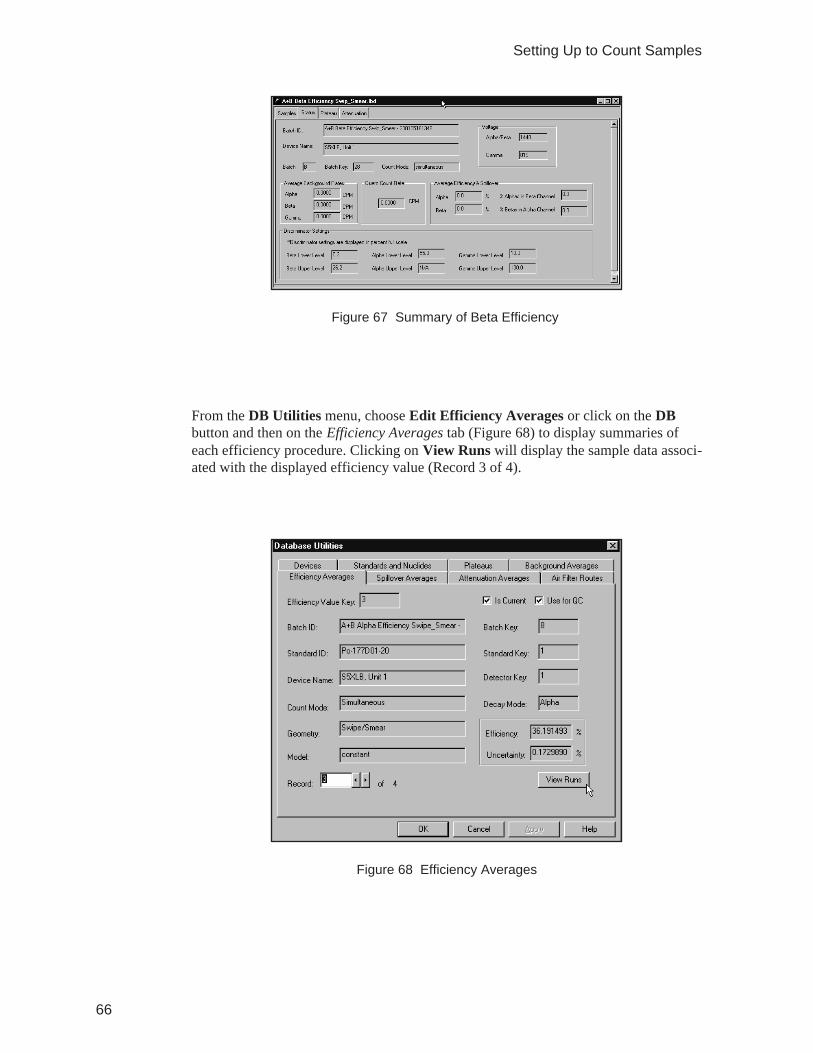
From the DB Utilities menu, choose Edit Efficiency Averages or click on the DBbutton and then on the Efficiency Averages tab (Figure 68) to display summaries ofeach efficiency procedure. Clicking on View Runs will display the sample data associ-ated with the displayed efficiency value (Record 3 of 4).
66
Setting Up to Count Samples
Figure 67 Summary of Beta Efficiency
Figure 68 Efficiency Averages
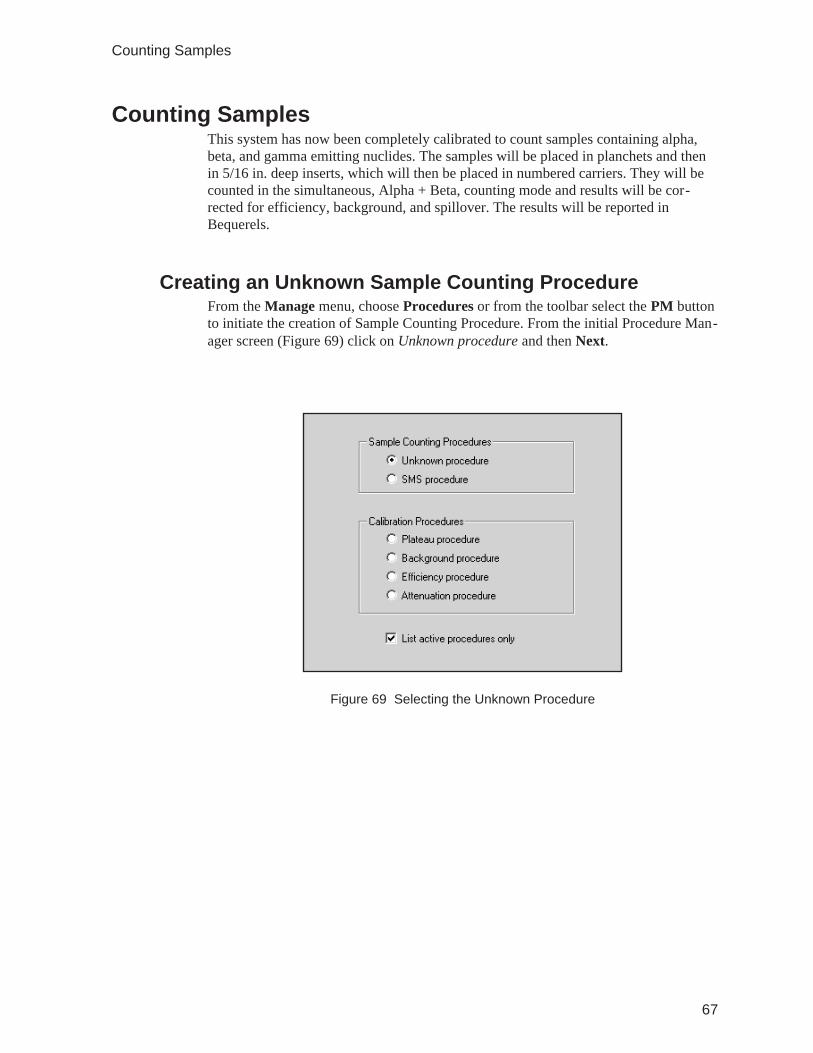
Counting SamplesThis system has now been completely calibrated to count samples containing alpha,beta, and gamma emitting nuclides. The samples will be placed in planchets and thenin 5/16 in. deep inserts, which will then be placed in numbered carriers. They will becounted in the simultaneous, Alpha + Beta, counting mode and results will be cor-rected for efficiency, background, and spillover. The results will be reported inBequerels.
Creating an Unknown Sample Counting ProcedureFrom the Manage menu, choose Procedures or from the toolbar select the PM buttonto initiate the creation of Sample Counting Procedure. From the initial Procedure Man-ager screen (Figure 69) click on Unknown procedure and then Next.
67
Counting Samples
Figure 69 Selecting the Unknown Procedure
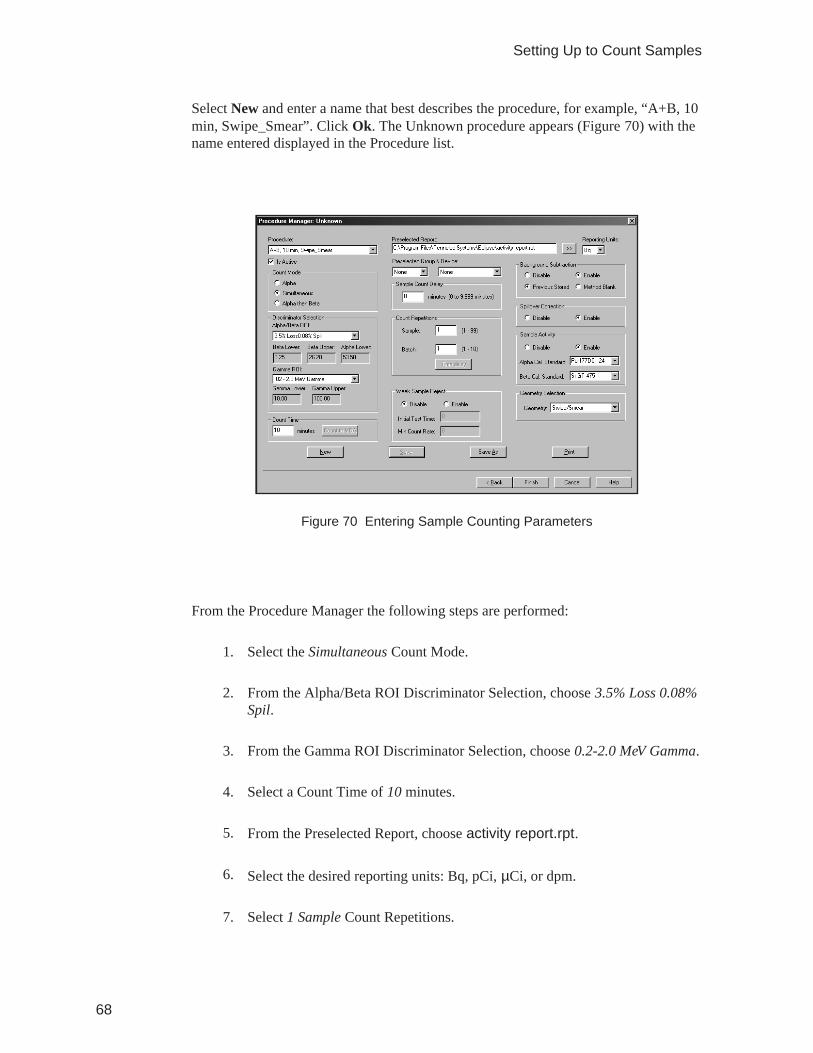
Select New and enter a name that best describes the procedure, for example, “A+B, 10min, Swipe_Smear”. Click Ok. The Unknown procedure appears (Figure 70) with thename entered displayed in the Procedure list.
From the Procedure Manager the following steps are performed:
1. Select the Simultaneous Count Mode.
2. From the Alpha/Beta ROI Discriminator Selection, choose 3.5% Loss 0.08%Spil.
3. From the Gamma ROI Discriminator Selection, choose 0.2-2.0 MeV Gamma.
4. Select a Count Time of 10 minutes.
5. From the Preselected Report, choose activity report.rpt.
6. Select the desired reporting units: Bq, pCi, µCi, or dpm.
7. Select 1 Sample Count Repetitions.
68
Setting Up to Count Samples
Figure 70 Entering Sample Counting Parameters
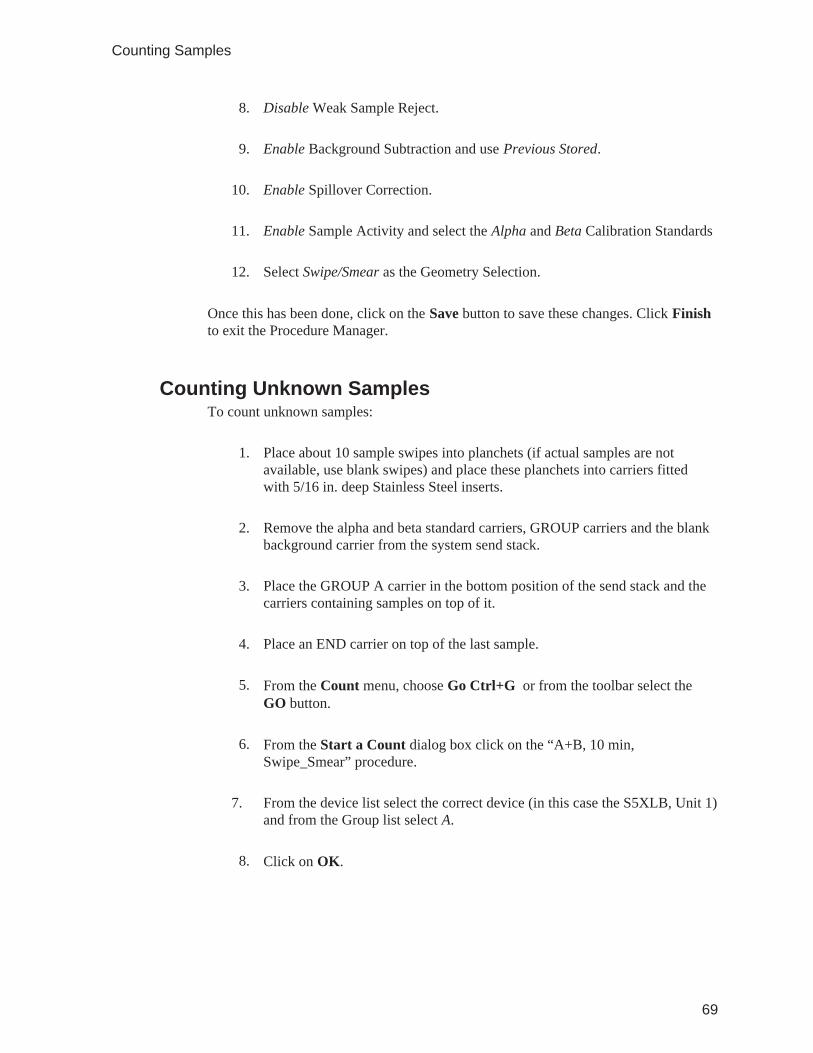
8. Disable Weak Sample Reject.
9. Enable Background Subtraction and use Previous Stored.
10. Enable Spillover Correction.
11. Enable Sample Activity and select the Alpha and Beta Calibration Standards
12. Select Swipe/Smear as the Geometry Selection.
Once this has been done, click on the Save button to save these changes. Click Finishto exit the Procedure Manager.
Counting Unknown SamplesTo count unknown samples:
1. Place about 10 sample swipes into planchets (if actual samples are notavailable, use blank swipes) and place these planchets into carriers fittedwith 5/16 in. deep Stainless Steel inserts.
2. Remove the alpha and beta standard carriers, GROUP carriers and the blankbackground carrier from the system send stack.
3. Place the GROUP A carrier in the bottom position of the send stack and thecarriers containing samples on top of it.
4. Place an END carrier on top of the last sample.
5. From the Count menu, choose Go Ctrl+G or from the toolbar select theGO button.
6. From the Start a Count dialog box click on the “A+B, 10 min,Swipe_Smear” procedure.
7. From the device list select the correct device (in this case the S5XLB, Unit 1)and from the Group list select A.
8. Click on OK.
69
Counting Samples
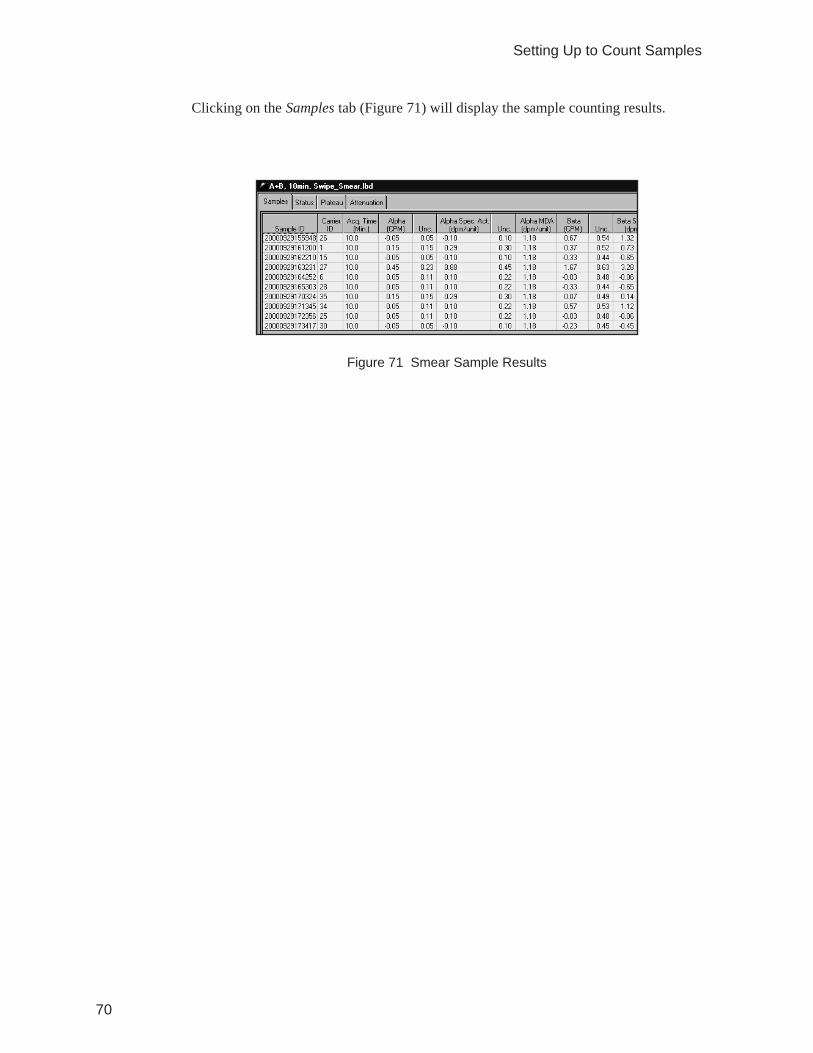
Clicking on the Samples tab (Figure 71) will display the sample counting results.
70
Setting Up to Count Samples
Figure 71 Smear Sample Results
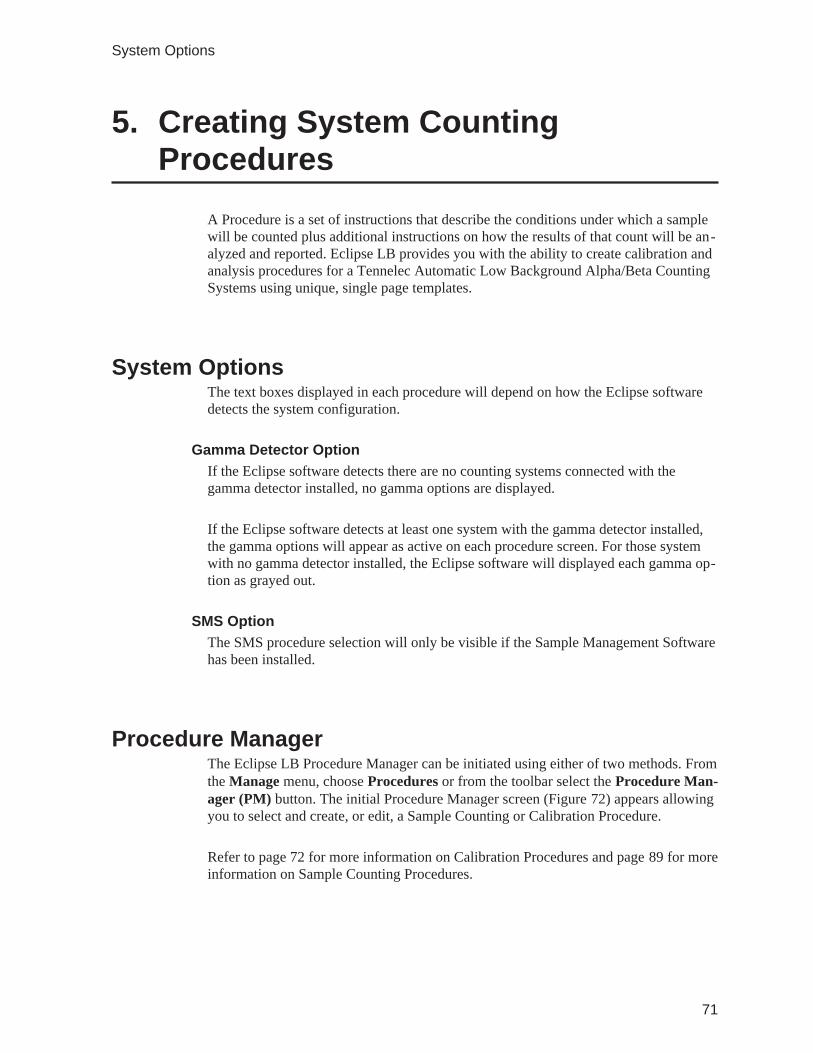
5. Creating System CountingProcedures
A Procedure is a set of instructions that describe the conditions under which a samplewill be counted plus additional instructions on how the results of that count will be an-alyzed and reported. Eclipse LB provides you with the ability to create calibration andanalysis procedures for a Tennelec Automatic Low Background Alpha/Beta CountingSystems using unique, single page templates.
System OptionsThe text boxes displayed in each procedure will depend on how the Eclipse softwaredetects the system configuration.
Gamma Detector OptionIf the Eclipse software detects there are no counting systems connected with thegamma detector installed, no gamma options are displayed.
If the Eclipse software detects at least one system with the gamma detector installed,the gamma options will appear as active on each procedure screen. For those systemwith no gamma detector installed, the Eclipse software will displayed each gamma op-tion as grayed out.
SMS OptionThe SMS procedure selection will only be visible if the Sample Management Softwarehas been installed.
Procedure ManagerThe Eclipse LB Procedure Manager can be initiated using either of two methods. Fromthe Manage menu, choose Procedures or from the toolbar select the Procedure Man-ager (PM) button. The initial Procedure Manager screen (Figure 72) appears allowingyou to select and create, or edit, a Sample Counting or Calibration Procedure.
Refer to page 72 for more information on Calibration Procedures and page 89 for moreinformation on Sample Counting Procedures.
71
System Options
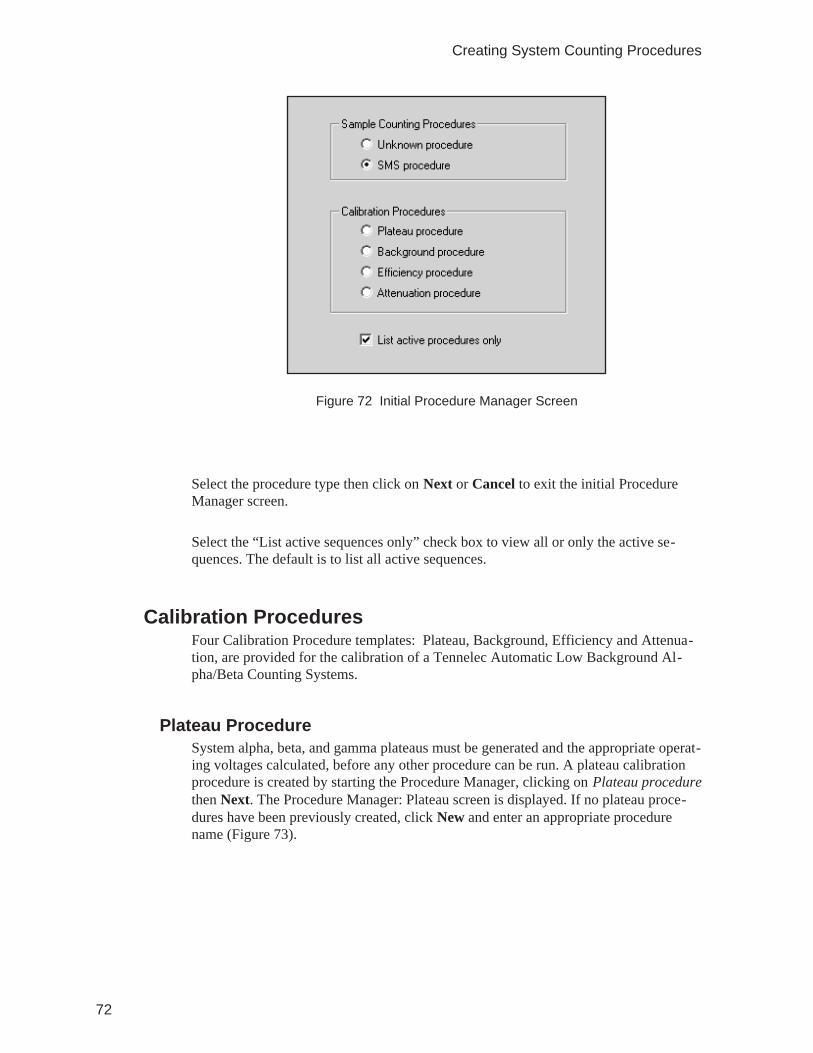
Select the procedure type then click on Next or Cancel to exit the initial ProcedureManager screen.
Select the “List active sequences only” check box to view all or only the active se-quences. The default is to list all active sequences.
Calibration ProceduresFour Calibration Procedure templates: Plateau, Background, Efficiency and Attenua-tion, are provided for the calibration of a Tennelec Automatic Low Background Al-pha/Beta Counting Systems.
Plateau ProcedureSystem alpha, beta, and gamma plateaus must be generated and the appropriate operat-ing voltages calculated, before any other procedure can be run. A plateau calibrationprocedure is created by starting the Procedure Manager, clicking on Plateau procedurethen Next. The Procedure Manager: Plateau screen is displayed. If no plateau proce-dures have been previously created, click New and enter an appropriate procedurename (Figure 73).
72
Creating System Counting Procedures
Figure 72 Initial Procedure Manager Screen
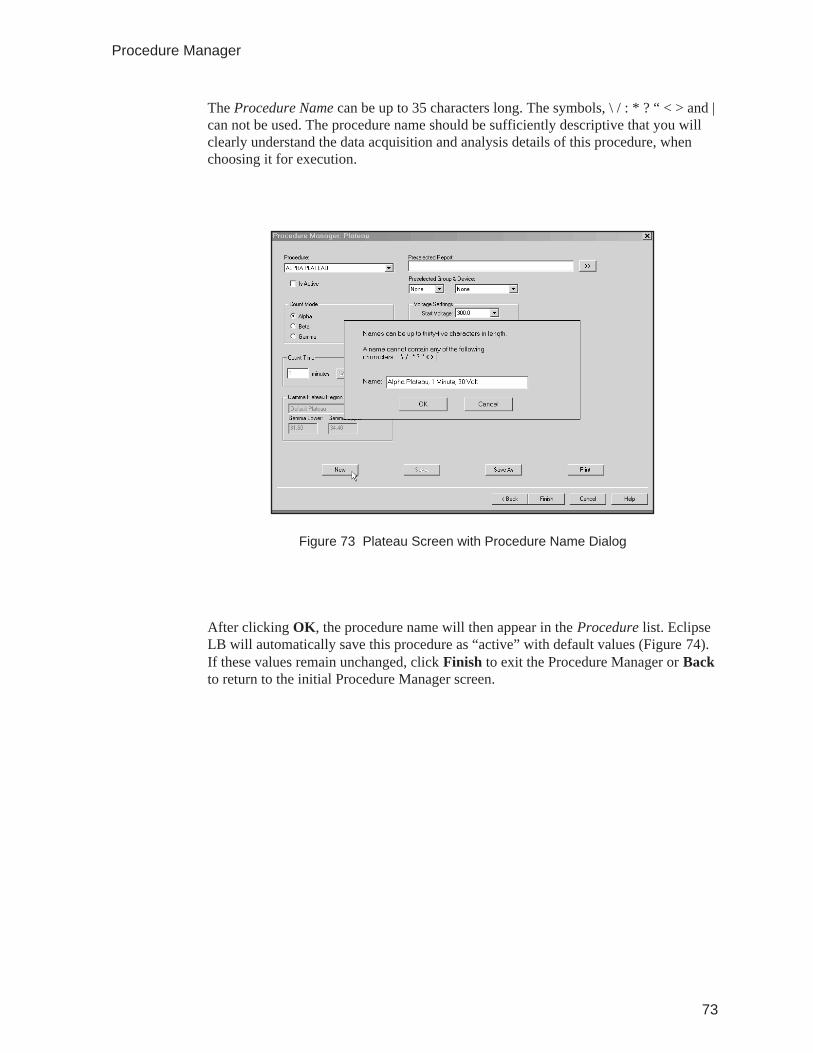
The Procedure Name can be up to 35 characters long. The symbols, \ / : * ? “ < > and |can not be used. The procedure name should be sufficiently descriptive that you willclearly understand the data acquisition and analysis details of this procedure, whenchoosing it for execution.
After clicking OK, the procedure name will then appear in the Procedure list. EclipseLB will automatically save this procedure as “active” with default values (Figure 74).If these values remain unchanged, click Finish to exit the Procedure Manager or Backto return to the initial Procedure Manager screen.
73
Procedure Manager
Figure 73 Plateau Screen with Procedure Name Dialog
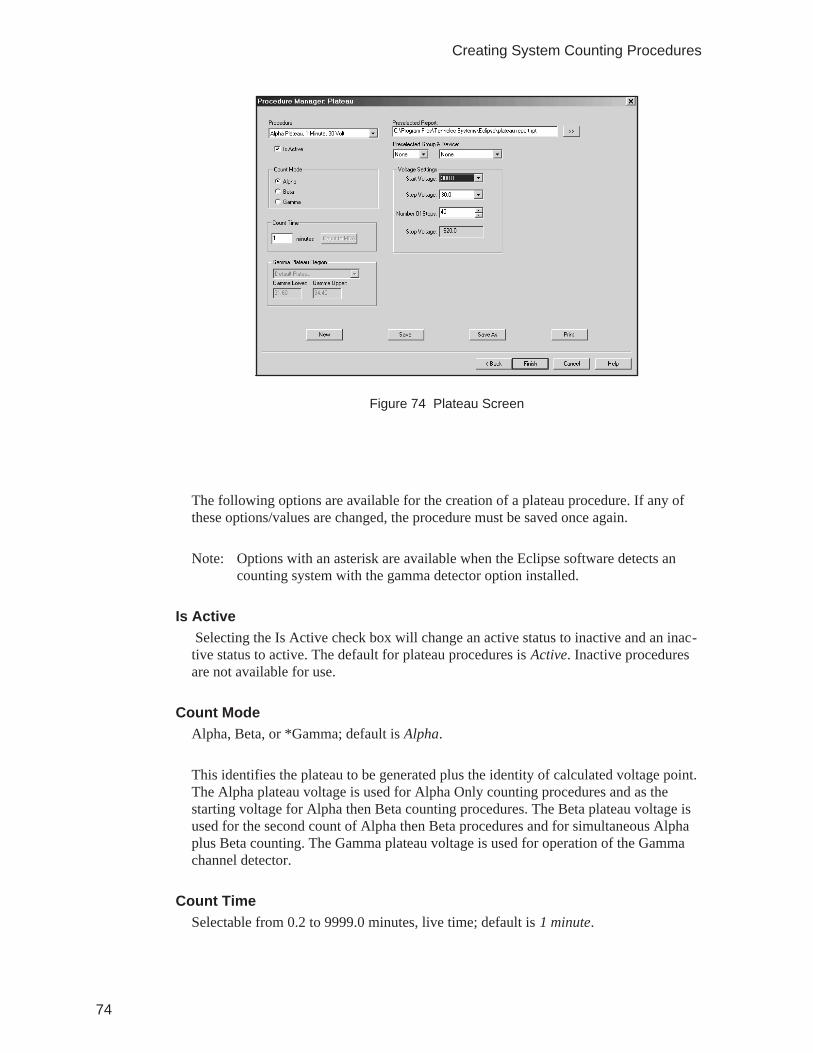
The following options are available for the creation of a plateau procedure. If any ofthese options/values are changed, the procedure must be saved once again.
Note: Options with an asterisk are available when the Eclipse software detects ancounting system with the gamma detector option installed.
Is ActiveSelecting the Is Active check box will change an active status to inactive and an inac-
tive status to active. The default for plateau procedures is Active. Inactive proceduresare not available for use.
Count ModeAlpha, Beta, or *Gamma; default is Alpha.
This identifies the plateau to be generated plus the identity of calculated voltage point.The Alpha plateau voltage is used for Alpha Only counting procedures and as thestarting voltage for Alpha then Beta counting procedures. The Beta plateau voltage isused for the second count of Alpha then Beta procedures and for simultaneous Alphaplus Beta counting. The Gamma plateau voltage is used for operation of the Gammachannel detector.
Count TimeSelectable from 0.2 to 9999.0 minutes, live time; default is 1 minute.
74
Creating System Counting Procedures
Figure 74 Plateau Screen
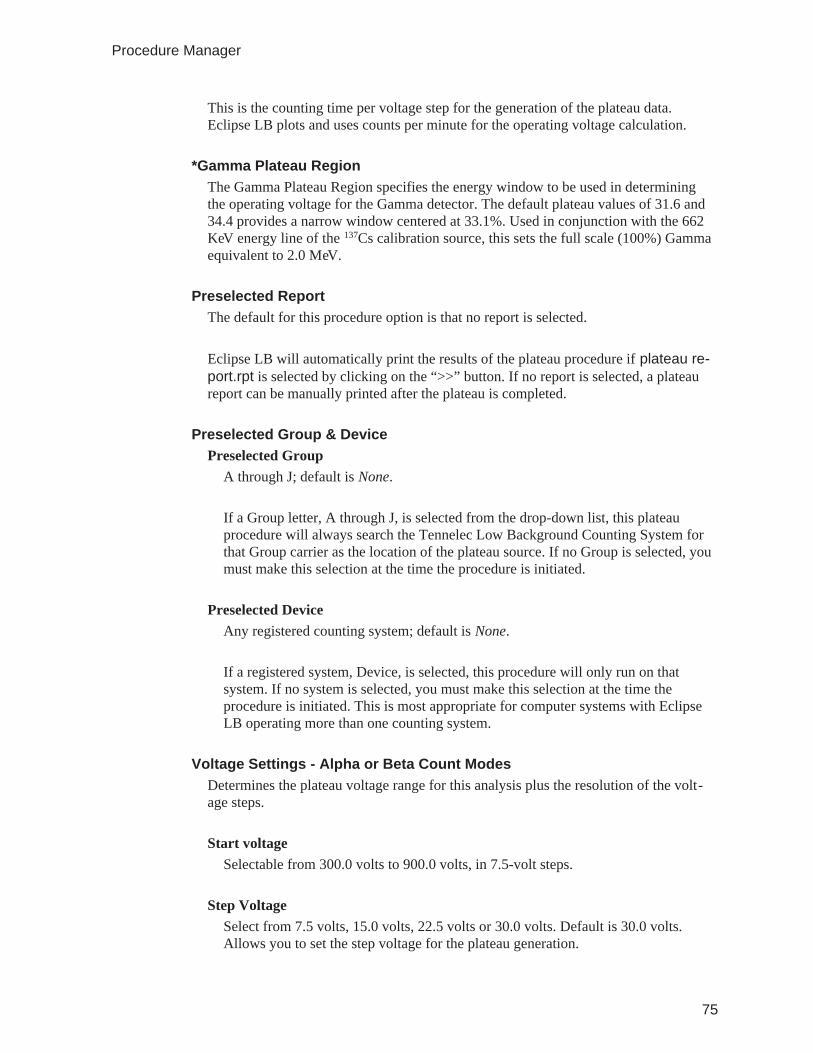
This is the counting time per voltage step for the generation of the plateau data.Eclipse LB plots and uses counts per minute for the operating voltage calculation.
*Gamma Plateau RegionThe Gamma Plateau Region specifies the energy window to be used in determiningthe operating voltage for the Gamma detector. The default plateau values of 31.6 and34.4 provides a narrow window centered at 33.1%. Used in conjunction with the 662KeV energy line of the 137Cs calibration source, this sets the full scale (100%) Gammaequivalent to 2.0 MeV.
Preselected ReportThe default for this procedure option is that no report is selected.
Eclipse LB will automatically print the results of the plateau procedure if plateau re-port.rpt is selected by clicking on the “>>” button. If no report is selected, a plateaureport can be manually printed after the plateau is completed.
Preselected Group & DevicePreselected Group
A through J; default is None.
If a Group letter, A through J, is selected from the drop-down list, this plateauprocedure will always search the Tennelec Low Background Counting System forthat Group carrier as the location of the plateau source. If no Group is selected, youmust make this selection at the time the procedure is initiated.
Preselected DeviceAny registered counting system; default is None.
If a registered system, Device, is selected, this procedure will only run on thatsystem. If no system is selected, you must make this selection at the time theprocedure is initiated. This is most appropriate for computer systems with EclipseLB operating more than one counting system.
Voltage Settings - Alpha or Beta Count ModesDetermines the plateau voltage range for this analysis plus the resolution of the volt-age steps.
Start voltageSelectable from 300.0 volts to 900.0 volts, in 7.5-volt steps.
Step VoltageSelect from 7.5 volts, 15.0 volts, 22.5 volts or 30.0 volts. Default is 30.0 volts.Allows you to set the step voltage for the plateau generation.
75
Procedure Manager
Number of StepsSelectable from 1 to 216 steps. Default is 45 steps.
Stop VoltageThe sum of the Start Voltage plus the Step Voltage times the number of Steps.
Note: Canberra does not recommend that the voltage applied to detectors made after1990 exceed 1650 volts. If an adjustment to the Start Voltage, Step Voltage orNumber of Steps results in a Stop Voltage in excess of 1650 volts, a warningwill be displayed when the procedure is saved.
*Voltage Settings - Gamma Count Mode:Determines the plateau voltage range for this analysis plus the resolution of the volt-age steps.
Start voltageSelectable from 450.0 volts to 999.0 volts, in 4.5-volt steps.
Step VoltageSelect from 4.5 volts, 9.0 volts, 13.5 volts or 18.0 volts. Default is 4.5 volts. Allowsyou to set the step voltage for the plateau generation.
Number of StepsSelectable from 1 to 156 steps. Default is 43 steps.
Stop VoltageThe sum of the Start Voltage plus the Step Voltage times the number of Steps. Themaximum Stop Voltage is 1147.5 volts.
Once all of the selections have been made, click Save to save this procedure or save itunder another name using the Save As button. This process may be repeated to pre-pare all of the plateau calibration procedures needed. Once this is done, click Finish toexit Procedure Manager or Back to return to the initial Procedure Manager screen.
Background ProcedureIf unknown sample analysis results are to be corrected for system background, theTennelec Low Background Counting System must be calibrated to determine the al-pha, beta, and gamma backgrounds.
A background calibration procedure is created by starting the Procedure Manager,clicking on Background procedure then Next. The Procedure Manager: Backgroundscreen is displayed. If no background procedures have been previously created, clickNew and enter an appropriate procedure name (Figure 75).
76
Creating System Counting Procedures
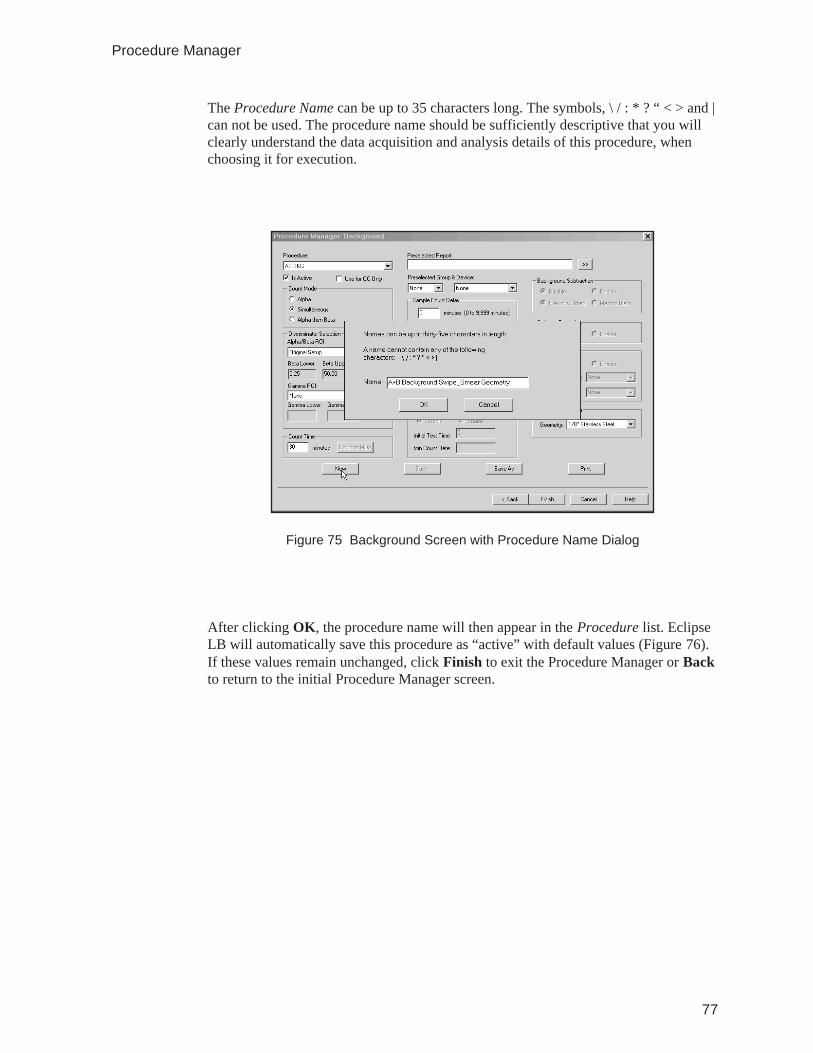
The Procedure Name can be up to 35 characters long. The symbols, \ / : * ? “ < > and |can not be used. The procedure name should be sufficiently descriptive that you willclearly understand the data acquisition and analysis details of this procedure, whenchoosing it for execution.
After clicking OK, the procedure name will then appear in the Procedure list. EclipseLB will automatically save this procedure as “active” with default values (Figure 76).If these values remain unchanged, click Finish to exit the Procedure Manager or Backto return to the initial Procedure Manager screen.
77
Procedure Manager
Figure 75 Background Screen with Procedure Name Dialog
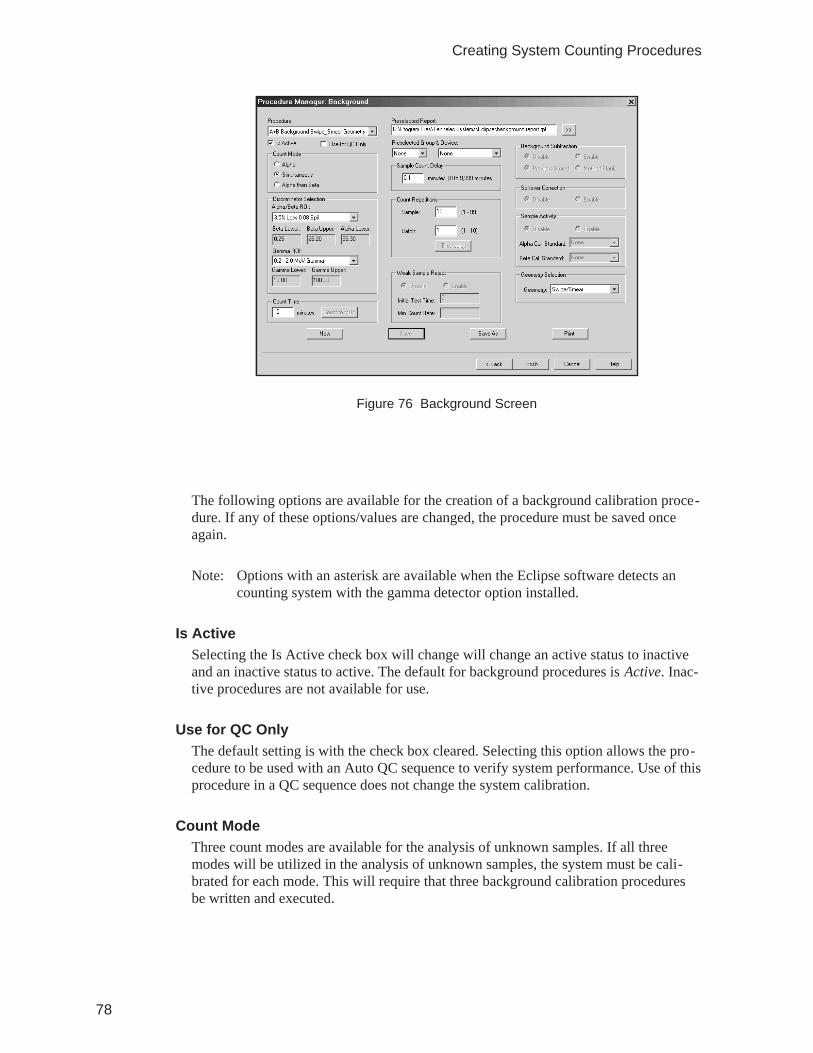
The following options are available for the creation of a background calibration proce-dure. If any of these options/values are changed, the procedure must be saved onceagain.
Note: Options with an asterisk are available when the Eclipse software detects ancounting system with the gamma detector option installed.
Is ActiveSelecting the Is Active check box will change will change an active status to inactiveand an inactive status to active. The default for background procedures is Active. Inac-tive procedures are not available for use.
Use for QC OnlyThe default setting is with the check box cleared. Selecting this option allows the pro-cedure to be used with an Auto QC sequence to verify system performance. Use of thisprocedure in a QC sequence does not change the system calibration.
Count ModeThree count modes are available for the analysis of unknown samples. If all threemodes will be utilized in the analysis of unknown samples, the system must be cali-brated for each mode. This will require that three background calibration proceduresbe written and executed.
78
Creating System Counting Procedures
Figure 76 Background Screen
AlphaThe Alpha (alpha only) Count Mode sets the system high voltage to the alphaplateau voltage. At this voltage, the proportional counter is only sensitive to alpharadiation.
SimultaneousThe simultaneous count mode sets the system high voltage to the beta plateauvoltage. At this voltage, the proportional counter is sensitive to all ionizingradiation and the separation of alpha and beta particles is accomplished using pulseheight.
Alpha then BetaIn the alpha then beta mode of operation the sample is counted twice; first at thealpha only voltage and then at the simultaneous voltage. The simultaneous voltagecounts are then corrected for the alpha only voltage counts.
ROI Discriminator SelectionAlpha/Beta ROI
Active only for the Simultaneous Count Mode, this selection uses previouslydetermined amplifier settings for the separation of alpha and beta particles. See“Alpha/Beta Amplifier Discriminator Adjustment” on page 53 for a description ofthe amplifier setup discriminator settings. Default settings for Alpha Only andAlpha then Beta modes can not be changed.
*Gamma ROIThis selection specifies the energy window of the gamma counting channel. Thegamma counting channel operation is independent of the Alpha/Beta channel. See“Gamma Amplifier Discriminator Adjustment” on page 56 for more details.
Count Time0.2 to 9999.0 minutes, live time; default is 1 minute.
Preselected ReportThe default for this procedure option is that no report is selected.
Eclipse LB will automatically print the results of the background procedure if back-ground report.rpt is selected. Make this selection by clicking on the “>>” button. Ifno report is selected, a background report can be manually printed after the analysis iscompleted.
Pre-selected Group & DevicePreselected Group
A through J; default is None.
79
Procedure Manager
If a Group letter, A through J, is selected from the drop-down list, this backgroundprocedure will always search the Tennelec Low Background Counting System forthat Group carrier as the location of the background blank. If no Group is selected,you must make this selection at the time the procedure is initiated.
Preselected DeviceAny registered counting system; default is None.
If a registered system, Device, is selected, this procedure will only run on thatsystem. If no system is selected, you must make this selection at the time theprocedure is initiated. This is most appropriate for computer systems with EclipseLB operating more than one counting system.
Sample Count DelayAny registered counting system; default is None. Selectable from 0 to 9999minutes.
The delay time between counting intervals. If a value other than “0” is entered, thesystem will count the sample for the selected Count Time, wait for the amount oftime selected for the Sample Count Delay and then count the sample again, for thenumber of Count Repetitions selected.
Count RepetitionsSample
Selectable from 1 to 99; default is “1”.
This is the number of times a sample will be counted for the selected Count Timebefore the next sample is inserted for analysis.
BatchSelectable from 1 to 10; default is “1”.
This is the number of times a Batch (Group) of samples will be counted before thesystem proceeds to another Group or Batch of samples. Note: This option requiresfirmware version 2.06 or higher.
Geometry SelectionJust as for Count Mode, if multiple geometries will be used in the analysis of unknownsamples, the system must be background calibrated for each of those geometries. Fromthe Geometry list choose: 1/8” Stainless Steel, ¼” Stainless Steel, 5/16” StainlessSteel, Daily, or Swipe/Smear. Separate procedures must be created for backgroundcalibrations for each geometry selection required.
80
Creating System Counting Procedures
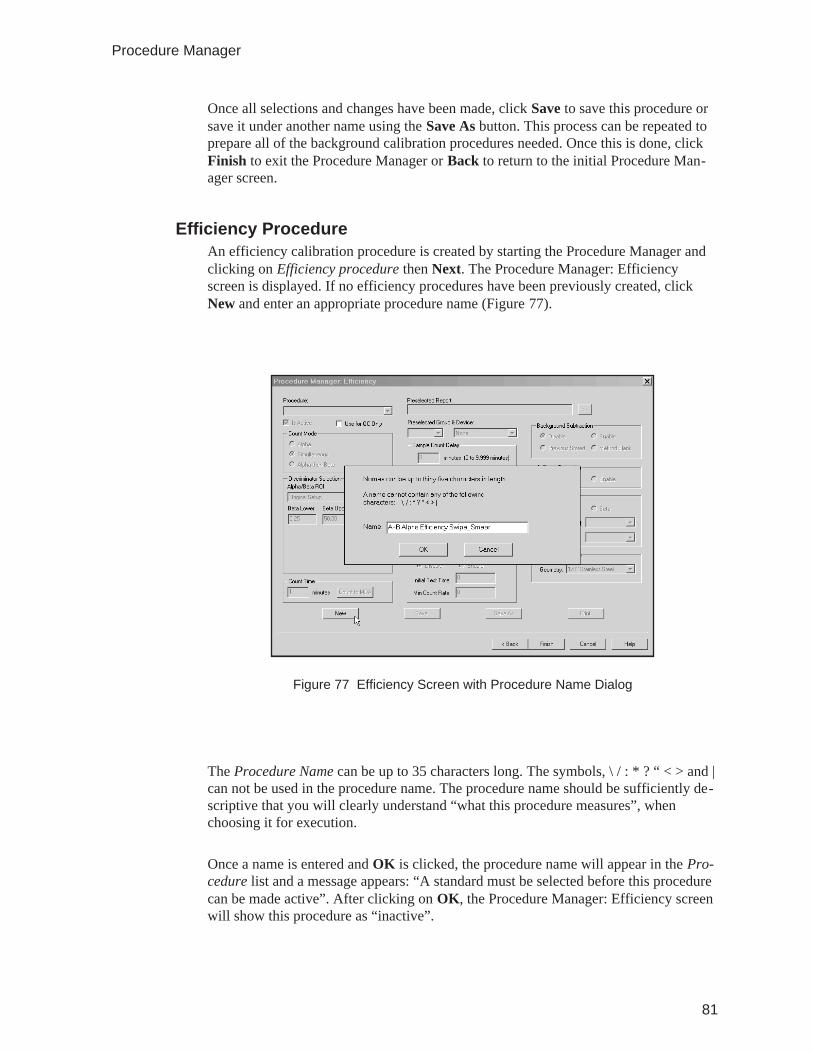
Once all selections and changes have been made, click Save to save this procedure orsave it under another name using the Save As button. This process can be repeated toprepare all of the background calibration procedures needed. Once this is done, clickFinish to exit the Procedure Manager or Back to return to the initial Procedure Man-ager screen.
Efficiency ProcedureAn efficiency calibration procedure is created by starting the Procedure Manager andclicking on Efficiency procedure then Next. The Procedure Manager: Efficiencyscreen is displayed. If no efficiency procedures have been previously created, clickNew and enter an appropriate procedure name (Figure 77).
The Procedure Name can be up to 35 characters long. The symbols, \ / : * ? “ < > and |can not be used in the procedure name. The procedure name should be sufficiently de-scriptive that you will clearly understand “what this procedure measures”, whenchoosing it for execution.
Once a name is entered and OK is clicked, the procedure name will appear in the Pro-cedure list and a message appears: “A standard must be selected before this procedurecan be made active”. After clicking on OK, the Procedure Manager: Efficiency screenwill show this procedure as “inactive”.
81
Procedure Manager
Figure 77 Efficiency Screen with Procedure Name Dialog
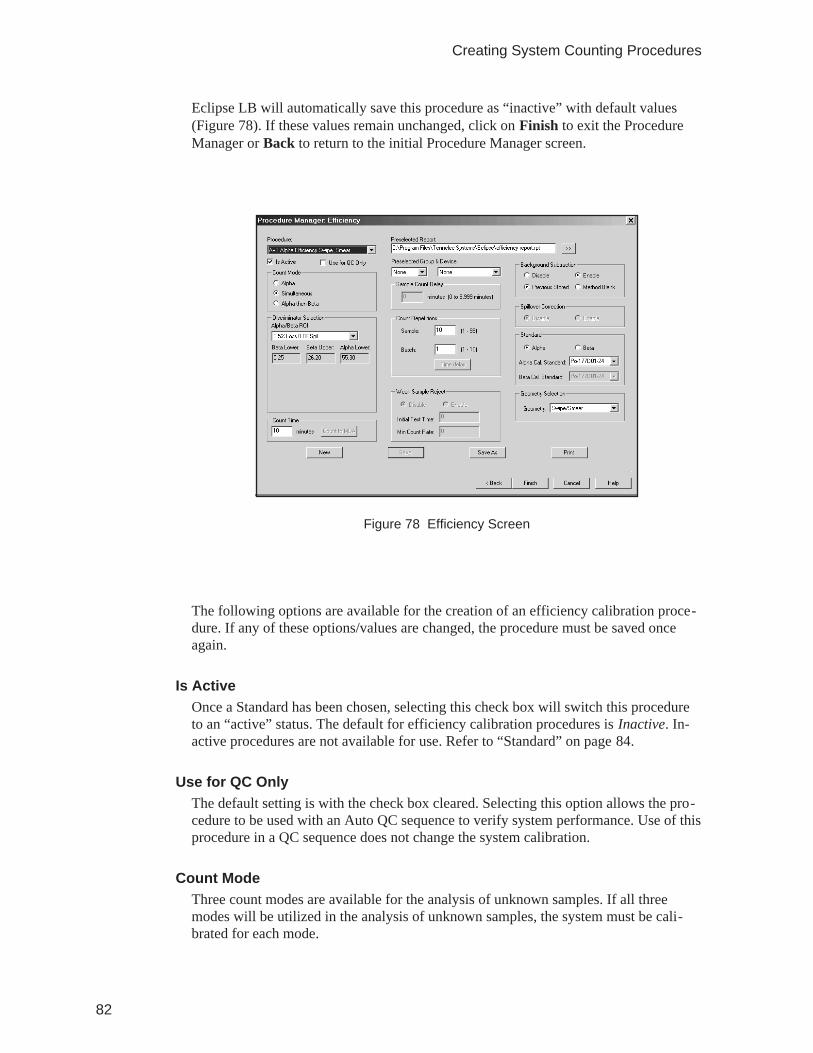
Eclipse LB will automatically save this procedure as “inactive” with default values(Figure 78). If these values remain unchanged, click on Finish to exit the ProcedureManager or Back to return to the initial Procedure Manager screen.
The following options are available for the creation of an efficiency calibration proce-dure. If any of these options/values are changed, the procedure must be saved onceagain.
Is ActiveOnce a Standard has been chosen, selecting this check box will switch this procedureto an “active” status. The default for efficiency calibration procedures is Inactive. In-active procedures are not available for use. Refer to “Standard” on page 84.
Use for QC OnlyThe default setting is with the check box cleared. Selecting this option allows the pro-cedure to be used with an Auto QC sequence to verify system performance. Use of thisprocedure in a QC sequence does not change the system calibration.
Count ModeThree count modes are available for the analysis of unknown samples. If all threemodes will be utilized in the analysis of unknown samples, the system must be cali-brated for each mode.
82
Creating System Counting Procedures
Figure 78 Efficiency Screen
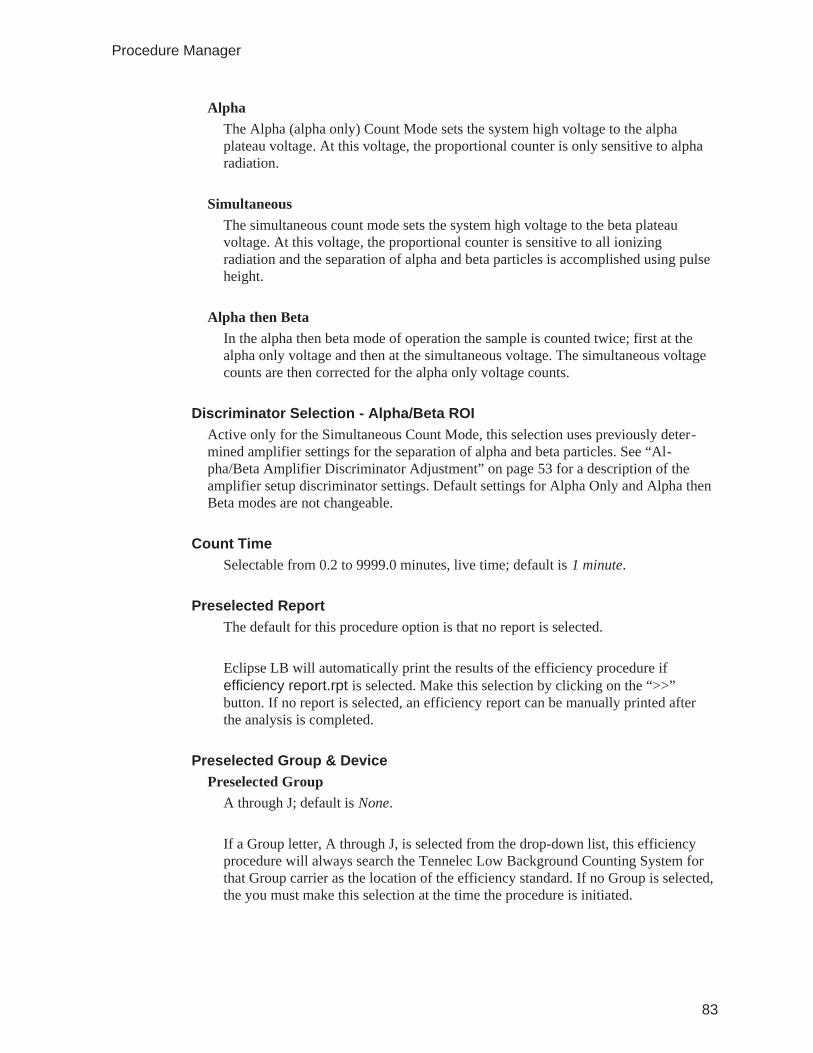
AlphaThe Alpha (alpha only) Count Mode sets the system high voltage to the alphaplateau voltage. At this voltage, the proportional counter is only sensitive to alpharadiation.
SimultaneousThe simultaneous count mode sets the system high voltage to the beta plateauvoltage. At this voltage, the proportional counter is sensitive to all ionizingradiation and the separation of alpha and beta particles is accomplished using pulseheight.
Alpha then BetaIn the alpha then beta mode of operation the sample is counted twice; first at thealpha only voltage and then at the simultaneous voltage. The simultaneous voltagecounts are then corrected for the alpha only voltage counts.
Discriminator Selection - Alpha/Beta ROIActive only for the Simultaneous Count Mode, this selection uses previously deter-mined amplifier settings for the separation of alpha and beta particles. See “Al-pha/Beta Amplifier Discriminator Adjustment” on page 53 for a description of theamplifier setup discriminator settings. Default settings for Alpha Only and Alpha thenBeta modes are not changeable.
Count TimeSelectable from 0.2 to 9999.0 minutes, live time; default is 1 minute.
Preselected ReportThe default for this procedure option is that no report is selected.
Eclipse LB will automatically print the results of the efficiency procedure ifefficiency report.rpt is selected. Make this selection by clicking on the “>>”button. If no report is selected, an efficiency report can be manually printed afterthe analysis is completed.
Preselected Group & DevicePreselected Group
A through J; default is None.
If a Group letter, A through J, is selected from the drop-down list, this efficiencyprocedure will always search the Tennelec Low Background Counting System forthat Group carrier as the location of the efficiency standard. If no Group is selected,the you must make this selection at the time the procedure is initiated.
83
Procedure Manager
Preselected DeviceAny registered counting system; default is None.
If a registered system, Device, is selected, this procedure will only run on thatsystem. If no system is selected, you must make this selection at the time theprocedure is initiated. This is most appropriate for computer systems with EclipseLB operating more than one counting system.
Count RepetitionsSample
Selectable from 1 to 99; default is “1”.
This is the number of times a sample will be counted for the selected Count Timebefore the next sample is inserted for analysis.
BatchSelectable from 1 to 10; default is “1”.
This is the number of times a Batch (Group) of samples will be counted before thesystem proceeds to another Group or Batch of samples. Note: This option requiresfirmware version 2.06 or higher.
Background SubtractionDisable or Enable; default is Disable.
Select Enable to correct the efficiency data results for background or Disable toignore the contribution of background to the efficiency results.
StandardSelect Alpha or Beta
Every efficiency calibration procedure must have a standard selected before it canbe stored as “active”. For procedures that are created for Alpha only count mode,only the Alpha option is active. For Simultaneous and Alpha then Beta countmodes, both the alpha and the beta options are active for selection. If an appropriatestandard has not yet been entered into the Standards and Nuclides database theefficiency calibration procedure can only be saved as inactive. See “EnteringCalibration Standards” on page 42. It can be recalled by clearing the “List activeprocedures only” check box on the initial Procedure Manager screen and updated toinclude a standard at a later time.
Geometry SelectionJust as for Count Mode, if multiple geometries will be used in the analysis ofunknown samples, the system must be efficiency calibrated for each of those
84
Creating System Counting Procedures
geometries. From the Geometry list choose: 1/8” Stainless Steel, ¼” Stainless Steel,5/16” Stainless Steel, Daily, or Swipe/Smear. Separate procedures must be createdfor efficiency calibrations for each geometry selection required.
Once all selections and changes have been made, click on Save to save this procedureor save it under another name using the Save As button. This process can be repeatedto prepare all of the efficiency calibration procedures needed. Once this is done, clickFinish to exit the Procedure Manager or Back to return to the initial Procedure Man-ager screen.
Attenuation ProcedureAn attenuation efficiency procedure is used to calibrate a Tennelec Automatic LowBackground Alpha/Beta Counting System for the absorption effects of sample mass onthe sensitivity, efficiency, of the system.
An attenuation calibration procedure is created by starting the Procedure Manager andclicking on Attenuation procedure then Next. The Procedure Manager: Attenuationscreen is displayed. If no attenuation procedures have been previously created, clickon New and enter an appropriate procedure name (Figure 79).
85
Procedure Manager
Figure 79 Attenuation Screen with Procedure Name Dialog
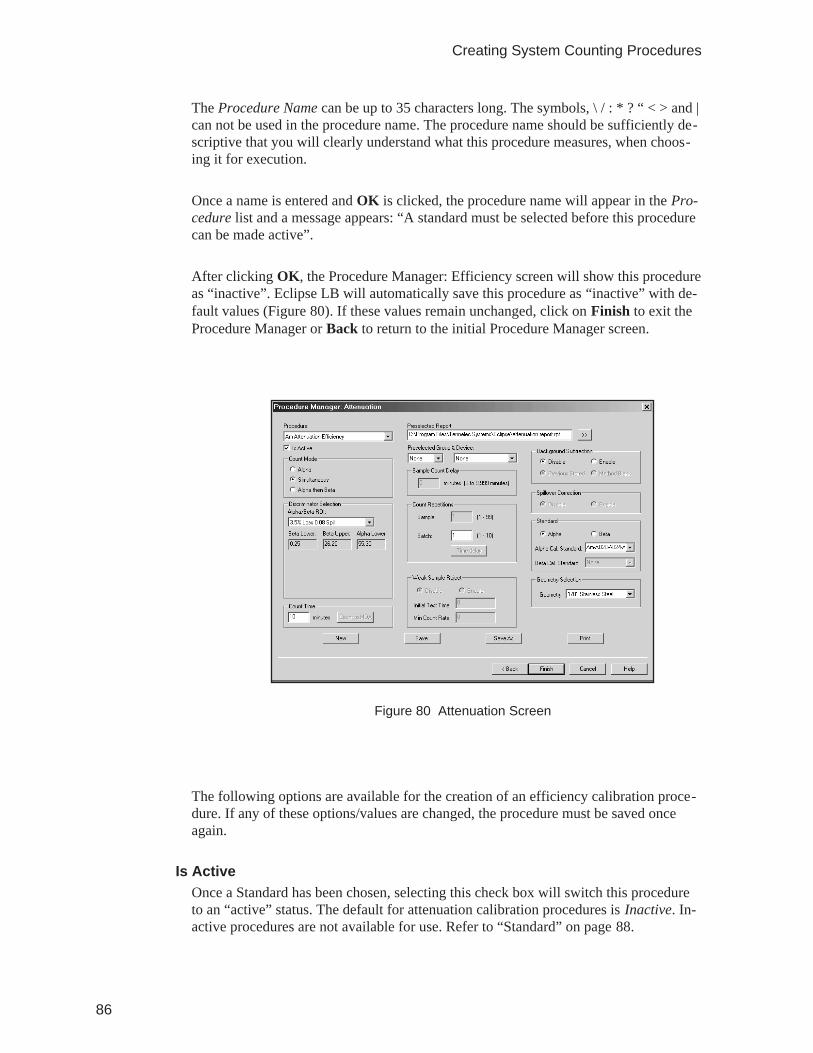
The Procedure Name can be up to 35 characters long. The symbols, \ / : * ? “ < > and |can not be used in the procedure name. The procedure name should be sufficiently de-scriptive that you will clearly understand what this procedure measures, when choos-ing it for execution.
Once a name is entered and OK is clicked, the procedure name will appear in the Pro-cedure list and a message appears: “A standard must be selected before this procedurecan be made active”.
After clicking OK, the Procedure Manager: Efficiency screen will show this procedureas “inactive”. Eclipse LB will automatically save this procedure as “inactive” with de-fault values (Figure 80). If these values remain unchanged, click on Finish to exit theProcedure Manager or Back to return to the initial Procedure Manager screen.
The following options are available for the creation of an efficiency calibration proce-dure. If any of these options/values are changed, the procedure must be saved onceagain.
Is ActiveOnce a Standard has been chosen, selecting this check box will switch this procedureto an “active” status. The default for attenuation calibration procedures is Inactive. In-active procedures are not available for use. Refer to “Standard” on page 88.
86
Creating System Counting Procedures
Figure 80 Attenuation Screen
Count ModeThree count modes are available for the analysis of unknown samples. If all threemodes will be utilized in the analysis of unknown samples, the system must be cali-brated for each mode.
AlphaThe Alpha (alpha only) Count Mode sets the system high voltage to the alphaplateau voltage. At this voltage, the proportional counter is only sensitive to alpharadiation.
SimultaneousThe simultaneous count mode sets the system high voltage to the beta plateauvoltage. At this voltage, the proportional counter is sensitive to all ionizingradiation and the separation of alpha and beta particles is accomplished using pulseheight.
Alpha then BetaIn the alpha then beta mode of operation the sample is counted twice; first at thealpha only voltage and then at the simultaneous voltage. The simultaneous voltagecounts are then corrected for the alpha only voltage counts.
Discriminator Selection - Alpha/Beta ROIActive only for the Simultaneous Count Mode, this selection uses previously deter-mined amplifier settings for the separation of alpha and beta particles. See “Al-pha/Beta Amplifier Discriminator Adjustment” on page 53 for a description of theamplifier setup discriminator settings. Default settings for Alpha Only and Alpha thenBeta modes are not changeable.
Count TimeSelectable from 0.2 to 9999.0 minutes, live time; default is 1 minute.
Preselected ReportThe default for this procedure option is that no report is selected.
Eclipse LB will automatically print the results of the attenuation procedure if attenua-tion report.rpt is selected. Make this selection by clicking on the “>>” button. If noreport is selected, an attenuation report can be manually printed after the analysis iscompleted.
Preselected Group & DevicePreselected Group
A through J; default is None.
87
Procedure Manager
If a Group letter, A through J, is selected from the drop-down list, this attenuationprocedure will always search the Tennelec Low Background Counting System forthat Group carrier as the location of the efficiency standard. If no Group is selected,you must make this selection at the time the procedure is initiated.
Preselected DeviceAny registered counting system; default is None.
If a registered system, Device, is selected, this procedure will only run on thatsystem. If no system is selected, you must make this selection at the time theprocedure is initiated. This is most appropriate for computer systems with EclipseLB operating more than one counting system.
Count Repetitions - BatchSelectable from 1 to 10; default is “1”.
This is the number of times a Batch (Group) of samples will be counted before the sys-tem proceeds to another Group or Batch of samples. Note: This option requires firm-ware version 2.06 or higher.
Background SubtractionDisable or Enable; default is Disable.
Select Enable to correct the efficiency data results for background or Disable to ignorethe contribution of background to the efficiency results.
Standard – Alpha or BetaEvery attenuation calibration procedure must have a standard selected before it can bestored as “active”. For procedures that are created for Alpha only count mode, only theAlpha option is active. For Simultaneous and Alpha then Beta count modes, both thealpha and the beta options are active for selection. If an appropriate standard has notyet been entered into the Standards and Nuclides database the attenuation calibrationprocedure can only be saved as inactive. See “Entering Calibration Standards” on page42. It can be recalled by clearing the “List active procedures only” option of the initialProcedure Manager screen and updated to include a standard at a later time.
Geometry SelectionJust as for Count Mode, if multiple geometries will be used in the analysis of unknownsamples, the system must be attenuation calibrated for each of those geometries. Fromthe Geometry list choose: 1/8” Stainless Steel, ¼” Stainless Steel, 5/16” StainlessSteel, Daily, or Swipe/Smear. Separate procedures must be created for attenuation cal-ibrations for each geometry selection required.
88
Creating System Counting Procedures
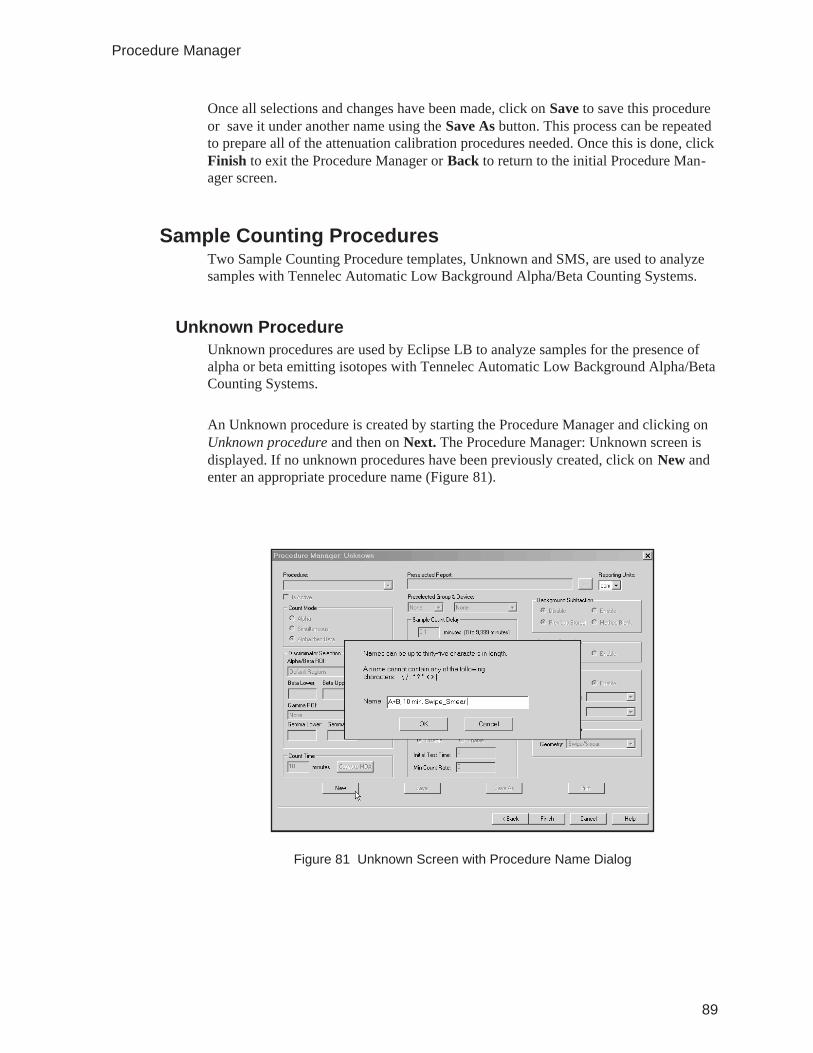
Once all selections and changes have been made, click on Save to save this procedureor save it under another name using the Save As button. This process can be repeatedto prepare all of the attenuation calibration procedures needed. Once this is done, clickFinish to exit the Procedure Manager or Back to return to the initial Procedure Man-ager screen.
Sample Counting ProceduresTwo Sample Counting Procedure templates, Unknown and SMS, are used to analyzesamples with Tennelec Automatic Low Background Alpha/Beta Counting Systems.
Unknown ProcedureUnknown procedures are used by Eclipse LB to analyze samples for the presence ofalpha or beta emitting isotopes with Tennelec Automatic Low Background Alpha/BetaCounting Systems.
An Unknown procedure is created by starting the Procedure Manager and clicking onUnknown procedure and then on Next. The Procedure Manager: Unknown screen isdisplayed. If no unknown procedures have been previously created, click on New andenter an appropriate procedure name (Figure 81).
89
Procedure Manager
Figure 81 Unknown Screen with Procedure Name Dialog
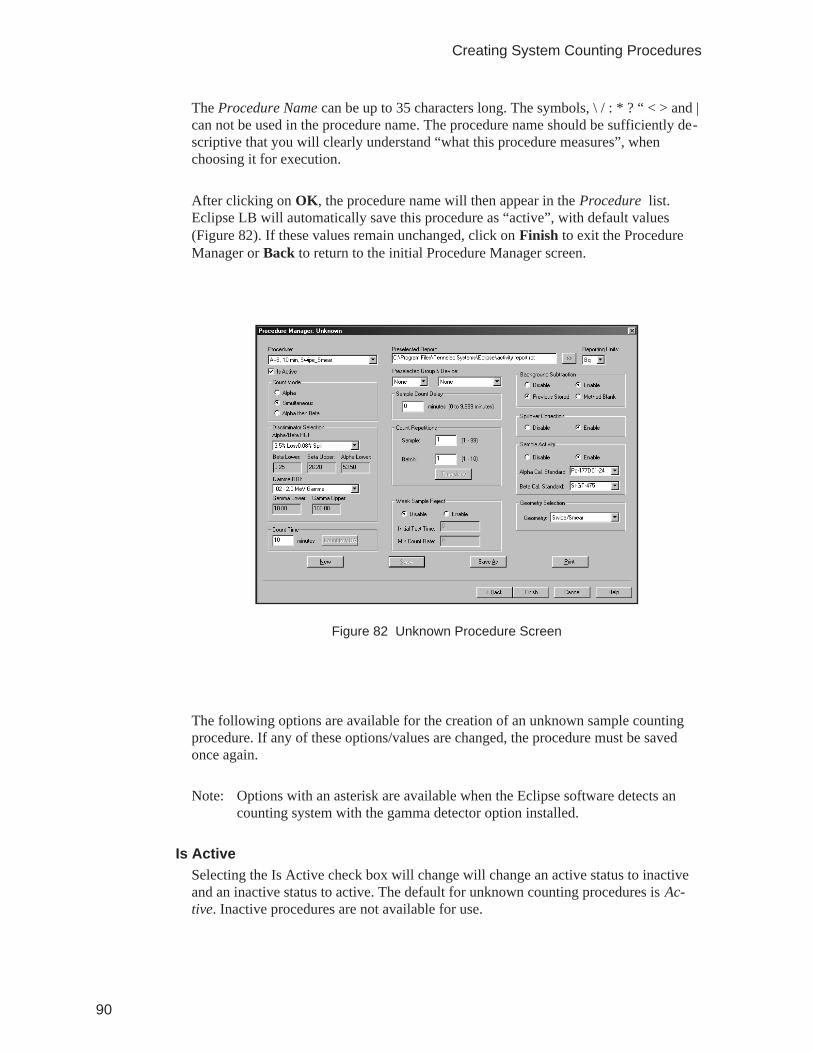
The Procedure Name can be up to 35 characters long. The symbols, \ / : * ? “ < > and |can not be used in the procedure name. The procedure name should be sufficiently de-scriptive that you will clearly understand “what this procedure measures”, whenchoosing it for execution.
After clicking on OK, the procedure name will then appear in the Procedure list.Eclipse LB will automatically save this procedure as “active”, with default values(Figure 82). If these values remain unchanged, click on Finish to exit the ProcedureManager or Back to return to the initial Procedure Manager screen.
The following options are available for the creation of an unknown sample countingprocedure. If any of these options/values are changed, the procedure must be savedonce again.
Note: Options with an asterisk are available when the Eclipse software detects ancounting system with the gamma detector option installed.
Is ActiveSelecting the Is Active check box will change will change an active status to inactiveand an inactive status to active. The default for unknown counting procedures is Ac-tive. Inactive procedures are not available for use.
90
Creating System Counting Procedures
Figure 82 Unknown Procedure Screen
Count ModeThree count modes are available for the analysis of unknown samples. When selectinga Count Mode, be certain that the system has been previously calibrated for that mode.
AlphaThe Alpha (alpha only) Count Mode sets the system high voltage to the alphaplateau voltage. At this voltage, the proportional counter is only sensitive to alpharadiation.
SimultaneousThe simultaneous count mode sets the system high voltage to the beta plateauvoltage. At this voltage, the proportional counter is sensitive to all ionizingradiation and the separation of alpha and beta particles is accomplished using pulseheight.
Alpha then BetaIn the alpha then beta mode of operation the sample is counted twice; first at thealpha only voltage and then at the simultaneous voltage. The simultaneous voltagecounts are then corrected for the alpha only voltage counts.
ROI Discriminator SelectionAlpha/Beta ROI
Active only for the Simultaneous Count Mode, this selection uses previouslydetermined amplifier settings for the separation of alpha and beta particles. See“Alpha/Beta Amplifier Discriminator Adjustment” on page 53 for a description ofthe amplifier setup discriminator settings. Default settings for Alpha Only andAlpha then Beta modes are not changeable.
*Gamma ROIThis selection specifies the energy window of the gamma counting channel. Thegamma counting channel operation is independent of the Alpha/Beta channel. See“Gamma Amplifier Discriminator Adjustment” on page 56 for more details.
Count TimeSelectable from 0.2 to 9999.0 minutes, live time; default is 1 minute.
Preselected ReportThe default for this procedure option is that no report is selected.
Eclipse LB will automatically print the results of this unknown sample counting proce-dure if an appropriate report is selected. Make this selection by clicking on the “>>”button. If no report is selected, a report can be manually printed after the analysis iscompleted.
91
Procedure Manager
Reporting Units
Select from Bq (Bequerels), dpm (disintegrations per minute), pC (picocuries), or µCi(microcuries). When activity report is selected, sample activity will be reported in theunits selected.
Preselected Group & DevicePreselected Group
A through J; default is None.
If a Group letter, A through J, is selected from the drop-down list, this unknownsample counting procedure will always search the Tennelec Low BackgroundCounting System for that Group carrier as the location of the unknown samples. Ifno Group is selected, you must make this selection at the time the procedure isinitiated.
Preselected DeviceAny registered counting system; default is None.
If a registered system, Device, is selected, this procedure will only run on thatsystem. If no system is selected, you must make this selection at the time theprocedure is initiated. This is most appropriate for computer systems with EclipseLB operating more than one counting system.
Sample Count DelaySelectable from 0 to 9999 minutes.
The delay time between counting intervals. If a value other than “0” is entered, thesystem will count the sample for the selected Count Time, wait for the amount oftime selected for the Sample Count Delay and then count the sample again, for thenumber of Count Repetitions selected.
Count RepetitionsSample
Selectable from 1 to 99; default is “1”.
This is the number of times a sample will be counted for the selected Count Timebefore the next sample is inserted for analysis.
BatchSelectable from 1 to 10; default is “1”.
This is the number of times a Batch (Group) of samples will be counted before thesystem proceeds to another Group or Batch of samples. Note: This option requiresfirmware version 2.06 or higher.
92
Creating System Counting Procedures
Weak Sample RejectDisable or Enable
This option can be extremely valuable when counting large numbers of samples forlong counting times. Generally, a sample count is terminated when the presetcounting time is reached. This option allows you to terminate a count if less than aspecified number of counts, generally based on background, is acquired within aspecified amount of time. This option is not available for the Alpha then Beta CountMode.
Initial Test TimeEclipse LB will, at this preset time, evaluate the count rate and make a reject orcontinue decision.
Min Count RateIf this preset count rate, CPM, is equaled or exceeded within the Initial Test Time,Eclipse LB will continue counting until the Count Time is reached. If this count rateis not equaled, Eclipse LB will terminate the counting of this sample.
Background SubtractionDisable or EnableThe default is Disable. If Background Subtraction is enabled, Eclipse LB will auto-matically subtract background contributions from the acquired sample data. Two back-ground choices are provided.
Previously StoredEclipse LB subtracts the alpha, beta, and gamma background values that werepreviously determined in the calibration of the system.
Method BlankIf Method Blank is chosen, Eclipse LB will use the alpha, beta, and gamma resultsof the count of any sample within the Group (Batch) identified as the BackgroundBlank backgrounds and will subtract these results from the counts acquired from theremaining samples in that group. The sample to be used as the background blankcan be identified after all of the samples have been counted, by double clicking onthe Sample ID. It can also be identified, prior to the counting of the sample, usingthe Sample Manager. Refer to Chapter 8, Sample Manager.
Spillover CorrectionDisable or Enable, default is Disable.
When performing an efficiency calibration in the Simultaneous Count Mode, EclipseLB will determine the % of beta interactions that spillover and are stored as alphaevents plus the % of alpha interactions that spillover and are stored as beta events.This option is not available for the Alpha Only or the Alpha then Beta Count Modes.
93
Procedure Manager
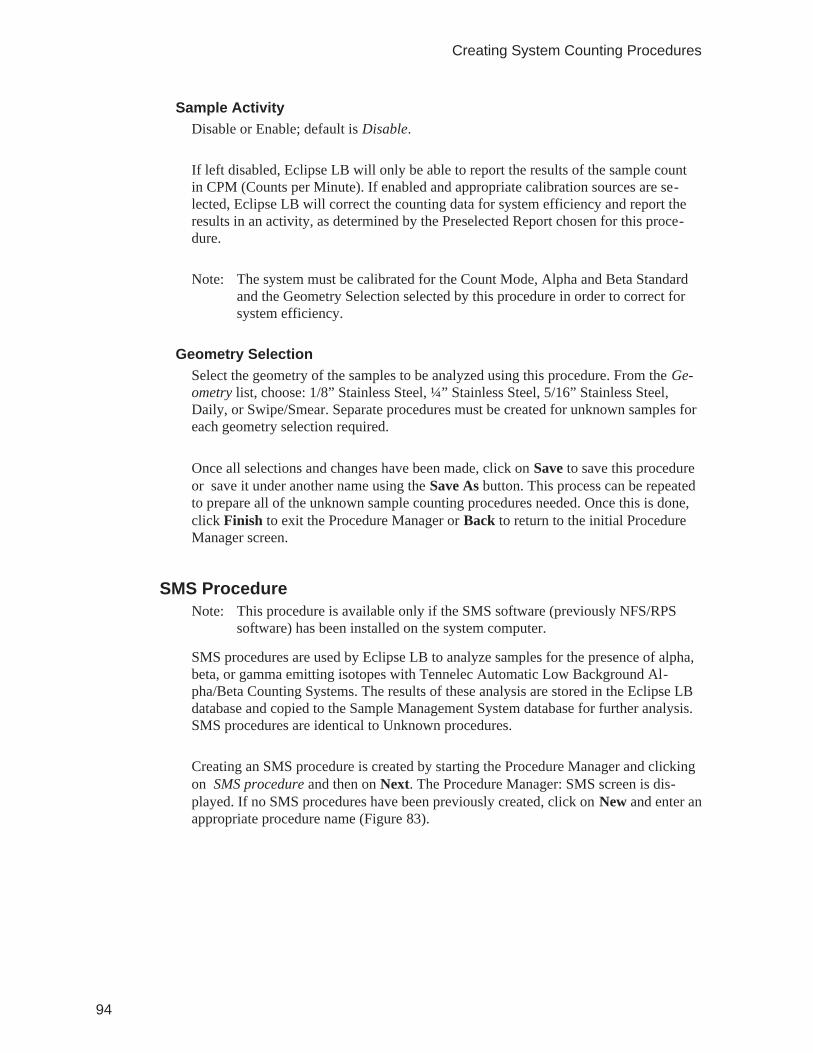
Sample ActivityDisable or Enable; default is Disable.
If left disabled, Eclipse LB will only be able to report the results of the sample countin CPM (Counts per Minute). If enabled and appropriate calibration sources are se-lected, Eclipse LB will correct the counting data for system efficiency and report theresults in an activity, as determined by the Preselected Report chosen for this proce-dure.
Note: The system must be calibrated for the Count Mode, Alpha and Beta Standardand the Geometry Selection selected by this procedure in order to correct forsystem efficiency.
Geometry SelectionSelect the geometry of the samples to be analyzed using this procedure. From the Ge-ometry list, choose: 1/8” Stainless Steel, ¼” Stainless Steel, 5/16” Stainless Steel,Daily, or Swipe/Smear. Separate procedures must be created for unknown samples foreach geometry selection required.
Once all selections and changes have been made, click on Save to save this procedureor save it under another name using the Save As button. This process can be repeatedto prepare all of the unknown sample counting procedures needed. Once this is done,click Finish to exit the Procedure Manager or Back to return to the initial ProcedureManager screen.
SMS ProcedureNote: This procedure is available only if the SMS software (previously NFS/RPS
software) has been installed on the system computer.
SMS procedures are used by Eclipse LB to analyze samples for the presence of alpha,beta, or gamma emitting isotopes with Tennelec Automatic Low Background Al-pha/Beta Counting Systems. The results of these analysis are stored in the Eclipse LBdatabase and copied to the Sample Management System database for further analysis.SMS procedures are identical to Unknown procedures.
Creating an SMS procedure is created by starting the Procedure Manager and clickingon SMS procedure and then on Next. The Procedure Manager: SMS screen is dis-played. If no SMS procedures have been previously created, click on New and enter anappropriate procedure name (Figure 83).
94
Creating System Counting Procedures
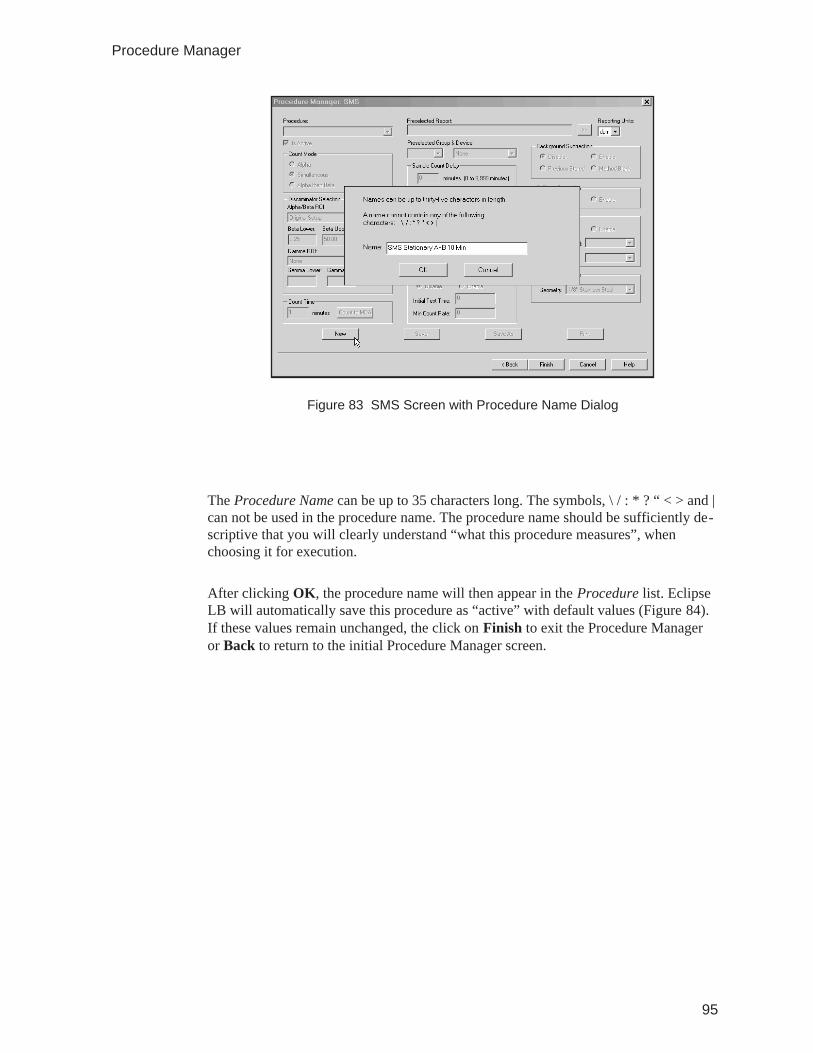
The Procedure Name can be up to 35 characters long. The symbols, \ / : * ? “ < > and |can not be used in the procedure name. The procedure name should be sufficiently de-scriptive that you will clearly understand “what this procedure measures”, whenchoosing it for execution.
After clicking OK, the procedure name will then appear in the Procedure list. EclipseLB will automatically save this procedure as “active” with default values (Figure 84).If these values remain unchanged, the click on Finish to exit the Procedure Manageror Back to return to the initial Procedure Manager screen.
95
Procedure Manager
Figure 83 SMS Screen with Procedure Name Dialog
The following options are available for the creation of an SMS sample counting proce-dure. If any of these options/values are changed, the procedure must be saved onceagain.
Note: Options with an asterisk are available when the Eclipse software detects ancounting system with the gamma detector option installed.
Is ActiveSelecting the Is Active check box will change will change an active status to inactiveand an inactive status to active. The default for SMS counting procedures is Active. In-active procedures are not available for use.
Count ModeThree count modes are available for the analysis of unknown samples. When selectinga Count Mode, be certain that the system has been previously calibrated for that mode.
AlphaThe Alpha (alpha only) Count Mode sets the system high voltage to the alphaplateau voltage. At this voltage, the proportional counter is only sensitive to alpharadiation.
SimultaneousThe simultaneous count mode sets the system high voltage to the beta plateauvoltage. At this voltage, the proportional counter is sensitive to all ionizing
96
Creating System Counting Procedures
Figure 84 SMS Procedure Screen
radiation and the separation of alpha and beta particles is accomplished using pulseheight.
Alpha then BetaIn the alpha then beta mode of operation the sample is counted twice; first at thealpha only voltage and then at the simultaneous voltage. The simultaneous voltagecounts are then corrected for the alpha only voltage counts.
ROI Discriminator SelectionAlpha/Beta ROI
Active only for the Simultaneous Count Mode, this selection uses previouslydetermined amplifier settings for the separation of alpha and beta particles. See“Alpha/Beta Amplifier Discriminator Adjustment” on page 53 for a description ofthe amplifier setup discriminator settings. Default settings for Alpha Only andAlpha then Beta modes are not changeable.
*Gamma ROIThis selection specifies the energy window of the gamma counting channel. Thegamma counting channel operations is independent of the Alpha/Beta channel. See“Gamma Amplifier Discriminator Adjustment” on page 56 for more details.
Count TimeSelectable from 0.2 to 9999.0 minutes, live time; default is 1 minute.
Preselected ReportThe default for this procedure option is that no report is selected.
Eclipse LB will automatically print the results of this unknown sample counting proce-dure if an appropriate report is selected. Make this selection by clicking on the “>>”button. If no report is selected, a report can be manually printed after the analysis iscompleted.
Reporting Units
Select from Bq (Bequerels), dpm (disintegrations per minute), pC (picocuries), or µCi(microcuries). When activity report is selected, sample activity will be reported in theunits selected.
Preselected Group & DevicePreselected Group
A through J; default is None.
If a Group letter, A through J, is selected from the drop-down list, this unknownsample counting procedure will always search the Tennelec Low BackgroundCounting System for that Group carrier as the location of the unknown samples. If
97
Procedure Manager
no Group is selected, you must make this selection at the time the procedure isinitiated.
Preselected DeviceAny registered counting system; default is None.
If a registered system, Device, is selected, this procedure will only run on thatsystem. If no system is selected, you must make this selection at the time theprocedure is initiated. This is most appropriate for computer systems with EclipseLB operating more than one counting system.
Sample Count DelaySelectable from 0 to 9999 minutes.
The delay time between counting intervals. If a value other than “0” is entered, thesystem will count the sample for the selected Count Time, wait for the amount oftime selected for the Sample Count Delay and then count the sample again, for thenumber of Count Repetitions selected.
Count RepetitionsSample
Selectable from 1 to 99; default is “1”.
This is the number of times a sample will be counted for the selected Count Timebefore the next sample is inserted for analysis.
BatchSelectable from 1 to 10; default is “1”
This is the number of times a Batch (Group) of samples will be counted before thesystem proceeds to another Group or Batch of samples. Note: This option requiresfirmware version 2.06 or higher.
Weak Sample RejectDisable or Enable
This option can be extremely valuable when counting large numbers of samples forlong counting times. Generally, a sample count is terminated when the presetcounting time is reached. This option allows you to terminate a count if less than aspecified number of counts, generally based on background, is acquired within aspecified amount of time. This option is not available for the Alpha then Beta CountMode.
98
Creating System Counting Procedures
Initial Test TimeEclipse LB will, at this preset time, evaluate the count rate and make a reject orcontinue decision.
Min Count RateIf this preset count rate, CPM, is equaled or exceeded within the Initial Test Time,Eclipse LB will continue counting until the Count Time is reached. If this count rateis not equaled, Eclipse LB will terminate the counting of this sample.
Background SubtractionDisable or Enable
The default is Disable. If Background Subtraction is enabled, Eclipse LB willautomatically subtract background contributions from the acquired sample data.Two background choices are provided.
Previously StoredEclipse LB subtracts the alpha, beta, and gamma background values that werepreviously determined in the calibration of the system.
Method BlankIf Method Blank is chosen, Eclipse LB will use the alpha, beta, and gamma resultsof the count of any sample within the Group (Batch) identified as the BackgroundBlank backgrounds and will subtract these results from the counts acquired from theremaining samples in that group. The sample to be used as the background blankcan be identified after all of the samples have been counted, by double clicking onthe Sample ID. It can also be identified, prior to the counting of the sample, usingthe Sample Manager. Refer to Chapter 8, Sample Manager.
Spillover CorrectionDisable or Enable; default is Disable.
When performing an efficiency calibration in the Simultaneous Count Mode, EclipseLB will determine the % of beta interactions that spillover and are stored as alphaevents plus the % of alpha interactions that spillover and are stored as beta events.This option is not available for the Alpha Only or the Alpha then Beta Count Modes.
Sample ActivityDisable or Enable; default is Disable.
If left disabled, Eclipse LB will only be able to report the results of the sample countin CPM (Counts per Minute). If enabled and appropriate calibration sources are se-lected, Eclipse LB will correct the counting data for system efficiency and report theresults in an activity, as determined by the Preselected Report chosen for this proce-dure.
99
Procedure Manager
Note: The counting system must be calibrated for the Count Mode, Alpha and BetaStandard and the Geometry Selection selected by this procedure in order tocorrect for system efficiency.
Geometry SelectionSelect the geometry of the samples to be analyzed using this procedure. From the Ge-ometry list, choose: 1/8” Stainless Steel, ¼” Stainless Steel, 5/16” Stainless Steel,Daily, or Swipe/Smear. Separate procedures must be created for SMS samples foreach geometry selection required.
Once all selections and changes have been made, click on Save to save this procedure.
Note: If Sample Activity is enabled, but no standards are selected, Eclipse LB willdisplay a warning message: “No alpha standard has been selected. This proce-dure will be marked inactive.” when the Save button is clicked.
Once standards are selected, the Is Active check box is selected and the procedure issaved once again or save it under another name using the Save As button. This processcan be repeated to prepare all of the SMS sample counting procedures needed. Oncethis is done, click Finish to exit the Procedure Manager or Back to return to the initialProcedure Manager screen.
100
Creating System Counting Procedures
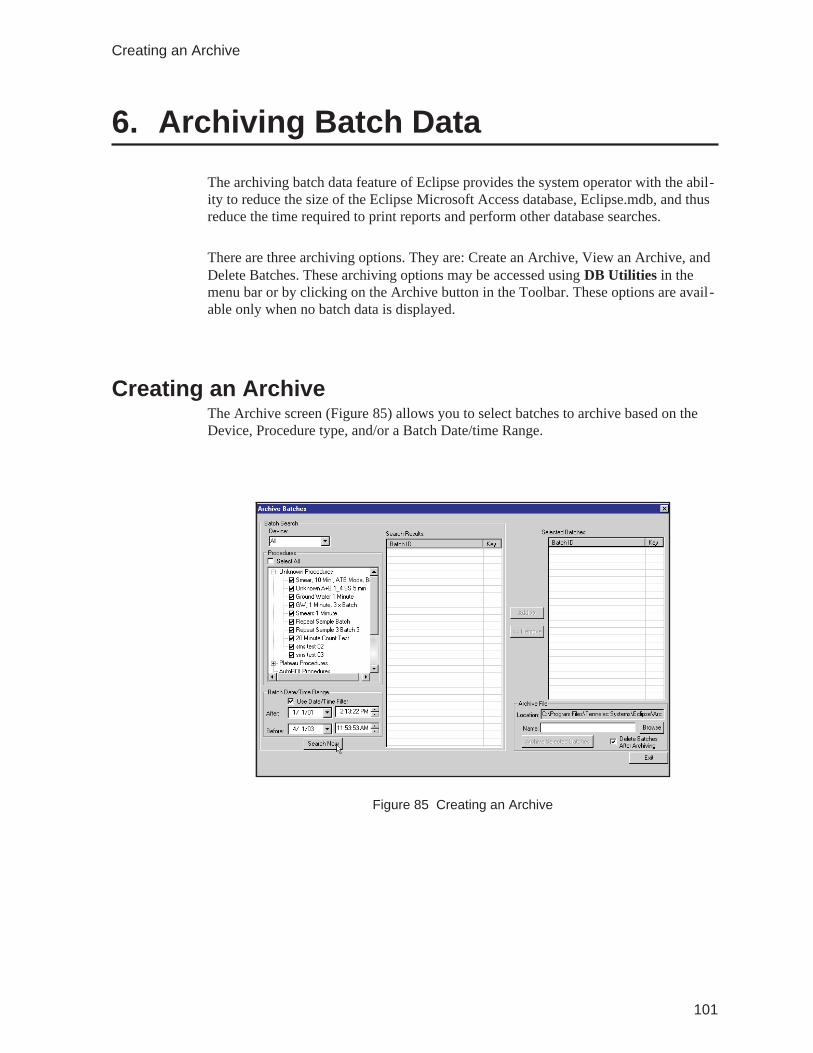
6. Archiving Batch Data
The archiving batch data feature of Eclipse provides the system operator with the abil-ity to reduce the size of the Eclipse Microsoft Access database, Eclipse.mdb, and thusreduce the time required to print reports and perform other database searches.
There are three archiving options. They are: Create an Archive, View an Archive, andDelete Batches. These archiving options may be accessed using DB Utilities in themenu bar or by clicking on the Archive button in the Toolbar. These options are avail-able only when no batch data is displayed.
Creating an ArchiveThe Archive screen (Figure 85) allows you to select batches to archive based on theDevice, Procedure type, and/or a Batch Date/time Range.
101
Creating an Archive
Figure 85 Creating an Archive
Batch SearchDevice
If multiple devices are attached to the same computer, the system operator mayselect procedures to archive from one of these devices or all of the devices.
ProceduresYou can check the Select All Procedures or you can limit the search to only thosebatches that use a specific counting procedure.
The batch data from background, efficiency, spillover, attenuation and plateaucalibration procedures that are marked “Is Current” will not be available forarchiving. For calibration procedures that are not marked “Is Current”, the batchdata will be archived but the record of those procedures will be retained in theactive database.
Date/Time Range SectionIf the Use Date/Time Filter checkbox is selected, the Search will identify only thosebatches from the selected procedures within the Before and After date and timerange specified.
Search Now
Click the Search Now button to start a search of batches matching the searchcriteria (Figure 86).
102
Archiving Batch Data
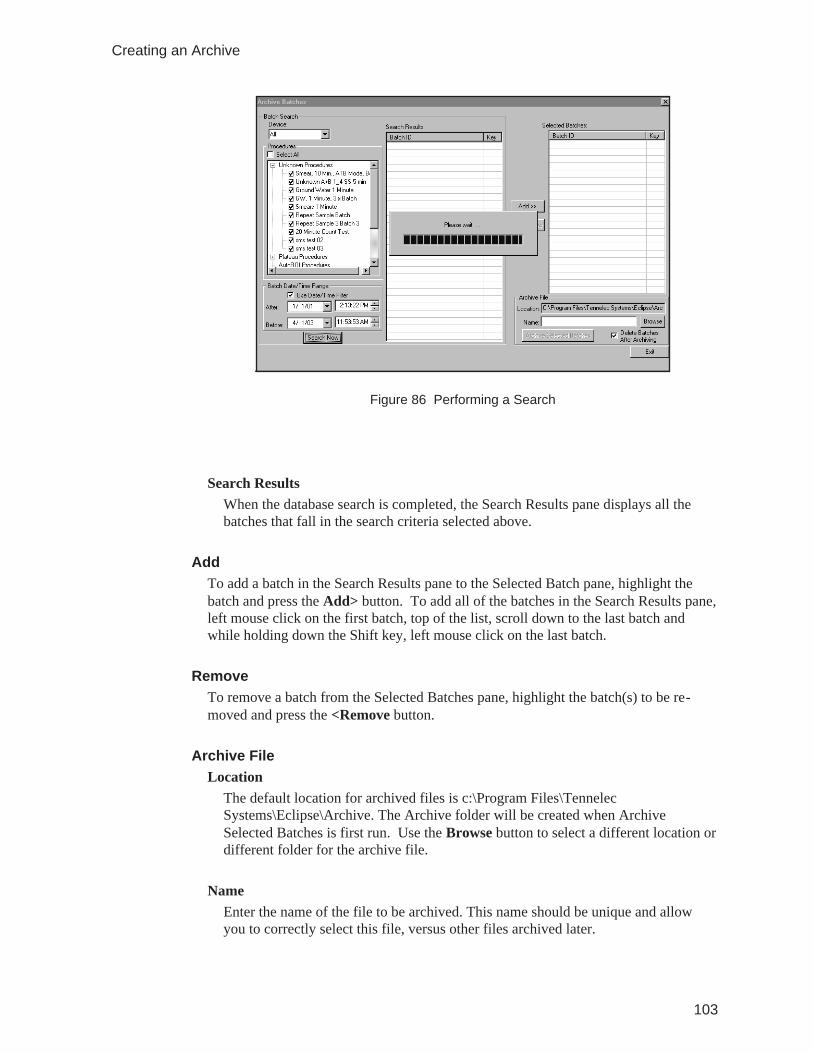
Search ResultsWhen the database search is completed, the Search Results pane displays all thebatches that fall in the search criteria selected above.
AddTo add a batch in the Search Results pane to the Selected Batch pane, highlight thebatch and press the Add> button. To add all of the batches in the Search Results pane,left mouse click on the first batch, top of the list, scroll down to the last batch andwhile holding down the Shift key, left mouse click on the last batch.
RemoveTo remove a batch from the Selected Batches pane, highlight the batch(s) to be re-moved and press the <Remove button.
Archive FileLocation
The default location for archived files is c:\Program Files\TennelecSystems\Eclipse\Archive. The Archive folder will be created when ArchiveSelected Batches is first run. Use the Browse button to select a different location ordifferent folder for the archive file.
NameEnter the name of the file to be archived. This name should be unique and allowyou to correctly select this file, versus other files archived later.
103
Creating an Archive
Figure 86 Performing a Search
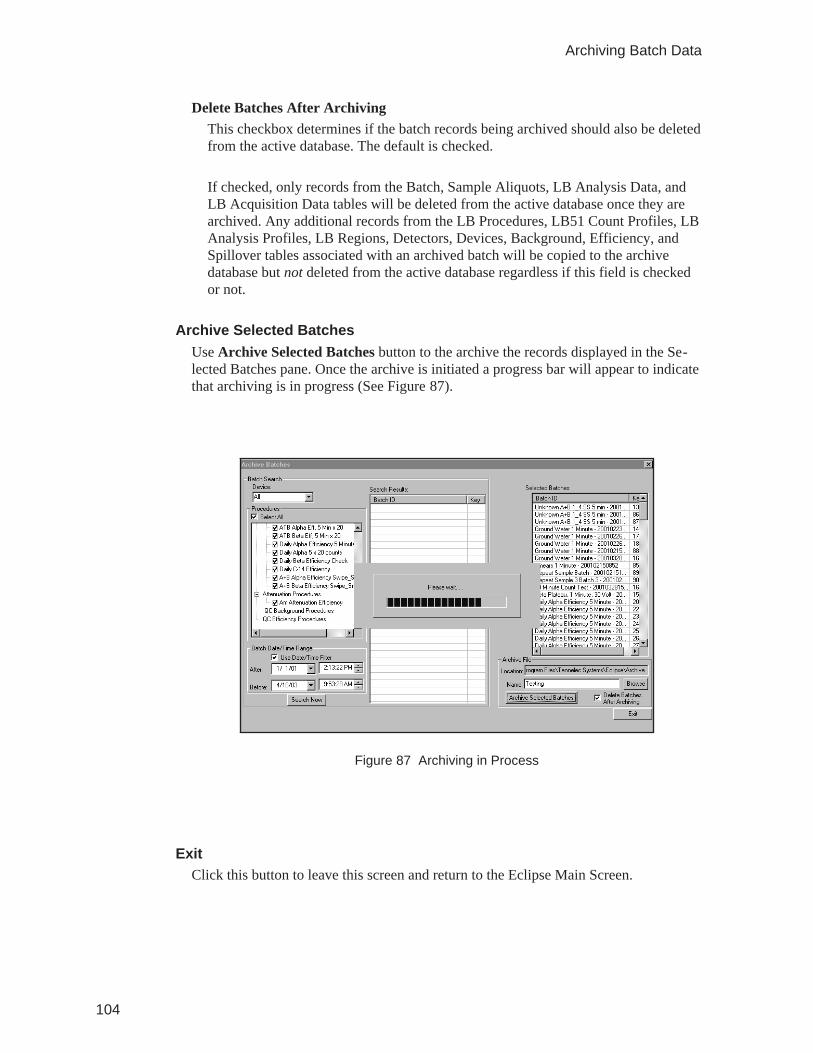
Delete Batches After ArchivingThis checkbox determines if the batch records being archived should also be deletedfrom the active database. The default is checked.
If checked, only records from the Batch, Sample Aliquots, LB Analysis Data, andLB Acquisition Data tables will be deleted from the active database once they arearchived. Any additional records from the LB Procedures, LB51 Count Profiles, LBAnalysis Profiles, LB Regions, Detectors, Devices, Background, Efficiency, andSpillover tables associated with an archived batch will be copied to the archivedatabase but not deleted from the active database regardless if this field is checkedor not.
Archive Selected BatchesUse Archive Selected Batches button to the archive the records displayed in the Se-lected Batches pane. Once the archive is initiated a progress bar will appear to indicatethat archiving is in progress (See Figure 87).
ExitClick this button to leave this screen and return to the Eclipse Main Screen.
104
Archiving Batch Data
Figure 87 Archiving in Process
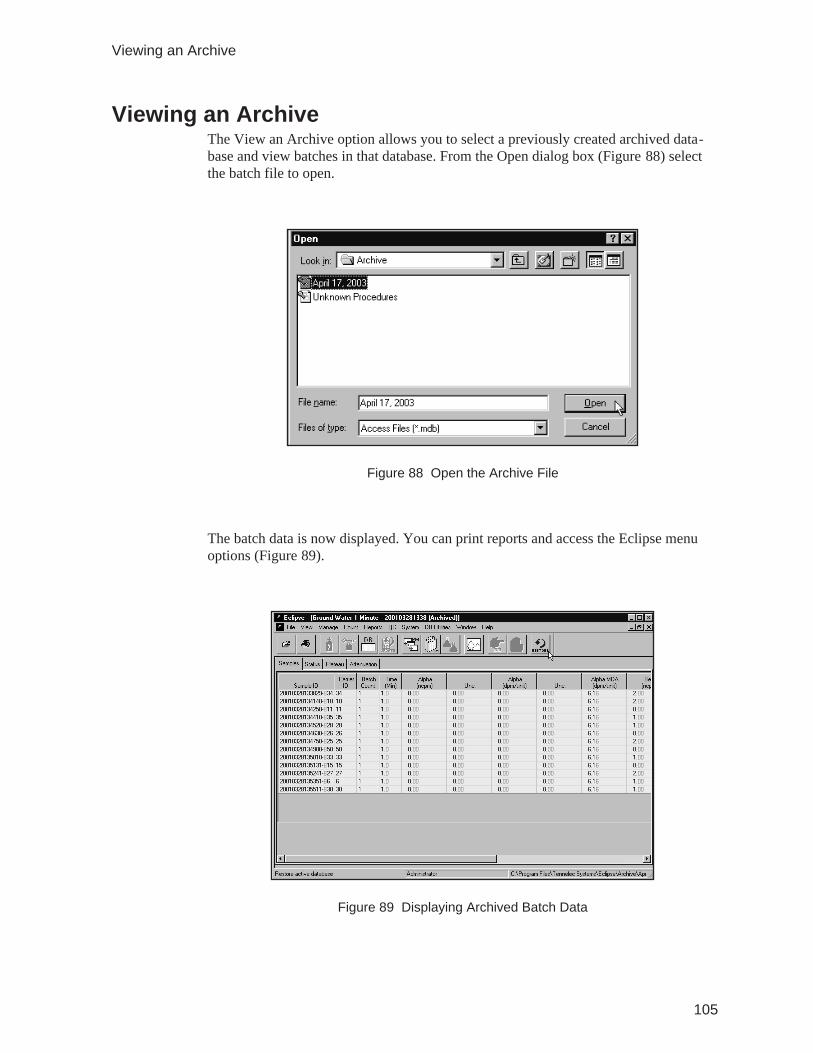
Viewing an ArchiveThe View an Archive option allows you to select a previously created archived data-base and view batches in that database. From the Open dialog box (Figure 88) selectthe batch file to open.
The batch data is now displayed. You can print reports and access the Eclipse menuoptions (Figure 89).
105
Viewing an Archive
Figure 88 Open the Archive File
Figure 89 Displaying Archived Batch Data
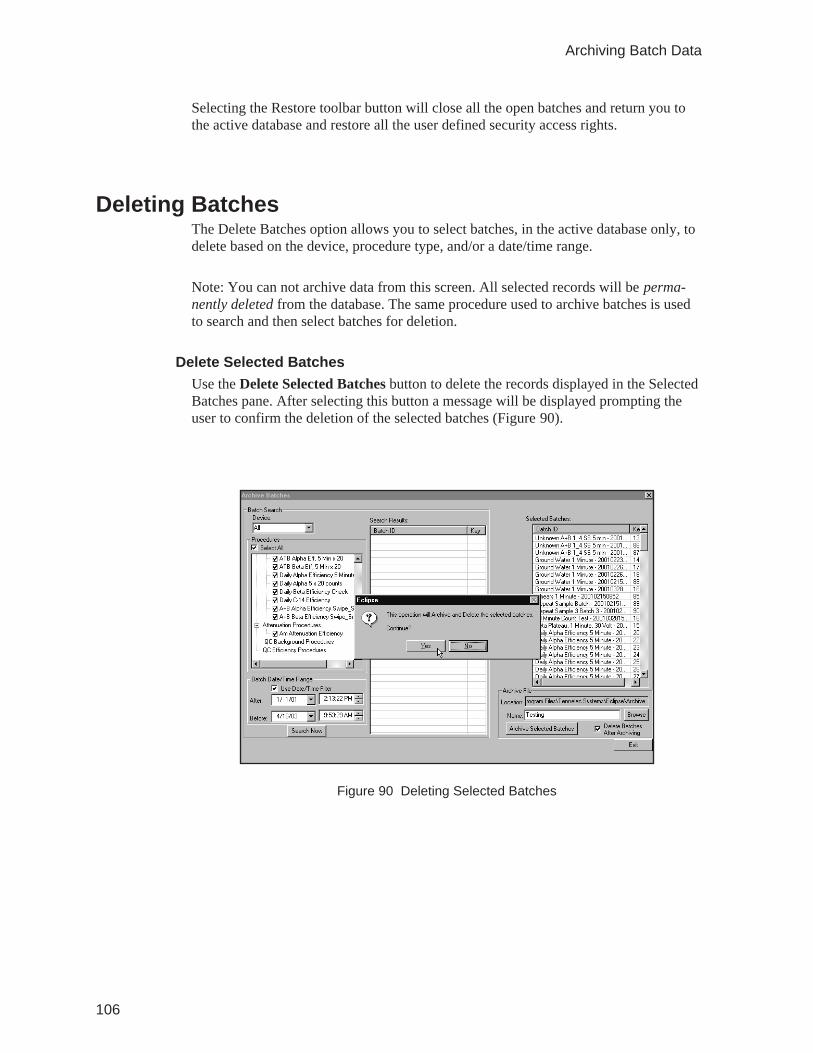
Selecting the Restore toolbar button will close all the open batches and return you tothe active database and restore all the user defined security access rights.
Deleting BatchesThe Delete Batches option allows you to select batches, in the active database only, todelete based on the device, procedure type, and/or a date/time range.
Note: You can not archive data from this screen. All selected records will be perma-nently deleted from the database. The same procedure used to archive batches is usedto search and then select batches for deletion.
Delete Selected BatchesUse the Delete Selected Batches button to delete the records displayed in the SelectedBatches pane. After selecting this button a message will be displayed prompting theuser to confirm the deletion of the selected batches (Figure 90).
106
Archiving Batch Data
Figure 90 Deleting Selected Batches

107
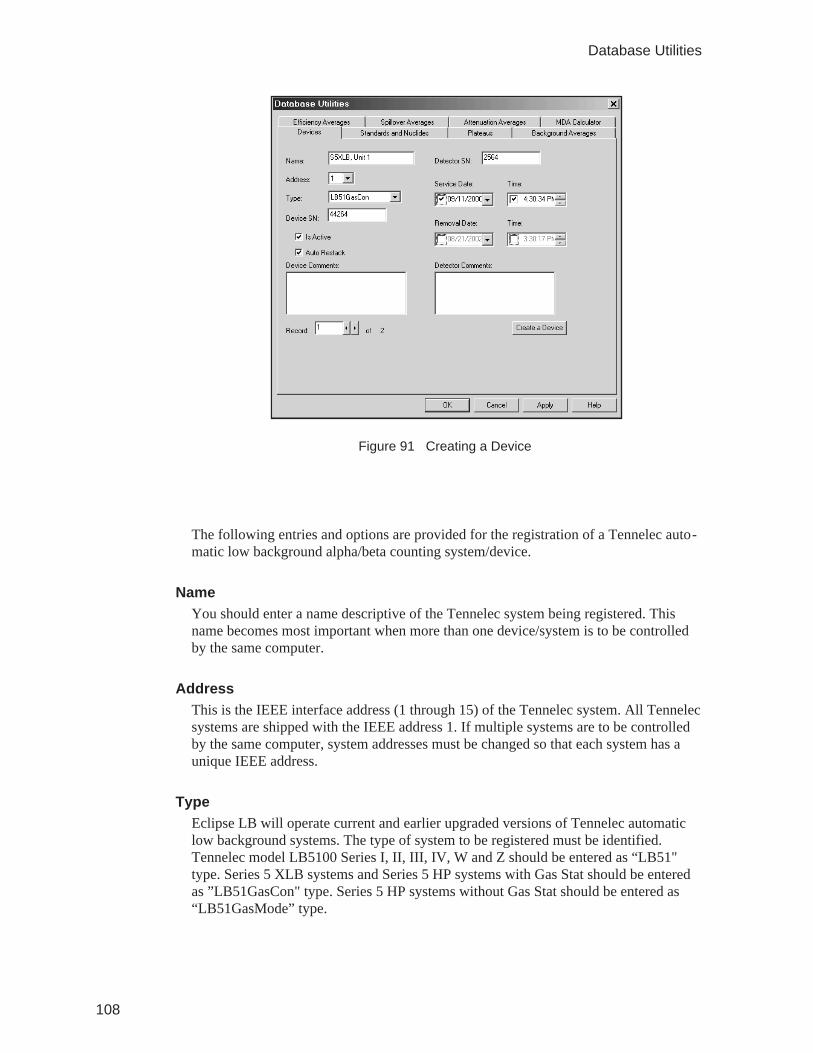
The following entries and options are provided for the registration of a Tennelec auto-matic low background alpha/beta counting system/device.
NameYou should enter a name descriptive of the Tennelec system being registered. Thisname becomes most important when more than one device/system is to be controlledby the same computer.
AddressThis is the IEEE interface address (1 through 15) of the Tennelec system. All Tennelecsystems are shipped with the IEEE address 1. If multiple systems are to be controlledby the same computer, system addresses must be changed so that each system has aunique IEEE address.
TypeEclipse LB will operate current and earlier upgraded versions of Tennelec automaticlow background systems. The type of system to be registered must be identified.Tennelec model LB5100 Series I, II, III, IV, W and Z should be entered as “LB51"type. Series 5 XLB systems and Series 5 HP systems with Gas Stat should be enteredas ”LB51GasCon" type. Series 5 HP systems without Gas Stat should be entered as“LB51GasMode” type.
108
Database Utilities
Figure 91 Creating a Device
Device SNIt is recommended that the system serial number be entered in this location for futurereference by the system operator or field service engineer.
Is ActiveThe default setting for this check box is to be selected. Active, selected, systems areavailable for the execution of procedures. If a system that has been registered is takenout of service, this check box can be cleared thus removing it from the list of availablesystems for procedures.
Auto RestackThe default setting for this check box is to be selected (active). When a Tennelec Au-tomatic Low Background System has completed the analysis of all samples, it willrestack the samples to the “send” (right side) stack. If cleared, the samples will be leftin the “receive” (left side) stack.
Device CommentsThis entry field is provided for you to add any comments appropriate to this system.Canberra recommends that you enter Preventive Maintenance (PM) dates and actionstaken in this space.
Detector SNEnter the detector serial number in this entry field. All calibration values for TennelecLow Background Systems are stored by Eclipse LB with reference to the DeviceName and Detector SN used to generate those values. This option allows for the con-trol of multiple systems by one computer. Also, if a system detector must be replaced,the original Device can be terminated and a new device with the same name, IEEE ad-dress, etc., but with a new detector serial number can be created.
Note: When running the Eclipse LB QC Chart program, this detector serial number isused to select the data to be plotted.
Service Date / TimeThis entry field is provided to identify when this system was placed into service.
Removal Date/TimeThis entry field is provided to identify when this system was taken out of service.
Detector CommentsThis entry field is provided to add any comments appropriate to the detector installedin this system.
109
Devices
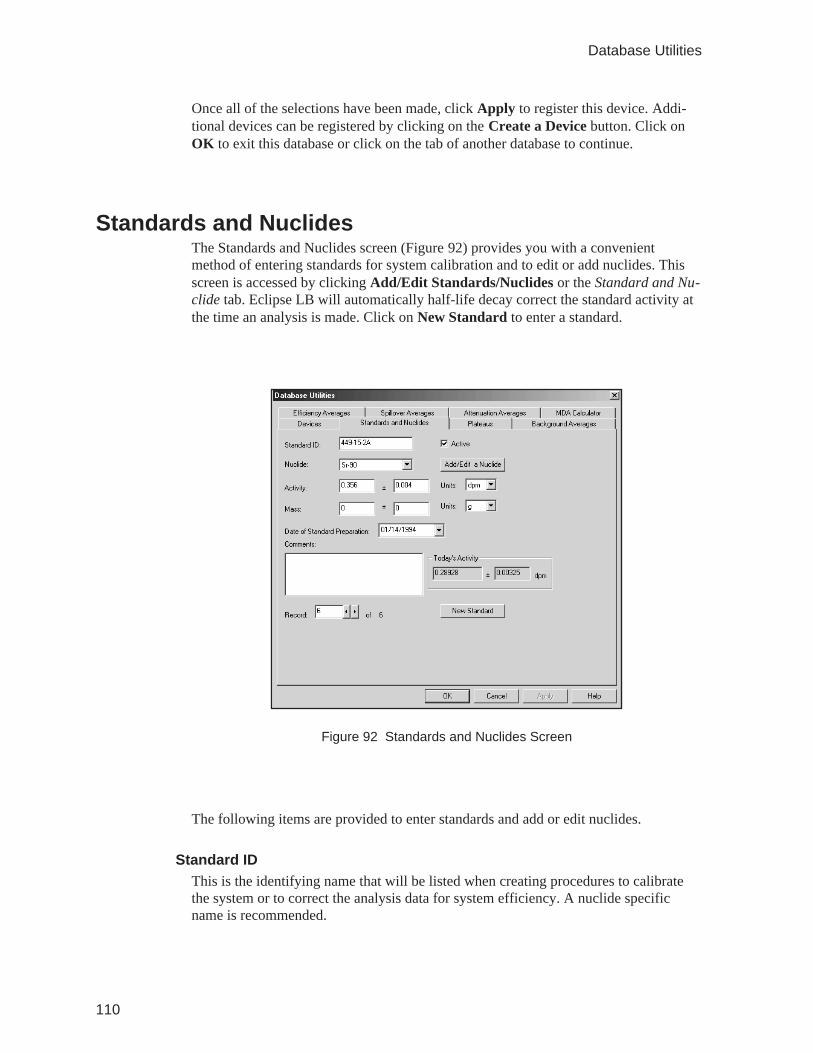
Once all of the selections have been made, click Apply to register this device. Addi-tional devices can be registered by clicking on the Create a Device button. Click onOK to exit this database or click on the tab of another database to continue.
Standards and NuclidesThe Standards and Nuclides screen (Figure 92) provides you with a convenientmethod of entering standards for system calibration and to edit or add nuclides. Thisscreen is accessed by clicking Add/Edit Standards/Nuclides or the Standard and Nu-clide tab. Eclipse LB will automatically half-life decay correct the standard activity atthe time an analysis is made. Click on New Standard to enter a standard.
The following items are provided to enter standards and add or edit nuclides.
Standard IDThis is the identifying name that will be listed when creating procedures to calibratethe system or to correct the analysis data for system efficiency. A nuclide specificname is recommended.
110
Database Utilities
Figure 92 Standards and Nuclides Screen
NuclideThe following twenty-four (24) nuclides are listed by Eclipse LB for selection.
Ac-228 Fe-55 Pa-234 Sr-90
Am-241 I-125 Po-210 Tc-99
C-14 I-129 Pu-238 Th-228
Co-57 I-131 Pu-239 Th-230
Co-60 Ni-63 Ra-226 U-235
Cs-137 Np-239 Ra-228 U-238
Highlight and click on the appropriate nuclide for selection.
ActivityThree input areas are provided. The first is for the activity of the standard, the secondfor the activity error and the third for the activity units. You can choose between Bq(Bequerels), dpm (disintegrations per minute) and pCi (picocuries) µCi (microcuries)for the standard activity.
MassThree input areas are provided. The first is for the mass of the standard, the second forthe mass error and the third for the mass units. You can choose between g (grams), kg(kilograms) and mg (milligrams) for the standard mass. Note: This information, al-though of potential value to the system operator, is not utilized by Eclipse LB.
Date of Standard PreparationThe calibration date should be entered in this space in a mm/dd/yy format. The pull-down calendar can be used to input the calibration date (Figure 93). Eclipse LB as-sumes a 12:00 midnight time for this activity calibration.
111
Standards and Nuclides
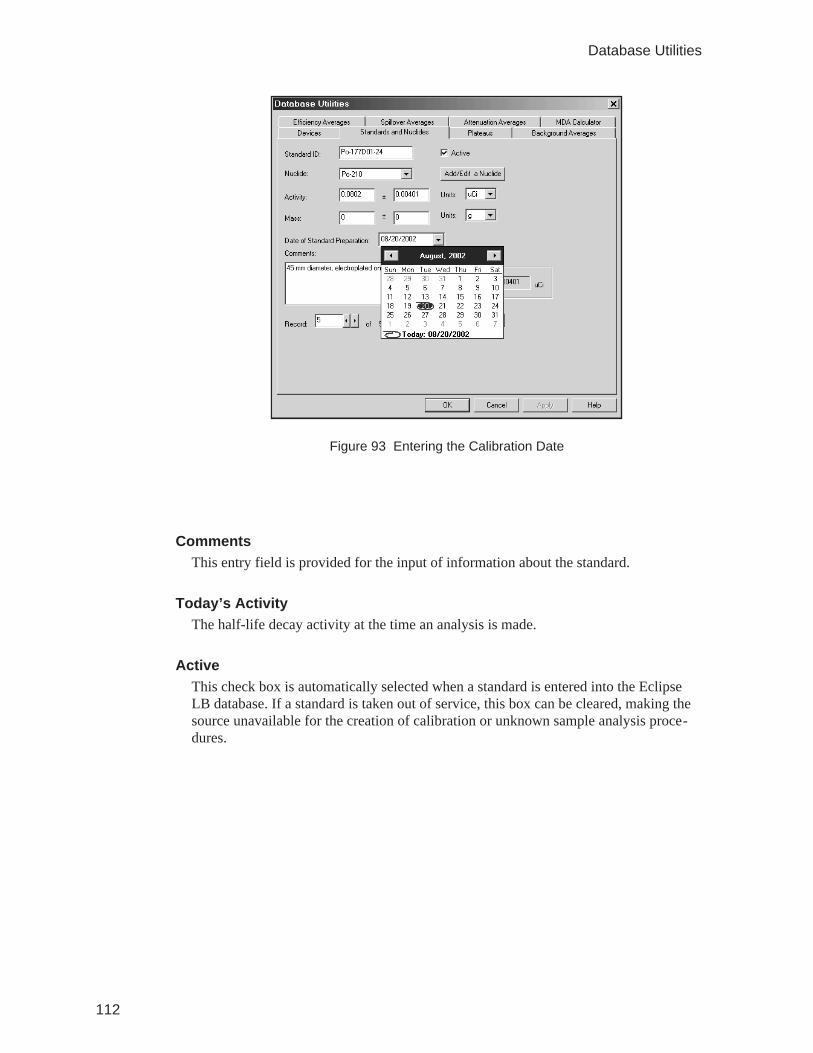
CommentsThis entry field is provided for the input of information about the standard.
Today’s ActivityThe half-life decay activity at the time an analysis is made.
ActiveThis check box is automatically selected when a standard is entered into the EclipseLB database. If a standard is taken out of service, this box can be cleared, making thesource unavailable for the creation of calibration or unknown sample analysis proce-dures.
112
Database Utilities
Figure 93 Entering the Calibration Date
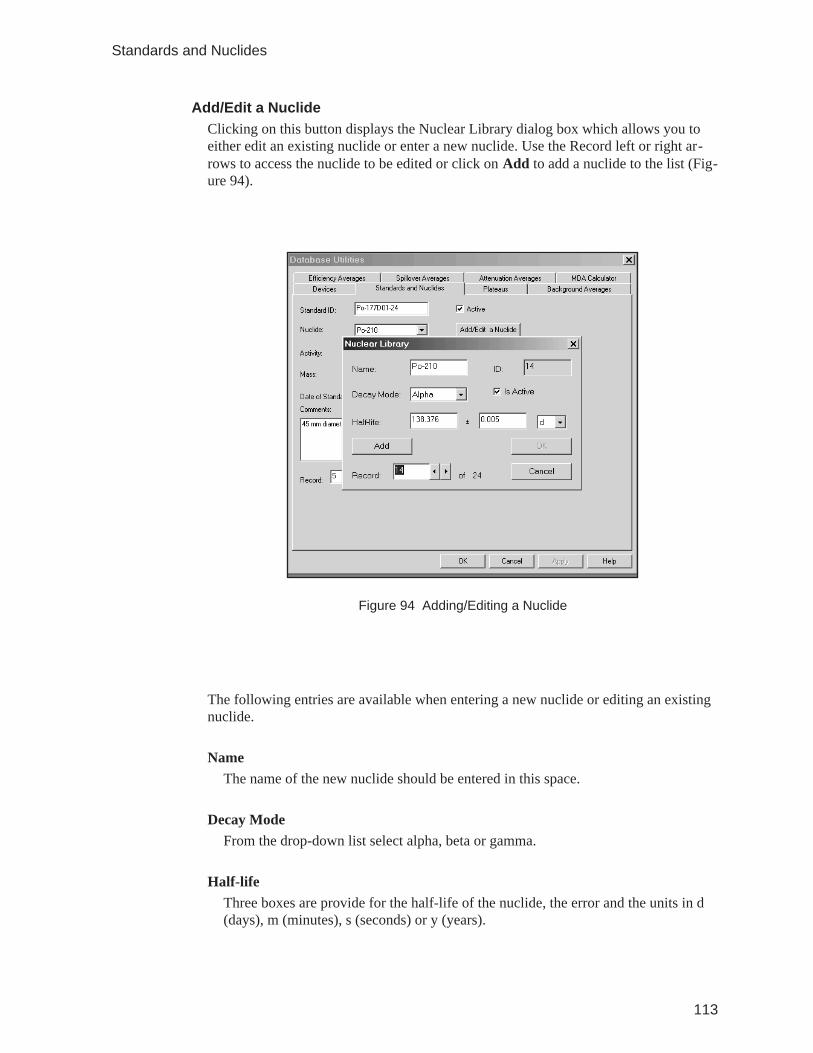
Add/Edit a NuclideClicking on this button displays the Nuclear Library dialog box which allows you toeither edit an existing nuclide or enter a new nuclide. Use the Record left or right ar-rows to access the nuclide to be edited or click on Add to add a nuclide to the list (Fig-ure 94).
The following entries are available when entering a new nuclide or editing an existingnuclide.
NameThe name of the new nuclide should be entered in this space.
Decay ModeFrom the drop-down list select alpha, beta or gamma.
Half-lifeThree boxes are provide for the half-life of the nuclide, the error and the units in d(days), m (minutes), s (seconds) or y (years).
113
Standards and Nuclides
Figure 94 Adding/Editing a Nuclide
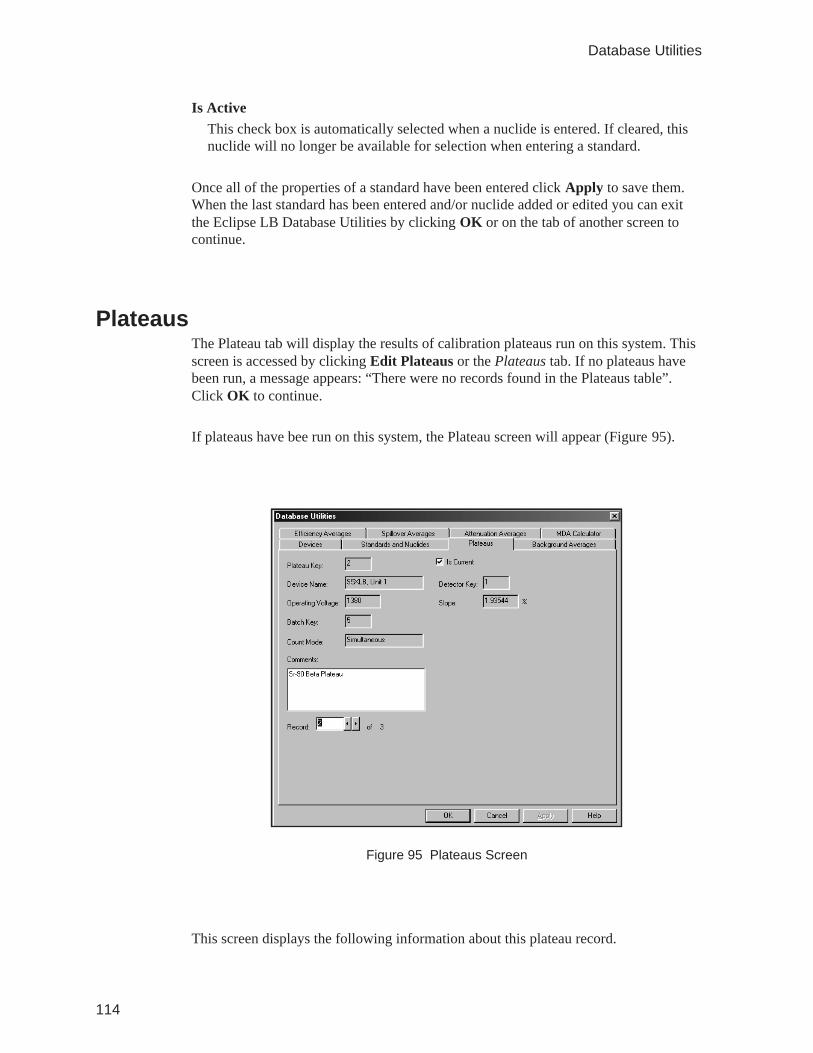
Is ActiveThis check box is automatically selected when a nuclide is entered. If cleared, thisnuclide will no longer be available for selection when entering a standard.
Once all of the properties of a standard have been entered click Apply to save them.When the last standard has been entered and/or nuclide added or edited you can exitthe Eclipse LB Database Utilities by clicking OK or on the tab of another screen tocontinue.
PlateausThe Plateau tab will display the results of calibration plateaus run on this system. Thisscreen is accessed by clicking Edit Plateaus or the Plateaus tab. If no plateaus havebeen run, a message appears: “There were no records found in the Plateaus table”.Click OK to continue.
If plateaus have bee run on this system, the Plateau screen will appear (Figure 95).
This screen displays the following information about this plateau record.
114
Database Utilities
Figure 95 Plateaus Screen
Plateau KeyThis refers to the location of the plateau data in the Plateaus table of the Eclipse LBMicrosoft Access database, Eclipse.mdb.
Device NameThis is the name given when registering the system used to generate this plateau. See“Devices” on page 107.
Operating VoltageThe voltage listed determined by Eclipse LB to be the operating voltage for the type ofplateau displayed. In this example, this is the alpha only operating voltage.
Batch KeyThis identifies the location of this plateau data in the Batch table of the Eclipse LBMicrosoft Access database, Eclipse.mdb.
Count ModeThis is the count mode used with the Tennelec LB system to generate this plateau.
CommentsThis entry field is provided for the convenience, information pertinent to this plateaucan be entered for this record.
Is CurrentWhenever a new plateau is generated, Eclipse LB will store the results of that plateauas Current. All previous plateaus of the same type will be stored as not current. Youcan clear any plateau and select a previous plateau. Only one plateau per type, CountMode, can be current.
Detector KeyThis is the location of the detector information associated with the device used to gen-erate this plateau. This location is stored in the Detectors table of the Eclipse LBMicrosoft Access database, Eclipse.mdb.
SlopeThis is the calculated slope per 100 volts at the Operating Voltage listed.
RecordThis displays the number of the record displayed plus how many plateau records arestored in the Eclipse LB database.
Once all plateau selections have been made click OK to exit the Eclipse LB DatabaseUtilities or another tab to continue.
115
Plateaus
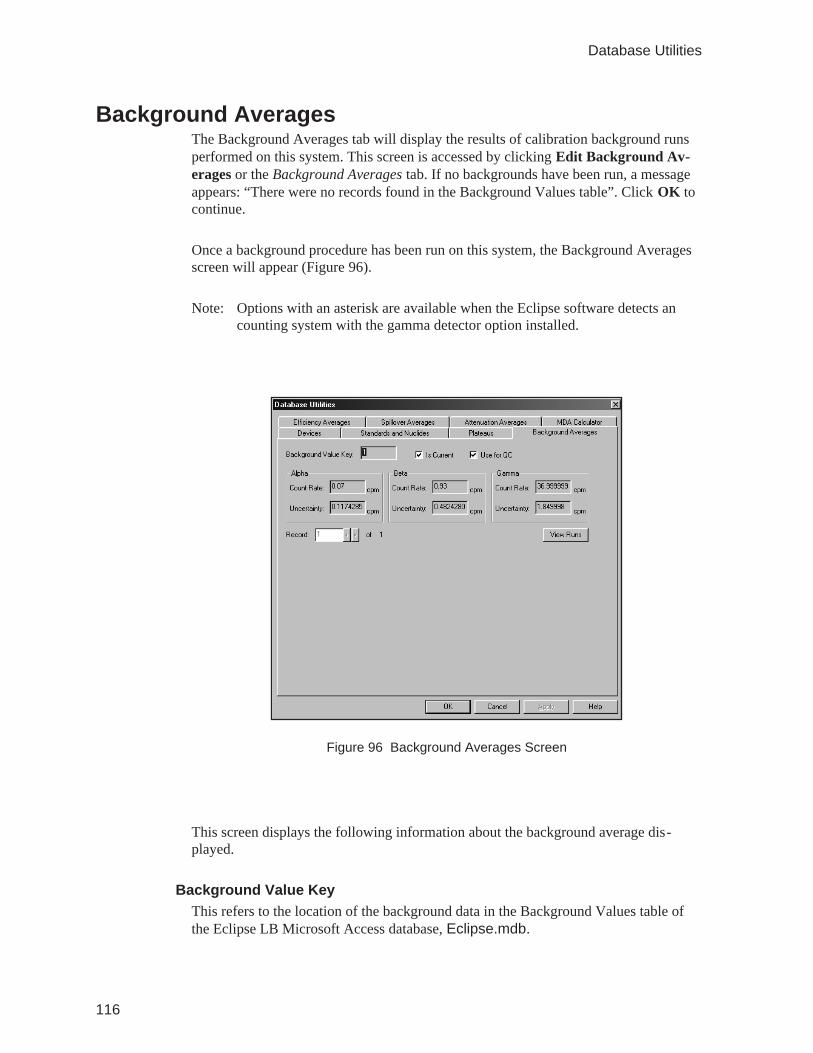
Background AveragesThe Background Averages tab will display the results of calibration background runsperformed on this system. This screen is accessed by clicking Edit Background Av-erages or the Background Averages tab. If no backgrounds have been run, a messageappears: “There were no records found in the Background Values table”. Click OK tocontinue.
Once a background procedure has been run on this system, the Background Averagesscreen will appear (Figure 96).
Note: Options with an asterisk are available when the Eclipse software detects ancounting system with the gamma detector option installed.
This screen displays the following information about the background average dis-played.
Background Value KeyThis refers to the location of the background data in the Background Values table ofthe Eclipse LB Microsoft Access database, Eclipse.mdb.
116
Database Utilities
Figure 96 Background Averages Screen
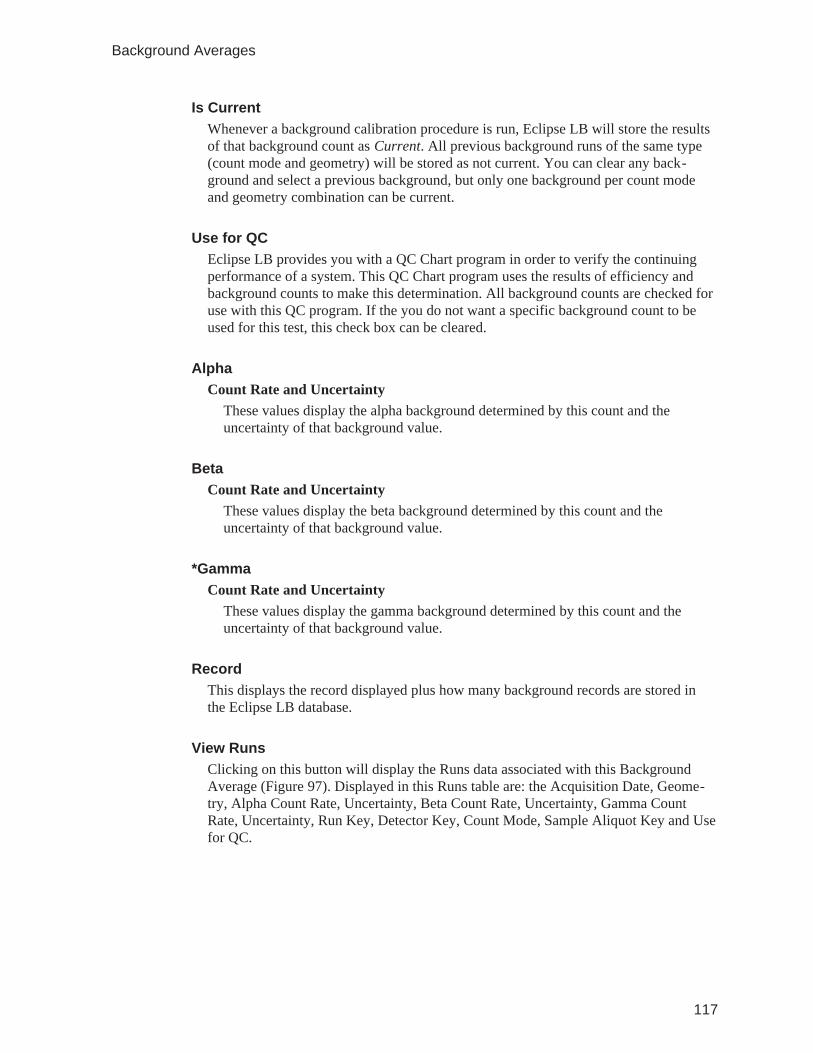
Is CurrentWhenever a background calibration procedure is run, Eclipse LB will store the resultsof that background count as Current. All previous background runs of the same type(count mode and geometry) will be stored as not current. You can clear any back-ground and select a previous background, but only one background per count modeand geometry combination can be current.
Use for QCEclipse LB provides you with a QC Chart program in order to verify the continuingperformance of a system. This QC Chart program uses the results of efficiency andbackground counts to make this determination. All background counts are checked foruse with this QC program. If the you do not want a specific background count to beused for this test, this check box can be cleared.
AlphaCount Rate and Uncertainty
These values display the alpha background determined by this count and theuncertainty of that background value.
BetaCount Rate and Uncertainty
These values display the beta background determined by this count and theuncertainty of that background value.
*GammaCount Rate and Uncertainty
These values display the gamma background determined by this count and theuncertainty of that background value.
RecordThis displays the record displayed plus how many background records are stored inthe Eclipse LB database.
View RunsClicking on this button will display the Runs data associated with this BackgroundAverage (Figure 97). Displayed in this Runs table are: the Acquisition Date, Geome-try, Alpha Count Rate, Uncertainty, Beta Count Rate, Uncertainty, Gamma CountRate, Uncertainty, Run Key, Detector Key, Count Mode, Sample Aliquot Key and Usefor QC.
117
Background Averages
Use the navigation buttons to move through this table. Click Close when finished.Click OK to exit the Eclipse LB Database Utilities or another tab to continue.
Efficiency AveragesThe Efficiency Averages tab will display the results of calibration efficiency runs per-formed on this system. This screen is accessed by clicking Edit Efficiency Averagesor the Efficiency Averages tab. If no efficiencies have been run, a message appears:“There were no records found in the Efficiency Values table”. Click OK to continue.
Once an efficiency procedure has been run on this system, the Efficiency Averagesscreen will appear (Figure 98).
118
Database Utilities
Figure 97 Displaying the Background Data
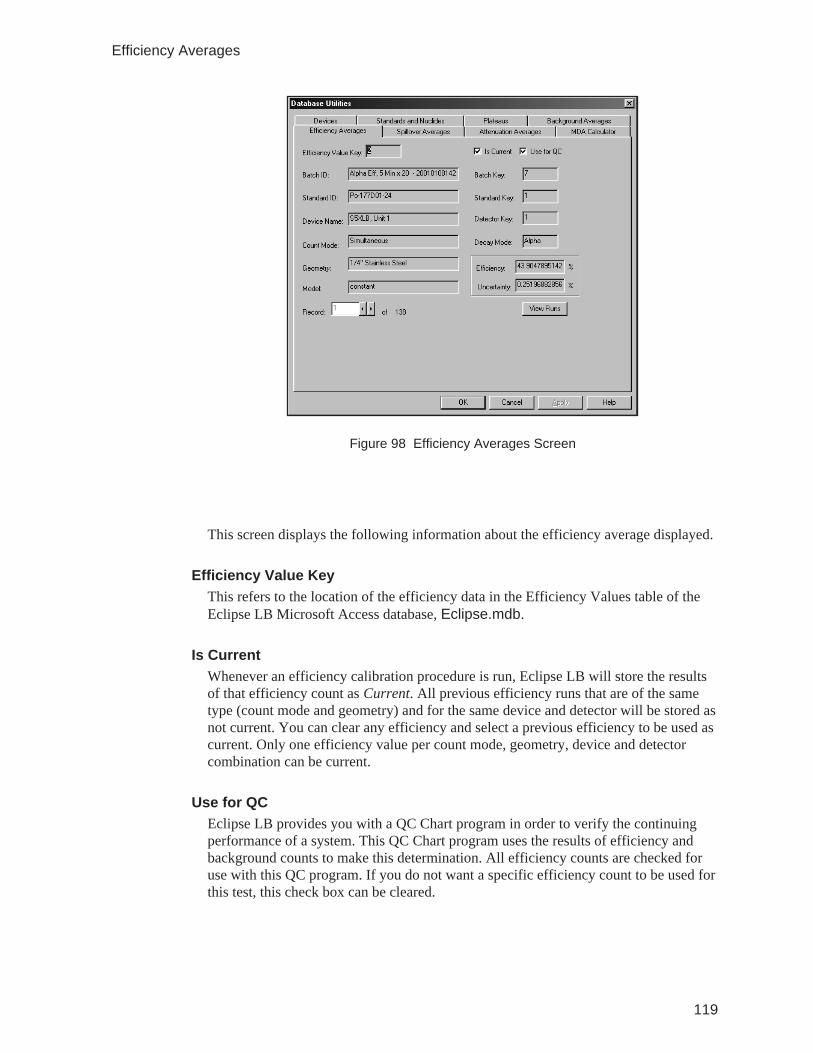
This screen displays the following information about the efficiency average displayed.
Efficiency Value KeyThis refers to the location of the efficiency data in the Efficiency Values table of theEclipse LB Microsoft Access database, Eclipse.mdb.
Is CurrentWhenever an efficiency calibration procedure is run, Eclipse LB will store the resultsof that efficiency count as Current. All previous efficiency runs that are of the sametype (count mode and geometry) and for the same device and detector will be stored asnot current. You can clear any efficiency and select a previous efficiency to be used ascurrent. Only one efficiency value per count mode, geometry, device and detectorcombination can be current.
Use for QCEclipse LB provides you with a QC Chart program in order to verify the continuingperformance of a system. This QC Chart program uses the results of efficiency andbackground counts to make this determination. All efficiency counts are checked foruse with this QC program. If you do not want a specific efficiency count to be used forthis test, this check box can be cleared.
119
Efficiency Averages
Figure 98 Efficiency Averages Screen
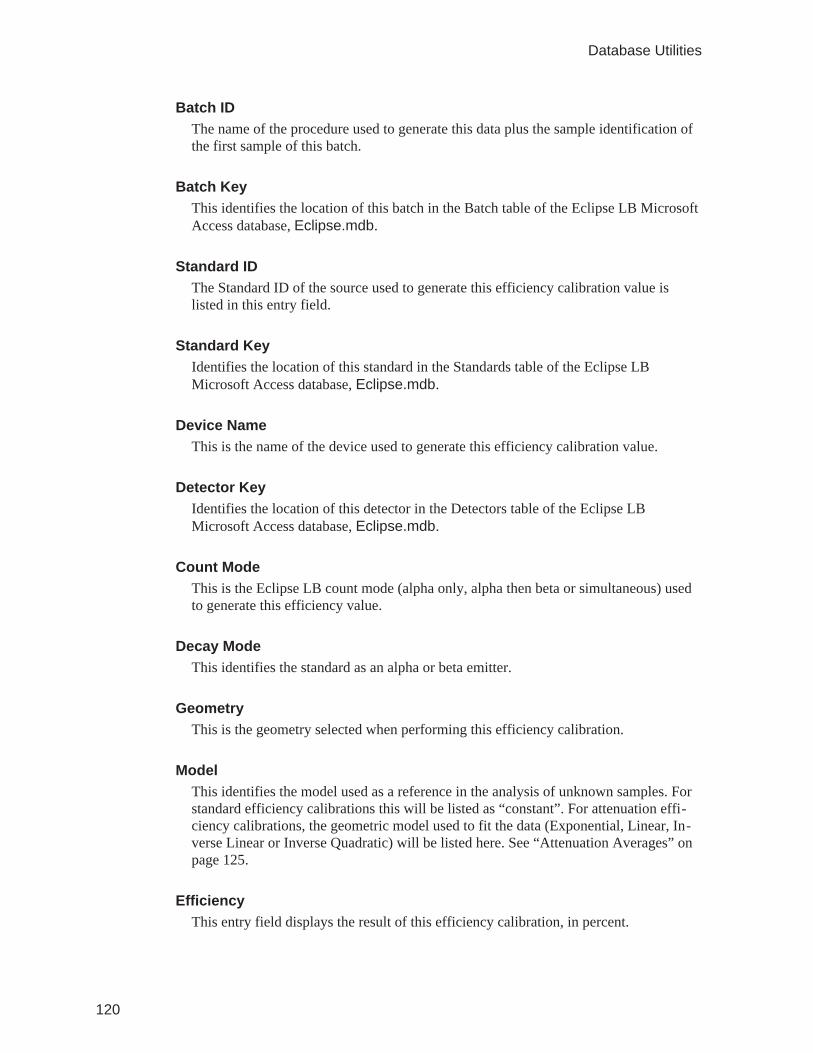
Batch IDThe name of the procedure used to generate this data plus the sample identification ofthe first sample of this batch.
Batch KeyThis identifies the location of this batch in the Batch table of the Eclipse LB MicrosoftAccess database, Eclipse.mdb.
Standard IDThe Standard ID of the source used to generate this efficiency calibration value islisted in this entry field.
Standard KeyIdentifies the location of this standard in the Standards table of the Eclipse LBMicrosoft Access database, Eclipse.mdb.
Device NameThis is the name of the device used to generate this efficiency calibration value.
Detector KeyIdentifies the location of this detector in the Detectors table of the Eclipse LBMicrosoft Access database, Eclipse.mdb.
Count ModeThis is the Eclipse LB count mode (alpha only, alpha then beta or simultaneous) usedto generate this efficiency value.
Decay ModeThis identifies the standard as an alpha or beta emitter.
GeometryThis is the geometry selected when performing this efficiency calibration.
ModelThis identifies the model used as a reference in the analysis of unknown samples. Forstandard efficiency calibrations this will be listed as “constant”. For attenuation effi-ciency calibrations, the geometric model used to fit the data (Exponential, Linear, In-verse Linear or Inverse Quadratic) will be listed here. See “Attenuation Averages” onpage 125.
EfficiencyThis entry field displays the result of this efficiency calibration, in percent.
120
Database Utilities
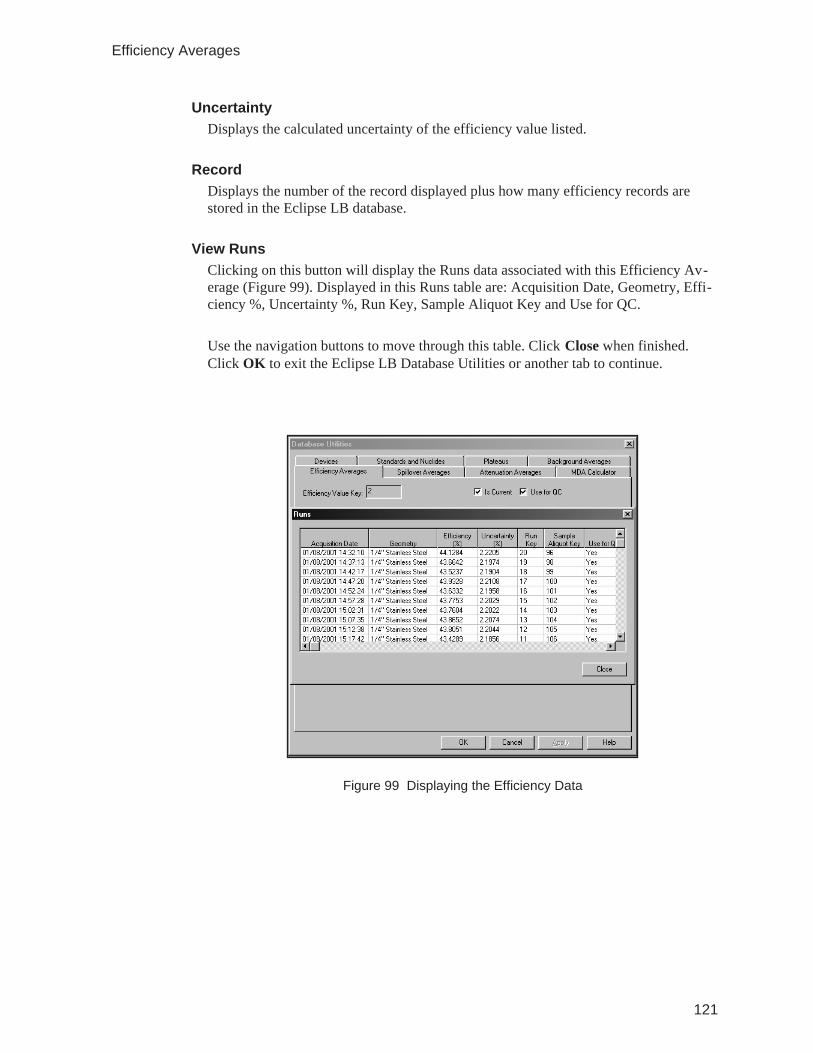
UncertaintyDisplays the calculated uncertainty of the efficiency value listed.
RecordDisplays the number of the record displayed plus how many efficiency records arestored in the Eclipse LB database.
View RunsClicking on this button will display the Runs data associated with this Efficiency Av-erage (Figure 99). Displayed in this Runs table are: Acquisition Date, Geometry, Effi-ciency %, Uncertainty %, Run Key, Sample Aliquot Key and Use for QC.
Use the navigation buttons to move through this table. Click Close when finished.Click OK to exit the Eclipse LB Database Utilities or another tab to continue.
121
Efficiency Averages
Figure 99 Displaying the Efficiency Data
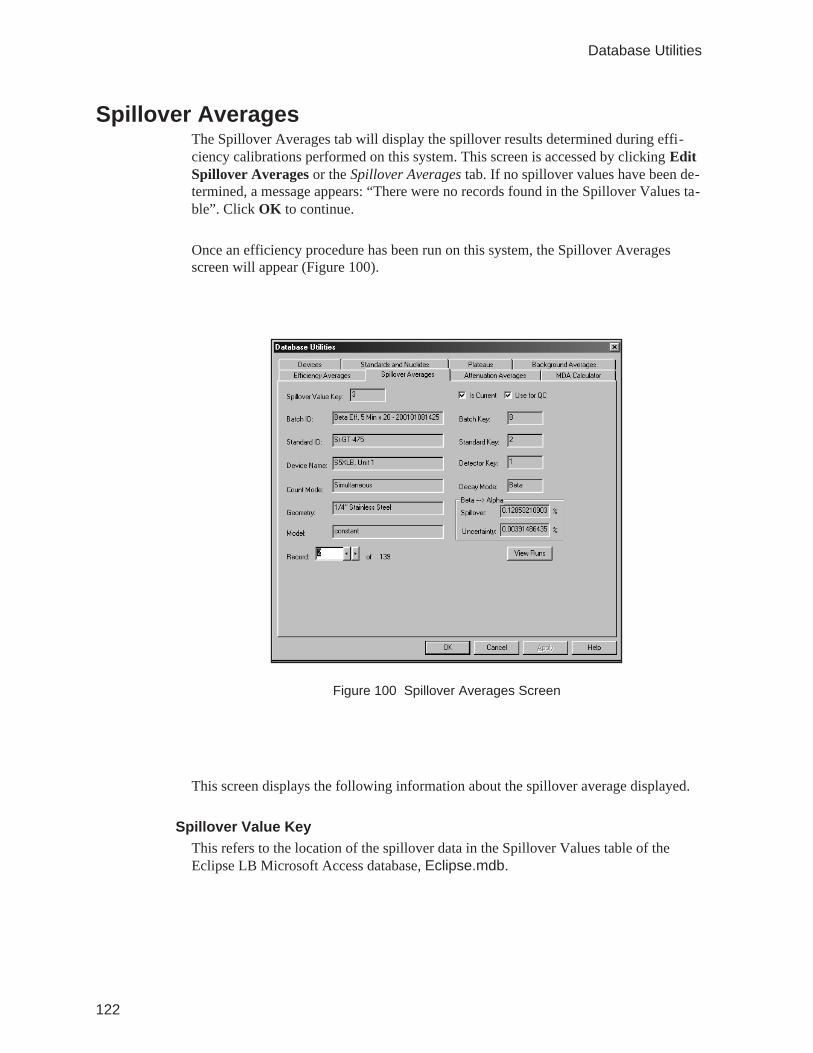
Spillover AveragesThe Spillover Averages tab will display the spillover results determined during effi-ciency calibrations performed on this system. This screen is accessed by clicking EditSpillover Averages or the Spillover Averages tab. If no spillover values have been de-termined, a message appears: “There were no records found in the Spillover Values ta-ble”. Click OK to continue.
Once an efficiency procedure has been run on this system, the Spillover Averagesscreen will appear (Figure 100).
This screen displays the following information about the spillover average displayed.
Spillover Value KeyThis refers to the location of the spillover data in the Spillover Values table of theEclipse LB Microsoft Access database, Eclipse.mdb.
122
Database Utilities
Figure 100 Spillover Averages Screen
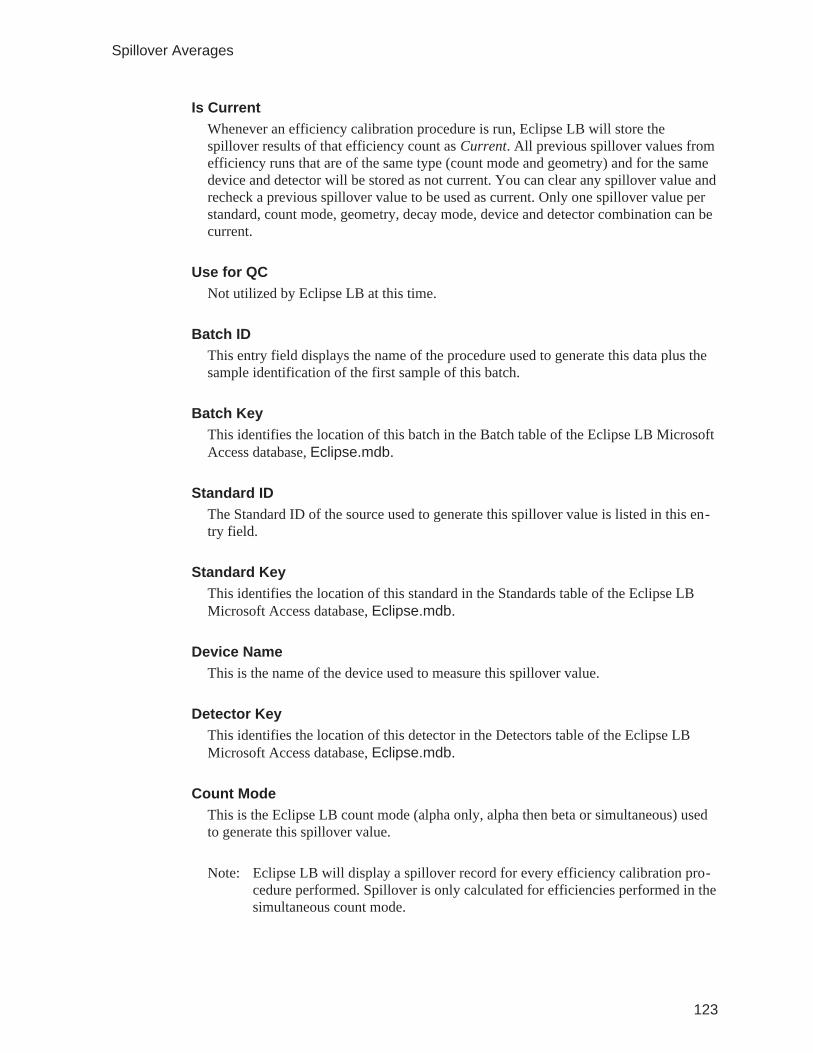
Is CurrentWhenever an efficiency calibration procedure is run, Eclipse LB will store thespillover results of that efficiency count as Current. All previous spillover values fromefficiency runs that are of the same type (count mode and geometry) and for the samedevice and detector will be stored as not current. You can clear any spillover value andrecheck a previous spillover value to be used as current. Only one spillover value perstandard, count mode, geometry, decay mode, device and detector combination can becurrent.
Use for QCNot utilized by Eclipse LB at this time.
Batch IDThis entry field displays the name of the procedure used to generate this data plus thesample identification of the first sample of this batch.
Batch KeyThis identifies the location of this batch in the Batch table of the Eclipse LB MicrosoftAccess database, Eclipse.mdb.
Standard IDThe Standard ID of the source used to generate this spillover value is listed in this en-try field.
Standard KeyThis identifies the location of this standard in the Standards table of the Eclipse LBMicrosoft Access database, Eclipse.mdb.
Device NameThis is the name of the device used to measure this spillover value.
Detector KeyThis identifies the location of this detector in the Detectors table of the Eclipse LBMicrosoft Access database, Eclipse.mdb.
Count ModeThis is the Eclipse LB count mode (alpha only, alpha then beta or simultaneous) usedto generate this spillover value.
Note: Eclipse LB will display a spillover record for every efficiency calibration pro-cedure performed. Spillover is only calculated for efficiencies performed in thesimultaneous count mode.
123
Spillover Averages
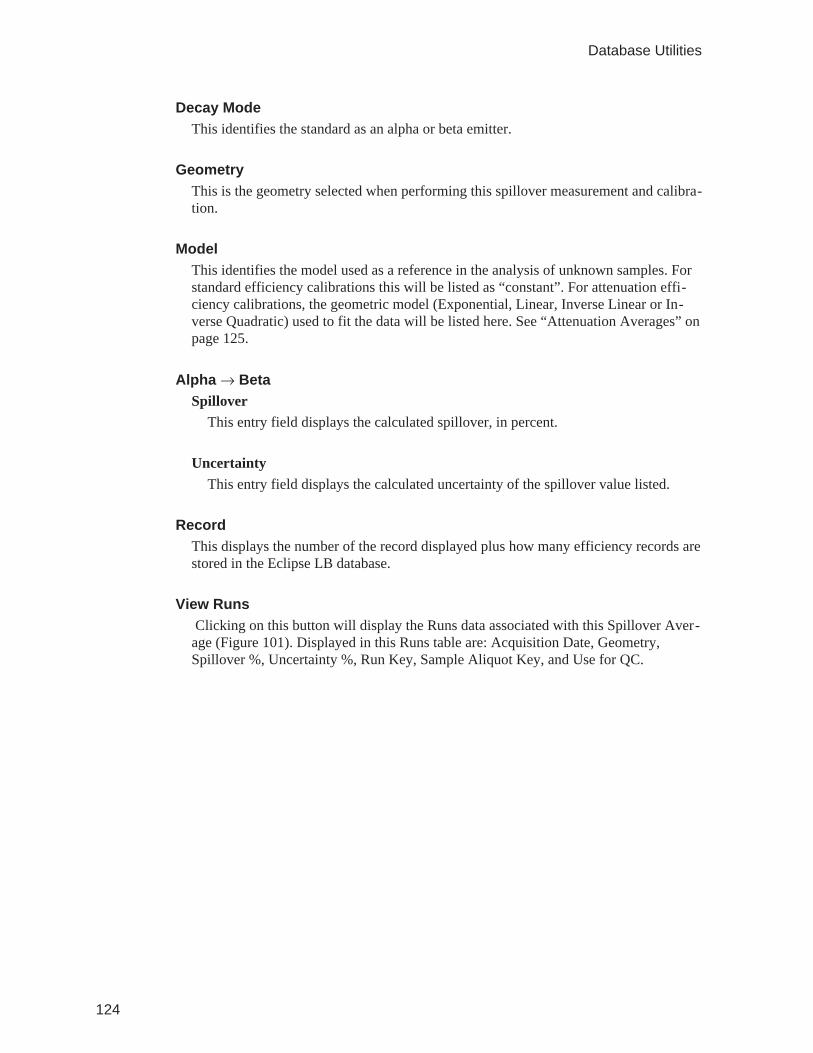
Decay ModeThis identifies the standard as an alpha or beta emitter.
GeometryThis is the geometry selected when performing this spillover measurement and calibra-tion.
ModelThis identifies the model used as a reference in the analysis of unknown samples. Forstandard efficiency calibrations this will be listed as “constant”. For attenuation effi-ciency calibrations, the geometric model (Exponential, Linear, Inverse Linear or In-verse Quadratic) used to fit the data will be listed here. See “Attenuation Averages” onpage 125.
Alpha BetaSpillover
This entry field displays the calculated spillover, in percent.
UncertaintyThis entry field displays the calculated uncertainty of the spillover value listed.
RecordThis displays the number of the record displayed plus how many efficiency records arestored in the Eclipse LB database.
View RunsClicking on this button will display the Runs data associated with this Spillover Aver-
age (Figure 101). Displayed in this Runs table are: Acquisition Date, Geometry,Spillover %, Uncertainty %, Run Key, Sample Aliquot Key, and Use for QC.
124
Database Utilities
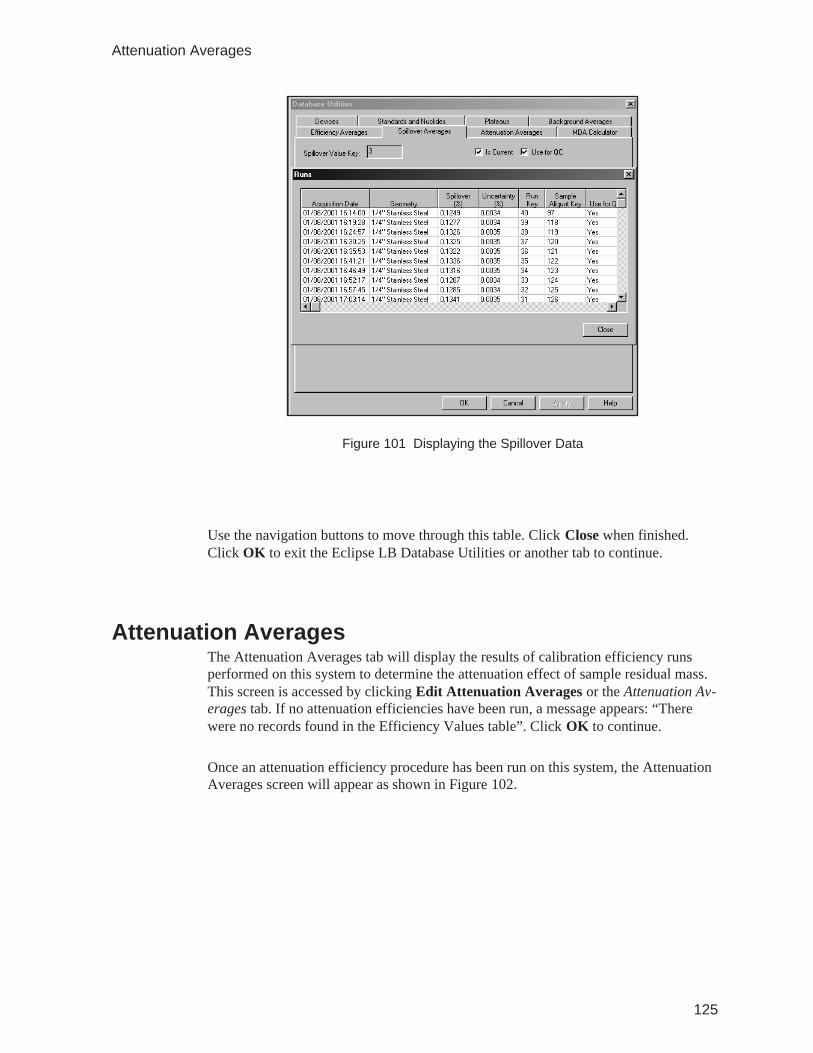
Use the navigation buttons to move through this table. Click Close when finished.Click OK to exit the Eclipse LB Database Utilities or another tab to continue.
Attenuation AveragesThe Attenuation Averages tab will display the results of calibration efficiency runsperformed on this system to determine the attenuation effect of sample residual mass.This screen is accessed by clicking Edit Attenuation Averages or the Attenuation Av-erages tab. If no attenuation efficiencies have been run, a message appears: “Therewere no records found in the Efficiency Values table”. Click OK to continue.
Once an attenuation efficiency procedure has been run on this system, the AttenuationAverages screen will appear as shown in Figure 102.
125
Attenuation Averages
Figure 101 Displaying the Spillover Data
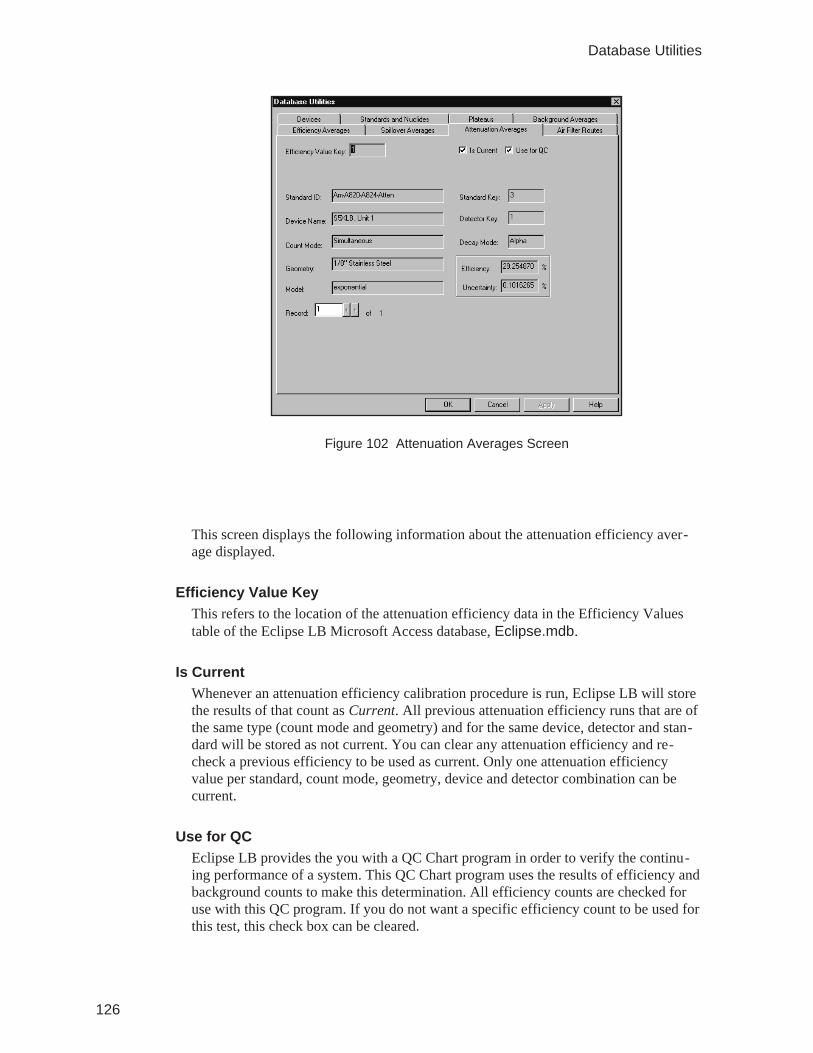
This screen displays the following information about the attenuation efficiency aver-age displayed.
Efficiency Value KeyThis refers to the location of the attenuation efficiency data in the Efficiency Valuestable of the Eclipse LB Microsoft Access database, Eclipse.mdb.
Is CurrentWhenever an attenuation efficiency calibration procedure is run, Eclipse LB will storethe results of that count as Current. All previous attenuation efficiency runs that are ofthe same type (count mode and geometry) and for the same device, detector and stan-dard will be stored as not current. You can clear any attenuation efficiency and re-check a previous efficiency to be used as current. Only one attenuation efficiencyvalue per standard, count mode, geometry, device and detector combination can becurrent.
Use for QCEclipse LB provides the you with a QC Chart program in order to verify the continu-ing performance of a system. This QC Chart program uses the results of efficiency andbackground counts to make this determination. All efficiency counts are checked foruse with this QC program. If you do not want a specific efficiency count to be used forthis test, this check box can be cleared.
126
Database Utilities
Figure 102 Attenuation Averages Screen
Standard IDThe Standard ID of the attenuation source set used to generate this attenuation effi-ciency calibration value is listed in this entry field.
Standard KeyThis identifies the location of this standard in the Standards table of the Eclipse LBMicrosoft Access database, Eclipse.mdb.
Device NameThis is the name of the device used to generate this attenuation efficiency calibrationvalue.
Detector KeyThis identifies the location of this detector in the Detectors table of the Eclipse LBMicrosoft Access database, Eclipse.mdb.
Count ModeThis is the Eclipse LB count mode (alpha only, alpha then beta or simultaneous) usedto generate this attenuation efficiency value.
Decay ModeThis identifies the standard as an alpha or beta emitter.
GeometryThis is the geometry selected when performing this attenuation efficiency calibration.
ModelThis identifies the model used to best fit the attenuation efficiency data accumulatedfor this calibration. Possible models are Exponential, Linear, Inverse Linear and In-verse Quadratic.
EfficiencyThis entry field displays the result of this efficiency calibration, in percent, for the zero(0) mass, X-axis intercept.
UncertaintyThis entry field displays the calculated uncertainty of the efficiency value listed.
RecordThis displays the number of the record displayed plus how many efficiency records arestored in the Eclipse LB database.
127
Attenuation Averages
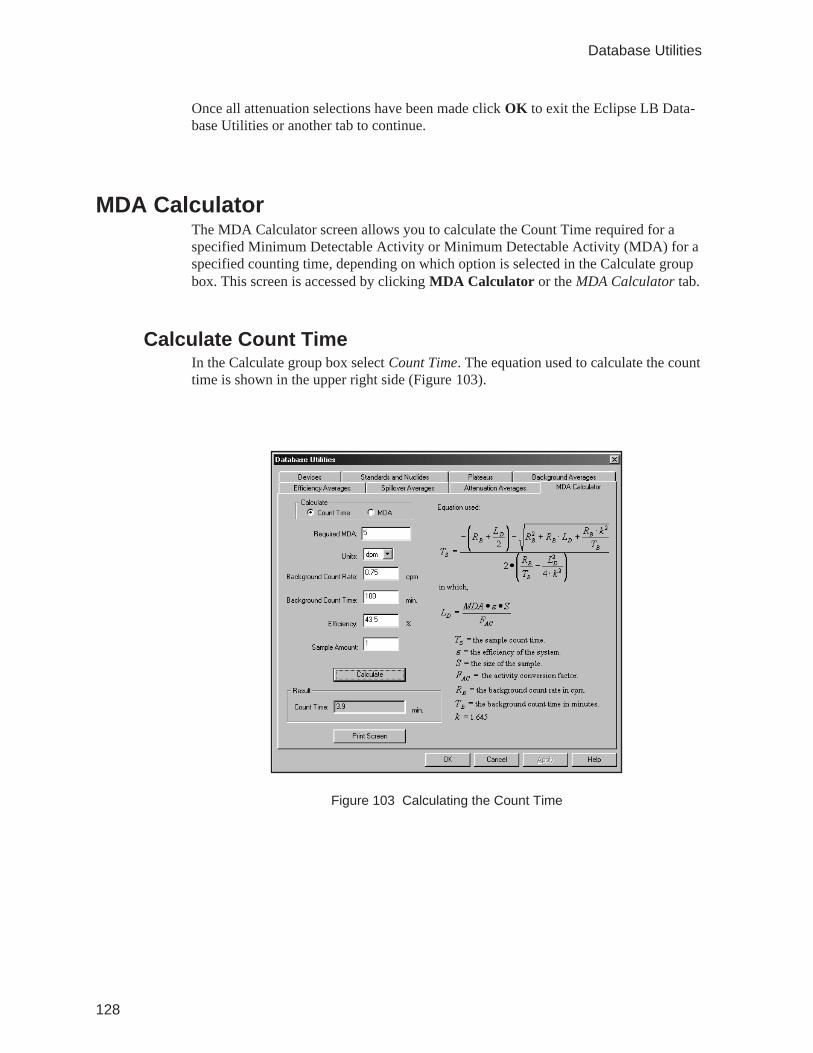
Once all attenuation selections have been made click OK to exit the Eclipse LB Data-base Utilities or another tab to continue.
MDA CalculatorThe MDA Calculator screen allows you to calculate the Count Time required for aspecified Minimum Detectable Activity or Minimum Detectable Activity (MDA) for aspecified counting time, depending on which option is selected in the Calculate groupbox. This screen is accessed by clicking MDA Calculator or the MDA Calculator tab.
Calculate Count TimeIn the Calculate group box select Count Time. The equation used to calculate the counttime is shown in the upper right side (Figure 103).
128
Database Utilities
Figure 103 Calculating the Count Time
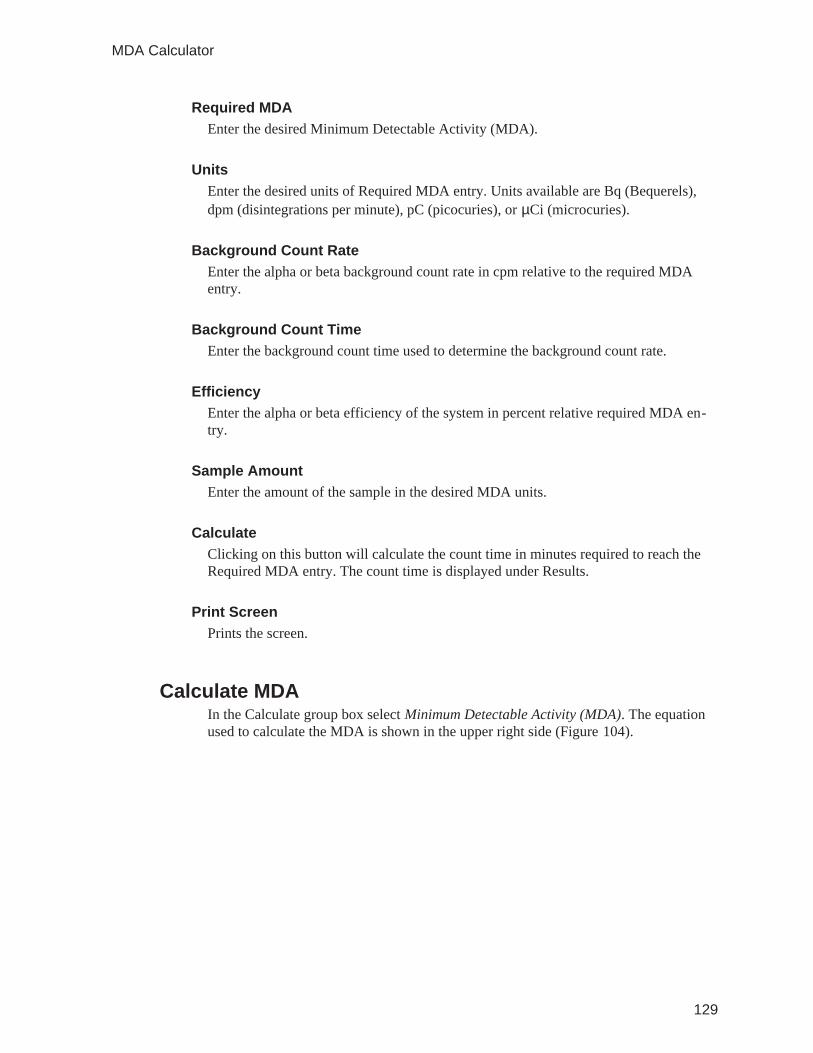
Required MDAEnter the desired Minimum Detectable Activity (MDA).
UnitsEnter the desired units of Required MDA entry. Units available are Bq (Bequerels),dpm (disintegrations per minute), pC (picocuries), or µCi (microcuries).
Background Count RateEnter the alpha or beta background count rate in cpm relative to the required MDAentry.
Background Count TimeEnter the background count time used to determine the background count rate.
EfficiencyEnter the alpha or beta efficiency of the system in percent relative required MDA en-try.
Sample AmountEnter the amount of the sample in the desired MDA units.
CalculateClicking on this button will calculate the count time in minutes required to reach theRequired MDA entry. The count time is displayed under Results.
Print ScreenPrints the screen.
Calculate MDAIn the Calculate group box select Minimum Detectable Activity (MDA). The equationused to calculate the MDA is shown in the upper right side (Figure 104).
129
MDA Calculator
Sample Count TimeThe sample count time in minutes. The count time must be between 0.2 and 9999 min-utes
Desired UnitsEnter the desired MDA units. Units available are Bq (Bequerels), dpm (disintegrationsper minute), pC (picocuries), or µCi (microcuries).
Background Count RateEnter the alpha or beta background count rate in cpm relative to the required MDA en-try.
Background Count TimeEnter the background count time used to determine the background count rate.
EfficiencyEnter the alpha or beta efficiency of the system in percent relative required MDA en-try.
Sample AmountEnter the amount of the sample in the desired MDA units.
130
Database Utilities
Figure 104 Calculating the Minimum Detectable Activity(MDA)

CalculateClicking on this button will calculate the MDA. The MDA is displayed under Results.
Print ScreenPrints the screen.
131
MDA Calculator
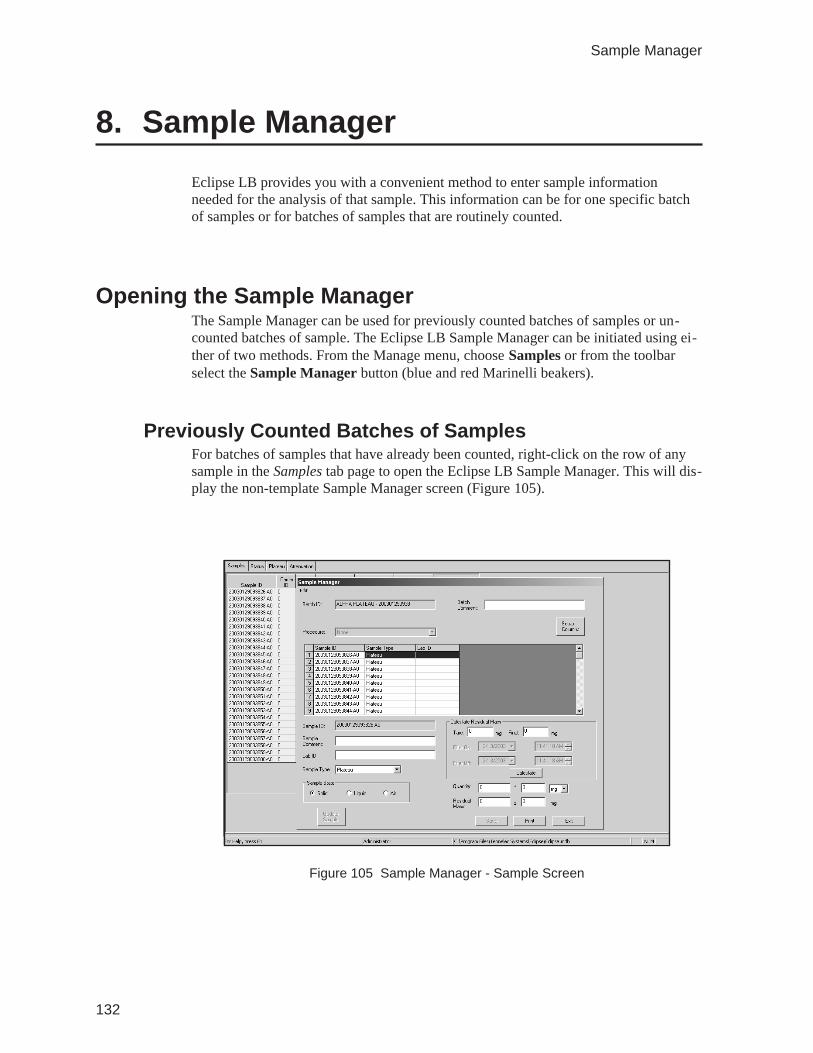
8. Sample Manager
Eclipse LB provides you with a convenient method to enter sample informationneeded for the analysis of that sample. This information can be for one specific batchof samples or for batches of samples that are routinely counted.
Opening the Sample ManagerThe Sample Manager can be used for previously counted batches of samples or un-counted batches of sample. The Eclipse LB Sample Manager can be initiated using ei-ther of two methods. From the Manage menu, choose Samples or from the toolbarselect the Sample Manager button (blue and red Marinelli beakers).
Previously Counted Batches of SamplesFor batches of samples that have already been counted, right-click on the row of anysample in the Samples tab page to open the Eclipse LB Sample Manager. This will dis-play the non-template Sample Manager screen (Figure 105).
132
Sample Manager
Figure 105 Sample Manager - Sample Screen
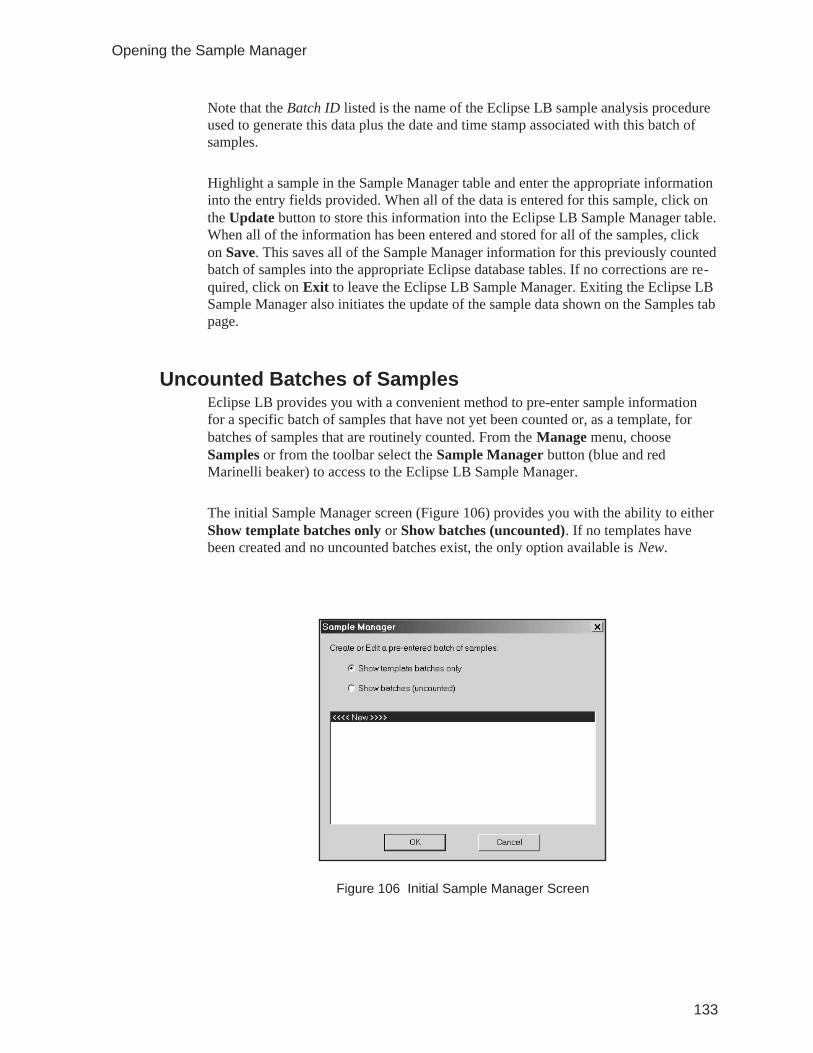
Note that the Batch ID listed is the name of the Eclipse LB sample analysis procedureused to generate this data plus the date and time stamp associated with this batch ofsamples.
Highlight a sample in the Sample Manager table and enter the appropriate informationinto the entry fields provided. When all of the data is entered for this sample, click onthe Update button to store this information into the Eclipse LB Sample Manager table.When all of the information has been entered and stored for all of the samples, clickon Save. This saves all of the Sample Manager information for this previously countedbatch of samples into the appropriate Eclipse database tables. If no corrections are re-quired, click on Exit to leave the Eclipse LB Sample Manager. Exiting the Eclipse LBSample Manager also initiates the update of the sample data shown on the Samples tabpage.
Uncounted Batches of SamplesEclipse LB provides you with a convenient method to pre-enter sample informationfor a specific batch of samples that have not yet been counted or, as a template, forbatches of samples that are routinely counted. From the Manage menu, chooseSamples or from the toolbar select the Sample Manager button (blue and redMarinelli beaker) to access to the Eclipse LB Sample Manager.
The initial Sample Manager screen (Figure 106) provides you with the ability to eitherShow template batches only or Show batches (uncounted). If no templates havebeen created and no uncounted batches exist, the only option available is New.
133
Opening the Sample Manager
Figure 106 Initial Sample Manager Screen
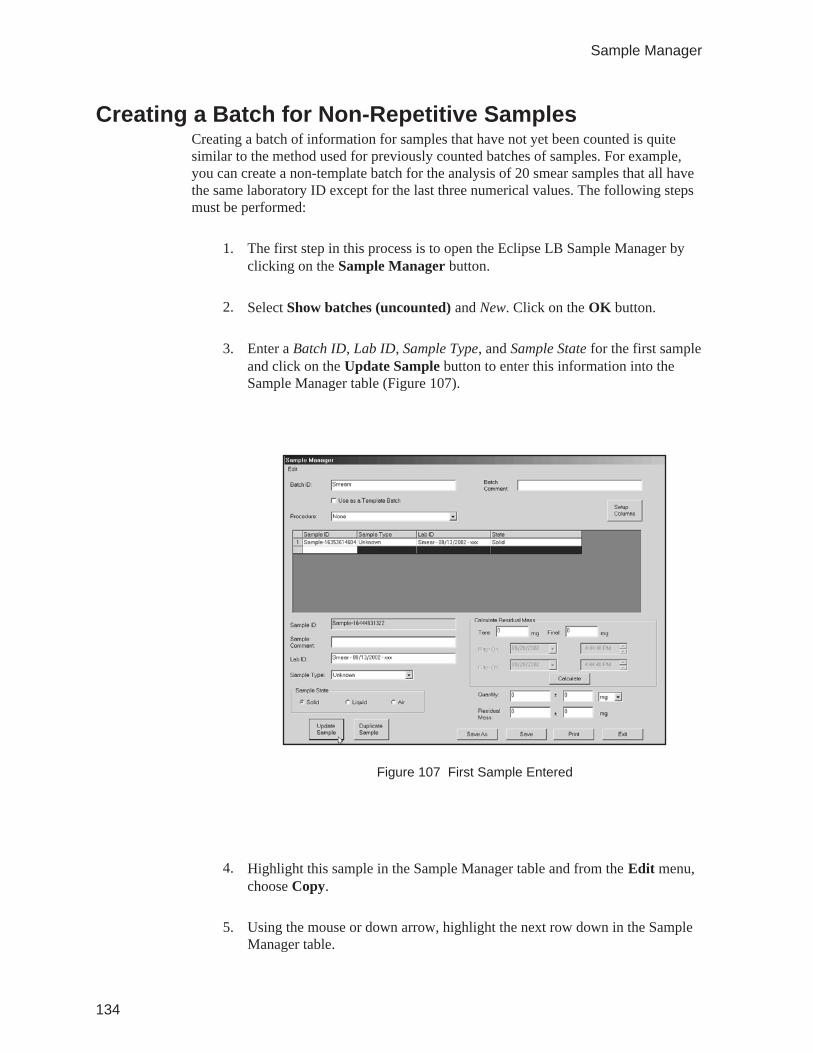
Creating a Batch for Non-Repetitive SamplesCreating a batch of information for samples that have not yet been counted is quitesimilar to the method used for previously counted batches of samples. For example,you can create a non-template batch for the analysis of 20 smear samples that all havethe same laboratory ID except for the last three numerical values. The following stepsmust be performed:
1. The first step in this process is to open the Eclipse LB Sample Manager byclicking on the Sample Manager button.
2. Select Show batches (uncounted) and New. Click on the OK button.
3. Enter a Batch ID, Lab ID, Sample Type, and Sample State for the first sampleand click on the Update Sample button to enter this information into theSample Manager table (Figure 107).
4. Highlight this sample in the Sample Manager table and from the Edit menu,choose Copy.
5. Using the mouse or down arrow, highlight the next row down in the SampleManager table.
134
Sample Manager
Figure 107 First Sample Entered
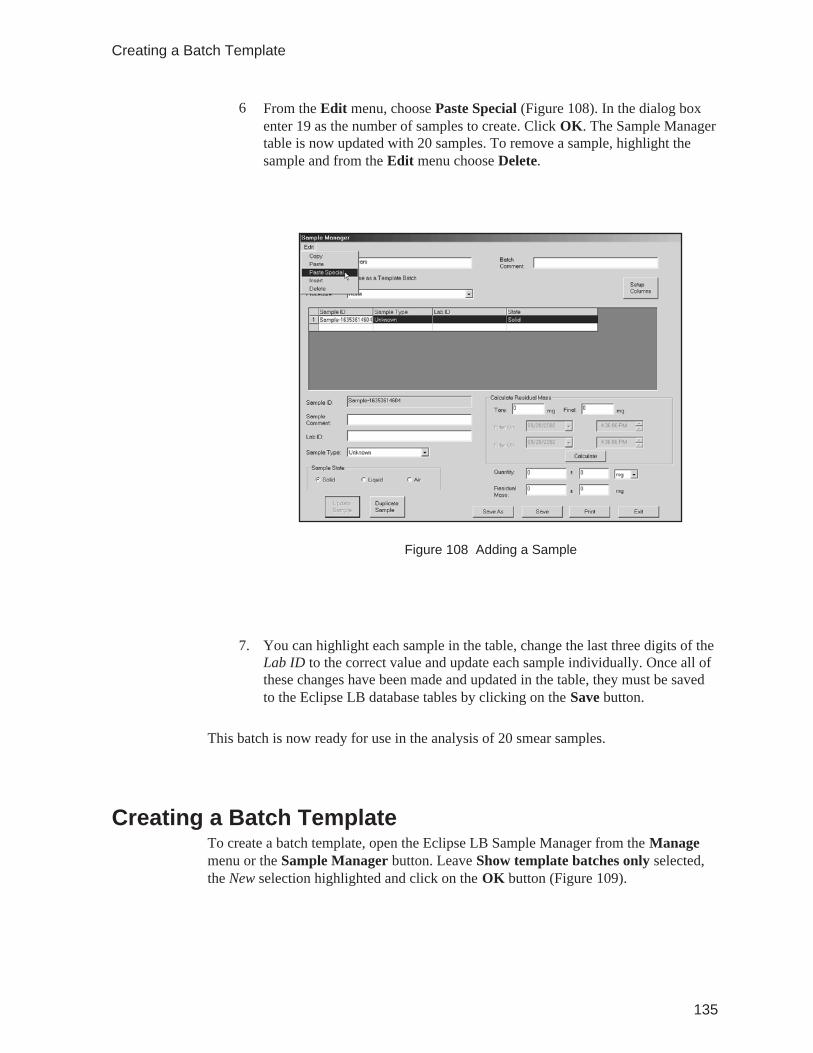
6 From the Edit menu, choose Paste Special (Figure 108). In the dialog boxenter 19 as the number of samples to create. Click OK. The Sample Managertable is now updated with 20 samples. To remove a sample, highlight thesample and from the Edit menu choose Delete.
7. You can highlight each sample in the table, change the last three digits of theLab ID to the correct value and update each sample individually. Once all ofthese changes have been made and updated in the table, they must be savedto the Eclipse LB database tables by clicking on the Save button.
This batch is now ready for use in the analysis of 20 smear samples.
Creating a Batch TemplateTo create a batch template, open the Eclipse LB Sample Manager from the Managemenu or the Sample Manager button. Leave Show template batches only selected,the New selection highlighted and click on the OK button (Figure 109).
135
Creating a Batch Template
Figure 108 Adding a Sample
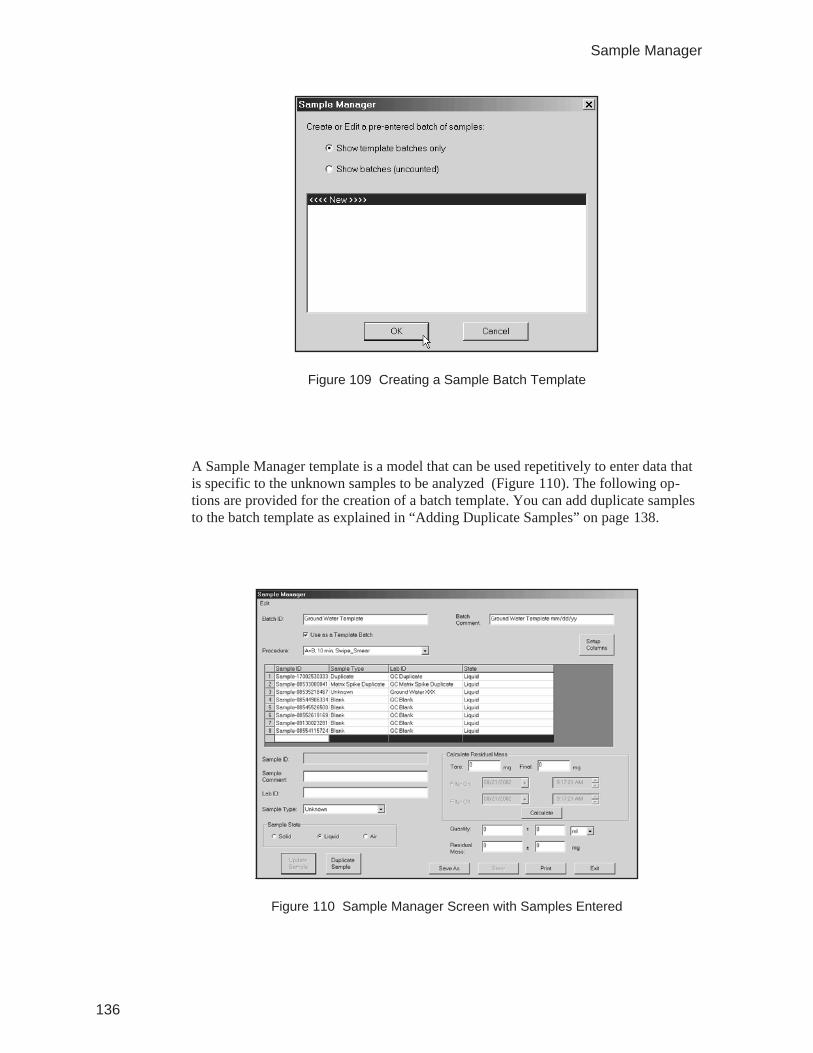
A Sample Manager template is a model that can be used repetitively to enter data thatis specific to the unknown samples to be analyzed (Figure 110). The following op-tions are provided for the creation of a batch template. You can add duplicate samplesto the batch template as explained in “Adding Duplicate Samples” on page 138.
136
Sample Manager
Figure 109 Creating a Sample Batch Template
Figure 110 Sample Manager Screen with Samples Entered
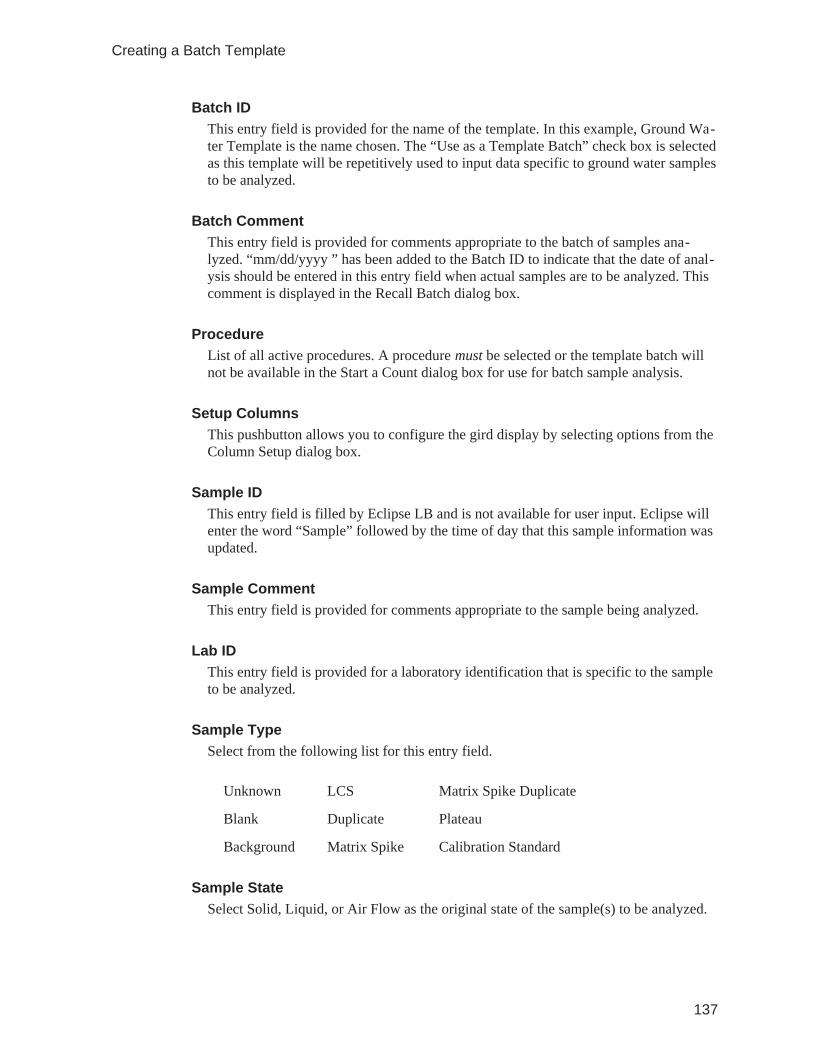
Batch IDThis entry field is provided for the name of the template. In this example, Ground Wa-ter Template is the name chosen. The “Use as a Template Batch” check box is selectedas this template will be repetitively used to input data specific to ground water samplesto be analyzed.
Batch CommentThis entry field is provided for comments appropriate to the batch of samples ana-lyzed. “mm/dd/yyyy ” has been added to the Batch ID to indicate that the date of anal-ysis should be entered in this entry field when actual samples are to be analyzed. Thiscomment is displayed in the Recall Batch dialog box.
ProcedureList of all active procedures. A procedure must be selected or the template batch willnot be available in the Start a Count dialog box for use for batch sample analysis.
Setup ColumnsThis pushbutton allows you to configure the gird display by selecting options from theColumn Setup dialog box.
Sample IDThis entry field is filled by Eclipse LB and is not available for user input. Eclipse willenter the word “Sample” followed by the time of day that this sample information wasupdated.
Sample CommentThis entry field is provided for comments appropriate to the sample being analyzed.
Lab IDThis entry field is provided for a laboratory identification that is specific to the sampleto be analyzed.
Sample TypeSelect from the following list for this entry field.
Unknown LCS Matrix Spike Duplicate
Blank Duplicate Plateau
Background Matrix Spike Calibration Standard
Sample StateSelect Solid, Liquid, or Air Flow as the original state of the sample(s) to be analyzed.
137
Creating a Batch Template
Calculate Residual MassIf a solid or liquid sample type was selected, the Calculate Residual Mass group boxallows you to enter the Tare and Final weights of the sample. Once entered click onthe Calculate button the residual mass of the sample will be determined by subtractingthe Tare weight from the Final weight.
Calculate FlowIf an air sample type was selected, the Calculate Flow group box allows you to enterthe Start and End flow rate of the sample and the Filter On and Filter Off dates andtimes. Once entered click on the Calculate button to calculate the total volume of orthat passed through sample.
QuantityThis is the quantity of the original sample. If a 10-ml volume sample of ground wateris to be processed for analysis, and the results reported in activity per liter, then a valueof 0.01 should be entered into the first space. A value based on the error of that vol-ume should be entered into the second space and “l” selected for the units. You canchoose cf. (cubic feet), l (liters) or ml (milliliter’s) for the sample Quantity value.
Residual MassThis is the weight of the actual sample to be analyzed. This information is important ifthe analysis results are to be attenuation corrected.
Update SampleClick on this button to enter information into the Sample Manager table
Duplicate SampleThis button will allow you to create one copy of a highlight sample at the end of abatch.
Once the values for the first sample, the blank in this example, have been entered, theoperator should click on the Update button to register this information in the tableshown at the top of the page. The information for the second sample can then be en-tered. Again, click on the Update button and continue with this process until all of thesamples for this template have been registered into the table.
Adding Duplicate SamplesWhen a batch of samples to be analyzed contains multiple samples of nearly identicalcharacteristics, Eclipse LB provides you with a quick and convenient method of add-ing these duplicate samples to the batch template. In this example, seven unknownsamples will be analyzed. Once the information for the first unknown sample has beenentered, you must click on the Update button to register this information into the Sam-ple Manager table. The next row down will become highlighted for entry of informa-tion for the next sample.
138
Sample Manager
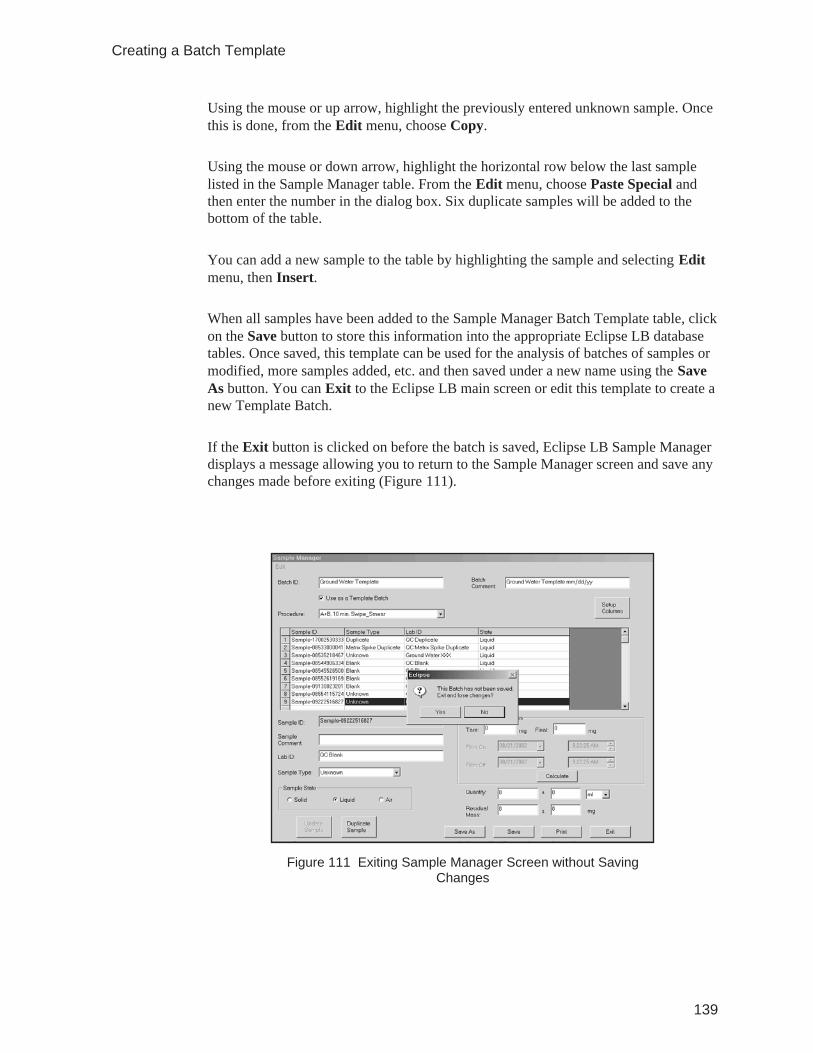
Using the mouse or up arrow, highlight the previously entered unknown sample. Oncethis is done, from the Edit menu, choose Copy.
Using the mouse or down arrow, highlight the horizontal row below the last samplelisted in the Sample Manager table. From the Edit menu, choose Paste Special andthen enter the number in the dialog box. Six duplicate samples will be added to thebottom of the table.
You can add a new sample to the table by highlighting the sample and selecting Editmenu, then Insert.
When all samples have been added to the Sample Manager Batch Template table, clickon the Save button to store this information into the appropriate Eclipse LB databasetables. Once saved, this template can be used for the analysis of batches of samples ormodified, more samples added, etc. and then saved under a new name using the SaveAs button. You can Exit to the Eclipse LB main screen or edit this template to create anew Template Batch.
If the Exit button is clicked on before the batch is saved, Eclipse LB Sample Managerdisplays a message allowing you to return to the Sample Manager screen and save anychanges made before exiting (Figure 111).
139
Creating a Batch Template
Figure 111 Exiting Sample Manager Screen without SavingChanges
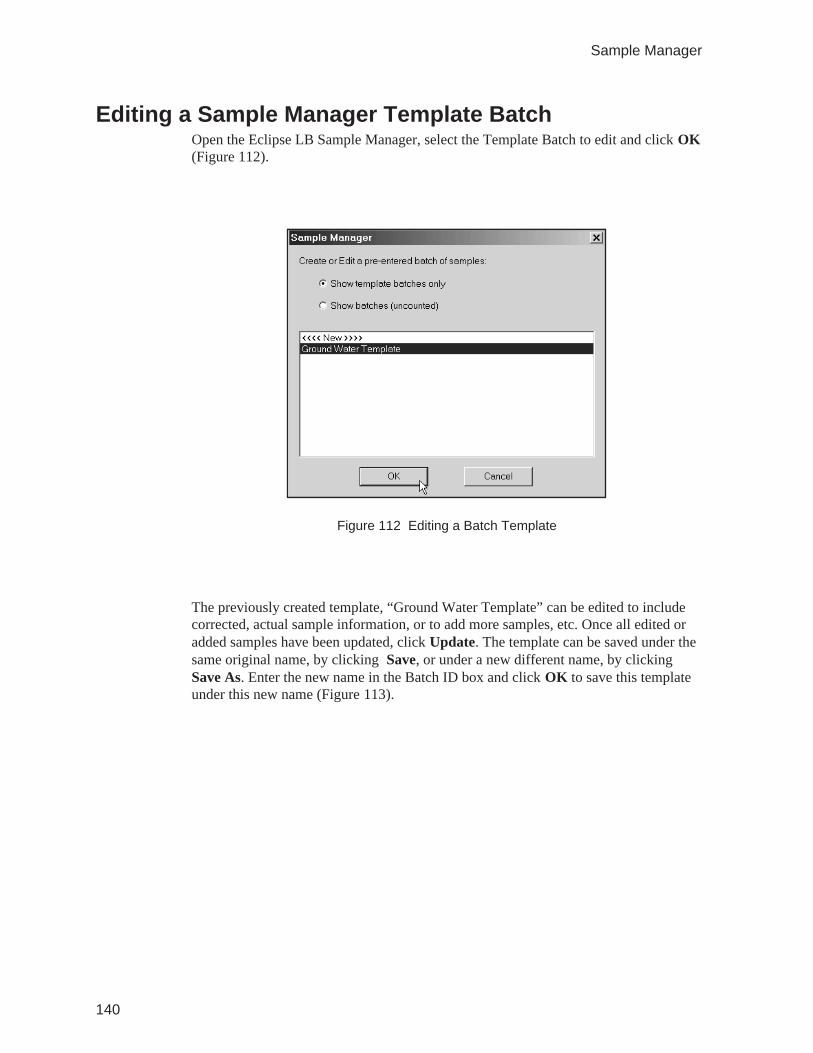
Editing a Sample Manager Template BatchOpen the Eclipse LB Sample Manager, select the Template Batch to edit and click OK(Figure 112).
The previously created template, “Ground Water Template” can be edited to includecorrected, actual sample information, or to add more samples, etc. Once all edited oradded samples have been updated, click Update. The template can be saved under thesame original name, by clicking Save, or under a new different name, by clickingSave As. Enter the new name in the Batch ID box and click OK to save this templateunder this new name (Figure 113).
140
Sample Manager
Figure 112 Editing a Batch Template
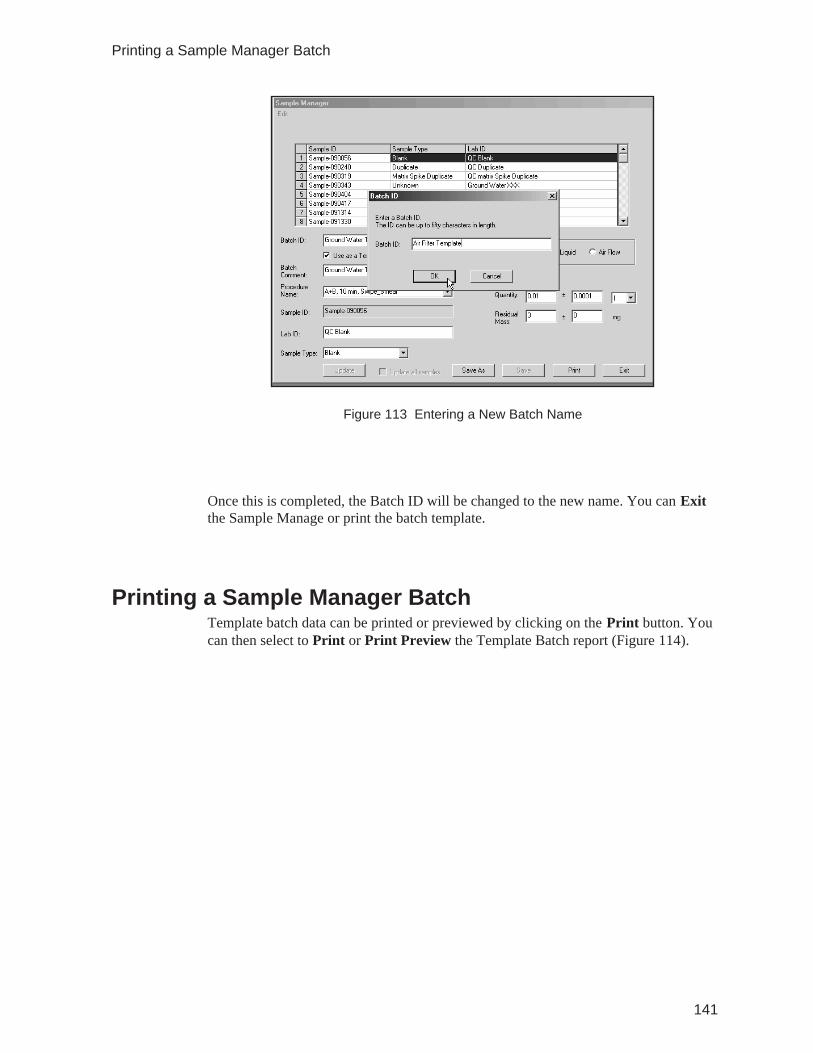
Once this is completed, the Batch ID will be changed to the new name. You can Exitthe Sample Manage or print the batch template.
Printing a Sample Manager BatchTemplate batch data can be printed or previewed by clicking on the Print button. Youcan then select to Print or Print Preview the Template Batch report (Figure 114).
141
Printing a Sample Manager Batch
Figure 113 Entering a New Batch Name
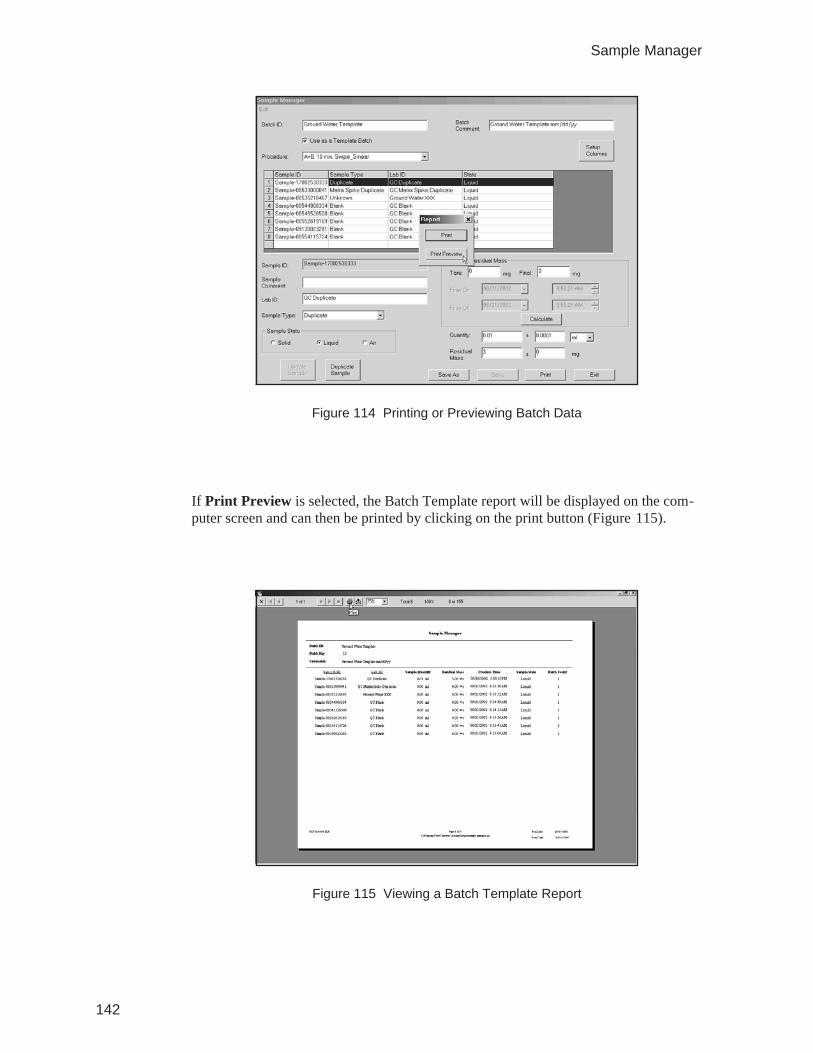
If Print Preview is selected, the Batch Template report will be displayed on the com-puter screen and can then be printed by clicking on the print button (Figure 115).
142
Sample Manager
Figure 114 Printing or Previewing Batch Data
Figure 115 Viewing a Batch Template Report
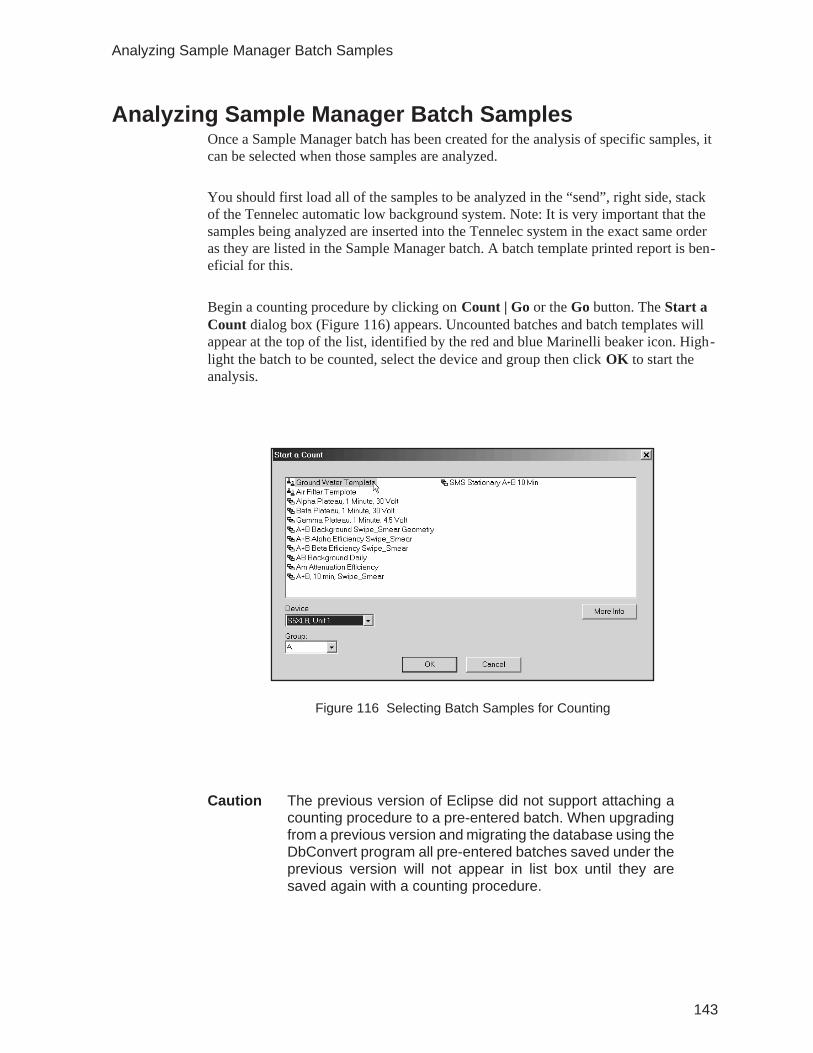
Analyzing Sample Manager Batch SamplesOnce a Sample Manager batch has been created for the analysis of specific samples, itcan be selected when those samples are analyzed.
You should first load all of the samples to be analyzed in the “send”, right side, stackof the Tennelec automatic low background system. Note: It is very important that thesamples being analyzed are inserted into the Tennelec system in the exact same orderas they are listed in the Sample Manager batch. A batch template printed report is ben-eficial for this.
Begin a counting procedure by clicking on Count | Go or the Go button. The Start aCount dialog box (Figure 116) appears. Uncounted batches and batch templates willappear at the top of the list, identified by the red and blue Marinelli beaker icon. High-light the batch to be counted, select the device and group then click OK to start theanalysis.
Caution The previous version of Eclipse did not support attaching acounting procedure to a pre-entered batch. When upgradingfrom a previous version and migrating the database using theDbConvert program all pre-entered batches saved under theprevious version will not appear in list box until they aresaved again with a counting procedure.
143
Analyzing Sample Manager Batch Samples
Figure 116 Selecting Batch Samples for Counting

The ability to attach a procedure to a pre-entered batch atrun-time will no longer be allowed, as was capable in theprevious version. All pre-entered batches must be definedwith a counting procedure.
Clicking on the More Info button displays the Eclipse LB Sample Manager screen forthe selected batch template. Exit returns you to the Start a Count dialog box.
Once this batch of samples has been counted, you can double-click on any sample onthe Samples tab screen and view the information attached to this batch of samples us-ing the Eclipse LB Sample Manager or click on the Status tab to view a summary ofthe procedure selected with the batch template.
144
Sample Manager
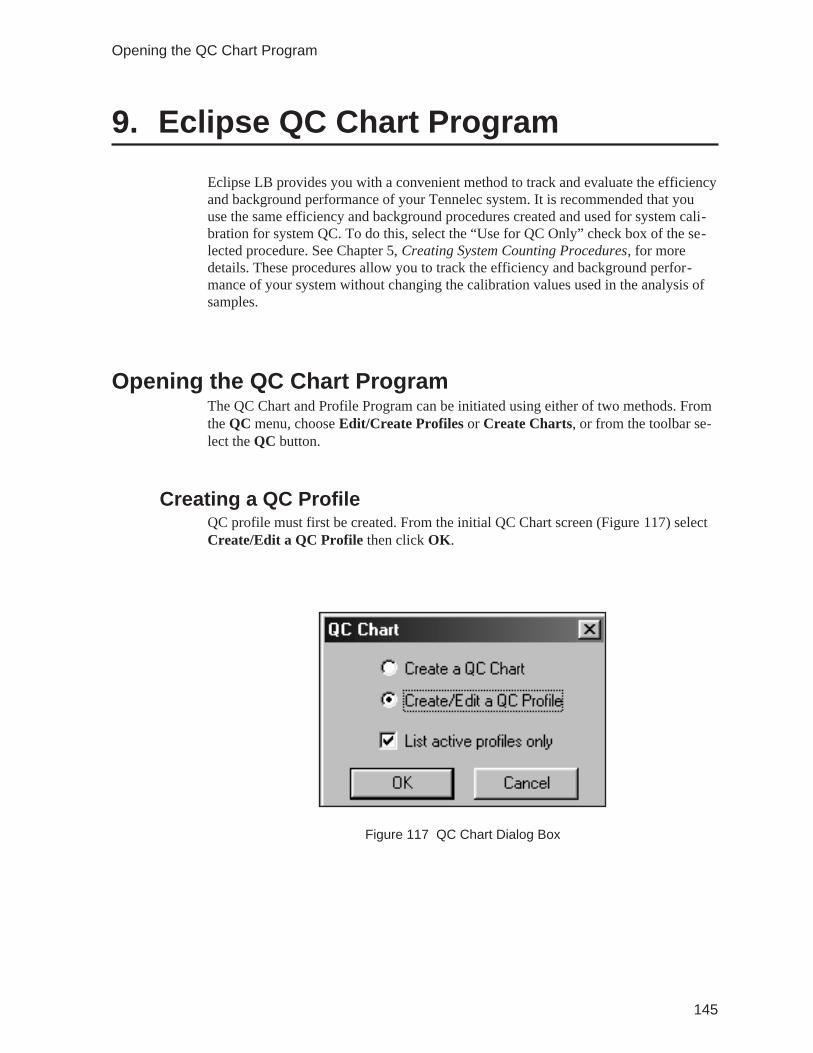
9. Eclipse QC Chart Program
Eclipse LB provides you with a convenient method to track and evaluate the efficiencyand background performance of your Tennelec system. It is recommended that youuse the same efficiency and background procedures created and used for system cali-bration for system QC. To do this, select the “Use for QC Only” check box of the se-lected procedure. See Chapter 5, Creating System Counting Procedures, for moredetails. These procedures allow you to track the efficiency and background perfor-mance of your system without changing the calibration values used in the analysis ofsamples.
Opening the QC Chart ProgramThe QC Chart and Profile Program can be initiated using either of two methods. Fromthe QC menu, choose Edit/Create Profiles or Create Charts, or from the toolbar se-lect the QC button.
Creating a QC ProfileQC profile must first be created. From the initial QC Chart screen (Figure 117) selectCreate/Edit a QC Profile then click OK.
145
Opening the QC Chart Program
Figure 117 QC Chart Dialog Box
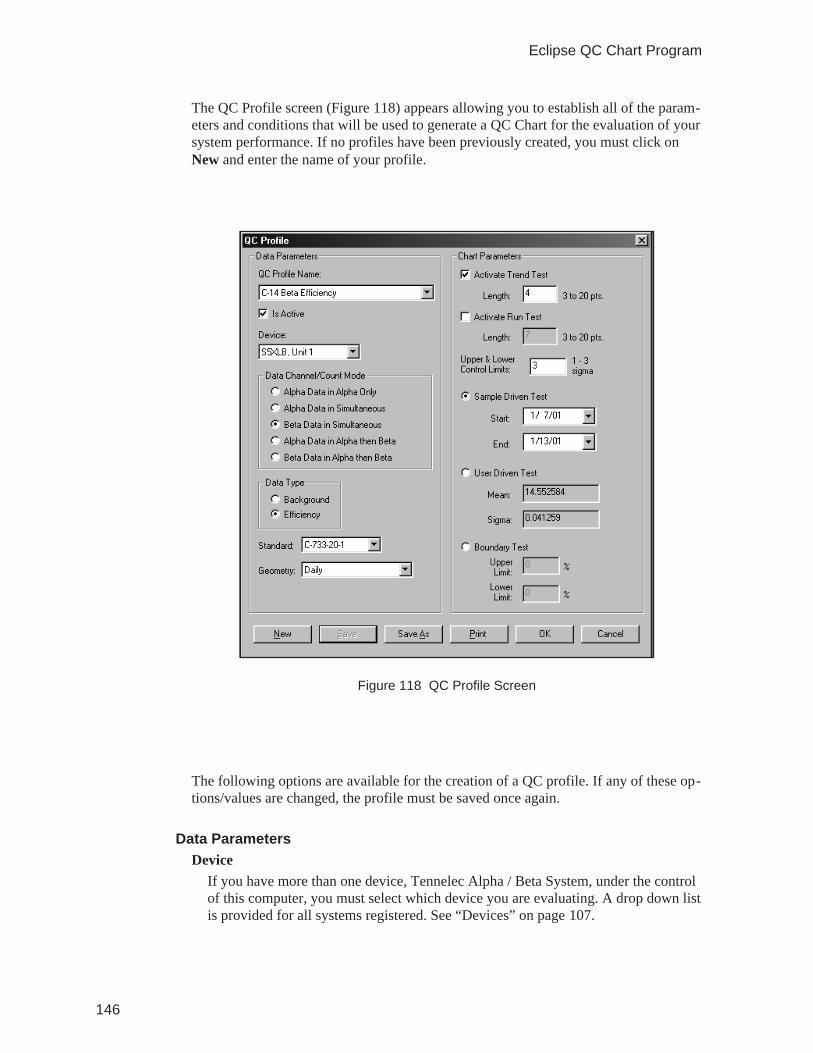
The QC Profile screen (Figure 118) appears allowing you to establish all of the param-eters and conditions that will be used to generate a QC Chart for the evaluation of yoursystem performance. If no profiles have been previously created, you must click onNew and enter the name of your profile.
The following options are available for the creation of a QC profile. If any of these op-tions/values are changed, the profile must be saved once again.
Data ParametersDevice
If you have more than one device, Tennelec Alpha / Beta System, under the controlof this computer, you must select which device you are evaluating. A drop down listis provided for all systems registered. See “Devices” on page 107.
146
Eclipse QC Chart Program
Figure 118 QC Profile Screen
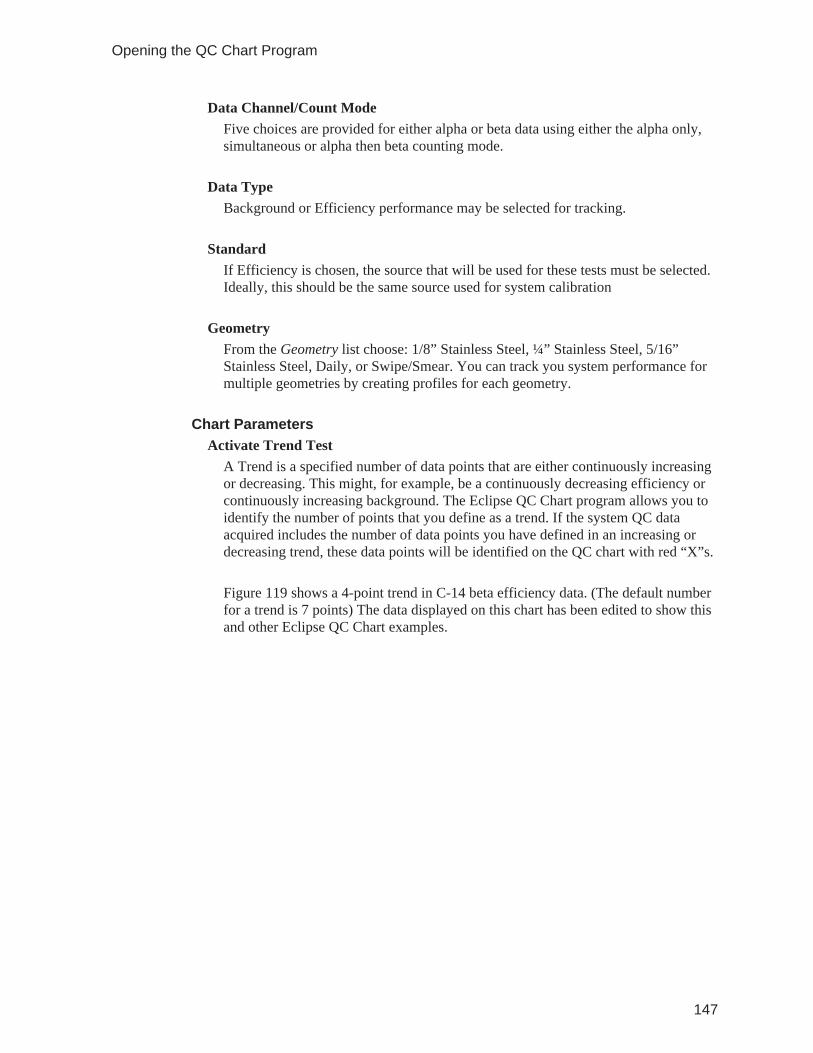
Data Channel/Count ModeFive choices are provided for either alpha or beta data using either the alpha only,simultaneous or alpha then beta counting mode.
Data TypeBackground or Efficiency performance may be selected for tracking.
StandardIf Efficiency is chosen, the source that will be used for these tests must be selected.Ideally, this should be the same source used for system calibration
GeometryFrom the Geometry list choose: 1/8” Stainless Steel, ¼” Stainless Steel, 5/16”Stainless Steel, Daily, or Swipe/Smear. You can track you system performance formultiple geometries by creating profiles for each geometry.
Chart ParametersActivate Trend Test
A Trend is a specified number of data points that are either continuously increasingor decreasing. This might, for example, be a continuously decreasing efficiency orcontinuously increasing background. The Eclipse QC Chart program allows you toidentify the number of points that you define as a trend. If the system QC dataacquired includes the number of data points you have defined in an increasing ordecreasing trend, these data points will be identified on the QC chart with red “X”s.
Figure 119 shows a 4-point trend in C-14 beta efficiency data. (The default numberfor a trend is 7 points) The data displayed on this chart has been edited to show thisand other Eclipse QC Chart examples.
147
Opening the QC Chart Program
Activate Run TestA run is a series of data points that are consistently above or below the mean value.Under normal operating conditions, efficiency QC values and background QCvalues will vary above and below the mean efficiency or background value. If, forexample, the efficiency data points are consistently below the mean or if thebackground is consistently above the mean, the system may have a problem. Theefficiency standard may have been placed in a deeper insert than normal, resultingin a lower efficiency or the detector window may have become contaminated,resulting in a higher than normal background. Whatever the cause, a “run” indicatesthat something is different about the system and should be investigated.
Figure 120 shows a run of seven C-14 efficiency data points above a meanefficiency value of 14.5%. This mean efficiency value was created using theBoundary Test described on page 150.
148
Eclipse QC Chart Program
Figure 119 C-14 Beta Efficiency Chart with a Four Point Trend
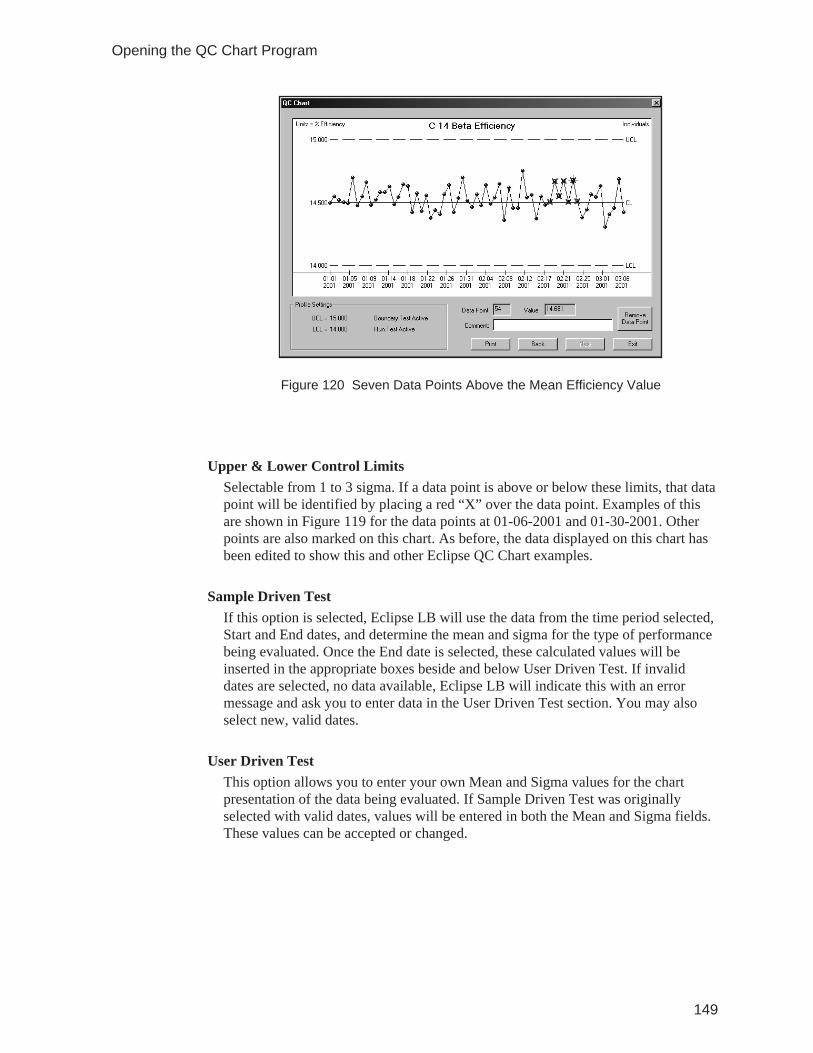
Upper & Lower Control LimitsSelectable from 1 to 3 sigma. If a data point is above or below these limits, that datapoint will be identified by placing a red “X” over the data point. Examples of thisare shown in Figure 119 for the data points at 01-06-2001 and 01-30-2001. Otherpoints are also marked on this chart. As before, the data displayed on this chart hasbeen edited to show this and other Eclipse QC Chart examples.
Sample Driven TestIf this option is selected, Eclipse LB will use the data from the time period selected,Start and End dates, and determine the mean and sigma for the type of performancebeing evaluated. Once the End date is selected, these calculated values will beinserted in the appropriate boxes beside and below User Driven Test. If invaliddates are selected, no data available, Eclipse LB will indicate this with an errormessage and ask you to enter data in the User Driven Test section. You may alsoselect new, valid dates.
User Driven TestThis option allows you to enter your own Mean and Sigma values for the chartpresentation of the data being evaluated. If Sample Driven Test was originallyselected with valid dates, values will be entered in both the Mean and Sigma fields.These values can be accepted or changed.
149
Opening the QC Chart Program
Figure 120 Seven Data Points Above the Mean Efficiency Value
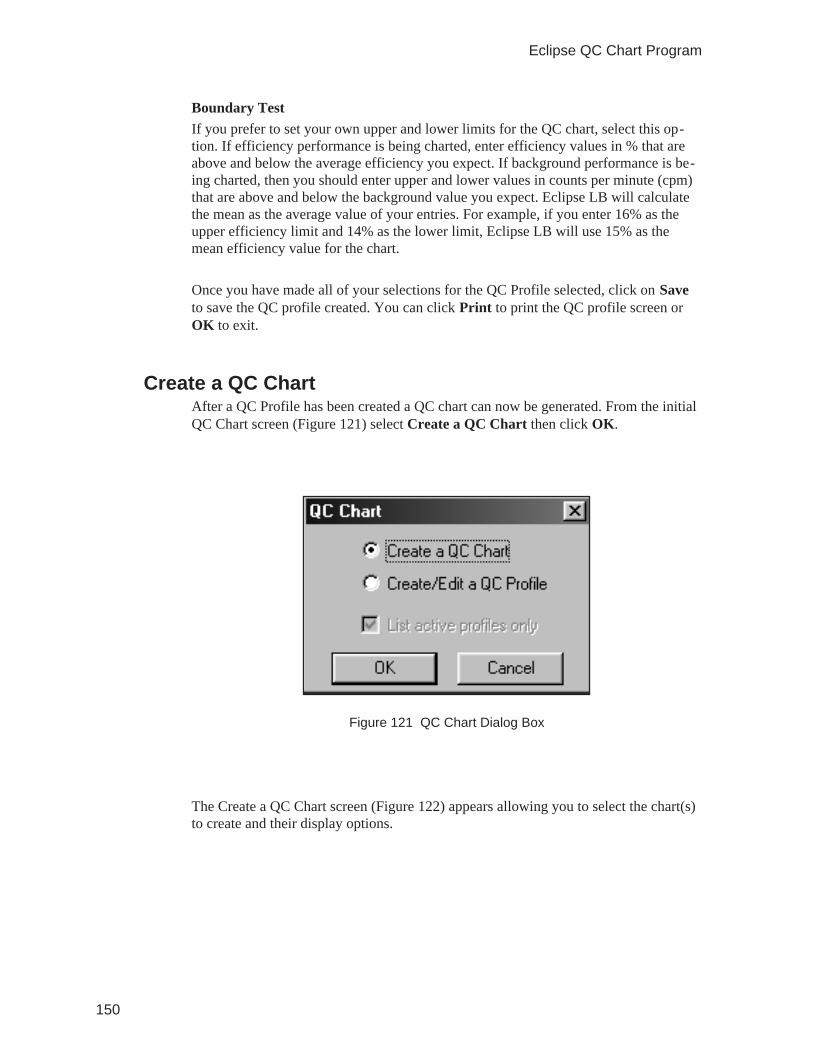
Boundary TestIf you prefer to set your own upper and lower limits for the QC chart, select this op-tion. If efficiency performance is being charted, enter efficiency values in % that areabove and below the average efficiency you expect. If background performance is be-ing charted, then you should enter upper and lower values in counts per minute (cpm)that are above and below the background value you expect. Eclipse LB will calculatethe mean as the average value of your entries. For example, if you enter 16% as theupper efficiency limit and 14% as the lower limit, Eclipse LB will use 15% as themean efficiency value for the chart.
Once you have made all of your selections for the QC Profile selected, click on Saveto save the QC profile created. You can click Print to print the QC profile screen orOK to exit.
Create a QC ChartAfter a QC Profile has been created a QC chart can now be generated. From the initialQC Chart screen (Figure 121) select Create a QC Chart then click OK.
The Create a QC Chart screen (Figure 122) appears allowing you to select the chart(s)to create and their display options.
150
Eclipse QC Chart Program
Figure 121 QC Chart Dialog Box
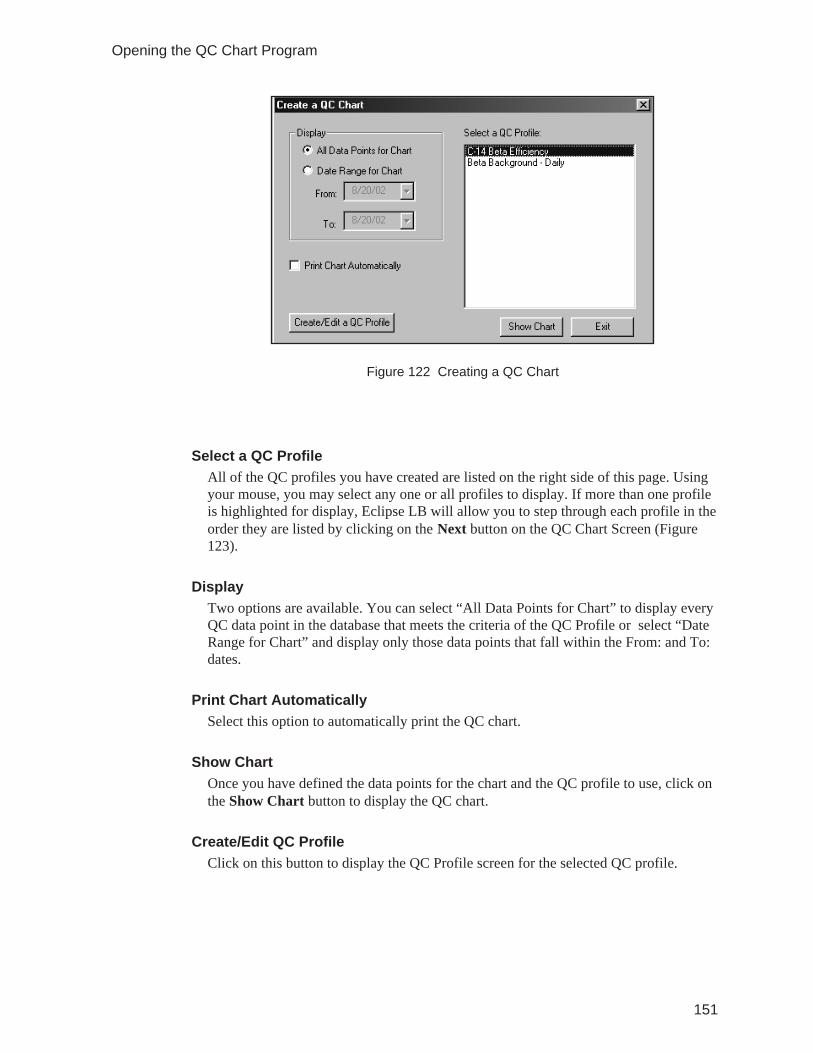
Select a QC ProfileAll of the QC profiles you have created are listed on the right side of this page. Usingyour mouse, you may select any one or all profiles to display. If more than one profileis highlighted for display, Eclipse LB will allow you to step through each profile in theorder they are listed by clicking on the Next button on the QC Chart Screen (Figure123).
DisplayTwo options are available. You can select “All Data Points for Chart” to display everyQC data point in the database that meets the criteria of the QC Profile or select “DateRange for Chart” and display only those data points that fall within the From: and To:dates.
Print Chart AutomaticallySelect this option to automatically print the QC chart.
Show ChartOnce you have defined the data points for the chart and the QC profile to use, click onthe Show Chart button to display the QC chart.
Create/Edit QC ProfileClick on this button to display the QC Profile screen for the selected QC profile.
151
Opening the QC Chart Program
Figure 122 Creating a QC Chart
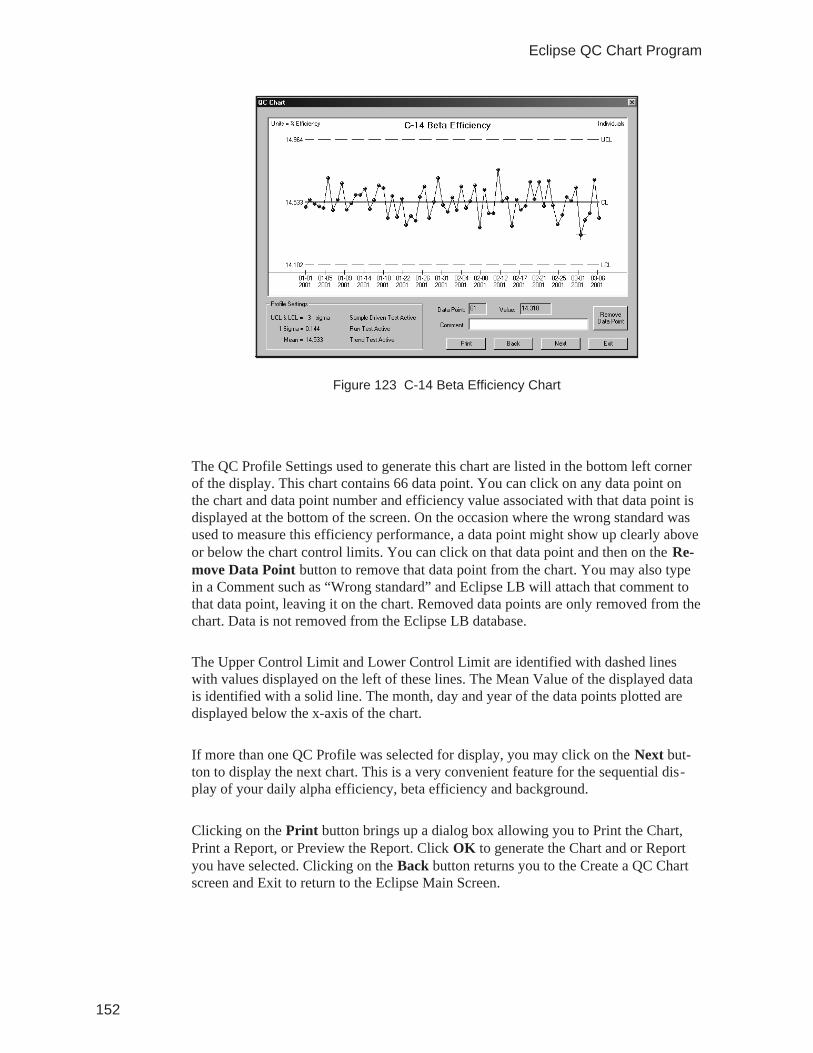
The QC Profile Settings used to generate this chart are listed in the bottom left cornerof the display. This chart contains 66 data point. You can click on any data point onthe chart and data point number and efficiency value associated with that data point isdisplayed at the bottom of the screen. On the occasion where the wrong standard wasused to measure this efficiency performance, a data point might show up clearly aboveor below the chart control limits. You can click on that data point and then on the Re-move Data Point button to remove that data point from the chart. You may also typein a Comment such as “Wrong standard” and Eclipse LB will attach that comment tothat data point, leaving it on the chart. Removed data points are only removed from thechart. Data is not removed from the Eclipse LB database.
The Upper Control Limit and Lower Control Limit are identified with dashed lineswith values displayed on the left of these lines. The Mean Value of the displayed datais identified with a solid line. The month, day and year of the data points plotted aredisplayed below the x-axis of the chart.
If more than one QC Profile was selected for display, you may click on the Next but-ton to display the next chart. This is a very convenient feature for the sequential dis-play of your daily alpha efficiency, beta efficiency and background.
Clicking on the Print button brings up a dialog box allowing you to Print the Chart,Print a Report, or Preview the Report. Click OK to generate the Chart and or Reportyou have selected. Clicking on the Back button returns you to the Create a QC Chartscreen and Exit to return to the Eclipse Main Screen.
152
Eclipse QC Chart Program
Figure 123 C-14 Beta Efficiency Chart
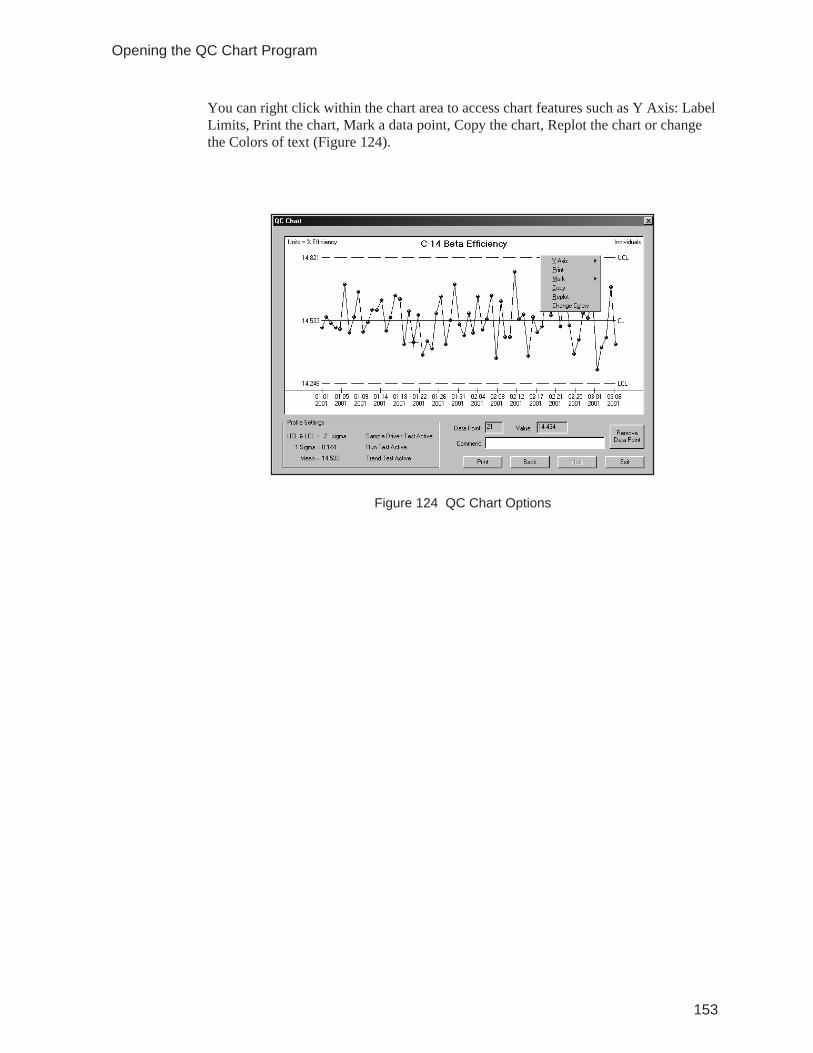
You can right click within the chart area to access chart features such as Y Axis: LabelLimits, Print the chart, Mark a data point, Copy the chart, Replot the chart or changethe Colors of text (Figure 124).
153
Opening the QC Chart Program
Figure 124 QC Chart Options
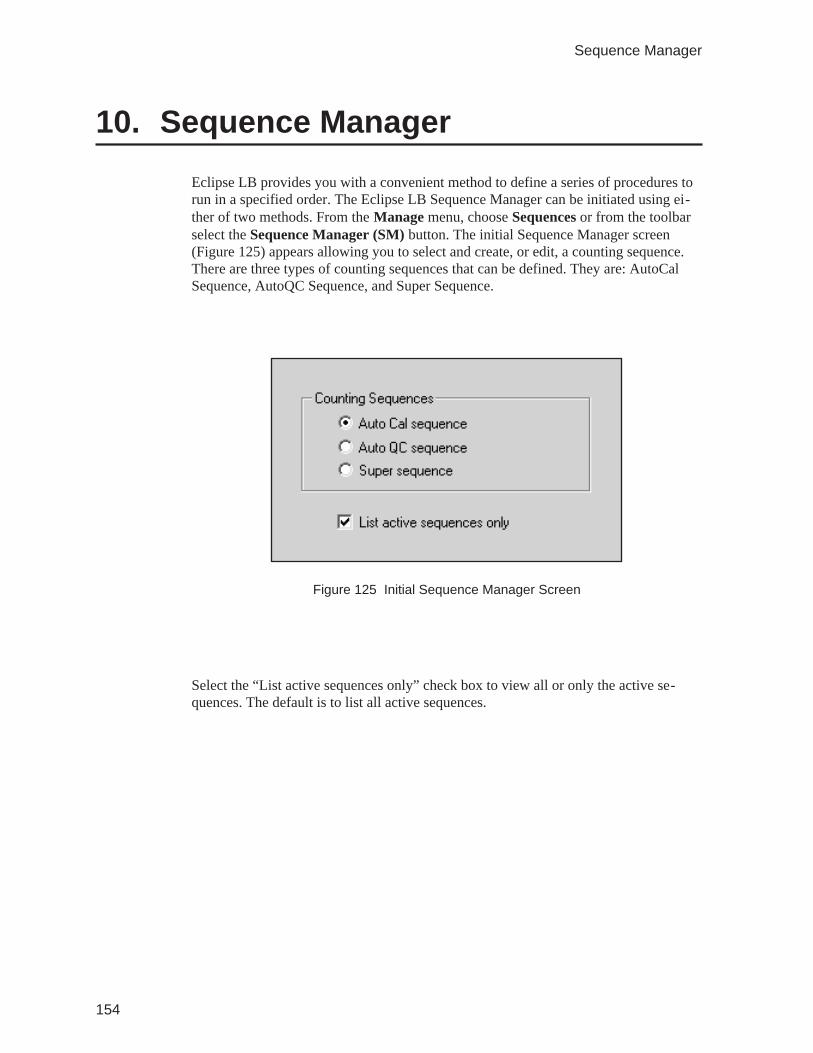
10. Sequence Manager
Eclipse LB provides you with a convenient method to define a series of procedures torun in a specified order. The Eclipse LB Sequence Manager can be initiated using ei-ther of two methods. From the Manage menu, choose Sequences or from the toolbarselect the Sequence Manager (SM) button. The initial Sequence Manager screen(Figure 125) appears allowing you to select and create, or edit, a counting sequence.There are three types of counting sequences that can be defined. They are: AutoCalSequence, AutoQC Sequence, and Super Sequence.
Select the “List active sequences only” check box to view all or only the active se-quences. The default is to list all active sequences.
154
Sequence Manager
Figure 125 Initial Sequence Manager Screen
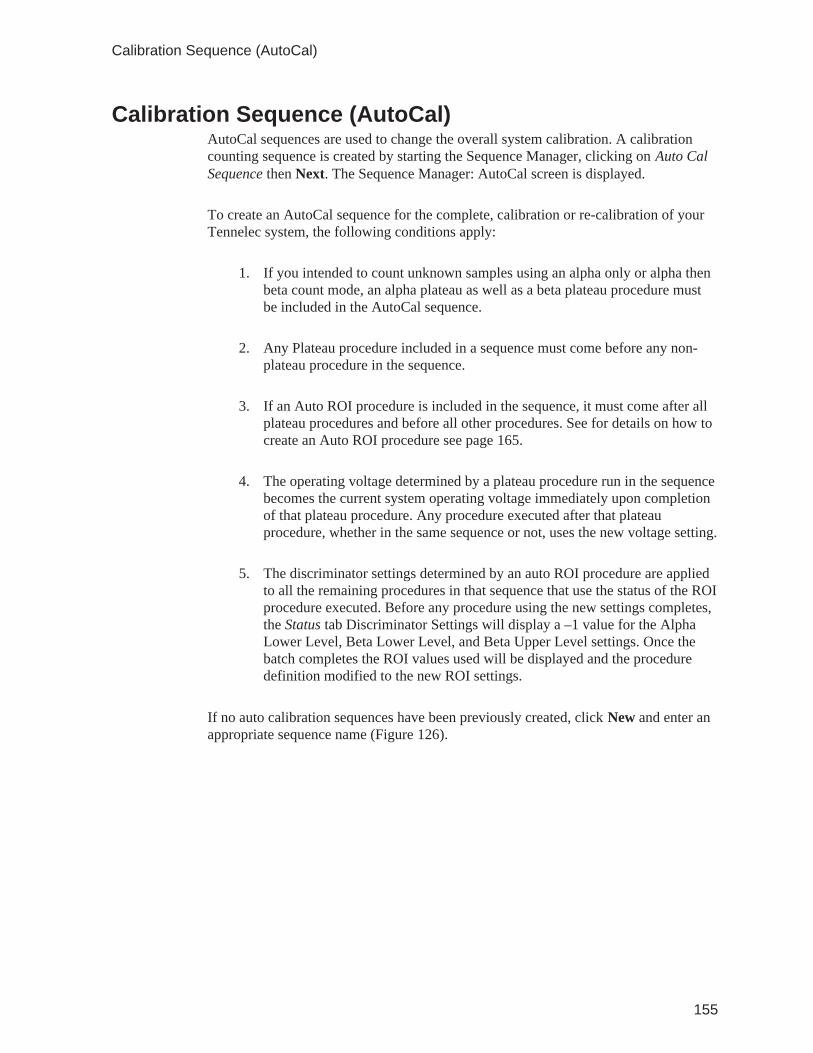
Calibration Sequence (AutoCal)AutoCal sequences are used to change the overall system calibration. A calibrationcounting sequence is created by starting the Sequence Manager, clicking on Auto CalSequence then Next. The Sequence Manager: AutoCal screen is displayed.
To create an AutoCal sequence for the complete, calibration or re-calibration of yourTennelec system, the following conditions apply:
1. If you intended to count unknown samples using an alpha only or alpha thenbeta count mode, an alpha plateau as well as a beta plateau procedure mustbe included in the AutoCal sequence.
2. Any Plateau procedure included in a sequence must come before any non-plateau procedure in the sequence.
3. If an Auto ROI procedure is included in the sequence, it must come after allplateau procedures and before all other procedures. See for details on how tocreate an Auto ROI procedure see page 165.
4. The operating voltage determined by a plateau procedure run in the sequencebecomes the current system operating voltage immediately upon completionof that plateau procedure. Any procedure executed after that plateauprocedure, whether in the same sequence or not, uses the new voltage setting.
5. The discriminator settings determined by an auto ROI procedure are appliedto all the remaining procedures in that sequence that use the status of the ROIprocedure executed. Before any procedure using the new settings completes,the Status tab Discriminator Settings will display a –1 value for the AlphaLower Level, Beta Lower Level, and Beta Upper Level settings. Once thebatch completes the ROI values used will be displayed and the proceduredefinition modified to the new ROI settings.
If no auto calibration sequences have been previously created, click New and enter anappropriate sequence name (Figure 126).
155
Calibration Sequence (AutoCal)
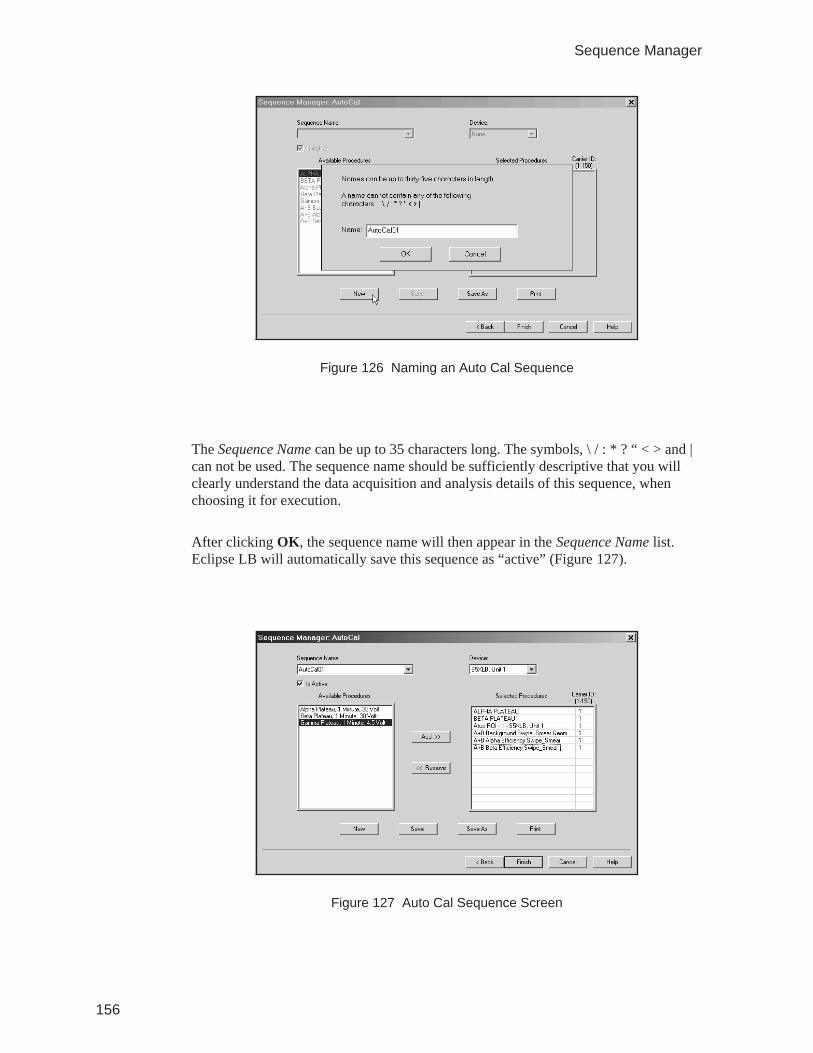
The Sequence Name can be up to 35 characters long. The symbols, \ / : * ? “ < > and |can not be used. The sequence name should be sufficiently descriptive that you willclearly understand the data acquisition and analysis details of this sequence, whenchoosing it for execution.
After clicking OK, the sequence name will then appear in the Sequence Name list.Eclipse LB will automatically save this sequence as “active” (Figure 127).
156
Sequence Manager
Figure 126 Naming an Auto Cal Sequence
Figure 127 Auto Cal Sequence Screen
The following options are available for the creation of a automatic calibration se-quence. If any of these options/values are changed, the procedure must be saved onceagain.
Is ActiveSelecting the Is Active check box will change an active status to inactive and an inac-tive status to active. The default for Auto Cal sequence is Active. Inactive sequencesare not available for use.
DeviceAny registered counting system; default is None.
This selection will override any predefined devices within the individual proceduresmaking up this sequence. Note: this option requires firmware version 3.0 or higher.
Available ProceduresThis is a list of all active calibration procedures: Plateau, Background, and Efficiencyplus all Auto ROI procedures. When defining an AutoCal sequence all Backgroundand Efficiency procedures previously counted are available for use. A vertical scrollbar will appear, if necessary, to allow viewing of all procedures in the list box.
Selected ProceduresThis is a list of all calibration procedures that currently define this AutoCal sequence.A vertical scroll bar will appear, if necessary, to allow viewing of all selected proce-dures.
Within this list box you must define the ID number of the sample carrier containingthe standard or Background media for the selected procedure. The carrier plate IDs donot have to be unique.
Note: The selected procedures will execute in the order displayed in the SelectedProcedures list box.
Add ButtonThe Add button is used to add the procedure selected in the Available Procedures listbox and to add it to the Selected Procedures list box.
Remove ButtonThe Remove button is used to remove the procedure selected in the Selected Proce-dures list box to the Available Procedures list box. This selection will then be addedback into the Available Procedures list box.
157
Calibration Sequence (AutoCal)
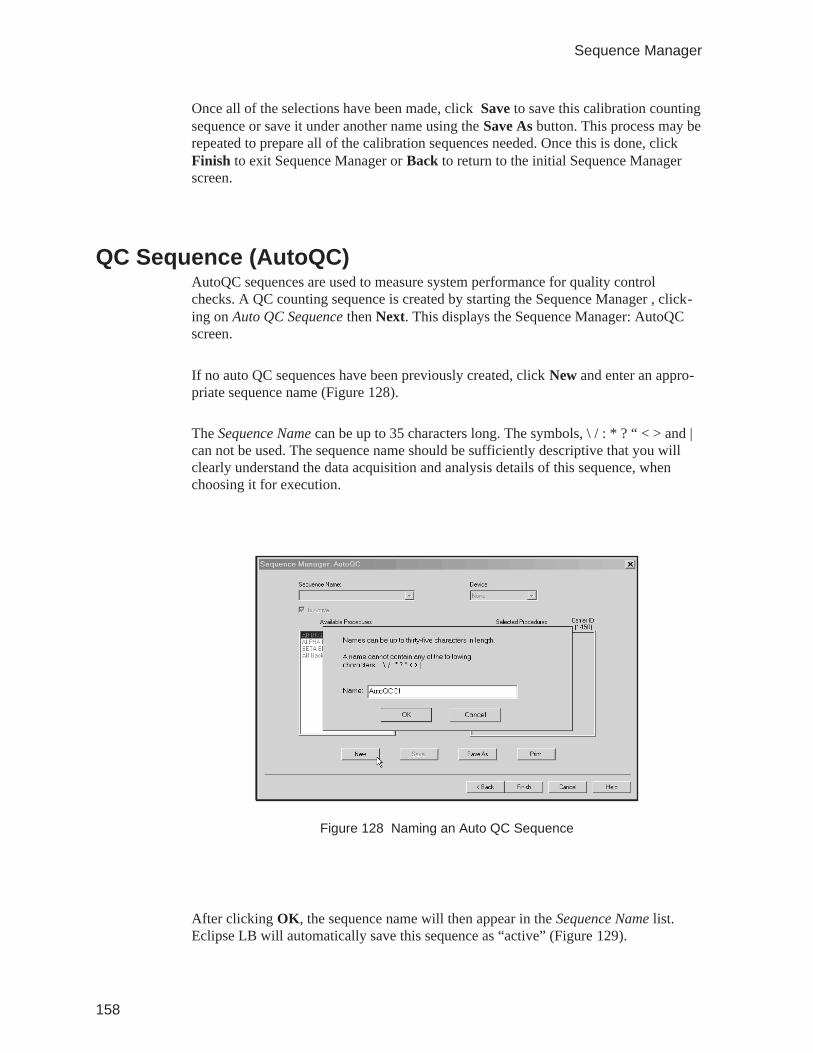
Once all of the selections have been made, click Save to save this calibration countingsequence or save it under another name using the Save As button. This process may berepeated to prepare all of the calibration sequences needed. Once this is done, clickFinish to exit Sequence Manager or Back to return to the initial Sequence Managerscreen.
QC Sequence (AutoQC)AutoQC sequences are used to measure system performance for quality controlchecks. A QC counting sequence is created by starting the Sequence Manager , click-ing on Auto QC Sequence then Next. This displays the Sequence Manager: AutoQCscreen.
If no auto QC sequences have been previously created, click New and enter an appro-priate sequence name (Figure 128).
The Sequence Name can be up to 35 characters long. The symbols, \ / : * ? “ < > and |can not be used. The sequence name should be sufficiently descriptive that you willclearly understand the data acquisition and analysis details of this sequence, whenchoosing it for execution.
After clicking OK, the sequence name will then appear in the Sequence Name list.Eclipse LB will automatically save this sequence as “active” (Figure 129).
158
Sequence Manager
Figure 128 Naming an Auto QC Sequence
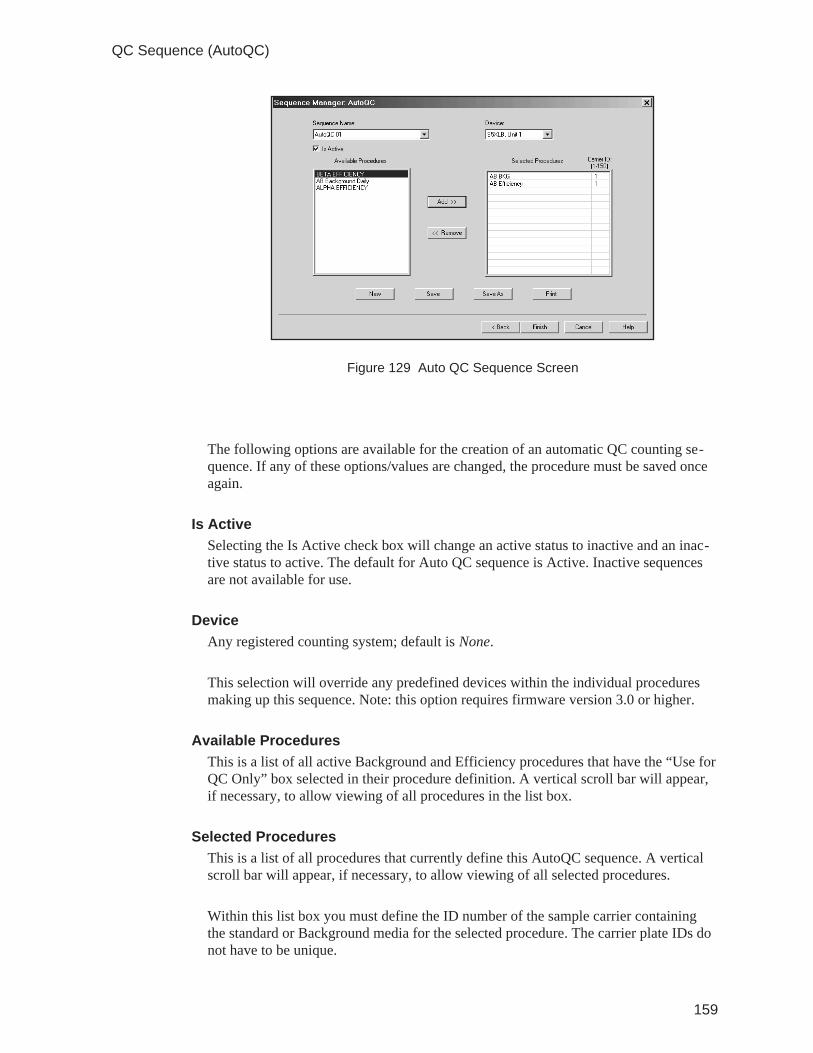
The following options are available for the creation of an automatic QC counting se-quence. If any of these options/values are changed, the procedure must be saved onceagain.
Is ActiveSelecting the Is Active check box will change an active status to inactive and an inac-tive status to active. The default for Auto QC sequence is Active. Inactive sequencesare not available for use.
DeviceAny registered counting system; default is None.
This selection will override any predefined devices within the individual proceduresmaking up this sequence. Note: this option requires firmware version 3.0 or higher.
Available ProceduresThis is a list of all active Background and Efficiency procedures that have the “Use forQC Only” box selected in their procedure definition. A vertical scroll bar will appear,if necessary, to allow viewing of all procedures in the list box.
Selected ProceduresThis is a list of all procedures that currently define this AutoQC sequence. A verticalscroll bar will appear, if necessary, to allow viewing of all selected procedures.
Within this list box you must define the ID number of the sample carrier containingthe standard or Background media for the selected procedure. The carrier plate IDs donot have to be unique.
159
QC Sequence (AutoQC)
Figure 129 Auto QC Sequence Screen
Note: The selected procedures will execute in the order displayed in the SelectedProcedures list box.
Add Button
The Add button is used to add the procedure selected in the Available Procedures listbox to the Selected Procedures list box. This selection will then be removed from theAvailable Procedures list box.
Remove ButtonThe Remove button is used to remove the procedure selected in the Selected Proce-dures list box to the Available Procedures list box. This selection will then be addedback into the Available Procedures list box
Once all of the selections have been made, click Save to save this QC sequence orsave it under another name using the Save As button. This process may be repeated toprepare all of the QC sequences needed. Once this is done, click Finish to exit Se-quence Manager or Back to return to the initial Sequence Manager screen.
Super SequenceA Super sequence an extremely powerful feature of Eclipse LB. Any batch template,uncounted batch, QC sequence, calibration procedure with Use for QC checked, orsample counting procedure is available for use in a Super sequence. A Super sequenceis created by starting the Sequence Manager, clicking on Super Sequence then Next.The Sequence Manager: Super screen is displayed.
If no super sequences have been previously created, click New and enter an appropri-ate sequence name (Figure 130).
The Sequence Name can be up to 35 characters long. The symbols, \ / : * ? “ < > and |can not be used. The sequence name should be sufficiently descriptive that you willclearly understand the data acquisition and analysis details of this sequence, whenchoosing it for execution.
160
Sequence Manager
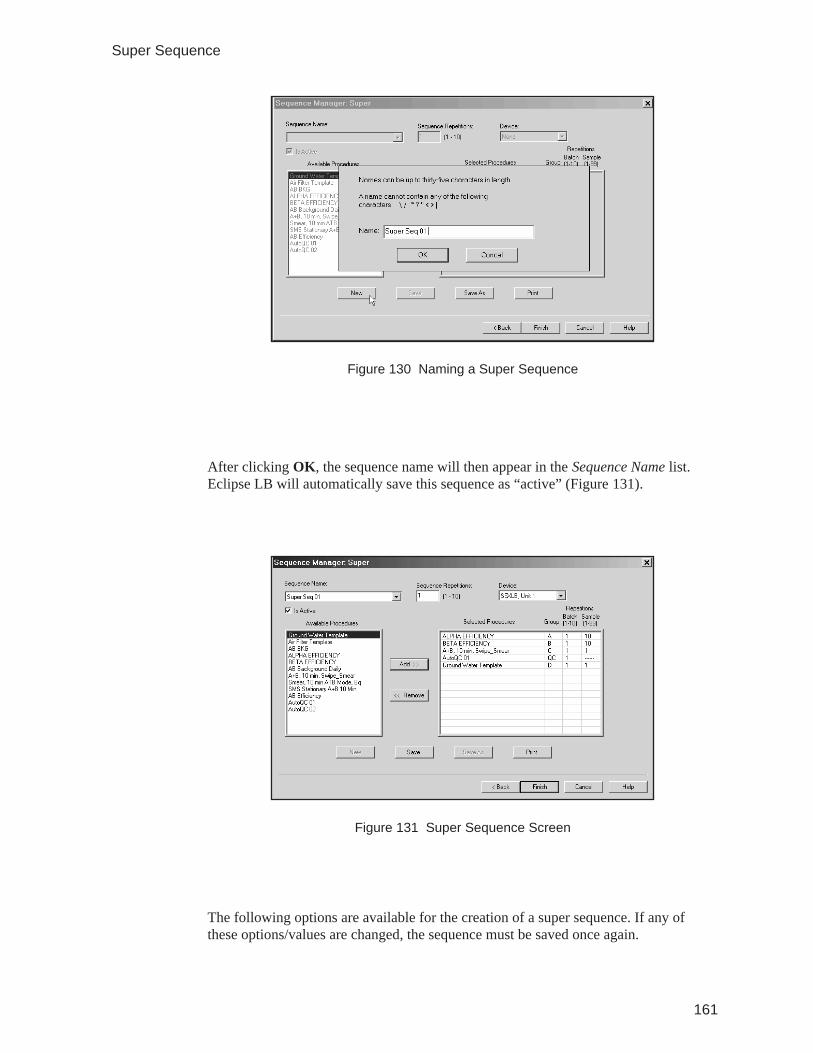
After clicking OK, the sequence name will then appear in the Sequence Name list.Eclipse LB will automatically save this sequence as “active” (Figure 131).
The following options are available for the creation of a super sequence. If any ofthese options/values are changed, the sequence must be saved once again.
161
Super Sequence
Figure 130 Naming a Super Sequence
Figure 131 Super Sequence Screen
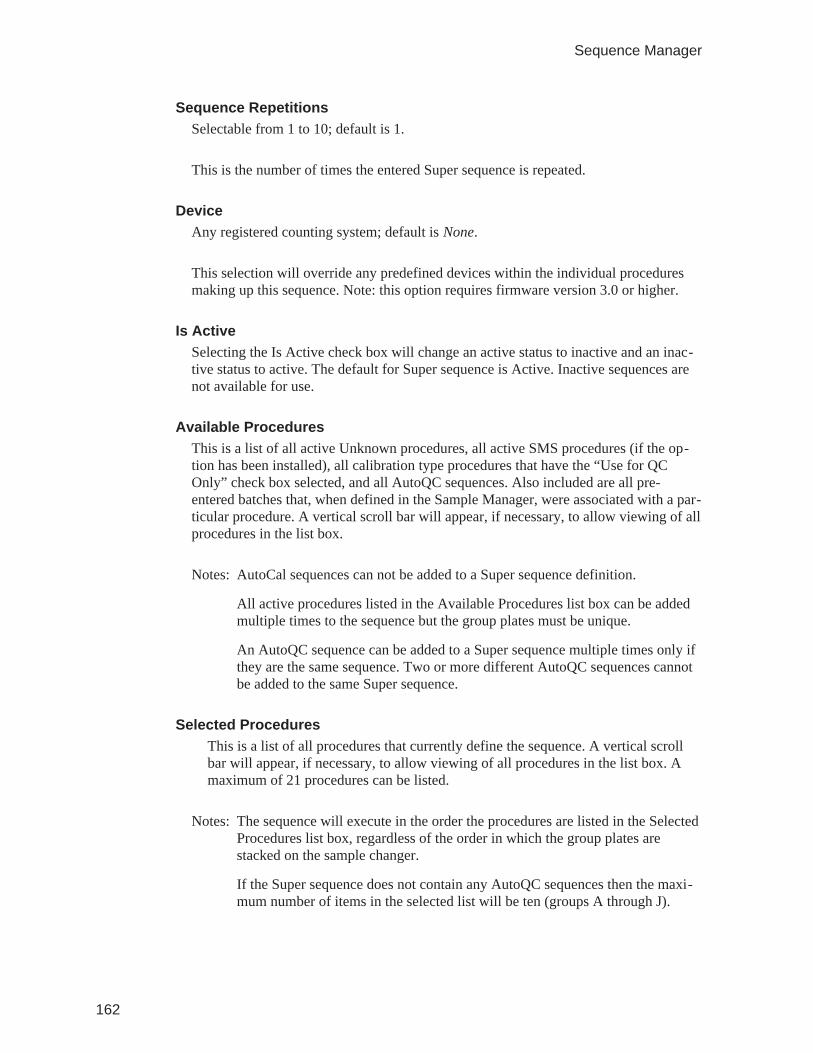
Sequence RepetitionsSelectable from 1 to 10; default is 1.
This is the number of times the entered Super sequence is repeated.
DeviceAny registered counting system; default is None.
This selection will override any predefined devices within the individual proceduresmaking up this sequence. Note: this option requires firmware version 3.0 or higher.
Is ActiveSelecting the Is Active check box will change an active status to inactive and an inac-tive status to active. The default for Super sequence is Active. Inactive sequences arenot available for use.
Available ProceduresThis is a list of all active Unknown procedures, all active SMS procedures (if the op-tion has been installed), all calibration type procedures that have the “Use for QCOnly” check box selected, and all AutoQC sequences. Also included are all pre-entered batches that, when defined in the Sample Manager, were associated with a par-ticular procedure. A vertical scroll bar will appear, if necessary, to allow viewing of allprocedures in the list box.
Notes: AutoCal sequences can not be added to a Super sequence definition.
All active procedures listed in the Available Procedures list box can be addedmultiple times to the sequence but the group plates must be unique.
An AutoQC sequence can be added to a Super sequence multiple times only ifthey are the same sequence. Two or more different AutoQC sequences cannotbe added to the same Super sequence.
Selected ProceduresThis is a list of all procedures that currently define the sequence. A vertical scrollbar will appear, if necessary, to allow viewing of all procedures in the list box. Amaximum of 21 procedures can be listed.
Notes: The sequence will execute in the order the procedures are listed in the SelectedProcedures list box, regardless of the order in which the group plates arestacked on the sample changer.
If the Super sequence does not contain any AutoQC sequences then the maxi-mum number of items in the selected list will be ten (groups A through J).
162
Sequence Manager
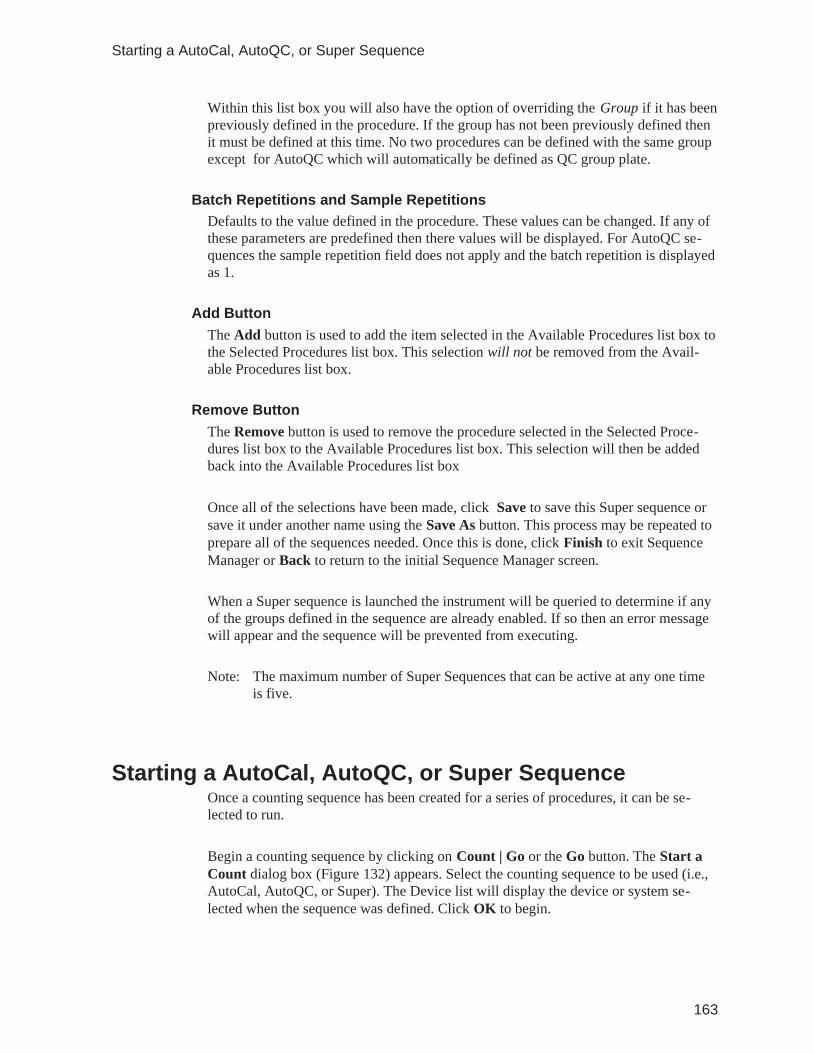
Within this list box you will also have the option of overriding the Group if it has beenpreviously defined in the procedure. If the group has not been previously defined thenit must be defined at this time. No two procedures can be defined with the same groupexcept for AutoQC which will automatically be defined as QC group plate.
Batch Repetitions and Sample RepetitionsDefaults to the value defined in the procedure. These values can be changed. If any ofthese parameters are predefined then there values will be displayed. For AutoQC se-quences the sample repetition field does not apply and the batch repetition is displayedas 1.
Add ButtonThe Add button is used to add the item selected in the Available Procedures list box tothe Selected Procedures list box. This selection will not be removed from the Avail-able Procedures list box.
Remove ButtonThe Remove button is used to remove the procedure selected in the Selected Proce-dures list box to the Available Procedures list box. This selection will then be addedback into the Available Procedures list box
Once all of the selections have been made, click Save to save this Super sequence orsave it under another name using the Save As button. This process may be repeated toprepare all of the sequences needed. Once this is done, click Finish to exit SequenceManager or Back to return to the initial Sequence Manager screen.
When a Super sequence is launched the instrument will be queried to determine if anyof the groups defined in the sequence are already enabled. If so then an error messagewill appear and the sequence will be prevented from executing.
Note: The maximum number of Super Sequences that can be active at any one timeis five.
Starting a AutoCal, AutoQC, or Super SequenceOnce a counting sequence has been created for a series of procedures, it can be se-lected to run.
Begin a counting sequence by clicking on Count | Go or the Go button. The Start aCount dialog box (Figure 132) appears. Select the counting sequence to be used (i.e.,AutoCal, AutoQC, or Super). The Device list will display the device or system se-lected when the sequence was defined. Click OK to begin.
163
Starting a AutoCal, AutoQC, or Super Sequence
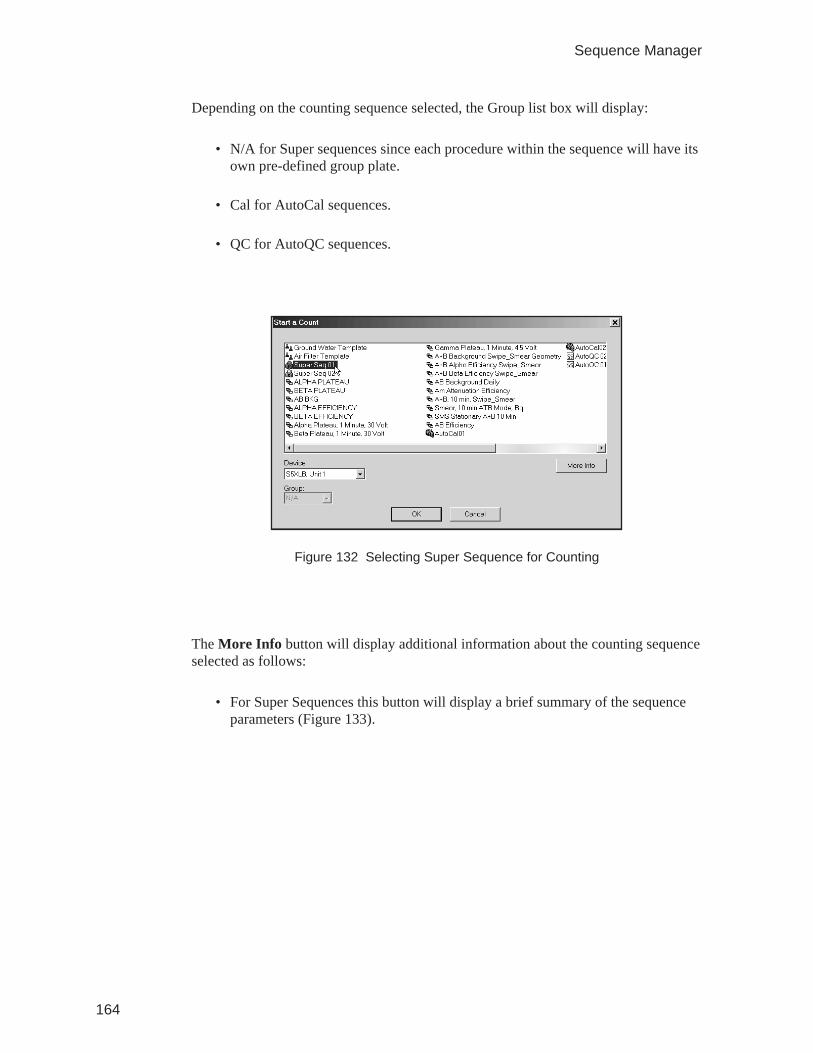
Depending on the counting sequence selected, the Group list box will display:
• N/A for Super sequences since each procedure within the sequence will have itsown pre-defined group plate.
• Cal for AutoCal sequences.
• QC for AutoQC sequences.
The More Info button will display additional information about the counting sequenceselected as follows:
• For Super Sequences this button will display a brief summary of the sequenceparameters (Figure 133).
164
Sequence Manager
Figure 132 Selecting Super Sequence for Counting
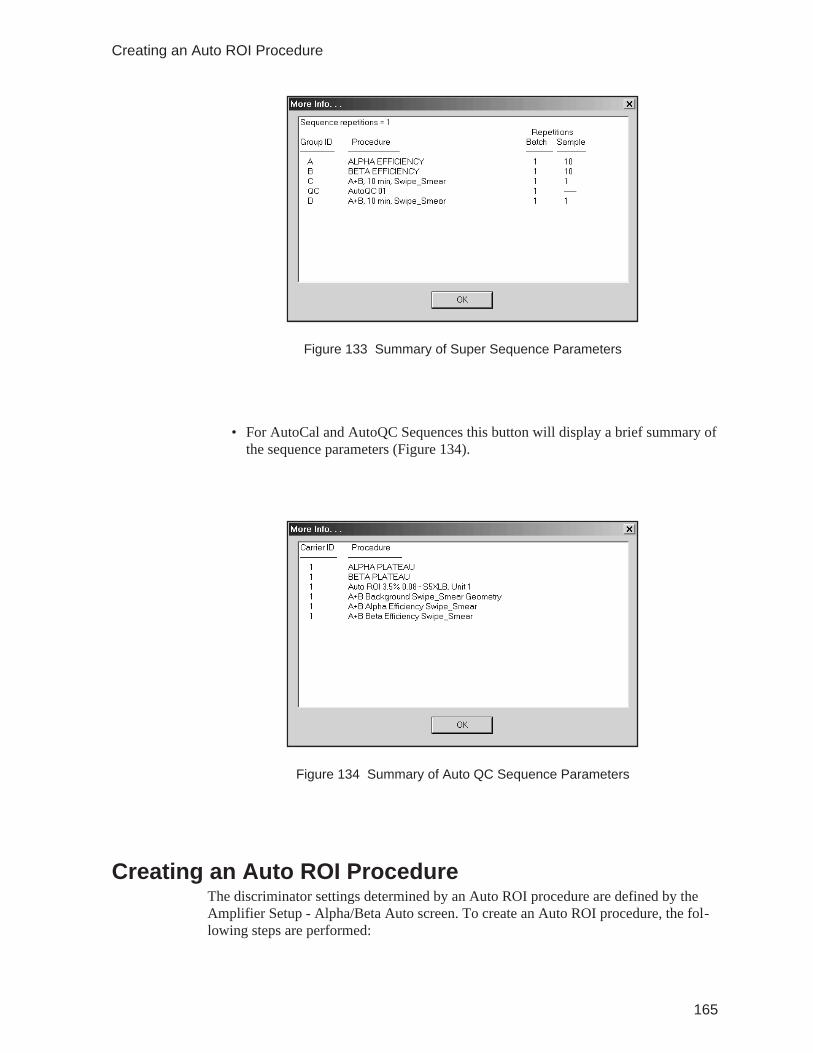
• For AutoCal and AutoQC Sequences this button will display a brief summary ofthe sequence parameters (Figure 134).
Creating an Auto ROI ProcedureThe discriminator settings determined by an Auto ROI procedure are defined by theAmplifier Setup - Alpha/Beta Auto screen. To create an Auto ROI procedure, the fol-lowing steps are performed:
165
Creating an Auto ROI Procedure
Figure 133 Summary of Super Sequence Parameters
Figure 134 Summary of Auto QC Sequence Parameters
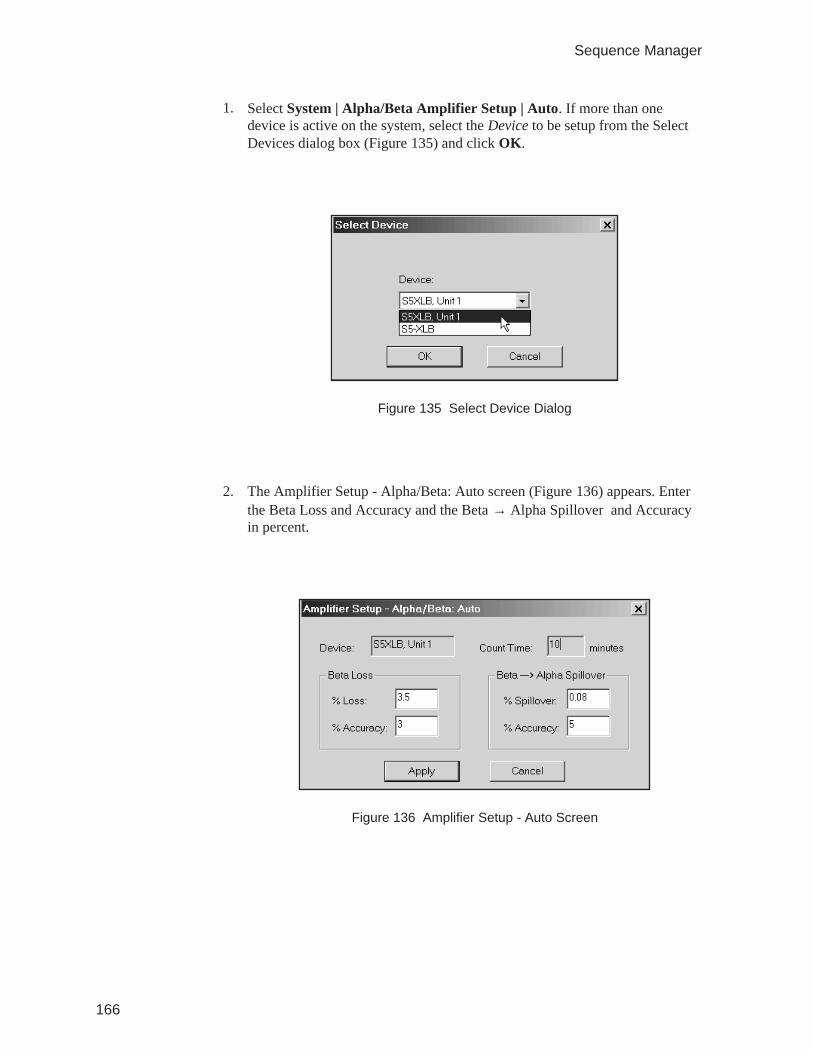
1. Select System | Alpha/Beta Amplifier Setup | Auto. If more than onedevice is active on the system, select the Device to be setup from the SelectDevices dialog box (Figure 135) and click OK.
2. The Amplifier Setup - Alpha/Beta: Auto screen (Figure 136) appears. Enterthe Beta Loss and Accuracy and the Beta → Alpha Spillover and Accuracyin percent.
166
Sequence Manager
Figure 135 Select Device Dialog
Figure 136 Amplifier Setup - Auto Screen
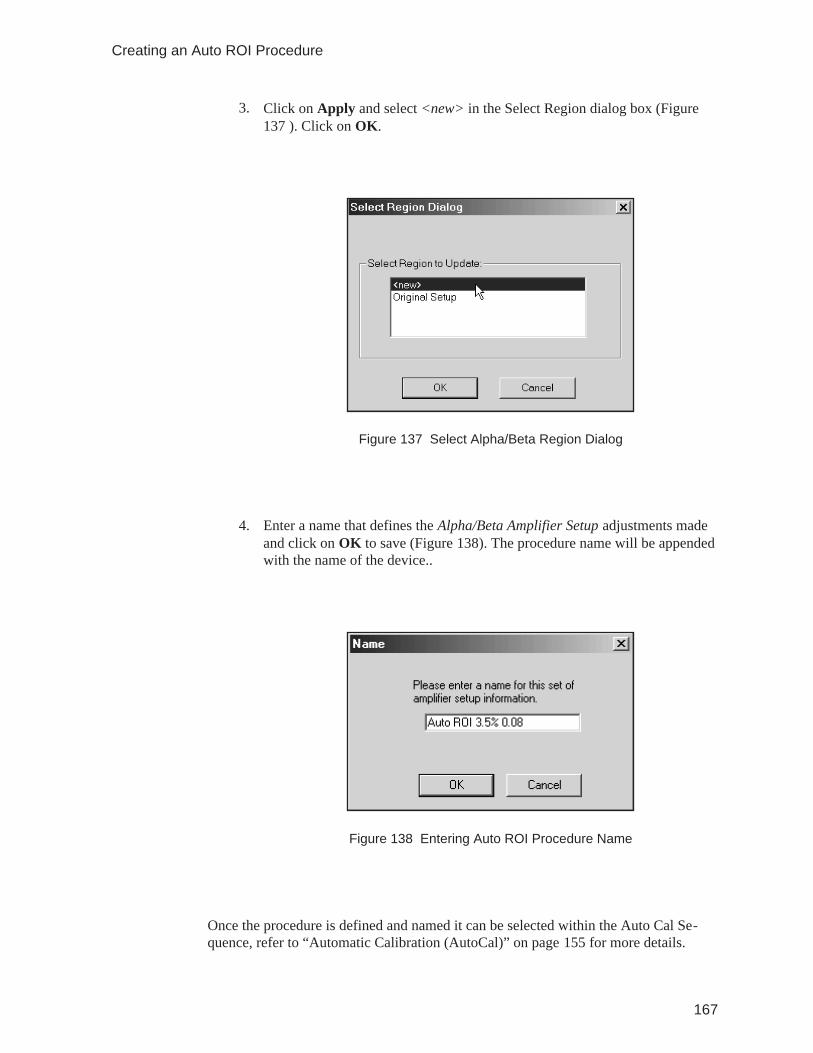
3. Click on Apply and select <new> in the Select Region dialog box (Figure137 ). Click on OK.
4. Enter a name that defines the Alpha/Beta Amplifier Setup adjustments madeand click on OK to save (Figure 138). The procedure name will be appendedwith the name of the device..
Once the procedure is defined and named it can be selected within the Auto Cal Se-quence, refer to “Automatic Calibration (AutoCal)” on page 155 for more details.
167
Creating an Auto ROI Procedure
Figure 137 Select Alpha/Beta Region Dialog
Figure 138 Entering Auto ROI Procedure Name
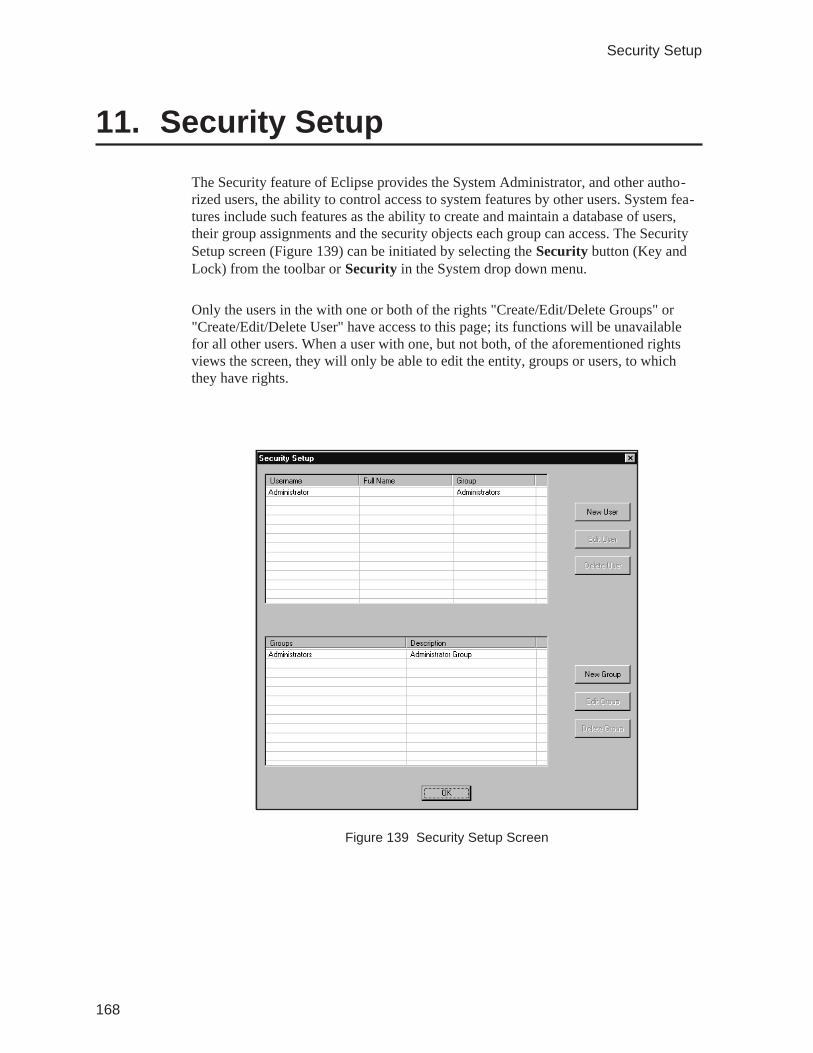
11. Security Setup
The Security feature of Eclipse provides the System Administrator, and other autho-rized users, the ability to control access to system features by other users. System fea-tures include such features as the ability to create and maintain a database of users,their group assignments and the security objects each group can access. The SecuritySetup screen (Figure 139) can be initiated by selecting the Security button (Key andLock) from the toolbar or Security in the System drop down menu.
Only the users in the with one or both of the rights "Create/Edit/Delete Groups" or"Create/Edit/Delete User" have access to this page; its functions will be unavailablefor all other users. When a user with one, but not both, of the aforementioned rightsviews the screen, they will only be able to edit the entity, groups or users, to whichthey have rights.
168
Security Setup
Figure 139 Security Setup Screen
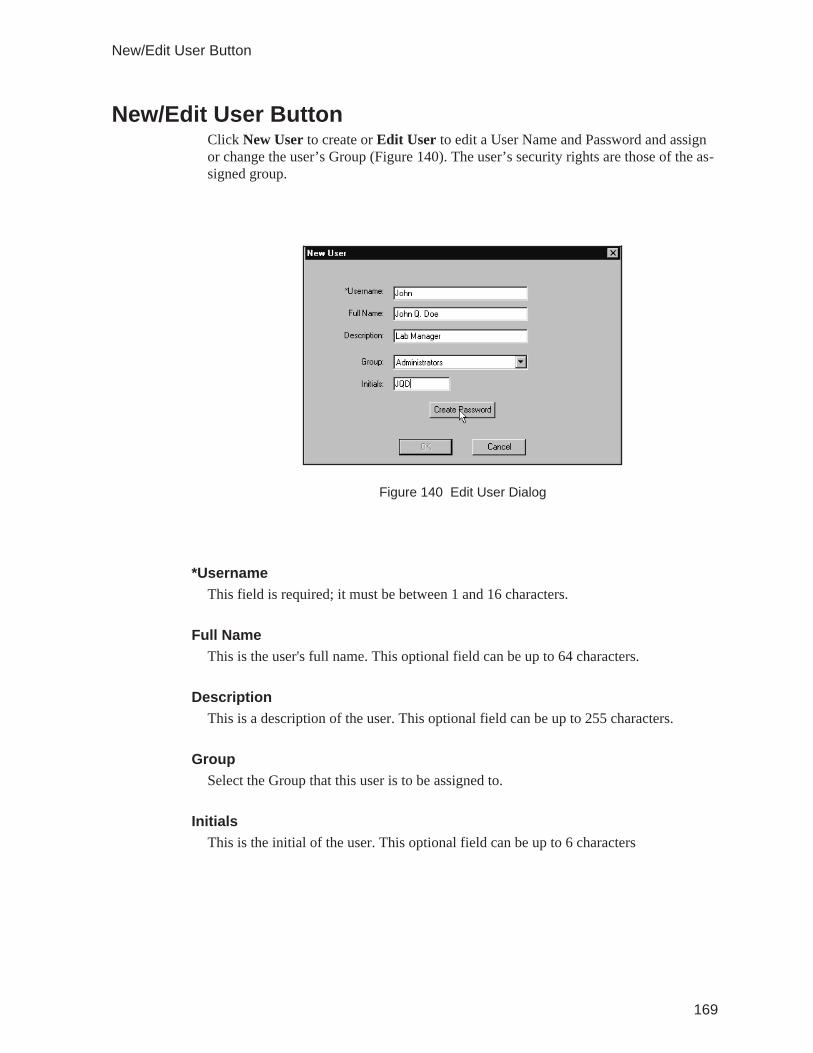
New/Edit User ButtonClick New User to create or Edit User to edit a User Name and Password and assignor change the user’s Group (Figure 140). The user’s security rights are those of the as-signed group.
*UsernameThis field is required; it must be between 1 and 16 characters.
Full NameThis is the user's full name. This optional field can be up to 64 characters.
DescriptionThis is a description of the user. This optional field can be up to 255 characters.
GroupSelect the Group that this user is to be assigned to.
InitialsThis is the initial of the user. This optional field can be up to 6 characters
169
New/Edit User Button
Figure 140 Edit User Dialog
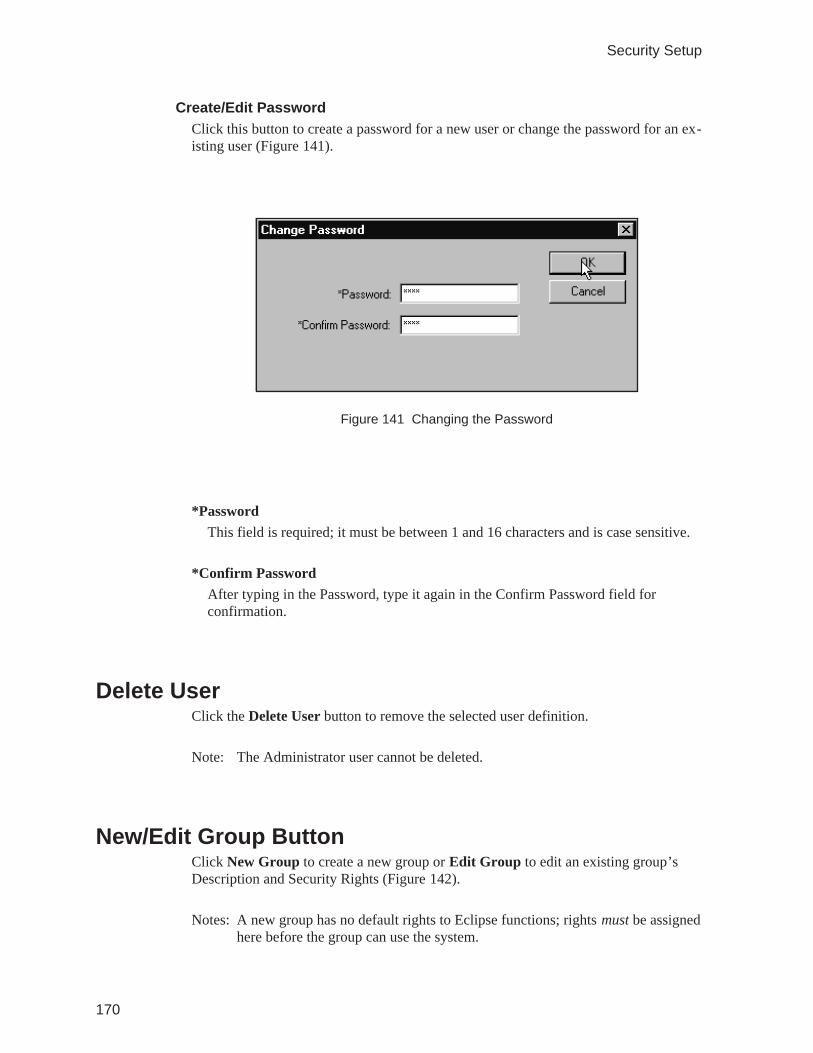
Create/Edit PasswordClick this button to create a password for a new user or change the password for an ex-isting user (Figure 141).
*PasswordThis field is required; it must be between 1 and 16 characters and is case sensitive.
*Confirm PasswordAfter typing in the Password, type it again in the Confirm Password field forconfirmation.
Delete UserClick the Delete User button to remove the selected user definition.
Note: The Administrator user cannot be deleted.
New/Edit Group ButtonClick New Group to create a new group or Edit Group to edit an existing group’sDescription and Security Rights (Figure 142).
Notes: A new group has no default rights to Eclipse functions; rights must be assignedhere before the group can use the system.
170
Security Setup
Figure 141 Changing the Password
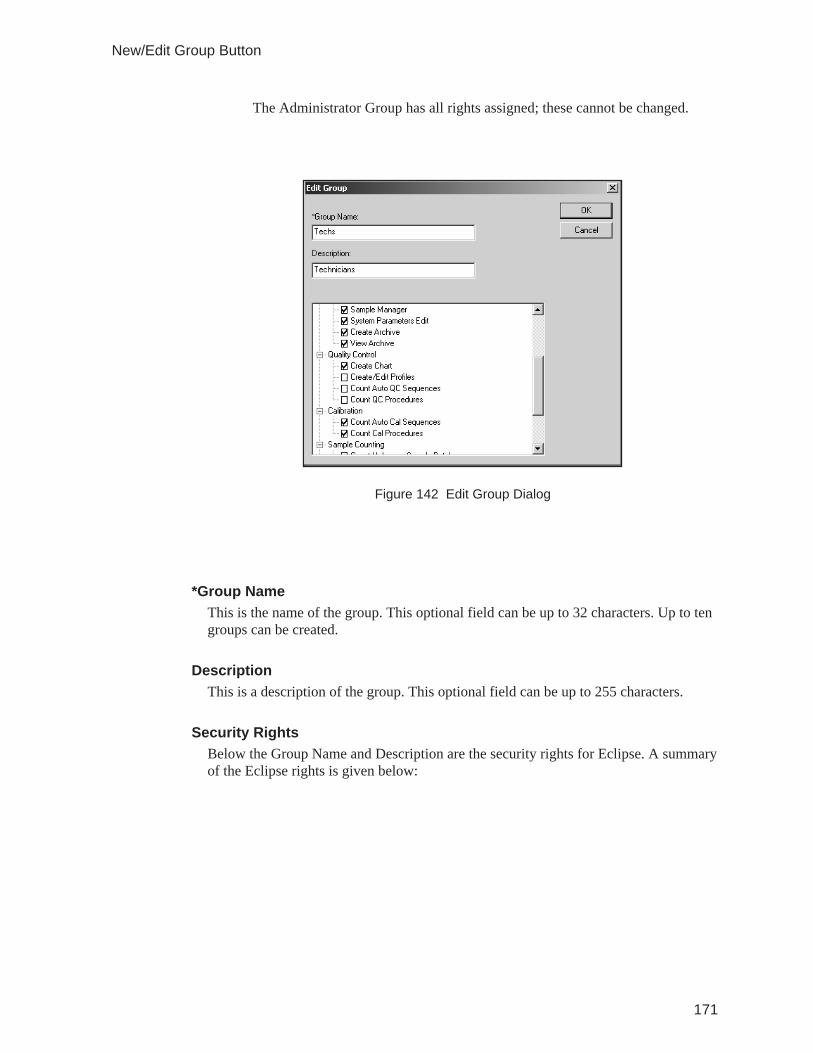
The Administrator Group has all rights assigned; these cannot be changed.
*Group NameThis is the name of the group. This optional field can be up to 32 characters. Up to tengroups can be created.
DescriptionThis is a description of the group. This optional field can be up to 255 characters.
Security RightsBelow the Group Name and Description are the security rights for Eclipse. A summaryof the Eclipse rights is given below:
171
New/Edit Group Button
Figure 142 Edit Group Dialog
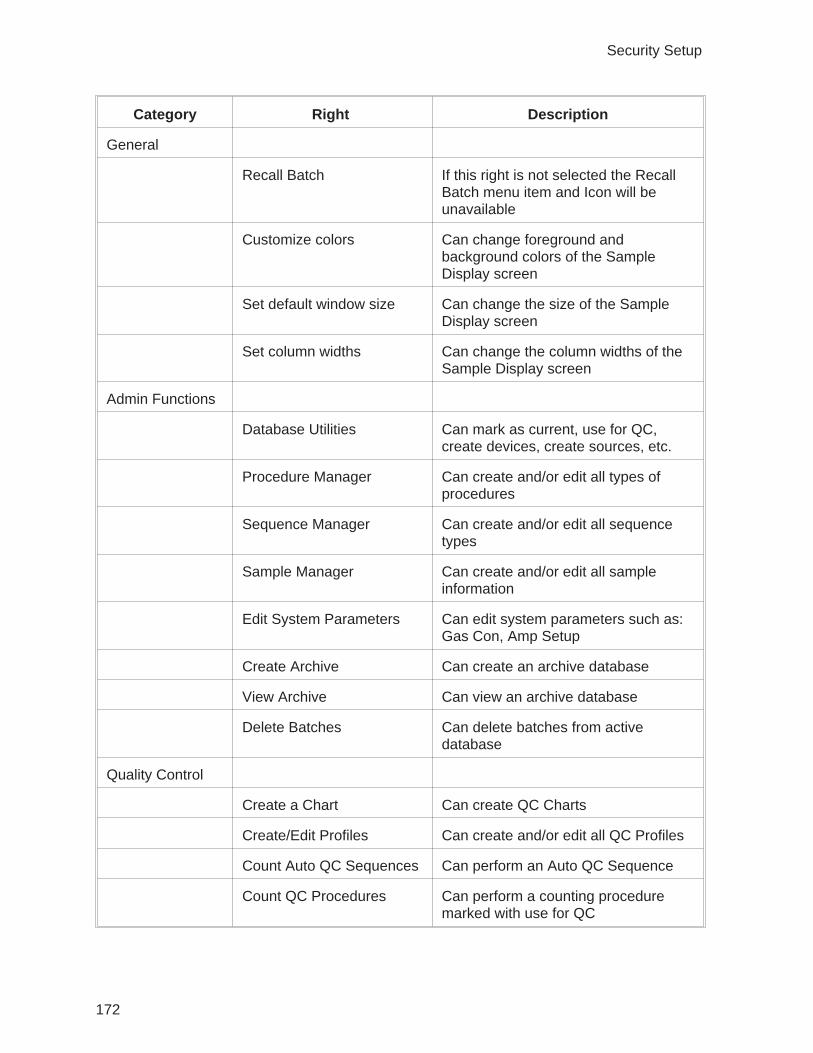
Category Right Description
General
Recall Batch If this right is not selected the RecallBatch menu item and Icon will beunavailable
Customize colors Can change foreground andbackground colors of the SampleDisplay screen
Set default window size Can change the size of the SampleDisplay screen
Set column widths Can change the column widths of theSample Display screen
Admin Functions
Database Utilities Can mark as current, use for QC,create devices, create sources, etc.
Procedure Manager Can create and/or edit all types ofprocedures
Sequence Manager Can create and/or edit all sequencetypes
Sample Manager Can create and/or edit all sampleinformation
Edit System Parameters Can edit system parameters such as:Gas Con, Amp Setup
Create Archive Can create an archive database
View Archive Can view an archive database
Delete Batches Can delete batches from activedatabase
Quality Control
Create a Chart Can create QC Charts
Create/Edit Profiles Can create and/or edit all QC Profiles
Count Auto QC Sequences Can perform an Auto QC Sequence
Count QC Procedures Can perform a counting proceduremarked with use for QC
172
Security Setup
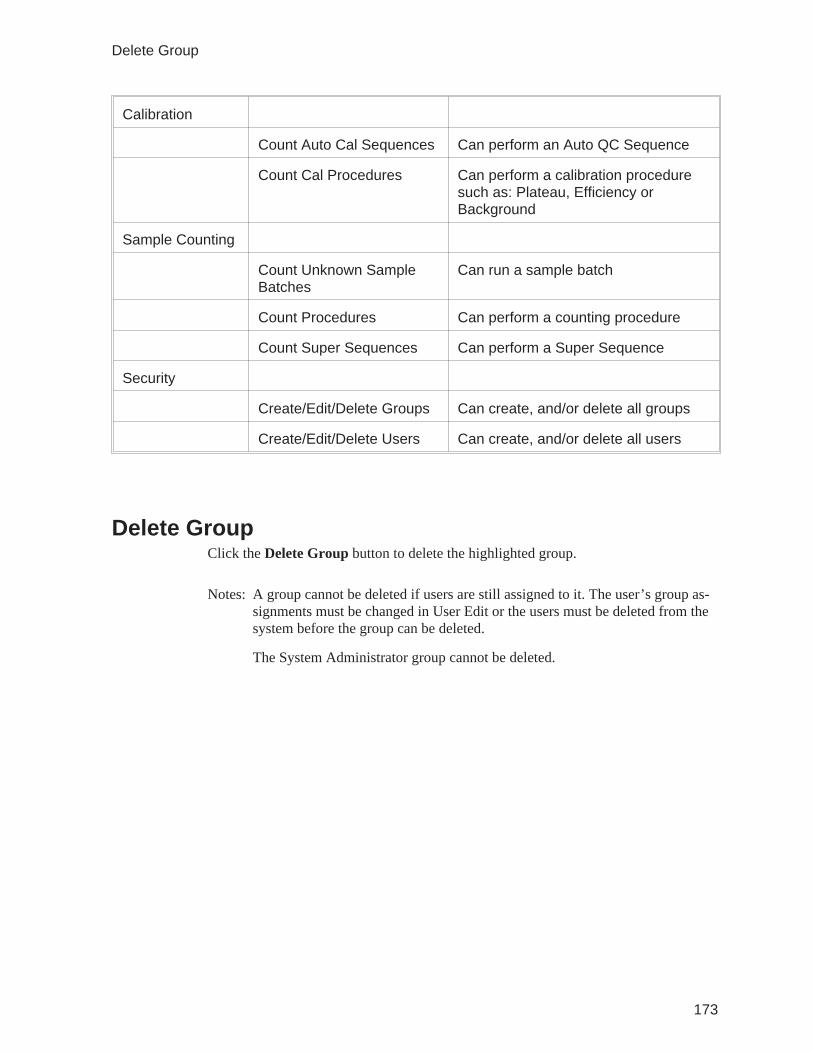
Calibration
Count Auto Cal Sequences Can perform an Auto QC Sequence
Count Cal Procedures Can perform a calibration proceduresuch as: Plateau, Efficiency orBackground
Sample Counting
Count Unknown SampleBatches
Can run a sample batch
Count Procedures Can perform a counting procedure
Count Super Sequences Can perform a Super Sequence
Security
Create/Edit/Delete Groups Can create, and/or delete all groups
Create/Edit/Delete Users Can create, and/or delete all users
Delete GroupClick the Delete Group button to delete the highlighted group.
Notes: A group cannot be deleted if users are still assigned to it. The user’s group as-signments must be changed in User Edit or the users must be deleted from thesystem before the group can be deleted.
The System Administrator group cannot be deleted.
173
Delete Group
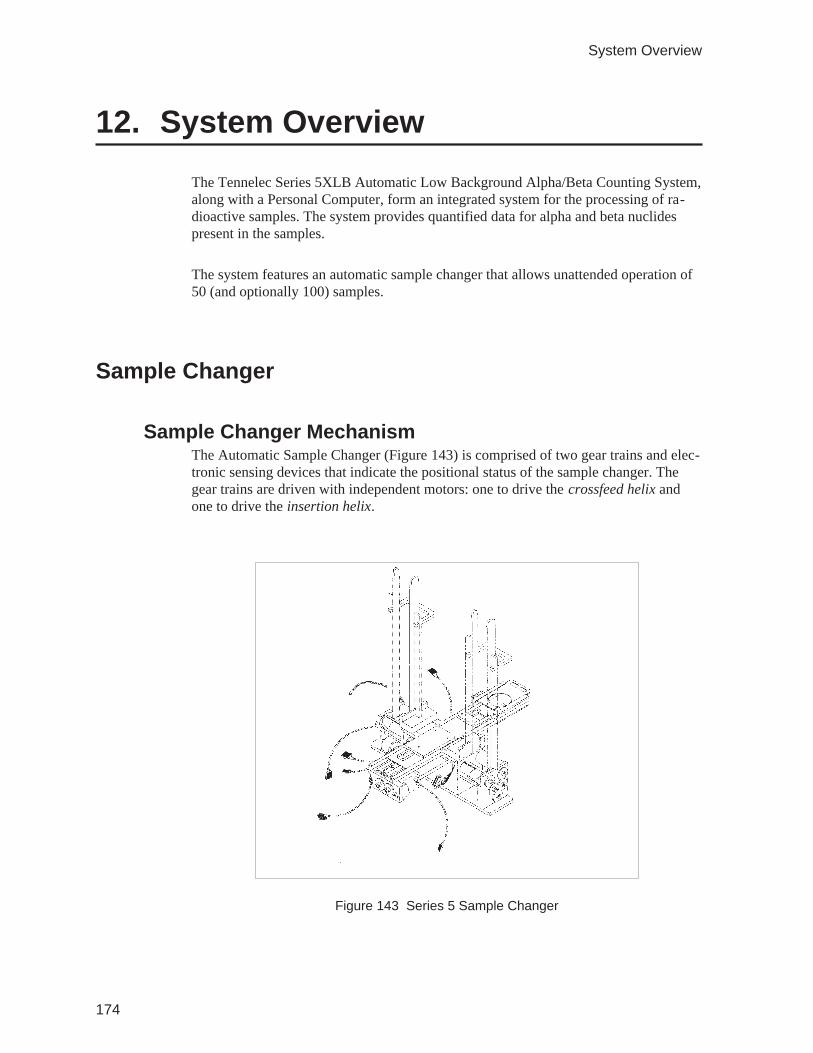
12. System Overview
The Tennelec Series 5XLB Automatic Low Background Alpha/Beta Counting System,along with a Personal Computer, form an integrated system for the processing of ra-dioactive samples. The system provides quantified data for alpha and beta nuclidespresent in the samples.
The system features an automatic sample changer that allows unattended operation of50 (and optionally 100) samples.
Sample Changer
Sample Changer MechanismThe Automatic Sample Changer (Figure 143) is comprised of two gear trains and elec-tronic sensing devices that indicate the positional status of the sample changer. Thegear trains are driven with independent motors: one to drive the crossfeed helix andone to drive the insertion helix.
174
System Overview
Figure 143 Series 5 Sample Changer
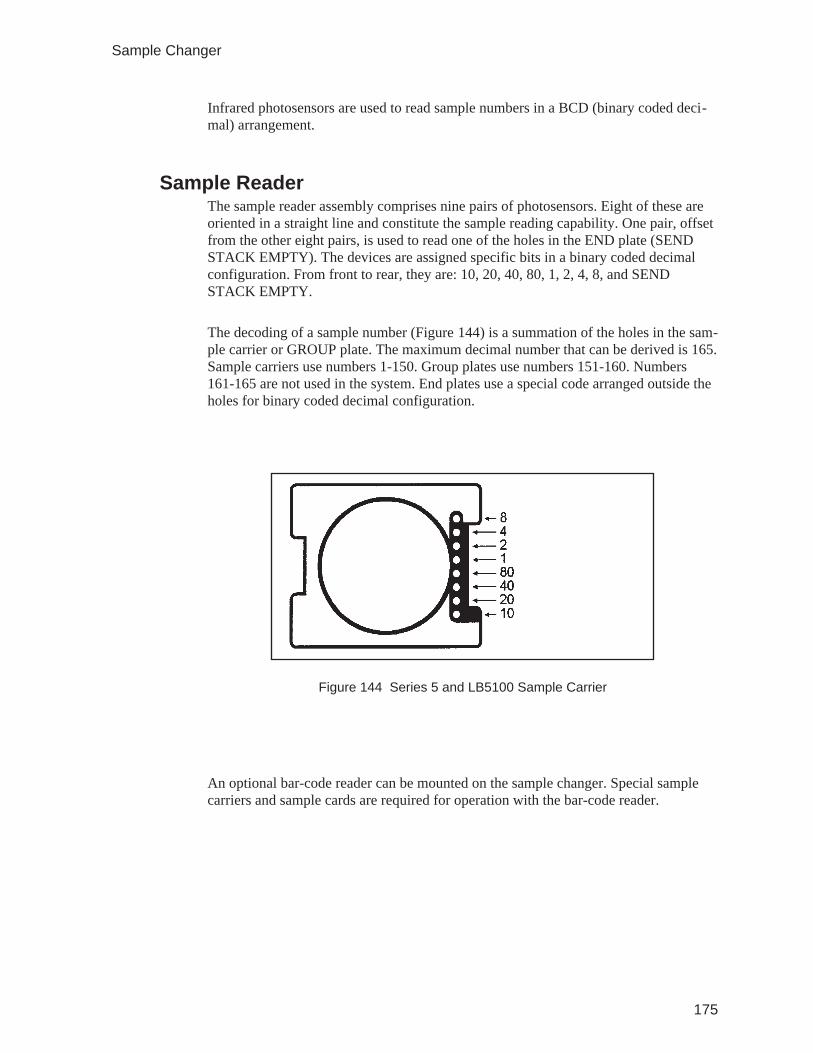
Infrared photosensors are used to read sample numbers in a BCD (binary coded deci-mal) arrangement.
Sample ReaderThe sample reader assembly comprises nine pairs of photosensors. Eight of these areoriented in a straight line and constitute the sample reading capability. One pair, offsetfrom the other eight pairs, is used to read one of the holes in the END plate (SENDSTACK EMPTY). The devices are assigned specific bits in a binary coded decimalconfiguration. From front to rear, they are: 10, 20, 40, 80, 1, 2, 4, 8, and SENDSTACK EMPTY.
The decoding of a sample number (Figure 144) is a summation of the holes in the sam-ple carrier or GROUP plate. The maximum decimal number that can be derived is 165.Sample carriers use numbers 1-150. Group plates use numbers 151-160. Numbers161-165 are not used in the system. End plates use a special code arranged outside theholes for binary coded decimal configuration.
An optional bar-code reader can be mounted on the sample changer. Special samplecarriers and sample cards are required for operation with the bar-code reader.
175
Sample Changer
Figure 144 Series 5 and LB5100 Sample Carrier
Sample Changer OperationSample carriers are loaded onto the right side of the changer in a vertical configurationand maintained in position by the sample masts. The sample carriers have differentwidth notches on each side of the carrier so that they cannot be inserted into the sam-ple stack backwards. When the crossfeed is operating in the forward or advance direc-tion, a rectangular-shaped sample carrier drops into position. Then a pair of drivecams, known as helixes, rotating in opposite directions, will push the carrier under thesample reader. When a sample number is recognized, the cams will push the samplecarrier onto the sample slide. The crossfeed motor stops when INDEXED. At thistime, the insertion motor is actuated and positions the sample under the detector.When the system has counted for the pre-selected time or preset counts, the slide iswithdrawn, and stops when fully extended, and the slide-out sensor has been activated.The crossfeed motor is once again turned on, and another carrier is pushed into posi-tion on the slide. Samples that have been counted are pushed to the left side of thesample changer and maintained in position by another set of sample masts.
INDEXING is accomplished by means of an aluminum disc with a slot (attached tothe left crossfeed gear train) and a single photosensor pair. When the slot in the alumi-num disc is aligned with the sensor, the changer is at the INDEX position. The INDEXcondition coincides with the mechanical alignment of the sample carrier with the sam-ple reader and indicates to the controller board that a sample carrier is in the properposition to reliably read the sample carrier number.
SLIDE IN and SLIDE OUT status is accomplished by using a pair of photosensors anda small aluminum tab mounted on the sample slide. Underneath the sample slide, thesensors for detecting SLIDE IN and OUT are mounted on the inside of the front andrear bearing plate for the insertion helix. A small piece of metal is attached to the slide.When the slide reaches full IN or OUT and the metal gate blocks the gap between thesensor, the photosensor pair is activated and the controller board senses the informa-tion.
Sample counting continues until there are no longer any sample carriers in the right-hand (SEND) mast and an END plate is pushed underneath the sample reader. Thesend stack empty photosensor is actuated by the holes in the END plate.
Lead ShieldThe Tennelec Series 5 incorporates a modular cast-lead shield assembly that can beconfigured for several background / weight combinations. The individual lead shieldcomponents have a maximum weight of 60 lbs. to facilitate the assembly of the leadshield.
176
System Overview

The fully assembled lead shield is shown in Figure 145.
Gas System
Gas Regulation and ControlThe system P-10 counting gas is supplied from a high-pressure (3000 psi) gas cylin-der. A single-stage regulator is mounted to the cylinder and regulates the gas pressuredelivered to the system at 10 ± 1 psi. The low-pressure gas is routed to the system us-ing flexible plastic tubing.
The 10 ± 1 psi low-pressure gas is applied to an electronic pressure controller that reg-ulates the system gas flow rate by varying the pressure applied to a precision porousmetal flow restrictor. Over the range of system gas flow rates, the output flow rate is anearly linear function of the applied gas pressure.
A low gas warning is issued from the controller and the system is disabled (gas modeis set to OFF/HV DISABLE) if the input pressure falls below 5 psi.
177
Gas System
Figure 145 Fully Assembled Lead Shield
The Tennelec Series 5 optionally includes a gas conservation system to reduce theconsumption of the P-10 counting gas. An electronic pressure regulator valve allowsthe system gas flow-rate to be automatically tailored to the system operational status.For more information on GasStat and Gas Mode systems, refer to Chapter 14, GasSystem.
DetectorsThe detector assembly consists of a 2.25-inch-diameter sample detector shielded by alarge-area guard detector. Both detectors are a gas-flow proportional type and operatewith P-10 gas.
Sample and Guard DetectorThe sample detector is a 2.25 inch diameter pancake style gas-flow proportional detec-tor. The detector features twin anodes for excellent counting uniformity and an ultra-thin 80 µg/cm2 entrance window for high counting efficiency.
The guard detector is a large-area gas-flow proportional detector with six anode wiresfor excellent counting uniformity. The bottom of the guard detector is contoured to en-compass the sample detector, thus reducing the exposure of the sample detector to un-guarded external background sources.
PreamplifierThe system incorporates individual charge-sensitive preamplifiers for both the sampleand guard detectors. The preamplifiers also distribute the high voltage bias to the de-tectors.
Amplifier/SCAThe system amplifier/SCA board contains separate amplification/shaping/discrimina-tion sections for the Guard and Sample channel information. The output of the Guardamplifier feeds a discriminator whose threshold is set by the system controller card.The output of the Sample amplifier feeds one threshold (β lower) and twodiscriminators (β upper and α lower) whose settings are modified by the system con-troller card. The discriminator outputs from both the Guard and Sample channels arerouted to the counters on the controller card. The board also contains count activity in-dicators and a variable amplitude test pulsar.
178
System Overview
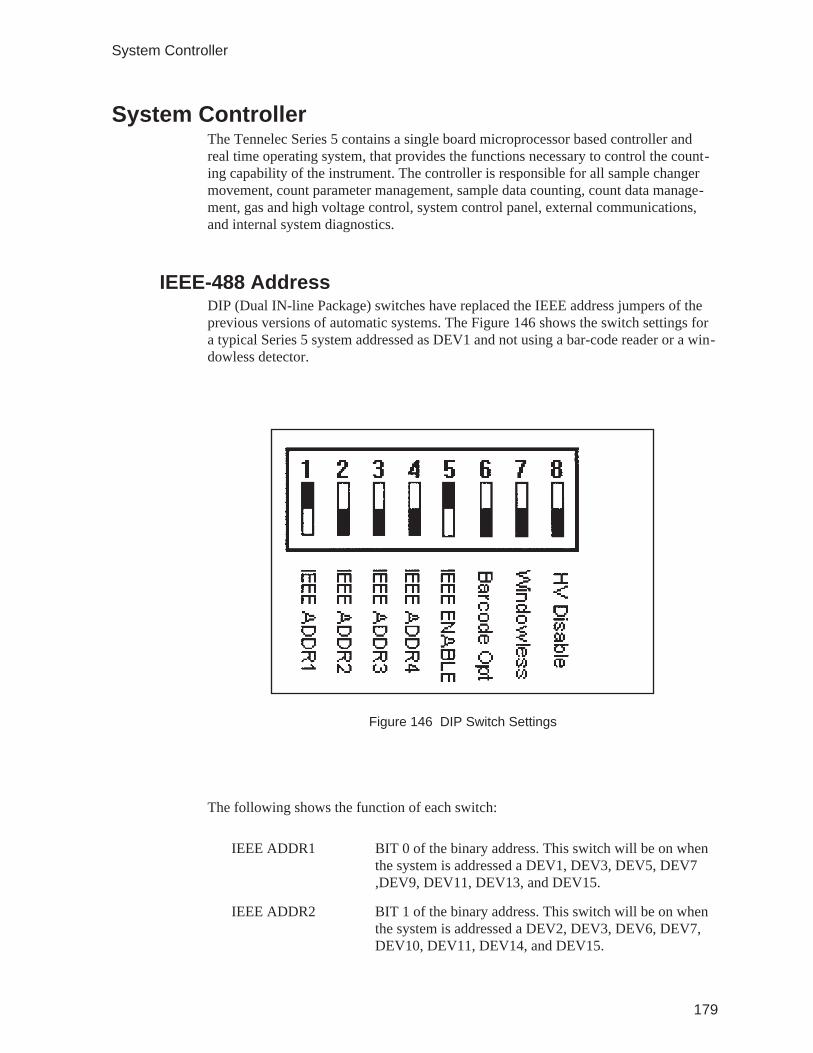
System ControllerThe Tennelec Series 5 contains a single board microprocessor based controller andreal time operating system, that provides the functions necessary to control the count-ing capability of the instrument. The controller is responsible for all sample changermovement, count parameter management, sample data counting, count data manage-ment, gas and high voltage control, system control panel, external communications,and internal system diagnostics.
IEEE-488 AddressDIP (Dual IN-line Package) switches have replaced the IEEE address jumpers of theprevious versions of automatic systems. The Figure 146 shows the switch settings fora typical Series 5 system addressed as DEV1 and not using a bar-code reader or a win-dowless detector.
The following shows the function of each switch:
IEEE ADDR1 BIT 0 of the binary address. This switch will be on whenthe system is addressed a DEV1, DEV3, DEV5, DEV7,DEV9, DEV11, DEV13, and DEV15.
IEEE ADDR2 BIT 1 of the binary address. This switch will be on whenthe system is addressed a DEV2, DEV3, DEV6, DEV7,DEV10, DEV11, DEV14, and DEV15.
179
System Controller
Figure 146 DIP Switch Settings
IEEE ADDR3 BIT 2 of the binary address. This switch will be on whenthe system is addressed a DEV4, DEV5, DEV6, DEV7,DEV12, DEV13, DEV14, and DEV15.
IEEE ADDR4 BIT 3 of the binary address. This switch will be on whenthe system is addressed a DEV8, DEV9, DEV10, DEV11,DEV12, DEV13, DEV14, and DEV15.
IEEE ENABLE The switch should always be on.
BARCODE OPT This switch is on if the system is equipped with a bar codereader.
WINDOWLESS OPT This switch is on only if the system is equipped with thewindowless option and is being operated in windowlessmode.
HV DISABLE The switch is only turned off for diagnostic purposes.
Control PanelA control panel provides system status information and allows you to have manualcontrol of the sample changer when needed.
System StatusThe tri-color System Status serves as a visual indicator of the overall system opera-tional status.
The System Status indicator illuminates green for normal operational status.
The System Status indicator illuminates yellow if a low input gas pressure is detected.
The System Status indicator illuminates red if a system fault is detected. This includesan internal power supply that is out of tolerance, low battery voltage, high voltagefault or excessive motor current during sample changer operation.
Sample Changer Control
AUTO and MANUALThe Auto and Manual push-buttons select the sample changer mode.
The automatic mode is the default mode in which all changer operations occur as dic-tated by the system controller. A green indicator, located behind the Auto push-button,is illuminated any time the system is in automatic mode.
180
System Overview

The manual mode is used in special cases where it is necessary for the user to controlsample changer movement. A yellow indicator, located behind the Manual push-button, is illuminated any time the system is in manual mode.
Manual mode takes effect immediately when the button is pressed and stops anychanger operation in progress. Since the changer is stopped, the Halt indicator (de-scribed below) is illuminated.
COUNT and HALTThe Count and Halt buttons have a dual purpose. When the system is analyzing a sam-ple, the Halt button serves to stop the count. This feature can be useful when calibrat-ing the system. A red indicator behind the Halt button illuminates when the system ispaused. Pressing the Count button restarts counting and illuminates the green Countindicator. The red Halt indicator will flash during sample changer operation.
If the system is not analyzing a sample, the Halt button stops the sample changer andplaces the system into manual mode.
IN and OUTThese push buttons are enabled only when the Manual indicator is illuminated. The Inbutton takes the slide into the detector drawer. The Out button pulls the slide out of thedetector drawer.
ADVANCE and REVERSEThe Reverse push-button is enabled only when the Manual indicator is illuminated.The Reverse button moves the stack one carrier to the right.
The Advance button is enabled whether or not the Manual indicator is illuminated, butserves a different purpose in each case. In manual mode, the Advance push-buttonmoves the stack one carrier to the left and stops. In Auto mode, the Advance push-button causes the next carrier to be placed in the lead cave and counted. When fin-ished, the changer will again advance and repeat the sequence.
RESTACKThis button has the same function as the Reverse button except that the changer movesall the sample carriers to the load stack. This function can be helpful if it is necessaryto remove a stack of carriers in the same order as they were loaded.
Power SupplyThe system requires connection to the ac mains for operation. The unit features a uni-versal-input power supply that accepts ac mains power from virtually any country.
181
Power Supply
13. Upgraded System Instructions
Older Tennelec LB systems like the LB5100-I, II, III, and Z that have been updated tothe Windows 3 environment can be easily upgraded to Eclipse. This upgrade providesmany of the advantages of the new operating system.
Newer systems like the LB5100-W and LB5100-IV enjoy most of the basic function-ality of the software as a Series 5 system. There are some differences in the setup andoperation. This chapter will address many of the differences.
System AddressingPlacing jumpers on the appropriate sets of pins sets the IEEE address of the system. Ifa system is to be addressed as Device 1 (DEV1) without a bar-code reader, there needto be jumpers on BIT 0 and IEEE Enable. If a system is to be addressed as DEV3,there should be jumpers on BIT 0, BIT 1, (1+2=3) and IEEE Enable. A system ad-dressed as DEV15 would need jumpers on BIT 0, BIT 1, BIT 2, BIT 3(1+2+4+8=15),and IEEE Enable.
Non-NIM Bin Based InstrumentsThe operation of non-NIM based instruments similar to the Tennelec LB5100-W andthe Tennelec LB5100 Series 4 is very similar to the operation of the Series 5. The ma-jor difference is the lack of gas flow regulation and conservation. These features arenot retro-fitable into the old systems. Most other features should emulate a Series 5.
NIM Bin Based InstrumentsTennelec systems with NIM Bins like the LB5100-I, II, series III, and LB5500 can beoperated by Eclipse software. Even though all the features of the Series 5 cannot be re-produced, the ease of operation and incredible flexibility of Eclipse can be utilized.
Automatic Gas Flow RegulationThe automatic gas flow regulation is not retro-fittable into the NIM based systems.The original flow meter will have to be used.
182
Upgraded System Instructions
ROI Setup - SpilloverAfter running a plateau, the alpha discriminators should be adjusted to minimize falsereadings of alphas counted as betas and beta counted as alpha. The Tennelec LB5100and LB5500 use pulse height discrimination to determine if an event should be scaledinto the alpha or the beta counting channel. For any given isotope, the measured pulseheight will not be absolutely constant but will vary slightly from one measurement tothe next.
The Tennelec LB5100-I, II, III, and LB5500 use one discriminator level to distinguishbetween alpha and beta particles. The NIM Module TC265A is the sample channelamplifier and SCA (Single Channel Analyzer).
TC265 Settings
Gain: 16
α Discriminator: Varies
α+β Discriminator: Fully CCW or .25
TC264 Settings
Gain: 64
Discriminator: Fully CCW or .50
Adjusting Channel DiscriminatorsThis section discusses the ROI calibration procedure for systems equipped with a NIMBIN only. On LB5100-W and LB5100-IV systems, use the ROI calibration procedurein section.
It is recommended that you follow along by actually performing the operations de-scribed in the example.
1. Close all Eclipse Batch windows. The Amplifier Setup command is notavailable unless there are no Batch windows open.
2. Select System | Amplifier Setup.
3. Load a pure beta emitting standard (for example, 90Sr) behind a group plate.
4. On the Amplifier Setup screen, choose the device and group then press theStart Count button.
183
NIM Bin Based Instruments

5. The system should move the sample into position and begin counting.Always allow 10,000-30,000 counts to register before making adetermination on spill. The goal is to set the Beta into Alpha spill to 1.0% ±0.05%. Press the Halt Count Button.
6. If the Beta into Alpha spill is greater than 1.05%, turn up the α Discriminatoron the 265A NIM Module. If the Beta into Alpha spill is less than 0.95%,turn down the α Discriminator. Press the Resume Count button.
7. Continue performing the previous step until the Beta into Alpha spill is 1%(0.95-1.05%). Press the Apply button if there are no non-NIM based sharingthis computer. Enter the name of this ROI set in the space provided and pressOK. The NIM based system does not use the ROI that is set. If there are non-NIM based systems connected to this computer simply press cancel.
Note It is recommended to enter a name the first time this procedure is run and thenselecting cancel subsequent times. This allows for the use of the same countprofiles without updating the existing procedures.
8. Once this procedure is completed, it is recommended that the detector be re-calibrated. Minor changes in the ROI setting will not radically change thebackground. Many facilities have chosen to disregard the differences in thebackgrounds with different ROI settings, so long as the count mode isconsistent.
Upgraded Hardware Specifics
Detector Replacement (LB5100-W-GWD)The detector assembly can be accessed without having to disassemble the lead shield.To gain access to the detector, perform the following:
1. Remove ac power from the system.
2. At the rear of the system, loosen the four knurled screws retaining the accesspanel on the top-rear shroud.
3. Disconnect the black High Voltage cable from the back of the system.
4. Disconnect the ground strap from the back of the drawer. These are quick-connect and can be pulled loose.
5. Disconnect the quick-connect gas fitting.
184
Upgraded System Instructions
6. Remove the four corner counter-sunk Phillips-head screws from thealuminum panel located in the center of the lead shield. Remove the rearcover.
7. Grasp the top lead brick by the handle and remove it. Grasp the handle of thebottom lead brick and remove it.
8. Remove the two screws holding the detector in place.
9. Grasp the detector Pre-amp assembly and withdraw completely. Place it on atable or work bench.
10. Disconnect the gas lines.
11. Pick up the (top) guard detector and lift it up and OFF the platform.
12. Remove the Phillips head screw from the LEXAN cover.
13. Remove the cover.
14. Remove the 1700-0178 sample preamplifier card (the smaller of the twocards).
15. Remove the (bottom) sample detector.
CAUTION The detector window is exposed at this time. Be very carefulto not damage the window.
16. Before installing the detector back into the shield, take a few minutes toinspect and clean the inside of the shield, using alcohol.
17. Position the new detector onto platform, paying particular attention toprevent the retaining stud from inadvertently puncturing the window. Ensurethat the window ring comes to rest within the mating hole on the detectorcradle.
18. Repeat the previous steps in reverse order.
19. Insert the slide with a sample insert in place. Submerge the gas vent lineapproximately 1/8 inch below the surface of a container of liquid and ensurethat bubbles are produced. If not, immediately disconnect the gas quick-connect fittings and investigate for possible crimping of the gas line within
185
Upgraded Hardware Specifics
the shield area. Failure to do this may result in damage to the window on thesample detector.
20. With the gas-flow integrity having been verified, proceed with the attachingthe high voltage cable.
21. Apply power to the system and test for proper operation. You should alwaysperform a plateau when installing a new detector. Calibrate the system.
Detector Replacement (LB5100-W)The detector assembly can be accessed without having to disassemble the lead shield.To gain access to the detector, perform the following:
1. Remove ac power from the system.
2. At the rear of the system, loosen the four knurled screws retaining the accesspanel on the top-rear shroud.
3. Disconnect the black High Voltage cable from the back of the system.
4. Disconnect the ground strap from the back of the drawer. These are quick-connect and can be pulled loose.
5. Disconnect the quick-connect gas fitting.
6. Remove the four corner 6-32 Phillips-head screws from the aluminum panellocated in the center of the lead shield.
7. Grasp the aluminum handle and withdraw the detector drawer six to seveninches.
8. Note the three pieces of lead shielding on the drawer. These are attachedwith two retaining bolts and weigh 30-35 pounds.
9. Grasp the side of the drawer with your free hand to afford more support,withdraw the detector drawer completely, and set on a table or work bench.
10. Disconnect the gas lines.
11. Using a straight screwdriver remove the screw that holds the aluminum strapto the retaining studs. Set aside the strap.
12. Pick up the (top) guard detector and lift it up and OFF the platform.
186
Upgraded System Instructions
13. Remove the Phillips head screw from the LEXAN cover.
14. Remove the cover.
15. Remove the 1700-0178 sample preamplifier card (the smaller of the twocards).
16. Remove the (bottom) sample detector.
CAUTION The detector window is exposed at this time. Be very carefulto not damage the window.
17. Before installing the detector back into the shield, take a few minutes toinspect and clean the inside of the shield, using alcohol.
18. Position the new detector onto platform, paying particular attention toprevent the retaining stud from inadvertently puncturing the window. Ensurethat the window ring comes to rest within the mating hole on the detectorcradle.
19. Repeat the previous steps in reverse order.
20. Submerge the gas vent line approximately 1/8 inch below the surface of acontainer of liquid and ensure that bubbles are produced. If not, immediatelydisconnect the gas quick-connect fittings and investigate for possiblecrimping of the gas line within the shield area. Failure to do this may resultin damage to the window on the sample detector.
21. With the gas-flow integrity having been verified, proceed with the attachingthe high voltage cable.
22. Secure the detector drawer into place using the four 6-32 Phillips screws.
23. Apply power to the system and test for proper operation. You should alwaysperform a plateau when installing a new detector. Calibrate the system.
Detector Replacement (NIM-based system)The detector assembly can be accessed without having to disassemble the lead shield.To gain access to the detector, perform the following:
1. Remove ac power from the system.
187
Upgraded Hardware Specifics

2. At the rear of the system, loosen the four knurled screws retaining the accesspanel on the top-rear shroud.
3. Disconnect the black HV/Signal cables labeled SAMPLE and GUARD fromthe INPUT connectors of the TC175B preamplifiers.
4. Disconnect the ground straps from the front panels of the preamplifiers.These are quick-connect and can be pulled loose.
5. Disconnect the quick-connect gas fitting.
6. Remove the four corner 6-32 Phillips-head screws from the aluminum panellocated in the center of the lead shield.
7. Grasp the aluminum handle and withdraw the detector drawer six to seveninches.
8. Note the two pieces of lead shielding on the drawer. These are attached witha retaining bolt, but weigh 30-35 pounds.
9. Grasp the side of the drawer with your free hand to afford more support,withdraw the detector drawer completely, and set on a table or work bench.
10. Disconnect the two cables from the detectors.
11. Disconnect the gas lines.
12. Using a 1/4-inch nut driver or socket, remove the “kep” nut that retains thecopper strap to the retaining stud. Set aside the ground strap.
13. Lift the copper strap up and pivot to the side.
14. Pick up the detector by the connector end and lift it up and off the platform.Exercise caution when handling the detector; the entrance window can beeasily damaged.
15. Position the new detector onto platform, paying particular attention toprevent the retaining stud from inadvertently puncturing the window. Ensurethat the window ring comes to rest within the mating hole on the detectorcradle.
16. Attach the High Voltage signal cables with the Guard cable to the topconnector, and the Sample cable to the lower connector.
188
Upgraded System Instructions

17. Attach the gas lines so that the Gas In tube connects to the bottom detector,and the vent line to the top detector.
18. Pivot the copper retaining strap and position onto the retaining stud.
19. Position the ground strap onto the retaining stud and secure firmly, but nottoo tightly, using the 4-40 x 1/4-inch hex kep nut.
20. Before installing the detector back into the shield, take a few minutes toinspect and clean the inside of the shield, using alcohol.
21. Install the detector drawer back into the shield and slide in about half way.
22. Orient the cables and gas lines within the slots of the lead brick so that theywill not be damage or crimped when the drawer is fully inserted.
23. Join the two mating gas line quick-connect fittings and twist to lock in place.
24. Submerge the gas vent line approximately 1/8 inch below the surface of acontainer of liquid and ensure that bubbles are produced. If not, immediatelydisconnect the gas quick-connect fittings and investigate for possiblecrimping of the gas line within the shield area. Failure to do this may resultin damage to the window on the sample detector.
25. With the gas flow integrity having been verified, proceed with the attachingthe high voltage/signal cables to the inputs of their respective preamplifiers.
26. Attach the ground straps to the front panel of the preamplifiers.
27. Secure the detector drawer into place using the four 6-32 Phillips screws.
28. Apply power to the system and test for proper operation. It is always best toperform a plateau when installing a new detector. Calibrate the system.
Sample Changer ConsiderationsShould you have one of the early-style changers, there are a few items worthy of con-sidering for upgrade.
189
Upgraded Hardware Specifics
Sample Changer Wiring HarnessEarly-style changers used a single-sided circuit board with precise orientation ofphoto-devices to detect the sample carrier. Pins of devices were inserted straightthrough and soldered. Problems have been noticed from a lack of strain relief wherethe wires were soldered to the 25 pin D-connector. Problems were seen in form of bro-ken wires, and solder connections would fatigue due to vibration of the changer. New-style harnesses utilize double-sided board material. Some holes are plated through, butthe photo sensors are inserted and then the pins are bent over and soldered to a pad.This allows some flexibility in the lead to absorb vibrations and mechanical stressfrom the collimator. Strain relief was added to the 25 pin D- connector.
LED CoverThe early style did not have one. Problems occurred when planchets, not properly in-stalled would contact the infrared diodes and pull them loose from circuit board. AnLED cover, which prevents this from occurring, can be installed on all early versionsof changers.
Slide RailsThe early style was manufactured from brass. Subsequent styles used Teflon-coatedsteel rails. Both types were more susceptible to galling and had to be cleaned and lu-bricated frequently. The new style consists of a steel rail hot-dipped in liquid nylon. Asmooth and durable surface is obtained, exhibiting minimum friction between slideand support rails. This also requires a new T block due to difference in dimensions.
Sample SlideThe early style was manufactured from nickel-plated steel with lead shielding attachedwith 10-32 socket-head screws. A problem occurred when the screws were over-tightened. Screws could be tightened through the lead shield entirely. The screwswould then protrude through the bottom of the slide into the slide support rail. This re-sulted in excessive wear of the rails, and elevated the slide from its correct orientationwith the detector drawer, causing jamming of the slide. The new assembly is still anickel-plated steel slide, but the lead has been changed to nickel-plated copper. Also,the large shield has slotted holes to allow for minor adjustment of the channel forsmooth carrier movement.
Slide Indexing BarThe early style was an aluminum bar with notches cut into it to allow indexing of slidephoto sensors. The problem with the early-style changers is the minor dimensionalvariation between the changers. These variations cause the mechanical action of theslide to differ from the designed tolerance of the slot width in the indexing bar (that is,slide in and slide out could not be adjusted accurately). A later style has an adjustablewindow width to allow for precise adjustment of slide in and slide out position. Thepresent style has a fixed vane or magnet, mounted to the slide and a photo detector as-sembly or Hall-effect sensor mounted to each end plate. Tolerances are taken care ofthrough software overdrive.
190
Upgraded System Instructions
One Hundred Sample Option (High Torque Motor)The early systems used 65:1 ratio motor, which worked well with 1/8 inch deep plan-chets. Deeper planchets added more weight than the motor could handle. Motors didnot fail, but current load caused frequent shutdown through over-current protection.The new motor has 127:1 ratio with plenty of torque to handle more than 100 samples.THIS IS NOT RECOMMENDED FOR UPGRADE ON OLDER CHANGERS. Toomany other problems are encountered unless additional upgrades are incorporated,such as:
Gear Trains
The system originally used plastic gears, which were then upgraded at no chargeto customer. The early-style gears were retained on a shaft with 5/64 inch rollpins. They were 1/8 inch thick. In some locations, it was necessary to pin twogears together. This style of gears works well unless upgrading to the 3500-0003motor (127:1 ratio). The cotter pin holes are slightly larger than pins. Reversingtorque over a time will fatigue pins and cause them to shear. The new-style gearshave smaller holes and result in gears being pinned tight to shaft. Also, spiralpins were incorporated in place of roll pins for added strength. Instead of pinningtwo gears together to obtain width of gear cogs, wide face gears have beenincorporated.
Helixes or Crossfeed Cams
Those of the previous style are similar to the new style. The difference is that thenew style has been cut down to allow use with the new mounting bracket for theinside rail of the mast assembly. This allows the carriers to be controlled duringtheir entire descent to the helixes and eliminates any type of jamming problemrelated to displacement in the horizontal plane of travel.
191
Upgraded Hardware Specifics
14. Gas System
Gas ManagementMost Tennelec Low Background Counting Systems include a gas regulator. Due to thedifferences in gas handling requirements in foreign countries, the gas regulator can besupplied locally as an option to meet the specific requirements. The gas regulator forthe Series 5 is a single stage regulator. Tennelec counting systems, that are notequipped with Gas Stat or Gas Mode, require a dual stage gas regulator.
Gas control on the new Series 5 is managed using two modes of operation. Bothmodes incorporate digital flow control and sensing to provide the operator a preciseread-out. Gas Mode, a standard feature of the Series 5 HP, controls the gas flow rateonly. You can adjust the gas flow rate Eclipse LB. The gas flow rate is updated priorto each sample count. At no time during a sample count do changes in the gas flowrate take effect. Using the system status tab in the TAB Control View of Eclipse LBthe operator can view the current flow rate.
Another mode of the gas management system incorporates a more sophisticated sens-ing system that continuously monitors and controls the gas flow rate. Gas Stat mode ofoperation is a standard feature of the Series 5 XLB. It can be equipped as an option onthe Series 5 HP. Gas Stat provides the operator with the capability to control the gasflow for time and rate.
Note The secondary gas pressure should be set to 10 PSI ± 1 for normal operation.On systems that are equipped with Gas Stat or Gas Mode the inlet pressure tothe system must not exceed 15 PSI for any reason. High pressures could causeirreparable damage to the detector window.
Gas SpecificationsP-10 gas (90% Argon, 10% Methane) is recommended to be used in the Tennelec Se-ries 5. The maximum operating high voltage for Tennelec counting systems is 1650 V.
Gas ModeAll Tennelec Series 5 systems use Automatic Gas Flow (AGF) regulation. A micro-processor based unit continuously monitors and maintains the operator-set gas-flowrate for consistent operation. AGF may reduce cost and down time due to windowdamage because it is virtually impossible to damage a window by over pressurization.
AGF may also increase stability in count results because internal gas pressure, whichcould affect the quality of counting data, is automatically held within tighter tolerancesthan possible with traditional manual controlled flow meters.
192
Gas System

The gas system of the new Series 5 uses Standard Cubic Centimeters per Minute(SCCM). The conversion between Standard Cubic Feet per Hour (SCFH) is given by:
1 SCFH ≈ 470 SCCM.
For many applications, the factory default gas-flow rate will never need to be changed.Changing the gas flow rate is simple and fast through Eclipse LB software. Careshould be taken when changing the flow rate from the factory default. Flow rate af-fects spillover dramatically and has a small effect on Background and Efficiency. If itis necessary to change the gas flow rate, the system performance should be re-selected.Re-calibration may be necessary after changing the flow rate.
To access gas mode setup, select System | Gas Flow Setup from the main menu. Amore detailed system operation can be found in the next section.
Gas Stat Gas Conservation SystemThe Series 5 with Gas Stat sets a new standard in the industry for eliminating the needfor frequent re-calibrations due to counting gas changes.
Gas Stat senses when the system is not counting samples, and automatically reducesthe gas flow rate to a low quiescent flow to maintain detector gas quality. This pre-vents atmospheric impurities from diffusing into the detector and causing questionableresults. The system is microprocessor controlled and provides unattended operation.The operator can modify gas Stat settings.
This unique development effectively increases the useful life of the gas supply therebyreducing the frequency of instrument re-verification, saving time and improving thequality of counting data.
There are four different modes in which Gas Stat can be operated: Maximum, Normal,Minimum, and Custom. The parameters are:
Operate Flow - The normal operating flow rate.
Inactivity Time - The amount of time the system will be idle before it goes intostandby.
Standby Flow - The flow rate while the system is in standby.
Purge Flow - The flow rate at which the system will purge when inactivity hasended prior to settling and then counting.
Purge Time - The time the Purge Flow will last before the settling starts.
193
Gas Management
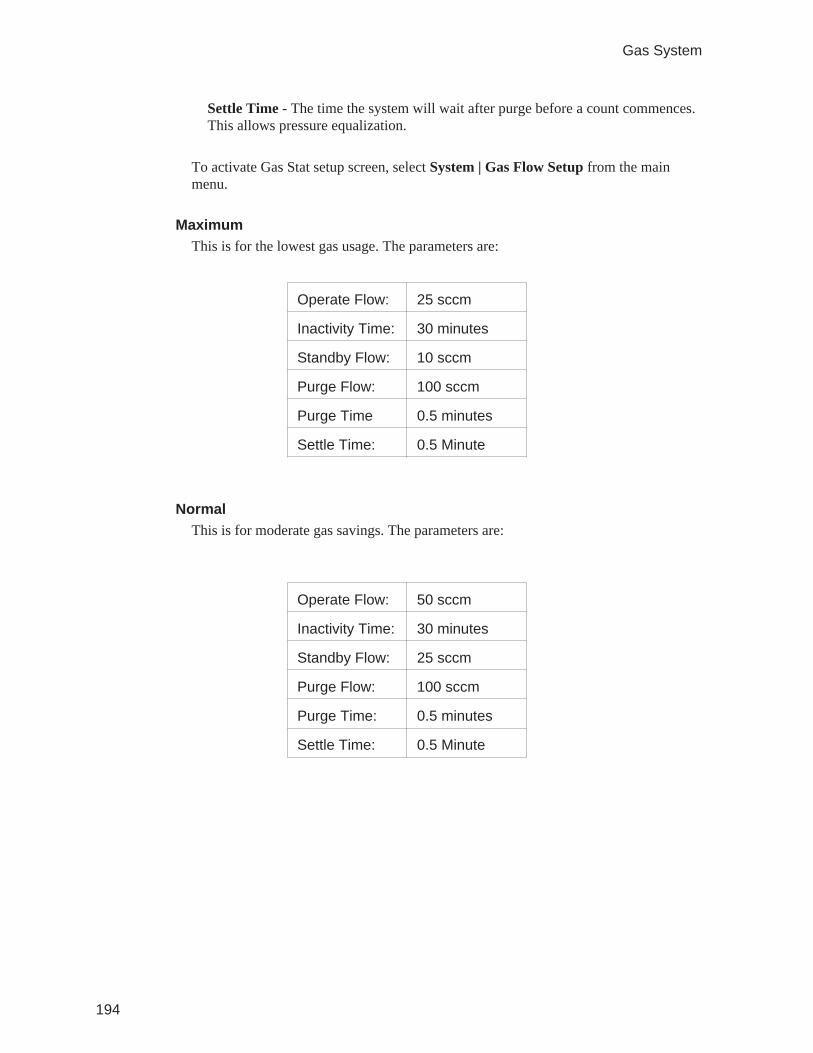
Settle Time - The time the system will wait after purge before a count commences.This allows pressure equalization.
To activate Gas Stat setup screen, select System | Gas Flow Setup from the mainmenu.
MaximumThis is for the lowest gas usage. The parameters are:
Operate Flow: 25 sccm
Inactivity Time: 30 minutes
Standby Flow: 10 sccm
Purge Flow: 100 sccm
Purge Time 0.5 minutes
Settle Time: 0.5 Minute
NormalThis is for moderate gas savings. The parameters are:
Operate Flow: 50 sccm
Inactivity Time: 30 minutes
Standby Flow: 25 sccm
Purge Flow: 100 sccm
Purge Time: 0.5 minutes
Settle Time: 0.5 Minute
194
Gas System
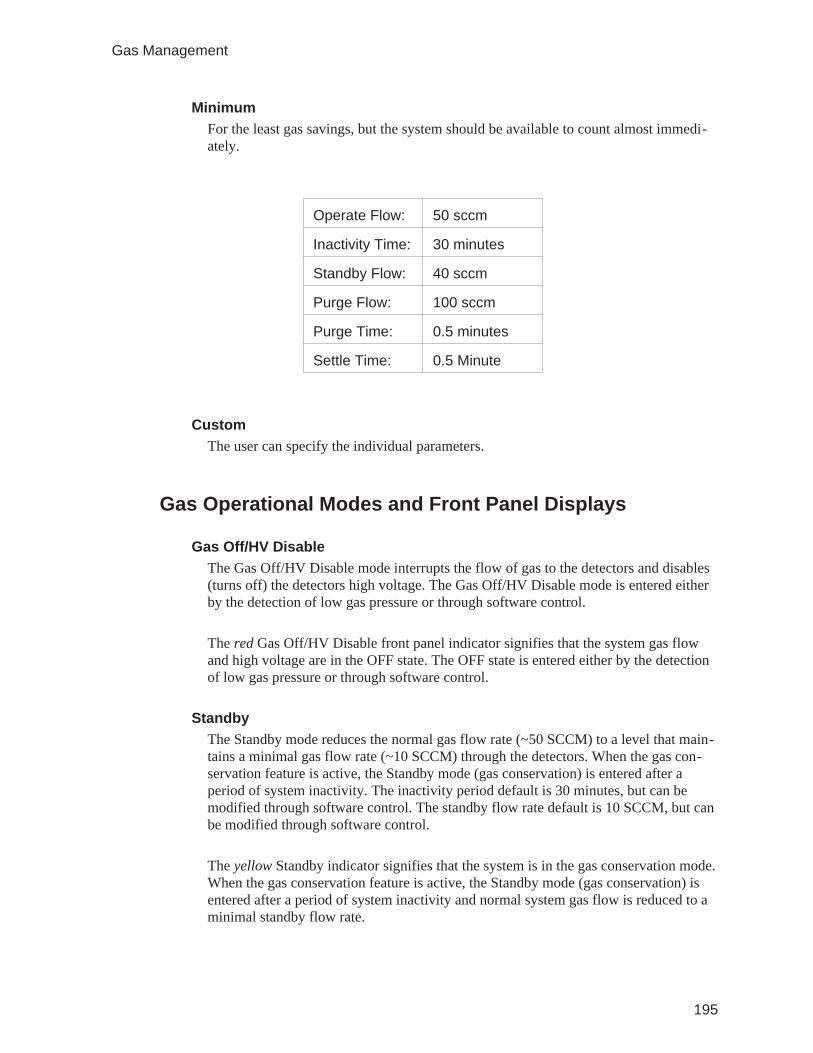
MinimumFor the least gas savings, but the system should be available to count almost immedi-ately.
Operate Flow: 50 sccm
Inactivity Time: 30 minutes
Standby Flow: 40 sccm
Purge Flow: 100 sccm
Purge Time: 0.5 minutes
Settle Time: 0.5 Minute
CustomThe user can specify the individual parameters.
Gas Operational Modes and Front Panel Displays
Gas Off/HV DisableThe Gas Off/HV Disable mode interrupts the flow of gas to the detectors and disables(turns off) the detectors high voltage. The Gas Off/HV Disable mode is entered eitherby the detection of low gas pressure or through software control.
The red Gas Off/HV Disable front panel indicator signifies that the system gas flowand high voltage are in the OFF state. The OFF state is entered either by the detectionof low gas pressure or through software control.
StandbyThe Standby mode reduces the normal gas flow rate (~50 SCCM) to a level that main-tains a minimal gas flow rate (~10 SCCM) through the detectors. When the gas con-servation feature is active, the Standby mode (gas conservation) is entered after aperiod of system inactivity. The inactivity period default is 30 minutes, but can bemodified through software control. The standby flow rate default is 10 SCCM, but canbe modified through software control.
The yellow Standby indicator signifies that the system is in the gas conservation mode.When the gas conservation feature is active, the Standby mode (gas conservation) isentered after a period of system inactivity and normal system gas flow is reduced to aminimal standby flow rate.
195
Gas Management
Standby mode is only present on systems equipped with Gas Stat.
PurgeWhen the gas conservation feature is active and the system in the Stanby mode, thePurge mode is entered before normal sample counting is resumed. The Purge mode in-creases the gas flow rate to a high level (~100 SCCM). This operation ensures that anygases or water molecules that might have diffused into the detectors during standbyare purged from the system before resuming normal counting. The purge flow rate de-fault is 100 SCCM, but can be modified through software control. The purge time de-fault is 1 minute, but can be modified through software control.
The flashing yellow Purge indicator signifies that the system is in the gas purge mode.When the gas conservation feature is active and the system is in the Standby mode, thePurge mode is entered before normal sample counting is resumed.
Purge is only present on system equipped with Gas Stat.
OperateThis is the normal operational mode of the system. The Operate mode can be enteredmanually (custom settings) or as the normal counting mode when the gas conservationfeature is active. When the gas conservation feature is active and a purge cycle hasended, the system will enter normal operation after a delay to ensure that the opera-tional gas flow rate has stabilized. The operational delay default is 0.5 minutes, butcan be modified through software control. The normal operational flow rate is 50SCCM, but can be modified through software control.
The green Operate indicator signifies that the system is in the normal operationalmode.
196
Gas System
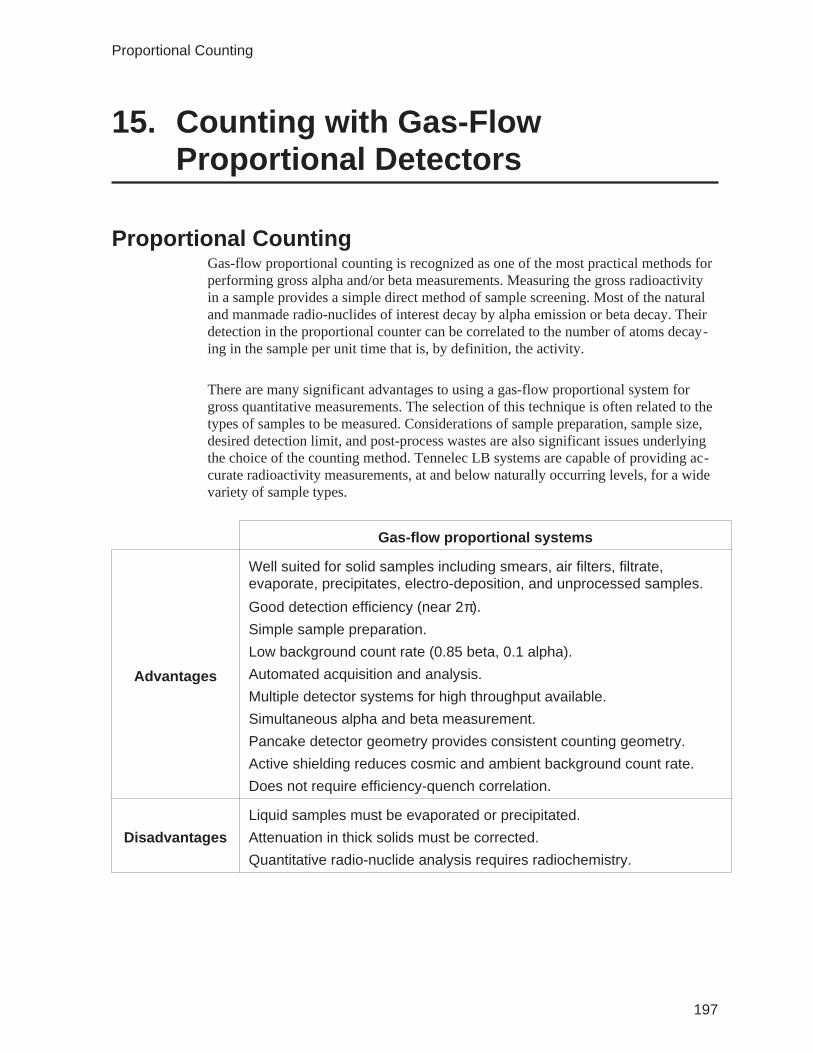
15. Counting with Gas-FlowProportional Detectors
Proportional CountingGas-flow proportional counting is recognized as one of the most practical methods forperforming gross alpha and/or beta measurements. Measuring the gross radioactivityin a sample provides a simple direct method of sample screening. Most of the naturaland manmade radio-nuclides of interest decay by alpha emission or beta decay. Theirdetection in the proportional counter can be correlated to the number of atoms decay-ing in the sample per unit time that is, by definition, the activity.
There are many significant advantages to using a gas-flow proportional system forgross quantitative measurements. The selection of this technique is often related to thetypes of samples to be measured. Considerations of sample preparation, sample size,desired detection limit, and post-process wastes are also significant issues underlyingthe choice of the counting method. Tennelec LB systems are capable of providing ac-curate radioactivity measurements, at and below naturally occurring levels, for a widevariety of sample types.
Gas-flow proportional systems
Advantages
Well suited for solid samples including smears, air filters, filtrate,evaporate, precipitates, electro-deposition, and unprocessed samples.
Good detection efficiency (near 2π).
Simple sample preparation.
Low background count rate (0.85 beta, 0.1 alpha).
Automated acquisition and analysis.
Multiple detector systems for high throughput available.
Simultaneous alpha and beta measurement.
Pancake detector geometry provides consistent counting geometry.
Active shielding reduces cosmic and ambient background count rate.
Does not require efficiency-quench correlation.
Disadvantages
Liquid samples must be evaporated or precipitated.
Attenuation in thick solids must be corrected.
Quantitative radio-nuclide analysis requires radiochemistry.
197
Proportional Counting
The remainder of this section presents introductory technical discussions on how gasdetectors work (refer to “How a Gas Detector Works” on page 198), how proportionalgas detectors work (refer to “Proportional Detectors” on page 200), a discussion of thevarious counting modes (refer to “Discussion of Count Modes” on page 203), issuesrelating to the operation of such detectors, and to measurements performed with them(refer to “Factors Affecting Sample Measurements” on page 205).
How a Gas Detector WorksA gas-flow proportional detector is a type of gas-filled detector. It consists of a vol-ume of gas surrounded by a housing called the detector body. The detector can besealed or in the case of the counting systems, designed to allow a continuous flow ofcounting gas. A voltage is applied across the electrodes within the detector creating anelectric field. When radiation from the sample is emitted and passes though the detec-tor gas, it can ionize the gas molecules to form electron-ion pairs.
Ionization and excitation are the principle interactions of energy transfer betweencharged particle radiation and matter, including the matter that makes a detector. Themoving charged particle exerts coulombic (electromagnetic) forces on atomic elec-trons and imparts energy to them. Energy loss interactions with the nucleus are negli-gible except for particles at low velocities. If the particle-electron interaction transferssufficient energy, an electron bound to the atom can be freed (the binding energy is ex-ceeded), freeing it from its bond and thereby ionizing the atom. Alternatively, the atomcan be left in an excited but non-ionized state.
Energy and angular momentum conservation laws maintain that the maximum energytransferred in a single collision is usually a small fraction of the charged particle’s en-ergy. Therefore a heavy charged particle such an alpha particle travels nearly a straightpath through matter, losing energy almost continuously in small collisions with atomicelectrons. Occasionally, large angle deflections can occur to alpha and other chargedparticles resulting from Rutherford backscattering and other effects.
Beta particles, including electrons and positrons, also lose energy almost continuouslyas they traverse through matter. However, unlike heavier charged particles, their massis about equal to that of the atomic electrons with which they are interacting. They canlose a large fraction of their energy in a single collision. They are also deflected atlarge angles by collisions with nuclei. As a result, the path of betas through matter israrely straight. Other processes, such as bremsstrahlung that result from a deflection ofan electron by a nucleus also result from interactions of betas with matter.
Gas detectors such as those used in Tennelec LB systems utilize the ionization pro-cesses for radiation detection. For most gases, including P10 argon/methane, the aver-age energy to create an electron-ion pair is about 30 eV. This value accounts for allcollisions, including those that lead to excitation. For a 3 MeV alpha or beta particlethat deposits all of its energy in a detector, the number of electron-ion pairs producedby only primary ionization, will on average be:
198
Counting with Gas-Flow ProportionalDetectors
3 10 eV
30 eV / pair10 electron ion pairs
65×
= −
This calculation is valid for only the primary ionization produced from the radiation. Itexcludes the effects of gas multiplication and secondary ionization that occur in pro-portional and Geiger-Müeller operating regions, discussed below. Furthermore, a typi-cal gas detector that has a capacitance of about 50 pF (picoFarads) with chargecollection in the range of 1 µs. Assuming all of the charge from this primary ionizationis collected from the 3 MeV particle, it will produce a voltage and current of:
VQ
C
10 1.6 10 C / e
50 10 F0.5 10 V 0
5 19
123= ≈
× ×
×≈ × ≈
−− .5mV
where
V = output voltage from the detector
mV = milliVolt = 1/1000 V
Q = total charge collected = number of charges collected times the charge inCoulombs per electron
C = capacitance of the detector in Farads
iQ
t
10 1.6 10
10A 1.610 A
5 9
68= ≈
× ×≈
−−
where
I = current in amperes output by the detector
Q = total charge collected
t = collection time of charges (pulse processing shaping time)
Operating Regions of Gas DetectorsGas detectors operate in different ways depending upon the electric field strength, afunction of the operating voltage applied to the electrodes. The classic discussion de-scribes five operating regions, recombination, ionization, proportional, Geiger-Müller(GM region), and continuous discharge.
199
Operating Regions of Gas Detectors
Recombination RegionIn the recombination region, the electrons and ions move slowly and can recombinebefore they reach the electrodes. Increases in high voltage result in a stronger electricfield that collects more ions and /or electrons as recombination increases.
Ionization RegionNo additional charge is collected with higher voltages because no recombination is oc-curring and no additional charge is created by secondary ionization.
Proportional RegionAbove a certain voltage, there is enough energy in the electric field to cause secondaryionization from the electrons produced from the radiation’s primary interactions. Fur-ther increase in high voltage results in more charge being created and collected. Thegas multiplication factor is a measure of this secondary ionization and is defined as theratio of total ionization produced divided by the primary ionization. This factor is, fora given voltage, independent of the primary ionization event energy. Therefore theoutput pulse maintains proportionally, its amplitude relative to the primary ionizationevent energy. As a result, particle identification and energy measurement are possible.
Geiger-Müller (GM) RegionAs voltages are further increased, the electric field is so strong that an ionizing eventionizes all the gas molecules in the volume of the detector. This avalanche produces alarge signal with shape and amplitude independent of the original ionizing event’s en-ergy.
Continuous Discharge RegionAbove a critical voltage, a single ionizing event starts a continuous discharge in thegas. There is no recovery and the device no longer functions as a counter and mayeven be damaged.
Proportional DetectorsMost commercial detectors, including the Tennelec gas-flow proportional detectors,are designed to operate in only one of these regions. Proportional counters operate inthe region where gas multiplication takes place and where the output signal is propor-tional to the energy deposited by the radiation. For charged particles such as alpha andbeta particles, the signal pulse is produced for every particle that deposits a significantamount of energy in the gas.
200
Counting with Gas-Flow ProportionalDetectors
Gas Multiplication in Proportional DetectorsGas multiplication occurs when secondary ionization occurs between the primary ion-ized electrons and neutral gas atoms. Most gas multiplication occurs where the electricfield strength is high, near the anode wire as the electrons are accelerated. The produc-tion of this shower of electron-ion pairs is called a Townsend avalanche.
In addition to secondary ionization, secondary excitation can occur. Those events re-sulting in excitation without creation of a secondary electron are lost to the detectionprocess. Occasionally, their decay by emission UV or visible light can produce addi-tional secondary ionization of a less tightly bound electron in another gas molecule asdescribed in “Gas Composition and Quenching” on page 205. When this occurs, spuri-ous signals may result. This additional ionization can result in spurious pulses becauseof the time differences in when the charge is collected.
Therefore, the detector is operated at lower gas multiplication factors in order to limitthe amplitude of the voltage output pulses to only those events that deposit more thana minimum limit of energy. These pulses create enough electron-ion pairs to producean output voltage large enough to exceed the lower noise discriminator of the counter.However, the pulses are not so large as to create single avalanches that introduce non-linearity for large pulses and spurious background counts from noise.
Relationship of Plateau Voltage to Charge CollectionOperation of a proportional counter involves the selection of operating voltage withinthe operating region, in this case the proportional region. Within the proportional re-gion, the relationship between the applied voltage and the collection of charge, resultsin regions where increases in voltage do not result in increasing countrate. This regionis called a plateau. A voltage plateau is a required part of instrument setup. The shapeof the voltage plateau will vary depending upon the radio-nuclide and its associatednuclear decay scheme. To generate a voltage plateau, a check source containing a sin-gle alpha or beta emitting radio-nuclide is counted as the detector voltage is varied. Anoperating point is selected that corresponds to a flat region on the a plot of count rateversus operating voltage.
Alpha Particle Interactions with Proportional DetectorsIf a source is mono-energetic and the radiation deposits all of its energy within the de-tector, a proportional counter records each particle that enters its active volume withnearly 100% efficiency. This is usually the case for alpha particles emitted from a spe-cific nuclide. However, with a pancake geometry, such as that used in the Tennelec LBsystems, the detector thickness is about 0.375 in. which is less than the range of an al-pha particle in air. Ignoring small differences in density between 10P and air, the gaspressure is at atmosphere, so some alpha particles may reach the back wall of the de-tector. Nevertheless, the alpha particles deposit most of their energy in the gas andtherefore create a large output pulse.
201
Proportional Detectors
Even considering the energy range of most alpha particles is between 4 and 8 MeV, thedetector dimensions are large compared to the range of the alpha radiation. As a result,alpha particles deposit nearly all of their energy into the detector creating abundantelectron-ion pairs within a short range. Energy loss does occur in both the window andair between the sample and the detector. Absolute measurement of alpha radioactivityis simple if one knows the geometric efficiency and can correct for self-absorption andscattering in the source. Self-absorption and sample scattering are discussed in “Sam-ple Self-absorption and Scattering” on page 209.
Beta Particle Interactions with Proportional DetectorsBeta particles have ranges that greatly exceed the dimensions of a typical proportionaldetector. The number of electron-ion pairs produced is proportional to only that part ofthe energy deposited in the gas before the particle reaches the back wall. (Note thatsome backscatter can occur from the detector’s back wall, but the creation of addi-tional charge pairs will occur within the same collection time as those produced fromthe original radiation track and will be recorded as a single event of greater amplitude.Backscatter can also occur within the sample for higher energy beta particles. Thesecan contribute to measured efficiencies greater than expected from geometrical consid-erations alone.)
As a result of the weaker primary ionization of the gas by the beta particles, the outputpulses are much smaller than those resulting from alpha particles of equivalent energyare. Beta decay also results in lower energies (1-4 MeV) than most alpha decays (4-8MeV), although some overlap in their energy ranges does exist. Furthermore, in betadecay, the beta particle shares its energy with a neutrino and hence, can itself have anenergy from 0 to a maximum energy equal to the energy difference of the two groundstates.
Operating Voltage In Relation To The Type Of RadiationWithin the proportional region, the operating voltage is set to a plateau where thecount rate does not increase significantly as a function of applied voltage. As voltageis increased within the region, an alpha plateau is reached first because the alpha parti-cles create sufficient charge in the gas that the gas multiplication factor is sufficient toresult in an output pulse that exceeds the lower discriminator. The alpha plateau is rel-atively flat; with 210Po, it remains flat over hundreds of volts.
As the voltage is further increased, the gas multiplication factor also increases. Even-tually, the smaller charge produced in the detector gas by primary ionization of thebeta particles is multiplied sufficiently that the beta output pulses also exceed thethreshold. At this point, the alpha pulses are even larger due to the higher gas multipli-cation factor. The plateau for a beta emitting radio-nuclide is shorter and may have asteeper slope than an alpha plateau, often flat or slightly increasing over a 200 voltrange. At the beta plateau voltage, both alpha and beta particles create enough chargepairs and hence output pulse amplitude that they are both counted.
202
Counting with Gas-Flow ProportionalDetectors
Simultaneous Alpha and Beta MeasurementsTheoretically, an alpha or beta particle of the same energy that deposits all of its en-ergy in the detector will produce identical numbers of primary-ionization electron-ionpairs and hence equivalent output pulse voltages. Practically, this is not observed, butrather the alpha and beta particles have different pulse heights for equivalent energyparticles. First, there is a difference in the energy range of alphas and betas. Second,the difference in the interaction processes of alpha and beta particles with matter resultin vastly different ranges and interaction probabilities for each particle. Both of thesefactors contribute to generally smaller beta output pulses and larger alpha outputpulses.
Two methods of differentiating alpha and beta pulses have been employed in LBcounting systems. The first, pulse height discrimination utilizes the difference in theamplitude of the output voltage pulses created from each type of radiation. The secondmethod uses pulse shape discrimination that is based upon the differences in collectiontime of charges from each type of radiation. The Tennelec LB systems use pulseheight discrimination, a measure of the pulse’s voltage created from the interaction ofradiation in the detector, to differentiate alpha from beta pulses.
By examining the amount of charge produced in the detector and by recognizing thedifferences of how alpha and beta particles interact in the detector, it is possible to dis-tinguish between the alpha and beta radiation. Differences between the alpha versusbeta particles are measured by examining the output pulse height of each. By settingnot only a lower discriminator but a lower and upper discriminator for the beta and al-pha windows, an energy range, ∆E, that corresponds to an output pulse voltage range,∆V, for each type of radiation may be defined. When a pulse falls into the beta energyrange, a counter for the beta channel is incremented by one. Similarly, a counter forthe alpha energy range is incremented when the particle’s output pulse falls in thisvoltage range. In this way, the sample’s alpha and beta activities may be determinedsimultaneously.
Discussion of Count ModesEclipse-LB software provides for three different counting modes that address manycounting applications. Simultaneous counting of alpha and beta radiation providesmaximum throughput but adds some uncertainty and inaccuracy because of spillovereffects. Alpha then Beta count mode provides better accuracy and lower uncertaintybut requires each sample be counted twice. Alpha Only count mode is perfect for al-pha measurements when no beta measurement is required.
Alpha OnlyThe Alpha Only count mode is ideal for counting applications that require only an al-pha result. There are many advantages including:
203
Discussion of Count Modes
• Lower overall background
• No beta to alpha spillover
• No alpha and beta discriminators to modify
• Simple counting parameters
• Only alpha plateau needed
Alpha Only optimum voltage plateau is typically achieved with a Tennelec gas flowdetector (using P-10 gas) between 300 and 900 volts.
Alpha then BetaThe Alpha then Beta mode is an automatic means to count the sample first at the opti-mum alpha voltage plateau and then for a second count at the beta (plus alpha) opti-mum voltage plateau setting. This allows the beta counts to be determined as thedifference between the two measurements. At the beta plateau voltage, both alpha andbeta pulses are counted, the beta activity is determined by subtracting the counts re-corded at the alpha plateau voltage from the combined counts measured at the betavoltage. Essentially Alpha then Beta count mode is Alpha Only then Alpha/Beta Si-multaneous minus Alpha. The advantages to using Alpha Then beta are:
• No need to set alpha and beta discriminators
• No spillover from alpha into beta and beta and into alpha
The disadvantages include:
• Need to count each sample twice, once at each plateau voltage
• Lower throughput that simultaneous mode
• Statistical problems associated with counting samples multiple times underdifferent conditions
• Must run both alpha and beta plateaus
The typical alpha operating voltage is 300-900 volts. The typical beta operatingvoltage is 1350-1590 volt.
204
Counting with Gas-Flow ProportionalDetectors
Simultaneous (Alpha and Beta)The most efficient count mode for measuring both alpha and beta radiation is the si-multaneous counting mode. Counting is performed at the beta (simultaneous) plateauvoltage. Simultaneous mode uses pulse height discrimination to differentiate betweenalphas and betas.
The advantages of counting in simultaneous mode are:
• Only need to count sample once
• Measure both alpha and beta activity at the same time
The disadvantages are:
• Must set Discriminators to match gas, high voltage, and radio-nuclide
• Must only have Beta plateau but Alpha is highly recommended
• Spillover a) alpha into beta and b) beta and into alpha
The typical Simultaneous operating voltage at sea level is 1350-1590 volts using a90Sr/90Y point source in a 2 in. x 1/8 in. deep stainless steel insert. This operatingvoltage can decrease with an increase in elevation.
Factors Affecting Sample MeasurementsThere are several factors that can directly affect the quality of results using a gas flowproportional counter. Following some of the most common factors causing interfer-ence in GFPC’s.
Gas Composition and QuenchingWhile many gases work in an ionization detector, this is not true for proportional de-tectors. The quality and composition of the counting gas has a direct effect on the per-formance of the counter. In proportional detectors, the output signal is derived fromthe collection of free electrons. Any creation of negative ions competes with free elec-tron production and collection; therefore affects the proportionality of the outputpulses. The fill gas must not contain any molecular gas components that are strongelectron attractors that form anions. The noble gases are ideal for proportional detec-tors.
205
Factors Affecting Sample Measurements
Another consideration in the selection of the counting gas for proportional detectors isthat secondary Townsend avalanches are infrequent. These secondary avalanches re-sult when ultraviolet photons produced by atomic de-excitation occurs in the gas. Theaddition of a quenching agent, usually a polyatomic gas such as methane that is addedto the argon gas, suppresses further ionization from excited gas atoms. The quenchingagent absorbs the UV photons and then de-excites by dissociation or radioactivemodes of de-excitation that do not result in localized ionization avalanches in the gas.As discussed above, when these secondary avalanches do occur, they may result inhigher background or spurious counts in the detector. The most commonly used count-ing gas, P-10, utilizes this principle in its 90% argon 10% methane mixture.
Gas QualityThe composition of the gas can vary among suppliers and occasionally from differentbottles from the same supplier. Chemical impurity in the gas such as water vapor maybe present. These impurities can cause a quenching effect that will affect the back-ground count rate and the measured efficiencies of the counting system. Calibrationplateau, background and efficiency should be verified whenever the gas is changed.
Sources of Background in Gas Proportional DetectorsCosmic radiation and natural radiation in the environment both contribute to the ob-served background of gas proportional counting systems. The most important of theseinclude:
• Natural radioactivity in the detector materials.
• Natural radioactivity in associated equipment, supports, shielding, and circuitrynear the detector.
• Radiation from other materials in the laboratory including walls, building, andsubsurface materials.
• Radioactivity in the gas or air near the detector (radon and thoron daughters).
• Cosmic radiation.
206
Counting with Gas-Flow ProportionalDetectors
Instrument Methods to Reduce System Background
Voltage DiscriminationThe counting gas is not as sensitive to fast electrons as it is to alphas and heavilycharged particles; therefore, operating the detector at the alpha plateau voltage resultsin beta output pulses that do not exceed the counting voltage threshold. Under theseconditions, many possible sources of background are eliminated. The observed back-ground in a proportional detector is a function of the threshold setting that defines theminimum ionization required for a count to be recorded.
Active Methods - Anti-Coincidence Background ReductionModern Tennelec LB systems employ active anti-coincidence to further reduce thebackground count rate due to external cosmic interactions with the sample detector.The guard detector and sample detector are similar in that they are both gas-flow pro-portional detectors, but each has been optimized. The guard detector does not have athin mylar window. It has a thick metal plate on both sides that maximizes the interac-tion of cosmic rays and gamma rays with the gas.
When the pulse processing electronics sense a suitable event in the guard detector, thelinear gate of the sample processing electronics is enabled. This disables the samplecounter and timing electronics for a predefined time. This type of gating in the elec-tronics is called anti-coincidence gating because the sample counters are turned offwhen an event is coincident in both detectors. This suppression assures no spuriouscounts will occur in the sample detector as a result of a cosmic ray shower or otherambient background source. The result is lower background count rates, <1cpm, ver-sus 20 cpm in a system without active anti-coincidence. The guard detector is most ef-fective for rejection of gamma ray, which could be counted as betas.
Passive Methods - ShieldingThe passive lead shielding effectively blocks all alpha and most beta radiation fromreaching the detector unless it originates in the sample. Passive shielding is less effec-tive for electromagnetic radiation such as cosmic rays and gamma rays. For thesetypes of radiation, the active shielding provides additional background reduction.
Tennelec Series 5 systems provide a choice of passive shielding thickness. Whenweight or portability is not a concern, the lowest background performance is obtainedwith the 4 in. shielding. All materials used in Tennelec LB systems are carefully eval-uated and chosen based upon their content of radioactive constituents.
207
Factors Affecting Sample Measurements
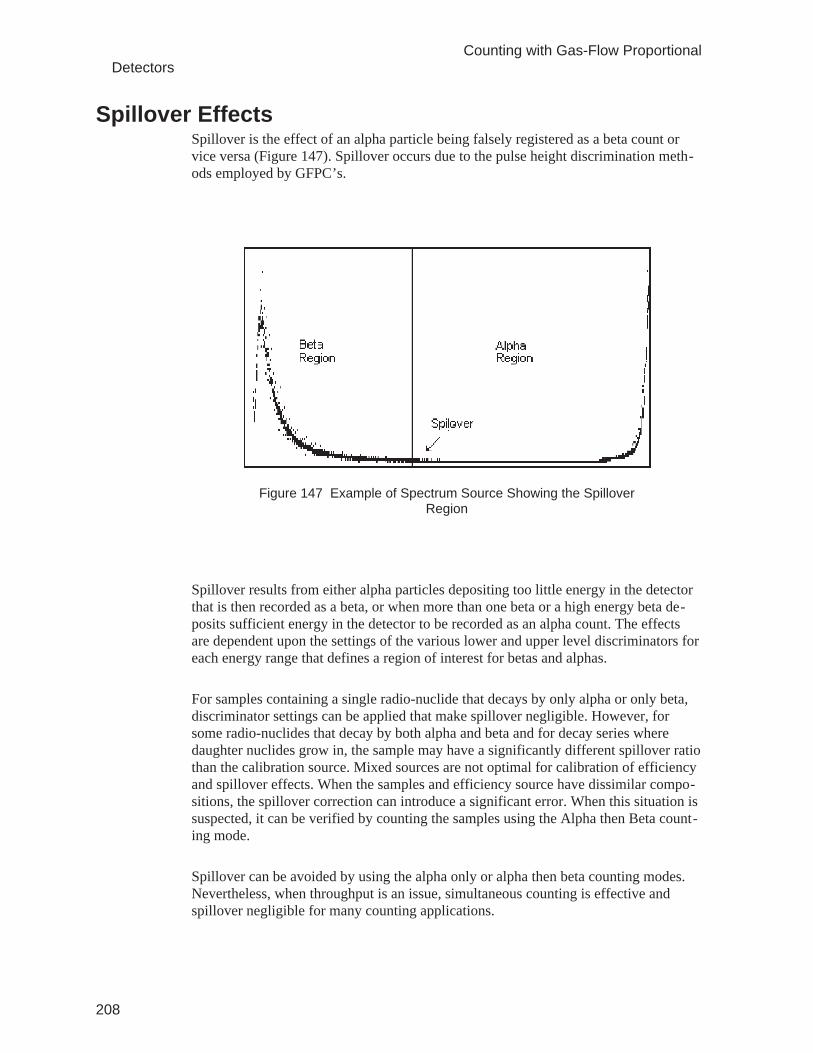
Spillover EffectsSpillover is the effect of an alpha particle being falsely registered as a beta count orvice versa (Figure 147). Spillover occurs due to the pulse height discrimination meth-ods employed by GFPC’s.
Spillover results from either alpha particles depositing too little energy in the detectorthat is then recorded as a beta, or when more than one beta or a high energy beta de-posits sufficient energy in the detector to be recorded as an alpha count. The effectsare dependent upon the settings of the various lower and upper level discriminators foreach energy range that defines a region of interest for betas and alphas.
For samples containing a single radio-nuclide that decays by only alpha or only beta,discriminator settings can be applied that make spillover negligible. However, forsome radio-nuclides that decay by both alpha and beta and for decay series wheredaughter nuclides grow in, the sample may have a significantly different spillover ratiothan the calibration source. Mixed sources are not optimal for calibration of efficiencyand spillover effects. When the samples and efficiency source have dissimilar compo-sitions, the spillover correction can introduce a significant error. When this situation issuspected, it can be verified by counting the samples using the Alpha then Beta count-ing mode.
Spillover can be avoided by using the alpha only or alpha then beta counting modes.Nevertheless, when throughput is an issue, simultaneous counting is effective andspillover negligible for many counting applications.
208
Counting with Gas-Flow ProportionalDetectors
Figure 147 Example of Spectrum Source Showing the SpilloverRegion
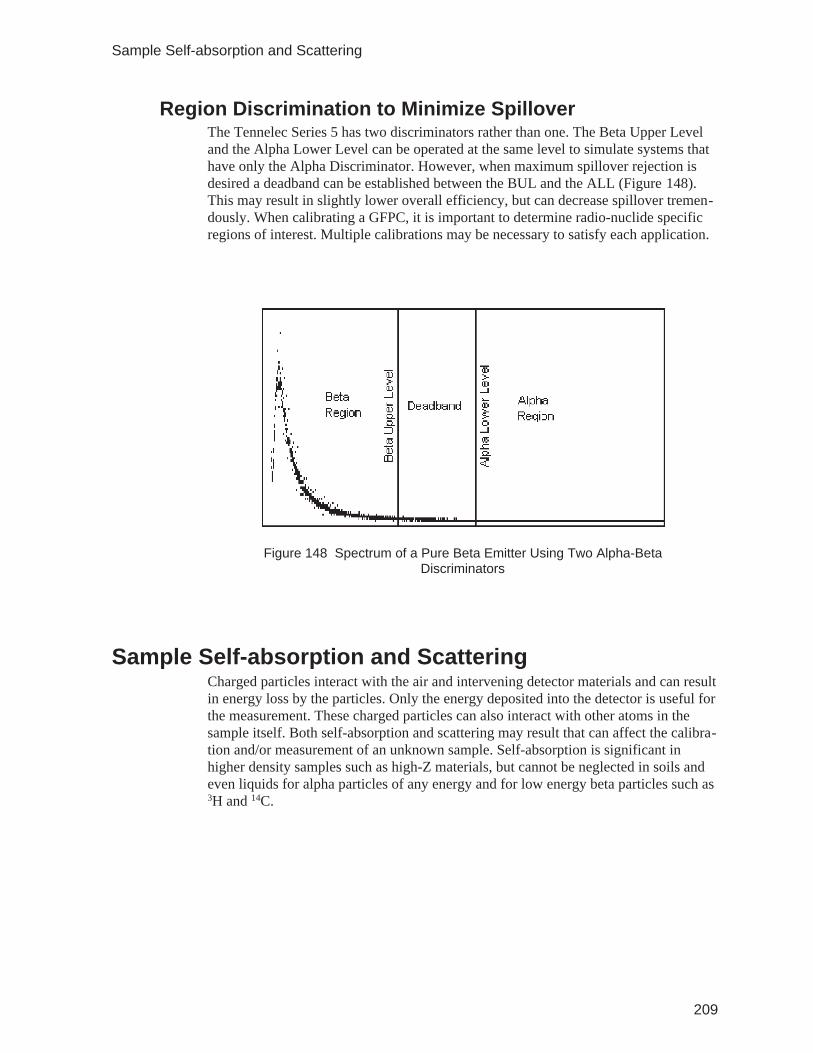
Region Discrimination to Minimize SpilloverThe Tennelec Series 5 has two discriminators rather than one. The Beta Upper Leveland the Alpha Lower Level can be operated at the same level to simulate systems thathave only the Alpha Discriminator. However, when maximum spillover rejection isdesired a deadband can be established between the BUL and the ALL (Figure 148).This may result in slightly lower overall efficiency, but can decrease spillover tremen-dously. When calibrating a GFPC, it is important to determine radio-nuclide specificregions of interest. Multiple calibrations may be necessary to satisfy each application.
Sample Self-absorption and ScatteringCharged particles interact with the air and intervening detector materials and can resultin energy loss by the particles. Only the energy deposited into the detector is useful forthe measurement. These charged particles can also interact with other atoms in thesample itself. Both self-absorption and scattering may result that can affect the calibra-tion and/or measurement of an unknown sample. Self-absorption is significant inhigher density samples such as high-Z materials, but cannot be neglected in soils andeven liquids for alpha particles of any energy and for low energy beta particles such as3H and 14C.
209
Sample Self-absorption and Scattering
Figure 148 Spectrum of a Pure Beta Emitter Using Two Alpha-BetaDiscriminators
Detector GeometryGas detectors have been manufactured in different sizes and shapes. The optimum de-sign is the pancake style. The Tennelec Series 5 utilizes a pancake detector that pro-vides a flat entrance window, convenient for most sample counting geometry’s. Thedetector shape determines the electric field strength and variations within the detector.The pancake geometry ensures uniform electrical field distribution throughout the ac-tive volume of the detector for uniform charge collection.
Gamma and X-ray Sensitivity of Proportional DetectorsGas-filled detectors operating in the proportional region are sensitive to X-rays andgamma rays below 100 keV. Above this energy, the intrinsic efficiency drops off rap-idly because most of the measurable pulses result from photoelectric interactions. Pho-toelectric processes are a strong function of both Z, the atomic number of the material,and E, the energy of the radiation. Photoelectric absorption follows atomic number asZ5 and is inversely proportional to energy as 1/ E3.5. Nevertheless, X-rays and gammarays emitted from a sample and those produced in secondary and tertiary cosmic rayproduction can interact in the detector and result in background counts or as spuriousbeta counts. The use of a cosmic guard detector reduces the cosmic ray contribution tobackground by a factor of 100. Associated X-rays and gamma rays from a given radio-nuclide can result in a beta plateau, which may have a different shape due to the addi-tional contribution of alpha and beta events.
Quantitative Measurements with Gas-flow ProportionalCounting Systems
Determining accurate analysis for specific radio-nuclides can be performed usingchemical methods to isolate and purify the radio-nuclide(s) of interest. Conventionalchemistry using ion-exchange resin or extraction solvents allows specific radio-chemicals to be separated from one another. The physical separation of the radio-nuclides of interest from the sample matrix must be performed because the propor-tional counter cannot be easily used to resolve different alpha or beta emitters. Betadecay results in a range of energies that precludes energy spectroscopy for a propor-tional detector.
210
Counting with Gas-Flow ProportionalDetectors
16. Troubleshooting
This chapter provides some troubleshooting techniques for your Tennelec Series5Automatic Low Background Alpha/Beta Counting System.
System Status IndicatorDuring normal operation, the System Status indicator on the Series 5 front panel willbe green. It can either be:
Green - Normal Operation.
Yellow - Gas Problem, see Gas Flow Problems.
Red - Power Supply Problem, see GAS OFF/HV DISABLE
Gas Flow ProblemsThe System Status Light is yellow for one of two reasons. The system will either inter-pret that there is no gas connected (Low Gas Condition) to the system or that outputflow of the Electronic Gas Flow regulator does not match the set flow. Problems andcommon solutions are discussed. Please check each of these conditions before callingCanberra.
Gas Pressure LowAfter changing the gas bottle, it is necessary to set the pressure on the secondary gasregulator to 10 psi ± 1 psi. The internal pressure switch in the Series 5 is factory presetto 5 PSI. Any setting of less than 5 psi will not activate this switch. No counting willcommence until the pressure is above 5 psi.
Gas Tubing Crimped or Secondary of Regulator not OpenWith the gas regulator turned on, disconnect the gas tubing from the system’s rearpanel GAS IN connection by simultaneously pushing in on the lip of the connectorand pulling out the tubing. If gas is flowing, you should be able to hear and feel it. Re-turn the tubing to the GAS IN connector.
211
System Status Indicator
Gas Not FlowingIf gas did not flow there may be an obstruction in the filter or the regulator may bedamaged. Contact Canberra for replacement.
Gas FlowingIf gas is flowing, the gas flow regulator may be damaged or the pressure switch maybe defective. Call Canberra for replacements.
Bubble TestVerify that gas is flowing through the detector assembly by performing a bubble test.This is accomplished by submerging the exhaust gas line (located at the rear of thesystem) about one centimeter below the surface of a beaker of water or alcohol. On agridded windowless system, a sample insert must be inside the detector chamber to ac-complish this test. Absence of bubbles indicates a leak in the system, and usually is as-sociated with a ruptured or punctured detector window. Failure here requires accessingthe detector assembly.
Plateau ProblemsAbnormal plateaus are usually caused by incorrect percentage of argon and methane inthe gas mixture, the wrong gas in the cylinder, or contaminants, such as water or oxy-gen in the counting gas. Using filter paper type sources, sources that display some selfabsorption, a ruptured detector window, gas tubing, and detector leaks or electronicsfailure may also cause unusual plateaus.
Background Problems
High BackgroundIf background measurements are not reproducible from one measurement to the nextor are elevated, check the following:
1. Has the background count rate increased or decreased steadily or suddenly?If there has been a steady increase over the past few weeks or months, it isprobably contamination. Some types of sudden electronic malfunction canalso cause increased background rates.
2. Is the same carrier/insert always being counted? If not, try using the samecarrier/insert all the time to see if the problem improves. If always using thesame carrier, try replacing it with another and see if the background changes.
212
Troubleshooting
3. Does the problem appear when multiple counts are performed?
4. Has the x-talk increased or decreased substantially?
5. Has the system been re-calibrated (Plateau and ROI) since a gas bottlechange?
6. Is it standard laboratory practice to clean the carrier/insert occasionally withalcohol or another decontamination agent? If no, periodically clean thecarrier/insert. If yes, is there a correlation between when it is cleaned andwhen the background is elevated?
Efficiency/Spillover ProblemsThis section covers some common efficiency and spillover problems that can occur.
Sr-90 Efficiency too highMany source manufacturer’s do not account for the 90Y in-growth in the 90Sr stan-dards. This results in the total activity of the standard actually being approximately 2xthe stated value (and often an efficiency of 100% or greater). Because of its high en-ergy, 90Sr also has a back-scatter component that can make the efficiency greater than50%.
Alpha Spillover too High210Po generally gives a spillover of ≤ 3% with the discriminators setup properly. Thisresult is not attainable with other nuclides like 241Am, 239Pu, etc. The reason is thatspillover is only one component that will be seen in the spillover channel.
The Tennelec Series 5 and all gas flow proportional counters (GFPC) report gross re-sults. spillover correction should only be used to correct for the spill of alphas that arecounted as betas and vice versa when using the alpha/beta (also called simultaneous)mode. This is accomplished by performing spill calibrations with 210Po alpha and apure beta emitter like 90Sr/90Y.
It is not valid to correct for spillover from daughter products that appear due to naturaldecay processes in a gross alpha/beta measurement. For example, let’s say that we arecounting Uranium 238.
Unless the 238U has been recently separated, there will be substantial contribution from234Th (Beta Emitter), 234U (Alpha Emitter), and so on through the Uranium decaychain. In the past, many people have tried to counteract these phenomena by perform-ing spillover correction. First, let’s define some terms.
213
Efficiency/Spillover Problems
Crosstalk is the contribution of additional counts from a source other than theintended source. Crosstalk is most significant when using a multi-detector systemlike the Tennelec LB4100-W. An example of crosstalk would be the contribution indetector one from a source located under detector two.
Spillover (or spill) has in the past been mislabeled crosstalk. It is the counts that aremiscounted as another type of emission due to incomplete energy deposition,sample self absorption, etc.
Secondary Emissions have also been erroneously labeled as crosstalk. Secondaryemissions can also be characterized as non-principal or minor emissions. 241Am isregarded as an alpha emitter because of its principal emissions of 5.4 MeV Alphas.It also includes a 59.5 KeV gamma that is reported in a GFPC as beta. The result is~25% (α to β) secondary emissions contribution in the beta channel.
Daughter Contribution has also been called crosstalk. It is due to natural decayprocesses that sometimes cause unexpected results.
The short-coming of the “spillover correction” method is that it over-simplifies nature.The correct terminology when using a GFPC is:
Twenty µciL of Alpha based on a 238U calibration (correct)
not 20µciL of 238U (incorrect)
The GFPC was never designed to perform radio-nuclide identification. It is a gross al-pha/beta counter, not a spectrometer. The problem is the poor resolution of the GasFlow detector. Although some emissions (like the Electron Capture of Fe55) givegood resolution, most cannot be distinguished from other radio-nuclides. The GFPC isdesigned for, and is very proficient at identifying the quantity of emissions from agiven radioactive source.
Count Timer Not IncrementingThe count timer not incrementing is usually caused by 100% dead time. Check theguard count rate (or the guard count LED on the amplifier. If it is glowing continu-ously, this is the problem. It can be caused by:
• Hardware Failure
• Moisture in the Gas
• Guard Threshold at zero
214
Troubleshooting
Data ReproducibilityThere is uncertainty associated with any measurement. However, the Series 5 shouldbe able to reproduce the results from a given standard consistently. If efficiency mea-surements are not reproducible from one measurement to the next, check the follow-ing:
1. Is the same standard being counted, or are there several standards that arebeing interchanged? Try using the same standard all the time to see if theproblem improves.
2. Does the problem appear when multiple counts are performed? If not, it maybe a geometry reproducibility problem. Try making a small orientation markon the standard so it is always inserted in the same direction.
3. Has the spillover increased or decreased substantially?
4. Has the background count rate increased or decreased substantially?
5. Has the system been re-calibrated (Plateau and ROI) since a gas bottlechange?
Report Generation ProblemsEclipse includes several reports pre-configured. If there is a problem viewing or print-ing a report, it could be caused by one of the following:
1. No printer driver selected in Windows.
2. No background in the database matching the geometry of the procedureselected which uses background subtraction.
3. No efficiency in the database matching the geometry of the procedureselected which uses efficiency correction.
4. Trying to Automatically print the report of an application that needs samplespecific information entered.
Software Error MessagesThis section covers common software errors.
215
Data Reproducibility
Database Error MessagesError Message: The eclipse database - eclipse.mdb - could not be located.
Cause: The database has been moved from the previous time Eclipse wasrun.
The database is read-only.
Solution: Use the provided open-file dialog box to open the database.
Use the Eclipse database properties sheet to un-check the read-onlyattribute.
Error Message: There are currently no valid devices on-line, try back when thereare devices on-line.
Cause: A gas-con LB could not be found.
Solution: Make sure the device in the database is correct.
Make sure the device and host are communicating.
Divide by Zero ErrorsError Message: An attempt to divide by zero has occurred. The error occurred in
the function CountRate.
Cause: This error is very unlikely. The culprit would be the firmware giv-ing a live time of zero.
Solution: None.
Error Message: An attempt to divide by zero has occurred. The error occurred inthe function NetCountRate.
Cause: The live time for the currently counting sample is zero. (Very un-likely.)
The background used to perform the background subtraction iszero. (Likely)
Solution: The background chosen by the user did not have the correct param-eters for the current sample. Check the database to make sure theregions, geometry and detector match the current sample.
The live time for the chosen background is zero in the database.
Error Message: An attempt to divide by zero has occurred. The error occurred inthe function Efficiency.
216
Troubleshooting
Cause: The activity of the standard is zero.
Solution: The incorrect standard was selected, that is, an alpha standard isused for a beta standard and visa-versa.
The database does not contain any standards.
Error Message: An attempt to divide by zero has occurred. The error occurred inthe function Spillover.
Cause: The user is trying to perform a single point efficiency calibrationand no counts have been detected.
Solution: Make sure there is a calibration source being counted.
Error Message: An attempt to divide by zero has occurred. The error occurred inthe function Activity.
Cause: The efficiency is zero.
Solution: The efficiency chosen by the user did not have the correct parame-ters for the current sample. Check the database to make sure the re-gions, geometry and detector match the current sample.
Error Message: An attempt to divide by zero has occurred. The error occurred inthe function Cd2.
Cause: The half-life is zero.
Solution: There is no half-life in the nuclide database for the selected nuclide.
Memory ErrorsError Message: Enough memory to perform a calculation could not be found. The
error occurred in the function Singular Value Decomposition.
Cause: Out of memory.
Solution: Shut down other applications that might be running.
Buy more RAM.
Error Message: Enough memory to perform a calculation could not be found. Theerror occurred in the function nVector Allocation.
Cause: Out of memory.
Solution: Shut down other applications that might be running.
Buy more RAM.
217
Software Error Messages
Error Message: Enough memory to perform a calculation could not be found. Theerror occurred in the function dMatrix Allocation.
Cause: Out of memory.
Solution: Shut down other applications that might be running.
Buy more RAM.
Plateau Error MessagesError Message: The selected device could not be found in the list of available de-
vices.
Cause: The device hasn’t been registered in the database.
Solution: Run the device registration utility.
Make sure the device in the database is correct, e.g., the device inthe database can be address 1 when in fact it is at address 0.
Error Message: There is more than one current detector for the specified device;can’t initialize.
Cause: The database contains two detectors for a single LB5100 device.
Solution: Remove one of the detectors from the database.
Assign the second detector to the correct device.
Error Message: There is no current plateau for this detector.
Cause: A plateau for the necessary count mode hasn’t been run.
The latest plateau is not marked as “Is Current” in the database.
Solution: Run a plateau for desired count mode.
It is possible to mark the record “Is Current” but this isn’t desirable.
Error Message: There are more than one current plateau for the specified detector.
Cause: There is more than one plateau record marked “current” for a givencount mode.
Solution: It is possible to make one of the records that is marked “Is Current”not current.
218
Troubleshooting
A. References
1. Knoll, G.F., Radiation Detection and Measurement, Second Edition, JohnWiley & Sons, 1989.
2. Tsoulfanidis, N., Measurement and Detection of Radiation, MacGraw HillPublishing, 1983.
3. Parker, S.P., Nuclear and Particle Physics Source Book, MacGraw HillPublishing, 1987
219
B. Glossary of Terms
Absorbers(USAEC) Any material that absorbs or diminishes the intensity of ionizing radiation.Neutron absorbers, like boron, hafnium and cadmium are used in control rods for reac-tors. Concrete and steel absorbs gamma rays and neutrons in reactor shields. A thinsheet of paper or metal will absorb or attenuate alpha particles and all except the mostenergetic particles.
AbsorptionThe process by which radiation imparts some or all of its energy to any material
through which it passes.
Absorption Curve(ANSI N1.1-1976) A plot of an absorption radiation quantity (for example, energyflux density) as a function of the distance traversed in an absorber.
Abundance, Isotopic(ANSI N1.1-1976) The relative number of atoms of a particular isotope in a mixture ofthe isotopes of an element, expressed as a fraction of all the atoms of the element.
Abundance, Natural(ANSI N1.1-1976) Of a specified isotope of an element, the isotopic abundance in theelement as found in nature.
Accredited Testing Laboratory(ANSI N42.17A-1989) A testing laboratory that has been accredited by an authorita-tive body with respect to its qualifications to perform verification tests on the type ofinstruments covered by this standard.
Accuracy(ANSI N42.13-1978) The accuracy, usually described in terms of overall uncertainty,is the estimate of the overall possible deviation from the “true” value. As used in thisstandard, the overall uncertainty is a total of the estimated errors plus the random errorof the measurement.
Actinides(HPJ 60-1991) The series of elements beginning with actinium, element number 89,and continuing through lawrencium element number 103, which together occupy oneposition in the periodic table. The series includes uranium, element number 92, and allman-made transuranic elements.
220
Glossary of Terms
Actinium Series(USAEC) The series of nuclides resulting from the radioactive decay of Uranium-235.Many man made nuclides decay into this sequence. The end product of this sequenceif lead-207.
ActiveDescribes the window or icon to which the next keystroke or command will apply. If awindow is active, its title bar changes color to differentiate it visually from other openwindows. If an icon is active, the Control menu appears.
ActivityThe number of nuclear transformations occurring in a given material per unit time.
Activity Concentration(ANSI N13.14-1983) The quantity of radioactivity per unit volume or mass of a sub-stance.
Activity Intake By Inhalation(Ia) (ICRP 32-1981) “Activity intake” by inhalation is the inhaled activity of a radio-nuclide during a definite period of time.
Air Changes Per Hour (ACH)(ENV RAD-1987) The number of air changes per hour in a building.
Air Dose(NCRP 45-1975) (NCRP 94-1987) Absorbed dose in air is the quotient of the meanenergy imparted by ionizing radiation to a volume element of air divided by the massof air in that volume element. Air dose is expressed in rads. The air doses consideredin these reports are essentially constant over distances that are large compared to theranges of the charged particles producing the doses. Thus, the air dose is also a mea-sure of the indirectly ionizing radiation field (primarily photon radiation) generatingthese charged particles.
Airborne Radioactivity(ANSI N42.17B-1989) Radioactivity in any chemical or physical form that is dis-solved, mixed, suspended or otherwise entrained in air.
ALARA(NCRP 93-1987) A system of dose limitation based on keeping exposures, “as low asreasonably achievable,” economic and social factors being taken into account.
Aliquot(HPJ 60-1991) A divisor that divides a sample into a number of equal parts, leaving aremainder; a sample resulting from such a divisor.
221
Alpha ParticleA charged particle emitted from the nucleus of an atom. An alpha particle has a massand charge equivalent to that of an ionized helium nucleus, consisting of two protonsand two neutrons, with a double positive charge.
Ambient Background(ANSI N42.12-1980) Those counts that can be observed, and thereby allowed for, bymeasuring a source that is identical to the unknown source in all respects except forthe absence of radioactivity. These counts are attributable to environmental radioactiv-ity in the detector itself, the detector shielding material, and the sample container; cos-mic, electronic noise pulses, and so forth.
AmplificationAs related to radiation detection instruments, the process (gas, electronic or both) bywhich ionization effects are magnified to a degree suitable for their measurement.
Amplifier, LinearA pulse amplifier in which the output pulse is proportional to an input pulse height fora given pulse shape up to the point at which the amplifier overloads.
Analysis, Isotope Dilution(RHH-1970) A method of chemical analysis for a component of a mixture, based onthe addition to the mixture of a known amount of labeled component of known spe-cific activity, followed by isolation of a quantity of the component and measurementof the specific activity of that sample.
Analyte(ANSI N13.30-1989D) The particular radio-nuclide to be determined in a sample ofinterest.
Annihilation(RHH-1970) (ANSI N1.1-1976) An interaction between a positive and a negative elec-tron on which they both disappear; their energy, including rest energy, being con-verted into electromagnetic radiation (called annihilation radiation).
Annual Limit on Intake (ALI)(NCRP 91-1987) The activity of a radio-nuclide that, taken into the body during theyear, would provide a committed effective dose equivalent to a person, represented byReference Man, equal to the annual occupational effective dose equivalent limit (HEL)or in some cases, the organ dose equivalent limit (nonstochastic effect). The ALI isnormally expressed in becquerels (Bq) or curies.
AnodePositive electrode; electrode to which negative ions and electrons are attracted.
222
Glossary of Terms
ANSI(RAH-1988) American National Standards Institute.
ApplicationA program in Windows used for a particular kind of work. For the Low-BackgroundSystem, an application is a sample counting and analysis protocol.
Aqueous Tritium(NCRP 62-1979) The tritium associated with water molecules.
Area (Workplace) Monitoring(ICRU 43-1988) Monitoring intended to provide information about the radiation envi-ronment and about radiation conditions associated with the operations that are per-formed. Area monitoring also includes measurements made in the environment of theinstallation. The results of workplace monitoring are mainly used for categorizing andpredicting radiation exposures. The objective of area monitoring is to establish that op-erational conditions are satisfactory; it is of only limited value in the estimation ofdose equivalent to individuals.
Assay(ANSI N42.12-1980) The determination of the activity of a radio-nuclide in a sample.
AtomSmallest particle of an element that is capable of entering into a chemical reaction.
Atomic MassThe mass of a neutral atom of a nuclide, usually expressed in “atomic mass units.” The“atomic mass unit” is one-twelfth the mass of an atom of 12C; equivalent to 1.6604 x10⁻²⁴ gram.
Atomic NumberThe number of orbital electrons surrounding the nucleus of a neutral atom and accord-ing to present theory the number of protons in the nucleus (Symbol: Z).
Atomic Weight(USAEC) The mass of an atom relative to other atoms. The present-day basis of thescale of atomic weight is carbon; the most common isotope of this element has arbi-trarily been assigned an atomic weight of 12. The unit of the scale is 1/12 the weightof the carbon-12 atom or roughly the mass of one proton or one neutron. The atomicweight of any element is approximately equal to the total number of protons and neu-trons in its nucleus.
223
AttenuationThe process by which radiation is reduced in intensity when passing through some ma-terial. It is the combination of absorption and scattering processes and leads to a de-crease in flux density when projected through matter.
Attenuation FactorA measure of the opacity of a layer of material for radiation traversing it; the ratio ofthe incident intensity to the transmitted intensity. It is equal to Io/I, where Io and I arethe intensities of the incident and emergent radiation, respectively. In the usual senseof exponential absorption (I = Ioe
-mx) the attenuation factor is e-mx, where x is thethickness of the material, and m is the absorption coefficient.
AvalancheThe multiplicative process in which a single charged particle, accelerated by a strongelectric field, produces additional charged particles through collision with neutral gasmolecules.
Background, detector or systemThe number of counts measured in an instrument when no sample is present. Thebackground counts or count rate can be subtracted from the total or gross counts mea-sured in a sample. The gross counts minus the background counts equals the netcounts from the sample only.
Background Radiation(NBS 73-1960) Radiation arising from radioactive material other than the one directlyunder consideration. Background radiation due to cosmic rays and natural radioactiv-ity is always present. There may also be background radiation due to the presence ofradioactive substances in other parts of the building, in the building material itself, andso forth.
Backscattering
The deflection of radiation by scattering processes through angles >90° with respect tothe original direction of motion.
Bequerel (Bq)(HPJ 60-1991) A unit of radioactivity equal to one radioactive disintegration per sec-ond.
Beta ParticleCharged particle emitted from the nucleus of an atom and having a mass and chargeequal in magnitude to those of the electron.
224
Glossary of Terms
Bias(HPJ 60-1991) A systematic error inherent in a method of caused by some artifact oridiosyncrasy of the measurement system. Temperature effects and extraction ineffi-ciencies are examples of this first kind. Blanks, contamination, mechanical losses, andcalibration errors are examples of the latter kinds. Bias can be both positive and nega-tive, and several kinds can exist concurrently, so net bias is all can be evaluated, ex-cept under special conditions.
Bioaccumulation Factor (BF)(NCRP 76-1984) The ratio of a radio-nuclide concentration in an organism or tissue tothat in water or food products.
Bioassay(USAS N13.2-1969) Analysis of biological material to determine the presence andquantities of internally deposited radio-nuclides.
Biological Half-Life (Tb)(NCRP 87-1987) (HPJ 60-1991) The time required for a biological system, such as aperson, to eliminate by natural process, other than radioactive decay, one-half of theamount of a substance, such as a radio-nuclide that has entered it.
Blind Sample(HPJ 60-1991) A sample submitted for analysis whose composition is known to thesubmitter but unknown to the analyst. A blind sample is one way to test proficiency ofa measurement process.
Body Burden, Maximum Permissible(ANSI N1.1-1976) The body burden of a radio-nuclide which, if maintained at a con-stant level, would produce the maximum permissible dose equivalent in the critical or-gan.
Branching Ratio(ANSI N1.1-1976) The ratio of the branching fractions for two specified modes of dis-integration.
Breathing Zone(ANSI N13.1-1969) The breathing zone is identified as that region adjacent to aworker’s mouth and nostrils from which air is drawing into the lungs while he per-forms his assigned work. Air taken from this region will truly represent the air theworker is breathing while he works, whether standing, sitting or moving.
225
Bremsstrahlung(AEC) Electromagnetic radiation emitted from (as photons) when a fast-movingcharged particle (usually an electron) loses energy upon being accelerated and de-flected by an electric field surrounding a positively charged nucleus. X rays producedin ordinary X-ray machines are bremsstrahlung (in German, the term means “brakingradiation.”).
Calibrate(ANSI N42.17A-1989) (ANSI N42.17B-1989) (ANSI N42.17C-1989) To adjust ordetermine or both: (1) the response or reading of an instrument relative to a series ofconventionally true value; or (2) the strength of a radiation source relative to a stan-dard or conventionally true value.
Capture, Electron(RHH-1970) A mode of radioactive decay involving the capture of an orbital electronby its nucleus. Capture from a particular electron shell is designated as “K-electroncapture,” “L-electron capture,” etc..
Carrier(RHH-1970) (Beir III-1980) Nonradioactive or nonlabeled material of the same chem-ical composition as its corresponding radioactive or labeled material, so as to form achemically inseparable mixture, the carrier permits chemical (and some physical) ma-nipulations of the mixture with less loss of label or radioactivity than would be possi-ble in the use of undiluted label or radioactive material.
Carrier, Hold-Back(RHH-1970) The inactive isotope or isotopes of a radioactive element, or an elementof similar properties or some reagent that may be used to diminish the amount of theradio-nuclide coprecipitated or absorbed in a chemical reaction.
CascadeA way of arranging open windows on the desktop so that they overlap each other, withthe title bar of each window remaining visible.
Cascading MenuA menu that opens from a command on another menu.
CathodeNegative electrode; electrode to which positive ions are attracted.
Chamber, Ionization(RHH-1970) (BEIR III-1980) An instrument designed to measure quantity of ionizingradiation in terms of electric charge associated with ions produced within a definedvolume.
226
Glossary of Terms
Charged Particle(NCRP 51-1977) An atomic or subatomic quantity of matter (for example, electron,proton, alpha particle, and ionized atom) possessing or lacking a net electrical chargeof one or more alimentary units of charge.
Check Source(ANSI N42.14-1978) (ANSI N323-1978) (ANSI N320-1979) (ANSI N42.12-1980)(ANSI N42.15-1980) A radioactive source, not necessarily calibrated, which is used toconfirm the continuing satisfactory operation of an instrument.
Check BoxA small square box that appears in a dialog box and that can be selected or cleared.When the check box is selected, an X appears in the box. A check box represents anoption that you can set.
Circuit, AnticoincidenceA circuit with two inputs which delivers an output pulse if one input terminal receivesa pulse, but delivers no output pulse; if pulses are received by both input terminalswithin an assigned time interval.
ClickTo press and release a mouse button quickly.
CloseTo remove a document window or application window from the desktop. You canchoose to save or abandon the document in a document window before you close theapplication.
CoincidenceThe occurrence of counts in two of more detectors simultaneously or within an as-signed time interval.
Contamination, RadioactiveDeposition of radioactive material in any place where it is not desired, particularlywhere its presence may be harmful.
Control MenuThe menu appearing on every application that runs in a window and on some non-Windows applications. Icons, some dialog boxes, and windows within an applicationworkspace also have Control menus. For applications running in a Window and foricons and dialog boxes, Control-menu commands move, change the size of, and closewindows. For non-Windows applications, the Control-menu commands transfer infor-mation and perform other miscellaneous functions. Also known as System menu.
227
Control-Menu BoxThe icon that opens the Control menu for the window. It is always at the left of the ti-tle bar.
Controlled Area(ANSI N43.1-1978) Any area to which access is controlled for purposes of radiationprotection.
Cosmic Radiation(ICRP 39-1983) Natural sources of radiation can be grouped in three types accordingto origin: Cosmic radiation, from the sun and from outer space, varies with altitudeand latitude; Cosmogenic radio-nuclides (mainly caron-14), produced through interac-tion of cosmic rays with atoms in the atmosphere; and Primordial radio-nuclides,which have existed in the earth’s crust throughout history (for example, potassium-49and nuclides in the uranium and thorium decay series).
Cosmic RaysHigh-energy particulates and electromagnetic radiation that originates outside theearth’s atmosphere.
Cosmogenic Radionuclides(ICRP 39-1983) Natural sources of radiation can be grouped in three types accordingto origin: Cosmic radiation, from the sun and from outer space, varies with altitudeand latitude; Cosmogenic radio-nuclides (mainly carbon-14), produced through inter-action of cosmic rays with atoms in the atmosphere; and Primordial radio-nuclides,which have existed in the earth’s crust throughout history (for example, potassium-49and nuclides in the uranium and thorium decay series).
CoulombUnit of electrical charge in the practical system of units. A quantity of electricity equalto 3 x 10⁹ electrostatic units of charge.
Count, (Radiation Measurement)The external indication of a device designed to enumerate ionizing events.
Counter, Gas FlowA device in which an appropriate atmosphere is maintained in the counter tube by al-lowing a suitable gas to flow slowly through the sensitive volume.
Counter, ProportionalGas-filled radiation detection device; the pulse produced is proportional to the numberof ions formed in the gas by the primary ionizing particle.
228
Glossary of Terms
Counter, Scillation(RHH-1970) The combination of a phosphor, photmultiplier tube, and associated cir-cuits for counting light emissions produced in the phosphors.
Counting, Coincidence(RHH-1970) A technique in which particular types of events are distinguished frombackground events by coincidence circuits which register coincidence caused by thetype of events under consideration,
Counting Channel(ANSI N42.15-1980) A region of the pulse-height spectrum that is defined by upperand lower boundaries set by discriminators.
Counting Efficiency(ANSI N42.15-1980) The ratio of the count rate to the disintegration rate, usually ex-pressed as a percentage; where, E = counting system efficiency; R = the net count ratein an individual measurement, counts per minute, and A = activity of the radio-nuclidein the check source, disintegration per minute.
Curie(HPJ 60-1991) The quantity of radioactive nuclides disintegrating at the rate of 3.7 x10¹⁰ atoms per second (abbreviated Ci). Several fractions of the curie are in commonusage.
Millicurie: One thousandth of a curie (3.7 x 10⁷ disintegration per second),abbreviated mCi.
Microcurie: One millionth of a curie (3.7 x 10⁴ disintegration per second),abbreviated µCi.
Nanocurie: One billionth of a curie (3.7 a 101 disintegration per second),abbreviated nCi.
Picocurie: One millionth of a microcurie (3.7 x 10² disintegration per second or2.22 disintegration per minute), abbreviated pCi.
Femtocurie: One billionth of a microcurie (3.7 x 10⁻⁵ disintegration persecond), abbreviated fCi.
Attocurie: One millionth of a picocurie (3.7 x 10⁻⁸ disintegration per second),abbreviated aCi.
229
CrosstalkThe number of erroneous counts in a counting channel (alpha or beta) in systemswith multiple detectors. This effect is usually small unless there is electronic pickup between detector pulse-processing chains or in cases where inadequate shieldingallows charged particle or other ionizing radiation to be scattered into another de-tector.
Daughter Products(HPJ 60-1991) Isotopes that are formed by the radioactive decay of some other iso-tope. In the case of 226Ra, for example, there are 10 successive daughter products, end-ing in the stable isotope 206Pb.
Data FileAny file created within an application: a word processing document, a spreadsheet, adatabase file, a chart, and so forth. Also known as document.
Dead Time (td)(ANSI N42.12-1980) The time after triggering a pulse during which the system is un-able to retrigger.
Decay, Radioactive(ANSI N1.1-1976) A spontaneous nuclear transformation in which particles or gammaradiation of x radiation is emitted following orbital electron capture or the nucleus un-dergoes spontaneous fission.
Decay Chain or Decay Series(BEIR IV-1988) A sequence of radioactive decays of the same nucleus. An initial nu-cleus, the parent, decays into a daughter nucleus that differs from the first by whateverparticles were emitted during the decay. If further decays take place, the subsequentnuclei are also called daughters. Sometimes to distinguish the sequence, the daughterof the first daughter is called the granddaughter, etc.; ordinarily, this quickly becomestoo complicated.
Decay Constants(ICRU 33—1980) The decay constant of a radio-nuclide in a particular energy state isthe quotient dP by dt, where dP is the probability of a given nucleus undergoing aspontaneous nuclear transition from that energy state in the time interval dt.
Decay Curve(RHH-1970)(HPJ 60-1991) A curve showing the relative amount of radioactive sub-stance remaining after any time interval.
230
Glossary of Terms
Decay Product(HPJ 60-1991) A nuclide resulting from the radioactive disintegration of a radio-nuclide, being formed either directly or as a result of successive transformation in a ra-dioactive series. A decay product can be either radioactive or stable.
Default ButtonThe command button in some dialog boxes selected as the most logical or safestchoice. This button has a bold border when the dialog box appears, and pressingENTER chooses the button.
Decay, ConstantThe fraction of the number of atoms of a radioactive nuclide which decay in unit time(see disintegration constant).
Derived Air Concentration (DAC)(ICRP 30-1978) (NCRP 87-1987) (HPJ 60-1991) Equals the ALI of a radio-nuclidedivided by the volume of air inhaled by Reference Man in a working year (for exam-ple, 2.4 x 10³ m3). The unit of DAC is Bq m3.
Detection Limit(ANSI N42.17a-1989) (ANSI N42.17B-1989) (ANSI N42.17B-1989) (ANSIN42.17C-1989) The extreme of quantification for the radiation of interest by the in-strument as a whole or an individual readout scale or decade. The lower detection limitis the minimum quantifiable instrument response or reading. The upper detection limitis the maximum quantifiable instrument response or reading. Quantifiable, in this case,means with the specified accuracy.
Detector, RadiationAn instrument used to determine the presence of, and sometimes the amount, of radia-tion.
Dialog BoxA rectangular box that either requests or provides information. Many dialog boxespresent options to choose among before Windows can carry out a command. Some di-alog boxes present warnings or explain why a command cannot be completed.
DirectoryA collection of files and subdirectories that are stored at the same location on a disk.The name of the directory identifies its location. Part of the structure for organizingyour files on a disk. See also subdirectory.
DiscriminatorAn electronic circuit that outputs a logic pulse if the amplitude of the input pulse ex-ceeds some assigned threshold.
231
Disintegration, ConstantThe fraction of the number of atoms of a radioactive nuclide which decay in unit time;in the equation N = Noe
-gt, where No is the initial number of atoms present and N is thenumber of atoms present after some time, t.
Disintegration, NuclearA spontaneous nuclear transformation (radioactivity) characterized by the emission ofenergy and/or mass from the nucleus. When numbers of nuclei are involved, the pro-cess is characterized by a definite half-life.
Double-ClickTo rapidly press and release a mouse button twice without moving the mouse. Double-clicking carries out an action, such as opening an icon.
Efficiency (Counter or Detector)A ratio of the number of counts recorded relative to the number of nuclear transforma-tions occurring. The specific definition varies depending upon the factors included inthe ratio, such as geometry, window transmission, sensitive volume, and energy de-pendence.
Efficiency, Intrinsic (counters)(ANSIN1.1-1976) A measure of the probability that a count will be recorded when aparticle or photon of ionizing radiation is incident on a detector.
Electron
(ANSI N1.1-1976) A stable elementary particle having an electric charge equal to ±1.60219 x 10⁻¹⁹ C. and a rest mass equal to 9.1095 x 10⁻³¹ kg. When used without spec-ification the term means the negatively charged electron, which is also called a nega-tron or negaton. Its antiparticle, the positively charged electron, is called the positronor positon.
ElementPure substance consisting of atoms of the same atomic number that cannot be decom-posed by ordinary chemical means.
Energy Calibration(ANSI N42.12-1980) The relationship between the height of the amplifier output pulseand the energy of the photon originating in the radioactive source.
Energy, IonizingThe average energy lost by ionizing radiation in producing an ion pair in a gas. For airit is about 33 eV.
232
Glossary of Terms
Error, Statistical(RHH-1970) (HPJ 60-1991) Errors in counting due to the random time-distributions ofdisintegration.
ExcitationThe addition of energy to a system, thereby transferring it from its ground state to anexcited state. Excitation of a nucleus, an atom or a molecule can result from absorptionof photons or from inelastic collisions with other particles.
FileA document or application that has been given a name. All documents are stored asfiles in Windows.
Fission Product(NCRP 75-1983) (NCRP 81-1985) Any radio-nuclide or stable nuclide resulting fromnuclear fission, including both primary fission fragments and their decay products.
FocusThe currently selected Windows document.
Gamma Radiation(ENV RAD-1987) A ray of energy in contrast to beta and alpha particles’ radiation.The properties are similar to those of X-rays and other electromagnetic waves. Gammaradiation is highly penetrating but relatively low in ionizing potential.
Gamma RayShort wavelength electromagnetic radiation of nuclear origin with a range of wave-lengths from about 10-8 to 10-11 cm, emitted from the nucleus.
Gas Amplification(RHH-1970) As applied to gas ionization radiation detecting instruments, the ratio ofthe charge collected to the charge produced by the initial ionizing event.
Geiger-Mueller (G-M Counter)(NCRP 65-1980) A radiation detection and measuring instrument. It consists of a gas-filled (Geiger-Mueller) tube containing electrodes, between which there is an electricalvoltage but no current flowing. When ionizing radiation passes through the tube, ashort intense pulse of current passes from the negative electrode to the positive elec-trode, and is measured or counted. The number of pulses per second measures the in-tensity of radiation. It is also often known as a Geiger counter; it was named for HansGeiger and W. Mueller who invented it in the 1920’s.
233
Geiger Region(RHH-1970) In an ionization radiation detector, the operating voltage interval inwhich the charge collected per ionizing event, is essentially independent of the numberof primary ions produced in the initial ionizing event.
Geometry (good, bad)(ANSI N1.1-1976) A term used colloquially to signify the arrangement in space of thevarious components in an experiment, as in, for example, plane geometry, or 2 p ge-ometry. In beam0attenuation measurements, good geometry means that a materialwhose cross section is to be measured is interposed between source and detector sothat scattering as well as absorption in the material reduces the detection rate. Withbad-geometry, there may be scattering of the beam into the detector volume as well asaway from it.
Germanium(HPJ 60-1991) Symbol Ge. Element with atomic number 32. It is a semiconductor andused as the sensitive element in some g-ray detectors.
Guard DetectorA detector used in anti-coincidence counting to reject events from cosmic rays. Whenan event occurs in both the sample and guard detector within an assigned time interval,the count is not added to the channel accumulating the data.
Ground StateThe state of a nucleus, atom or molecule at its lowest energy. All other states are “ex-cited.”
Half-Life, RadioactiveTime required for a radioactive substance to lose 50% of its activity by decay. Each ra-dio-nuclide has a unique half-life.
Half-Value Layer (Half Thickness)The thickness of any particular material necessary to reduce the intensity of a radiationbeam to one-half its original value.
IconA graphical representation of various elements in Windows, such as disk drives, appli-cations, and documents.
In Growth, Radioactive(HPJ 60-1991) Increase in number of daughter atoms present as a result of radioactivedecay of the parent.
234
Glossary of Terms
Indirect Bioassay(ANSI N13.30-1989D) Measurements to determine the presence of or to estimate theamount of radioactive material in the excreta of other biological materials removedfrom the body. (Synonymous with in-vitro measurement.)
Instrument(ANSI N42.17A-1989) (ANSI N42.17B-1989) (ANSI N42.17C-1989) A completesystem designed to quantify one or more characteristics of ionizing radiation or radio-active material.
Internal Conversion(RHH-1970) One of the possible mechanisms of decay from the meta-stable state (iso-metric transition) in which transition energy is transferred to an orbital electron, caus-ing its ejection from the atom. The ratio of the number of internal conversion electronsto the number of gamma quanta emitted in the de-excitation of the nucleus is calledthe “conversion ratio.”
Inverse Square Relation(NCRP 51-1977) That rule which states that the intensity of radiation from a pointsource decreases as 1/d2 from the source in a non-absorbing medium, where d is thedistance from the source.
Ion Exchange(RHH-1970) (BEIR III-1980) A chemical process involving reversible interchange ofions between a solution and a particular solid material. Such as an ion exchange resinconsisting of a matrix of insoluble material interspersed with fixed ions of a charge op-posite to that in solution.
Ion PairTwo particles of opposite charge, usually referring to the electron and positive atomicor molecular residue resulting after the interaction of ionizing radiation with the orbitalelectrons of atoms.
IonizationThe process by which a neutral atom or molecule acquires a net positive or negativecharge.
Ionization Chamber(NCRP 65-1980) (HPJ 60-1991) An instrument that detects and measures ionizing ra-diation by measuring the electrical current that flows when radiation ionized gas in achamber, making the gas a conductor of electricity.
235
Ionizing Radiation(BEIR V-1990) Radiation sufficiently energetic to dislodge electrons from an atom.Ionizing radiation includes x and gamma radiation, electrons (beta radiation), alphaparticles (helium nuclei), and heavier charge atomic nuclei. Neutrons ionize indirectlyby colliding with atomic nuclei.
Ionization, TotalThe total electric charge of one sign on the ions produced by radiation in the processof losing all of its kinetic energy. For a given gas, the total ionization is closely pro-portional to the initial ionization and is nearly independent of the nature of the ioniz-ing radiation. It is frequently used as a measure of radiation energy.
Ionization DensityNumber of ion pairs per unit density.
Ionization Path (Track)The trail of ion pairs produced by an ionizing radiation in its passage through matter.
IsobarOne of two or more different nuclides having the same mass number but differing inatomic number.
IsomerOne of several nuclides having the same number of neutrons and protons but capableof existing, for a measurable time, in different quantum states with different energiesand radioactive properties. Commonly, the isomer of higher energy decays to one withlower energy by the process of isomeric transition.
Isotope, StableA non-radioactive isotope of an element.
IsotopeOne of several nuclides having the same number of protons in their nuclei, and hencehaving the same atomic number, but differing in the number of neutrons, and thereforein the mass number. Almost identical chemical properties exist between isotopes of aparticular element. The use of this term as a synonym for nuclide is to be discouraged.
keVThe symbol for 1000 electron volts, or 103 eV.
Labeled Compound(RHH-1970) (BEIR III-1980) A compound consisting, in part, of labeled molecules;by observation of radioactivity or isotopic composition, this compound or its frag-ments may be followed through physical, chemical or biologic processes.
236
Glossary of Terms
Laboratory Standard(NCRP 97-1988) In this report, a 226Ra solution prepared from an NBS certified sourceand used to deliver a known amount of rate of production of 222Rn.
Licensed Materials(10CFR20-1987) Source material, special nuclear material. Or byproduct material re-ceived, possesses, used or transferred under a general or specific license issued by theCommission pursuant to the regulations in 10CFR20.
Liquid Scintillation Solution(ANSI N42.15-1980) A solution consisting of and organic solvent (or mixture of sol-vents) and one or more organic scintillator solutes.
List BoxWithin a dialog box, a box listing available choices — for example, the list of allavailable files in a directory. If all the choices will not fit, the list box has a verticalscroll bar.
Lower Limit of Detection(ANSI N13.30-1989D) The amount of analyte material that has a 95% chance of beingdetected when the decision that some amount of analyte is present is made when a sig-nal occurs at or above the decision level. It has the same meanings as minimum detect-able amount (MDA), which is preferred terminology for this standard.
Mass AttenuationSee Attenuation
Mass NumberThe number of nucleons (protons and neutrons) in the nucleus of an atom.
Maximize ButtonThe small box containing an Up arrow at the right of the title bar. Mouse users canclick the Maximize button to enlarge a window to its maximum size. Other users canuse the Maximize command on the Control menu.
MDAAn acronym for Minimum Detectable Activity. Although specific formulations vary,the MDA is a measure of the detection limit based on the statistical precision assignedby the operator.
MenuA list of items, most of which are Windows commands. Menu names appear in themenu bar near the top of the window. You use a command on a menu by selecting themenu name, then choosing the command.
237
Menu BarThe horizontal bar containing the names of all the application menus. It appears belowthe title bar.
MeVThe symbol for 1 million electron volts, or 106e V.
Minimize Button: The small box containing a Down arrow at the right of the title bar.Mouse users can click the Minimize button to shrink a window to an icon. Other userscan use the Minimize command on the Control menu.
Minimum Detectable Activity (MDA)See MDA
Monitor, Radiation(ANSI N1.1-1976) A radiation detector whose purpose is to measure the level of ion-izing radiation (or quantity of radioactive material) and possibly give warning when itexceeds a prescribed amount. It may also give quantitative information on dose ordose rate. The term is frequently prefaced with a word indicating the purpose of themonitor, such as: area monitor, air particulate monitor.
Nanocuire (nCi)(NCRP 65-1980) A one billionth (10-9) part of a Curie or 37 nuclear transformationper second.
Natural Thorium(ANSI N7.2-1963) Natural thorium is a mixture of two isotopes of element number90, Th-232 and Th-228. Both of these isotopes occurring in the thorium radioactive se-ries, Th-232 being the series parent and Th-228 its daughter by one a and two b trans-formations. Both isotopes are a emitters with respective half-lives of 1.39 z 1010 yearsand 1.91 years. The specific a activity of the mixture is 4.9 x 10² dpm per mg. The ap-proximate proportions by weight, in nature or at a time of separation, are approxi-mately seven billion parts of Th-232 to one part of Th-228. Thorium-228 fathers a lineof a, b and g emitted having short half-lives. In-growth of these daughters upon the3.64 day half-life of radium-224 (ThX) which is the first daughter of Th-228. Naturalthorium, therefore, is free from daughter radiation for only a brief period of time fol-lowing its separation.
238
Glossary of Terms
Natural (or Normal) Uranium(ANSI N7.2-1963) Naturally occurring uranium, atomic number 92, and atomicweight 238.07, is a mixture consisting of 99.28 percent U-238, 0.71 percent U-235,and 0.00580 percent U-234 (formed by the decay of U-238). All three isotopes are a-active with half-lives of 4.51 x 10⁹ y, 7.13 x 10⁸ y, and 2.48 x 10⁵ y, respectively. Nat-ural uranium has a specific a activity of 1502.0 ± 1.5 dpm per mg, of which 737.4 ±1.6 dpm (49.1 percent) is due to U-234, 27.2 ± 3.5 dpm (1.8 percent) is due to U-235,and 737.4 ± 1.6 dpm (49.1 percent) is due to U-238. The term “natural uranium” or thealternate term “normal uranium” as used in this standard may apply to the metal, themetallic alloys or to uranium compounds (oxides, carbides, and so forth).
Naturally Occurring(RRM-1987) Occurring naturally in the soil, not caused by industrial or other humanactivity.
NeutrinoA neutral particle of very small rest mass postulated to account for the continuous dis-tribution of energy among the particles in the beta-decay process and to allow for con-versation of momentum in beta decay.
NeutronElementary nuclear particle with a mass approximately the same as that of a hydrogenatom and electrically neutral; its mass is 1.008982 mass units. Neutrons are commonlydivided into sub-classifications according to their energies as follows: thermal, around0.025 eV; epithermal, 0.1 eV to 100 eV; slow, < 100 eV; intermediate, 102 to 103 eV;fast, > 0.1 MeV.
NucleonCommon name for a constituent particle of the nucleus; applied to protons and neu-trons, but will include any other particle found to exist in the nucleus.
Nucleus (Nuclear)That part of an atom in which the total positive electric charge and most of the massare concentrated.
NuclideA species of atom characterized by the constitution of its nucleus. The nuclear consti-tution is specified by the number of protons, Z, number of neutrons, N, and energycontent; or, alter-natively, by the atomic number Z, mass number A = (N + Z), andatomic mass. To be regarded as a distinct nuclide, the atom must be capable of existingfor a measurable time; thus nuclear isomers are separate nuclides, whereas promptlydecaying excited nuclear states are unstable intermediates in nuclear reactions are notso considered.
239
Optically Coupled(HPJ 60-1991) A process of matching the refractive index of optical media; the spacebetween the window of a scintillation detector and the window of a photomultipliertube coupled to the detector is filled with a transparent material such as high viscositysilicon fluid with a refractive index close to that of the two windows.
PlateauAs applied to radiation detector chambers, the level portion of the counting rate-voltage curve where changes in operating voltage introduce minimum changes in thecounting rate.
Plateau Slope, RelativeThe relative increase in the number of counts as function of voltage expressed in per-centage per 100 volts increase above the Geiger threshold.
PositronParticle equal in mass to the electron and having an equal but opposite charge.
Power, StoppingA measure of the effect of a substance upon the kinetic energy of a charged particlepassing through it.
Proportional RegionVoltage range in which the gas amplification is greater than one, and in which thecharge collected is proportional to the charge produced by the initial ionizing event.
ProtonElementary nuclear particle with a positive electric charge equal numerically to thecharge of the electron and with a mass of 1.007 277 mass units.
Reaction (Nuclear)An induced nuclear disintegration, that is, a process occurring when a nucleus comesinto contact with a photon, an elementary particle or another nucleus. In many casesthe reaction can be represented by the symbolic equation: X + a ® Y + b or, in abbre-viated form, X(a, b)Y, in which X is the target nucleus, a is the incident particle orphoton, b is an emitted particle or photon, and Y is the product nucleus.
Restore ButtonThe small box containing a Down arrow and an Up arrow at the right of the title bar.The Restore button appears after you have enlarged a window to its full size. Mouseusers can click the Restore button to return the window to its previous size. Other us-ers can use the Restore command on the Control menu.
240
Glossary of Terms
Root DirectoryThe highest directory of a disk. The root directory is created when you format the disk.From the root directory, you can create other directories.
ScatteringChange of direction of subatomic particle or photon as a result of a collision or inter-action.
Scroll BarsThe bars at the bottom and right edge of a window whose contents are not entirely vis-ible. Each scroll bar contains a small box, called a scroll box, and two scroll arrows toallow different types of scrolling.
ScrollTo move text or graphics up or down or left or right, in order to see parts of the filethat cannot fit on the screen.
SelectTo highlight an item by clicking it with the mouse or using key combinations. Se-lecting does not initiate an action. After selecting an item, you choose the action youwant to effect the item. See also choose and highlighted.
Selection CursorThe marking device that shows where you are in a window, menu or dialog box. Theselection cursor can appear as a highlight or as a dotted rectangle around the text in adialog box option.
Self-AbsorptionAbsorption of radiation (emitted by radioactive atoms) by the material in which the at-oms are located; in particular, the absorption of radiation within a sample being as-sayed.
Specific ActivityTotal activity of a given nuclide per gram of a compound, element or radioactive nu-clide.
SpilloverThe number of erroneous counts in a counting channel (alpha or beta) in systems capa-ble of simultaneous counting. Alpha-into- beta crosstalk occurs when the higher en-ergy alpha particle creates a smaller charge within the detector because of a non-uniform detector response. Beta-into-alpha crosstalk occurs when the beta particlebackscatters into the sensitive volume, creating a larger charge.
241
Spillover CorrectionA mathematical method for correcting crosstalk effects that have been calibrated.
Standard, RadioactiveA sample of radioactive material, usually with a long half-life, in which the numberand type of radioactive atoms at a definite reference date and time is known. It is usedas a radiation source for calibrating radiation measurement equipment.
Text BoxA box within a dialog box where you type information needed to carry out the chosencommand. The text box may be blank when the dialog box appears or may containtext.
Text FileA file containing only letters, digits, and symbols. A text file usually consists of char-acters coded from the ASCII character set.
TileA way of arranging open windows on the desktop so that no windows overlap but allwindows are visible. Each window takes up a portion of the screen.
Title BarThe horizontal bar located at the top of a window and containing the title of the win-dow. On many windows, the title bar also contains the Control-menu box and Maxi-mize and Minimize buttons.
Tritium(3H or T) The hydrogen isotope having one proton and two neutrons in the nucleus.
UnknownA term used for samples in which the activities of various analytes are unknown.
Wildcard CharacterA character that represents another character. In filenames, you can use the asterisk (*)as a wildcard character to indicate any character or group of characters that mightmatch that position in other filenames. For example, *.EXE represents all files that endwith the .EXE filename extension.
X RaysPenetrating electro-magnetic radiation having wavelengths shorter than those of visi-ble light. Bombarding a metallic target with fast electrons in a high vacuum usuallyproduces them. In nuclear reactions it is customary to refer to photons originating inthe nucleus as gamma rays and those originating in the extranuclear part of the atom asX rays.
242
Glossary of Terms
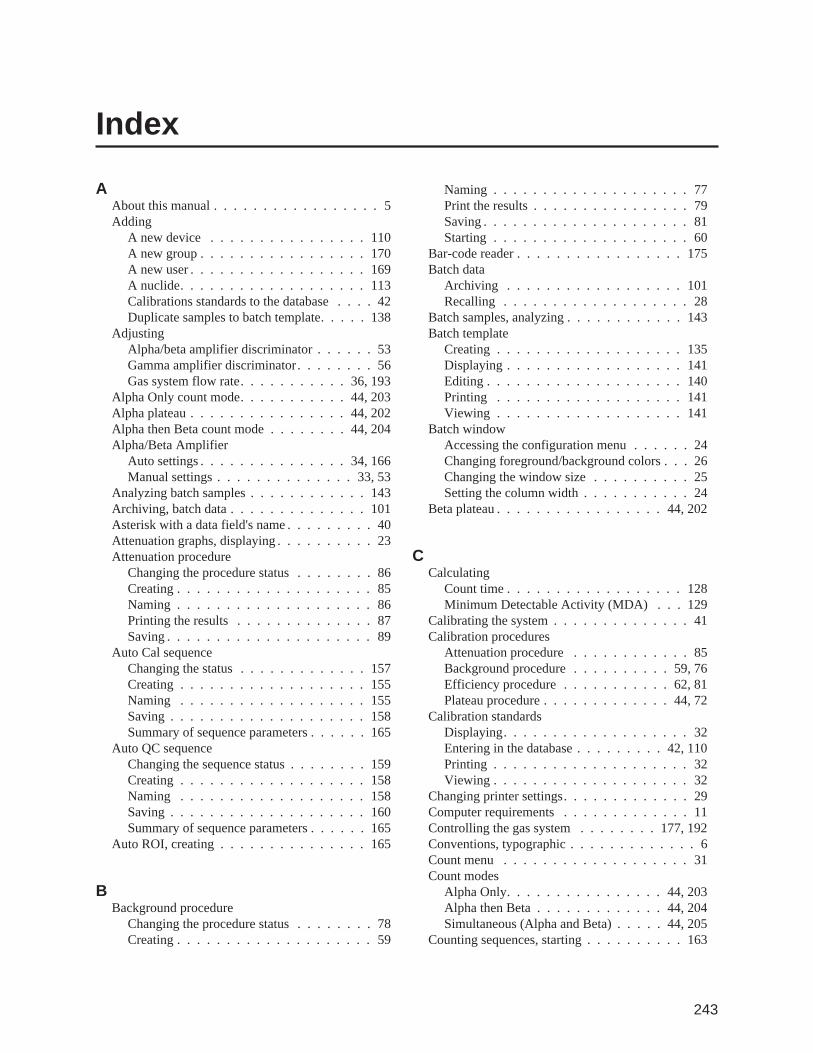
Index
AAbout this manual . . . . . . . . . . . . . . . . . 5Adding
A new device . . . . . . . . . . . . . . . . 110A new group . . . . . . . . . . . . . . . . . 170A new user . . . . . . . . . . . . . . . . . . 169A nuclide. . . . . . . . . . . . . . . . . . . 113Calibrations standards to the database . . . . 42Duplicate samples to batch template. . . . . 138
AdjustingAlpha/beta amplifier discriminator . . . . . . 53Gamma amplifier discriminator. . . . . . . . 56Gas system flow rate. . . . . . . . . . . 36, 193
Alpha Only count mode. . . . . . . . . . . 44, 203Alpha plateau . . . . . . . . . . . . . . . . 44, 202Alpha then Beta count mode . . . . . . . . 44, 204Alpha/Beta Amplifier
Auto settings . . . . . . . . . . . . . . . 34, 166Manual settings . . . . . . . . . . . . . . 33, 53
Analyzing batch samples . . . . . . . . . . . . 143Archiving, batch data . . . . . . . . . . . . . . 101Asterisk with a data field's name . . . . . . . . . 40Attenuation graphs, displaying . . . . . . . . . . 23Attenuation procedure
Changing the procedure status . . . . . . . . 86Creating . . . . . . . . . . . . . . . . . . . . 85Naming . . . . . . . . . . . . . . . . . . . . 86Printing the results . . . . . . . . . . . . . . 87Saving . . . . . . . . . . . . . . . . . . . . . 89
Auto Cal sequenceChanging the status . . . . . . . . . . . . . 157Creating . . . . . . . . . . . . . . . . . . . 155Naming . . . . . . . . . . . . . . . . . . . 155Saving . . . . . . . . . . . . . . . . . . . . 158Summary of sequence parameters . . . . . . 165
Auto QC sequenceChanging the sequence status . . . . . . . . 159Creating . . . . . . . . . . . . . . . . . . . 158Naming . . . . . . . . . . . . . . . . . . . 158Saving . . . . . . . . . . . . . . . . . . . . 160Summary of sequence parameters . . . . . . 165
Auto ROI, creating . . . . . . . . . . . . . . . 165
BBackground procedure
Changing the procedure status . . . . . . . . 78Creating . . . . . . . . . . . . . . . . . . . . 59
Naming . . . . . . . . . . . . . . . . . . . . 77Print the results . . . . . . . . . . . . . . . . 79Saving . . . . . . . . . . . . . . . . . . . . . 81Starting . . . . . . . . . . . . . . . . . . . . 60
Bar-code reader . . . . . . . . . . . . . . . . . 175Batch data
Archiving . . . . . . . . . . . . . . . . . . 101Recalling . . . . . . . . . . . . . . . . . . . 28
Batch samples, analyzing . . . . . . . . . . . . 143Batch template
Creating . . . . . . . . . . . . . . . . . . . 135Displaying . . . . . . . . . . . . . . . . . . 141Editing . . . . . . . . . . . . . . . . . . . . 140Printing . . . . . . . . . . . . . . . . . . . 141Viewing . . . . . . . . . . . . . . . . . . . 141
Batch windowAccessing the configuration menu . . . . . . 24Changing foreground/background colors . . . 26Changing the window size . . . . . . . . . . 25Setting the column width . . . . . . . . . . . 24
Beta plateau . . . . . . . . . . . . . . . . . 44, 202
CCalculating
Count time . . . . . . . . . . . . . . . . . . 128Minimum Detectable Activity (MDA) . . . 129
Calibrating the system . . . . . . . . . . . . . . 41Calibration procedures
Attenuation procedure . . . . . . . . . . . . 85Background procedure . . . . . . . . . . 59, 76Efficiency procedure . . . . . . . . . . . 62, 81Plateau procedure . . . . . . . . . . . . . 44, 72
Calibration standardsDisplaying. . . . . . . . . . . . . . . . . . . 32Entering in the database . . . . . . . . . 42, 110Printing . . . . . . . . . . . . . . . . . . . . 32Viewing . . . . . . . . . . . . . . . . . . . . 32
Changing printer settings. . . . . . . . . . . . . 29Computer requirements . . . . . . . . . . . . . 11Controlling the gas system . . . . . . . . 177, 192Conventions, typographic . . . . . . . . . . . . . 6Count menu . . . . . . . . . . . . . . . . . . . 31Count modes
Alpha Only. . . . . . . . . . . . . . . . 44, 203Alpha then Beta . . . . . . . . . . . . . 44, 204Simultaneous (Alpha and Beta) . . . . . 44, 205
Counting sequences, starting . . . . . . . . . . 163
243
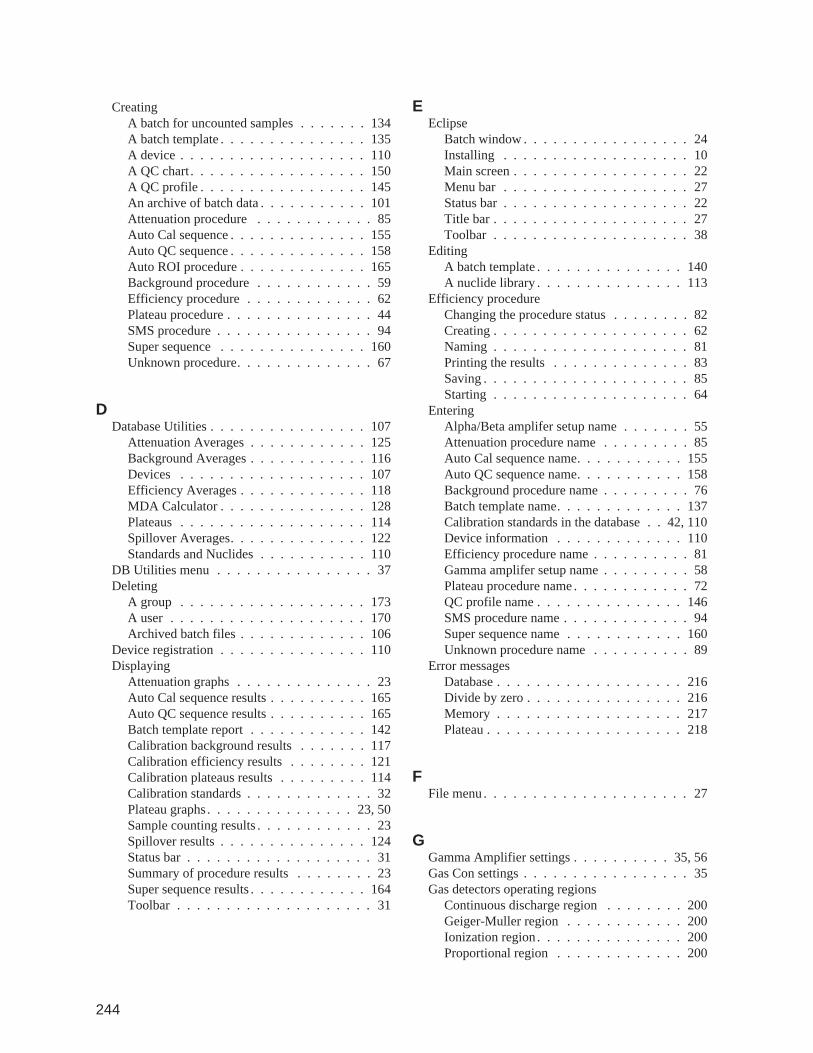
CreatingA batch for uncounted samples . . . . . . . 134A batch template . . . . . . . . . . . . . . . 135A device . . . . . . . . . . . . . . . . . . . 110A QC chart . . . . . . . . . . . . . . . . . . 150A QC profile . . . . . . . . . . . . . . . . . 145An archive of batch data . . . . . . . . . . . 101Attenuation procedure . . . . . . . . . . . . 85Auto Cal sequence . . . . . . . . . . . . . . 155Auto QC sequence . . . . . . . . . . . . . . 158Auto ROI procedure . . . . . . . . . . . . . 165Background procedure . . . . . . . . . . . . 59Efficiency procedure . . . . . . . . . . . . . 62Plateau procedure . . . . . . . . . . . . . . . 44SMS procedure . . . . . . . . . . . . . . . . 94Super sequence . . . . . . . . . . . . . . . 160Unknown procedure. . . . . . . . . . . . . . 67
DDatabase Utilities . . . . . . . . . . . . . . . . 107
Attenuation Averages . . . . . . . . . . . . 125Background Averages . . . . . . . . . . . . 116Devices . . . . . . . . . . . . . . . . . . . 107Efficiency Averages . . . . . . . . . . . . . 118MDA Calculator . . . . . . . . . . . . . . . 128Plateaus . . . . . . . . . . . . . . . . . . . 114Spillover Averages. . . . . . . . . . . . . . 122Standards and Nuclides . . . . . . . . . . . 110
DB Utilities menu . . . . . . . . . . . . . . . . 37Deleting
A group . . . . . . . . . . . . . . . . . . . 173A user . . . . . . . . . . . . . . . . . . . . 170Archived batch files . . . . . . . . . . . . . 106
Device registration . . . . . . . . . . . . . . . 110Displaying
Attenuation graphs . . . . . . . . . . . . . . 23Auto Cal sequence results . . . . . . . . . . 165Auto QC sequence results . . . . . . . . . . 165Batch template report . . . . . . . . . . . . 142Calibration background results . . . . . . . 117Calibration efficiency results . . . . . . . . 121Calibration plateaus results . . . . . . . . . 114Calibration standards . . . . . . . . . . . . . 32Plateau graphs . . . . . . . . . . . . . . . 23, 50Sample counting results . . . . . . . . . . . . 23Spillover results . . . . . . . . . . . . . . . 124Status bar . . . . . . . . . . . . . . . . . . . 31Summary of procedure results . . . . . . . . 23Super sequence results . . . . . . . . . . . . 164Toolbar . . . . . . . . . . . . . . . . . . . . 31
EEclipse
Batch window . . . . . . . . . . . . . . . . . 24Installing . . . . . . . . . . . . . . . . . . . 10Main screen . . . . . . . . . . . . . . . . . . 22Menu bar . . . . . . . . . . . . . . . . . . . 27Status bar . . . . . . . . . . . . . . . . . . . 22Title bar . . . . . . . . . . . . . . . . . . . . 27Toolbar . . . . . . . . . . . . . . . . . . . . 38
EditingA batch template . . . . . . . . . . . . . . . 140A nuclide library . . . . . . . . . . . . . . . 113
Efficiency procedureChanging the procedure status . . . . . . . . 82Creating . . . . . . . . . . . . . . . . . . . . 62Naming . . . . . . . . . . . . . . . . . . . . 81Printing the results . . . . . . . . . . . . . . 83Saving . . . . . . . . . . . . . . . . . . . . . 85Starting . . . . . . . . . . . . . . . . . . . . 64
EnteringAlpha/Beta amplifer setup name . . . . . . . 55Attenuation procedure name . . . . . . . . . 85Auto Cal sequence name. . . . . . . . . . . 155Auto QC sequence name. . . . . . . . . . . 158Background procedure name . . . . . . . . . 76Batch template name. . . . . . . . . . . . . 137Calibration standards in the database . . 42, 110Device information . . . . . . . . . . . . . 110Efficiency procedure name . . . . . . . . . . 81Gamma amplifer setup name . . . . . . . . . 58Plateau procedure name . . . . . . . . . . . . 72QC profile name . . . . . . . . . . . . . . . 146SMS procedure name . . . . . . . . . . . . . 94Super sequence name . . . . . . . . . . . . 160Unknown procedure name . . . . . . . . . . 89
Error messagesDatabase . . . . . . . . . . . . . . . . . . . 216Divide by zero . . . . . . . . . . . . . . . . 216Memory . . . . . . . . . . . . . . . . . . . 217Plateau . . . . . . . . . . . . . . . . . . . . 218
FFile menu . . . . . . . . . . . . . . . . . . . . . 27
GGamma Amplifier settings . . . . . . . . . . 35, 56Gas Con settings . . . . . . . . . . . . . . . . . 35Gas detectors operating regions
Continuous discharge region . . . . . . . . 200Geiger-Muller region . . . . . . . . . . . . 200Ionization region . . . . . . . . . . . . . . . 200Proportional region . . . . . . . . . . . . . 200
244
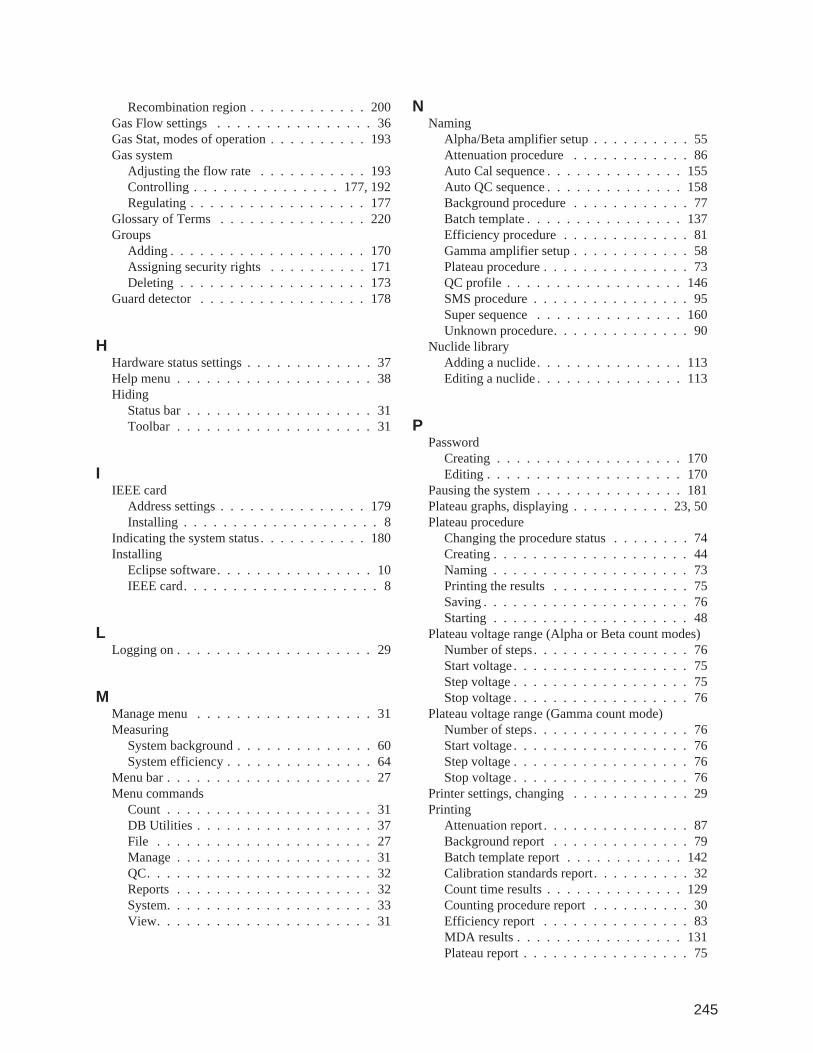
Recombination region . . . . . . . . . . . . 200Gas Flow settings . . . . . . . . . . . . . . . . 36Gas Stat, modes of operation . . . . . . . . . . 193Gas system
Adjusting the flow rate . . . . . . . . . . . 193Controlling . . . . . . . . . . . . . . . 177, 192Regulating . . . . . . . . . . . . . . . . . . 177
Glossary of Terms . . . . . . . . . . . . . . . 220Groups
Adding . . . . . . . . . . . . . . . . . . . . 170Assigning security rights . . . . . . . . . . 171Deleting . . . . . . . . . . . . . . . . . . . 173
Guard detector . . . . . . . . . . . . . . . . . 178
HHardware status settings . . . . . . . . . . . . . 37Help menu . . . . . . . . . . . . . . . . . . . . 38Hiding
Status bar . . . . . . . . . . . . . . . . . . . 31Toolbar . . . . . . . . . . . . . . . . . . . . 31
IIEEE card
Address settings . . . . . . . . . . . . . . . 179Installing . . . . . . . . . . . . . . . . . . . . 8
Indicating the system status . . . . . . . . . . . 180Installing
Eclipse software. . . . . . . . . . . . . . . . 10IEEE card. . . . . . . . . . . . . . . . . . . . 8
LLogging on . . . . . . . . . . . . . . . . . . . . 29
MManage menu . . . . . . . . . . . . . . . . . . 31Measuring
System background . . . . . . . . . . . . . . 60System efficiency . . . . . . . . . . . . . . . 64
Menu bar . . . . . . . . . . . . . . . . . . . . . 27Menu commands
Count . . . . . . . . . . . . . . . . . . . . . 31DB Utilities . . . . . . . . . . . . . . . . . . 37File . . . . . . . . . . . . . . . . . . . . . . 27Manage . . . . . . . . . . . . . . . . . . . . 31QC. . . . . . . . . . . . . . . . . . . . . . . 32Reports . . . . . . . . . . . . . . . . . . . . 32System. . . . . . . . . . . . . . . . . . . . . 33View. . . . . . . . . . . . . . . . . . . . . . 31
NNaming
Alpha/Beta amplifier setup . . . . . . . . . . 55Attenuation procedure . . . . . . . . . . . . 86Auto Cal sequence . . . . . . . . . . . . . . 155Auto QC sequence . . . . . . . . . . . . . . 158Background procedure . . . . . . . . . . . . 77Batch template . . . . . . . . . . . . . . . . 137Efficiency procedure . . . . . . . . . . . . . 81Gamma amplifier setup . . . . . . . . . . . . 58Plateau procedure . . . . . . . . . . . . . . . 73QC profile . . . . . . . . . . . . . . . . . . 146SMS procedure . . . . . . . . . . . . . . . . 95Super sequence . . . . . . . . . . . . . . . 160Unknown procedure. . . . . . . . . . . . . . 90
Nuclide libraryAdding a nuclide. . . . . . . . . . . . . . . 113Editing a nuclide . . . . . . . . . . . . . . . 113
PPassword
Creating . . . . . . . . . . . . . . . . . . . 170Editing . . . . . . . . . . . . . . . . . . . . 170
Pausing the system . . . . . . . . . . . . . . . 181Plateau graphs, displaying . . . . . . . . . . 23, 50Plateau procedure
Changing the procedure status . . . . . . . . 74Creating . . . . . . . . . . . . . . . . . . . . 44Naming . . . . . . . . . . . . . . . . . . . . 73Printing the results . . . . . . . . . . . . . . 75Saving . . . . . . . . . . . . . . . . . . . . . 76Starting . . . . . . . . . . . . . . . . . . . . 48
Plateau voltage range (Alpha or Beta count modes)Number of steps . . . . . . . . . . . . . . . . 76Start voltage . . . . . . . . . . . . . . . . . . 75Step voltage . . . . . . . . . . . . . . . . . . 75Stop voltage . . . . . . . . . . . . . . . . . . 76
Plateau voltage range (Gamma count mode)Number of steps . . . . . . . . . . . . . . . . 76Start voltage . . . . . . . . . . . . . . . . . . 76Step voltage . . . . . . . . . . . . . . . . . . 76Stop voltage . . . . . . . . . . . . . . . . . . 76
Printer settings, changing . . . . . . . . . . . . 29Printing
Attenuation report . . . . . . . . . . . . . . . 87Background report . . . . . . . . . . . . . . 79Batch template report . . . . . . . . . . . . 142Calibration standards report. . . . . . . . . . 32Count time results . . . . . . . . . . . . . . 129Counting procedure report . . . . . . . . . . 30Efficiency report . . . . . . . . . . . . . . . 83MDA results . . . . . . . . . . . . . . . . . 131Plateau report . . . . . . . . . . . . . . . . . 75
245
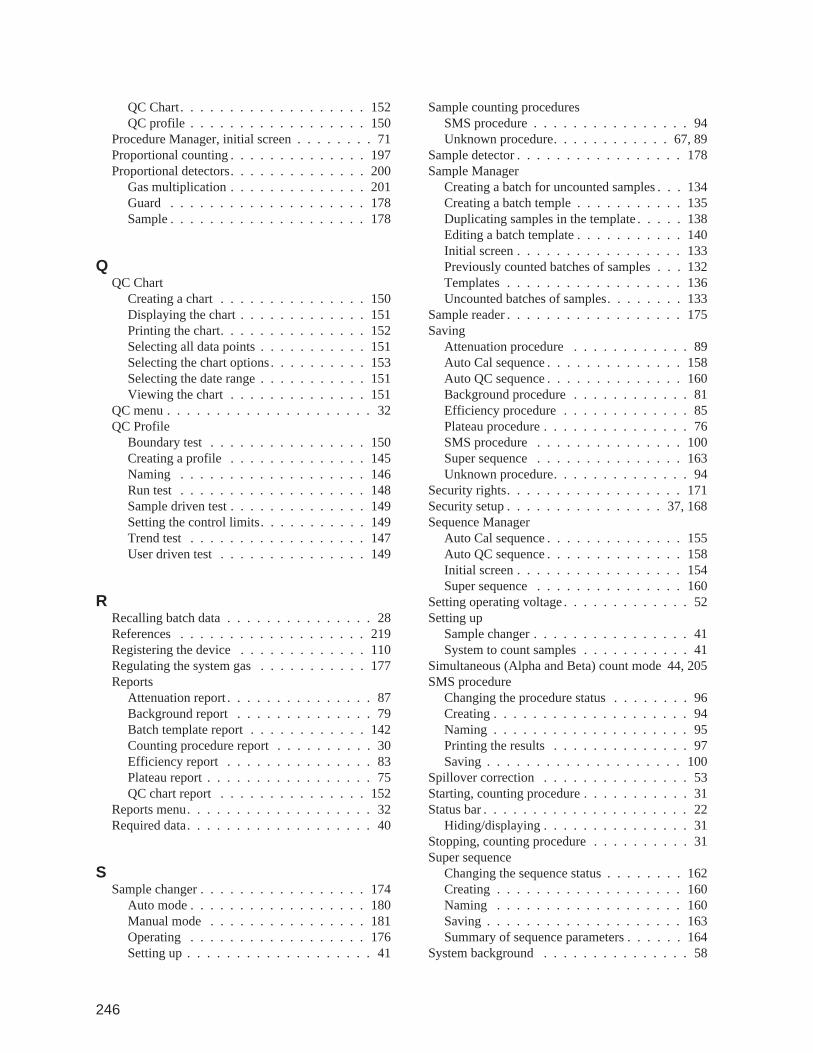
QC Chart . . . . . . . . . . . . . . . . . . . 152QC profile . . . . . . . . . . . . . . . . . . 150
Procedure Manager, initial screen . . . . . . . . 71Proportional counting . . . . . . . . . . . . . . 197Proportional detectors. . . . . . . . . . . . . . 200
Gas multiplication . . . . . . . . . . . . . . 201Guard . . . . . . . . . . . . . . . . . . . . 178Sample . . . . . . . . . . . . . . . . . . . . 178
QQC Chart
Creating a chart . . . . . . . . . . . . . . . 150Displaying the chart . . . . . . . . . . . . . 151Printing the chart. . . . . . . . . . . . . . . 152Selecting all data points . . . . . . . . . . . 151Selecting the chart options . . . . . . . . . . 153Selecting the date range . . . . . . . . . . . 151Viewing the chart . . . . . . . . . . . . . . 151
QC menu . . . . . . . . . . . . . . . . . . . . . 32QC Profile
Boundary test . . . . . . . . . . . . . . . . 150Creating a profile . . . . . . . . . . . . . . 145Naming . . . . . . . . . . . . . . . . . . . 146Run test . . . . . . . . . . . . . . . . . . . 148Sample driven test . . . . . . . . . . . . . . 149Setting the control limits. . . . . . . . . . . 149Trend test . . . . . . . . . . . . . . . . . . 147User driven test . . . . . . . . . . . . . . . 149
RRecalling batch data . . . . . . . . . . . . . . . 28References . . . . . . . . . . . . . . . . . . . 219Registering the device . . . . . . . . . . . . . 110Regulating the system gas . . . . . . . . . . . 177Reports
Attenuation report . . . . . . . . . . . . . . . 87Background report . . . . . . . . . . . . . . 79Batch template report . . . . . . . . . . . . 142Counting procedure report . . . . . . . . . . 30Efficiency report . . . . . . . . . . . . . . . 83Plateau report . . . . . . . . . . . . . . . . . 75QC chart report . . . . . . . . . . . . . . . 152
Reports menu. . . . . . . . . . . . . . . . . . . 32Required data. . . . . . . . . . . . . . . . . . . 40
SSample changer . . . . . . . . . . . . . . . . . 174
Auto mode . . . . . . . . . . . . . . . . . . 180Manual mode . . . . . . . . . . . . . . . . 181Operating . . . . . . . . . . . . . . . . . . 176Setting up . . . . . . . . . . . . . . . . . . . 41
Sample counting proceduresSMS procedure . . . . . . . . . . . . . . . . 94Unknown procedure. . . . . . . . . . . . 67, 89
Sample detector . . . . . . . . . . . . . . . . . 178Sample Manager
Creating a batch for uncounted samples . . . 134Creating a batch temple . . . . . . . . . . . 135Duplicating samples in the template . . . . . 138Editing a batch template . . . . . . . . . . . 140Initial screen . . . . . . . . . . . . . . . . . 133Previously counted batches of samples . . . 132Templates . . . . . . . . . . . . . . . . . . 136Uncounted batches of samples. . . . . . . . 133
Sample reader . . . . . . . . . . . . . . . . . . 175Saving
Attenuation procedure . . . . . . . . . . . . 89Auto Cal sequence . . . . . . . . . . . . . . 158Auto QC sequence . . . . . . . . . . . . . . 160Background procedure . . . . . . . . . . . . 81Efficiency procedure . . . . . . . . . . . . . 85Plateau procedure . . . . . . . . . . . . . . . 76SMS procedure . . . . . . . . . . . . . . . 100Super sequence . . . . . . . . . . . . . . . 163Unknown procedure. . . . . . . . . . . . . . 94
Security rights. . . . . . . . . . . . . . . . . . 171Security setup . . . . . . . . . . . . . . . . 37, 168Sequence Manager
Auto Cal sequence . . . . . . . . . . . . . . 155Auto QC sequence . . . . . . . . . . . . . . 158Initial screen . . . . . . . . . . . . . . . . . 154Super sequence . . . . . . . . . . . . . . . 160
Setting operating voltage . . . . . . . . . . . . . 52Setting up
Sample changer . . . . . . . . . . . . . . . . 41System to count samples . . . . . . . . . . . 41
Simultaneous (Alpha and Beta) count mode 44, 205SMS procedure
Changing the procedure status . . . . . . . . 96Creating . . . . . . . . . . . . . . . . . . . . 94Naming . . . . . . . . . . . . . . . . . . . . 95Printing the results . . . . . . . . . . . . . . 97Saving . . . . . . . . . . . . . . . . . . . . 100
Spillover correction . . . . . . . . . . . . . . . 53Starting, counting procedure . . . . . . . . . . . 31Status bar . . . . . . . . . . . . . . . . . . . . . 22
Hiding/displaying . . . . . . . . . . . . . . . 31Stopping, counting procedure . . . . . . . . . . 31Super sequence
Changing the sequence status . . . . . . . . 162Creating . . . . . . . . . . . . . . . . . . . 160Naming . . . . . . . . . . . . . . . . . . . 160Saving . . . . . . . . . . . . . . . . . . . . 163Summary of sequence parameters . . . . . . 164
System background . . . . . . . . . . . . . . . 58
246
Measuring . . . . . . . . . . . . . . . . . . . 60System efficiency . . . . . . . . . . . . . . . . 62
Measuring . . . . . . . . . . . . . . . . . . . 64System menu . . . . . . . . . . . . . . . . . . . 33System options . . . . . . . . . . . . . . . . . . 71System status indicator . . . . . . . . . . 180, 211
TTitle bar . . . . . . . . . . . . . . . . . . . . . 27Toolbar . . . . . . . . . . . . . . . . . . . . . . 38
Hiding/displaying . . . . . . . . . . . . . . . 31Troubleshooting
Background problems . . . . . . . . . . . . 212Bubble test . . . . . . . . . . . . . . . . . . 212Counter timer not incrementing . . . . . . . 214Data reproducibility . . . . . . . . . . . . . 215Efficiency/spillover problems . . . . . . . . 213Gas flow problems . . . . . . . . . . . . . . 211Plateau problems. . . . . . . . . . . . . . . 212Reports not generating . . . . . . . . . . . . 215System status indicator . . . . . . . . . . . 211
Typographic conventions . . . . . . . . . . . . . 6
UUnknown procedure
Changing the procedure status . . . . . . . . 90Creating . . . . . . . . . . . . . . . . . . . . 67Naming . . . . . . . . . . . . . . . . . . . . 90Printing the results . . . . . . . . . . . . . . 91Saving . . . . . . . . . . . . . . . . . . . . . 94Starting . . . . . . . . . . . . . . . . . . . . 69
UsersAdding . . . . . . . . . . . . . . . . . . . . 169Deleting . . . . . . . . . . . . . . . . . . . 170
VView menu . . . . . . . . . . . . . . . . . . . . 31Viewing
Attenuation graphs . . . . . . . . . . . . . . 23Auto Cal sequence results . . . . . . . . . . 165Auto QC sequence results . . . . . . . . . . 165Batch template report . . . . . . . . . . . . 142Calibration background results . . . . . . . 117Calibration efficiency results . . . . . . . . 121Calibration plateaus results . . . . . . . . . 114Calibration standards . . . . . . . . . . . . . 32Plateau graphs . . . . . . . . . . . . . . . 23, 50Sample counting results . . . . . . . . . . . . 23Spillover results . . . . . . . . . . . . . . . 124Status bar . . . . . . . . . . . . . . . . . . . 31Summary of procedure results . . . . . . . . 23
Super sequence results . . . . . . . . . . . . 164Toolbar . . . . . . . . . . . . . . . . . . . . 31
WWindow menu . . . . . . . . . . . . . . . . . . 38
247
Canberra’s product warranty covers hardware and software shipped to customers within the United States. Forhardware and software shipped outside the United States, a similar warranty is provided by Canberra’s localrepresentative.
DOMESTIC WARRANTYCanberra (we, us, our) warrants to the customer (you, your) that equipment manufactured by us shall be free fromdefects in materials and workmanship under normal use for a period of one (1) year from the date of shipment.
We warrant proper operation of our software only when used with software and hardware supplied by us andwarrant that our software media shall be free from defects for a period of 90 days from the date of shipment.
If defects are discovered within 90 days of receipt of an order, we will pay for shipping costs incurred in connectionwith the return of the equipment. If defects are discovered after the first 90 days, all shipping, insurance and othercosts shall be borne by you.
LIMITATIONSEXCEPT AS SET FORTH HEREIN, NO OTHER WARRANTIES, WHETHER STATUTORY, WRITTEN, ORAL,EXPRESSED, IMPLIED (INCLUDING WITHOUT LIMITATION, THE WARRANTIES OF MERCHANTABILITY ORFITNESS FOR A PARTICULAR PURPOSE) OR OTHERWISE, SHALL APPLY. IN NO EVENT SHALLCANBERRA HAVE ANY LIABILITY FOR ANY SPECIAL, INDIRECT OR CONSEQUENTIAL LOSSES ORDAMAGES OF ANY NATURE WHATSOEVER, WHETHER AS A RESULT OF BREACH OF CONTRACT, TORTLIABILITY (INCLUDING NEGLIGENCE), STRICT LIABILITY OR OTHERWISE.
EXCLUSIONSOur warranty does not cover damage to equipment which has been altered or modified without our writtenpermission or damage which has been caused by abuse, misuse, accident or unusual physical or electrical stress,as determined by our Service Personnel.
We are under no obligation to provide warranty service if adjustment or repair is required because of damagecaused by other than ordinary use or if the equipment is serviced or repaired, or if an attempt is made to service orrepair the equipment, by other than our personnel without our prior approval.
Our warranty does not cover detector damage due to neutrons or heavy charged particles. Failure of beryllium,carbon composite, or polymer windows or of windowless detectors caused by physical or chemical damage fromthe environment is not covered by warranty.
We are not responsible for damage sustained in transit. You should examine shipments upon receipt for evidenceof damage caused in transit. If damage is found, notify us and the carrier immediately. Keep all packages,materials and documents, including the freight bill, invoice and packing list.
When purchasing our software, you have purchased a license to use the software, not the software itself. Because titleto the software remains with us, you may not sell, distribute or otherwise transfer the software. This license allows you touse the software on only one computer at a time. You must get our written permission for any exception to this limitedlicense.
BACKUP COPIESOur software is protected by United States Copyright Law and by International Copyright Treaties. You have ourexpress permission to make one archival copy of the software for backup protection. You may not copy oursoftware or any part of it for any other purpose.
Revised 1/00