r/v urania, cruise no. u10/2011 - geomar repository eurofleets_cruise report... · r/v urania,...
TRANSCRIPT

R/V Urania, Cruise No. U10/2011, Naples – Naples, 27 July – 1 August 2011 1
EUROFLEETS Cruise Summary Report
The Panarea natural CO2 seeps: fate and impact of the leaking gas (PaCO2)
R/V URANIA, Cruise No. U10/2011,
27 July – 01 August 2011, Naples (Italy) – Naples (Italy)
AUTHORS McGinnis D.F., Beaubien S.E., Bigalke N., Bryant L.D., Celussi M., Comici C., De
Vittor C., Feldens P., Giani M., Karuza A., Schneider v. Deimling J.
October 2011 Citation: McGinnis D.F., Beaubien S.E., Bigalke N., Bryant L.D., Celussi M., Comici C., De Vittor C., Feldens P., Giani M., Karuza A., Schneider v. Deimling J. (2011) The Panarea natural CO2 seeps: fate and impact of the leaking gas (PaCO2). Eurofleet’s Cruise Report U10/2011, IFM-GEOMAR Kiel, Germany, 55pp.

R/V Urania, Cruise No. U10/2011, Naples – Naples, 27 July – 1 August 2011 2
TABLE OF CONTENTS
1 Summary ..................................................................................................................... 3 2 Research Objectives.................................................................................................... 4
2.1 Research Goals and Progress .............................................................................. 5 3 Narrative of the Cruise................................................................................................ 8 4 Preliminary Results................................................................................................... 10
4.1 Hydroacoustics.................................................................................................. 10 4.1.1 Introduction and overview of instruments and data.................................. 10 4.1.2 Chirp System Overview and Data Processing .......................................... 11 4.1.3 Multibeam - Kongsberg EM710 ............................................................... 11 4.1.4 Multibeam R2Sonic 2024 ......................................................................... 13 4.1.5 Preliminary Results................................................................................... 14
4.2 Water Column Gas and Geochemistry – CTD Niskin...................................... 17 4.2.1 Introduction and overview of data ............................................................ 17 4.2.2 Methods..................................................................................................... 17 4.2.3 Preliminary Results................................................................................... 21
4.3 Water Column Biology – CTD Niskin ............................................................. 24 4.3.1 Introduction and overview of data ............................................................ 24 4.3.2 Methods - Biology .................................................................................... 26 4.3.3 Preliminary Results................................................................................... 29
4.4 Water Column Physics...................................................................................... 32 4.4.1 Introduction and overview of data ............................................................ 32 4.4.2 CTD profiles ............................................................................................. 32 4.4.3 Preliminary Results - CTD........................................................................ 32 4.4.4 High-Resolution Microstructure CTD ...................................................... 34 4.4.5 Preliminary Results................................................................................... 35
4.5 Sea-Atmosphere CO2 Exchange (“Equilibrator”)............................................. 36 4.5.1 Introduction and overview of data ........................................................... 36 4.5.2 Preliminary Results................................................................................... 37
4.6 ROV dives and results ...................................................................................... 38 4.6.1 Methodology ............................................................................................. 38 4.6.2 Results....................................................................................................... 39
4.7 POZ Lander deployment................................................................................... 39 4.7.1 Methodology ............................................................................................. 39 4.7.2 Results....................................................................................................... 39
4.8 Eddy Correlation Measurements....................................................................... 40 4.8.1 Methodology ............................................................................................. 40 4.8.2 Results....................................................................................................... 41
5 Summary of student and CERTH participation ........................................................ 41 6 Data and Sample Storage /Availability..................................................................... 47 7 Participants................................................................................................................ 47 8 Station List U10/2011 ............................................................................................... 48 9 Acknowledgements................................................................................................... 53 10 References............................................................................................................. 54

R/V Urania, Cruise No. U10/2011, Naples – Naples, 27 July – 1 August 2011 3
1 Summary
Carbon capture and storage (CCS), both on- and offshore, is expected to be an important technique to mitigate anthropogenic effects on global climate by isolating man-made carbon dioxide (CO2) in deep geological formations. In marine environments, however, the potential impacts of CO2 leakage, appropriate detection methods, and risk and pathways of atmospheric emissions are poorly defined. The natural CO2 gas seeps that occur in the relatively shallow waters off the coast of Panarea Island (Aeolian Islands, Italy) can be studied as a large-scale, real-world analogue of what might occur at a leaking offshore CCS site and what tools can be used to study it. The oceanographic survey PaCO2 was performed aboard R/V Urania from 27 July – 01 August 2011 (Naples – Naples). The project’s ship-time was funded by Eurofleets, with work being performed as a sub-project of the Seventh Framework Programme projects “ECO2” and “RISCS”, which provided subsidiary funding. Large amounts of data and samples were collected during the cruise which will be interpreted in the coming months, with preliminary results detailed here. Of particular importance was the discovery of much larger areas showing gas seepage than previously reported. Interdisciplinary measurements were performed at the Panarea seepage site. The international team of scientists onboard R/V Urania performed complementary sampling and measurements for biological, chemical, and physical parameters throughout the area. Together with the dedication of R/V Urania’s Captain and crew, and the eagerness and cooperation of the scientific crew, we were able to obtain excellent scientific results during this six-day cruise.
Figure 1.1 Scientific crew from R/V Urania, Cruise No. U10/2011, Naples – Naples, 27 July – 1
August 2011 (photo Daniele Gitto).

R/V Urania, Cruise No. U10/2011, Naples – Naples, 27 July – 1 August 2011 4
2 Research Objectives
The goal of PaCO2 was to evaluate previously mapped seeps at Panarea and to search for new seepage areas. Focus was placed on evaluating techniques for CO2 seepage detection and quantification, as well as assessing the biological and chemical impact of the leaking CO2 in the water column. We applied interdisciplinary biological, chemical, and physical measurements at this site, comprising the following objectives: 1) Regional acoustic/seismic survey to locate bubble seeps related to shallow geological features and to define the gas leakage system, including shallow geology and structure (sub-bottom profiler) that may be controlling bubble pathways and leakage rates; 2) To better understand what percentage of CO2 leaked from the seafloor is transferred to the atmosphere by conducting an air-sea CO2-exchange survey; 3) Utilized hydroacoustic data to select sampling stations for vertical profiling and measurements in and around known and newly discovered seeps with emphases on the spatial biological and chemical impact; 4) To determine bubble plume dynamics (e.g. rise height, vertical velocity, horizontal dispersion, intrusion levels, fallback depths, etc) and how this influences CO2 migration in the water column by conducting high resolution temperature profiles (fast response CTD / microstructure profiler) on selected CO2 bubble plumes. To better understand bubble-induced water motion and heat fluxes by defining point velocities and temperature within bubble plumes using ADV coupled with a fast response temperature sensor (Eddy Correlation); 5) To determine the influence of local currents on CO2 dispersion in the near field surrounding CO2 bubble plumes by measuring water column velocity profiles (using a bottom mounted ADCP) and monitoring dissolved CO2 concentrations (using continuous monitoring probes moored above the ADCP); 6) To better understand the impact of CO2 leaks on prokaryote metabolism by sampling the water column inside and peripheral to seepage locations, characterizing these samples in terms of their chemistry (nutrients, dissolved CO2, pH, etc.), microbiology (viral abundance and activity, prokaryotic abundance, metabolic and exoenzymatic activity) by means of in situ sampling and conducting incubation experiments. 7) Use data to estimate rates of CO2 bubble flux, dissolution, and dispersion; and finally, 8) Plume modeling using collected data to allow extrapolation of the Panarea results to potential or current CCS marine sites. The results of this intense and multidisciplinary study will allow us to address questions specific to the Panarea site, such as CO2 detection, estimating fluxes, pathways, atmospheric emissions, etc., and will also allow us to provide guidance for monitoring and CO2 leakage impact estimations at CCS locations.

R/V Urania, Cruise No. U10/2011, Naples – Naples, 27 July – 1 August 2011 5
Combined, the described objectives will have numerous overall research benefits and impacts; such as safety, monitoring and leak detection, and risk and impact assessment of potential marine CCS sites.
2.1 Research Goals and Progress
Here, we address the degree to which our above-listed Research Objectives (Section 2) have been met, or will be met once the data are completely worked up. In general and despite the short length of the cruise, we were pleased with the outcome of the cruise and met (or will meet) nearly all of our research goals. Below we list specifically how the objects have been (or will be) achieved, and identify shortcomings (Section 2). Overall, we expect all goals of the project to be accomplished.
1) Hydroacoustic Mapping of gas seepage at Panarea: Acoustic measurements performed during the Urania cruise under the umbrella of PaCO2 in 2011 yielded novel acoustic data of high quality. Thus a new gas-seep distribution map could be acquired for the study area, demonstrating that the seepage areas are much larger than previously assumed. In contrast to the research proposal, the in situ hydroacoustic monitoring device GasQuant was not available for the cruise. Alternatively, we rented a very modern, state-of-the-art high frequency multibeam sounder (R2Sonic 200-400kHz) with a prototype water column imaging functionality. The device delivered exceptionally high quality data and even individual bubble streams could be resolved. These data have already been partially presented in Schneider von Deimling and Papenberg (2012). Further data processing of the R2Sonic data together with ADCP results will finally allow for gas flux estimates and determination of the bubble dissolution dynamics during ascent through the water.
Records of the subbottom chirp data have been reviewed, showing a maximum seafloor penetration of 10m. Once all sub-bottom acoustic data have been processed, bathymetry has been cleaned, and all gas ebullition sites have been mapped, we will link these data to investigate potential geologic control of the gas emissions.
2) Elevated seasurface methane concentrations at Panarea: As outlined in our research proposal, an air-sea equilibration system was installed on board of R/V Urania. The system was adapted in such a way that it could continuously measure both CO2 and CH4 with a high accuracy. It appeared that CH4 is an even better tracer for finding gas seepage related anomalies at the sea surface. The data have to be processed to compensate for different variable, such as changes in room temperature. After this has been accomplished, we will determine the spatial distribution of both CH4 and CO2 concentrations across the entire area of interest to meet the tasks presented in the proposal.
3) Use hydroacoustic data to select sampling stations: The high resolution hydroacoustic data described above was successfully used to accurately choose locations of interest for water sampling, including both leak and non-leaking sites. Besides sampling, identified seep sites were further explored using R/V Urania’s ROV, a Geitaliana Pollux Tre.

R/V Urania, Cruise No. U10/2011, Naples – Naples, 27 July – 1 August 2011 6
4) Bubble plume dynamics: We obtained more than sufficient data to perform our plume analyses and modelling. The data for the plume modeling were primarily obtained from the bubble-site near Bottaro Island and included bubble and gas measurements, heat and O2 fluxes with the Eddy Correlation, and high-resolution turbulence and CTD transects. The data are all used as boundary conditions in an existing bubble-plume model. For the first time, eddy correlation instrumentation has been deployed on such a bubble site. Our preliminary analysis indicates that we can use these flux data to estimate the gas expulsion rate from the Bottaro site, highlighting the applicability of this method for further similar studies. Collected water velocity data, from both the ADV and the ADCP, will be used to evaluate water motion, plume dispersion, and estimate turbulence at the site.
Work was conducted to measure bubble rise velocities in the first metre above the sediments, together with the capture of the bubbles at different heights to monitor for changes in gas chemistry. Due to limitations of the experimental set-up the research was not able to attain the goals originally set out in the proposal. That said, this experience has been fundamental in helping to design a new set-up that is presently being tested and used within one of the EC-funded projects linked to the EuroFleets PaCO2 cruise (i.e. ECO2).
5) Plume and CO2 dispersion: Continuous water column velocity profiles were collected with the bottom deployed ADCP. These data (and the ADV as supplemental and point measurements of velocity) and CO2 data collect with the air-sea equilibration system, water bottle samples, as well as the two deployed CO2 sensors will be used to investigate the horizontal movement of CO2. These combined data will be used to model the fate of the bottom-released CO2 and the potential to reach the surface-boundary layer where it can be vented to the atmosphere.
6) Impact of CO2 leaks on prokaryote metabolism: The Eurofleet campaign provided an overview of prokaryotic and viral abundances at different depths along a transect sampled within the vent field. The preliminary results obtained from the PaCO2 cruise showed a higher variability of microbial components than those observed in previous studies in the same study area. Our preliminary analysis indicates that this could be attributed to two factors: 1) samples were taken at deeper stations relative to the reference studies for the same area, thus outlining the variation of abundances along the water column; and 2) the summer sampling period likely enhanced the differences in microbial abundances due to stratification of the water column.
In contrast to expectations, which were based on our previous findings, viral abundances found at the control site, which is situated in the area external to the vent field, fell within the range of values of viral and HP abundances in the vent field. This result apparently means that viruses are not impacted by CO2 emissions. Only the results obtained from incubation experiments for the estimate of virus dynamics will allow us to define to what extent vent sites influence planktonic viruses.

R/V Urania, Cruise No. U10/2011, Naples – Naples, 27 July – 1 August 2011 7
Regarding the biochemical-biological aspects of the project, work performed during the PaCO2 cruise was successful in attaining the originally stated goals. Detailed profiles conducted in deep water sites, previously impossible from the small boats used in the past, have allowed for a complete characterisation of the water column along a transect cutting the submerged seamount where the bulk of previously known gas leakage points occur. With a focus on the carbonate system, nutrients, basic aqueous chemistry, and a wide range of biological analyses, this work allowed for a more extensive study of the potential impact of leaking CO2 on the marine ecosystem as a whole. Anomalies of dissolved CO2, pH, DIC, CH4, etc. highlighted three main anomalous areas along an essentially N-S transect crossing the seamount, with one on either side and one above the mount itself. The fact that anomalous values were often not found in adjacent CTD casts indicates that anomalous values are spatially restricted, likely due to efficient mixing processes. Measured inorganic nutrients did not show a significant correlation with CO2 leakage points, aside from silica which may be liberated due to reactions between the acidified waters and the shallow sediments or due to co-migration of silica-charged waters together with the CO2.
7) Estimate rates of CO2 bubble flux, dissolution, and dispersion: The data collected, combined with near-field plume and bubble-rise modeling, will be used to estimate the CO2 flux from the area, as well as dissolution and dispersion. These exercises will provide insight into the fate of the released CO2 and how and when it will vent to the atmosphere. Several boundary conditions will be explored, including varying depth and stratification. This will be linked to goal 8), extrapolation of our results to other CCS storage sites to develop measurement strategies, and to improve the effectiveness of monitoring techniques.

R/V Urania, Cruise No. U10/2011, Naples – Naples, 27 July – 1 August 2011 8
3 Narrative of the Cruise On 26 August, the scientists and students joining R/V Urania U10/2011 arrived in Naples, Italy, anticipating boarding the vessel the next morning. Naples greeted us with pleasant weather, and a promising forecast for our upcoming six day cruise. The 18 of us (Figure 1.1) enjoyed an unofficial pre-cruise meeting, where we met with our old and new colleagues while enjoying the flavors of Naples. While some of the scientists stayed aboard R/V Urania this evening, the rest of us stayed on land and arrived onboard the next morning at 09:00. Upon our arrival, we were greeted by Captain Emanuele Gentile and crew, as well as SO.PRO.MAR’s Technical Manager, Mr. Mauro Del Sette. During our brief meeting, we exchanged information and took care of formalities. We were pleased to learn that our equipment had safely arrived and was already loaded on board. Following, we participated in the safety drills, toured the ship and familiarized ourselves with the facilities; while preparing for our 14:00 departure (See Figure 1.2 Cruise track). This day saw a flurry of activity, as we rushed to unpack, assemble, and mount our equipment to begin operations when we arrived on station the next morning. Meals were separated into two groups, and we quickly discovered the excellent Italian cuisine that was in store for us onboard, with lunch and dinners consisting of three-course meals. After dinner, we had our first group meeting to plan the activities of the upcoming day. We enjoyed calm seas and little wind, and thus arrived on station slightly ahead of schedule at 03:15 on 28 July. The operations began with a CTD cast to obtain the sound velocity profiles for calibrating the seismic and acoustic systems. The first multibeam and chirp mapping then began around the Panarea area. Due to the shallow waters and numerous vessels in the area, operations on the plateau were limited to daylight hours. Just before lunch, we were able to deploy the IFM-GEOMAR POZ lander in the study area that would remain for the duration of the cruise to gather important information on the background hydrodynamic conditions. Following the POZ lander deployment, we utilized R/V Urania’s ROV to visually investigate the lander to confirm the position and proper orientation (Figure 3.1). There was some excitement with the discovery of a new gas seepage site by the hydroacoustic and seismic team. Therefore, the second ROV dive was deployed at this new site, where we found significant gas bubbling and were able to collect a gas bubble sample directly at the sea floor with an improvised gas capture apparatus mounted on the ROV. The rest of the day was devoted to CTD measurements followed by a night program of combined multibeam and sea surface gas-measurements with IOW’s equilibrator. The results of the day’s work and the next day’s planning were discussed at our nightly group meeting. Spirits were high as the final equipment had been assembled and was fully functional, and our first promising data were obtained.
Figure 3.1 POZ lander.

R/V Urania, Cruise No. U10/2011, Naples – Naples, 27 July – 1 August 2011 9
Figure 1.2. Cruise track for U10/2011, Naples to Naples. After completion of the night time seismic program, July 29 was a full day of several operations. The weather was fine, though the sea had picked up slightly. The morning began with an intense CTD and water sampling campaign for biological and chemical sampling by OGS and the University of Rome, followed by hydroacoustic/equilibrator transects. In the afternoon, IFM-Geomar’s Eddy lander was deployed by workboat on the Bottaro bubble field; equipped with University of Rome’s CO2 sensor. Despite the rough sea, the Eddy was deployed successfully for the measurement of turbulent oxygen and heat fluxes at the bubbling site. The evening saw several more CTD profiles and water sampling, followed by the night acoustic program. We were excited to test the new R2Sonic multibeam, which had been generously supplied by R2Sonic and Ageotec (Italy), and had been mounted on an “over-the-side” mounting earlier in the day. The usual nightly meeting was held after sunset where we strategically planned our last full upcoming working day.

R/V Urania, Cruise No. U10/2011, Naples – Naples, 27 July – 1 August 2011 10
Our final full workday, July 30, saw calmer seas, and fine weather. In the morning we awoke to learn that another new seep-field had been discovered by the hydroacoustic team during the night. Several CTD casts were performed, as well as our third ROV dive. Unfortunately, the ROV’s compensation thruster number 3 failed due to a faulty membrane, disabling the ROV for the remainder of the cruise. R/V Urania’s tender Plutone was deployed for microstructure measurements with the help of our eager student participants. Our final official meeting was again held this evening. July 31 was a busy day for all. Lander recovery operations took place first thing in the morning. Before lunchtime, both landers were back on board and Plutone was again deployed for the final day of microstructure profiling. Several CTD profiles were also obtained before the CTD was cleaned and put away. The afternoon was busy with cleaning, disassembling equipment, and packing as R/V Urania began her transit back to Naples. Before dinner, we assembled for the group photo, followed by an evening farewell party in the ship’s lounge. Using the looking glass from the bridge, we were able to see the flames from Mt. Etna in the distance. We arrived in port at Naples at 09:00 and began our disembarking procedures. All equipment was packed and labeled and the cabins cleared out. We enjoyed a final lunch on board and all scientists departed shortly after. We were all very pleased with the amount of data obtained on this rather short cruise, and the great collaboration shared among the scientific and student participants. We again express our deep gratitude to the Captain and Crew of R/V Urania, Eurofleets, and SOPRAMAR for their helpfulness and enthusiasm, and ensuring our successful cruise. Fair winds and following seas! 4 Preliminary Results The following is a brief summary of data obtained while on board and an overview of preliminary analyses. The preliminary results listed below are meant to inform as to the cruise activities and a first look to the physical and biogeochemical characterizations of the Panarea study area, and thus, the following information should not be viewed as final results. 4.1 Hydroacoustics 4.1.1 Introduction and overview of instruments and data The main goal of the acoustic studies was to detect CO2 bubbles emitting from the seafloor and in the water column. Thus, the overall subseafloor gas distribution, quantitative mapping of ebullition sites and determination of respective gas bubble rise heights could be constrained. Unfortunately, R/V Urania’s sparker system was damaged and sent for repair prior to the PaCO2 cruise. Instead R/V Urania’s chirp system was operated during the cruise. Due to shorter penetration depth of the chirp compared to the one of a sparker system, subbottom imaging was limited.

R/V Urania, Cruise No. U10/2011, Naples – Naples, 27 July – 1 August 2011 11
In the proposal the use of the 180kHz hydroacoustic monitoring device GasQuant was announced. However, this device could not be sent to R/V Urania due to a temporal overlap with another cruise. To compensate, a state-of-the-art R2Sonic 2024 multibeam system was brought onboard as a high-frequency (200-400kHz) alternative to GasQuant. 4.1.2 Chirp System Overview and Data Processing Sediment echo sounder data were collected using a hull-mounted Benthos-III Chirp system. A chirp echosounder emits a longer pulse, compared to traditional continuous wave echosounders, with a constantly increasing frequency – hence, the name “chirp”. The longer pulse duration leads to increased energy transmission into the water column, and therefore increased penetration depth. However, vertical resolution is not affected by the longer pulse duration: upon receiving, the pulse is compressed according to frequency. The Benthos–III was set to a frequency band between 2 and 7 kHz during data acquisition. Both intensity of the emitted sound pulse and record length were adjusted on-the-fly, depending on water depth and sediment characteristics. The navigational information written into the resulting segy-file headers is already corrected against the offset between GPS-antennae and chirp transducer. Navigational information of the recorded profiles is displayed in Figure 4.1.2-1. Generally, penetration into the subsurface was poor, due to the pronounced difference in acoustic impedance between volcanic material and water column/sediment. Furthermore, no migration pathways of rising gas could be recognized in the raw data. Meanwhile, both sediment layers on top of the volcanic basement and flares in the water column could be clearly recognized (Figure 4.1.2-2).
4.1.3 Multibeam - Kongsberg EM710 Bathymetric measurements and water column imaging (WCI) were performed with R/V Urania’s multibeam. The fix-installed Kongsberg MBES EM710 using a chirp frequency of 70-100 kHz by a 1x2° array with 150 ° swath width. The sonar head is positioned on the ship’s keel using a V-shaped steel frame. A sound velocity probe at the keel 1 m above the Sonar Head is interfaced directly to the MBES processor, thus providing the necessary real-time data for beam-formation. Motion data and GPS were supplied by R/V Urania’s Seapath system. CTD casts were normally used for input of the sound velocity profile to the system. Data were recorded including the WCI data mainly used for gas flare detection in the water column in one raw data file. Each visually observed flare was marked online to provide a map of flare findings. Prior testing of the WCI data import into FMMidwater (IVS) guaranteed successful data reviewing to determine total number of flares and bubble rise height. To increase bathymetry measurement quality, gas bubble interference was accounted for by adjusting the pulse length to the minimum value of 0.15 ms during most operations.

R/V Urania, Cruise No. U10/2011, Naples – Naples, 27 July – 1 August 2011 12
Figure 4.1.2-1: Overview of the recorded chirp-echosounder profiles.
Figure 4.1.2-2: Representative chirp data. X-Axis: Shot number. Y-Axis: Depth in seconds. The thickness of the resolved sediment layer above the acoustic basement is approx. 10 ms, equal to
approx. 7.5 m, with an assumed sound velocity of 1500 m/s.

R/V Urania, Cruise No. U10/2011, Naples – Naples, 27 July – 1 August 2011 13
4.1.4 Multibeam R2Sonic 2024 The R2Sonic 2024 is a very new broadband multibeam system operating between 200-400 kHz. The transducers were mounted at R/V Urania’s over-the-side pole in such a way that the transmit fan was pointing slightly forward looking resulting in a pitch offset of ~5° (Figure 4.1.4-1). This installation is not ideal for bathymetric measurements but effectively reduces the strong specular side-lobe from the first arrival thus improving WCI quality on the outer beams. Frequencies between 200-400 kHz were chosen depending on interference caused from other sounders. An Ageotec IMSV sound velocity probe installed one meter above the Mills-Cross continuously delivered data to the system. MRU data were shared over TSS1 from the Seapath system in real-time with a sampling frequency of 100 Hz. Bathymetry data were synchronized from a GPS (hemisphere A100) with zda and pps, in Qinsy and also in the R2Sonic-SIM, with a latency of zero. R2Sonic prototype software (pingviewlight, pingsnap) allowed for WCI online inspection and data replay with a sampling frequency of 4 Hz. The shown depth represents the depth below the transducer and has to be corrected by adding 4.28 m to the displayed value. These data were stored in both, screen capturing video and “raw” data format. The latter data format allows adjusting the gain during postprocessing. The sampling frequency of the raw images was limited to 0.5 Hz given the very large amount of data (4 MB per ping). The pulse length was set to the minimum value of 15 µs during most operations for high resolution and potential separation of individual bubbles. No tide correction has been applied to the data. Given the over-the-side mounting, survey speed was limited to 4 knots. Thus survey coverage was limited but flare imaging quality improved. At this stage of development it was not possible to record R2Sonic bathymetry and R2Sonic WCI data at the same time.
Figure 4.1.5-1: Overview of EM710 survey coverage around the shallow Panarea plateau gathered
during the cruise.
Figure 4.1.4-1: Pole-mounting of the R2Sonic multibeam transducer and external seawater pump along
R/V Urania’s starboard side.
R/V Urania, Cruise No. U10/2011, Naples – Naples, 27 July – 1 August 2011 14
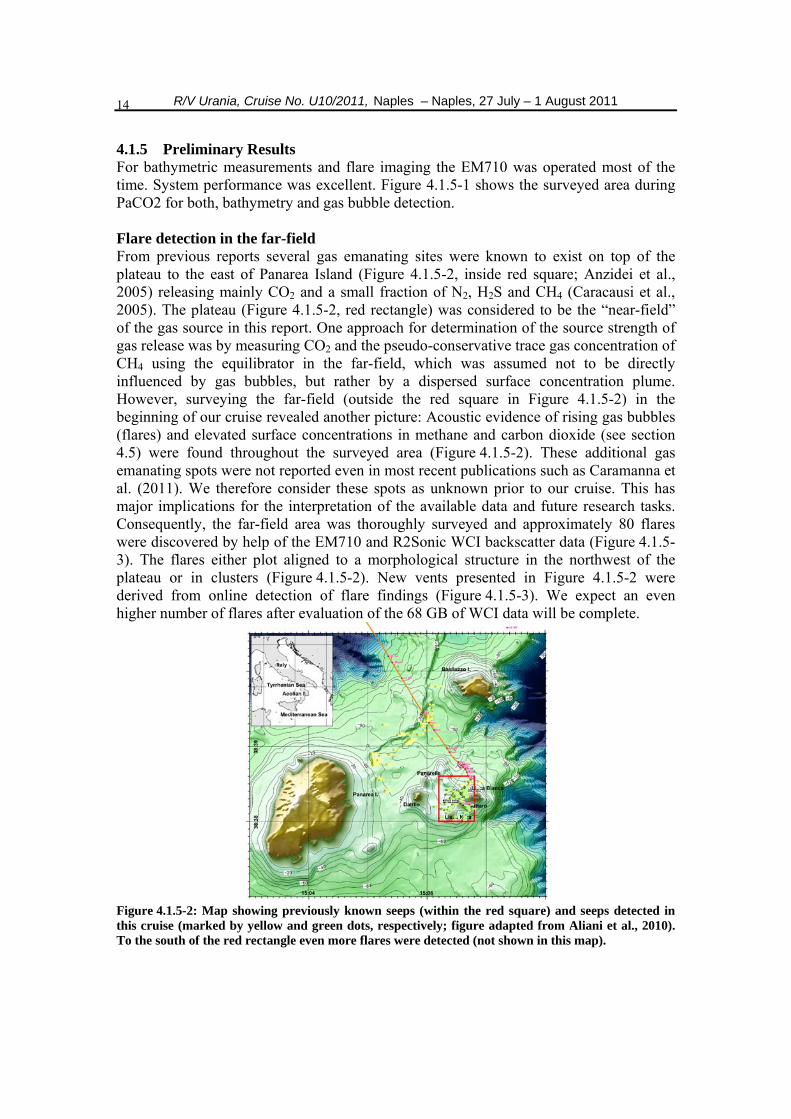
4.1.5 Preliminary Results For bathymetric measurements and flare imaging the EM710 was operated most of the time. System performance was excellent. Figure 4.1.5-1 shows the surveyed area during PaCO2 for both, bathymetry and gas bubble detection. Flare detection in the far-field From previous reports several gas emanating sites were known to exist on top of the plateau to the east of Panarea Island (Figure 4.1.5-2, inside red square; Anzidei et al., 2005) releasing mainly CO2 and a small fraction of N2, H2S and CH4 (Caracausi et al., 2005). The plateau (Figure 4.1.5-2, red rectangle) was considered to be the “near-field” of the gas source in this report. One approach for determination of the source strength of gas release was by measuring CO2 and the pseudo-conservative trace gas concentration of CH4 using the equilibrator in the far-field, which was assumed not to be directly influenced by gas bubbles, but rather by a dispersed surface concentration plume. However, surveying the far-field (outside the red square in Figure 4.1.5-2) in the beginning of our cruise revealed another picture: Acoustic evidence of rising gas bubbles (flares) and elevated surface concentrations in methane and carbon dioxide (see section 4.5) were found throughout the surveyed area (Figure 4.1.5-2). These additional gas emanating spots were not reported even in most recent publications such as Caramanna et al. (2011). We therefore consider these spots as unknown prior to our cruise. This has major implications for the interpretation of the available data and future research tasks. Consequently, the far-field area was thoroughly surveyed and approximately 80 flares were discovered by help of the EM710 and R2Sonic WCI backscatter data (Figure 4.1.5-3). The flares either plot aligned to a morphological structure in the northwest of the plateau or in clusters (Figure 4.1.5-2). New vents presented in Figure 4.1.5-2 were derived from online detection of flare findings (Figure 4.1.5-3). We expect an even higher number of flares after evaluation of the 68 GB of WCI data will be complete.
Figure 4.1.5-2: Map showing previously known seeps (within the red square) and seeps detected in this cruise (marked by yellow and green dots, respectively; figure adapted from Aliani et al., 2010). To the south of the red rectangle even more flares were detected (not shown in this map).

R/V Urania, Cruise No. U10/2011, Naples – Naples, 27 July – 1 August 2011 15
From online inspection we discovered maximum rise heights of 70 m (Figure 4.1.5-3). Assuming almost pure CO2 gas being released from the seafloor (based on ROV sampling – see section 4.6), this rise height would suggest that most of the CO2 has been dissolved and replaced by stripped oxygen and nitrogen (McGinnis et al., 2011).
Figure 4.1.5-3: Online display of (a) the EM 710 and (b) R2Sonic 2024 water column data showing
flares rising from 70 meters almost to the sea surface. Flare analysis in the near-field At several sites within the plateau flare surveying was performed with the R2Sonic multibeam. The navigation sounders of R/V Urania and water pumps were switched off whenever possible to improve the signal to noise ratio (S/N). Figure 4.1.5-4 clearly shows bubble streams emerging from the seafloor. In the figure four bubble streams appear to rise from the seafloor at 24 m seawater depth. A strictly vertical rise is later strongly deflected or the stream disappears partially (Figure 4.1.5-4, right side). The reason for this can be either fast dissolution of the soluble CO2 (McGinnis et al., 2011) and/or geometrical reasons (beam narrowing at short ranges). The real rise height will be determined after inspection of 3D data gained during a very slow drift survey over the seep area. Flare imaging was not limited to the inner beams but could be detected even in the very outer beams close to the seafloor, where the S/N ratio is much worse compared to nadir due to side-lobe interference. Thus, the R2Sonic provides large potential for wide-coverage flare imaging using the full swath width of 160°. At the ROV dive site gas bubble flow was imaged as a time series. The respective video (http://www.ocean-sci-discuss.net/8/1757/2011/osd-8-1757-2011-discussion.html) shows continuous movement of rising gas bubbles. Bubble rise velocities will be constrained following Schneider von Deimling and Papenberg (2011). At the current stage of development the R2Sonic WCI is in prototype mode, which only allows a sample frequency of 0.5 Hz for high resolution “pingsnap” data and 4 Hz for the online/video display. Nevertheless the high density of bubble “seeds” will most likely allow for bubble rise velocity estimates. At the moment, there is no sophisticated software available to read the WCI data. Significant post-processing is required and scheduled for a future endeavor.

R/V Urania, Cruise No. U10/2011, Naples – Naples, 27 July – 1 August 2011 16
Figure 4.1.5-4: Water column imaging data recorded at Panarea (Italy) showing four natural CO2 bubble streams released at 24 m depth. The ROV appears in the center beam together with its connecting umbilical, and the vessel induced bubble wake plots close to the sea surface. Currents deflect the bubbles to the right. A video from Schneider von Deimling and Papenberg (2011) of the data can be downloaded (see text). Conclusion Flare analysis Surveying outside of the shallow plateau to the east of Panarea Island in the beginning of our cruise revealed that much more gas exhalations exist than previously reported. Overall ~80 additional flares were found which are predominately aligned to a morphological structure in the northwest, or appear in clusters (Figure 4.1.5-2). Gas bubble release was observed at a maximum depth of 85 m and vertical rise heights
peaked at 70 m. The rise height of the all detected flares will be evaluated during data post-processing. Moreover, by the use of the high frequency R2Sonic, bubble rise velocities, plume dispersion, and dissolution behavior may be derived after processing the data at shallow depth. Bathymetry
The focus in our study was to gather high-quality water column backscatter data. Valuable bathymetry could be recorded (Figure 4.1.5-5) in addition to the flare imaging to complement already published work (Anzidei et al., 2005; Fabris et al., 2010). To avoid bubble-shadowing effects potentially caused by 400 kHz we used a frequency of 200 kHz to perform a high-resolution bathymetric survey at the Black Smoke seep site on the plateau. After application of a sound velocity profile, corrections for roll, pitch and yaw (roll -0.98, pitch 5.12, yaw 2.34) as well as data cleaning performed in QINSy (grid cell size set to 0.5 m), the R2Sonic data clearly revealed the crater of this prominent gas release site. Unfortunately this survey had to be aborted due to scuba diver activities in the area.
Figure 4.1.5-5: High-resolution bathymetric map showing the Black Smoke depression.

R/V Urania, Cruise No. U10/2011, Naples – Naples, 27 July – 1 August 2011 17
4.2 Water Column Gas and Geochemistry – CTD Niskin 4.2.1 Introduction and overview of data CTD data defining water column stratification and pH distribution were used to decide the location and depth of discrete water sampling for various chemical analyses, including dissolved gases, major and trace elements, pH, alkalinity, oxygen, dissolved organic and inorganic carbon, inorganic nutrients, particulate carbon and nitrogen and chlorophyll a. Data will be combined to understand mixing, carbon cycling, and to give support for interpretation of the biological data. 4.2.2 Methods Dissolved gases The headspace technique was used for the quantification of the partial pressure (pCO2, pCH4) of dissolved gases in water column samples (Capasso and Inguaggiato, 1998). One end of a narrow bore Teflon tube was connected directly to a Niskin bottle while the other was placed in the bottom of a 40 ml, amber, wide-mouth VOA glass vial (Figure 4.2-1a). Water flow was then initiated, making sure to maintain a low flow rate to minimize turbulence and degassing. A total of about 100 ml of water was allowed to flow into the vial, meaning that the remaining 40 ml had experienced laminar flow and very limited contact with the atmosphere. The tube was carefully removed, thus leaving a large meniscus at the vial mouth. The vial was then carefully capped with a septum (silicone and Teflon) to ensure that no gas bubbles had formed. These samples were then stored in a refrigerator at 4°C until processing. Of the collected samples, approximately 25% were processed and analyzed directly on board ship using a Varian model 3800 gas chromatograph (GC) (Figure 4.2-1b). Due, however, to failure of the hydrogen generator used for production of the GC carrier gas and FID flame, the remaining 75% were transported back to the lab in coolers with ice, transferred directly to a refrigerator, and processed and analyzed within 5 days after the end of the cruise.
Figure 4.2-1. Photograph showing the filling of a VOA bottle for dissolved gas analyses (a) and the gas chromatograph mounted in the dry lab of R/V Urania (b). Dissolved gas samples were first processed by injecting 5 ml of pure helium gas into the vial through the capped septum using a 5 ml plastic syringe and needle, displacing at the same time an equal volume of water through a second needle placed in the septum. This sample was then left overnight to equilibrate the headspace gas with the water sample. A
a b

R/V Urania, Cruise No. U10/2011, Naples – Naples, 27 July – 1 August 2011 18
“U-tube” (filled with degassed seawater) was then attached to the vial via a needle to allow for equilibration at atmospheric pressure, followed by shaking for 5 minutes to re-equilibrate. A 1 ml sample of gas was then removed from the headspace for analysis, while an equal volume of degassed seawater was injected into the vial to maintain constant atmospheric pressure conditions. The collected headspace sample was then injected into a Varian 3800 gas chromatograph; this GC is equipped with a 100l sample loop, a 25m long PoraPlotQ wide-bore capillary column, TCD and FID detectors in series for the analysis of CO2 and CH4 (respectively), and was run under isothermal conditions of 40°C. Calibration was conducted daily via certified standards; repeat analysis of control standards during the analyses indicates an accuracy of < ± 5% for both measured analytes. The analyses resulted in pCO2 and pCH4 values, which can then be used to calculate the original dissolved concentrations using Henry’s Law constants and the Ideal Gas Law.
Major and trace elements
As selected samples will be analyzed for trace element concentrations, reagents and procedures were used which would minimize the possibility of contamination. Reagents included MilliQ water, double sub-boiled distilled ultrapure nitric acid, and ICPMS grade single element standards. Labware used in any stage of the method, such as glass flasks for dilutions or High Density Polyethylene (HDPE) bottles used for sample collection, were cleaned prior to use by placing them in a soap bath for 24 hours, rinsing thoroughly with distilled water, placing in a 10% nitric acid bath for 24 hours, and rinsing thoroughly with de-ionized water. Each bottle or container was then closed and stored in a clean area prior to use. Samples were filtered immediately on board ship using 33 mm diameter, regenerated-cellulose syringe filters having a nominal pore size of 0.45 m. The following protocol was adopted. A 60 mL plastic syringe was filled directly from the Niskin bottle using a short piece of Teflon tubing, agitated, then the water was discarded. The syringe was re-filled, a clean filter attached, the 60 mL of sample was filtered into a clean 100 ml HDPE sample bottle and this water was used to rinse both bottles to be used for that sample; this water was then discarded. Finally the syringe was re-filled and water was filtered (using the same syringe filter) into a bottle for anion analysis and then repeated into a separate bottle for cation analyses. The bottles for the cation analyses were acidified with 100 L of ultra pure nitric acid. All samples were then stored in a refrigerator at 4°C until analysis.

R/V Urania, Cruise No. U10/2011, Naples – Naples, 27 July – 1 August 2011 19
Figure 4.2-2. Photographs of the ion chromatograph (a) and ICPMS (b) that will be used for the major and trace element analyses. Both major anion (Cl-, F-, SO4
2-, NO3-) and cation (Li+, NH4
+, Ca2+, Mg2+, K+, Na+ and Sr2+) concentrations will be measured separately with a Dionex “CX-500” ion chromatograph (Figure 4.2-2a) while trace heavy metals will be analyzed using a VG Elemental “Plasma-Quad” Inductively Coupled Plasma – Mass Spectrometer (Figure 4.2-2a). All samples will be diluted 1:200 prior to analyses due to the elevated seawater concentrations; this implies that some analyzed components having initial low concentrations will not be quantified with this level of dilution. Both field and laboratory blanks will be analyzed along with the samples in order to assess possible contamination as well as detection limits. Total alkalinity, pH and Dissolved Oxygen The sampling for total alkalinity analysis has been carried out in 250 mL borosilicate glass bottles adding 100 µL of a saturated HgCl2 solution. The samples have been preserved at 4°C until analysis. The standard operative procedure for total alkalinity in seawater using open cell titration (SOP 3b., Dickson et al., 2007) was followed. Total alkalinity (At) has been determined by potentiometric titration with a Mettler Toledo G20 titrator with a Mettler-Toledo DGi 115SG glass electrode. The titration has been carried out in a cell thermostatted at 25.0 °C (Lauda RE104). The temperature in the cell has been recorded by a DT1000 temperature probe. About 100 g of seawater sample have been carefully weighed and titrated by HCl 0.01M (Merck Titrisol) standardized against Na2CO3 (Merck Certipur). The HCl was maintained at 25.0°C with circulating bath (ISCO GTR2000). Periodic controls on the accuracy have been carried out on certified reference material Batch 107 supplied by University of California, San Diego. Several of total alkalinity analyses have been conducted and data processing is in progress. Water samples for pH analysis have been collected directly in cylindrical cell of 100 mm path length. The measurements have been carried out on board against MilliQ water in a double beam Varian Cary 100 spectrophotometer with thermostatted cylindrical cell holders. A circulating bath was used to keep the temperature at 25.0°C. The temperature in the reference cell was checked by a PT100 temperature sensor (precision: 0.01°C, GMH 3750). The indicator m-cresol violet at pH 8.0 (60-80 µL) has been added in the cell by a micropipette. The SOP6b ver 3.01 (Dickson et al., 2007) method has been followed. The measurements have been corrected for effect of the addition of the indicator. Periodic controls on the accuracy have been carried out on certified reference
a b

R/V Urania, Cruise No. U10/2011, Naples – Naples, 27 July – 1 August 2011 20
material Batch 107 supplied by University of California, San Diego. The results were expressed on the pHT scale; the in situ pH was calculated on the basis of the in situ temperature and salinity measured by the CTD probe. For dissolved oxygen, water samples were collected in acid-cleaned and distilled-water-rinsed 60 mL BOD bottles. Dissolved oxygen concentration was measured with a Mettler Toledo G20 titrator for automated Winkler titration based on potentiometric end point detection, as detailed by Zoppini et al. (2010). Chlorophyll a For chlorophyll a (chla) measurements seawater samples of 2-4 liters were filtered through Whatman GF/F glass-fiber filters (0.7 μm nominal pore size, 45 mm diameter) and immediately frozen (–20°C) until analysis. Pigments were extracted overnight in the dark at 4°C with 90% acetone from the homogenate filter and determined spectrofluorometrically following the procedures described by Lorenzen and Jeffrey (1980). The measurements of chla were performed before and after acidification with 2 drops of HCl 1 N using a JASCO FP 6500 spectrofluorometer (450 nm excitement and 665 nm emission wavelengths). Calibration was made with pure Sigma chla standards. Analyses have been performed and data processing is in progress. Dissolved Inorganic Nutrients Seawater samples for dissolved nutrient analyses (NH4
+, NO2
-, NO3-, PO4
3- and Si(OH)4-) were pre-filtered on 0.7 µm
pore size glass-fiber filters (Whatman GF/F). Analyses were performed at room temperature on a five-channel using a Bran+Luebbe Autoanalyzer 3 Continuous Flow Analyzer (Bran+Luebbe, Norderstedt, Germany) (Figure 4.2-3), according to Koroleff & Grasshof (1983). The efficiency of the system was checked before and after sample analyses by doing replicates of internal standards. Dissolved Organic and Inorganic Carbon (DOC and DIC) Samples for DOC analyses were filtered on board through precombusted (4h at 480°C) and acidified (1N HCl) Whatman GF/F glass fiber filters (0.7 µm nominal pore size). Filtration was performed using a glass syringe and a filter holder in order to prevent atmospheric contamination. The filtered samples were stored frozen (-20°C) in 20 mL glass vials (previously treated with chromic mixture and precombusted for 4h at 480°C). Before the analysis, samples were acidified (pH <2) with 6N HCl solution and purged for 8 min using high-purity oxygen bubbling (150 mL min-1). The HTCO method was applied using a commercial unit, the Shimadzu TOC-V CSH with a quartz combustion column filled with 1.2% Pt on silica pillows with an approximate diameter of 3 mm (Cauwet, 1994). One hundred µL of sample was injected into the instrument port. Carbon concentrations were calculated by subtracting the system blanks and dividing by the slope of the calibration curve (Thomas et al., 1995). Standardization was carried out every day using potassium hydrogen phthalate. Each value was determined from a minimum of
Figure 4.2-3. Segmented Flow Analyzer (Bran + Luebbe Autoanalyzer III) for nutrient analysis.

R/V Urania, Cruise No. U10/2011, Naples – Naples, 27 July – 1 August 2011 21
three injections, with a variation coefficient <2%. The replicate samples showed dispersion between 1.5% and 4%. Analyses are in progress. Samples for DIC analyses were collected in clean glass vials minimizing gas exchange with atmosphere, treated with a mercuric chloride solution (0.04% by volume of a saturated aqueous solution) in order to prevent biological activity, sealed with Teflon cap and stored refrigerated until analyses. Non-dispersive infrared (NDIR) measurements for DIC analysis were performed on a Shimadzu TOC-V CSH analyzer. Samples were introduced into the instrument automatic sampling syringe through a needle tipped Teflon tube. After four or five syringe washes, aliquots of sample were injected into a sparging chamber containing a phosphoric acid (25%) solution. Phosphoric acidification generated CO2 that was carried to the NDIR detector. Standardization was carried out every day using sodium carbonate/bicarbonate. Analysis showed the variation coefficient <1.5%. The reproducibility of the method was between 1.5% and 3%. Particulate organic carbon and nitrogen 250 mL seawater subsamples were filtered through 25 mm Whatman GF/F filters, precombusted at 450 °C for 4 h. The filters were frozen at -20 °C. Before the analysis, the filters were treated with 200 µL 1 N HCl to remove the carbonates (Lorrain et al., 2003) and than dried in oven at 60 °C for 1 h. Before the analysis the filter was folded and inserted in a tin capsule (9x10 mm). Carbon and nitrogen were determined using a CHNO-S elemental analyzer mod. ECS 4010 (Costech, Italy) according to the methods of Pella and Colombo (1973) and Sharp (1974). The analysis was performed by combustion of the sample in oxygen excess at 980°C with Cr2O3 catalyst, and reduction in a column filled with reduced copper wires at 650°C. Anhydrous magnesium perchlorate was used to trap water. The CO2 and N2 were separated in a HayeSepQ divinylbenzene packed column at 70°C, using helium as carrier gas, and measured by a thermal conductivity detector. Acetanilide (Carlo Erba; ≥99.5 %) was used as standard to calibrate the instrument. Filter blanks were analyzed and subtracted. The C and N sample concentrations were expressed as µg C L-1 and µg N L-1. Analyses are in progress. 4.2.3 Preliminary Results Dissolved gases A few preliminary dissolved pCO2 profiles are presented together with the CTD-measured pH values in Figure 4.2. Both the 10 cm averaged values (black line), as well as the discrete values when each Niskin bottle were collected (black circle and dashed black line), are presented for the pH data. Note that the raw pH data are generally too high, however discrete pH analyses on board the ship will be used to correct these values.

R/V Urania, Cruise No. U10/2011, Naples – Naples, 27 July – 1 August 2011 22
Figure 4.2.3-1. Distribution with depth of pCO2 and pH at three stations. The black line refers to the 10cm average CTD data, and the black symbols with the dashed line are the specific CTD data from
when the bottle was triggered. Note the different vertical scales Figure 4.2a, collected at station CTD08, shows a very smooth pCO2 trend with depth that mirrors the measured pH data. In particular values have a minimum around 50 m where there is a pH maximum, then gently increase with depth to attain values on the order of 600 ppm. Figure 4.2b gives the results from station CTD13bis, located in the vicinity of a seepage area that was discovered during the PaCO2 cruise. Here surface pCO2 values are similar to those observed at CTD08, however they increase sharply in the bottom water sample to around 1500 ppm. Considering the discrete pH results one might expect to see even higher pCO2 values for the bottom two samples, however the 10 cm average pH data shows significant inter-fingering, and thus these results will need to be compared to the pH measurements conducted on board the ship. Finally Figure 4.2c gives the results for the station performed within the center of the plateau where shallow water seeps occur. The highest pCO2 result was obtained at this location, reaching 2500 ppm in the sample at 20 m depth. Interestingly the bottom water sample collected only a few meters deeper (at 22.5 m) has a much lower value despite the low CTD-measured pH. Note, however, that the bottom two samples were performed in triplicate (i.e. the Niskin bottle was sampled three separate times, and the resultant 3 vials were analyzed separately), and all three replicates for both samples show a very close distribution. This implies that the observed values cannot be due to analytical issues, but rather may be due to either degassing from the water in the Niskin bottle prior to sampling, or the sampling of a more dilute, inter-fingered water. Major and trace elements None of these laboratory-based analyses have been conducted to date. Dissolved oxygen (Winkler method) The maxima in oxygen concentration and oxygen saturation correspond to the low salinity waters located between 20-25 and 50 m (Figure 4.2-5). On the plateau the oxygen maxima where below the thermocline, the surface water were depleted in oxygen as shown by the undersaturation in the physical section.

R/V Urania, Cruise No. U10/2011, Naples – Naples, 27 July – 1 August 2011 23
Figure 4.2-5 Isopleths of dissolved oxygen concentration (Winkler method) as a function of the depth
along the transect. pH and carbonate system From pHT section it is evident the decrease on the centre of the plateau (station P35, Figure 4.2-6) where the vents are located. The minimum value recorded reached 7.31. It is noteworthy that the acidification effect reaches the surface due to the shallow depth (pHT=7.640). A marked decrease in the bottom waters occurs at station P23. The dissolved inorganic carbon concentrations were higher (up to 39.76 mg C L-1) in the bottom waters on the plateau (station P35) and on station P30 (Figure 4.2.7). Total alkalinity samples were taken at the same depth as for pH and their analysis is underway.
Figure 4.2-6 Isopleths of pHT as a function of the depth along the transect.
Nutrients Among the nutrients mainly phosphates and silicates showed marked variation due to the gas seepage from the vents. The phosphates concentration in surface waters were generally low (<0.03 mol P L-1) whereas silicate were around 1-1.5 mol Si L-1. A high increase in concentration in correspondence with the plateau zone with the hydrothermal vents was observed for phosphates (up to 1.28 mol P L-1, Figure 4.2.8) and silicates (2.84 mol Si L.-1, Figure 4.2.9). Probably the turbulence induced by the seepage of gas bubbles transport upwards the interstitial water enriched in phosphate and silicates.

R/V Urania, Cruise No. U10/2011, Naples – Naples, 27 July – 1 August 2011 24
Figure 4.2-7 Isopleths of dissolved inorganic carbon (DIC) as a function of the depth along the
transect.
Figure 4.2-8. Isopleths of phosphates as a function of the depth along the transect.
Figure 4.2-9 Isopleths of silicate as a function of the depth along the transect.
4.3 Water Column Biology – CTD Niskin 4.3.1 Introduction and overview of data Biological samples were collected with Niskin bottles in order to analyze prokaryotic communities (standing stocks and assemblage structure) and their activities (degradation and organic matter utilization processes). Experiments were conducted in order to evaluate the relationship between viruses and prokaryotes. Additionally, nanoplankton abundance and biomass were determined. To date, information on the effect of high CO2 concentration on bacterioplankton and virioplankton are limited. Many authors have found that bacterial (sensu prokaryotic) abundances in natural assemblages are scarcely influenced by acidification (Grossart et al., 2006; Allgaier et al., 2008) although its major photoautotrophic fraction (Cyanobacteria) may benefit from additional CO2 (Hutchins et al., 2007). On the
R/V Urania, Cruise No. U10/2011, Naples – Naples, 27 July – 1 August 2011 25
contrary, heterotrophic production (estimated using tritiated leucine incorporation) has been found to be either stimulated (Grossart et al., 2006), or unaffected (Allgaier et al., 2008), or inhibited (Coffin et al., 2004) by CO2-induced pH decrease. An early study on marine bacterioplankton dynamics under elevated pCO2, highlighted that polypeptide and polysaccharide degradation were enhanced at higher CO2 levels (Grossart et al., 2006), being possibly linked to phytoplankton and particle dynamics. More recently Piontek et al. (2010) confirmed the low pH enhanced polysaccharide degradation, attributing this effect to the chemistry of the involved enzymes that would benefit from increased proton concentration in acidified conditions. On the contrary, by using chemical buffer to decrease seawater pH, Yamada and Suzumura (2010) found that acidification (down to pH 5.6) inhibited leucine aminopeptidase and lipase and did not substantially affect beta-glucosidase and phosphatase. Moreover, Tanaka et al. (2008) found little differences in phosphatase activity in samples collected at different pCO2, even though their results suggest a faster phosphate remineralisation at higher carbon dioxide concentration. Cyanobacteria and heterotrophic prokaryotes represent up to 70% of the organic carbon in the photic zone (Fuhrman et al. 1999). Viral lysis of prokaryotes, as their most common hosts in the environment, can short-circuit the microbial loop by releasing dissolved organic matter (DOM), thus reducing prokaryotic carbon production and the energy transfer to higher trophic levels and influencing the overall carbon budget of the oceans (Fuhrman, 1999; Wilhelm and Suttle, 1999). The ecological consequence of viral infection includes profound impacts on microbial population sizes and biodiversity, horizontal transfer of genetic materials and cycle of organic matter (Suttle, 2005). There are only few studies dealing with virus-prokaryote interactions in hydrothermal vent areas (Juniper et al., 1998; Manini et al., 2008; Ortmann and Suttle, 2005; Rochelle-Newall et al., 2004; Wommack et al., 2004), although only the study of Manini et al. (2008) refers to gas vents in a shallow system. The findings generally concur that viral abundances in the proximity of exhalative area are notably reduced with respect to those observed in the site non affected by gas emission, with the exception of what reported by Rochelle-Newall et al. (2004) who found that elevated pCO2 had no effect on total viral abundance. Prangishvilli and Garrett (2004, 2005) found that viruses of acidophilic hyperthermophiles are non-lytic and persist in host cells in a stable state (pseudolysogeny or ‘carrier state’) hypothesizing that such a survival strategy could be beneficial for viruses, helping them to avoid direct exposure to the harsh conditions of the host habitat. The direct effect of CO2 on marine viruses is still largely unknown. Since the assessment of viral and prokaryotic abundances obtained from available studies does not clarify to which extent viral lysis is influenced by pCO2 changes and how does it influence viral dynamics, the experiments were set up in order to estimate the intensity of viral production and decay as factors that determine viral abundance in the given moment. To investigate whether the low abundance of free viruses (observed during our previous study in the area of interest-data not published, and in concert to the findings reported by Manini et al., 2008) could be related to lysogenic life cycle, the experiment aimed to quantify the fraction of lysogenic cells (i.e. the percentage of cells in the prokaryotic community containing an inducible viral genome) were carried out as well.

R/V Urania, Cruise No. U10/2011, Naples – Naples, 27 July – 1 August 2011 26
Biological samples were collected as described in Table 4.3.1.
Table 4.3.1: Biological samples collected in the frame of PaCO2. EEA = exoenzymatic activities, PCP = Prokaryotic C Production, NANO = nanoplankton; MPHYTO = microphytoplankton; MZOO =
microzooplankton; PROK = prokaryotes.
Station Depth
(m) EEA PCP NANO
VIRUS, PROK
MPHYTO- MZOO-PROK
STRUCTURE PROK_VIRUS Experiments
P0 1 X X X X X X X X P0 50 X X X X X X X X
P15 3 X X X X X X X X P15 40 X X X X X X X P15 250 X X X P15 394 X X X X X X P19 3 X X X X X X X X P19 45 X X X X X X P19 69 X X X X X X X X P23 3 X X X X X X X X P23 30 X X X X X X X P23 53 X X X P23 61 X X X X X X X X P25 3 X X X X X X P25 28 X X X X X P25 45 X X X X X X P26 3 X X X X X X X P26 30 X X X X X P26 51 X X X X X X X P30 3 X X X X X X P30 21 X X X X X X P31 3 X X X X X X P31 54 X X X P31 67 X X X X X X P33 3 X X X X X X X P33 40 X X X X X P33 73 X X X X X X X P35 2 X X X X X X X P35 20 X X X P35 23 X X X X X X X X
4.3.2 Methods - Biology 4.3.2.1 Structural and functional parameters Prokaryotic carbon production (PCP) was measured by the incorporation of 3H-leucine (Leu) (Kirchman et al., 1985). Triplicate aliquots (1.7 mL) and two controls killed by the addition of 90 μL 100% trichloracetic acid (TCA) were amended with a 20-nM radiotracer and incubated at the in situ temperature in the dark. Incubations were stopped with TCA (5% final concentration) after 1 h. The extraction with 5% TCA and 80% ethanol was carried out using the microcentrifugation method (Smith and Azam, 1992). Activity in the samples was determined by a β-counter (Packard Tri-Carb 2900TR) after the addition of 1 mL scintillation cocktail (Ultima Gold MV; Packard). Extracellular enzymatic activities (EEA) were assayed using fluorogenic substrate analogues (Hoppe, 1993) derived from 7-amino-4-methyl-coumarin (AMC) and 4-

R/V Urania, Cruise No. U10/2011, Naples – Naples, 27 July – 1 August 2011 27
methyl-umbelliferone (MUF). Leucine aminopeptidase activity was assayed as the hydrolysis rate of leucine-AMC. β-glucosidase, lipase and phosphatase were assayed using MUF-β-D-glucoside, MUF-oleate and MUF-phosphate, respectively. Enzyme activities were expressed in terms of the rate of MUF or AMC production. After evaluation of the saturating concentrations, hydrolysis was measured by incubating 2.5-mL sub-samples with 200-μM MUF-β-D-glucoside, leucine-AMC, 100 μM MUF-oleate and 50 μM MUF-phosphate for 1 h in the dark at in situ temperature. All samples were run in three replicates. Fluorescence increase due to MUF and AMC hydrolysed from the model substrates was measured using a Shimadzu RF-1501 spectrofluorometer (MUF = 365-nm excitation and 455-nm emission; AMC = 380-nm excitation and 440-nm emission). 0.2 m-filtered seawater collected at every experimental pH was used to produce calibration curves (three replicates) by adding standard solutions of MUF and AMC. Triplicate blanks without fluorogenic substrate were used to determine the natural fluorescence increase in the samples not attributable to the tested enzymes. Viruses (V) and prokaryotes (heterotrophs-HP, autotrophs-AP) were fixed with buffered formaldehyde (2% final concentration) and flash frozen in liquid nitrogen (-80°C) according to Patel et al. (2007). Samples for the determination of viral and prokaryotic abundance were processed according to Noble and Fuhrman (1998) within 1 month. Samples were filtered in triplicate (0.5 – 1.5 mL) onto 0.02 m pore-size Al2O3 inorganic membrane filters (Anodisc, Whatman), then stained with SYBR Green I (Molecular Probes) 50X (final concentration) and filters were mounted on a glass slide with antifade solution (50% glycerol, 49% PBS and 1% ascorbic acid) and stored at -20 °C. The enumeration in epifluorescence microscopy under different excitation filter sets for the counts of viruses and prokaryotes are in progress (Figure 4.3.2.1-1). Nanoplankton samples were fixed with buffered formaldehyde (4% final concentration) and were filtered onto black 0.8 μm polycarbonate filters (Nuclepore). Cells were stained on the filter with DAPI (1 μg mL-1 final concentration) and processed as described by Verity et al. (1993). Nanoplankton was enumerated using an Olympus BX50 fluorescence microscope with a 100x oil immersion objective counting at least 100 cells for phototrophs (PNP) and for heterotrophs (HNP). Carbon content was calculated using a conversion factor of 0.14 pg C μm–3 per cell (Lessard, 1991). Microphytoplankton (MPHYTO-) and Microzooplankton (MZOO-) samples were collected and will be processed as described by Fonda Umani et al. (2005). Prokaryotic community structure samples were collected and will be processed as described in Celussi and Cataletto (2007).
Figure 4.3.2.1-1. Viruses and prokaryotes stained with SYBR Green I observed by epifluorescence microscope (Diaplan Leitz) under blue excitation light at 1000 X magnification. Viruses are tiny fluorescent dots. Heterotrophic prokaryotes are the largest and brightest dots .

R/V Urania, Cruise No. U10/2011, Naples – Naples, 27 July – 1 August 2011 28
4.3.2.2. Experiments The estimate of viral production was carried out according to the modified dilution protocol originally proposed by Wilhelm et al. (2002) as described by Karuza et al. (2010). All equipment in direct contact with the samples was treated with HCl (10%), rinsed with deionized water and sterilized by autoclaving. Only precleaned and rinsed silicone tubes were used. For each experiment a volume of 50 mL seawater sample was filtered onto 0.2µm pore-size inorganic membrane filter (Millipore) in order to collect bacterial cells whether the viral particles were allowed to pass through. The retentate (bacterial concentrate) was resuspended in 50 mL of virus-free seawater (0.02 µm-filtered) and shaken for 20 min in order to facilitate removal from the filter. The obtained sample was incubated in transparent polycarbonate vials (50 ml volume) in the dark and in situ temperature. Subsamples (1.7 mL) were taken at 0, 3, 6, 9, 12 and 15 hours incubation time and immediately fixed and stored as described above for viral and prokaryotic abundance determination. From the initial non-manipulated sample an aliquot of 1.7 mL was fixed as described above for the analysis of bacterial abundance in order to define the correction factor for the bacterial loss due to filtration. Viral production rates will be determined by the first order linear regression analysis of triplicate viral abundances versus incubation time. The enumeration of viruses and prokaryotes is in progress. The experiment for the estimate of lysogenic bacterial fraction was carried by use of mitomycin C (Weinbauer and Suttle 1996). Sample (50 mL) was incubated with mitomycin C (1µg mL-1 final concentration) and 3 subsamples (1.7 mL) were taken at 0, 3, 6, 12 and 24 hours incubation time and immediately fixed and stored as described above for viral and prokaryotic abundance determination. Sample (50 mL) without the addition of antibiotics was incubated as a control and subsampled in parallel. Lysogeny will be calculated as the ratio of the number of viruses released per mL of sample h-1 after the addition of mitomycin C (VPmitomycin C) and BS. The % lysogenic prokaryotes (%LP)= (VPmitomycin C)/prokaryotes × 100, where VP has to be estimated during the first 6 h of incubation and the burst size has to be measured for each set of samples. The enumeration of viruses and prokaryotes is in progress. Viral decay will be calculated according to Corinaldesi et al. (2010) in two different ways, both as the maximum decrease in viral abundance observed during the time-course experiment of viral production and from the release of viruses from prokaryotic cells due to the addition of antibiotics (mitomycin C) in the experiment for the estimate of lysogenic bacterial fraction. Prokaryotic mortality will provide an estimate of the net decrease in viral abundance over time-course of the incubation. The experiment for the estimate of burst size (the number of virions liberated per every lytic event) was carried out using streptomycin sulphate (0.3% w/v). Sample (50 mL) was incubated for 1 h at the dark and immediately fixed and stored as described above for viral and prokaryotic abundance determination. Sample (50 mL) without the addition of

R/V Urania, Cruise No. U10/2011, Naples – Naples, 27 July – 1 August 2011 29
antibiotics was incubated as a control and subsampled in parallel. Burst size will be calculated as the increase of viruses respectively to the increase of bacteria. The enumeration of viruses and prokaryotes is in progress. 4.3.3 Preliminary Results
4.3.3.1 Structural and functional parameters The degradation of linear polysaccharides, performed by beta-glucosidase activity was more pronounced in the surface layer and along the water column of station P35 (maximum value = 4.1 nM h-1 measured at st. P23 at surface). All other samples collected at a depth > 20 m showed degradation rates < 2 nM h-1 (Figure 4.3.3.1). The spatial pattern of extracellular dephosphorilation (phosphatase activity) was rather homogeneous along the transect, with the exception of station P35, where the highest degradation rates were measured (up to 31.2 nM h-1). The degradation of polypeptides (leucine aminopeptidase activity) showed a spatial gradient with faster rates at the northern stations (fastest rate = 34.1 nM h-1, station 25 at surface). Degradation rates measured at two sites unaffected by CO2 are reported in Fig 4.3.3.2 (P0) and Figure 4.3.3.3 (P15).
-glucosidase
0.0
0.5
1.0
1.5
2.0
2.5
3.0
3.5
P0
nM
h-1
1m
50m
Phosphatase
9.5
10.0
10.5
11.0
11.5
12.0
12.5
P0
nM
h-1
1m
50mLeu-aminopeptidase
0123456789
P0
nM
h-1
1m
50m
Figure 4.3.3.2 Degradative activities at station P0
Figure 4.3.3.1 Degradtion of polysaccharides (BGLU), phosphorilated molecules (APA) and polypeptides (AMA) along the water column across the main transect.

R/V Urania, Cruise No. U10/2011, Naples – Naples, 27 July – 1 August 2011 30
0
50
100
150
200
250
300
350
400
450
0 5 10 15 20
P 15 (nM h-1)
dep
th (
m)
beta glucosidase Phosphatase Leu-aminopeptidase
Figure 4.3.3.3 Degradative activities along the water column at station P15
Prokaryotic C Production values were higher in bottom samples collected in the southern sector of the transect (MAX = 75.4 ngC L-1 h-1; Fig 4.3.3.4 and 4.3.3.5)
Figure 4.3.3.4 (Left) Prokaryotic C Production (PCP) along the water column across the main
transect and (Right) at station P0.
0
50
100
150
200
250
300
350
400
450
0 10 20 30 40 50
P 15
dep
th (
m)
PCP (ngC L-1 h-1)
Figure 4.3.3.5 Depth profile of Prokaryotic C Production (PCP) at station P0.

R/V Urania, Cruise No. U10/2011, Naples – Naples, 27 July – 1 August 2011 31
Both the phototrophic and heterotrophic fraction of nanoplankton (PNP and HNP) displayed the highest abundances in subsurface layers of the northern sector of the transect, whereas their numbers at the shallowest stations (P35 and P30) were particularly low (Figure 4.3.3.6, 4.3.3.7).
Figure 4.3.3.6 Phototrophic and heterotrophic nanoplankton (PNP and HNP) along the water column
across the main transect.
PNP
340
360
380
400
420
440
460
P15
10
3 ce
ll L
-1
3
40
HNP
56586062646668707274
P15
10
3 ce
ll L
-1
3
40
Figure 4.3.3.7 Phototrophic and heterotrophic nanoplankton (PNP and HNP) at two stations (P0 and
P15) unaffected by CO2 emission.

R/V Urania, Cruise No. U10/2011, Naples – Naples, 27 July – 1 August 2011 32
4.4 Water Column Physics 4.4.1 Introduction and overview of data CTD casts were performed at the primary bubble-seep sites and also at background sites in order to characterize the physical and chemical properties of the water column. A traditional CTD and a MSS90-L microstructure profiler were used to obtain CTD profiles. Water samples at key depths were also obtained using the traditional CTD. CTD (Conductivity-Temperature-Depth) measurements provide the information on water column physical structure (temperature, salinity, density), and other scalar parameters (O2, fluorescence, etc.). CTD data are used to help detecting the principal features of the water column according to which biological and chemical parameters were sampled by means of Niskin bottles. 4.4.2 CTD profiles The ship SBE9 Seabird CTD was the main instrument we used for water column measurements. The SBE9 samples at 24Hz and was equipped with the default sensors (SBE 3/F temperature sensor, SBE 4C conductivity sensor, Digiquartz pressure sensor), standard additions (SBE 43 oxygen sensor, Chelsea Aqua 3 fluorometer, Chelsea/Seatech/Wetlab CStar light transmissometer) and a SBE 18 pH sensor. A General Oceanics rosette sampler with 24 10 L capacity Niskin bottles was employed for water sampling. DGPS NMEA Position data were interfaced directly to the Seabird SBE 11 PLUS acquisition systems. 4.4.3 Preliminary Results - CTD
All the sampling stations where CTD profiles were performed displayed the same general water column features (Figure 4.4.3.1; 4.4.3.2; 4.4.3.3). A thermocline was present between 25 and 50 m depth, separating warmer surface waters (> 25°C) from colder deeper ones (≤ 15°C). At the same depth where the thermocline was detected a low salinity layer was present (< 37.8; >37.5). The surface layer (25 m thick) was indeed characterized by a constant low density (~ 25.5 kg m-3) below which increasing values were recorded proceeding to the seabed.
Figure 4.4.3.1: Water column temperature, salinity and density at 13 stations along the main transect

R/V Urania, Cruise No. U10/2011, Naples – Naples, 27 July – 1 August 2011 33
Figure 4.4.3.2: Water column florescence, oxygen concentration and saturation at 13 stations along
the main transect.
The deep chlorophyll maximum was detected between 50 and 100 m, affecting oxygen concentration which steeply increased from 200 M in the upper 20 m to ~ 260 M between 25 and 50 m. Oxygen concentration < 210 M were recorded below the DCM. Oxygen oversaturation characterized the low salinity layer (up to 112%), whereas values < 100 % were recorded in the upper 20 m and below 75 m.

R/V Urania, Cruise No. U10/2011, Naples – Naples, 27 July – 1 August 2011 34
Figure 4.4.3.3: Depth profiles of temperature, salinity, density, fluorescence, oxygen concentration and saturation at stations P0 and P15. y-axis is in logaritmic scale.
4.4.4 High-Resolution Microstructure CTD Microstructure profilers are specialized physical oceanographic tools that are capable of measuring high-resolution (cm to mm scale, depending on the sensors) profiles of the water column. A MSS90-L microstructure profiler (Sea & Sun, Trappenkamp, Germany) was loosely tethered to the R/V Urania workboat Plutone and profiling was performed on July 30, 2011 (Figure 4.4.4-1). The profiler was equipped with one shear sensor (for turbulence measurements), a fast temperature sensor and standard CTD sensors, an Oxyguard oxygen sensor and a Seapoint turbidity sensor. To further investigate oxygen dynamics, the MSS was equipped with a fast oxygen sensor system (developed by IFM GEOMAR) capable of resolving fine structures of oxygen at cm scale. Such resolution is not currently achievable with the standard oxygen sensors at the MSS profiling speed of 0.5-0.6 m s-1. The high-resolution MSS data will be utilized to quantify vertical transport of solutes via the vertical eddy diffusion coefficient which is derived from turbulence. Flux estimations can be carried out using the gradient method in which concentration gradients (primarily from the fast oxygen sensor for this study) are multiplied by the vertical eddy diffusion coefficient.

R/V Urania, Cruise No. U10/2011, Naples – Naples, 27 July – 1 August 2011 35
Figure 4.4.4-1. R/V Urania cruise members with the MSS profiler.
4.4.5 Preliminary Results Approximately 140 profiles were obtained in the vicinity of the Bottaro bubble-seep site (Figure 4.4.5-1). A linear transect through the seep site as well as focused profiling directly in the bubble plume were performed. Preliminary results indicate that oxygen was decreased in the bubble plume which could be a result of gas stripping by CO2 and/or methane in this region (McGinnis et al., 2011a; Figure 4.4.5-2). Temperature was observed to increase and enhanced variation in salinity was also observed within the bubble plume and also downstream at the end of the linear transect (Figure 4.4.5-2b-d). Close correlation between temperature and salinity is also observed, with evidence of some sort of inflow within the bubble site (Figure 4.4.5-2b).
Transect start
Transect end
Bottarobubble site
Eddy site
Figure 4.4.5-1 Locations of MSS profile and eddy deployment sites.

R/V Urania, Cruise No. U10/2011, Naples – Naples, 27 July – 1 August 2011 36
Figure 4.4.5-2 Preliminary oxygen, temperature, and salinity profiles from MSS profiling. Data
shown from start of transect (a; upstream from the bubble site), within the bubble plume (b-c), and at the end of the transect (d; downstream from the bubble site). Profile numbers correspond to site
locations in Figure 4.4.5-2. Oxygen given in count (not yet calibrated).
4.5 Sea-Atmosphere CO2 Exchange (“Equilibrator”) 4.5.1 Introduction and overview of data For continuous measurement of CO2 and CH4 of the surface water, an equilibrator system was installed on R/V Urania (Figure 4.5.1-1). The analytical setup consists of a methane and carbon dioxide analyzer (MCA, Los Gatos Research) connected to a gas-seawater equilibration system. The analyzer uses off-axis integrated cavity output spectroscopy (ICOS) and combines a highly specific infrared band laser with a set of strongly reflecting mirrors to obtain an effective laser path length of several kilometers. This allows detecting methane and carbon dioxide concentrations in the equilibrated gas phase with a precision better than 0.1% at high probing frequency. A complete description of the system can be found in Gülzow et al. (2011). Initially, the onboard seawater pump was used to supply the equilibrator with seawater. However, during the transit to Panarea, methane concentrations of 100 ppm and higher were measured, indicating contamination due to microbial activity in the onboard supply unit. To avoid this problem, the onboard seawater supply was exchanged for an external pump. At first, the pump was attached to a cable and a depressor in front of the CTD at 3.1 m water depth. For handling convenience and safety it was later mounted onto the pole fixed alongside the vessel at 3.3 m water depth (Figure 4.1.4-1). An air tube supplied uncontaminated air from the upper deck of the vessel to the analyzer. Interferences of the
Figure 4.5.1-1: IOW Equilibrator setup installed in the wet lab of R/V Urania.

R/V Urania, Cruise No. U10/2011, Naples – Naples, 27 July – 1 August 2011 37
operating pump with hydroacoustic measurements were not detected. All temperature effects between in-situ and ambient laboratory temperatures were accounted for by continuously measuring temperatures in the lab using a calibrated (precision 0.02° C) sensor and with R/V Urania’s thermosalinograph system. Unfortunately, the data acquisition of the equilibrator system does not support GPS integration yet. Thus, merging CO2 and CH4 data to ship positions requires post processing using UTC time stamps. 4.5.2 Preliminary Results Equilibrator transects were conducted north of, south of, and on a circular path around the plateau to obtain a representative set of sea surface CH4 and CO2 concentrations of the area (Figure 4.5.2-1). Both CH4 and CO2 seem to be valuable tracers of the gas plumes emitted at Panarea. Figure 4.5.2-2 shows the time series of the data gathered during the cruise including far-field and near-field measurements. Local background concentrations of CO2 and CH4 were determined to 380 ppm and 2.5 ppm, respectively. In the near field of the plateau CO2 and CH4 concentrations reach maximum values (>800 ppm, 8 ppm respectively), exceeding local background concentrations by factors of 2 and 4, respectively. However, elevated CO2 and CH4 signals were also measured in the far field several miles away from the plateau. Future georeferencing of the equilibrator data will clarify if those concentration anomalies relate to local currents and belong to the surface plume of the near field, or if they are directly caused by seeps off the plateau discovered during this cruise.
0.2 0.4 0.6 0.8 1 1.2 1.4 1.6 1.8 2
x 105
0
2
4
6
8
10
CH
4 [pp
m]
0.2 0.4 0.6 0.8 1 1.2 1.4 1.6 1.8 2
x 105
300
400
500
600
700
800
CO
2 [pp
m]
07/29/1104:03
07/31/1114:04
Figure 4.5.2-2: 3-day time series of a continuous measurement of CO2 and CH4 concentrations.
Spikes indicate calibration with a gas standard (dry air, 380ppm CO2, 2.0 ppm methane)
Figure 4.5.2-1: The orange polygon shows one equilibrator track

R/V Urania, Cruise No. U10/2011, Naples – Naples, 27 July – 1 August 2011 38
Figure 4.5.2-3: Subplot of Figure 4.5.2-2 resolving individual signals.
Methane, which is known to be released at Panarea at a low mole fraction, seems to be an excellent tracer for gas exhalations around Panarea. However, CH4 has an approximately 5-fold lower equilibration and response time within the equilibrator (Gülzow et al., 2011) than CO2. This reduces the spatial and temporal resolution of the methane time series measurements. Thus, the CH4 data plots like a low-pass filtered time series of the CO2 peaks, resulting in a smoothed signal (Figure 4.5.2-3). 4.6 ROV dives and results 4.6.1 Methodology Two dives were conducted using the R/V Urania’s ROV, a Geitaliana Pollux Tre. The first dive was used to visually confirm the safe and correct deployment of the POZ lander (see below) in the shallow waters of the sub-sea plateau. The second dive was performed in deeper waters (>80m) to the NW of the plateau, in the region of one of the newly discovered seep areas. The goal of this second dive was to visually confirm the presence of the bubble flares defined with the hydroacoustic surveys (see above) and to sample the gas bubbles themselves for chemical analyses.
Figure 4.6-1. Pollux Tre ROV on board the R/V Urania

R/V Urania, Cruise No. U10/2011, Naples – Naples, 27 July – 1 August 2011 39
The capture of the bubbles was affected as follows. A 40 ml, amber VOA glass vial (filled with water and capped with a screw-top cap) was strapped upside down to the mechanical arm of the ROV on board the ship. Once the ROV was lowered into the sea, the cap was removed and the decent was begun. After searching for a period, a small bubbling point was located and the ROV was positioned such that the bubbles slowly displaced the water and filled the vial. The ROV was then returned to surface and the cap replaced on the vial while it was still in the water. Once on board, all the gas was removed with a 60 mL syringe by displacing it with injected seawater. This gas was then transferred into a 25 mL, stainless-steel canister for storage. Preliminary gas chromatograph analyses were conducted on board the ship (Figure 4.2-1b) to determine the bulk chemical composition. 4.6.2 Results Two analyses were conducted of the collected gas bubble sample, one pure and one diluted 1:50. The results indicate that this gas is composed of >97% CO2 and > 1000 ppm CH4, values which are similar to the composition of the gas bubbling from the known shallow water seepage areas located on the sub-sea plateau. This data will be important for interpreting the hydroacoustic results for this region and for eventual numerical modeling of the bubble flares. 4.7 POZ Lander deployment 4.7.1 Methodology The POZ-Lander (Figure 4.7.1-1) is a low-profile, autonomously deployed lander equipped with a 300 kHz ADCP (Acoustic Doppler Current Profiler) and a RBR storage CTD. The lander is designed to be autonomously deployed and free-falls into position on the sea floor. The lander is retrieved by sending an acoustic command to the releaser, which then drops the bottom-weight and allows the lander to rise to the sea surface for recovery. In addition to the above instrumentation, we also installed the Uni. Rome’s CO2 sensor (data not shown). The lander was deployed within the Plateau and began recording at 12:00 on 28 July and was recovered 07:20 on 31 July (UTC) at ~23 meters depth. 4.7.2 Results ADCP: The ADCP measures velocity in the x, y and z direction. Data were obtained at a rate of 1 profile every 15 minutes. The vertical resolution of the profiles was every 0.5 meters (Figure 4.7.2-1). Results show oscillatory flow. The water level changes by about +/- 20 cm (data not shown), however the full period ranges from 11 – 13 hours. Current speeds range up to about 25 cm/s and are predominantly in the North-South direction. Note that in Figure 4.7.2-1 that the currents remained rather low in the bottom few meters. We suspect that this is due to geographic features of the plateau.
Figure 4.7.1-1. POZ-Lander with ADCP, CO2 sensor and CTD.

R/V Urania, Cruise No. U10/2011, Naples – Naples, 27 July – 1 August 2011 40
Figure 4.7.2-1. POZ lander ADCP results. Top – current direction, Bottom – current speed. 4.8 Eddy Correlation Measurements 4.8.1 Methodology The Eddy Correlation (EC) technique has been used for over 50 years to measure constituent fluxes in the atmosphere (Lee et al. 2004) and is becoming a more routine and established measure of turbulent benthic fluxes at the sediment-water interface in the BBL of lakes and oceans (McGinnis et al. 2011). However, it is still a relatively new approach in aquatic systems, which was first implemented by Berg et al. (2003) to determine DO fluxes in coastal environments. One advantage of the EC technique over i.e. benthic chambers and in-situ microprofilers, is the potential to record undisturbed fluxes with high temporal resolution and the ability to deploy it where these other methods are not possible (Glud et al. 2010).
Figure 4.8.1-1. Eddy correlation instrument. Right, fast temperature and O2 Clark electrode.
The Eddy correlation device shown (Figure 4.8.1-1) was developed at IFM-Geomar (McGinnis et al. 2011) and the temperature addition was developed within the context of IFM-GEOMAR CLUSTER PROPOSAL. The concept of the eddy correlation is quite simple, in that by measuring and correlating the vertical velocity fluctuations w’, with the fluctuations of the constituents (DO, T) C’, the instantaneous exchange flux can be

R/V Urania, Cruise No. U10/2011, Naples – Naples, 27 July – 1 August 2011 41
calculated in a straight-forward manner. Its average yields the net flux directed towards (consumption; heat loss) or away from (production; heat gain) of the sediment. The instrumentation includes a NORTEK Vector ADV (Acoustic Doppler Velocity meter), a fast response O2 electrode (response time <0.3 seconds) and an FP07 temperature sensor (response time <10 ms). 4.8.2 Results The Heat and Oxygen Flux Eddy was deployed at the bubble-site Bottaro from 29 July at 13:15 to 31 July at 06:40 (UTC) (Figure 4.8.2-1). To our knowledge, this was the first time this device was used in a bubble field. Because of the difficulties presented by the bubbles passing the measurement volume, as well as the oxygen sensor, extra processing steps will be necessary to filter these data and to ensure accurate fluxes. This is evident by both the extremely high oxygen fluxes shown on Figure 4.8.2-1 and by their drastic swing (from around -150 to +150 mmol/m2/day), despite the relatively low flow velocities. We suspect most of the oxygen consumption (negative) may be a result of the CO2 bubbles stripping oxygen (See e.g. McGinnis et al. 2011a) and/or highly reduced substance released from the sediment, however caution should be used in interpreting these flux values as the results are preliminary and the final oxygen sensor calibration check still must be performed.
0.5 1.0 1.5 2.0 2.5
-150
-100
-50
0
50
100
150
Flu
x (m
mol
/m2 /d
)
0 1 2-4
-3
-2
-1
0
1
2
3
Vel
ocity
(cm
/s)
Time (hours)
X-VEL Y-VEL Z-VEL
Figure 4.8.2-1. Eddy in the bubble field.
5 Summary of student and CERTH participation Eurofleet’s encourages the training of students (pre-PhD level) and also provides vessel access to Institutes who lack such ocean-going infrastructure, or those who normally conduct science on land. We were pleased that four student helpers as well as two participants from CERTH joined the PaCO2 project and participated in the cruise – we are very grateful for their help. The following is a summary of their activity aboard R/V Urania. CERTH The Centre for Research and Technology Hellas/Institute for Solid Fuels Technology and Application (CERTH/ISFTA) is the main Greek R&D organization in the field of clean coal and CCS technologies. CERTH/ISFTA is an active partner in the RISCS project, assessing the impact of an onshore CO2 natural analogue in northern Greece.

R/V Urania, Cruise No. U10/2011, Naples – Naples, 27 July – 1 August 2011 42
CERTH/ISFTA was represented in the oceanographic survey PACO2 by Mrs. Vassiliki Gemeni and Mrs. Fotini Ziogou. Mrs. Vassiliki Gemeni has a master in Applied Environmental Geology and the last three years she is working as and scientific researcher in CERTH/ISFTA involved mainly in CCS R&D projects. Her recent scientific activities include on going European projects such as FP7 RISCS (“Research into Impacts and Safety in CO2 Storage”) and UCG-CO2. Mrs. Fotini Ziogou is a Chemical Engineering and holds a Master’s Degree in Business Administration. She has a long experience record as she has been working for 7 years in the French multinational company AIR LIQUIDE HELLAS as a Production Engineer of air and CO2 liquefaction plants in North Greece and supervising engineer at the Florina natural CO2 deposits for the commercial exploitation of CO2 as an industrial gas. Since 2006 she works for CERTH/ISFTA as a Scientific co-operator implementing European and national R&D projects dealing with CCS technologies (ENCAP, FENCO - ERA.NET, Greece-Czech and Greece-USA bilateral projects etc.). Other on going project that is within her activities is the FP7 RISCS project. During the project’s ship-time Mrs. Vassiliki Gemeni was involved in the preparation of the collected water column samples from Panarea seepage site and the relevant chemical analyses (ph, temperature etc.). Mrs. Fotini Ziogou supported OGS’s activities related to the processing and elaboration of biological (archaea, bacteria, and virus) analyses of the recovered water samples in order to study the ecosystem impact of the CO2 vents. In addition, she has participated in the benthic chamber experiments by Zodiac performed by IFM-GEOMAR. Silvia Colella My name is Silvia Colella and I have almost finished my Master Degree in “Geodynamics, Geophysics and Volcanology” at the Department of Earth Sciences of the University of Rome “Sapienza” and I have already a Bachelor Degree in Geosciences at the same university. I had never been on an oceanographic ship till that opportunity. In this moment I am doing my traineeship at Netherlands Organization for Applied Scientific Research TNO of Utrecht, working about my thesis project. For the next 7 months I will work for this company and I am glad to collaborate on the research project about the geophysical exploration and basin modeling of Arabian Plate. In particular the objective of my research is to calculate the gravity model of the area and the basal heat flow with the use of gravity data from ESA satellite (GOCE). My studies are oriented mainly towards geophysics and it was really instructive for me participate at regional acoustic/seismic survey aboard R/V Urania. The oceanographic campaign was a wonderful experience in my academic career because I obtained shipboard training and gained experience at sea also in the other topics (like Geology, Chemistry, Physics and Biology). Even the theme of the campaign made me so delighted. Nowadays I think that the Carbon Capture and Storage (CCS) is one of the most important theme in the research field because is an important technique to mitigate anthropogenic effects on global climate, by isolating CO2 in deep geological formations.

R/V Urania, Cruise No. U10/2011, Naples – Naples, 27 July – 1 August 2011 43
I was very pleased to spend the working days aboard with an international and interdisciplinary contingent of scientists that satisfied all my curiosities. Especially I worked with Cinzia Comici (Geologist from OGS) and Valerio Marinelli (Physics student from Rome) to recover water samples using R/V Urania’s tender Plutone. Within the scope of the RISCS project, we conducted a transect consisting of 7 stations across the main seepage field. We measured a CTD profile and collected samples with a Niskin Bottle where the depth of the water does not allow to sample from the ship. During the cruise I often collaborated in the systematic sampling with a 24-bottle rosette. Further I wondered in seeing novel instruments. On board in fact, I could see all the instrumentations utilized and in particular I went on the R/V Urania’s tender with Lee Davis Bryant (Civil Engineer from Duke Uni.) and Elisa Fierro (Geology student from Rome) to test the Sea & Sun MSS28 microstructure profiler. In my opinion the direct experience, hands-on practice and workshop are really necessary for my professional qualification. In addition I believe that working with a qualified team of high level enriches each student in his/her personal growth. Not only was the work done aboard important for me but also the opportunity to meet very friendly and helpful scientists that made this cruise so amazing. The work plans were excellent and allows us students to follow every research. In this way we could learn enough about every sampling and measurements. In few days I felt to have improved significantly my knowledge. I would like to thanks everybody and I really hope to sail with you again soon. Elisa Fierro Age: 27 City of birth: Rome Educations: High school diploma specializing in classical studies (2003) Three-year degree in Geological Sciences at the Sapienza University of Rome, with a thesis entitled “Rielaborazione dei dati di fratturazione della Maiolica nel versante sinistro dell’anticlinale di Burano (PU)” [Data processing of majolica’s fracturing on the left slope of the Burano anticline (PU)] (2010). Currently enrolled in the first year of the Laurea specialistica (second level Italian degree) in Geology of Exploration, within the Course “Oil Exploration”. Examinations taken: Structural Geology of brittle, Seismic Interpretation and 3D modeling, Log Analysis Future Prospects: I hope to complete my studies within two years, and then to put into practice the knowledge I gained in the geophysical-explorative area by working for Research Institutions and/or private companies, in Italy or abroad. I would indeed be very interested in taking an internship abroad, also in order to improve my English. Cruise Activities: I had the chance to take part in the oceanographic campaign thanks to Dr. Beaubien, who was looking for students interested in this kind of experience and willing to learn; furthermore, my degree program requires an internship with a Research Institution. Thus, I took advantage of this opportunity, thanks to the agreement between

R/V Urania, Cruise No. U10/2011, Naples – Naples, 27 July – 1 August 2011 44
my University and the OGS of Trieste, which is basically the Institution I worked for on the ship. I performed interdisciplinary activities, from sampling to laboratory work: - My job was mainly focused on sampling on board of R/V Urania, needed to determine chemical-biological parameters, using the rosette sampler. Therefore, I didn’t carry out the sampling for the RISCS project, which was performed by three other students. - In the laboratory, I learned to use some tools for the chemical analysis of samples, such as the pH-meter and the titrator, needed to measure, respectively, the pH and the quantity of oxygen in sea waters. I also had the chance to observe the operations of sample filtering and fixation of filtrate using formalin, when an analysis on organic compounds was performed. - Together with Dr. Lee Davis Bryant and my colleague Silvia Colella, we used on board of tender “Plutone” a new generation tool, the “Microstructure Profiler”, which, when cast into the water, can provide high resolution physical measures. We thus verified its effectiveness. - I also took an interest in the area of geophysical researches, performed by the researchers of the University of Kiel and the IFM- GEOMAR using Multibeam system: I observed the operations of acquisition and elaboration of data, trying and finding a connection with my theoretical knowledge on the subject. My Impressions: This oceanographic campaign was my first scientific experience, and I can consider myself satisfied in many ways: it was indeed an excellent didactic tool for students like us, and allowed us to interact with international technical and scientific professionals. I had the chance to observe the practical use of some tools I have studied, and also to get to know the functioning of new tools. I would have liked to take a more active role in the geophysical researches, in order to better integrate theory and practice, and for a personal interest of mine as well. I thank the scientific staff for their kindness and for giving me the opportunity to actively participate in their research activities, and I hope I will have the chance to have more similar experiences in the future. Valerio Marinelli My name is Valerio Marinelli, I am studying Physics at “Roma Tre” University in Rome, specializing in Geophysics. In May 2007 I achieved my bachelor's degree in Physics with a thesis in Applied Geophysics, “Misure di migrazione di inquinanti organici in falda con tecniche elettromagnetiche” (Measures of migration of organic pollutants in ground water with electromagnetic techniques). During these years I've been studying and working several times with electromagnetic instruments for geophysical surveys, such as GPR (Ground Penetrating Radar) and TDR (Time Domain Reflectometry). An extremely interesting task that both instruments can perform, is that they let us understand (almost qualitatively) in which way water is interacting with the soil, physically and (in part) chemically, and if there's some sign of pollution.
R/V Urania, Cruise No. U10/2011, Naples – Naples, 27 July – 1 August 2011 45
This theme in my opinion is fundamental for the present and the future of Humanity, since we will have to learn how to live, as best as we can, despite the scarcity of uncontaminated water; this, always in respect of the sea environment too, as it represents the very heart and stomach of Earth. In this context, I had the opportunity, together with Elisa Fierro, Silvia Colella, Federica Nasi, to participate in PACO2 Oceanographic Campaign: it was an absolutely unique experience for me to learn new methodologies, new techniques, new ways to evaluate human impact on environment. Moreover: it was the first time ever I've been on a research vessel. In particular, I have been involved in collecting water samples and in acquiring chemical and physical data from the sea water near Panarea (Aeolian Isles), using different kinds of instrumentation. Water sampling for RISCS project: During the cruise, I had the possibility to work with OGS scientists for two different projects that required the gathering water samples: RISCS and ECO2. The first one was the most intensive for me, both in terms of handiwork and of personal gratification, as I manually deployed a twenty-kilos-weight CTD profiler and some Niskin bottles for each of the seven stations planned for the RISCS “transect”. So special thanks to Dr. Cinzia Comici for her kindness and patience while I was learning to operate correctly. CTD is an instrument carrying various probes, principally an electrical Conductivity meter, a Thermometer and a pressure meter (to obtain Depth), plus auxiliary sensors to measure other parameters (such as pH, dissolved oxygen, etc.). Data are directly collected by a PC and the scientist can control the acquisition and take a first look at the physical and chemical properties of the water column. This operation, apparently short and simple, is actually long and demanding. After completing the preliminary profiling of the entire water column (till the bottom), the further step is the sampling: Niskin bottles can contain about five liters of water; since all this operation was done on “Plutone”, the small R/V Urania's tender, small samples were extracted to be analyzed later with laboratory instruments No doubt that the most amazing (and challenging) part is preparing (“arming”) Niskin bottles, as you have to be accurate and careful, if you want the bottle to close at the required depth! ECO2 project: sampling and analysis: For the project ECO2 we students helped both in extracting samples from Niskin bottles mounted on a 24-bottles carousel structure (“rosette”) and in some first biological and chemical analysis on those samples. Dr. Cinzia De Vittor taught me how to use an automatic titrator, that I used together with Elisa Fierro to estimate dissolved oxygen in water samples acquired from the benthic chambers, and I've learned that a pH-meter is maybe one of the fastest and amusing

R/V Urania, Cruise No. U10/2011, Naples – Naples, 27 July – 1 August 2011 46
(really??) instruments one can aspire to use in chemical analysis, during an oceanographic campaign. Nevertheless this instrument is quite interesting: its functioning is very similar to an electrical conductivity meter (that I already used in the past), as in both instruments a probe measures a differential of electric potential within two electrodes, immersed in the liquid sample. Catching gas seeps: microstructure profiling: One of the most “tech-advanced” tools that IFM-Geomar people brought aboard the ship was a microstructure profiler (MSS): it not only represents an evolution of a CTD, as it permits to acquire high resolution vertical profiles, but carries on also other types of probes, whose final goal is to evaluate the turbulence in the water column. A useful indicator of a gas leakage from a CCS site could be just the presence of eddy currents around the area of emission. Dr. Lee Bryant, in her second exit with the R/V Urania's tender “Plutone”, with the help of Dr. Fotini Ziogou and myself, deployed the MSS on several points around one of the most active and shallowest gas seeps. Initially we had some difficulties to find a correct position above the main bubble plume, as the superficial current would take us far away. After a correct repositioning, we were able to acquire many profiles along a path (“transect”) that crossed one of the CO2 emission spots. Microstructure profiler is better than a CTD also under the aspect of the deployment: its buoyancy can be adjusted just adding or removing floating strips, so that one can leave the probe at constant rate free-fall. Final Considerations: I will never be able to thank much enough who made possible, for me and the others, to live this experience: Dr. Stanley Beaubien, whom I owe so much for all he has done. Furthermore I have to express all my gratitude to OGS' and IFM-Geomar's scientists, as we students learned a lot about physical and biochemical surveys in oceanographic activity. Is maybe there something more that I could aim to do? Maybe I’d like I had a little more time on the ship to follow the most “physical” part of the cruise, that's to say acoustic and seismic surveys, in particular to better comprehend differences and affinities between acoustic/seismic (e.g. chirp, multibeam) and electromagnetic (e.g. GPR) soundings of media. Federica Nasi Past Education: Biology at the University of Modena (Italy) Current Studies: I am studying environmental biology at the University of Trieste and now I'm doing a internship at OGS. Cruise activities: I helped sampling of water, plankton and microzooplankton with CTD/Rosette and I helped sampling with benthic chamber experiment. I have a good impression of the cruise and of the activity because I've never seen scientific instruments like those. I prefer to focus on the sampling of macrozoobenthos, but I was glad to broaden my knowledge.

R/V Urania, Cruise No. U10/2011, Naples – Naples, 27 July – 1 August 2011 47
6 Data and Sample Storage /Availability The data storage and availability follows the policy of ECO2 – Sub-seabed CO2 Storage: Impact on Marine Ecosytems (“ECO2 is a Collaborative Project funded under the European Commission's Framework Seven Programme Topic OCEAN.2010.3 Sub-seabed carbon storage and the marine environment, project number 265847”). The PaCO2 project will thus follow the FP7 regulations regarding the Intellectual Properties Rights of the funded project. The ECO2 database will be used to upload and store all date related to PaCO2. These data will be then archived in and published by the PANGAEA data library operated by the Alfred-Wegener-Institute in Bremerhaven, Germany. This system provides free and open access as a partnership approach within the ECO2 consortium. As per EU data policy, these data will be made public two years after the termination of ECO2. The above information was summarized from “Data management plan and policy”. See http://www.eco2-project.eu/deliverables-and-publications.html for more information. 7 Participants In addition to an international and interdisciplinary contingent of scientists, it was with our great pleasure to welcome on board 4 Master’s level students who obtained shipboard training and gained experience at sea. All below personnel were on board for the duration of the cruise (27 July – 8 August 2011).
Name Sex Nationality Competence Function Institute
1 Daniel McGinnis M USA Physical Oceanography
Chief Scientist/ Physics
IFM‐GEOMAR
2 Sergiy Cherednichenko
M UKRAINE Electrical Engineer
Technical support
IFM‐GEOMAR
3 Peter Feldens M GERMAN Geologist Acoustics Uni. Kiel
4 Jens Schneider von Deimling
M GERMAN Geologist Acoustics/Gas sampling
IOW
5 Lee Davis Bryant F USA Civil Engineer Microstructure and moorings
DUKE Uni.
6 Nikolaus Bigalke M GERMAN Geologist Acoustics/Gas sampling
IFM‐GEOMAR
7 Fotini Ziogou F Greek Biologist Interdisciplinary measurements
CERTH/ISFTA
8 Vasiliki Gemeni F Greek Biologist Interdisciplinary measurements
CERTH/ISFTA
9 Cinzia De Vittor F Italy Biologist Interdisciplinary measurements
OGS

R/V Urania, Cruise No. U10/2011, Naples – Naples, 27 July – 1 August 2011 48
10 Mauro Celussi M Italy Biologist Interdisciplinary measurements
OGS
11 Cinzia Comici F Italy Geologist Interdisciplinary measurements
OGS
12 Ana Karuza F Italy Biologist Interdisciplinary measurements
OGS
13 Michele Giani M Italy Chemist Interdisciplinary measurements
OGS
14 Federica Nasi F Italy Student Interdisciplinary measurements
OGS
15 Stanley Beaubien
M Canadian Chemist Interdisciplinary measurements
Uni. of Rome
16 Valerio Marinelli M Italy Student Interdisciplinary measurements
Uni. of Rome
17 Elisa Fierro F Italy Student Interdisciplinary measurements
Uni. of Rome
18 Silvia Colella F Italy Student Interdisciplinary measurements
Uni. of Rome
19 Alberto Panti M Italy Geologist Acoustics AGEOTEC S.r.L
CERTH: The Centre for Research and Technology Hellas, Halandri, Greece
DUKE Uni.: Duke University, Durham, North Carolina, USA
IFM-GEOMAR: Leibniz-Institut fur Meereswissenschaften an der Universitat Kiel
(IFM-GEOMAR), Kiel, Germany
IOW: Leibniz-Institut fur Ostseeforschung Warnemunde, Rostock, Germany
OGS: National Institute of Oceanography and Experimental Geophysics, Trieste, Italy
Uni. Kiel: University of Kiel, Kiel, Germany
Uni. of Rome: Università di Roma La Sapienza (URS), Rome, Italy
AGEOTEC S.r.L, Zola Predosa (Bo), Italy www.ageotec.com
8 Station List U10/2011
Sta. No.
Date Time Gear Coordinates Water Depth
Remarks
2011 UTC (oN) (oW) m
P0 28-Jul 1:45 CTD 34:43.1340 15:03.3869 1558 pH sensor not working, repeated CTD at station
P0a 28-Jul 1:45 CTD 34:43.1341 15:03.3870 1558 8 bottles fired from 0-50 m
P1 28-Jul MB, No data, test runs - no
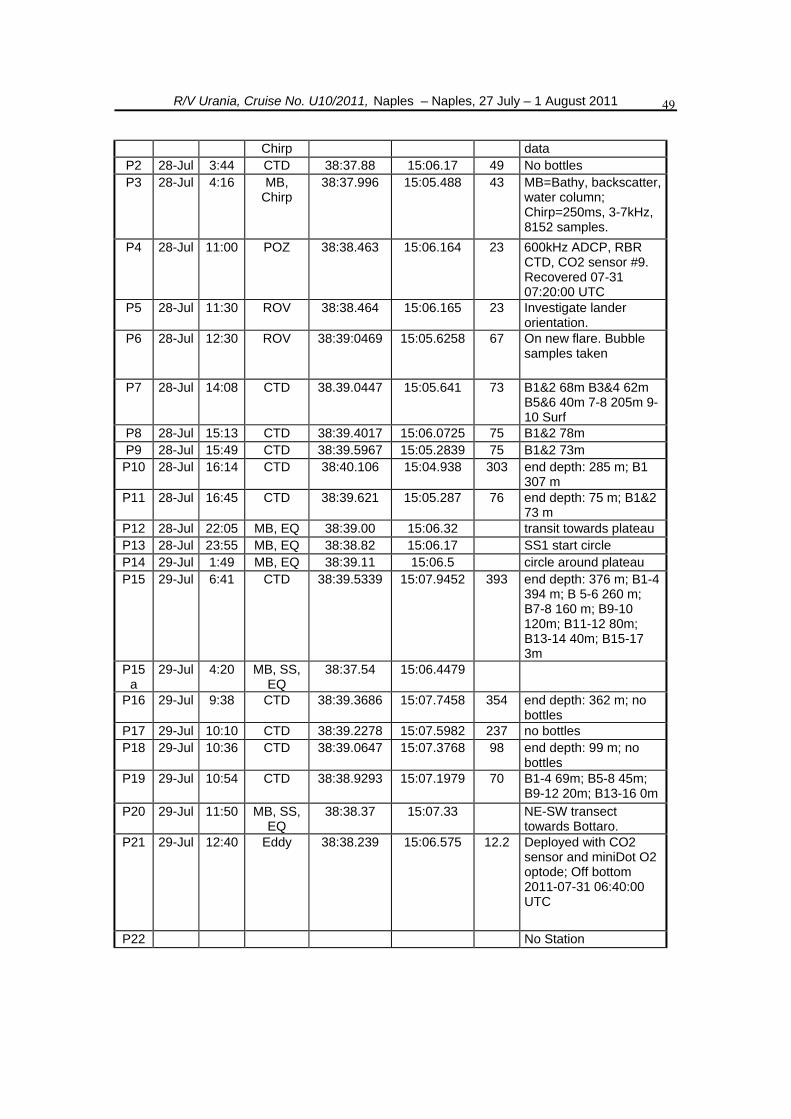
R/V Urania, Cruise No. U10/2011, Naples – Naples, 27 July – 1 August 2011 49
Chirp data P2 28-Jul 3:44 CTD 38:37.88 15:06.17 49 No bottles P3 28-Jul 4:16 MB,
Chirp 38:37.996 15:05.488 43 MB=Bathy, backscatter,
water column; Chirp=250ms, 3-7kHz, 8152 samples.
P4 28-Jul 11:00 POZ 38:38.463 15:06.164 23 600kHz ADCP, RBR CTD, CO2 sensor #9. Recovered 07-31 07:20:00 UTC
P5 28-Jul 11:30 ROV 38:38.464 15:06.165 23 Investigate lander orientation.
P6 28-Jul 12:30 ROV 38:39:0469 15:05.6258 67 On new flare. Bubble samples taken
P7 28-Jul 14:08 CTD 38.39.0447 15:05.641 73 B1&2 68m B3&4 62m B5&6 40m 7-8 205m 9-10 Surf
P8 28-Jul 15:13 CTD 38:39.4017 15:06.0725 75 B1&2 78m P9 28-Jul 15:49 CTD 38:39.5967 15:05.2839 75 B1&2 73m P10 28-Jul 16:14 CTD 38:40.106 15:04.938 303 end depth: 285 m; B1
307 m P11 28-Jul 16:45 CTD 38:39.621 15:05.287 76 end depth: 75 m; B1&2
73 m P12 28-Jul 22:05 MB, EQ 38:39.00 15:06.32 transit towards plateau P13 28-Jul 23:55 MB, EQ 38:38.82 15:06.17 SS1 start circle P14 29-Jul 1:49 MB, EQ 38:39.11 15:06.5 circle around plateau P15 29-Jul 6:41 CTD 38:39.5339 15:07.9452 393 end depth: 376 m; B1-4
394 m; B 5-6 260 m; B7-8 160 m; B9-10 120m; B11-12 80m; B13-14 40m; B15-17 3m
P15a
29-Jul 4:20 MB, SS, EQ
38:37.54 15:06.4479
P16 29-Jul 9:38 CTD 38:39.3686 15:07.7458 354 end depth: 362 m; no bottles
P17 29-Jul 10:10 CTD 38:39.2278 15:07.5982 237 no bottles P18 29-Jul 10:36 CTD 38:39.0647 15:07.3768 98 end depth: 99 m; no
bottles P19 29-Jul 10:54 CTD 38:38.9293 15:07.1979 70 B1-4 69m; B5-8 45m;
B9-12 20m; B13-16 0m P20 29-Jul 11:50 MB, SS,
EQ 38:38.37 15:07.33 NE-SW transect
towards Bottaro. P21 29-Jul 12:40 Eddy 38:38.239 15:06.575 12.2 Deployed with CO2
sensor and miniDot O2 optode; Off bottom 2011-07-31 06:40:00 UTC
P22 No Station

R/V Urania, Cruise No. U10/2011, Naples – Naples, 27 July – 1 August 2011 50
P23 29-Jul 16:18 CTD 38:38.7553 15:07.683 60 B1-4 61m; B5-8 53m; B9-12 30m; B12-16 3m
P24 29-Jul 16:45 MB, SS, EQ
38:38.59 15:07.19 64
P25 29-Jul 18:51 CTD 38:38.6069 15:06.9384 51 B1-4 45m; B5-8 28m; B9-12 3m
P26 29-Jul 21:09 CTD 38:37.84 15:08.0222 53 B1-4 51m; B5-8 30m; B9-12 3m
P27 29-Jul 22:30 CTD 38:39.341 15:05.624 58 No bottles P28 29-Jul 21:50 MB, SS,
EQ 38:39.3451 15:05.4650 MB03 a/b. R2SONIC +
Konsberg 500ms.
P29 30-Jul 3:56 MB, SS, EQ
38.39.575 15:09.722 800 far-field equi transect north of Bariluzzo. New seep field found.
P30 30-Jul 8:09 CTD 38:38.492 15:06.7064 26 B1-4 21m; B 5-8 12m; B9-12 3m: on new seep field #2 (red box)
P31 30-Jul 8:55 MB, EQ 38:38.1274 15:06.2220 19 P31
a 30-Jul 9:48 CTD 38:37.6806 15:05.7644 71 B 1-4 67m; B5-8 54 m;
B9-12 3m P32 30-Jul 13:00 ROV ROV malfunctioned P33 30-Jul 13:13 CTD 38:37.284 15:05.2453 77 B1-4 73m; B5-8 60m;
B9-12 3m P34 30-Jul 14:30 mini CTD 38:38.34 15:06.28 24 P35 30-Jul 15:42 CTD 38:38.34 15:06.28 26 B 1-4 23m; B5-8 20 m;
B9-12 17m; B13-16 3m WB1 30-Jul 13:30 MSS 38:37.896 15:06.892 15 -
35 practice session with MSS buoyancy at Bottaro - see supplement for coordinates
WB2 31-Jul 7:00 MSS 38:38.171 15:06.633 15 - 30
transect waypoints 150 thru 326 - Bubble plume microstructure transect in Bottaro - see supplement for coordinates
Supplemental Station List U10/2011: Microstructure CTD (MSS) from Plutone Station
No. Date Time Instrument Coordinates GPS
Designation
3-Jul UTC (oN) (oW) m
MSS1 30-Jul-11 14:26:50 MSS N38.63660 E015.10925 146 MSS2 30-Jul-11 14:49:18 MSS N38.63394 E015.11107 147 MSS3 30-Jul-11 14:49:31 MSS N38.63393 E015.11112 148 MSS4 30-Jul-11 14:54:56 MSS N38.63342 E015.11192 150 MSS5 30-Jul-11 15:03:02 MSS N38.63231 E015.11374 151 MSS6 30-Jul-11 15:03:24 MSS N38.63226 E015.11383 152 MSS7 30-Jul-11 15:05:51 MSS N38.63197 E015.11434 153
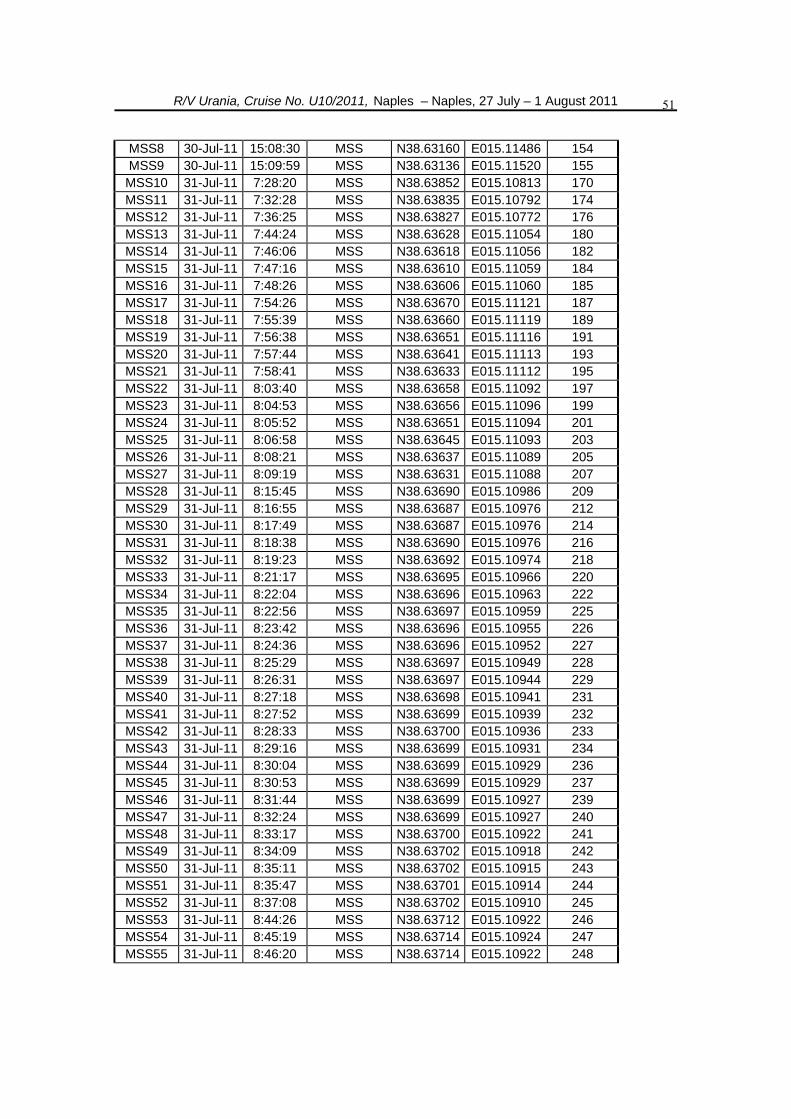
R/V Urania, Cruise No. U10/2011, Naples – Naples, 27 July – 1 August 2011 51
MSS8 30-Jul-11 15:08:30 MSS N38.63160 E015.11486 154 MSS9 30-Jul-11 15:09:59 MSS N38.63136 E015.11520 155 MSS10 31-Jul-11 7:28:20 MSS N38.63852 E015.10813 170 MSS11 31-Jul-11 7:32:28 MSS N38.63835 E015.10792 174 MSS12 31-Jul-11 7:36:25 MSS N38.63827 E015.10772 176 MSS13 31-Jul-11 7:44:24 MSS N38.63628 E015.11054 180 MSS14 31-Jul-11 7:46:06 MSS N38.63618 E015.11056 182 MSS15 31-Jul-11 7:47:16 MSS N38.63610 E015.11059 184 MSS16 31-Jul-11 7:48:26 MSS N38.63606 E015.11060 185 MSS17 31-Jul-11 7:54:26 MSS N38.63670 E015.11121 187 MSS18 31-Jul-11 7:55:39 MSS N38.63660 E015.11119 189 MSS19 31-Jul-11 7:56:38 MSS N38.63651 E015.11116 191 MSS20 31-Jul-11 7:57:44 MSS N38.63641 E015.11113 193 MSS21 31-Jul-11 7:58:41 MSS N38.63633 E015.11112 195 MSS22 31-Jul-11 8:03:40 MSS N38.63658 E015.11092 197 MSS23 31-Jul-11 8:04:53 MSS N38.63656 E015.11096 199 MSS24 31-Jul-11 8:05:52 MSS N38.63651 E015.11094 201 MSS25 31-Jul-11 8:06:58 MSS N38.63645 E015.11093 203 MSS26 31-Jul-11 8:08:21 MSS N38.63637 E015.11089 205 MSS27 31-Jul-11 8:09:19 MSS N38.63631 E015.11088 207 MSS28 31-Jul-11 8:15:45 MSS N38.63690 E015.10986 209 MSS29 31-Jul-11 8:16:55 MSS N38.63687 E015.10976 212 MSS30 31-Jul-11 8:17:49 MSS N38.63687 E015.10976 214 MSS31 31-Jul-11 8:18:38 MSS N38.63690 E015.10976 216 MSS32 31-Jul-11 8:19:23 MSS N38.63692 E015.10974 218 MSS33 31-Jul-11 8:21:17 MSS N38.63695 E015.10966 220 MSS34 31-Jul-11 8:22:04 MSS N38.63696 E015.10963 222 MSS35 31-Jul-11 8:22:56 MSS N38.63697 E015.10959 225 MSS36 31-Jul-11 8:23:42 MSS N38.63696 E015.10955 226 MSS37 31-Jul-11 8:24:36 MSS N38.63696 E015.10952 227 MSS38 31-Jul-11 8:25:29 MSS N38.63697 E015.10949 228 MSS39 31-Jul-11 8:26:31 MSS N38.63697 E015.10944 229 MSS40 31-Jul-11 8:27:18 MSS N38.63698 E015.10941 231 MSS41 31-Jul-11 8:27:52 MSS N38.63699 E015.10939 232 MSS42 31-Jul-11 8:28:33 MSS N38.63700 E015.10936 233 MSS43 31-Jul-11 8:29:16 MSS N38.63699 E015.10931 234 MSS44 31-Jul-11 8:30:04 MSS N38.63699 E015.10929 236 MSS45 31-Jul-11 8:30:53 MSS N38.63699 E015.10929 237 MSS46 31-Jul-11 8:31:44 MSS N38.63699 E015.10927 239 MSS47 31-Jul-11 8:32:24 MSS N38.63699 E015.10927 240 MSS48 31-Jul-11 8:33:17 MSS N38.63700 E015.10922 241 MSS49 31-Jul-11 8:34:09 MSS N38.63702 E015.10918 242 MSS50 31-Jul-11 8:35:11 MSS N38.63702 E015.10915 243 MSS51 31-Jul-11 8:35:47 MSS N38.63701 E015.10914 244 MSS52 31-Jul-11 8:37:08 MSS N38.63702 E015.10910 245 MSS53 31-Jul-11 8:44:26 MSS N38.63712 E015.10922 246 MSS54 31-Jul-11 8:45:19 MSS N38.63714 E015.10924 247 MSS55 31-Jul-11 8:46:20 MSS N38.63714 E015.10922 248

R/V Urania, Cruise No. U10/2011, Naples – Naples, 27 July – 1 August 2011 52
MSS56 31-Jul-11 8:47:12 MSS N38.63715 E015.10923 249 MSS57 31-Jul-11 8:48:05 MSS N38.63718 E015.10923 251 MSS58 31-Jul-11 8:48:54 MSS N38.63720 E015.10924 252 MSS59 31-Jul-11 8:49:46 MSS N38.63722 E015.10924 253 MSS60 31-Jul-11 8:50:37 MSS N38.63723 E015.10926 254 MSS61 31-Jul-11 8:51:31 MSS N38.63723 E015.10930 255 MSS62 31-Jul-11 8:52:28 MSS N38.63724 E015.10935 256 MSS63 31-Jul-11 8:53:24 MSS N38.63726 E015.10938 257 MSS64 31-Jul-11 8:54:14 MSS N38.63728 E015.10939 258 MSS65 31-Jul-11 8:55:31 MSS N38.63730 E015.10941 259 MSS66 31-Jul-11 8:59:26 MSS N38.63734 E015.10948 261 MSS67 31-Jul-11 9:00:52 MSS N38.63731 E015.10954 262 MSS68 31-Jul-11 9:04:20 MSS N38.63735 E015.10967 263 MSS69 31-Jul-11 9:05:08 MSS N38.63735 E015.10971 264 MSS70 31-Jul-11 9:06:02 MSS N38.63736 E015.10972 265 MSS71 31-Jul-11 9:08:39 MSS N38.63735 E015.10982 266 MSS72 31-Jul-11 9:09:15 MSS N38.63735 E015.10984 267 MSS73 31-Jul-11 9:09:36 MSS N38.63735 E015.10984 268 MSS74 31-Jul-11 9:11:31 MSS N38.63740 E015.10995 269 MSS75 31-Jul-11 9:14:49 MSS N38.63773 E015.10953 270 MSS76 31-Jul-11 9:15:52 MSS N38.63774 E015.10955 271 MSS77 31-Jul-11 9:16:19 MSS N38.63773 E015.10956 272 MSS78 31-Jul-11 9:17:06 MSS N38.63773 E015.10961 273 MSS79 31-Jul-11 9:18:40 MSS N38.63773 E015.10967 275 MSS80 31-Jul-11 9:19:26 MSS N38.63773 E015.10969 276 MSS81 31-Jul-11 9:25:05 MSS N38.63825 E015.10949 277 MSS82 31-Jul-11 9:25:43 MSS N38.63827 E015.10952 278 MSS83 31-Jul-11 9:26:24 MSS N38.63828 E015.10954 279 MSS84 31-Jul-11 9:27:03 MSS N38.63829 E015.10954 280 MSS85 31-Jul-11 9:27:41 MSS N38.63829 E015.10957 281 MSS86 31-Jul-11 9:28:21 MSS N38.63830 E015.10960 282 MSS87 31-Jul-11 9:32:09 MSS N38.63859 E015.10906 283 MSS88 31-Jul-11 9:33:05 MSS N38.63861 E015.10907 284 MSS89 31-Jul-11 9:33:53 MSS N38.63862 E015.10910 285 MSS90 31-Jul-11 9:34:43 MSS N38.63865 E015.10912 286 MSS91 31-Jul-11 9:35:32 MSS N38.63868 E015.10914 287 MSS92 31-Jul-11 9:37:49 MSS N38.63890 E015.10883 288 MSS93 31-Jul-11 9:38:33 MSS N38.63891 E015.10886 289 MSS94 31-Jul-11 9:39:19 MSS N38.63893 E015.10888 290 MSS95 31-Jul-11 9:40:06 MSS N38.63896 E015.10891 291 MSS96 31-Jul-11 9:41:27 MSS N38.63901 E015.10900 292 MSS97 31-Jul-11 9:42:47 MSS N38.63900 E015.10891 294 MSS98 31-Jul-11 9:44:41 MSS N38.63932 E015.10830 295 MSS99 31-Jul-11 9:45:38 MSS N38.63935 E015.10836 296 MSS100 31-Jul-11 9:46:41 MSS N38.63938 E015.10843 297 MSS101 31-Jul-11 9:47:46 MSS N38.63942 E015.10854 298 MSS102 31-Jul-11 9:48:42 MSS N38.63947 E015.10860 299 MSS103 31-Jul-11 9:54:14 MSS N38.63724 E015.10966 300

R/V Urania, Cruise No. U10/2011, Naples – Naples, 27 July – 1 August 2011 53
MSS104 31-Jul-11 9:57:25 MSS N38.63729 E015.10973 301 MSS105 31-Jul-11 9:58:21 MSS N38.63730 E015.10976 302 MSS106 31-Jul-11 9:59:18 MSS N38.63733 E015.10978 303 MSS107 31-Jul-11 9:59:58 MSS N38.63734 E015.10979 304 MSS108 31-Jul-11 10:00:50 MSS N38.63735 E015.10979 305 MSS109 31-Jul-11 10:01:49 MSS N38.63737 E015.10982 306 MSS110 31-Jul-11 10:03:16 MSS N38.63740 E015.10986 307 MSS111 31-Jul-11 10:04:00 MSS N38.63741 E015.10989 308 MSS112 31-Jul-11 10:04:42 MSS N38.63740 E015.10991 309 MSS113 31-Jul-11 10:05:17 MSS N38.63741 E015.10994 310 MSS114 31-Jul-11 10:05:55 MSS N38.63741 E015.10998 311 MSS115 31-Jul-11 10:06:39 MSS N38.63741 E015.10998 312 MSS116 31-Jul-11 10:07:54 MSS N38.63740 E015.11000 313 MSS117 31-Jul-11 10:08:34 MSS N38.63739 E015.11002 314 MSS118 31-Jul-11 10:09:13 MSS N38.63739 E015.11004 315 MSS119 31-Jul-11 10:09:49 MSS N38.63739 E015.11005 316 MSS120 31-Jul-11 10:10:31 MSS N38.63738 E015.11007 317 MSS121 31-Jul-11 10:11:13 MSS N38.63737 E015.11010 318 MSS122 31-Jul-11 10:11:56 MSS N38.63735 E015.11011 319 MSS123 31-Jul-11 10:13:23 MSS N38.63731 E015.11017 320 MSS124 31-Jul-11 10:13:52 MSS N38.63729 E015.11021 321 MSS125 31-Jul-11 10:14:18 MSS N38.63727 E015.11024 322 MSS126 31-Jul-11 10:14:42 MSS N38.63726 E015.11026 323 MSS127 31-Jul-11 10:15:04 MSS N38.63725 E015.11028 324 MSS128 31-Jul-11 10:15:31 MSS N38.63724 E015.11030 325 MSS129 31-Jul-11 10:15:56 MSS N38.63723 E015.11032 326
9 Acknowledgements
We would like to take this opportunity to express our deepest thanks and gratitude to the Captain C.L.C. Emanuele Gentile and Crew of R/V Urania for their fantastic support, professionalism, courtesy and hospitality. Despite the short time frame, we consider the cruise a significant success thanks in a large part to their efforts. We would also like to thank Eurofleets (Call for ship-time “Regional 1” 2010, European Commission Grant agreement no 228344) for funding the ship time and logistics, the EU projects ECO2 (ECO2 is a Collaborative Project funded under the European Commission's Framework Seven Programme Topic OCEAN.2010.3 Sub-seabed carbon storage and the marine environment, project number 265847) and RISCS for providing subsidiary funding, and to acknowledge the excellent support provided by SO.PRO.MAR, particularly Dr. Mauro Del Sette and Dr. Massimiliano Di Bitetto, the Italian National Research Council (CNR) and IFREMER. Special thanks go also to R2Sonic, AGEOTEC and Alberto Panti for supplying their 2024 to guarantee the successful WCI study. Extended thanks also to Andrea Fogliuzzi and Giovanni Tascillo, as well as Anna Baccani from Uni. Roma and Martina Kralj and Gianmarco Ingrosso from OGS. Thanks also to logistics and support to Bettina Domeyer, Christine Utecht, Lorenzo Rovelli and Peter Linke from IFM-Geomar, as well as Sascha Flögel and Mark Schmidt for lending us important instrumentation, and Anni Glud for providing the oxygen microelecrodes
R/V Urania, Cruise No. U10/2011, Naples – Naples, 27 July – 1 August 2011 54
used in this study. Special thanks for the excellent technical “round-the-clock” support from R/V Urania’s technicians Daniele Gitto and Francesco Urzi, as well as IFM-Geomar technician Sergiy Cherednichenko. Finally, we are very gracious for the support provided by Giovanni Bortoluzzi, Stefano Aliani and colleagues at ISMAR in La Spezia for their generous support in providing us bathymetric maps and very helpful sampling advice.
10 References
Aliani, S., Bortoluzzi, G., Caramanna, G. and Raffa, F. 2010. Seawater dynamics and environmental settings after November 2002 gas eruption off Bottaro (Panarea, Aeolian Islands, Mediterranean Sea). Continential Shelf Research 30, 1338-1348.
Allgaier, M., Riebesell, U., Vogt, M., Thyrhaug, R. Grossart, H.-P. 2008. Coupling of heterotrophic bacteria to phytoplankton bloom development at different pCO2 levels: a mesocosm study. Biogeosciences 5, 1007-1022.
Anzidei, Marco, Alessandra Esposito, Giovanni Bortoluzzi, and Francesco De Giosa. “The high resolution bathymetric map of the exhalative area of Panarea (Aeolian Islands, Italy).” ANNALS OF GEOPHYSICS 48, no. 6 (2005): 899-921.
Berg, P., H. Røy, F. Janssen, V. Meyer, B. B. Jørgensen, M. Hüttel, and D. de Beer. 2003. Oxygen uptake by aquatic sediments measured with a novel non-invasive eddy-correlation technique. Mar. Ecol.-Prog. Ser. 261:75-83.
Capasso G. and Inguaggiato S., 1998. A simple method for the determination of dissolved gases in natural waters. An application to thermal waters from Vulcano Island. Applied Geohemistry, 13(5): 631-642.
Caracausi, A., M. Ditta, F. Italiano, M. Longo, P. M. Nuccio, A. Paonita, and A. Rizzo (2005), Changes in fluid geochemistry and physico-chemical conditions of geothermal systems caused by magmatic input : The recent abrupt outgassing off the island of Panarea ( Aeolian Islands , Italy ), Geochimica et Cosmochimica Acta, 69(12), 3045-3059, doi:10.1016/j.gca.2005.02.011.
Caramanna, G., N. Voltattorni, and M. M. Maroto-Valer (2011), In the Field Is Panarea Island ( Italy ) a valid and cost-effective natural laboratory for monitoring techniques for submarine, Greenhouse Gas Sci Technol, 1, 200-210, doi:10.1002/ghg.
Cauwet, G., 1994. HTCO method for dissolved organic carbon analysis in influence of catalyst on blank estimation. Marine Chemistry 47, 55-64.
Celussi, M., Cataletto, B., 2007. Annual dynamics of bacterioplankton assemblages in the Gulf of Trieste (Northern Adriatic Sea). Gene 406, 113-123.
Coffin, R.B., Montgomery, M.T., Boyd, T.J., Masutani, S.M. 2004. Influence of ocean CO2 sequestration on bacterial production. Energy 29, 1511-1520.
Corinaldesi, C., Dell’Anno, A., Magagnini, M., Danovaro, R., 2010. Viral decay and viral production rates in continental-shelf and deep-sea sediments of the Mediterranean Sea. FEMS Microbiology Ecology 72, 208-218.
Dickson, A.G., Sabine, C. L., Christian, J.R SOP 3b Determination of total alkalinity in seawater using an open-cell titration, ver. 3.01 2008. In: Dickson, A.G., Sabine, C. L., Christian, J.R. (eds.) 2007. Guide to best practices for ocean CO2 measurements. PICES Special Publication 3, 191 p.

R/V Urania, Cruise No. U10/2011, Naples – Naples, 27 July – 1 August 2011 55
Dickson, A.G., Sabine, C. L., Christian, J.R SOP 6b. Determination of the pH of seawater using the indicator dye m-cresol purple. Ver. 3.01. Jan 28, 2009. In: Dickson, A.G., Sabine, C. L., Christian, J.R. (eds.) 2007. Guide to best practices for ocean CO2 measurements. PICES Special Publication 3, 191 p.
Fabris, Massimo, Paolo Baldi, Marco Anzidei, Arianna Pesci, Giovanni Bortoluzzi, and Stefano Aliani. “High resolution topographic model of Panarea Island by fusion of photogrammetric, lidar and bathymetric digital terrain models.” The Photogrammetric Record 25, no. 132 (2010): 382-401. http://dx.doi.org/10.1111/j.1477-9730.2010.00600.x.
Fonda Umani S., Monti M., Bergamasco A., Cabrini M., De Vittor C., Burba N., Del Negro P., 2005. Plankton community structure and dynamics versus physical structure from Terrra Nova Bay to Ross Ice Shelf (Antarctica). Journal of Marine Systems 55, 31-46.
Fuhrman, J.A., 1999. Marine viruses and their biogeochemical and ecological effects. Nature 399, 541-548.
Fuhrman, J.A., Sleeter, T.D., Carlson, C.A., Proctor, L.M., 1989. Dominance of bacterial biomass in the Sargasso Sea and its ecological implications. Marine Ecology Progress Series 57, 207-217.
Glud, R. N., P. Berg, A. Hume, P. Batty, M. E. Blicher, K. Lennert, and S. Rysgaard. 2010. Benthic O2 exchange across hard-bottom substrates quantified by eddy correlation in a sub-Arctic fjord. Marine Ecology-Progress Series. 417:1-12 [doi:10.3354/meps08795].
Grossart, H.-P., Allgaier, M., Passow, U., Riebesell, U. 2006. Testing the effect of CO2 concentration on the dynamics of marine heterotrophic bacterioplankton. Limnology and Oceanography 51, 1-11.
Gülzow, Wanda, Gregor Rehder, Bernd Schneider, Jens Schneider von Deimling, and Bernd Sadkowiak. “A new method for continuous measurement of methane and carbon dioxide in surface waters using off-axis integrated cavity output spectroscopy (ICOS): An example from the Baltic Sea.” Limnol. Oceanogr. Methods 9 (2011): 176-184.
Hoppe, H.G., 1993. Use of fluorogenic model substrates for extracellular enzyme activity (EEA) measurement of bacteria. In: Kemp, P.F., Sherr, B.F., Sherr, E.B., Cole J.J. (Eds.), Current methods in aquatic microbial ecology. Boca Raton, CRC Press, pp. 423-431.
Hutchins, D.A., Fu, F. X., Zhang, Y., Warner, M.E., Feng, Y., Portune, K., Bernhardt, P.W. and Mulholland, M.R. 2007. CO2 control of Trichodesmium N2 fixation, photosynthesis, growth rates, and elemental ratios: implications for past, present, and future ocean biogeochemistry. Limnology and Oceanography 52, 1293-1304.
Hutchins, D.A., Fu, F.-X., Zhang, Y., Warner, M.E., Feng, Y., Portune, K., Bernhardt, P.W., Mulholland, M.R. 2007. CO2 control of Trichodesmium N2 fixation, photosynthesis, growth rates, and elemental ratios: implications for past, present, and future ocean biogeochemistry. Limnology and Oceanography 52, 1293-1304.

R/V Urania, Cruise No. U10/2011, Naples – Naples, 27 July – 1 August 2011 56
Juniper, S.K., Bird, D.F., Summit, M., Vong, M.P., Baker, E.T., 1998. Bacterial and viral abundances in hydrothermal event plumes over northern Gorda Ridge. Deep-Sea Research 45, 2739-2749.
Karuza, A., Del Negro, P., Crevatin, E., Fonda Umani, S., 2010. Viral production in the Gulf of Trieste (Northern Adriatic Sea): preliminary results using different methodological approaches. Journal of Experimental Marine Biology and Ecology 383, 96-104.
Kirchman, D., K�nees, E., Hodson, R., 1985. Leucine incorporation and its potential as a measure of protein synthesis by bacteria in natural waters. Applied Environmental Microbiology 49, 599–607
Koroleff F, Grasshof K (1983) Determination of nutrients, in: Grasshof K, Erhardt M, Kremling K (Eds), Methods of seawater analyses. Verlag Chemie, Weinheim 125-188
Lee, X., W. Massman, and B. Law. 2004. Handbook of Micrometeorology: A Guide for Surface Flux Measurement and Analysis. Kluwer Academic Publishers.
Lorenzen C, Jeffrey J (1980) Determination of chlorophyll in sea water. UNESCO Tech Pap Mar Sci 35:1-20
Lorrain A., Savoye N., Chauvaud L., Paulet Y.M., Naulet N. (2003) Decarbonation and preservation method for the analysis of organic C and N contents and stable isotope ratio of low-carbonated suspended particulate material. Anal Chim Acta, 491: 125-133
Lueck, R. G., F. Wolk and H. Yamazaki (2002). Oceanic velocity microstructure measurements in the 20th century. Journal of Oceanography. 58(1): 153-174, doi:10.1023/A:1015837020019.
Manini, E., Luna, G., Corinaldesi, C., Zeppilli, D., Bortoluzzi, G., Caramanna, G., Raffa, F., Danovaro, R., 2008. Prokaryote Diversity and Virus Abundance in Shallow Hydrothermal Vents of the Mediterranean Sea (Panarea Island) and the Pacific Ocean (North Sulawesi-Indonesia). Microbial Ecology 55, 626-639.
McGinnis, Daniel F, Mark Schmidt, Tonya DelSontro, Sören Themann, Lorenzo Rovelli, Anja Reitz, and Peter Linke. (2011a) “Discovery of a natural CO 2 seep in the German North Sea: Implications for shallow dissolved gas and seep detection.” Journal of Geophysical Research 116, no. 3: 1-12.
McGinnis, D. F., S. Cherednichenko, S. Sommer, P. Berg, L. Rovelli, R. Schwarz, R. N. Glud, P. Linke (2011b), Simple, robust eddy correlation amplifier for aquatic dissolved oxygen and hydrogen sulfide flux measurements, Limnology and Oceanography: Methods, 9, 340-347
Noble, R.T., Fuhrman, J.A., 1998. Use of SYBR Green I for rapid epifluorescence counts of marine viruses and bacteria. Aquatic Microbial Ecology 14, 113–118.
Ortmann, A., Suttle, C.A., 2005. High abundances of viruses in a deep-sea hydrothermal vent system indicates viral mediated microbial mortality. Deep-Sea Research I 52, 1515-1527.
Osborn, T. R. (1980). Estimates of the local rate of vertical diffusion from dissipation measurements. Journal of Physical Oceanography 10: 83-89.

R/V Urania, Cruise No. U10/2011, Naples – Naples, 27 July – 1 August 2011 57
Patel, A., Noble, R.T., Steele, J.A., Schwalbach, M.S., Hewson, I., Fuhrman, J.A., 2007. Virus and prokaryote enumeration from planktonic aquatic environments by epifluorescence microscopy with SYBR Green I. Nature protocols 2, 269-276.
Pella E., Colombo B. (1973) Study of carbon, hydrogen and nitrogen determination by combustion-gas chromatography. Mikrochim Acta 5: 697-719.
Piontek, J., Lunau, M., Händel, N., Borchard, C., Wurst, M., Engel, A. 2010. Acidification increases microbial polysaccharide degradation in the ocean. Biogeosciences 7, 1615-1624.
Prangishvili, D., Garrett, R.A., 2004. Exceptionally diverse morphotypes and genomes of crenarchaeal hyperthermophilic viruses. Biochemical Society Transition 32, 204–208.
Prangishvilli, D., Garrett, R.A., 2005. Viruses of hyperthermophilic Crenarchaea. Trends in Microbiology 13, 535-542.
Rochelle-Newall, E., Delille, B., Gattuso, J.-P., Jacquet, S., Frankignoulle, M., Terbruggen, A., Riebesell, U., Zondervan, I., 2004. Chromophoric dissolved organic matter in experimental mesocosms maintained under different CO2 levels. Marine Ecology Progress Series 272, 25-31.
Sargent, J.R., 1976. The structure, metabolism and function of lipids in marine organisms. In: Malins, D.C., Sargent, J.R. (Eds.), Biochemical and Biophysical Perspectives in Marine Biology. Academic Press, London, pp. 149-212.
Schneider von Deimling, J, and C Papenberg. “Technical Note: Detection of gas bubble leakage via correlation of water column multibeam images.” Ocean Sci. Discuss. 8, no. 4 (July 15, 2011): 1757-1775. http://www.ocean-sci-discuss.net/8/1757/2011/.
Sharp J.H. (1974) Improved analysis for “particulate” organic carbon and nitrogen from seawater. Limnol Oceanogr: 19(6): 984-989.
Smith, D.C., Azam, F., 1992. A simple, economical method for measuring bacterial protein synthesis rates in seawater using 3H-leucine. Marine Microbial Food Webs, 6(2), 107–114.
Smith, K.L., Ruhl, H.A., Kaufmann, R.S., Kahru, M., 2008. Tracing abyssal food supply back to upper-ocean processes over a 17-year time series in the northeast Pacific. Limnology and Oceanography 53, 2655-2667.
Suttle, C.A., 2005. Viruses in the sea. Nature 437, 356-361.
Tanaka, T., Thingstad, T.F., Løvdal, T., Grossart, H.-P., Larsen, A., Allgaier, M., Meyerhöfer, M., Schulz, K.G., Wohlers, J., Zöllner, E., Riebesell, U. 2008. Availability of phosphate for phytoplankton and bacteria and of glucose for bacteria at different pCO2 levels in a mesocosm study. Biogeosciences 5, 669-678.
Thomas, C., Cauwet, G., Minster, J.F., 1995. Dissolved organic carbon in the equatorial Atlantic Ocean. Marine Chemistry 49, 155-169
Verity, P.G., Stoecker, D.K., Sieracki, M.E., Nelson, J.R., 1993. Grazing, growth and mortality of microzooplankton during the 1989 North Atlantic spring bloom at 47°N, 18°W. Deep-Sea Research I 40, 1793–1814.
Weinbauer, M.G., Suttle, C.A., 1999. Lysogeny and prophage induction in coastal and offshore bacterial communities. Aquatic Microbial Ecology 18, 217-225.

R/V Urania, Cruise No. U10/2011, Naples – Naples, 27 July – 1 August 2011 58
Wilhelm, S., Brigden, S., Suttle, C., 2002. A dilution technique for the direct measurement of viral production: a comparison in stratified and tidally mixed coastal waters. Microbial Ecology 43, 168-173.
Wilhelm, S.W., Suttle, C.A., 1999. Viruses and nutrient cycles in the sea. Bioscience 49, 781-788.
Wommack, K.E., Williamson, S.J., Sundbergh, A., Helton, R.R., Glazer, B.T., Portune, K., Cary, S.C., 2004. An instrument for collecting discrete large-volume water samples suitable for ecological studies of microorganisms. Deep Sea Research Part I: Oceanographic Research Papers 51(11), 1781-1792.
Yamada, N., Suzumura, M. 2010. Effects of seawater acidification on hydrolytic enzyme activities. Journal of Oceanography 66: 233-241.
Zoppini A, Azzaro M, Del Negro P, La Ferla R, Pugnetti A (2010) Respirazione planctonica, in: Socal G, Buttino I, Cabrini M, Mangoni O, Penna A, Totti C (Eds), Metodologie di studio del plancton marino. ISPRA, settore editoria, pp. 185-19.