r/v natsushima cruise report nt13-13 · r/v natsushima cruise report nt13-13 24th june - 5th july,...
TRANSCRIPT
1
R/V Natsushima cruise report
NT13-13 24th June - 5th July, 2013
#5 Takuyo Seamount Northwest Pacific
Chief Scientist: Blair Thornton
(Institute of Industrial Science, The University of Tokyo) in collaboration with:
Department of Geology, Kochi University,
Department of Molecular Biology,
Tokyo University of Pharmacy and life science
Japan Agency for Marin-Earth Science and Technology
(JAMSTEC)
2
Preface
This report describes the dives of the ROV HyperDolphin at Takuyo-Daigo seamount during the NT13-13 cruise of the R/V Natsushima between 24th June and 5th July, 2013. The NT13-13 cruise was conducted based on the proposal entitled “Investigation of acoustic, 3D visual mapping and sampling methods for survey of manganese crust”, proposed by Blair Thornton of The University of Tokyo. The main objective of the cruise was to investigate the application of acoustic and visual instruments to perform in-situ measurements of the volumetric distribution of manganese crusts. In particular, the emphasis was to test newly developed instruments on the slopes of the seamount, to make continuous measurements over long distances and survey a large range of depths. Another objective of the cruise was to collect undisturbed manganese crust samples from the slope of the seamount at various depths and conduct on-site measurement of their physical parameters. Through these studies, we aim to figure out the parameters related to the variations of chemical and physical characteristics of ferromanganese crusts in space and time. Samples of sandy sediments and ambient seawater were collected. An in-situ microbial colonization device that remained in the seafloor for nearly one year was recovered during the cruise, and we will characterize the microbial communities populating the crusts and the role of microbes in the development of crusts. The research party would like to thank the crew members of the R/V Natsushima lead by Captain Aoki Takafumi, the members of the ROV HyperDolphin operation team lead by Yoshinari Ono, marine technician Satomi Minamizawa together with the staff of JAMSTEC and Nippon Marine Enterprise for their dedicated efforts which contributed greatly to the success of this cruise.
August 2013 Blair Thornton (NT13-13 Chief Scientist)

3
Notice on use
This cruise report is a preliminary document prepared during the cruise, and its content
may be changed/corrected without notice. Data on this cruise report may be raw or
unprocessed. If you are going to use or refer to the data written on this report, please ask
the Chief Scientist for latest information. Users of data or results on this cruise report
are requested to submit their results to the Data Management Group of JAMSTEC.
For further details concerning the methods and instruments used, please refer to the
following publications or contact the chief scientist directly.
[1] Thornton, B.; Asada, A.; Bodenmann, A.; Sangekar, M.; Ura, T., "Instruments and Methods for Acoustic and Visual Survey of Manganese Crusts," Oceanic Engineering, IEEE Journal of , vol.38, no.1, pp.186,203, Jan. 2013 [2] Blair Thornton, Adrian Bodenmann, Akira Asada, Tamaki Ura, Mehul Sangekar, Katsumi, Ohira, Daigo Kirimura, ‘Acoustic , visual survey of manganese crusts using an underwater vehicle at Takuyo-Daigo seamount’, In. Proc. Underwater Technology 2011, Tokyo, 1028, 2011. [3] Adrian Bodenmann, Blair Thornton, Takeshi Nakatani, Tamaki Ura, ‘3D colour reconstructions of a hydrothermally active area using an underwater robot’, In Proc. IEEE/MTS Oceans’11 Kona, 110422-033, 2011. [4] Blair Thornton, Akira Asada, Tamaki Ura, Katsumi Ohira, Daigo Kirimura, ‘The development of an acoustic probe to measure the thickness of manganese crusts’, In Proc. IEEE/MTS Oceans’10 Sydney, 2010. [5] Adrian Bodenmann, Blair Thornton , Tamaki Ura, ‘ 3D Mapping of the Seafloor in Color Using a Single Camera: Benthic Mapping Based on Video Recordings , Laser Profiling To Generate Colored 3D Reconstructions of the Seafloor.’ Sea technology, Vol. 51. No. 12, pp 51-53, 2010.

4
Contents 1. Cruise information 2. Cruise Log 2.1 Survey area and time schedule 2.2 Research party 3. Instrumentation and methods 3.1 Objectives 3.2 In-situ measurements 3.2.1 Sub-surface acoustic measurement 3.2.2 3D visual mapping 3.3 Sampling tools 3.3.1 Rotary blade 3.3.2 Rock breaker 3.4 Preparation of samples for Geochemical analysis 3.4.1 Manganese crusts 3.4.2 Sediments 3.5 Preparation of samples for Microbial characterization 3.5.1 Manganese crusts 3.5.2 Sediments 3.5.3 Water 3.5.4 In-situ microbial colonization device 4. ROV operation 4.1 HPD #1540 4.2 HPD #1541 4.3 HPD #1542 4.4 HPD #1543 4.5 HPD #1544 5. Sample list 5.1 Rock/crust table 6. Preliminary results 6.1 Acoustic and visual mapping 6.2 Description of samples 7. Future Plans 7.1 Instrumentation and methods 7.2 Challenges for AUV deployment 7.3 Analysis Acknowledgements
5
List of Figures
Fig: 1 R/V Natsushima track during NT13-13 ......................................... 7
Fig: 2 Trajectories of HyperDolphin during NT13-13 ............................ 11
Fig: 3 Sampling devices and Payload mounted on HyperDolphin during NT13-13
........................................................................................................... 15
Fig: 4 Payload Skid containing Gimbaled Acoustic probe and 3D mapping System
........................................................................................................... 16
Fig: 5 Payload Skid being slid in to the payload bay of HyperDolphin ............... 16
Fig: 6 Acoustic probe developed to measure manganese crust thickness............. 17
Fig: 7 Schematic diagram of the algorithm for calculating the slope angle and
controlling the gimbals in real-time ........................................................ 18
Fig: 8 Illustration of SeaXerocks, used for generation of 3D reconstructions of the
seafloor in colour. ................................................................................. 19
Fig: 9 Rotary Blade being used for rock sampling during dive HPD#1544 ......... 20
Fig: 10 Rock breaker .................................................................................... 21
Fig: 11 Rock breaker being used durin drive HPD#1540 .................................. 21
Fig: 12 The microbial colonization device ...................................................... 24
Fig: 13 On site photo of recovering the device ................................................ 24
Fig: 14 Images of crust deposit taken during HPD#1540 .................................. 25
Fig: 15 HPD#1540 survey area ...................................................................... 26
Fig: 16 Images of crust deposit taken during HPD#1541 .................................. 27
Fig: 17 HPD#1541 survey area ...................................................................... 28
Fig: 18 HPD#1543 survey area ...................................................................... 30
Fig: 19 Images of crust deposit taken during HPD#1544 ............................... 31
Fig: 20 HPD#1544 survey area ...................................................................... 32
Fig: 21 GUI used to set waypoints during the first half of the dive HPD#1544 ... 33
Fig: 22 Image showing all rock samples collected at respective locations in
survey area ........................................................................................... 34
Fig: 23 3D reconstruction in colour using HPD#1540 data at depth 1704m ................................................................................................ 35
Fig: 24 3D reconstruction in colour using HPD#1543 data at depth
6
1620m ................................................................................................ 36
Fig: 25 3D reconstruction in colour using HPD#1543 data at depth 1430m ................................................................................................ 36
Fig: 26 Acoustic measurements of the crust thickness and sample taken during dive HPD#1540 ..................................................................... 37
Fig: 27 Photo of push corer sampling of HPD#1540C01 .................................. 40
Fig: 28 Close-up photo of the foraminifer ooze, HPD#1540C01 ....................... 40
Fig: 29 New bottom skimmer probe AUV ............................................... 42
Fig: 30 Fairing concept ............................................................................ 43
Fig: 31 Participants of the NT13-13 cruise ...................................................... 46
List of Tables
Table 1 Specifications of the rotary blade ....................................................... 20
Table 2 HPD#1540 Event log ........................................................................ 26
Table 3 HPD#1541 Event log ........................................................................ 28
Table 4 HPD#1542 Event log ........................................................................ 29
Table 5 HPD#1543 Event log ........................................................................ 30
Table 6 HPD#1544 Event log ........................................................................ 33
Table 7 List of Rock/Fe-Mn crust samples ...................................................... 34
Table 8 New bottom Skimmer probe’s specification ........................................ 43
7
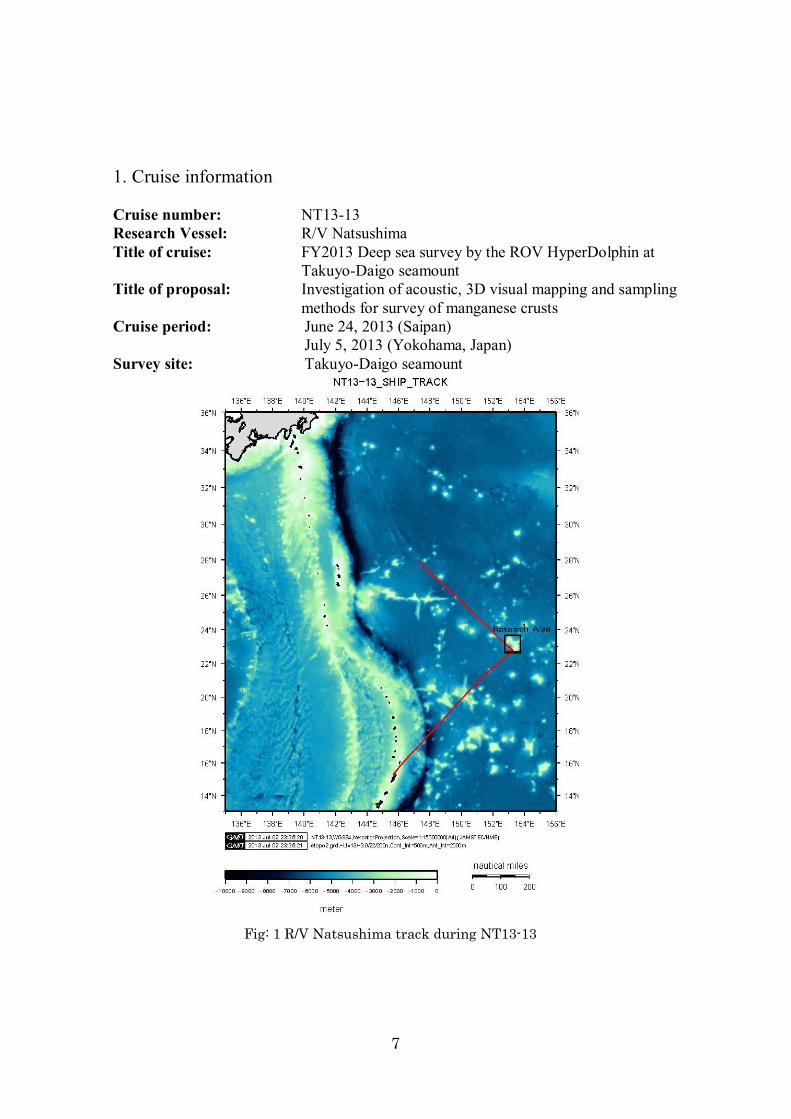
1. Cruise information Cruise number: NT13-13 Research Vessel: R/V Natsushima Title of cruise: FY2013 Deep sea survey by the ROV HyperDolphin at
Takuyo-Daigo seamount Title of proposal: Investigation of acoustic, 3D visual mapping and sampling
methods for survey of manganese crusts Cruise period: June 24, 2013 (Saipan) July 5, 2013 (Yokohama, Japan) Survey site: Takuyo-Daigo seamount
Fig: 1 R/V Natsushima track during NT13-13
8
1.1 Overview of the observation
A survey of manganese crust deposits was performed at Takuyo-Daigo seamount
(23o00’N, 153o20’E), northwest Pacific using the ROV HyperDolphin and the R/V
Natsushima between June 24, 2013 and July 5, 2013. Ferro-manganese crusts occur
throughout the Pacific on seamounts, ridges and plateaus in areas that have been kept
free of sedimentation, at least intermittently, for millions of years. The crusts are formed
by oxidised minerals that precipitate out of the ambient seawater to form a continuous
layer of deposit that extends over several tens of kilometres, blanketing an underlying
rock substrate. The crust layers are typically between 10 and 200mm thick, consisting
mainly of Fe and Mn oxides, but are rich in Co, Ni, Cu and contain traces of Pt and rare
metals, making them the focus of much attention as a potential mineral resource for
mining. The main purpose of the cruise was to investigate the performance of acoustic
and visual instruments, developed under the ‘Program for the development of
fundamental tools for the utilization of marine resources’ of the Japanese Ministry of
Education. The instruments have been developed to perform high resolution surveys of
the volumetric distribution of manganese crusts from an underwater vehicle, and consist
of an acoustic device, developed to perform continuous sub-surface measurements of
manganese crust thickness at depths of up to 3000m, and a vision based mapping
system that generates millimeter order resolution three-dimensional (3D)
reconstructions of the seafloor in actual colours. The ultimate goal of the measurements
is to accurately determine the volumetric distribution of exposed manganese crusts over
a wide survey area. The instruments were mounted on-board the ROV HyperDolphin of
the Japan Agency for Marine-Earth Science and Technology (JAMSTEC), and were
deployed at Takuyo-Daigo seamount. During the survey, the ROV was operated on the
slopes of the seamount to survey the area both acoustically and visually. It is considered
that combining the proposed remote sensing system with conventional survey methods,
such as shipboard multibeam and ROV sampling can potentially accelerate manganese
crust survey and lead to more accurate estimation of the volume of mineral resources
over a large scale, as well as contribute to a better understanding of crust deposits from
a scientific perspective on both local and regional scales.
The acoustic and visual instruments were mounted on the ROV HyperDolphin together
9
with an underwater rotary blade and rock breaker, designed to assist sampling of
manganese crusts. The ROV HyperDolphin dived four times (#1540, #1541, #1543,
#1544) on the southern edge of a margin of the flat top and adjacent slope in the
southernmost part of the Takuyo #5 seamount in the Northwestern Pacific. The acoustic
and 3D image mapping system was operated in the area of ferromanganese crust
pavement zone continuously at the altitude between 1 and 2 meters above the sea floor.
The very slow and constant speed of mapping (10 to 20cm per second) provided us with
very important opportunity of careful observation of the morphology and material over
the ferromanganese crusts. A total 10km mapping lines were surveyed during the four
dives at water depths between 1700 and 1400 meters. We took 16 intact, undisturbed
and in-situ samples of ferromanganese crusts at 13 stops over the lines. The nine out of
the collected samples were scraped from real rock outcrop and was not collected from
fragments or rolling nodules. The seafloor observation and samples are important to
study the mode and controlling factors of the small-scale variation in composition and
configuration of the ferromanganese crusts. Apart from this seafloor sediment and water
samples were collected using a Push corer and Niskin water sampler device respectively.
Four sediment cores and four seawater samples were obtained from various depths on
the seamount. They have been divided and prepared into samples for chemical,
mineralogical and microbiological investigation. CTD-Do measurements were also
made during all the dives. The diving operations were carried out on four consecutive
days. One dive (HPD#1542) was cancelled early during the dive due to payload failure.
All other dives were successful including the dive after fixing the payload fault.
The mapping data obtained during this cruise is not only valuable in terms of
information concerning the distribution of manganese crusts on the seamount, but also
demonstrates that the system developed is capable of performing acoustic
measurements of manganese crust thickness on slopes up to 30 degrees. This was
possible mainly due to the active double gimbal mechanism introduced to control the
direction of the acoustic probe, and the increased measuring range and dynamic beam
focusing capabilities of the acoustic probe itself. It could also be established that the
2.5m range of the probe was sufficient for operation of HyperDolphin on the slopes of
the seamount. The combination of acoustic sub-surface measurements and the 3D visual
reconstructions are found to be powerful tools to quantitatively assess the volumetric
distribution of manganese crusts and it was demonstrated that this kind of acoustic and
10
visual survey of manganese crusts, combined with sampling, forms an effective and
powerful tool to better understand the nature of manganese crusts on a large scale. The
experience gained during the dives will enable engineering feedback to make further
improvements to the various payloads deployed during this cruise.
Finally, it should be mentioned that this cruise follows NT09-02 Leg 2, NT10-11,
NT12-05 and NT12-25 as the fifth multi-disciplinary survey of manganese crust
deposits at Takuyo-Daigo seamount. It is recognized that collaborative projects between
ocean engineers, marine geophysicists and microbiologists such as on this cruise are
highly productive for establishing a sound scientific and engineering background, and it
is necessary that such collaborative cruises focusing on oceanic manganese crust
deposits continue in the future.
11
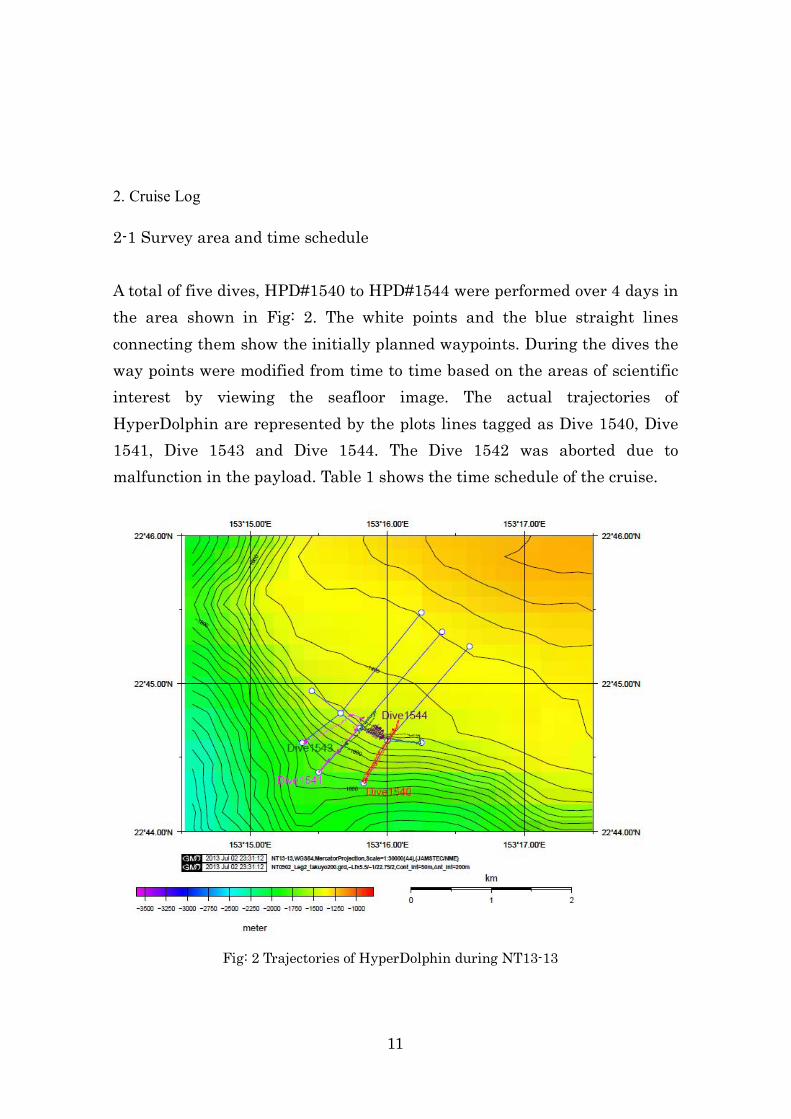
2. Cruise Log 2-1 Survey area and time schedule A total of five dives, HPD#1540 to HPD#1544 were performed over 4 days in the area shown in Fig: 2. The white points and the blue straight lines connecting them show the initially planned waypoints. During the dives the way points were modified from time to time based on the areas of scientific interest by viewing the seafloor image. The actual trajectories of HyperDolphin are represented by the plots lines tagged as Dive 1540, Dive 1541, Dive 1543 and Dive 1544. The Dive 1542 was aborted due to malfunction in the payload. Table 1 shows the time schedule of the cruise.
Fig: 2 Trajectories of HyperDolphin during NT13-13

12
Table 1: Time schedule of NT13-13
2.2 Research party The list of the research party is given in table 2.
Table 2: Research party (*chief scientist)
13
3. Instrumentation and methods
3.1 Objectives
One of the main objectives of the cruise was to test the performance of acoustic and
visual mapping instruments designed to measure the thickness and distribution of
manganese crusts. It is proposed that this system can be mounted on a mobile
underwater platform, such as an autonomous underwater vehicle (AUV) or remotely
operated vehicle (ROV), to continuously map the volumetric distribution of crusts
remotely from low altitudes. On this cruise, the research party tested the survey strategy
to the slopes of the seamount. The main motivation for this is to determine the
distribution of crusts at different depths, since both changes in properties of seawater in
the water column and the shape of the terrain itself are thought to play an important role
in determining the thickness and distribution of manganese crusts. By combining the
acoustic data with visual mapping data based on navigation information, it is possible to
create a 3D colour reconstruction of the seafloor with multiple layers of information, as
a form of Geographic Information System (GIS). In addition to the investigation of the
survey system, a major goal of this cruise was to perform sampling of manganese crust
and their substrate from the outcrop of the seamount, and also obtain sediment and
seawater samples over a range of depths for chemical, mineralogical and
microbiological studies.
Ocean hydrogenetic ferromanganese crusts are potential archives of paleoceanographic
and geological environments as well as potential future mineral resources. The
oceanographic or geological parameters controlling their elemental and mineralogical
diversity have not been well defined. Thus a combined geochemical, mineralogical,
physical and microbiological characterization is necessary on regional, small-scale or
microscopic scales. The ROV exploration and geological mapping proved the most
elegant, accurate, and effective method for on-site geological study and geochemical
analysis. We attempt to figure out the parameters related to the variations of chemical
and physical characteristics of ferromanganese crusts in space and time. For this
purpose, the key technique is a delicate sampling method that should provide us with
undisturbed ferromanganese crust samples and on-site measurement of chemical and
14
physical parameters. This cruise is a part of our program to characterize the geological
occurrences of ferromanganese crusts from two model areas (Minami Torishima Island
area, the Pacific and Okino Torishima Island area, the Philippine sea) over the
northwestern Pacific Ocean. We plan to describe on microscopic scale geochemical,
mineralogical, and structural properties with reliable time scales, related to the results of
NT09-02, KY11-02, and NT 12-05.
Another major objective of this cruise was to recover the in-situ microbial colonization
devices that were deployed about one year before during NT12-05 at various depths on
the seamount. This long-term experiment will help characterize the affinity of microbial
species to crusts. It is hoped that the efforts during this cruise, contribute to a better
understanding of crust deposits from a scientific perspective and allow for more
accurate estimation of the volume of mineral resources at Takuyo-Daigo seamount.
The research party consisted of five oceanic engineers, a geochemist and a
microbiologist. The engineering group’s main aim was to investigate the performance of
the in-situ sensors and test the performance of the acoustic probe and mapping system
in different seafloor morphologies in order to gain engineering feedback into future
modifications for the systems. The aim of the geology team was to collect information
to help describe the mode of geochemical and mineralogical variations on regional,
small to microscopic scales in relation to depositional processes and geological
environments. In order to achieve this, it is crucial that the rocks and manganese
crusts are collected systematically by the ROV from known depths, and that the samples
meet the following requisites;
1) the samples preserve their original structure,
2) seawater samples obtained in the same region are available for study,
3) the crust deposits are continuous from top to bottom,
4) the related topographic and oceanographic parameters such as CTDO-pH of the
locations where the samples were obtained are known, and
5) the obtained samples are firmly rooted to the seafloor to be representative of the
region from which they were taken.
The samples will be subject to geochemical, mineralogical, and structural analyses at
the University of Tokyo, Kochi University, and JAMSTEC, and it is planned that age
15
dating will also be performed. The aim of the microbiologist is to obtain crust samples,
sandy sediments and ambient seawater, and recover the colonization devices remained
on the seafloor for nearly one year deployed during the cruise NT12-05. This long-term
experiment will help characterize the affinity of microbial species to crusts. The purpose
in our study is to characterize the microbial community on the crusts and the role of
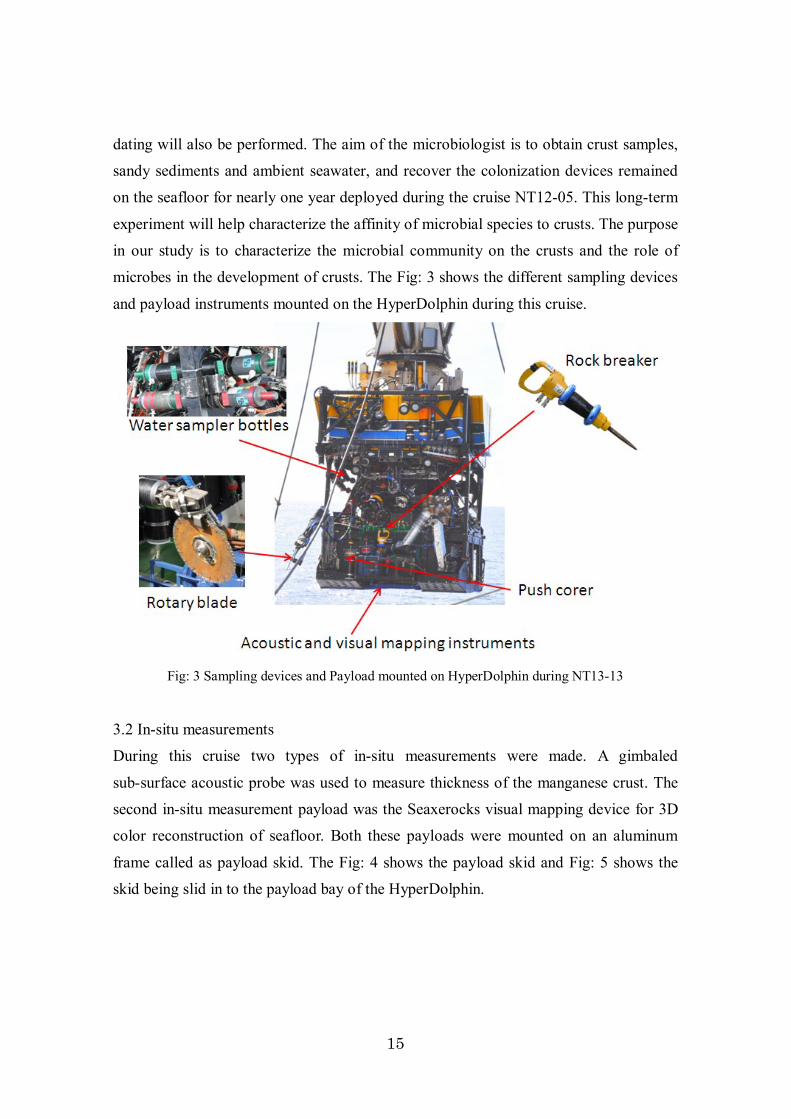
microbes in the development of crusts. The Fig: 3 shows the different sampling devices
and payload instruments mounted on the HyperDolphin during this cruise.
Fig: 3 Sampling devices and Payload mounted on HyperDolphin during NT13-13
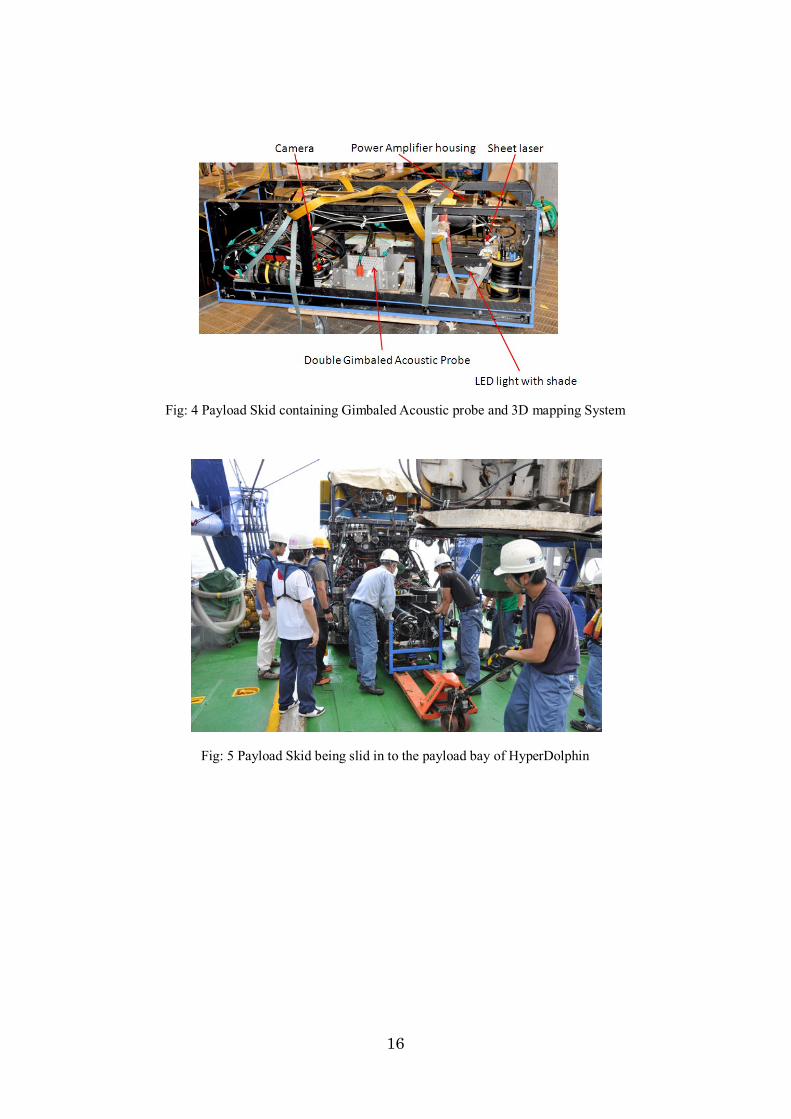
3.2 In-situ measurements
During this cruise two types of in-situ measurements were made. A gimbaled
sub-surface acoustic probe was used to measure thickness of the manganese crust. The
second in-situ measurement payload was the Seaxerocks visual mapping device for 3D
color reconstruction of seafloor. Both these payloads were mounted on an aluminum
frame called as payload skid. The Fig: 4 shows the payload skid and Fig: 5 shows the
skid being slid in to the payload bay of the HyperDolphin.
16
Fig: 4 Payload Skid containing Gimbaled Acoustic probe and 3D mapping System
Fig: 5 Payload Skid being slid in to the payload bay of HyperDolphin
17
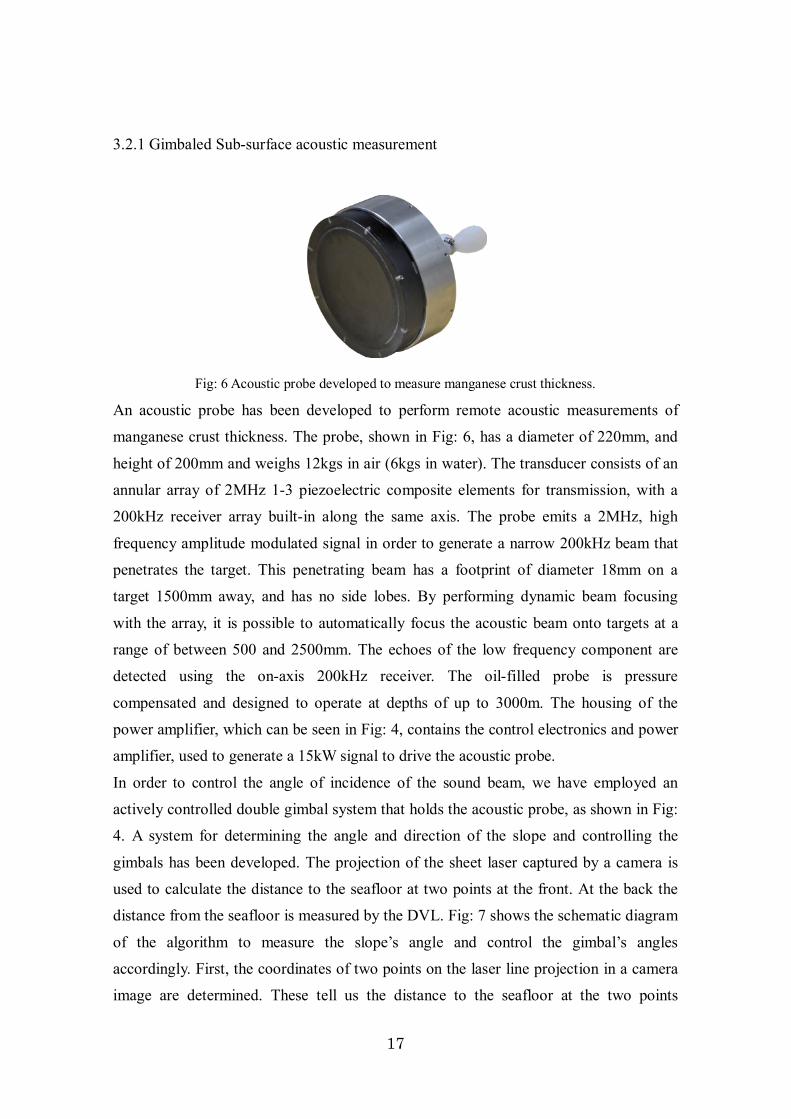
3.2.1 Gimbaled Sub-surface acoustic measurement
Fig: 6 Acoustic probe developed to measure manganese crust thickness.
An acoustic probe has been developed to perform remote acoustic measurements of
manganese crust thickness. The probe, shown in Fig: 6, has a diameter of 220mm, and
height of 200mm and weighs 12kgs in air (6kgs in water). The transducer consists of an
annular array of 2MHz 1-3 piezoelectric composite elements for transmission, with a
200kHz receiver array built-in along the same axis. The probe emits a 2MHz, high
frequency amplitude modulated signal in order to generate a narrow 200kHz beam that
penetrates the target. This penetrating beam has a footprint of diameter 18mm on a
target 1500mm away, and has no side lobes. By performing dynamic beam focusing
with the array, it is possible to automatically focus the acoustic beam onto targets at a
range of between 500 and 2500mm. The echoes of the low frequency component are
detected using the on-axis 200kHz receiver. The oil-filled probe is pressure
compensated and designed to operate at depths of up to 3000m. The housing of the
power amplifier, which can be seen in Fig: 4, contains the control electronics and power
amplifier, used to generate a 15kW signal to drive the acoustic probe.
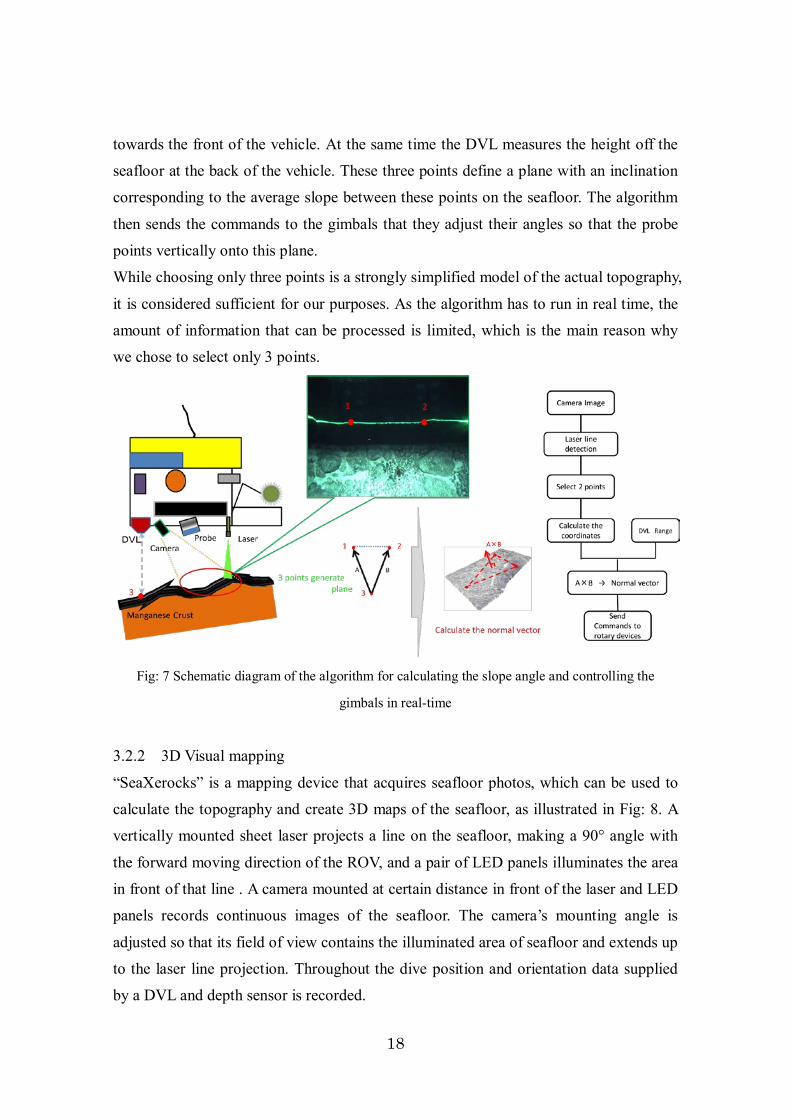
In order to control the angle of incidence of the sound beam, we have employed an
actively controlled double gimbal system that holds the acoustic probe, as shown in Fig:
4. A system for determining the angle and direction of the slope and controlling the
gimbals has been developed. The projection of the sheet laser captured by a camera is
used to calculate the distance to the seafloor at two points at the front. At the back the
distance from the seafloor is measured by the DVL. Fig: 7 shows the schematic diagram
of the algorithm to measure the slope’s angle and control the gimbal’s angles
accordingly. First, the coordinates of two points on the laser line projection in a camera
image are determined. These tell us the distance to the seafloor at the two points
18
towards the front of the vehicle. At the same time the DVL measures the height off the
seafloor at the back of the vehicle. These three points define a plane with an inclination
corresponding to the average slope between these points on the seafloor. The algorithm
then sends the commands to the gimbals that they adjust their angles so that the probe
points vertically onto this plane.
While choosing only three points is a strongly simplified model of the actual topography,
it is considered sufficient for our purposes. As the algorithm has to run in real time, the
amount of information that can be processed is limited, which is the main reason why
we chose to select only 3 points.
Fig: 7 Schematic diagram of the algorithm for calculating the slope angle and controlling the
gimbals in real-time
3.2.2 3D Visual mapping
“SeaXerocks” is a mapping device that acquires seafloor photos, which can be used to
calculate the topography and create 3D maps of the seafloor, as illustrated in Fig: 8. A
vertically mounted sheet laser projects a line on the seafloor, making a 90° angle with
the forward moving direction of the ROV, and a pair of LED panels illuminates the area
in front of that line . A camera mounted at certain distance in front of the laser and LED
panels records continuous images of the seafloor. The camera’s mounting angle is
adjusted so that its field of view contains the illuminated area of seafloor and extends up
to the laser line projection. Throughout the dive position and orientation data supplied
by a DVL and depth sensor is recorded.

19
Fig: 8 Illustration of SeaXerocks, used for generation of 3D reconstructions of the seafloor in colour.
As the vehicle moves forwards, the projected laser line scans the shape of the seafloor,
and through triangulation of the laser projections captured by each camera, it is possible
to generate a detailed 3D bathymetry of the seafloor based on the vehicles position. In a
second step colour information is added and after meshing the individual points, 3D
reconstructions such as those shown in Fig: 23, Fig: 24 and Fig: 25 can be generated.
3.3 Rock sampling tools
Two types of rock sampling tools were used to provide us with undisturbed
ferromanganese crust samples during the cruise. One is a rotary blade cutter and another
is a rock breaker.
3.3.1 Rotary blade
A rotary blade has been developed to aid sampling of manganese crusts. The blade is
used to make incisions into the crust and substrate, and a crowbar was used to extract
samples directly from the outcrop. The main hydraulic unit of the ROV HyperDolphin
supplies hydraulic pressure, and the flow can be controlled from the control room of the
ROV. The specifications of the rotary blade are as shown in Table 1.
20
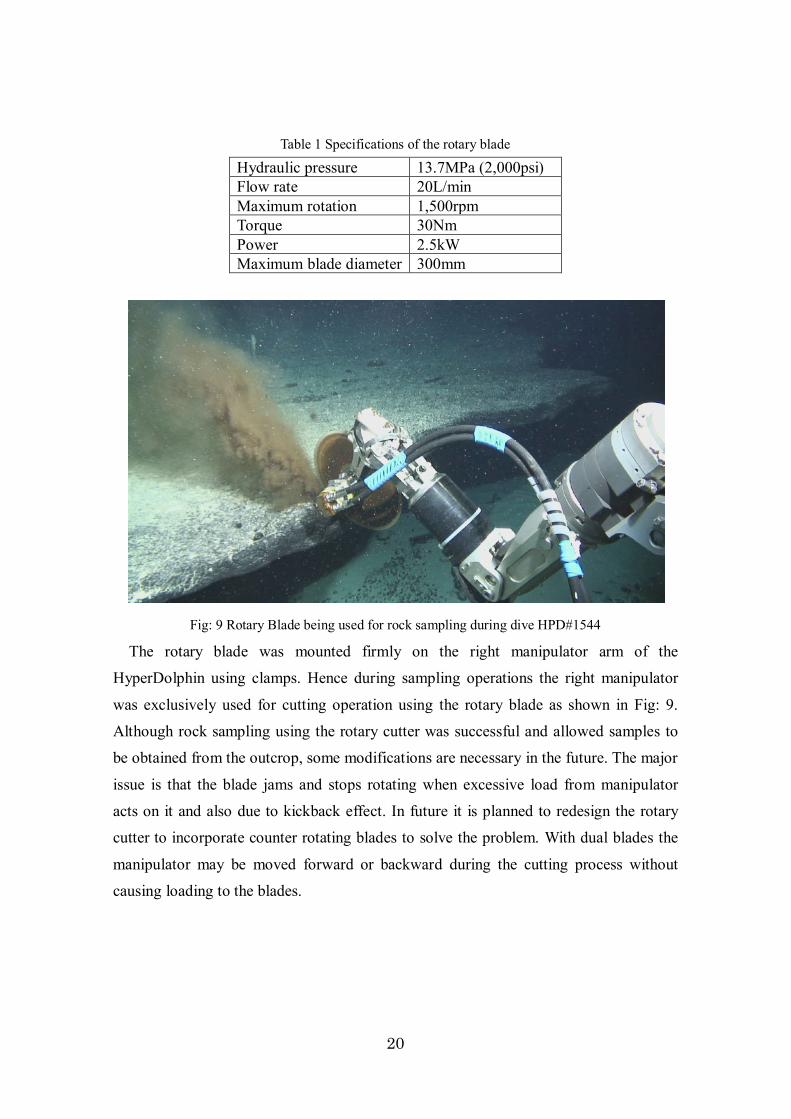
Table 1 Specifications of the rotary blade
Hydraulic pressure 13.7MPa (2,000psi) Flow rate 20L/min Maximum rotation 1,500rpm Torque 30Nm Power 2.5kW Maximum blade diameter 300mm
Fig: 9 Rotary Blade being used for rock sampling during dive HPD#1544
The rotary blade was mounted firmly on the right manipulator arm of the
HyperDolphin using clamps. Hence during sampling operations the right manipulator
was exclusively used for cutting operation using the rotary blade as shown in Fig: 9.
Although rock sampling using the rotary cutter was successful and allowed samples to
be obtained from the outcrop, some modifications are necessary in the future. The major
issue is that the blade jams and stops rotating when excessive load from manipulator
acts on it and also due to kickback effect. In future it is planned to redesign the rotary
cutter to incorporate counter rotating blades to solve the problem. With dual blades the
manipulator may be moved forward or backward during the cutting process without
causing loading to the blades.
21
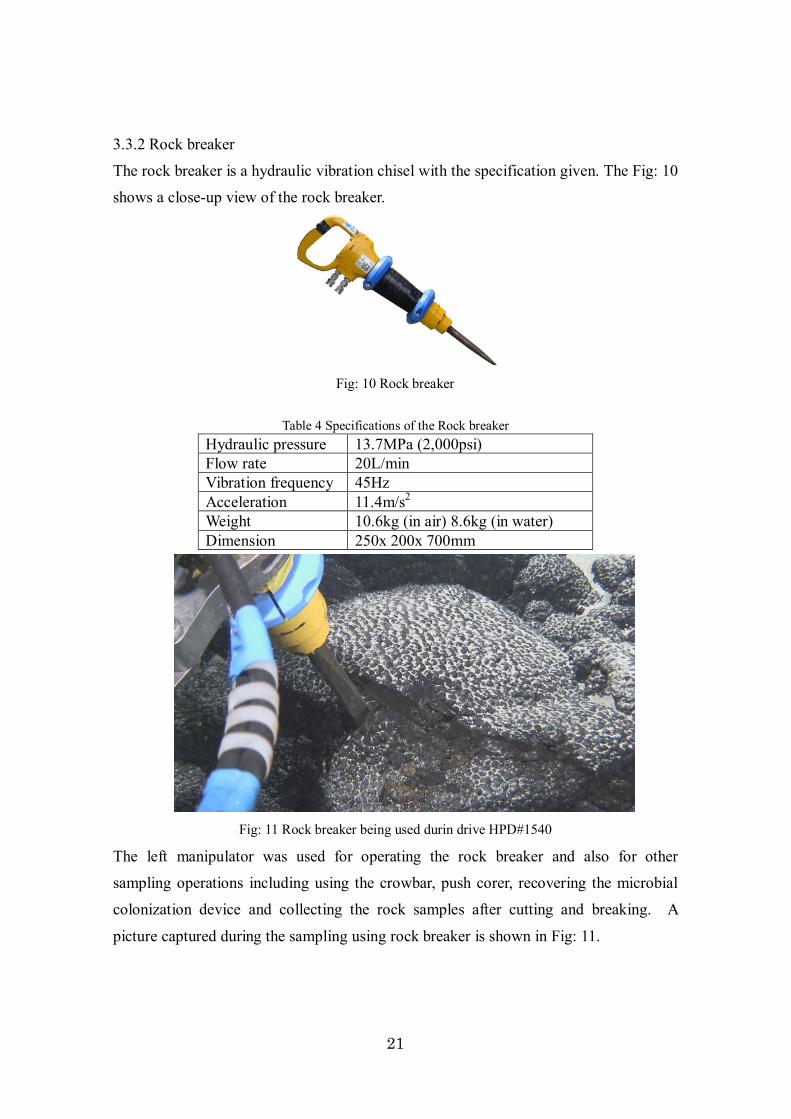
3.3.2 Rock breaker
The rock breaker is a hydraulic vibration chisel with the specification given. The Fig: 10
shows a close-up view of the rock breaker.
Fig: 10 Rock breaker
Table 4 Specifications of the Rock breaker
Hydraulic pressure 13.7MPa (2,000psi) Flow rate 20L/min Vibration frequency 45Hz Acceleration 11.4m/s2 Weight 10.6kg (in air) 8.6kg (in water) Dimension 250x 200x 700mm
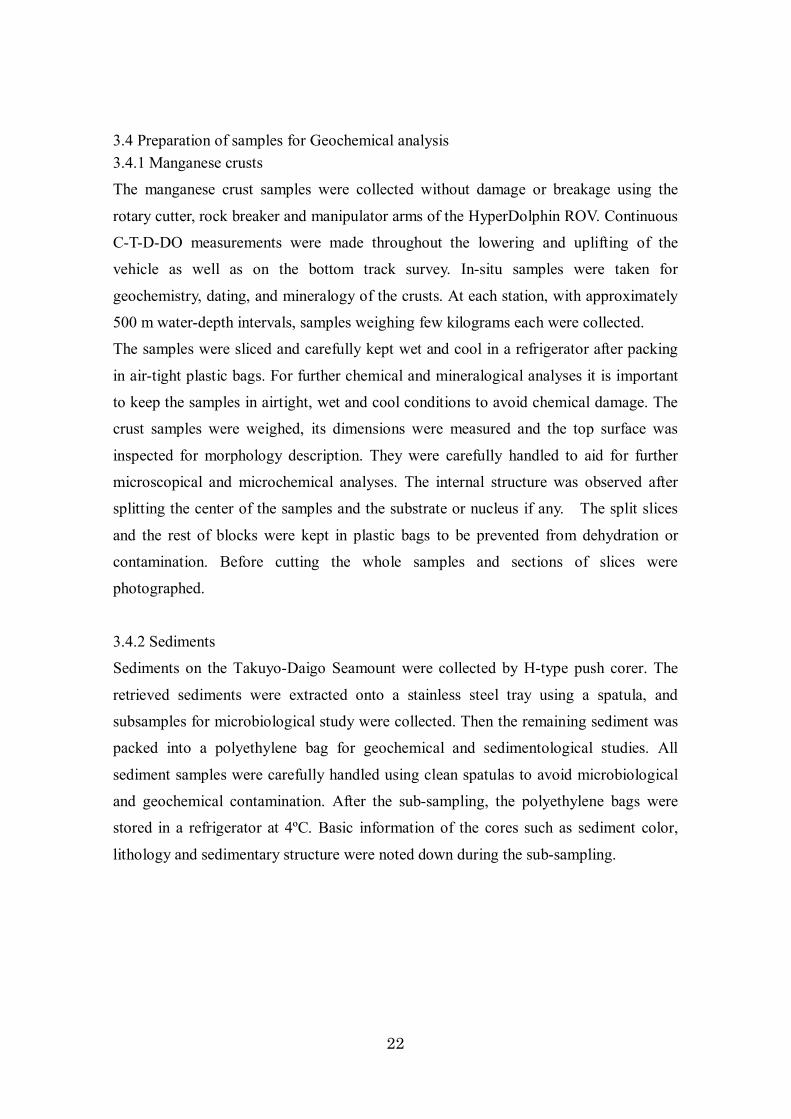
Fig: 11 Rock breaker being used durin drive HPD#1540
The left manipulator was used for operating the rock breaker and also for other
sampling operations including using the crowbar, push corer, recovering the microbial
colonization device and collecting the rock samples after cutting and breaking. A
picture captured during the sampling using rock breaker is shown in Fig: 11.
22
3.4 Preparation of samples for Geochemical analysis 3.4.1 Manganese crusts
The manganese crust samples were collected without damage or breakage using the
rotary cutter, rock breaker and manipulator arms of the HyperDolphin ROV. Continuous
C-T-D-DO measurements were made throughout the lowering and uplifting of the
vehicle as well as on the bottom track survey. In-situ samples were taken for
geochemistry, dating, and mineralogy of the crusts. At each station, with approximately
500 m water-depth intervals, samples weighing few kilograms each were collected.
The samples were sliced and carefully kept wet and cool in a refrigerator after packing
in air-tight plastic bags. For further chemical and mineralogical analyses it is important
to keep the samples in airtight, wet and cool conditions to avoid chemical damage. The
crust samples were weighed, its dimensions were measured and the top surface was
inspected for morphology description. They were carefully handled to aid for further
microscopical and microchemical analyses. The internal structure was observed after
splitting the center of the samples and the substrate or nucleus if any. The split slices
and the rest of blocks were kept in plastic bags to be prevented from dehydration or
contamination. Before cutting the whole samples and sections of slices were
photographed.
3.4.2 Sediments
Sediments on the Takuyo-Daigo Seamount were collected by H-type push corer. The
retrieved sediments were extracted onto a stainless steel tray using a spatula, and
subsamples for microbiological study were collected. Then the remaining sediment was
packed into a polyethylene bag for geochemical and sedimentological studies. All
sediment samples were carefully handled using clean spatulas to avoid microbiological
and geochemical contamination. After the sub-sampling, the polyethylene bags were
stored in a refrigerator at 4ºC. Basic information of the cores such as sediment color,
lithology and sedimentary structure were noted down during the sub-sampling.
23
3.5 Preparation of samples for microbial characterization
For microbial analyses, manganese crusts, sandy sediments and bottom seawater were
collected. We were successful in recovering in-situ microbial colonization devices
placed on the seafloor at the depth of 1425 m on HPD#1354 dive during NT12-05
cruise (March, 2012). These samples were stored in suitable condition for the respective
sample type as described below. Several samples were inoculated into the culture media
prepared for cultivation of Mn oxidizing bacteria and ammonia oxidizers, respectively.
3.5.1 Manganese crusts
The collected manganese crusts were divided into portions of manganese oxides or
basement rocks using a clean sterilized hammer. Large subsamples were stored in
plastic tubes or bags at –80ºC for DNA/RNA analysis. Cells attached with small
subsamples were fixed with 0.22 µm filtered seawater containing formalin (final 3.7%
v/v) in plastic tubes at 4ºC until microscopic observation. Small subsamples were also
stored in plastic tubes or bags at 4ºC for cultivation.
3.5.2 Sediments
A part (approximately ~100 g) of the sediments collected by the H-type push corer were
sampled using a clean spatula. Manganese oxides buried in sediment were also sampled
using a clean spatula and forceps. Subsamples were stored in plastic tubes or bags at
–80ºC for DNA/RNA analysis. Cells attached with small subsamples were fixed with
0.22 µm filtered seawater containing formalin (final 3.7% v/v) in plastic tubes at 4ºC
until microscopic observation. Small subsamples were also stored in plastic tubes at 4ºC
for cultivation.
3.5.3 Water
1L of seawater samples collected by NISKIN sampler (Volume 2.5L) was filtered with
0.22 µm polycarbonate filter. The filter was stored in a lab dish at -80℃ for DNA/RNA
analysis. Remaining seawater samples were stored in plastic bottles or glass bottles at
4ºC for cultivation and microscopic observation. For microscopic observation, seawater
samples were fixed with formalin (final 3.7% v/v).
24
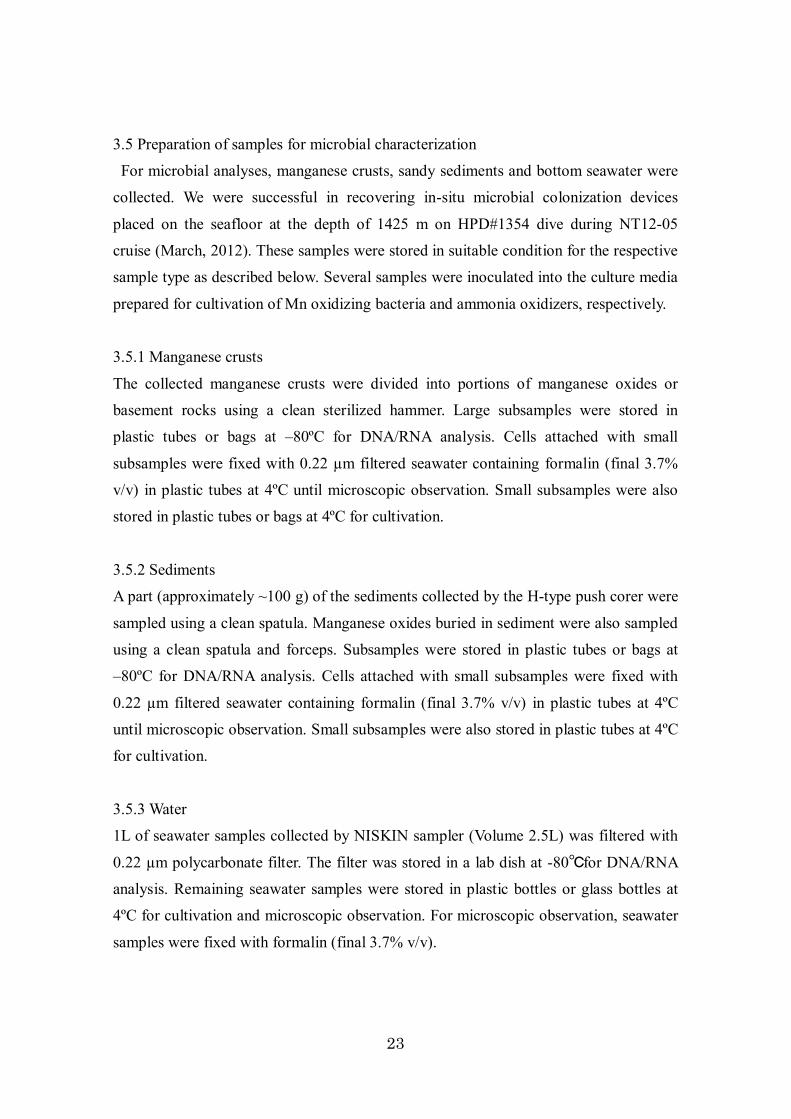
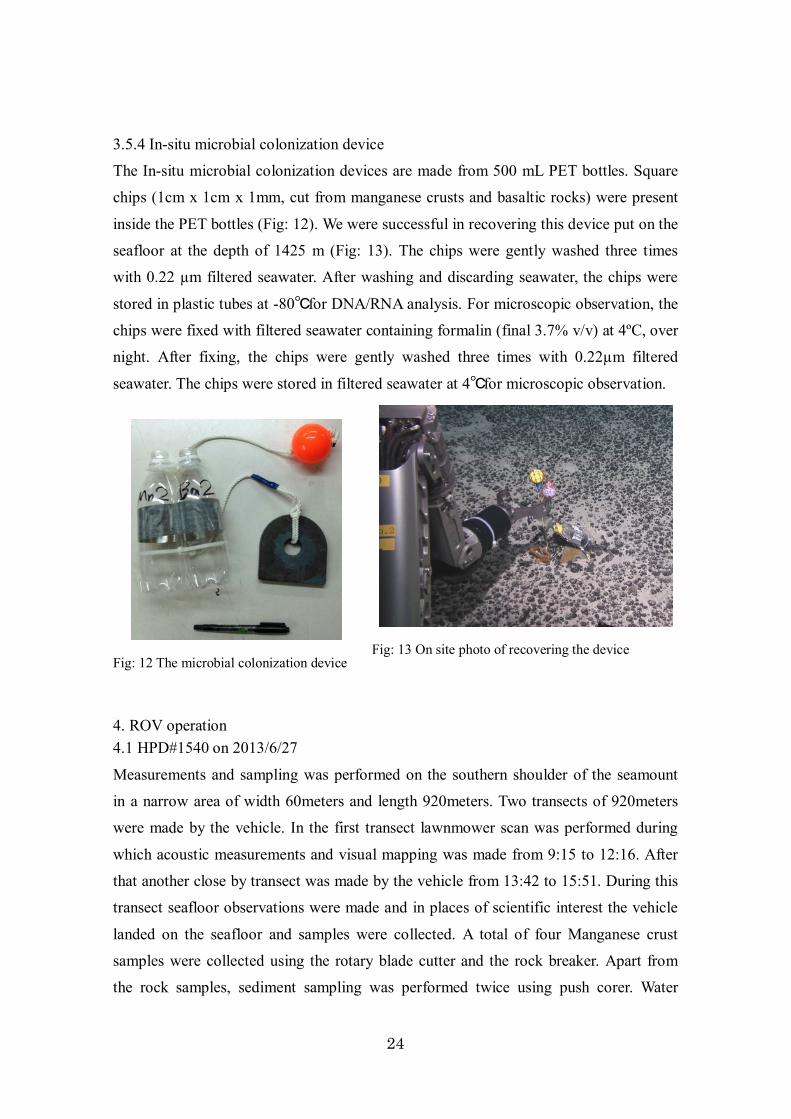
3.5.4 In-situ microbial colonization device
The In-situ microbial colonization devices are made from 500 mL PET bottles. Square
chips (1cm x 1cm x 1mm, cut from manganese crusts and basaltic rocks) were present
inside the PET bottles (Fig: 12). We were successful in recovering this device put on the
seafloor at the depth of 1425 m (Fig: 13). The chips were gently washed three times
with 0.22 µm filtered seawater. After washing and discarding seawater, the chips were
stored in plastic tubes at -80℃ for DNA/RNA analysis. For microscopic observation, the
chips were fixed with filtered seawater containing formalin (final 3.7% v/v) at 4ºC, over
night. After fixing, the chips were gently washed three times with 0.22µm filtered
seawater. The chips were stored in filtered seawater at 4℃ for microscopic observation.
Fig: 12 The microbial colonization device
Fig: 13 On site photo of recovering the device
4. ROV operation 4.1 HPD#1540 on 2013/6/27
Measurements and sampling was performed on the southern shoulder of the seamount
in a narrow area of width 60meters and length 920meters. Two transects of 920meters
were made by the vehicle. In the first transect lawnmower scan was performed during
which acoustic measurements and visual mapping was made from 9:15 to 12:16. After
that another close by transect was made by the vehicle from 13:42 to 15:51. During this
transect seafloor observations were made and in places of scientific interest the vehicle
landed on the seafloor and samples were collected. A total of four Manganese crust
samples were collected using the rotary blade cutter and the rock breaker. Apart from
the rock samples, sediment sampling was performed twice using push corer. Water

25
sampling was performed at way point #5 at a depth of 1419m. The seafloor depth in
the survey area ranged from 1420m to 1707m. Some of the images captured by the
vehicle during this dive is shown in Fig: 14. A map of the survey area is provided in
Fig: 15. A detailed event log of the dive is provided in the Table 2.
Fig: 14 Images of crust deposit taken during HPD#1540

26
Fig: 15 HPD#1540 survey area
Table 2 HPD#1540 Event log
27
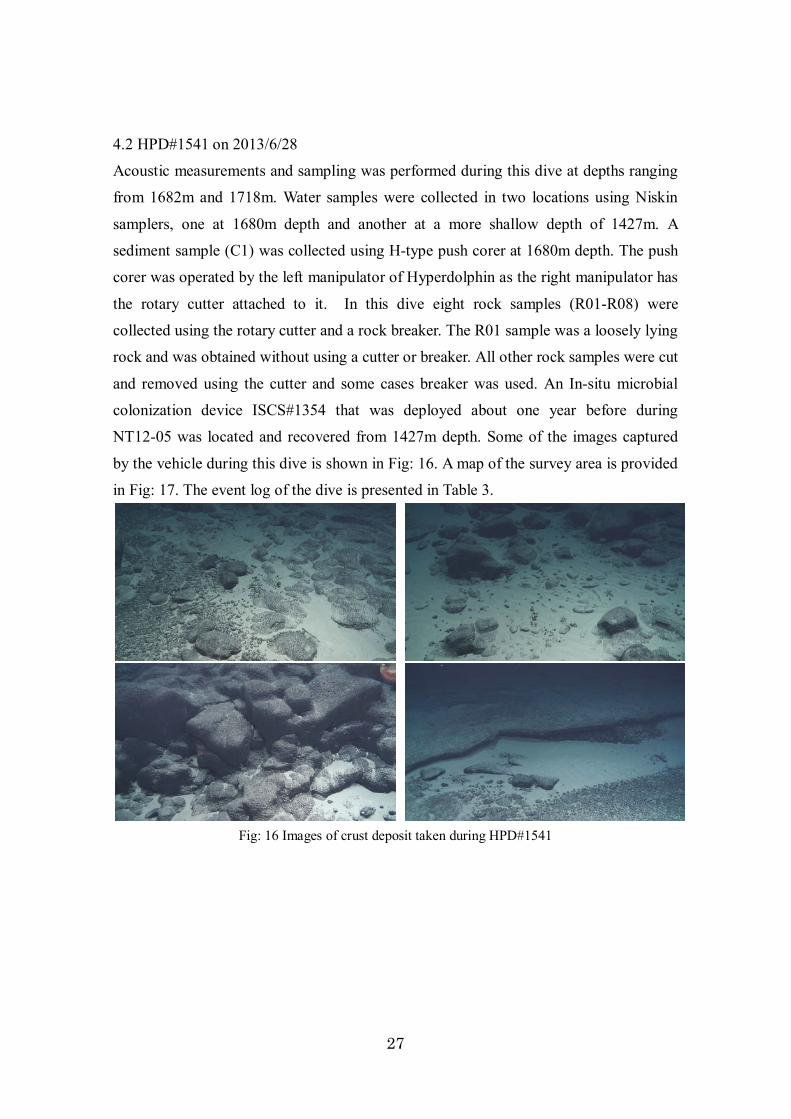
4.2 HPD#1541 on 2013/6/28
Acoustic measurements and sampling was performed during this dive at depths ranging
from 1682m and 1718m. Water samples were collected in two locations using Niskin
samplers, one at 1680m depth and another at a more shallow depth of 1427m. A
sediment sample (C1) was collected using H-type push corer at 1680m depth. The push
corer was operated by the left manipulator of Hyperdolphin as the right manipulator has
the rotary cutter attached to it. In this dive eight rock samples (R01-R08) were
collected using the rotary cutter and a rock breaker. The R01 sample was a loosely lying
rock and was obtained without using a cutter or breaker. All other rock samples were cut
and removed using the cutter and some cases breaker was used. An In-situ microbial
colonization device ISCS#1354 that was deployed about one year before during
NT12-05 was located and recovered from 1427m depth. Some of the images captured
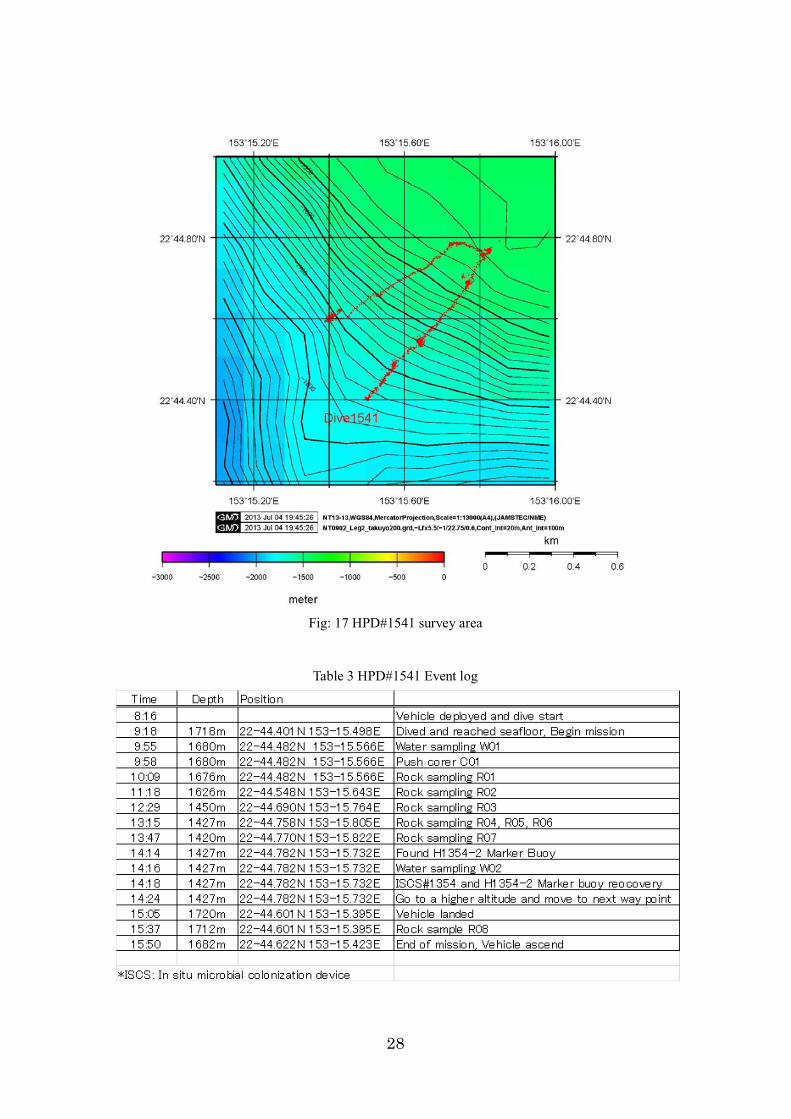
by the vehicle during this dive is shown in Fig: 16. A map of the survey area is provided
in Fig: 17. The event log of the dive is presented in Table 3.
Fig: 16 Images of crust deposit taken during HPD#1541
28
Fig: 17 HPD#1541 survey area
Table 3 HPD#1541 Event log

29
4.3 HPD#1542 on 2013/6/29
This dive was made on the morning of 29th July and lasted only 42 minutes. The vehicle
started diving at 8:13am and at a depth of 320m the vehicles payload started
malfunctioning. By 8:40 the dive was aborted and HyperDolphin was retrieved for
inspecting the fault in the payload. An event log of the dive is given in Table 4. Table 4 HPD#1542 Event log
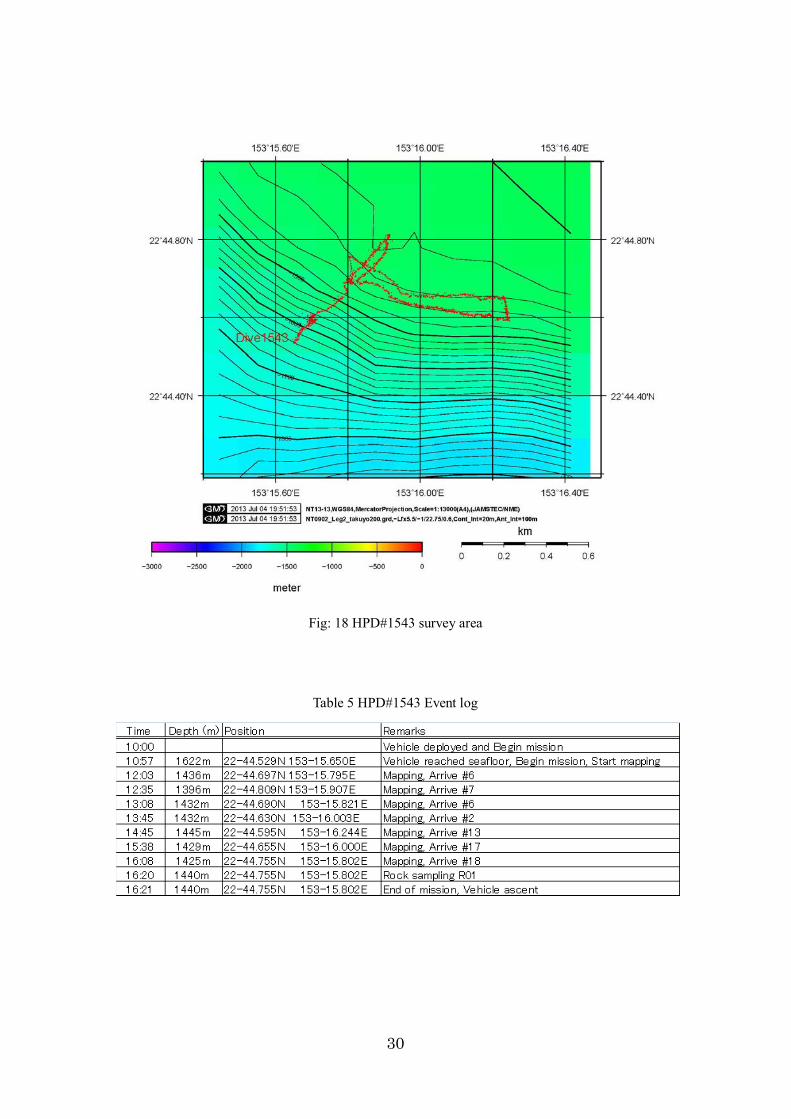
4.4 HPD#1543 2013/6/29
On retrieving the vehicle after dive HPD#1542 the payload was inspected and the fault
was rectified. After rectification the vehicle made a second dive on the same day (29th
July) by 10:00. This dive was mainly focused on acoustic and visual mapping. From
time 10:57 to 16:08 the acoustic and visual mapping survey was made with around
1.8m altitude. An altitude of 1.8m from seafloor is ideal for the acoustic and visual
mapping to get strong acoustic reflections and capture high resolution images. One rock
sample was obtained at a depth of 1440m. The seafloor morphology was characterized
by large crust covered boulders and areas covered with nodules covered sediments. A
map of the survey area is provided in Fig: 18. An event log of the dive is given in Table
5.
30
Fig: 18 HPD#1543 survey area
Table 5 HPD#1543 Event log

31
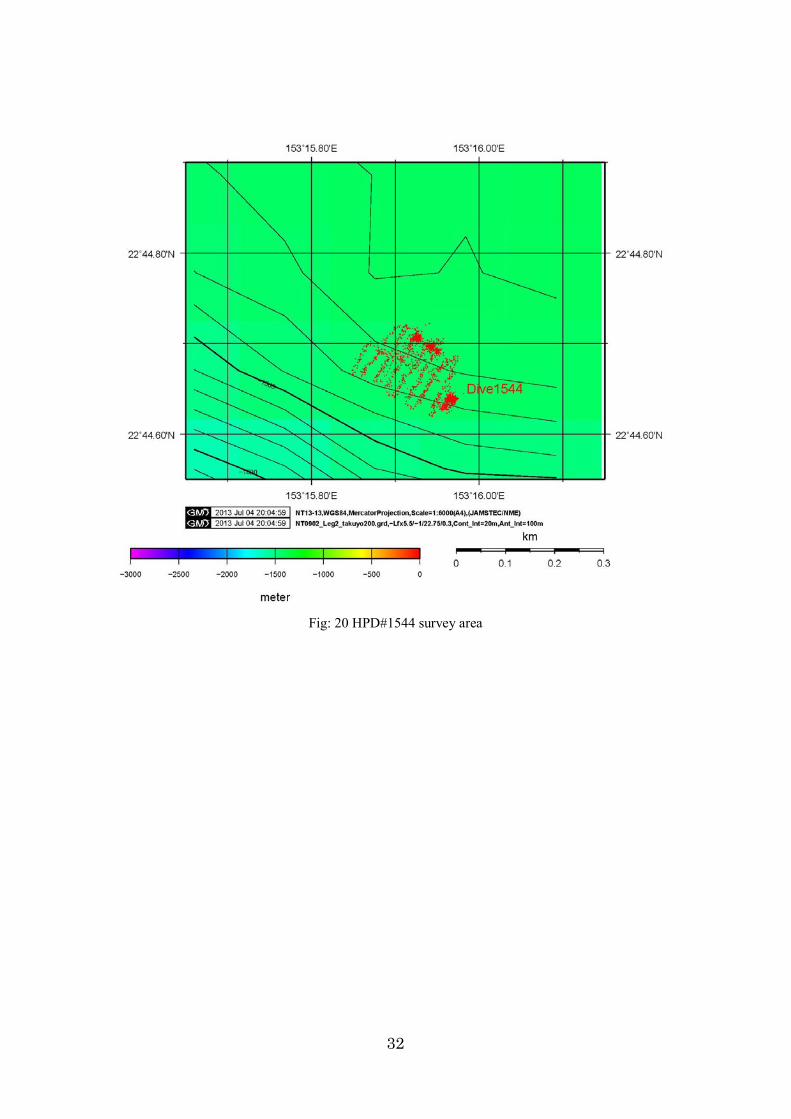
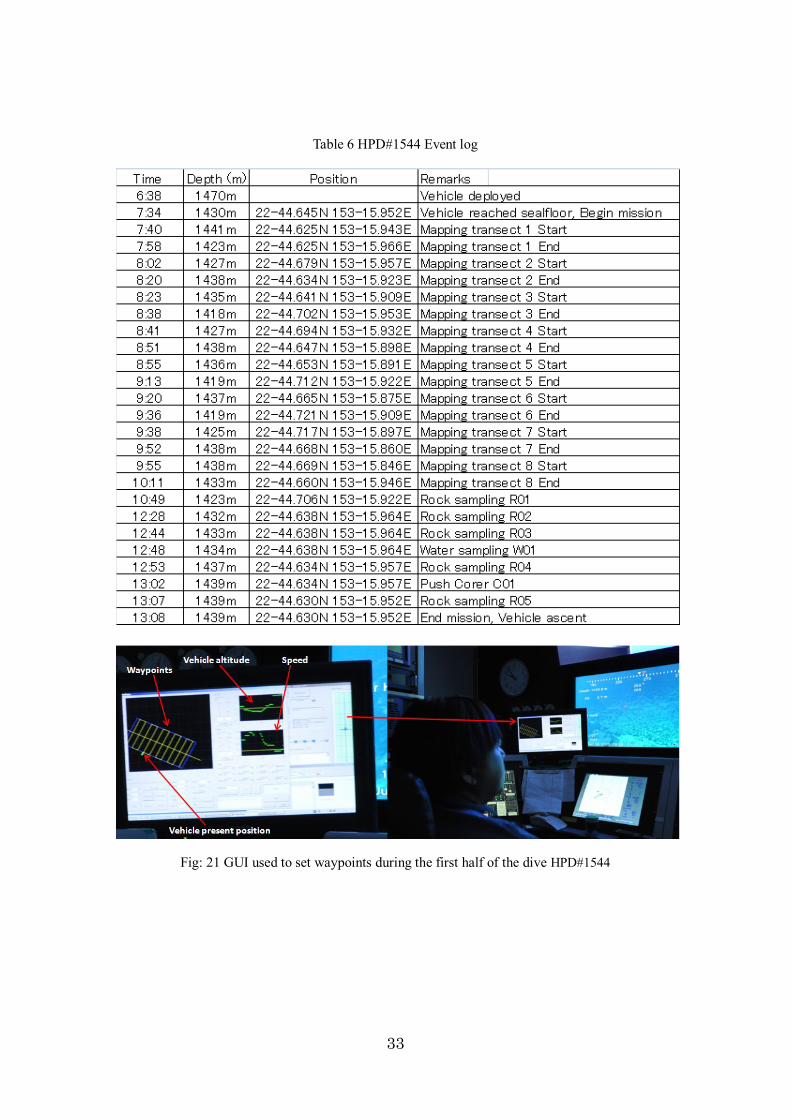
4.5 HPD#1544 on 2013/6/30
This was the last dive in this cruise and the dive started earlier than usual at time 6:38.
In the first half of the dive from 7:40 to 10:11 acoustic and visual mapping
measurements were performed. During the measurements 8 close transects were made
in an area which is 180m wide and 140m long. Each transect was 140m long.
Lawnmower survey was made along the transects at around 1.8m altitude from seafloor.
As transects were very close, it is not possible to use the SSBL system for accurate
vehicle positioning. Hence a GUI software developed by the research party was used to
plot the way points and monitor the real-time position of vehicle as shown in Fig: 21.
This software uses the payloads onboard DVL to precisely monitor real-time position of
the vehicle. The second half of the dive from 10:49 to 13:08 was focused on collecting
various samples. A total of five rock samples were collected. One water sample and one
push core sampling was also conducted. Some of the images captured by the vehicle
during this dive is shown in Fig: 19. A map of the survey area is provided in Fig: 20.
The event log of the dive is presented in Table 6.
Fig: 19 Images of crust deposit taken during HPD#1544
32
Fig: 20 HPD#1544 survey area
33
Table 6 HPD#1544 Event log
Fig: 21 GUI used to set waypoints during the first half of the dive HPD#1544
34
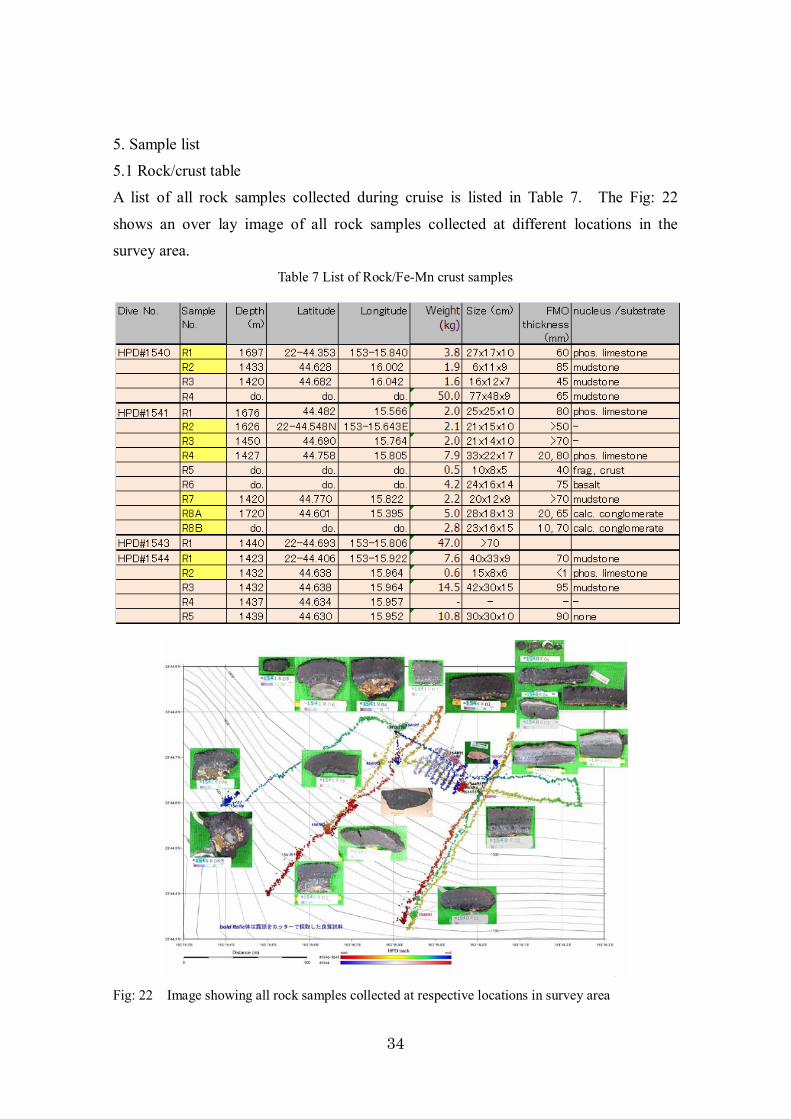
5. Sample list
5.1 Rock/crust table
A list of all rock samples collected during cruise is listed in Table 7. The Fig: 22
shows an over lay image of all rock samples collected at different locations in the
survey area. Table 7 List of Rock/Fe-Mn crust samples
Fig: 22 Image showing all rock samples collected at respective locations in survey area
35
6. Preliminary results
6.1 Acoustic and visual mapping
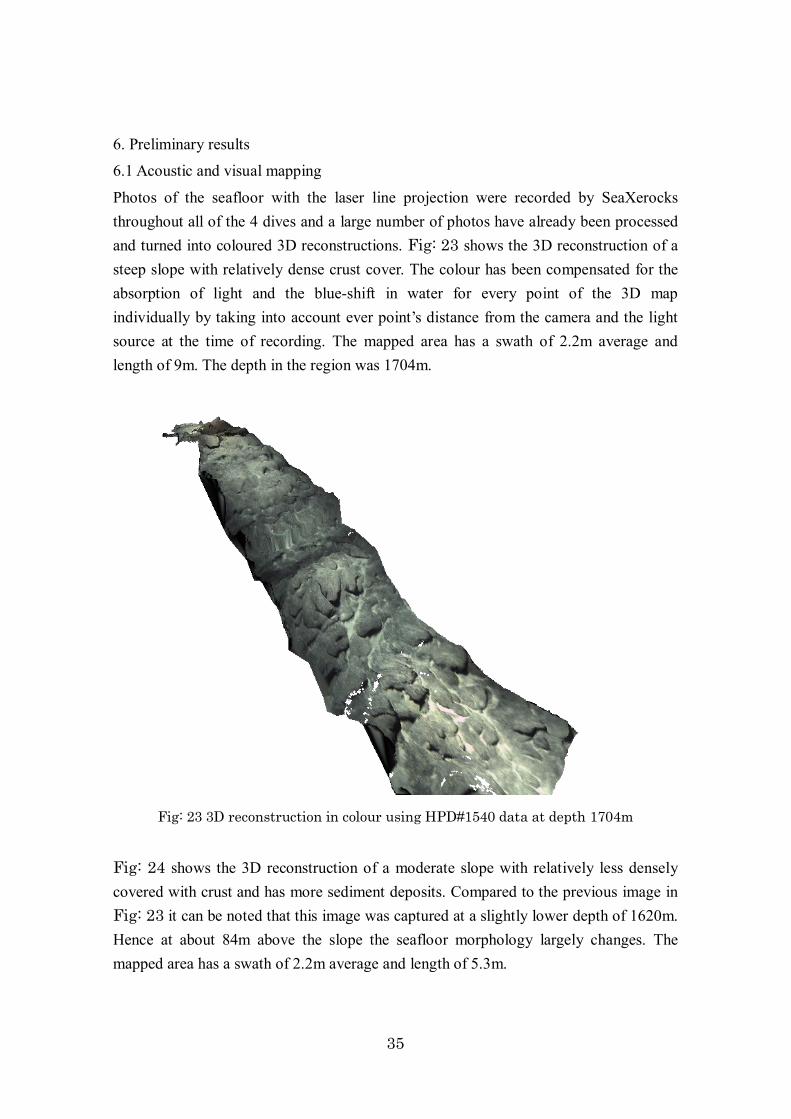
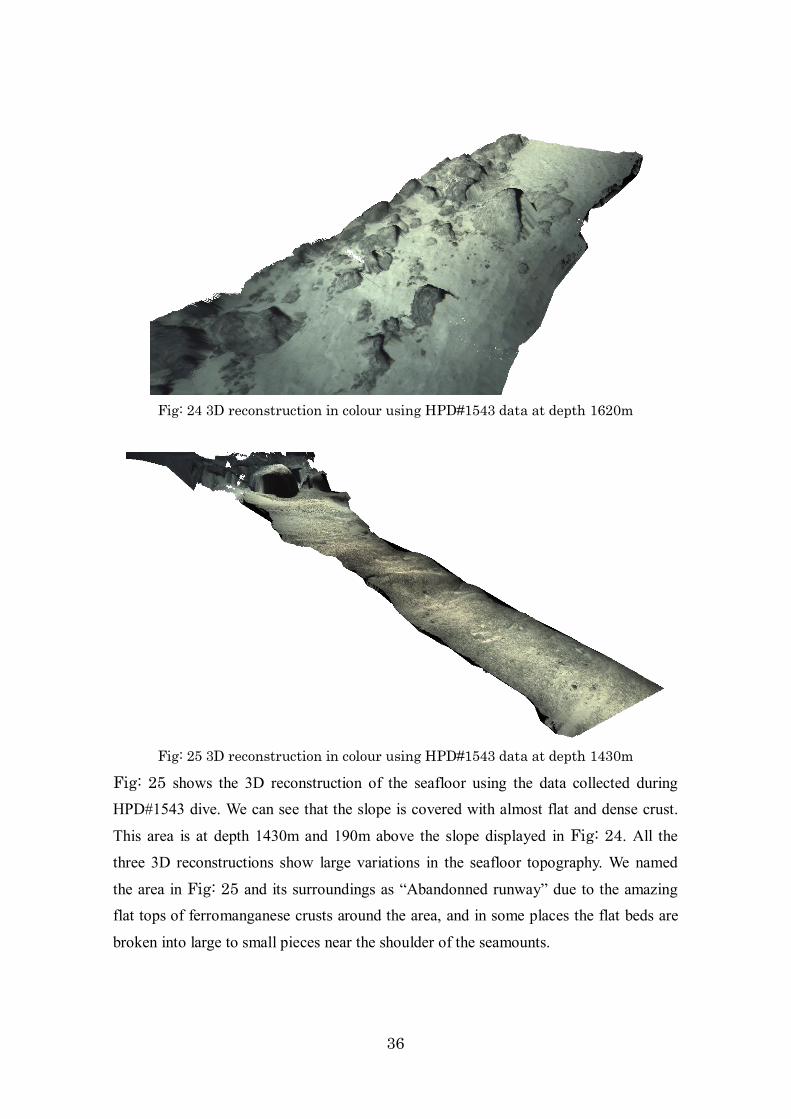
Photos of the seafloor with the laser line projection were recorded by SeaXerocks throughout all of the 4 dives and a large number of photos have already been processed and turned into coloured 3D reconstructions. Fig: 23 shows the 3D reconstruction of a steep slope with relatively dense crust cover. The colour has been compensated for the absorption of light and the blue-shift in water for every point of the 3D map individually by taking into account ever point’s distance from the camera and the light source at the time of recording. The mapped area has a swath of 2.2m average and length of 9m. The depth in the region was 1704m. Fig: 24 shows the 3D reconstruction of a moderate slope with relatively less densely covered with crust and has more sediment deposits. Compared to the previous image in Fig: 23 it can be noted that this image was captured at a slightly lower depth of 1620m. Hence at about 84m above the slope the seafloor morphology largely changes. The mapped area has a swath of 2.2m average and length of 5.3m.
Fig: 23 3D reconstruction in colour using HPD#1540 data at depth 1704m
36
Fig: 24 3D reconstruction in colour using HPD#1543 data at depth 1620m
Fig: 25 3D reconstruction in colour using HPD#1543 data at depth 1430m
Fig: 25 shows the 3D reconstruction of the seafloor using the data collected during HPD#1543 dive. We can see that the slope is covered with almost flat and dense crust.
This area is at depth 1430m and 190m above the slope displayed in Fig: 24. All the
three 3D reconstructions show large variations in the seafloor topography. We named
the area in Fig: 25 and its surroundings as “Abandonned runway” due to the amazing flat tops of ferromanganese crusts around the area, and in some places the flat beds are
broken into large to small pieces near the shoulder of the seamounts.
37
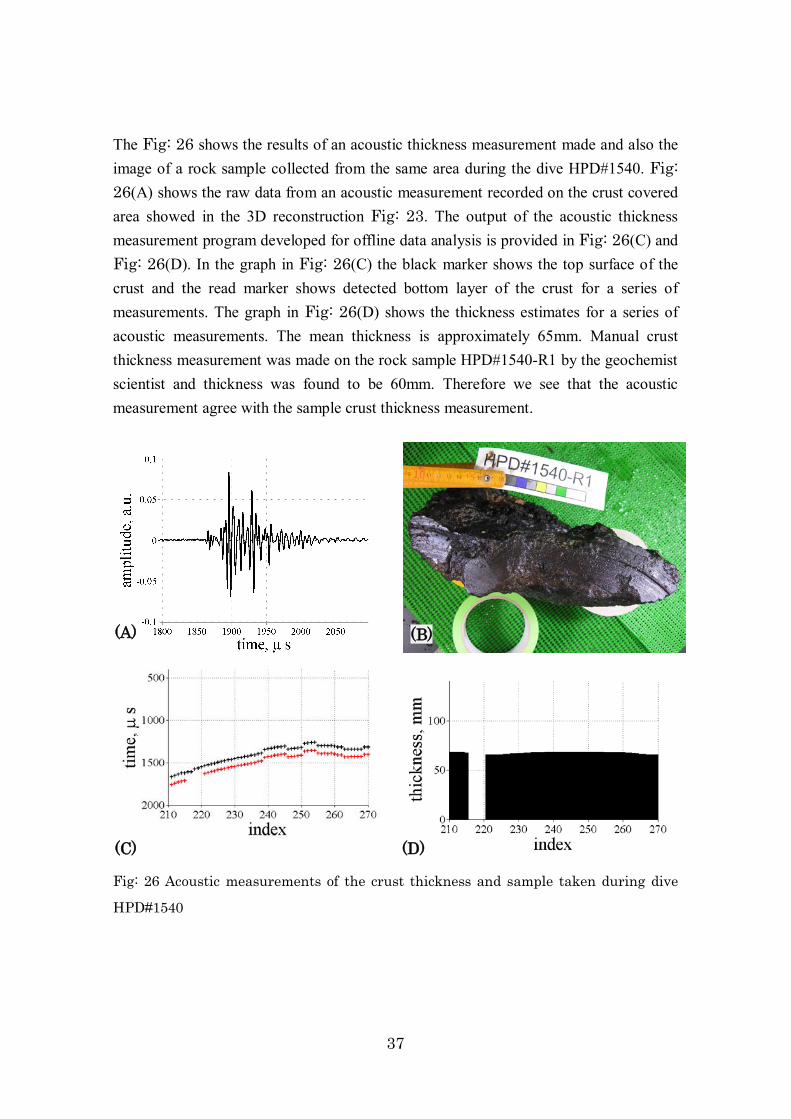
The Fig: 26 shows the results of an acoustic thickness measurement made and also the image of a rock sample collected from the same area during the dive HPD#1540. Fig: 26(A) shows the raw data from an acoustic measurement recorded on the crust covered area showed in the 3D reconstruction Fig: 23. The output of the acoustic thickness measurement program developed for offline data analysis is provided in Fig: 26(C) and Fig: 26(D). In the graph in Fig: 26(C) the black marker shows the top surface of the crust and the read marker shows detected bottom layer of the crust for a series of measurements. The graph in Fig: 26(D) shows the thickness estimates for a series of acoustic measurements. The mean thickness is approximately 65mm. Manual crust thickness measurement was made on the rock sample HPD#1540-R1 by the geochemist scientist and thickness was found to be 60mm. Therefore we see that the acoustic measurement agree with the sample crust thickness measurement.
Fig: 26 Acoustic measurements of the crust thickness and sample taken during dive
HPD#1540
(A) (B)
(C) (D)
38
6.2 Description of samples
6.2.1 Seafloor observation and sampling
The ROV HyperDolphin dived four times (#1540, #1541, #1543, #1544) on the
southern edge of a margin of the flat top and adjacent slope in the southernmost par of
the Takuyo #5 seamount in the Northwestern Pacific.
The acoustic and 3D image mapping system have been operated in the area of
ferromanganese crust pavement zone continuously at the altitude between 1 and 2
meters above the sea floor. The very slow and constant speed of mapping (10 to 20cm
per second) provided us with very important opportunity of careful observation of the
morphology and material over the ferromanganese crusts. A total 10-km mapping lines
were surveyed during the four dives at water depths between 1700 and 1400 meters. We
took 16 intact, undisturbed and in-situ samples of ferromanganese crusts at 13 stops
over the lines. The nine out of the collected samples were scraped from real rock
outcrop and was not collected from fragments or rolling nodules. The seafloor
observation and samples are important to study the mode and controlling factors of the
small-scale variation in composition and configuration of the ferromanganese crusts.
Based on the seafloor observation and brief description of collected samples, we can
suggest a generally uniform development of hydrogenetic ferromanganese crusts over
any firm rock outcrops within the 1 x 2 km area. The thickness of ferromanganese oxide
layer varies within 65 to 90 mm for the flat outcrop near the top above the 1450 m water
depth, while that of the rolling nodules or encrustation on broken rock fragments are
usually less than 10 mm. The thickness seems greatest near the broken flat beds
We also observed small-scale variations in relation to microtopography, gradient, and
bottom sediments, along with the above-mentioned a general uniform developments of
crusts. The amazing flat tops of ferromanganese crusts entirely cover the survey area,
but the flat beds (hardpan) may be broken into large to small pieces possibly near the
shoulder of the seamount (we named it as "Abandoned runway") where the slope
gradient increases. Thin sediment cover, probably less than 10 cm, often veil the surface
of ferromanganese crusts, which prevents us from observation or measurement of the
crusts. The slopes are partly filled with sediments like pockets or stairways, where
nodules or pieces of crusts may occur on or within sediments. The sediments also
widely cover the hardpan ferromanganese crusts over the flat top further inside.
39
6.2.2 Sample Description
The substrate or nucleus are limestone, mostly of reef carbonate, calcareous
conglomerate, phosphorite, or volcanic rocks, which are normal types of basement
rocks for a drowned atoll in the Pacific. A diversity in occurrence of ferromanganese
crusts was found along the line #1540; steep slopes (about 20-30 degrees gradient;
between 1700 and 1500 water depths) are mostly covered with 6-8 cm ferromanganese
oxide crusts underlain by consolidated blocks of slump deposits due to mass wasting.
Such knobby surface, similar to pillow lava flow, may be a result of simulating
coverage of crusts over the rugged rock surface with angular boulders. Sediments are
scarce in the slopes, except occasionally with a trap of sediments or small nodules. At
shallower sea floor above about 1500m, most frequent bottom materials are boulders,
talus, broken pieces of flat crusts, most of the blocks may have run down from the
seamount tops. Above the jigsaw-mosaic rocks zone, A flat hard pan of the
ferromanganese crusts of 10cm thick or less is a general morphology, often with stepped
or bumped surface texture ("Abandoned runway").
The major mineral component of the crusts may be hydrogenetic iron-manganese
mineral "vernadite." Diagenetic influence is rarely observed except on a fully buried
surface within sediments.
6.2.3 Description of sediment samples
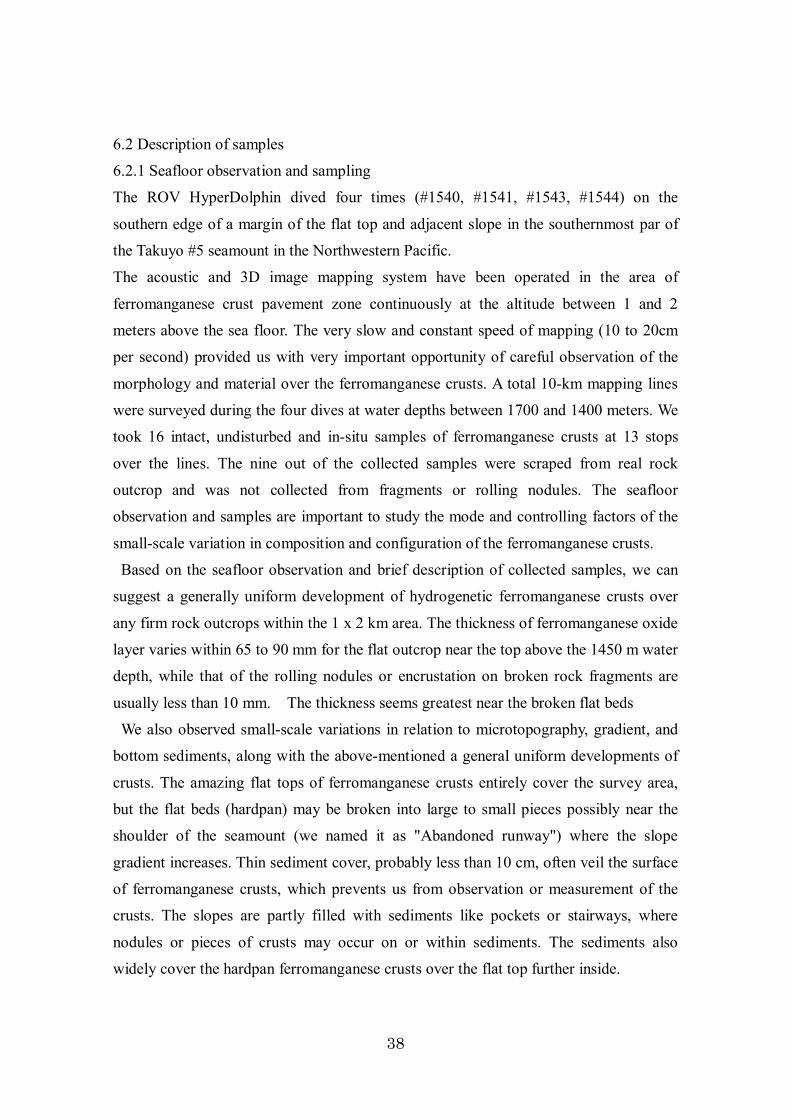
Sediment samples were collected at depths of 1420m and 1439m. At the all sampling
locations, due to thin sediment thickness above the basement and loose aggregation of
coarse grains, sediments were poorly recovered through perpendicular penetration of the
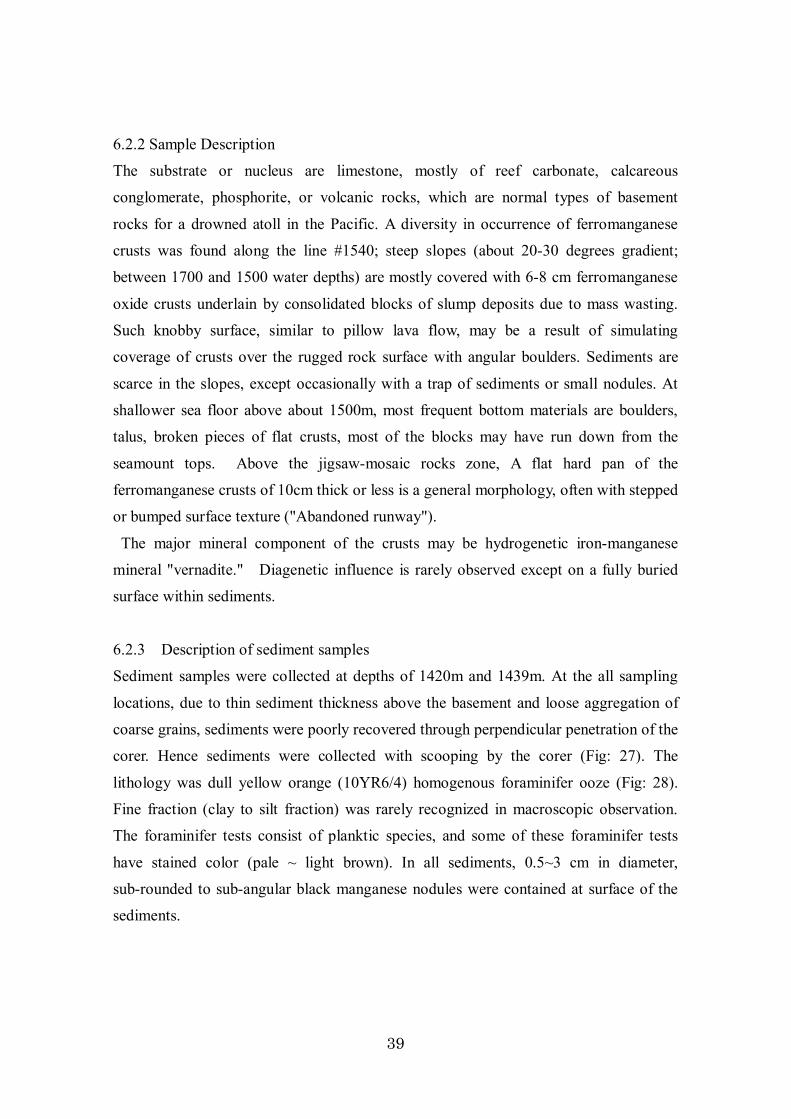
corer. Hence sediments were collected with scooping by the corer (Fig: 27). The
lithology was dull yellow orange (10YR6/4) homogenous foraminifer ooze (Fig: 28).
Fine fraction (clay to silt fraction) was rarely recognized in macroscopic observation.
The foraminifer tests consist of planktic species, and some of these foraminifer tests
have stained color (pale ~ light brown). In all sediments, 0.5~3 cm in diameter,
sub-rounded to sub-angular black manganese nodules were contained at surface of the
sediments.
40
Fig: 27 Photo of push corer sampling of HPD#1540C01
Fig: 28 Close-up photo of the foraminifer ooze, HPD#1540C01

41
7 Future Plan
7.1 Instruments and methods
During this cruise we were able to make efficient measurements of the manganese crust
thickness in steep slopes using the gimbaled sub-surface acoustic probe. The double
gimbal system was useful in the slopes of the seamount to point the acoustic probe in
the direction of the normal to the seafloor. The active control of the double gimbal
system precisely controlled the angle of the gimbal system in real time. The double
gimbal system has become more reliable and accurate compared to operation during
NT12-05 and NT12-25. I can be noted that during NT12-05 a single gimbal system was
used and based on the cruise data results recommendations were made for automatic
realtime control of gimbal angle and a double gimbal system was also recommended.
In NT 12-25 the double gimbal and active realtime control was introduced.
The measurements of the seaXerocks mapping device have been used to generate
several, high resolution 3D reconstructions of the seafloor. Though noise filtering and
colour correction for attenuation have not been performed at this point, the 3D
reconstructions shown in this report can be generated onboard the ship on a standard
laptop PC. The operating range of the mapping system was matched to the acoustic
system, but can be extended for other applications. The 3D reconstructions, when
studied together with the acoustic measurements of crust thickness, provide an effective
method to assess the volumetric distribution of the crust deposits.
At present 3D mapping system and gimbal active control system use separate cameras
and spate computer and software for their operation. The cameras are placed very close
to each other so that they can see almost the same seafloor scene. Hence both the
camera images appear very similar. Therefore it is possible to use a single camera,
computer hardware and a single software program which can do multiple tasks ie. to
capture images for 3D mapping and also do the active realtime gimbal control. This
consolidation of hardware is part of our future plan. This will make the system compact
and light weight so that it can be mounted on smaller vehicles like AUVs. The power
consumption of the system will be substantially reduced by eliminating a computer and
camera.
To make wide area manganese crust volumetric measurements, we are presently
developing an AUV which can carry the double gimbaled acoustic probe and the 3D
mapping system as payload. Details on the AUV development is provided in the next
42
section.
Intially during the cruise we planned to crusts on Rysusei Seamount. However, because
of the rough sea state forecast we had to cancel our initial plan to operate HyperDolphin
on Ryusei seamount and we proceed to Takuyo seamount. We hope to be able to
measure the crust thickness with our survey device on Ryusei seamount in the future as
it is thought that there is extensive crust deposit.
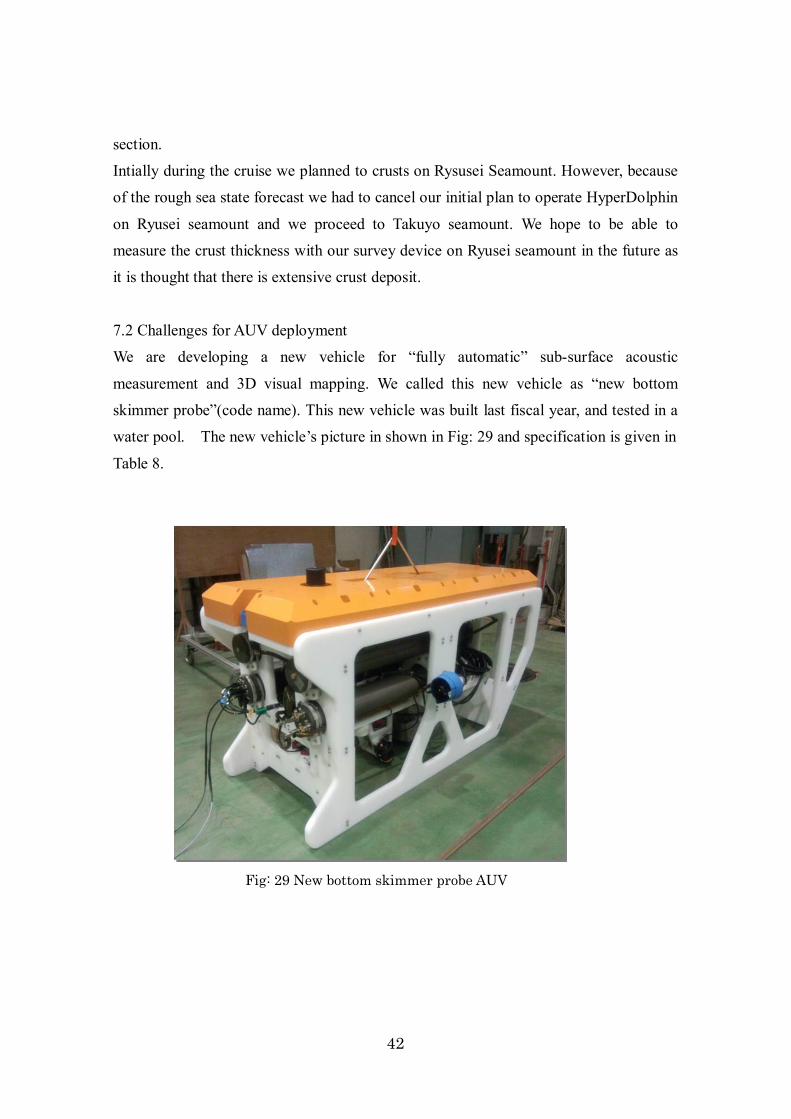
7.2 Challenges for AUV deployment
We are developing a new vehicle for “fully automatic” sub-surface acoustic
measurement and 3D visual mapping. We called this new vehicle as “new bottom
skimmer probe”(code name). This new vehicle was built last fiscal year, and tested in a
water pool. The new vehicle’s picture in shown in Fig: 29 and specification is given in
Table 8.
Fig: 29 New bottom skimmer probe AUV
43
Table 8 New bottom Skimmer probe’s specification
Dimension 1090W×2000L×815H
Weight 550kg in Air / -5kg in seawater
Max Depth 3,000m
Max Speed 1~2 kts
Observation speed ~1kts
Observation altitude 1.5m
Endurance 5 hours @ 1kts
Based on the results from the water pool experiments and after observing the seafloor
topography during this cruise we plan to make several modifications on the new vehicle
for operating at sea. Vehicle’ modification planned are described below.
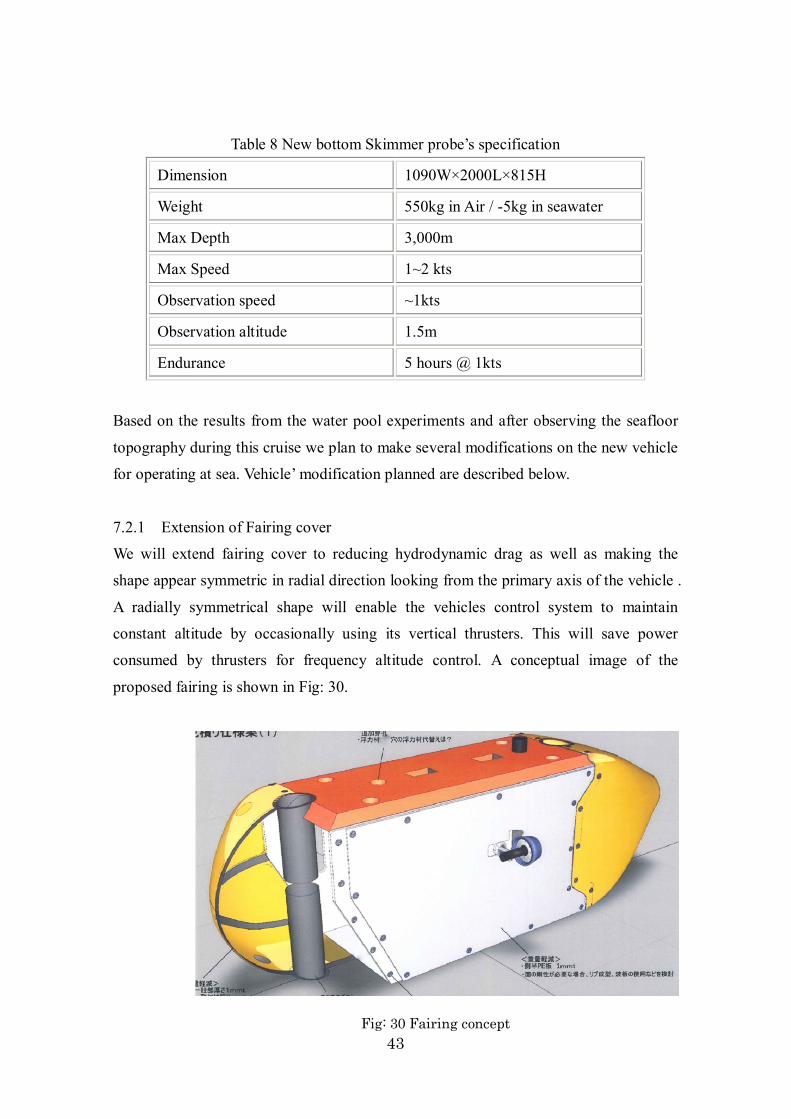
7.2.1 Extension of Fairing cover
We will extend fairing cover to reducing hydrodynamic drag as well as making the
shape appear symmetric in radial direction looking from the primary axis of the vehicle .
A radially symmetrical shape will enable the vehicles control system to maintain
constant altitude by occasionally using its vertical thrusters. This will save power
consumed by thrusters for frequency altitude control. A conceptual image of the
proposed fairing is shown in Fig: 30.
Fig: 30 Fairing concept
44
7.2.2 Power up of forward looking function and constant altitude navigation.
After observing the seafloor in the Takuyo seamount area during this cruise, we
understood that seafloor area with manganese crust deposits can have complicated
terrains with abrupt overhangs. We need to develop new algorithms of forward looking
function and constant altitude navigation.
7.2.3 Autonomous Payload control function
In the present cruise payload control is done manually from the ROV control room.
Therefore we need to develop payload control function for AUV. During the survey
with the AUV, the vehicle should autonomus make decisions regarding the payload
operation. For example when a the vehicle receives a obstacle warning from its obstacle
avoidance system, then the vehicle should turn off its payload automatically and safely
surface. This automatic emergency function should be developed.
7.3 Plan for Future Analysis
The rock slice samples (2 cm thickness each) will be subject to the below mentioned
analysis in collaboration within the shipboard scientists at first and secondly with
shore-based collaborators. The samples and topics of analysis will be shared and
informed to each other among the party to avoid overlapping and to secure their priority
of all members.
We will first select specific key samples from the sites on the track line, and
following analysis will be made mostly on the same slice or columns after discussion
and negotiation.
-Bulk chemical analysis using ICP/AES and ICP/MS for about 2-3 mm intervals.
-Powder X-ray diffraction analysis for the above aliquots
-Microscopic observation on polished and thin sections for the same columns
-Petrography and dating of substrates
-SEM/EDS for crusts
-EPMA/WDS
-XANES, EXAFS
-Isotopes (Be, Os)
-PGE and REE abundances
-more dating (other isotopic, paleomagnetic, paleontological)
45
In order to correlate secular profiles, we should make a layer-by-layer analysis between
stratigraphic columns of ferromanganese crusts. On the other hand, micro-analysis
including LA/ICP-MS, SIMS, TEM observation and analysis will be considered to
specify chemical and mineralogical form of useful elements and fractionation.
46
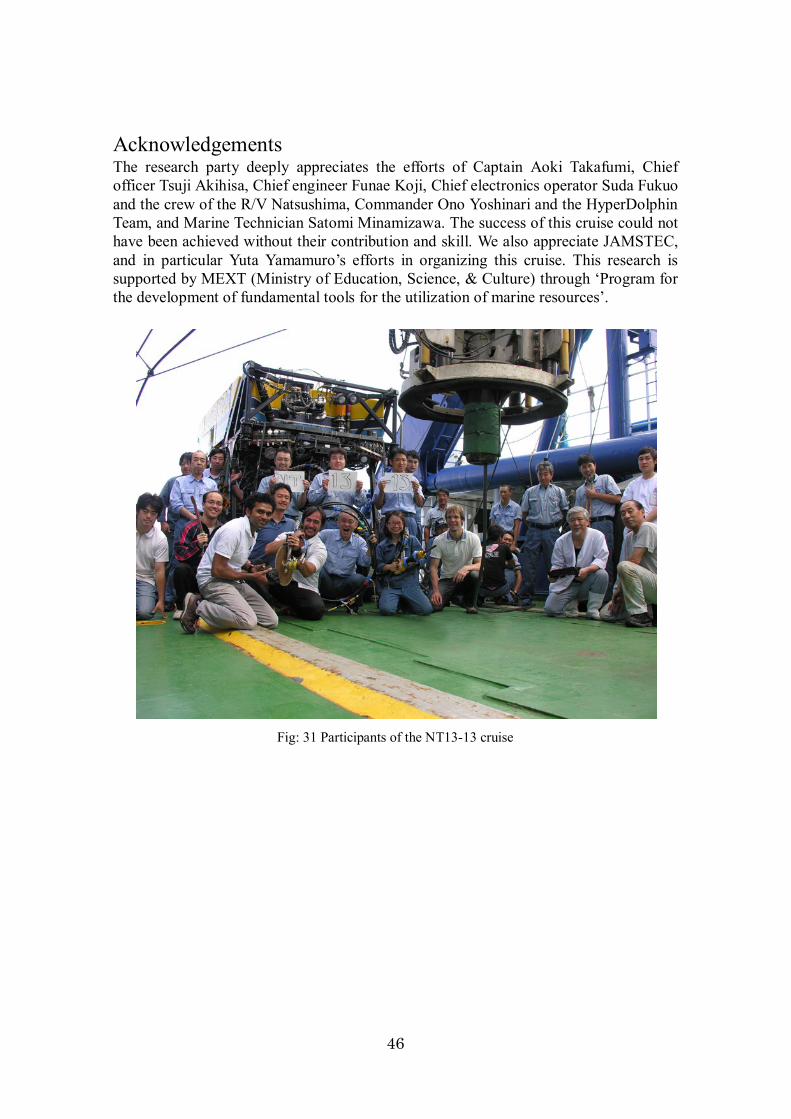
Acknowledgements The research party deeply appreciates the efforts of Captain Aoki Takafumi, Chief officer Tsuji Akihisa, Chief engineer Funae Koji, Chief electronics operator Suda Fukuo and the crew of the R/V Natsushima, Commander Ono Yoshinari and the HyperDolphin Team, and Marine Technician Satomi Minamizawa. The success of this cruise could not have been achieved without their contribution and skill. We also appreciate JAMSTEC, and in particular Yuta Yamamuro’s efforts in organizing this cruise. This research is supported by MEXT (Ministry of Education, Science, & Culture) through ‘Program for the development of fundamental tools for the utilization of marine resources’.
Fig: 31 Participants of the NT13-13 cruise