running head: memory for internal arousal in social anxiety · running head: memory for internal...
TRANSCRIPT
RUNNING HEAD: Memory for internal arousal in social anxiety
Memory for Physiological Feedback in Social Anxiety Disorder:
The Role of Fear of Bodily Sensations
Andrea R. Ashbaugh and Adam S. Radomsky
Concordia University, Montreal, Quebec, Canada
CORRESPONDING AUTHOR:
Adam S. Radomsky Department of Psychology Concordia University 7141 Sherbrooke St. West Montreal, QC, H4B 1R6 CANADA E-mail: [email protected] Phone: +1 514 848 2424 x.2202 FAX: +1 514 848 4523
2
ABSTRACT
This study examined whether individuals with social anxiety disorder (SAD) have a
memory bias for bodily sensations associated with anxiety. Using a physiology false feedback
paradigm, 33 individuals with SAD and 34 non-anxious control participants (NAC) completed a
performance task while monitoring stimuli they were told provided feedback on whether their
physiological response was changing or stable. Reaction time to detect the feedback during the
performance task was assessed, as was memory for the feedback via free recall and recognition
tasks. SAD participants were found to have a slower reaction time to change compared to stable
words, whereas no difference in reaction time for change and stable was found for NAC
participants, In contrast, on measures of free recall and recognition for their feedback no
differences were found between SAD and NAC individuals. Overall, participants exhibited
enhanced memory for stimuli indicative of changing physiological arousal. Furthermore, among
SAD participants only, fear of bodily sensations was associated with enhanced memory for
stimuli associated with physiological responses. Results suggest that it may be necessary to
measure not only fear of social situations, but also the focus of those fears, such as bodily
sensations, when examining memory biases in social anxiety.
KEYWORDS: social anxiety; social anxiety disorder; social phobia; memory bias; fear of
bodily sensations; beliefs
3
Memory for Physiological Feedback in Social Anxiety Disorder:
The Role of Fear of Bodily Sensations
1. Introduction
Cognitive models hypothesize that individuals with social anxiety disorder (SAD) will
exhibit enhanced memory for social threat information (Clark & Wells, 1995; Rapee &
Heimberg, 1997). However, most studies using social threat word stimuli have been
unsuccessful in detecting memory biases in SAD (Cloitre, Cancienne, Heimberg, Holt, &
Liebowitz, 1995; Foa, McNally, & Murdock, 1989; Rapee, McCallum, Melville, Ravenscroft, &
Rodney, 1994). The few studies that have found evidence of a memory bias in social anxiety
have done so for negative public self-referent information (O'Banion & Arkowitz, 1977),
particularly under conditions of social evaluation (Breck & Smith, 1983; Smith, Ingram, &
Brehm, 1983). Some studies have used more ecologically valid stimuli, such as critical or angry
faces (Coles & Heimberg, 2005; Foa, Gilboa-Schectman, Amir, & Freshman, 2000; Lundh &
Öst, 1996a; Lundh & Öst, 1996b; Pérèz-López & Woody, 2001). Though some of these studies
have found evidence of a memory bias among individuals with social anxiety (Foa et al. 2000;
Lundh & Öst, 1996a), several others have failed to find such evidence (Coles & Heimberg, 2005;
Lundh & Öst, 1996b; Pérèz-López & Woody, 2001).
Other researchers have assessed memory for social interactions using both vignettes and
real interactions (Brendle & Wenzel, 2004; Daly, Vangelisti, & Lawrence, 1989; Kimble & Zehr,
1982; Mellings & Alden, 2000; Stopa & Clark, 1993; Wenzel, Finstrom, Jordan, & Brendle,
2005). Brendle and Wenzel (2004) failed to demonstrate that social anxiety was associated with
enhanced recall of negative evaluative information presented in vignettes depicting prototypical
social situations and subsequently replicated this finding using video-taped social situations
4
(Wenzel et al., 2005). Some studies have demonstrated that individuals with high levels of social
anxiety remember fewer details of a social interaction compared to non-anxious controls (Daly et
al., 1989; Kimble & Zehr, 1982; Mellings & Alden, 2000; Stopa & Clark, 1993).
The prediction that social anxiety is associated with enhanced memory for social threat
information has generally not been supported. Studies with positive findings have used self-
referent stimuli (Breck & Smith, 1983; O’Banion & Arkowitz, 1977; Smith et al., 1983),
whereas most negative findings have used general social threat stimuli (Cloitre et al., 1995; Foa
et al., 1989; Rapee et al., 1994). Null findings for memory bias in social anxiety for external
social threat combined with research finding evidence for memory bias for self-referent
information suggest that memory biases in social anxiety may be for information about the self
in social situations.
This idea is consistent with another major aspect of cognitive-behavioral models of social
anxiety; the tendency for socially anxious individuals, in social situations to direct attention
towards the self, particularly thoughts and beliefs about the self, as well as toward bodily
sensations of arousal (Clark & Wells, 1995; Rapee & Heimberg, 1997). Individuals with SAD
report greater levels of public self-consciousness, the tendency to direct attention towards
observable aspects of the self (Fenigstein, Scheier, & Buss, 1975), compared to non-anxious
participants (Hope & Heimberg, 1988; Jostes, Pook, & Florin, 1999; Lundh & Öst, 1996c;
Saboonchi, Lundh, & Öst, 1999). When self-focused attention is experimentally induced,
individuals with SAD exhibit enhanced concern over the impression they will leave (Alden,
Teschuk, & Tee, 1992) and report increased anxiety (Woody, 1996; Woody & Rodriguez, 2000).
Even among individuals without SAD, experimentally induced self-focused attention results in
5
increased concern over rejection (Fenigstein, 1979), suggesting that self-focused attention may
play a causal role in the maintenance of social anxiety.
Consistent with evidence suggesting that social anxiety is associated with enhanced
attention towards aspects of the self, two recent studies have found that individuals high in social
anxiety exhibit attentional biases towards cues of internal arousal versus cues of external social
threat (Mansell, Clark, & Ehlers, 2003; Pineles & Mineka, 2005). Mansell and colleagues
(2003) found that under conditions of anticipated social threat, speech anxious individuals
exhibited an internal bias, which indicated faster response to cues of internal arousal rather than
an external probe, compared to non-anxious individuals. These findings were replicated by
Pineles and Mineka (2005) using visual signals representing arousal rather than tactile signals.
The presence of enhanced attention towards internal cues of arousal in social anxiety may
explain why researchers have generally been unsuccessful in detecting memory biases for
external social threats. It may be that it is the self-focused information for which people with
social anxiety have an enhanced memory. This is consistent with research demonstrating
enhanced memory for self-referent information (Breck & Smith, 1983; O’Banion & Arkowitz,
1977; Smith et al., 1983).
The current study examined whether individuals with SAD exhibit a memory bias for
internal physiological sensations. Participants were asked to complete a video-taped word
pronunciation performance task, as they monitored their physiology. They were told that if the
word appears on one side of the computer screen, it indicates that their physiology is changing,
whereas if it appears on the opposite side of the screen it indicates that their physiology is stable.
After completing the task, participants were subsequently asked to recall and recognize the
6
words they had seen. We predicted that SAD participants would remember more stimuli
associated with changing physiology compared to non-anxious participants.
2. Method
The study design was approved by the ethics committee at Concordia University,
Montreal, Quebec and was carried out in accordance with the Declaration of Helsinki.
2.1 Participants
Participants included individuals diagnosed with SAD (n = 40) and undergraduate
students from Concordia University, Montreal, Quebec (n = 42), who served as a non-anxious
control group (NAC). Participants were recruited via advertisements in local newspapers for
SAD participants, and via notices posted around the university campus as well as announcements
made in classes for NAC participants. To attempt to match the two groups on age, students over
the age of 30 were particularly encouraged to participate during recruitment. Exclusion criteria
included current reports of psychosis, or a current diagnosis of bipolar or panic disorder. All
participants provided informed consent for study procedures at the beginning of the study. As
deception was involved in the study, at the end of the study participants were informed of the
true nature of the study and given the opportunity to withdraw consent to have their data
included in analyses. No participant withdrew consent. Participants received either cash
remuneration, partial credit towards their classes or had their name entered in a draw for cash
prizes in exchange for participating.
Participants were excluded if they indicated that they did not at all believe their
physiology was being monitored (SAD n = 1; NAC n = 1) or they did not learn how to correctly
monitor their physiology (SAD n = 6; NAC n = 7; see section 2.2.7 below for more information).
After excluding these participants, there were 33 individuals in the SAD group and 34
7
individuals in the NAC group. The average age of SAD participants was 34.70 (SD = 11.89) and
64% were female. The average age of NAC participants was 29.53 (SD = 11.59) and 62% were
female. There were no significant differences in age, t (65) = -1.80, p = .08, d = 0.45,or gender,
χ2 (1) = .025, p = .87, between the groups. There was also no significant difference between the
groups with regard to highest level of education attained, U = 468.00, p = .30. Among SAD
participants the distribution of highest level of education attained was as follows: 3% elementary
school, 24% high school, 21% pre-university college1, 51% university. Among NAC
participants the distribution of highest level of education attained was as follows: 21% high
school, 51% pre-university college, 27% university. Data concerning highest level of education
attained was missing for one NAC participant.
Diagnoses were assessed with the Anxiety Disorders Interview Schedule – IV (ADIS-IV;
T. A. Brown, DiNardo, & Barlow, 1994). Individuals in the NAC group did not meet criteria for
any DSM-IV disorder. In the SAD group, the mean ADIS-IV severity score for SAD was 4.70
(Range 4-6; SD = .81). For all but three participants in the SAD group, SAD was the primary
diagnosis. Primary diagnoses for the remaining participants were depression, generalized
anxiety disorder (GAD), and post-traumatic stress disorder (PTSD). Participants reported an
average of 7.48 (SD = 2.05) feared situations with a range from 3 – 11 feared situations. Thus
most SAD participants in this study met criteria for the generalized subtype. Among SAD
participants 21.2% received one additional diagnosis, 30.3% received two additional diagnoses,
and 3% received three additional diagnoses. Six met criteria for GAD, 7 for obsessive-
compulsive disorder, 3 for PTSD, 6 for depression, 1 for substance dependence without
physiological dependence and 1 for substance dependence without physiological dependence in
1 In Quebec students are required to complete a pre-university college which is the equivalent of the final two years of high school in other parts of Canada and the United States.
8
sustained partial remission. Participants meeting criteria for substance dependence agreed not to
use the substance(s) on the evening before or day of the experiment.
Participants were included if they were currently taking medications, though they were
required to be stabilized on the same dosage for at least one month prior to participating in the
study. Among the SAD participants, 27.3% reported currently taking a psychotropic medication.
Medications included selective serotonin reuptake inhibitors (n = 4), tricyclic antidepressants (n
= 1), other types of antidepressants (n = 2), and benzodiazepines (n = 2). Among the NAC
group, 2 participants also reported taking psychotropic medication. One was prescribed an anti-
psychotic drug and the other a benzodiazepine.2
2.2 Measures
2.2.1. Anxiety Disorders Interview Schedule-IV (ADIS-IV; T.A. Brown, et al., 1994).
The ADIS-IV is a semi-structured interview that assesses for the presence of anxiety and
mood disorders using DSM-IV (American Psychiatric Association, 2000) criteria. For each
diagnostic category a dimensional rating from 0 (none) to 8 (very severely disturbing/disabling)
is given at the end of each subsection. Scores greater than 4 indicate that the problem causes
significant distress or interference and that all DSM-IV criteria are met to warrant a diagnosis.
The ADIS-IV has demonstrated good to excellent inter-rater reliability for all categories except
for Dysthymia (T.A. Brown, DiNardo, Lehman, & Campbell, 2001). The interview was
administered by doctoral level students trained to administer the ADIS-IV.
2.2.2. Social Phobia Scale (SPS) and Social Interaction Anxiety Scale (SIAS; Mattick & Clarke,
1998).
2 Results pertaining to the predictions of the study did not change when analyses were rerun excluding the two SAD participants meeting diagnostic criteria for substance dependence without physiological dependence and the two NAC participants who reporting taking psychotropic medication.
9
The SPS and SIAS are 20-item self-report questionnaires assessing the fear of being
observed by others and social interaction anxiety, respectively. Scores greater than 24 on the
SPS or greater than 34 on the SIAS are suggestive of SAD (Heimberg, Mueller, Holt, Hope, &
Liebowitz, 1992). Both scales have exhibited excellent internal consistency, (αs > .85)
(Heimberg et al., 1992; Mattick & Clarke, 1998; Osman, Gutierrez, Barrios, Kopper, & Chiros,
1998), test-retest reliability (Mattick & Clarke, 1998), and convergent and divergent validity in
clinical and non-clinical samples (Heimberg et al., 1992; Mattick & Clarke, 1998). Additionally,
the SPS and the SIAS have been shown to effectively discriminate those with SAD from those
without SAD (E. J. Brown et al., 1997; Mattick & Clarke, 1998; Peters, 2000).
2.2.3 Beck Depression Inventory-II (BDI-II; Beck, Steer, & Brown, 1996).
The BDI-II is a 21-item self-report measure assessing cognitive, affective, and somatic
symptoms of depression. The scale has exhibited acceptable internal consistency (αs > .89)
(Beck et al., 1996; Carmody, 2005; Dozois, Dobson, & Ahnberg, 1998; Osman et al., 1997;
Wiebe & Penley, 2005), test-retest reliability (Beck et al., 1996; Wiebe & Penley, 2005), as well
as acceptable convergent and divergent validity (Beck et al., 1996; Osman et al., 1997) in clinical
and non-clinical samples.
2.2.4 Body Sensations Questionnaire (BSQ; Chambless, Caputo, Bright, & Gallagher, 1984).
The BSQ is a 17-item self-report questionnaire assessing concern and preoccupation with
autonomic arousal. A total score is calculated by averaging the 17 individual items, thus scores
can range from 1 to 5. The scale has exhibited acceptable internal consistency (α = .87) and 1-
month test-retest reliability among a sample of individuals with agoraphobia (Chambless et al.,
1984). The scale has also exhibited acceptable convergent and divergent validity (Chambless et
al., 1984). Research also suggests that this scale is appropriate for use among individuals with
10
other anxiety disorders beyond agoraphobia (Zgourides, Warren, & Englert, 1989). The BSQ
was used as a measure of fear of bodily sensations rather than the Anxiety Sensitivity Index
(ASI; Reiss, Peterson, Gursky, & McNally, 1986) because items simply assess fears of bodily
sensations whereas the ASI also includes wording within the items related to beliefs about the
meaning of some sensations (e.g., “When I notice my heart is beating rapidly, I worry that I
might have a heart attack”) that are likely to be more relevant to panic disorder than SAD.
2.2.5 Subjective Units of Distress Scale (SUDS).
Participants were asked to rate how happy, angry, anxious, and depressed they were
feeling at the present moment using a 100 mm visual analog scale (VAS) from 0 (I do not feel at
all X) to 100 (I feel extremely X) for each emotion at baseline, just prior to, and just after the
word pronunciation task. Only ratings of anxiety were analyzed; the other emotion ratings were
used as filler items.
2.2.6 Performance ratings.
Participants were asked to rate how accurate, clear, expressive and likeable they
anticipated appearing from 0 (not at all) to 100 (completely) just prior to the word pronunciation
task. They were asked to make self-evaluations of these variables using the same rating scale
just after completing the word pronunciation task.
2.2.7 Manipulation check.
At the end of the study participants were asked to rate, using a 100mm VAS, the degree
to which they believed the computer was measuring their physiology from 0 (completely
believed) to 100 (did not believe at all). Participants who did not at all believe the computer was
measuring their performance, by circling 100 on the VAS, were excluded. They were also asked
using a 100mm VAS the degree to which they believed that their physiology was a good

11
indicator of their performance from 0 (physiology reflected my performance) to 100 (physiology
was unrelated to my performance). To ensure that participants correctly learned how to monitor
their physiology based upon the location of the words on the computer screen during the word
pronunciation task, participants were asked whether words on the left indicated their physiology
was stable, changing, or unrelated to their performance. Participants who answered incorrectly
were excluded.
2.3 Word Stimuli
A total of 60 nouns were selected from the Toronto Word List (Friendly, Franklin,
Hoffman, & Rubin, 1982) for use during the word pronunciation and the recognition tasks. The
Toronto Word List contains 1080 nouns that are rated for frequency, imagery, and concreteness
in the English language. Words with the 20 highest and 20 lowest rankings of frequency,
imagery, and concreteness were eliminated from the word list. Words that were shorter than 5
letters were also eliminated. Additionally, all nouns from the Toronto Word List were screened
by nine individuals from the Fear and Anxiety Disorders Lab at Concordia University, who are
familiar with stimuli that may appear threatening to someone with an anxiety disorder,
particularly SAD. Any word identified as potentially threatening (e.g., “speech”, “party” and
“needle”) was eliminated from the word list. From the remaining words, 60 were randomly
selected; 30 words were used for the word pronunciation task and 30 words were used as lures
during the recognition test. All words were matched for word frequency, imagery and
concreteness. Examples of words used include “figure”, “basket”, “silver”, and “province”.
2.4 Procedure
Participants were told that the study examines whether performance on a word
pronunciation task improves if one knows how his/her physiology is responding. Participants
12
were told word pronunciation is an important part of giving a good speech and that changes in
physiology increase the likelihood of word mispronunciation. After being informed of the study
purpose, baseline SUDS were taken and participants were administered the ADIS-IV.
2.4.1 Task Training Phase
After completing the interview, participants were seated in front of a computer. All
experimental tasks (with the exception of questionnaire completion) were completed on the
computer using SuperLab Pro V 2.0.4 (Cedrus Corporation, 2003) software.
During the training phase, the operation of the computer was demonstrated to
participants. Participants were asked to focus on a + that appeared in the centre of the screen.
The + appeared for 1000 ms, and was subsequently replaced by a colored triangle that appeared
either on the left (3.5 inches [8.89 cm] from the top and 1.60 inches [4.11 cm] from the left) or
on the right (3.5 inches [8.89 cm] from the top and 6.34 inches [16.10 cm] from the left) side of a
16 inch (40.64 cm) screen. Participants were asked to press “F” on the keyboard whenever the
triangle appeared on the left and “J” on the keyboard whenever it appeared on the right, and then
to name the color of the triangle. These keys were chosen because they are distinguished by
raised marks, corresponding to the placement of the left and right index finger when touch
typing. After completing 6 training trails, during which half the triangles appeared on the left
and half appeared on the right, the experimenter verified that participants understood the
computer task before continuing on to the next phase of the study.
2.4.2 Physiology Monitoring Training
Following the task training phase, participants were connected to physiology monitoring
equipment. TD-142G vinyl disposable electrodes were attached to the inner elbow of each arm
and a Velcro electrode cuff was attached to the left ring finger of participants. Participants were
13
told that the electrodes attached to the arm measured heart rate fluctuation and the electrode
attached to the finger measured sweating. A Panasonic video camera was mounted directly on
top of the computer monitor facing the participant and a computer microphone was placed just to
the left of the monitor. Participants were told that the camera would measure “jerky awkward
movements,” and that the microphone would measure fluctuations in voice quality. A webcam
was mounted on top of the computer monitor and participants were told that it was an infra-red
camera that would measure how much heat was coming off their body, “a good measure of how
much [they were] blushing.”
Participants were told that the equipment would monitor their physiology and that they
would receive feedback as to whether their physiology was changing or not changing. At no
point in time during the experiment was the physiology of participants ever measured.
Participants were told that when the stimuli appears on one side of the screen (e.g., left) it
indicates that their physiology is changing and when it appears on the other side of the screen
(e.g., right) it indicates that it is stable. The location of stimuli associated with changing and
stable physiology was counterbalanced across participants.
Participants then completed a practice exercise to help them better remember how to
monitor their physiology. The practice exercise was the same as the training task, except that
participants were also asked to say out loud whether their physiology was changing or stable
based on feedback from the computer. To increase the believability of the physiology
manipulation, the practice exercise was completed under two conditions; while sitting quietly
when 5 out of 6 of the triangles appeared in the location associated with stable physiology, and
after having jogged on the spot for 30 seconds when 5 of out 6 of the triangles appeared in the
location associated with changing physiology.
14
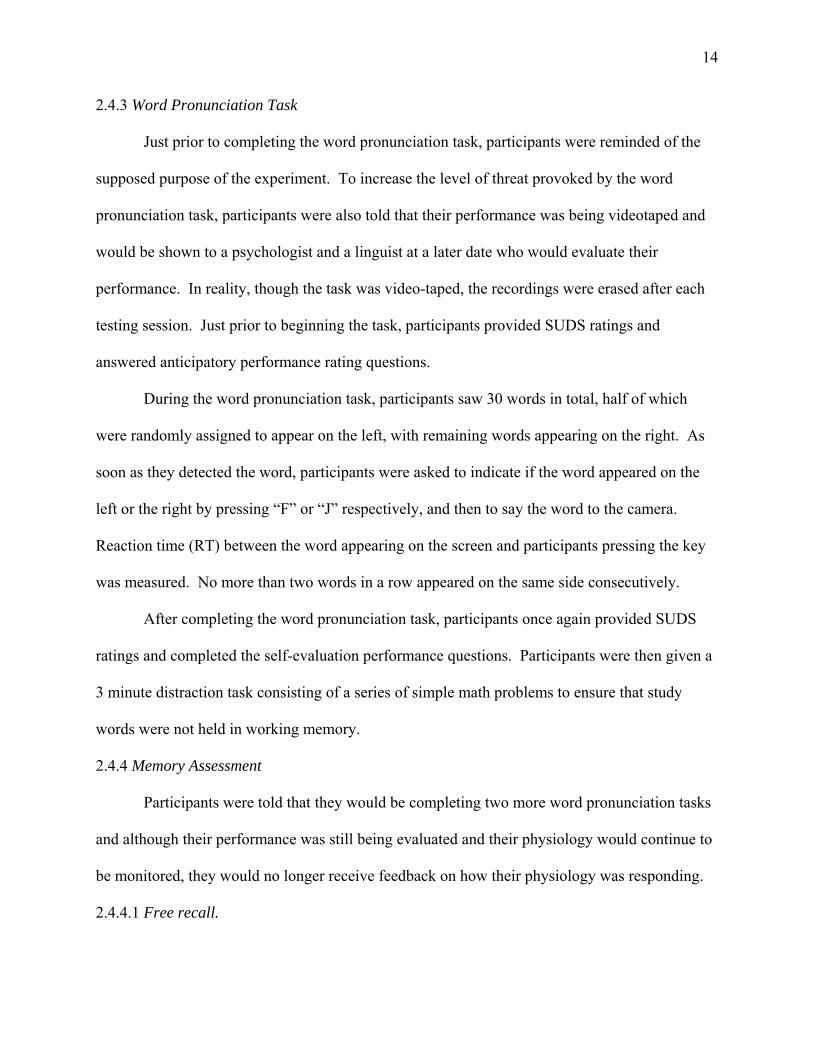
2.4.3 Word Pronunciation Task
Just prior to completing the word pronunciation task, participants were reminded of the
supposed purpose of the experiment. To increase the level of threat provoked by the word
pronunciation task, participants were also told that their performance was being videotaped and
would be shown to a psychologist and a linguist at a later date who would evaluate their
performance. In reality, though the task was video-taped, the recordings were erased after each
testing session. Just prior to beginning the task, participants provided SUDS ratings and
answered anticipatory performance rating questions.
During the word pronunciation task, participants saw 30 words in total, half of which
were randomly assigned to appear on the left, with remaining words appearing on the right. As
soon as they detected the word, participants were asked to indicate if the word appeared on the
left or the right by pressing “F” or “J” respectively, and then to say the word to the camera.
Reaction time (RT) between the word appearing on the screen and participants pressing the key
was measured. No more than two words in a row appeared on the same side consecutively.
After completing the word pronunciation task, participants once again provided SUDS
ratings and completed the self-evaluation performance questions. Participants were then given a
3 minute distraction task consisting of a series of simple math problems to ensure that study
words were not held in working memory.
2.4.4 Memory Assessment
Participants were told that they would be completing two more word pronunciation tasks
and although their performance was still being evaluated and their physiology would continue to
be monitored, they would no longer receive feedback on how their physiology was responding.
2.4.4.1 Free recall.
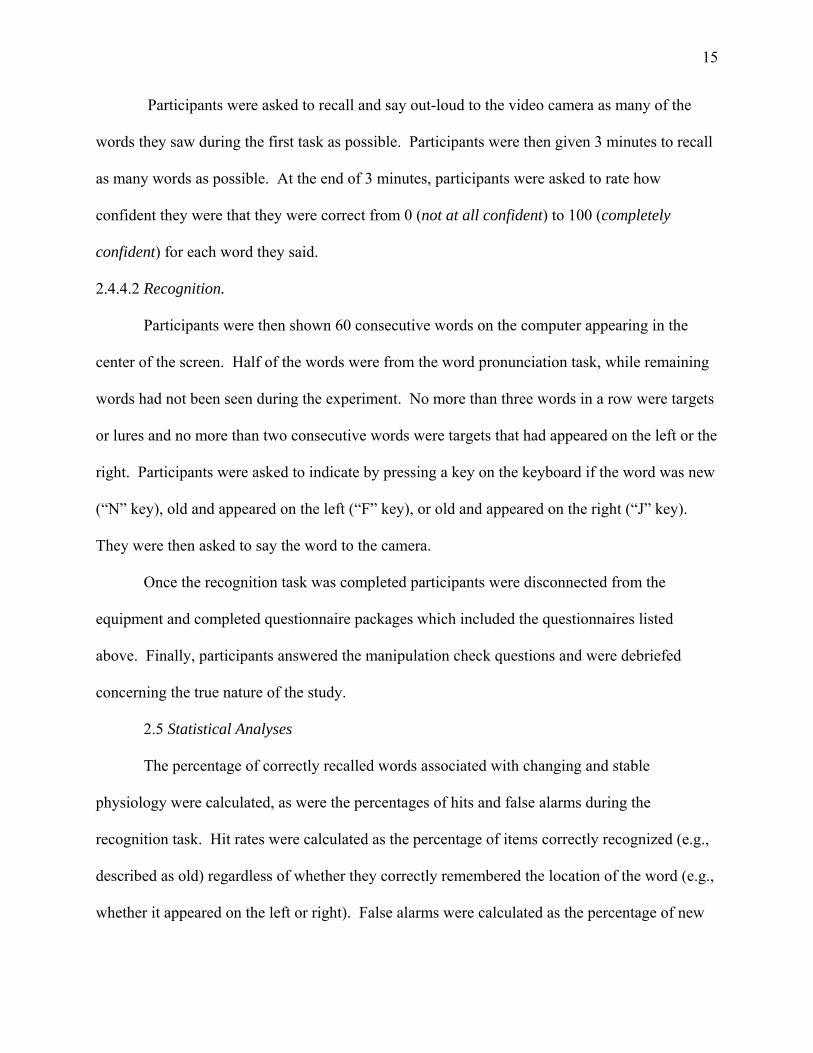
15
Participants were asked to recall and say out-loud to the video camera as many of the
words they saw during the first task as possible. Participants were then given 3 minutes to recall
as many words as possible. At the end of 3 minutes, participants were asked to rate how
confident they were that they were correct from 0 (not at all confident) to 100 (completely
confident) for each word they said.
2.4.4.2 Recognition.
Participants were then shown 60 consecutive words on the computer appearing in the
center of the screen. Half of the words were from the word pronunciation task, while remaining
words had not been seen during the experiment. No more than three words in a row were targets
or lures and no more than two consecutive words were targets that had appeared on the left or the
right. Participants were asked to indicate by pressing a key on the keyboard if the word was new
(“N” key), old and appeared on the left (“F” key), or old and appeared on the right (“J” key).
They were then asked to say the word to the camera.
Once the recognition task was completed participants were disconnected from the
equipment and completed questionnaire packages which included the questionnaires listed
above. Finally, participants answered the manipulation check questions and were debriefed
concerning the true nature of the study.
2.5 Statistical Analyses
The percentage of correctly recalled words associated with changing and stable
physiology were calculated, as were the percentages of hits and false alarms during the
recognition task. Hit rates were calculated as the percentage of items correctly recognized (e.g.,
described as old) regardless of whether they correctly remembered the location of the word (e.g.,
whether it appeared on the left or right). False alarms were calculated as the percentage of new
16
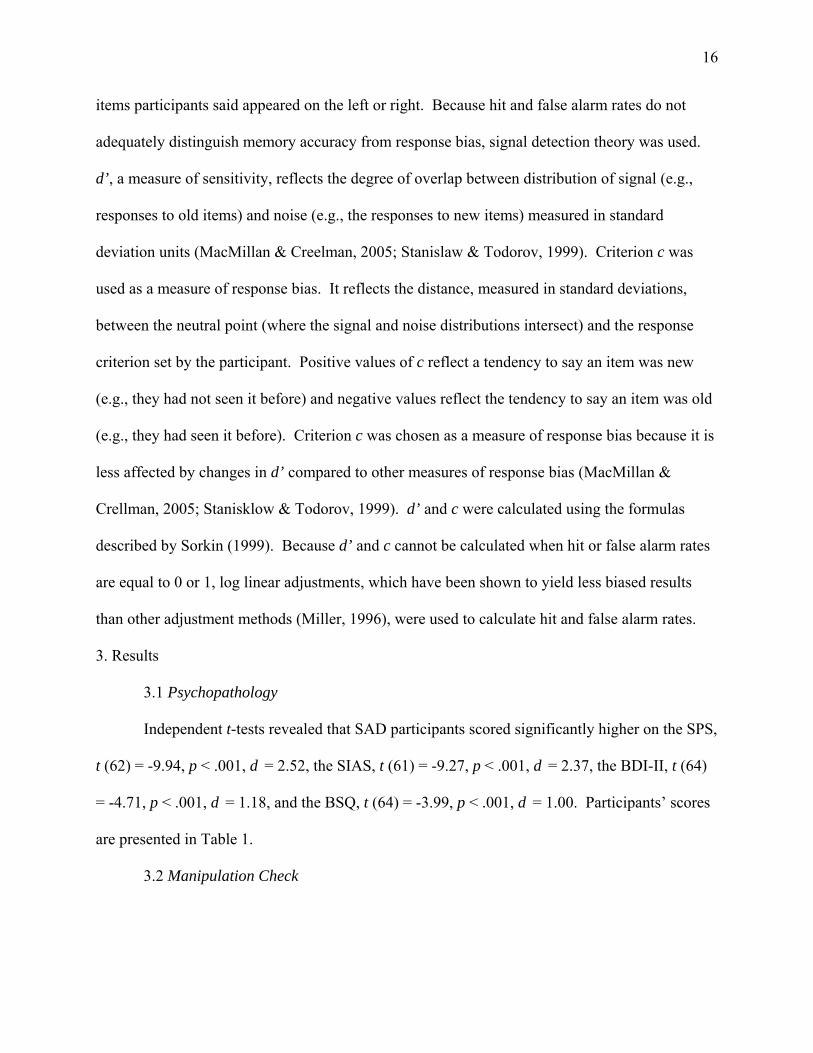
items participants said appeared on the left or right. Because hit and false alarm rates do not
adequately distinguish memory accuracy from response bias, signal detection theory was used.
d’, a measure of sensitivity, reflects the degree of overlap between distribution of signal (e.g.,
responses to old items) and noise (e.g., the responses to new items) measured in standard
deviation units (MacMillan & Creelman, 2005; Stanislaw & Todorov, 1999). Criterion c was
used as a measure of response bias. It reflects the distance, measured in standard deviations,
between the neutral point (where the signal and noise distributions intersect) and the response
criterion set by the participant. Positive values of c reflect a tendency to say an item was new
(e.g., they had not seen it before) and negative values reflect the tendency to say an item was old
(e.g., they had seen it before). Criterion c was chosen as a measure of response bias because it is
less affected by changes in d’ compared to other measures of response bias (MacMillan &
Crellman, 2005; Stanisklow & Todorov, 1999). d’ and c were calculated using the formulas
described by Sorkin (1999). Because d’ and c cannot be calculated when hit or false alarm rates
are equal to 0 or 1, log linear adjustments, which have been shown to yield less biased results
than other adjustment methods (Miller, 1996), were used to calculate hit and false alarm rates.
3. Results
3.1 Psychopathology
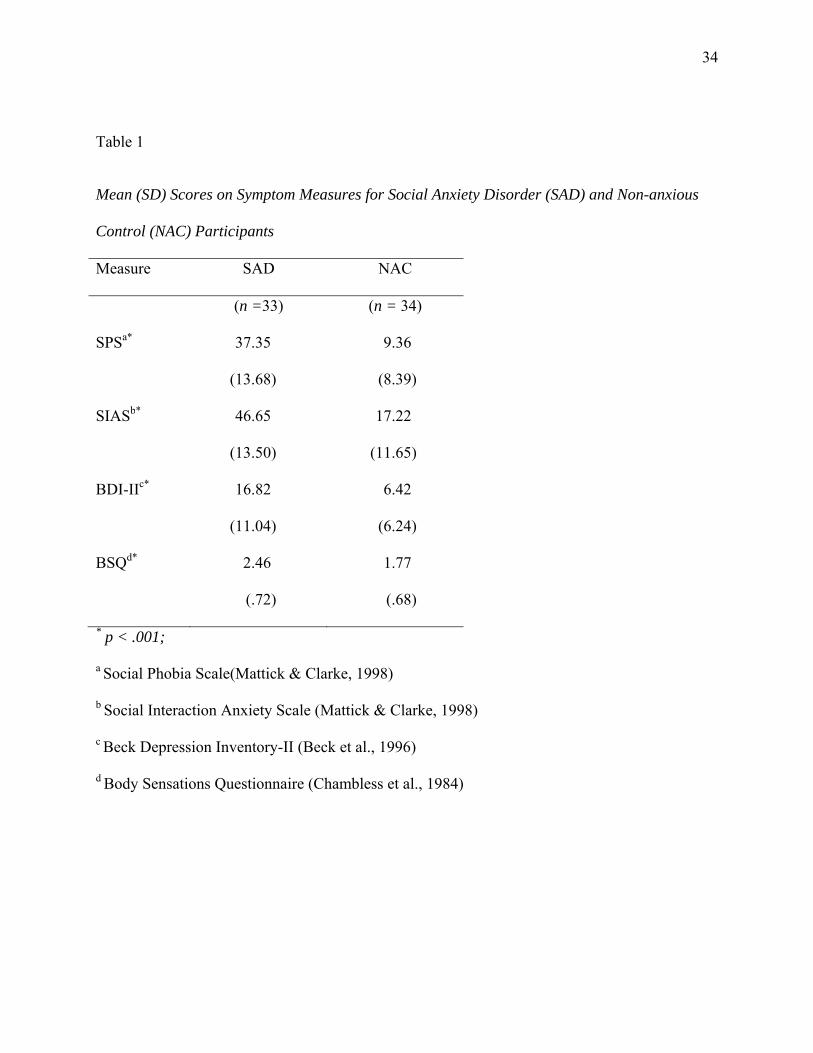
Independent t-tests revealed that SAD participants scored significantly higher on the SPS,
t (62) = -9.94, p < .001, d = 2.52, the SIAS, t (61) = -9.27, p < .001, d = 2.37, the BDI-II, t (64)
= -4.71, p < .001, d = 1.18, and the BSQ, t (64) = -3.99, p < .001, d = 1.00. Participants’ scores
are presented in Table 1.
3.2 Manipulation Check
17
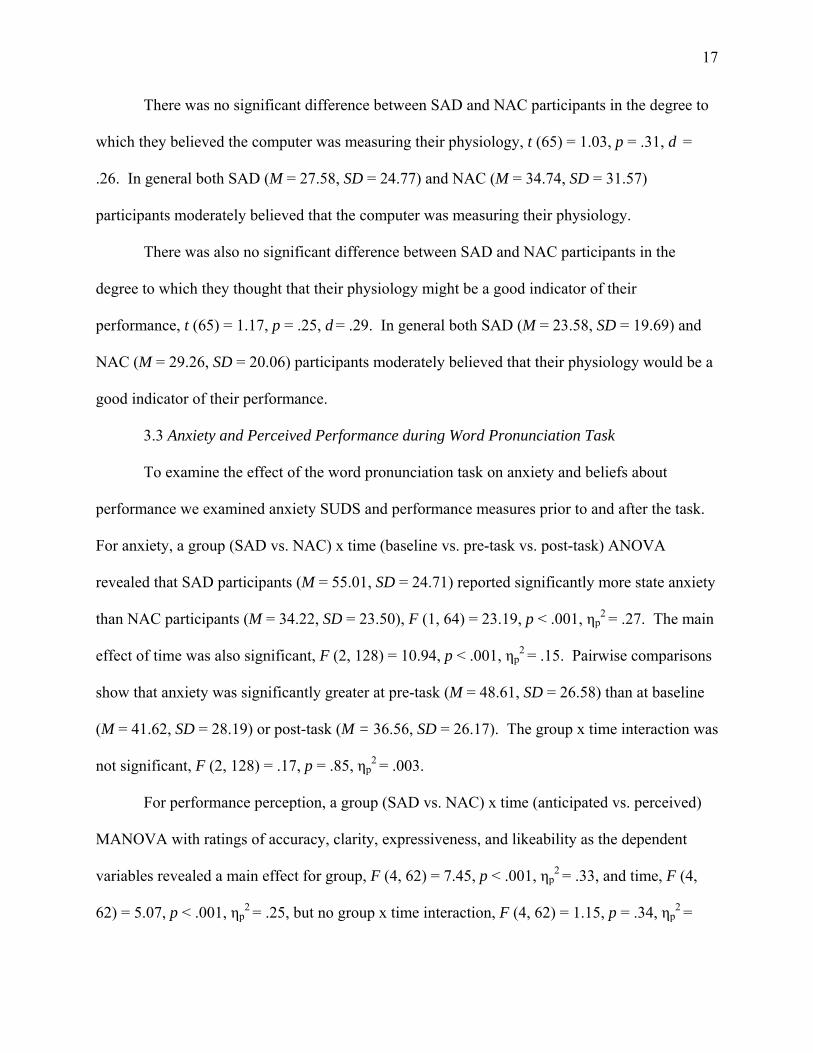
There was no significant difference between SAD and NAC participants in the degree to
which they believed the computer was measuring their physiology, t (65) = 1.03, p = .31, d =
.26. In general both SAD (M = 27.58, SD = 24.77) and NAC (M = 34.74, SD = 31.57)
participants moderately believed that the computer was measuring their physiology.
There was also no significant difference between SAD and NAC participants in the
degree to which they thought that their physiology might be a good indicator of their
performance, t (65) = 1.17, p = .25, d = .29. In general both SAD (M = 23.58, SD = 19.69) and
NAC (M = 29.26, SD = 20.06) participants moderately believed that their physiology would be a
good indicator of their performance.
3.3 Anxiety and Perceived Performance during Word Pronunciation Task
To examine the effect of the word pronunciation task on anxiety and beliefs about
performance we examined anxiety SUDS and performance measures prior to and after the task.
For anxiety, a group (SAD vs. NAC) x time (baseline vs. pre-task vs. post-task) ANOVA
revealed that SAD participants (M = 55.01, SD = 24.71) reported significantly more state anxiety
than NAC participants (M = 34.22, SD = 23.50), F (1, 64) = 23.19, p < .001, ηp2 = .27. The main
effect of time was also significant, F (2, 128) = 10.94, p < .001, ηp2 = .15. Pairwise comparisons
show that anxiety was significantly greater at pre-task (M = 48.61, SD = 26.58) than at baseline
(M = 41.62, SD = 28.19) or post-task (M = 36.56, SD = 26.17). The group x time interaction was
not significant, F (2, 128) = .17, p = .85, ηp2 = .003.
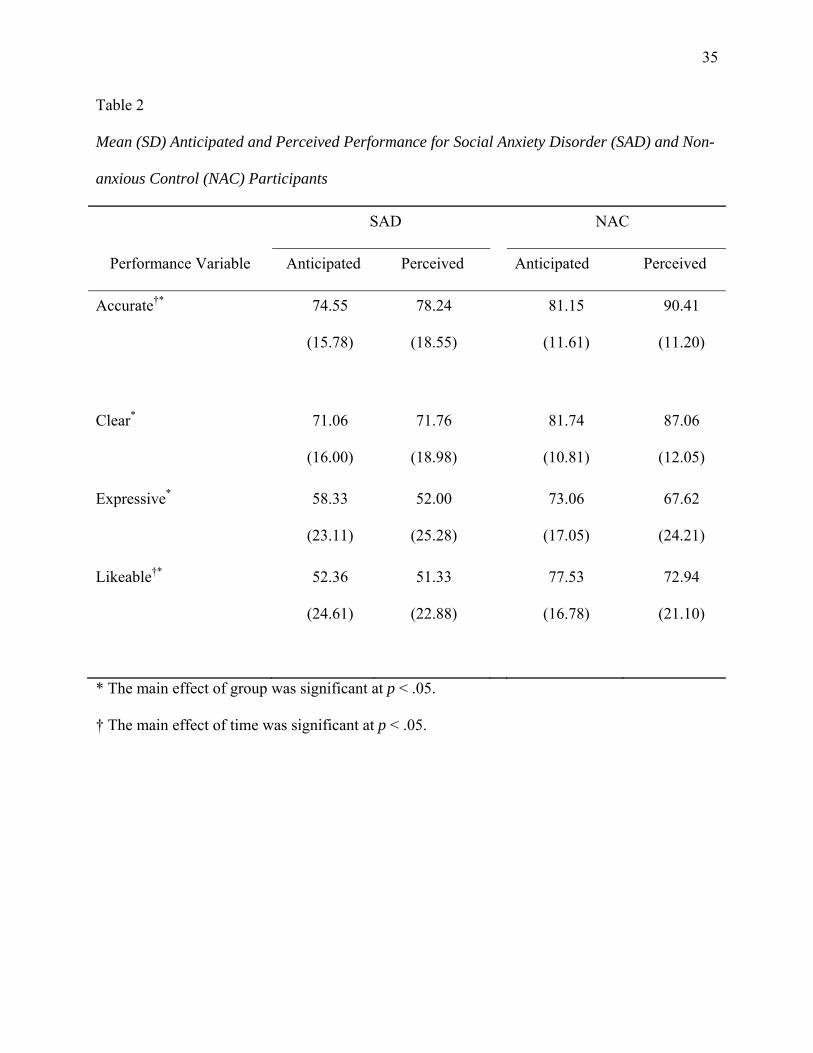
For performance perception, a group (SAD vs. NAC) x time (anticipated vs. perceived)
MANOVA with ratings of accuracy, clarity, expressiveness, and likeability as the dependent
variables revealed a main effect for group, F (4, 62) = 7.45, p < .001, ηp2 = .33, and time, F (4,
62) = 5.07, p < .001, ηp2 = .25, but no group x time interaction, F (4, 62) = 1.15, p = .34, ηp
2 =
18
.07. Univariate ANOVAs demonstrated that compared to perceived ratings, anticipatory ratings
were significantly lower for accuracy, F (1, 65) = 13.36, p < .001, ηp2 = .17, and significantly
higher for how likeable participants thought they were, F (1, 65) = 6.76, p < .05, ηp2 = .09. There
was a trend for participants to also give lower ratings for how clear, F (1, 65) = 3.26, p = .08, ηp2
= .05, and higher ratings for how expressive, F (1, 65) = 3.40, p = .07, ηp2 = .05 they were, when
anticipating their performance prior to the task compared to their perception of their performance
after the task. That is, on some performance measures participants under-anticipated their
performance whereas on other measures they over-anticipated their performance. SAD
participants rated themselves as significantly less accurate, F (1, 65) = 9.26, p < .01, ηp2 = .13,
clear, F (1, 65) = 16.45, p < .001, ηp2 = .20, expressive, F (1, 65) = 9.06, p < .01, ηp
2 = .12, and
likable, F (1, 65) = 21.62, p < .001, ηp2 = .25, overall compared to NAC participants. Results are
presented in Table 2.
3.4 Reaction Time during the Word Pronunciation Task
A group (SAD vs. NAC) x variable (change vs. stable words) ANOVA revealed that
SAD participants responded significantly slower than NAC participants during the word
pronunciation task, F (1, 64) = 8.35, p < .01, ηp2 = .12. There was no main effect for variable, F
(1, 64) = .70, p = .41, ηp2 = .01, however there was a significant group x variable interaction, F
(91, 64) = 5.74, p < .05, ηp2 = .08. Pairwise comparisons demonstrate that participants in the
SAD group responded significantly more slowly to words associated with changing physiology
(M = 1330.42ms, SD = 506.80ms) compared to words associated with stable physiology (M =
1237.69ms, SD = 473.03ms), F (1, 64) = 5.08, p < .05, ηp2 = .07, whereas there was no
significant difference in the NAC group with regard to reaction time for words associated with
19
changing (M = 935.94ms, SD = 442.52ms) or stable (M = 980.59ms, SD = 467.48ms),
physiology, F (1, 64) = 1.25, p = .27, ηp2 = .02.
3.5 Memory
3.5.1 Free Recall
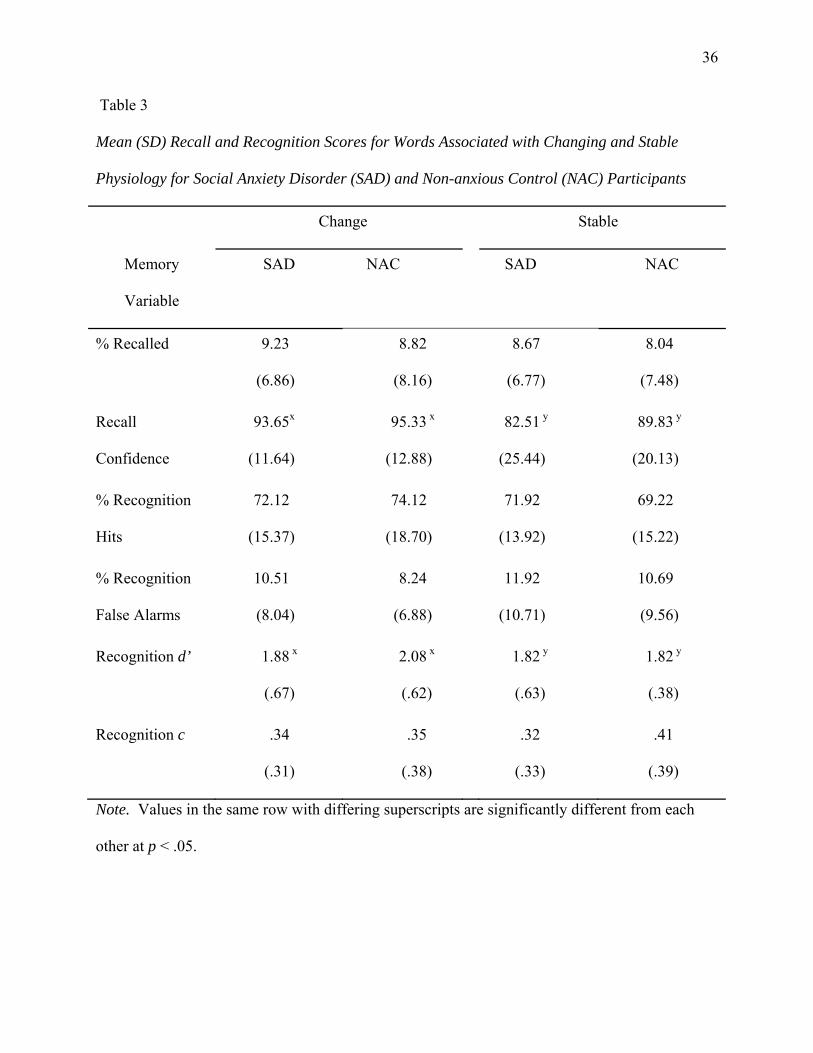
All memory-related results are presented in Table 3. For the percentage of items recalled,
a group x variable ANOVA revealed no significant main effects for group, F (1, 65) = .17, p =
.68, ηp2 = .003, variable, F (1, 65) = .34, p = .56, ηp
2 = .01, nor a significant group x variable
interaction, F (1, 65) = .006, p = .94, ηp2 < .0001. Of items that were correctly recalled, a group
x variable ANOVA found that participants reported significantly greater confidence in their
memory for words associated with changing compared to stable physiology, F (1, 34) = 5.34, p <
.05, ηp2 = .14. There were no significant differences in confidence ratings between groups, F (1,
34) = .76, p = .39, ηp2 = .02, nor was there a significant group x variable interaction, F (1, 34) =
.61, p = .44, ηp2 = .02.
3.5.2 Recognition
For the percentage of hits, a group x variable ANOVA revealed no significant main
effects for group, F (1, 65) = .002, p = .97, ηp2 < .0001, variable, F (1, 65) = 1.78, p = .19, ηp
2 =
.03, nor a significant group x variable interaction, F (1, 65) = 2.10, p = .15, ηp2 = .03.
For false alarm rates, the group x variable ANOVA revealed no significant main effects
for group, F (1, 65) = .13, p = .34, ηp2 = .01, or variable, F (1, 65) = 2.67, p = .11, ηp
2 = .04, nor a
significant group x variable interaction, F (1, 65) = .19, p = .66, ηp2 = .003.
To determine if there were any differences in overall memory accuracy during
recognition we also examined d’. The group x variable ANOVA revealed a significant main
effect for variable, F (1, 65) = 5.05, p < .05, ηp2 = .07. Participants were more accurate at
20
detecting words associated with changing compared to stable physiology. The main effect of
group was not significant, F (1, 65) = .51, p = .48, ηp2 = .008, nor was the group x variable
interaction, F (1, 65) = 2.16, p = .15, ηp2 = .03.
For response bias, a group x variable ANOVA revealed no significant, main effects for
group, F (1, 65) = .35, p = .56, ηp2 = .005, or variable, F (1, 65) = .15, p = .70, ηp
2 = .002, nor a
significant group x variable interaction, F (1, 65) = .75, p = .39 , ηp2 = .01.
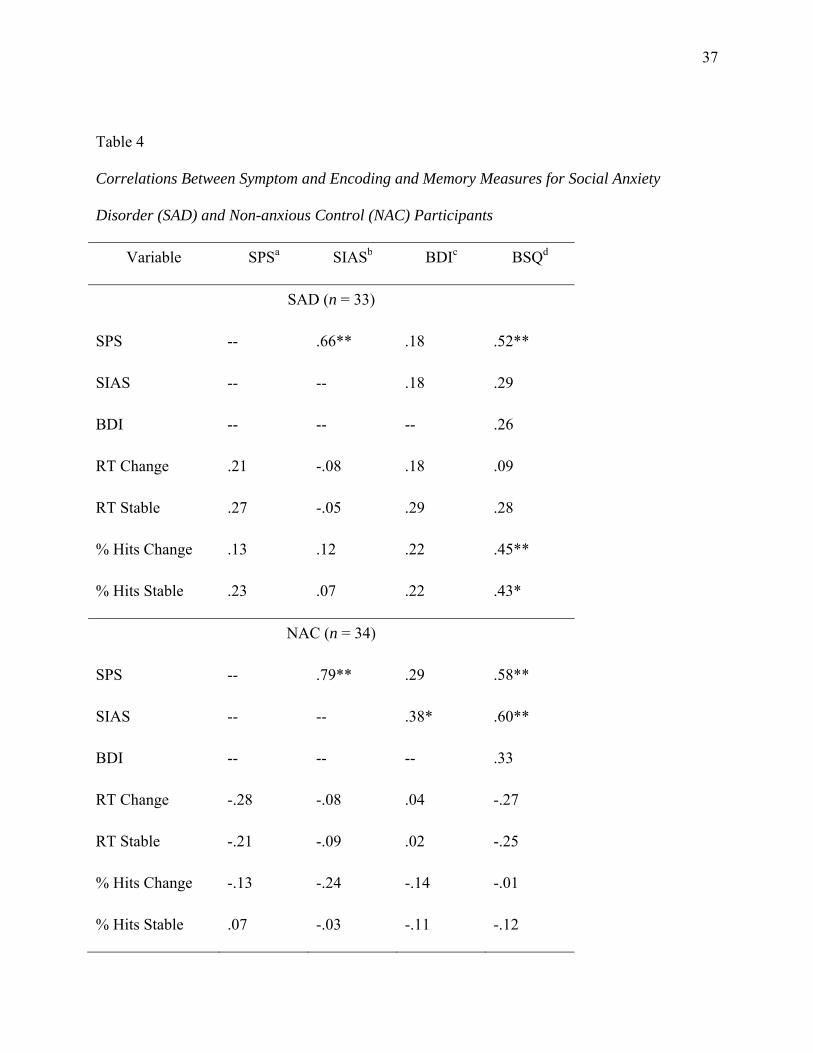
3.6 Correlations Between Information Processing. Depression and Anxiety
To examine the relationships between information processing with symptoms of
depression, social anxiety, and fear of bodily sensations, correlations between the BDI, SPS,
SIAS, and the BSQ with RT during the word task, and percentage of items recognized were
calculated. They are presented in Table 4 for each group. There were no significant correlations
between these symptom variables and RT during the task in the NAC and SAD groups
separately. Among SAD participants, scores on the BSQ were significantly and positively
correlated with percentage of recognized changing and stable items. In the NAC group there
were no significant correlations between recognition and any symptom measure.
To examine if the correlation between the BSQ and the percentage of recognized
changing and stable items was significantly larger among SAD than NAC participants r s were
transformed to Fisher’s Z to test for the significance of differences between independent rs
(Glass & Hopkins, 1984). The correlations for SAD participants were significant larger than the
correlations for NAC participants for both the correlation between the BSQ and the percentage of
hits for stimuli associated with changing physiology, z = 9.03, p < .001, and stimuli associated
with stable physiology, z = 10.60, p < .001.
4. Discussion
21
This study examined whether individuals with SAD exhibit a memory bias for cues they
believed indicated changing physiological arousal. Contrary to expectations we did not find that
individuals with SAD remembered more words associated with changing physiology compared
to a non-anxious control group. We did, however, find that participants, regardless of social
anxiety status, were more accurate in recognizing words associated with changing than stable
physiology and were more confident in their recall of words associated with changing than stable
physiology. That is all participants appeared to show enhanced memory for information that
their physiology was changing.
These results suggest that a memory bias for increasing arousal is not specific to social
anxiety. Other studies have also found that all participants, regardless of social anxiety level,
show enhanced memory for social threat words (Rapee et al., 1994) or affectively valenced
words (Cloitre et al., 1995). One possible explanation for these findings is that processes
implicated in social anxiety, such as self-focused attention, are activated in most individuals
when anxiety increases in social situations. Consistent with this hypothesis, research has found
that overall, individuals, regardless of the level of social anxiety, increase self-focused attention
under evaluative conditions (Mellings & Alden, 2000). What may distinguish individuals with
SAD from individuals without SAD is the degree and frequency of anxiety experienced. To
detect memory biases in SAD, it may be necessary to use a control group reporting minimal
levels of social anxiety or to test memory using performance tasks that provoke very minimal
anxiety in control participants.
An alternative hypothesis is that individual differences in the type(s) of feared stimuli
among SAD participants may determine if memory biases for bodily sensations exist. We found
that among SAD participants only, there was a positive correlation between a measure of fear of
22
bodily sensations and the percentage of items associated with changing and stable physiology
recognized. The relationship between recognition and fear of body sensations was not apparent
among non-anxious participants. That is, SAD participants who tended to report greater fear of
bodily sensations also remembered more stimuli associated with their bodily response.
We also found higher correlations between the SPS and the BSQ than the SIAS and the
BSQ, particularly among SAD participants. This is consistent with other research suggesting
that fear of public speaking, but not fear of social interactions, is associated with fear of bodily
sensations and panic-like symptoms (Hofmann, Ehlers, & Roth, 1995; Norton, Cox, Hewitt, &
McLeod, 1997).
To account for the difficulty in demonstrating memory biases in anxiety, Williams and
colleagues’ (1997) model of emotion and information processing suggests that anxiety is
associated with early pre-attentive information processing biases apparent in attentional tasks
followed by avoidance at the voluntary stage of information processing where explicit memory
biases are likely to occur. This model, however, is inconsistent with clinical observations that
suggest individuals with anxiety often dwell upon fearful situations and models of social anxiety
in particular that implicate post-event processing as one of the maintaining factors (Clark &
Wells, 1995). Our results, though correlational, point to another possibility consistent with a
different approach based on personal significance (see Radomsky & Rachman, 2004). It may be
that at later stages of processing individuals selectively elaborate aspects of a social situation
they believe are most relevant to their anxiety experiences. Individuals with SAD who fear
bodily sensations would be more likely to remember the arousal they experienced during a social
situation but may not be more likely to remember information about bored audience members,
whereas the opposite may be true for individuals with SAD who report fear of judgment from
23
others but less fear of their bodily sensations. Consistent with this alternative hypothesis
regarding anxiety and memory, the few studies that have demonstrated enhanced memory for
threat in social anxiety have used personally relevant stimuli (Breck & Smith, 1983; Daly et al.,
1989; Mellings & Alden, 2000; O’Banion, & Arkowitz, 1977, Smith, et al., 1983). It is also
consistent with research suggesting that memorial biases are likely only to be detected when
interpretation biases are examined concurrently (Hertel, Brozovich, Joormann, & Gotlib, 2008).
Future research assessing memory using more idiographic approaches is warranted. Furthermore
research in which the interpretation of social experiences, such as the meaning of bodily
sensations during a social performance, is manipulated should be conducted to examine how
such interpretations influence memory.
One other interesting finding emerged from this study and warrants discussion. During
the encoding task we found that participants with SAD had longer RTs than non-anxious
participants for words associated with changing but not stable physiology. It may be that slower
response times for stimuli associated with changing physiology observed among SAD
participants resemble the slower response of anxious compared to non-anxious participants to the
‘emotional Stroop’ paradigm (e.g., Lundh & Öst, 1996c). Results could reflect factors that have
also been suggested to affect the emotional Stroop response including cognitive avoidance and
inhibition of response due to the emotional reaction elicited by information that one’s physiology
is changing (Bögels & Mansell, 2004). Previous research has demonstrated that individuals with
social anxiety preferentially attend to internal cues of arousal rather than external cues of social
threat (Mansell et al., 2003; Pineles & Mineka, 2005). Current results suggest that selective
attention may be further refined and directed towards specifically changes in physiological
response. As this study was designed as a memory study rather than an attention study,
24
participants were not asked to respond as soon as they detect the location of the word,
interpretation of these results needs to be made with caution. Future research examining
selective attention for different types of internal cues in social anxiety warrants examination.
Methodologically, this study was one of the few studies to assess memory during a social
task rather than in anticipation of a task. More particularly, this was one of the first studies to
assess memory for personal internal information using an objective method. The alternative
performance task (e.g., the word pronunciation task) in this study was successful in provoking
anxiety and resulted in similar changes in anxiety and perceived performance among SAD and
NAC participants as standard performance tasks (e.g., Ashbaugh, McCabe, Antony, Schmidt, &
Swinson, 2005; Mellings & Alden, 2000). This new methodology may allow researchers to
examine memory and other information processes during anxiety provoking events rather than in
anticipation of them as is frequently done (e.g., Mansell et al., 2003). However, rates of recall
among participants were low ranging from 8.04% to 9.23%. These low rates of recall may have
prevented us from detecting group or stimulus differences in recall. A task that encourages
deeper encoding, such as having participants create sentences with the words, may have
increased rates of recall.
In addition to this methodological challenge, a few other limitations should be noted.
First, to maintain the believability, ecological validity of the task, and encourage deeper
processing of the stimuli of interest, participants were told that changes in physiology results in a
greater likelihood to mispronounce words. This may have led participants to pay particular
attention to stimuli indicative of physiological change and may account for differences in
recognition of stimuli associated with change versus stable physiology, but would not necessarily
account for the correlations between recognition of stimuli associated with change and stable
25
physiology and fear of bodily sensations observed among SAD participants. Additionally,
though most participants likely interepted “changing physiology” to reflect increasing
physiological response, some may have interpretted it to mean decreasing physiological response
as well, which could potentially affect how they process the meaning of such changes. These
individual differences may have increased variability in results. Replication addressing these
limitations is warranted.
Additionally, the SAD group reported higher levels of depression than the NAC group.
However, correlations between reaction time, recognition and scores on the BDI-II were non-
significant for both the NAC and SAD groups, suggesting that depression may not have played a
significant role in determining results. Secondly, our NAC group was comprised of
undergraduate students. Though we attempted to reduce potential differences between the two
groups by actively recruiting students over the age of 30, a community control group may have
been a better comparison group. Future researchers may wish to replicate findings from this
study with depression as a further exclusionary criterion and use a community control group to
further examine memory for physiological arousal in social anxiety. Finally, control for
familywise error rates for the correlational analysis was not possible without substantially
reducing the power of the study, though we did attempt to reduce the possibility of making a
Type I error by limiting the number of correlations between BSQ and memory to percentage
recognized only.
The results of this study suggest that enhanced memory for bodily sensations of arousal
may be apparent in some individuals with SAD, specifically those who report elevated fears of
those sensations. For these individuals, reappraisal of beliefs about bodily sensations,
interoceptive exposure, and attention retraining to reduce self-focus (Wells & Papageorgiou,
26
1998) may be particularly beneficial during cognitive-behavioral treatment. More broadly, these
findings suggest the importance of taking an idiographic approach toward feared stimuli in both
the research and cognitive-behavioral treatment of SAD.
27
References
Alden, L. E., Teschuk, M., & Tee, K. (1992). Public self-awareness and withdrawal from social
interactions. Cognitive Therapy and Research, 16, 249-267.
American Psychiatric Association (2000). Diagnostic and Statistical Manual of Mental
Disorders IV-TR. Washington DC: Author.
Ashbaugh, A. R., McCabe, R. E., Antony, M. M., Schmidt, L. A., & Swinson, R. P. (2005).
Evaluative biases in social anxiety. Cognitive Therapy and Research, 29, 387-398.
Beck, A. T., Steer, R. A., & Brown, G. K. (1996). Beck Depression Inventory manual (2 ed.).
San Antonio, TX: Psychological Corporation.
Bögels, S. M., & Mansell, W. (2004). Attention processes in the maintenance and treatment of
social phobia: hypervigilance, avoidance and self-focused attention. Clinical Psychology
Review, 24, 827-856.
Breck, B. F., & Smith, S. H. (1983). Selective recall of self-descriptive traits by socially anxious
and nonanxious females. Social Behavior and Personality, 11, 71-76.
Brendle, J. R., & Wenzel, A. (2004). Differentiating between memory and interpretation biases
in socially anxious and nonanxious individuals. Behaviour Research and Therapy, 42,
155-171.
Brown, E. J., Turovsky, J., Heimberg, R. G., Juster, H. R., Brown, T. A., & Barlow, D. H.
(1997). Validation of the Social Interaction Anxiety Scale and the Social Phobia Scale
across the anxiety disorders. Psychological Assessment, 9, 1-27.
Brown, T. A., DiNardo, P. A., & Barlow, D. H. (1994). Anxiety Disorders Interview Schedule for
DSM-IV (ADIS-IV). Albany, NY: Graywind.
28
Brown, T. A., DiNardo, P. A., Lehman, C. L., & Campbell, L. A. (2001). Reliability of DSM-IV
anxiety and mood disorders: Implications for the classification of emotional disorders.
Journal of Abnormal Psychology, 110, 49-58.
Carmody, D. P. (2005). Psychometric characteristics of the Beck Depression Inventory-II with
college students of diverse ethnicity. International Journal of Psychiatry in Clinical
Practice, 9, 22-28.
Cedrus Corporation (2003). SuperLab Pro (Version 2.0.4). San Pedro, CA: Author.
Chambless, D. L., Caputo, G. C., Bright, P., & Gallagher, R. (1984). Assessment of fear of fear
in agoraphobics: The Body Sensations Questionnaire and the Agoraphobic Cognitions
Questionnaire. Journal of Consulting and Clinical Psychology, 52, 1090-1097.
Clark, D. M., & Wells, A. (1995). A cognitive model of social phobia. In R. G. Heimberg, M. R.
Liebowitz, D. A. Hope & F. R. Schneier (Eds.), Social phobia: Diagnosis, assessment,
and treatment (pp. 69-93). New York, NY: Guilford Press.
Cloitre, M., Cancienne, J., Heimberg, R. G., Holt, C. S., & Liebowitz, M. (1995). Memory bias
does not generalize across anxiety disorders. Behaviour Research and Therapy, 33, 305-
307.
Coles, M. E., & Heimberg, R. G. (2005). Recognition bias for critical faces in social phobia: A
replication and extension. Behaviour Research and Therapy, 43, 109-120.
Daly, J. A., Vangelisti, A. L., & Lawrence, S. G. (1989). Self-focused attention and public
speaking anxiety. Personality and Individual Differences, 10, 903-913.
Dozois, D. J. A., Dobson, K. S., & Ahnberg, J. L. (1998). A psychometric evaluation of the Beck
Depression Inventory - II. Psychological Assessment, 10, 83-89.
29
Fenigstein, A. (1979). Self-consciousness, self-attention, and social interaction. Journal of
Personality and Social Psychology, 37, 75-86.
Fenigstein, A., Scheier, M.F., & Buss, A.H. (1975). Public and private self-consciousness:
Assessment and Theory. Journal of Consulting and Clinical Psychology, 43, 522-527.
Foa, E. B., Gilboa-Schechtman, E., Amir, N., & Freshman, M. (2000). Memory bias in
generalized social phobia: Remembering negative emotional expressions. Journal of
Anxiety Disorders, 14, 501-519.
Foa, E. B., McNally, R., & Murdock, T. B. (1989). Anxious mood and memory. Behaviour
Research and Therapy, 27, 141-147.
Friendly, M., Franklin, P. E., Hoffman, D., & Rubin, D. C. (1982). The Toronto Word Pool:
Norms for imagery, concreteness, orthographic variables and grammatical usage for 1080
words. Behavior Research Methods, and Instrumentation, 14, 375-399.
Glass, G.V., & Hopkins, K.D. (1984). Statistical methods in education and psychology. (2nd
ed.). Boston: Allyn and Bacon.
Heimberg, R. G., Mueller, G. P., Holt, C. S., Hope, D. A., & Liebowitz, M. (1992). Assessment
of anxiety in social interaction and being observed by others: The Social Interaction
Anxiety Scale and the Social Phobia Scale. Behavior Therapy, 23, 53-73.
Hertel, P.T., Brozovich, F., Joorman, J., & Gotlib, I.H. (2008). Biases in interpretation and
memory in generalized social phobia. Journal of Abnormal Psychology, 117, 278-288.
Hofmann, S. G., Ehlers, A., & Roth, W. T. (1995). Conditioning theory: A model for the
etiology of public speaking anxiety? Behaviour Research and Therapy, 33, 567-571.
Hope, D. A., & Heimberg, R. G. (1988). Public and private self-consciousness and social phobia.
Journal of Personality Assessment, 52, 626-639.
30
Jostes, A., Pook, M., & Florin, I. (1999). Public and private self-consciousness as specific
psychopathological features. Personality and Individual Differences, 27, 1285-1295.
Kimble, C. E., & Zehr, H. D. (1982). Self-consciousness, information load, self-presentation, and
memory in a social situation. Journal of Social Psychology, 118, 39-46.
Lundh, L.-G., & Öst, L.-G. (1996a). Recognition bias for critical faces in social phobics.
Behaviour Research and Therapy, 34, 787-794.
Lundh, L.-G., & Öst, L.-G. (1996b). Face recognition in patients with social phobia.
Scandanavian Journal of Behaviour Therapy, 25, 139-148.
Lundh, L.-G., & Öst, L.-G. (1996c). Stroop interference, self-focus and perfectionism in social
phobics. Personality and Individual Differences, 20, 725-731.
MacMillan, N. A., & Creelman, C. D. (2005). Detection Theory: A User's Guide (2 ed.).
Hillside, NJ: Lawrence Erlbaum Associates.
Mansell, W., Clark, D. M., & Ehlers, A. (2003). Internal versus external attention in social
anxiety: An investigation using a novel paradigm. Behaviour Research and Therapy, 41,
555-572.
Mattick, R. P., & Clarke, J. C. (1998). Development and validation of measures of social phobia
scrutiny fear and social interaction anxiety. Behaviour Research and Therapy, 36, 455-
470.
Mellings, T. M. B., & Alden, L. E. (2000). Cognitive processes in social anxiety: The effects of
self-focus, rumination and anticipatory processing. Behaviour Research and Therapy, 38,
243-257.
Miller, J. (1996). The sampling distribution of d’. Perception and Psychophysics, 58, 65-72.
31
Norton, G. R., Cox, B. J., Hewitt, P. L., & McLeod, L. (1997). Personality factors associated
with generalized and non-generalized social anxiety. Personality and Individual
Differences, 22, 655-660.
O'Banion, K., & Arkowitz, H. (1977). Social anxiety and selective memory for affective
information about the self. Social Behavior and Personality, 5, 321-328.
Osman, A., Downs, W. R., Barrios, F. X., Kopper, B. A., Gutierrez, P. M., & Chiros, C. E.
(1997). Factor structure and psychometric characteristics of the Beck Depression
Inventory-II. Journal of Psychopathology and Behavioral Assessment, 19, 359-376.
Osman, A., Gutierrez, P. M., Barrios, F. X., Kopper, B. A., & Chiros, C. E. (1998). The Social
Phobia and Social Interaction Anxiety Scales: Evaluation of psychometric properties.
Journal of Psychopathology and Behavioral Assessment, 20, 249-264.
Pérèz-López, J. R., & Woody, S. R. (2001). Memory for facial expressions in social phobia.
Behaviour Research and Therapy, 39, 967-975.
Peters, L. (2000). Discriminant validity of the Social Phobia and Anxiety Inventory (SPAI), the
Social Phobia Scale (SPS) and the Social Interaction Anxiety Scale (SIAS). Behaviour
Research and Therapy, 38, 943-950.
Pineles, S. L., & Mineka, S. (2005). Attentional biases to internal and external sources of
potential threat in social anxiety. Journal of Abnormal Psychology, 114, 314-318.
Radomsky, A. S., & Rachman, S. (2004). The importance of importance in OCD memory
research. Journal of Behavior Therapy and Experimental Psychiatry, 35, 137-151.
Rapee, R. M., & Heimberg, R. G. (1997). A cognitive-behavioral model of anxiety in social
phobia. Behaviour Research and Therapy, 35, 741-756.
32
Rapee, R. M., McCallum, S. L., Melville, L. F., Ravenscroft, H., & Rodney, J. M. (1994).
Memory bias in social phobia. Behaviour Research and Therapy, 32, 89-99.
Reiss, S., Peterson, R. A., Gursky, D. M., & McNally, R. (1986). Anxiety sensitivity, anxiety
frequency and the prediction of fearfulness. Behaviour Research and Therapy, 24, 1-8.
Saboonchi, F., Lundh, L.-G., & Öst, L.-G. (1999). Perfectionism and self-consciousness in social
phobia and panic disorder with agoraphobia. Behaviour Research and Therapy, 37, 799-
808.
Smith, T. W., Ingram, R. E., & Brehm, S. S. (1983). Social anxiety, anxious self-preoccupation,
and recall of self-relevant information. Journal of Personality and Social Psychology, 44,
1276-1283.
Sorkin, R. D. (1999). Spreadsheet signal detection. Behavior Research Methods, Instruments,
and Computers, 31, 46-54.
Stanislaw, H., & Todorov, N. (1999). Calculation of signal detection theory measures. Behavior
Research Methods, Instruments, and Computers, 31, 137-149.
Stopa, L., & Clark, D. M. (1993). Cognitive processes in social phobia. Behaviour Research and
Therapy, 31, 255-267.
Wells, A., & Papageorgiou, C. (1998). Social phobia: Effects of external attention on anxiety,
negative beliefs, and perspective taking. Behavior Therapy, 29, 357-370.
Wenzel, A., Finstrom, N., Jordan, J., & Brendle, J. R. (2005). Memory and interpretation of
visual representations of threat in socially anxious and nonanxious individuals. Behaviour
Research and Therapy, 43, 1029-1044.
Wiebe, J. S., & Penley, J. A. (2005). A psychometric comparison of the Beck Depression
Inventory-II in English and Spanish. Psychological Assessment, 17, 481-485.
33
Williams, J. M. G., Watts, F. N., MacLeod, C., & Mathews, A. (1997). Cognitive Psychology
and Emotional Disorders. New York: Wiley.
Woody, S. R. (1996). Effects of focus of attention on anxiety levels and social performance of
individuals with social phobia. Journal of Abnormal Psychology, 105, 61-69.
Woody, S. R., & Rodriguez, B. F. (2000). Self-focused attention and social anxiety in social
phobics and normal controls. Cognitive Therapy and Research, 24, 473-488.
Zgourides, G. D., Warren, R., & Englert, M. E. (1989). Further evidence of construct validity for
the agoraphobic cognitions questionnaire and the body sensations questionnaire.
Psychological Reports, 64, 590.
34
Table 1
Mean (SD) Scores on Symptom Measures for Social Anxiety Disorder (SAD) and Non-anxious
Control (NAC) Participants
Measure SAD NAC
(n =33) (n = 34)
SPSa* 37.35
(13.68)
9.36
(8.39)
SIASb* 46.65
(13.50)
17.22
(11.65)
BDI-IIc* 16.82
(11.04)
6.42
(6.24)
BSQd* 2.46
(.72)
1.77
(.68)
* p < .001;
a Social Phobia Scale(Mattick & Clarke, 1998)
b Social Interaction Anxiety Scale (Mattick & Clarke, 1998)
c Beck Depression Inventory-II (Beck et al., 1996)
d Body Sensations Questionnaire (Chambless et al., 1984)
35
Table 2
Mean (SD) Anticipated and Perceived Performance for Social Anxiety Disorder (SAD) and Non-
anxious Control (NAC) Participants
SAD NAC
Performance Variable Anticipated Perceived Anticipated Perceived
Accurate†* 74.55
(15.78)
78.24
(18.55)
81.15
(11.61)
90.41
(11.20)
Clear* 71.06
(16.00)
71.76
(18.98)
81.74
(10.81)
87.06
(12.05)
Expressive* 58.33
(23.11)
52.00
(25.28)
73.06
(17.05)
67.62
(24.21)
Likeable†* 52.36
(24.61)
51.33
(22.88)
77.53
(16.78)
72.94
(21.10)
* The main effect of group was significant at p < .05.
† The main effect of time was significant at p < .05.
36
Table 3
Mean (SD) Recall and Recognition Scores for Words Associated with Changing and Stable
Physiology for Social Anxiety Disorder (SAD) and Non-anxious Control (NAC) Participants
Change Stable
Memory
Variable
SAD NAC SAD NAC
% Recalled 9.23
(6.86)
8.82
(8.16)
8.67
(6.77)
8.04
(7.48)
Recall
Confidence
93.65x
(11.64)
95.33 x
(12.88)
82.51 y
(25.44)
89.83 y
(20.13)
% Recognition
Hits
72.12
(15.37)
74.12
(18.70)
71.92
(13.92)
69.22
(15.22)
% Recognition
False Alarms
10.51
(8.04)
8.24
(6.88)
11.92
(10.71)
10.69
(9.56)
Recognition d’ 1.88 x
(.67)
2.08 x
(.62)
1.82 y
(.63)
1.82 y
(.38)
Recognition c .34
(.31)
.35
(.38)
.32
(.33)
.41
(.39)
Note. Values in the same row with differing superscripts are significantly different from each
other at p < .05.
37
Table 4
Correlations Between Symptom and Encoding and Memory Measures for Social Anxiety
Disorder (SAD) and Non-anxious Control (NAC) Participants
Variable SPSa SIASb BDIc BSQd
SAD (n = 33)
SPS -- .66** .18 .52**
SIAS -- -- .18 .29
BDI -- -- -- .26
RT Change .21 -.08 .18 .09
RT Stable .27 -.05 .29 .28
% Hits Change .13 .12 .22 .45**
% Hits Stable .23 .07 .22 .43*
NAC (n = 34)
SPS -- .79** .29 .58**
SIAS -- -- .38* .60**
BDI -- -- -- .33
RT Change -.28 -.08 .04 -.27
RT Stable -.21 -.09 .02 -.25
% Hits Change -.13 -.24 -.14 -.01
% Hits Stable .07 -.03 -.11 -.12
38
* p < .05
** p < .01
a Social Phobia Scale (Mattick & Clarke, 1998)
b Social Interaction Anxiety Scale (Mattick & Clarke, 1998)
c Beck Depression Inventory-II (Beck et al., 1996)
d Body Sensations Questionnaire (Chambless et al., 1984)