rowland unified school district€¦ · fiscal year 2017 -2018 . budget presentation. june 6, 2017....
TRANSCRIPT

Fiscal Year 2017-2018 Budget Presentation
June 6, 2017
1
Rowland Unified School District

2017-2018 Budget• Local Control Funding Formula • Unrestricted General Fund 17-18 • Restricted General Fund 17-18• Multi Year Projections
• Major Assumptions• STRS/PERS Annual Cost Increases• Multi-year Unrestricted General Fund• Multi-year Restricted General Fund 2
Overview of Presentation

Adopted LCAP & Budget
(2017-18) Unaudited Actual
Results for 2016-17
1st Interim
Financial Report
Audit Report
Accepted
Governor’s Budget
Proposal
2nd
Interim Financial Report
Preliminary Budget
May Revise
Present Final LCAP & Budget (2017-18)
3
June
December
January
March
May
April
July
We Are Here!September

In 2013, California dramatically reformed the way it funds our public schools. LCFF established a funding system that provides school districts with base funding and additional funds based on how many low-income students, English learners, and foster youth they serve.
4
B A S EG R A N T S
Every student generates a base grant, which funds basic educational costs, such as teacher salaries, retirement costs, instructional materials, etc.
S U P P L E M E N TA L G R A N T S
Every student who is low-income, learning English, or in foster care generates 20% more funding above the base grant.
These funds must be spent on increasing and improving services for these high-need student groups in order to improve their achievement.
C O N C E N T R AT I O N G R A N T S
In districts where at least 55% of students are high-need, those high-need students above the 55% enrollment threshold generate an extra 50% of the base grant.
These funds must also be spent to increase or improve services for high-need students in order to improve their achievement.
$107,129,080 $23,172,154
How the Local Control Funding Formula (LCFF) Works
5
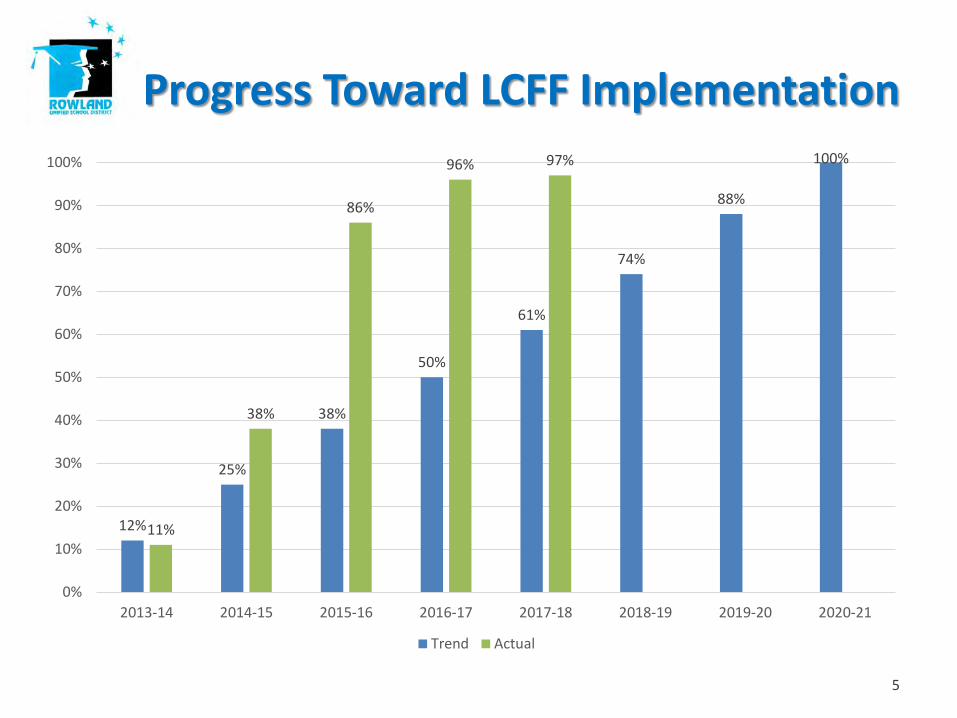
12%
25%
38%
50%
61%
74%
88%
100%
11%
38%
86%
96% 97%
0%
10%
20%
30%
40%
50%
60%
70%
80%
90%
100%
2013-14 2014-15 2015-16 2016-17 2017-18 2018-19 2019-20 2020-21
Trend Actual
Progress Toward LCFF Implementation

2017-2018 BUDGET
6

$107.1, 80%
$23.2, 17%
$2.7, 2%$910,000, 1%
LCFF - Base
LCFF - Supplemental & Concentration
Other State & Fed
Local Miscellaneous
2017-18 Unrestricted General Fund Revenue in Millions
7
2017-2018 Unrestricted General Fund Revenue
Revenues and Other Financing Sources
LCFF $130,301,234
Federal Revenues 0
Other State Revenues
$2,750,449
Other Local Revenues
$910,000
Total $133,961,683

$104,396,610 , 78%
$4,863,963 , 4%
$7,214,562 , 5%
$0 , 0%
$16,391,404 , 13%
Salaries &Benefits
Books &Supplies
Services/Operating Expenses
Capital Outlay
Transfers Out/Other Uses
UNRESTRICTED General Fund Expenditures in dollars
8
Projected Unrestricted General Fund Expenditures 2017-2018
Expenditures and Other Financing Uses
Certificated Salaries
$61,390,372
Classified $17,190,895
Employee Benefits $25,815,343
Books and Supplies $4,863,963
Service and Other Operating Expenditures
$7,214,562
Capital Outlay $0
Other Outgo $1,832,644
Indirect -$1,234,806
Other Financing Sources
$16,391,404
Total $133,464,377
9
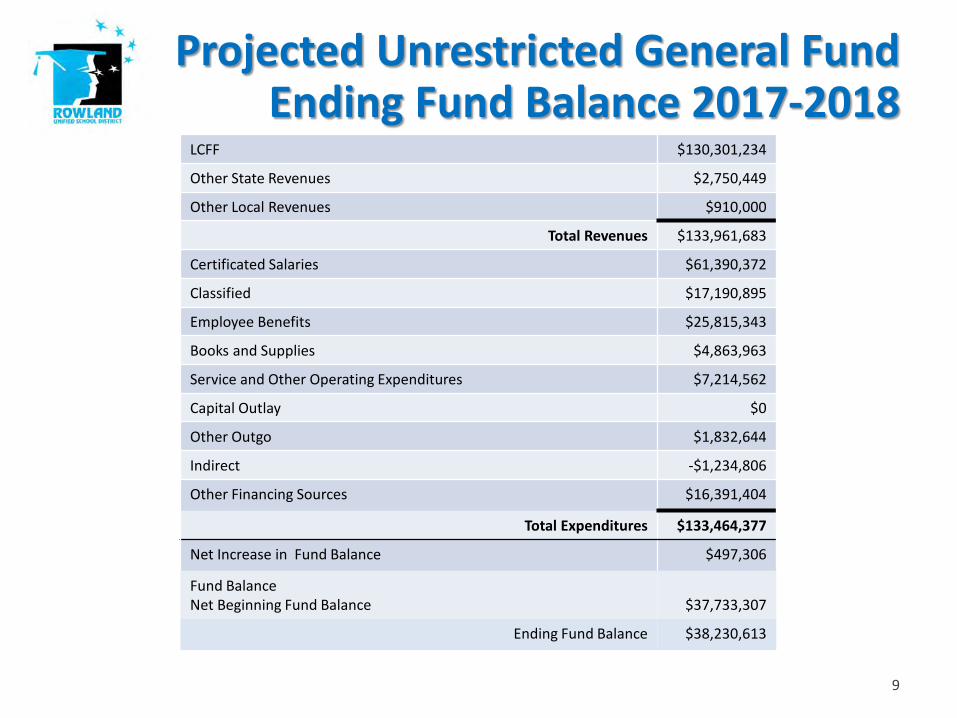
LCFF $130,301,234
Other State Revenues $2,750,449
Other Local Revenues $910,000
Total Revenues $133,961,683
Certificated Salaries $61,390,372
Classified $17,190,895
Employee Benefits $25,815,343
Books and Supplies $4,863,963
Service and Other Operating Expenditures $7,214,562
Capital Outlay $0
Other Outgo $1,832,644
Indirect -$1,234,806
Other Financing Sources $16,391,404
Total Expenditures $133,464,377
Net Increase in Fund Balance $497,306
Fund Balance Net Beginning Fund Balance $37,733,307
Ending Fund Balance $38,230,613
Projected Unrestricted General Fund Ending Fund Balance 2017-2018

Description 2017-18
Ending Fund Balance $38,230,613
Revolving Cash & Inventory $209,333
Required State 3% reserve $5,028,260
Assigned Fund Balance
STRS/PERS Increases $6,000,000
Declining Enrollment $6,000,000
Emergency Disaster/Safety $6,000,000
Technology $6,409,066
Instructional Program support $6,000,000
School Site Block Grant $1,000,000
School Site Discretionary $1,000,000
Equipment Replacement $583,954
Available $010
Unrestricted General Fund 2017-2018Ending Fund Balance Assignments

$8,656,455.0 , 19%
$20,444,559.0 , 44%
$744,857.0 , 2%
$16,391,404.0 , 35%
Federal
Other State
Other Local
District Contribution
2017-18 Restricted General Fund Revenue in Dollars
11
2017-2018 Restricted General Fund Revenue
Revenues and Other FinancingSources
DistrictContribution
$16,391,404
Federal Revenues
$8,656,455
Other State Revenues
$20,444,559
Other Local Revenues
$744,857
Total $46,237,275

$36,796,725 , 73%
$8,739,805 , 17%
$4,284,175 , 9%
$617,782 , 1%
Salaries & Benefits
Books & Supplies
Services/OperatingExpensesCapital Outlay
RESTRICTED General Fund Expenditures in dollars
12
Projected Restricted General Fund Expenditures 2017-2018
Expenditures and Other Financing Uses
Certificated Salaries $13,709,038
Classified $7,846,788
Employee Benefits $15,240,899
Books and Supplies $8,739,805
Service and Other Operating Expenditures
$4,284,175
Capital Outlay $ 96,987
Other Outgo
Indirect $617,782
Total $50,535,474

13
District Contributions $16,391,404
Federal Revenues $8,656,455
Other State Revenues $20,444,559
Other Local Revenues $744,857
Total Revenues $46,237,275
Certificated Salaries $13,709,038
Classified $7,846,788
Employee Benefits $15,240,899
Books and Supplies $8,739,805
Service and Other Operating Expenditures $4,284,175
Capital Outlay $ 96,987
Other Outgo $0
Indirect $617,782
Total Expenditures $50,535,474
Net Increase in Fund Balance $ -4,298,199
Beginning Fund Balance $14,630,083
Ending Fund Balance $10,331,884
Projected Restricted General Fund Ending Fund Balance 2017-2018

14
Multi-Year Projected Budget

15
LCFF Planning Factors 2017-2018 2018-2019 2019-2020
Average Daily Attendance (ADA)
13,499 13,285 13,071
Statutory COLA 1.56% 2.15% 2.35%
Step and Column 1.04% 1.04% 1.04%
Gap Funding (SSC) 43.97% 39.03% 41.51%
Special Education and Categorical Programs COLA
1.56% 2.15% 2.35%
Lottery Revenue –Unrestricted
$144/ADA $144/ADA $144/ADA
Lottery Revenue – Restricted $45/ADA $45/ADA $45/ADA
California Consumer Price Index (CPI)
3.11% 3.19% 2.86%
One-time Discretionary Funds $0 $ 0 $ 0
Major Assumptions for Proposed Budget

16
Year STRS Employer Contribution
% CumulativeIncrease
Additional STRS Cost to the District
Cumulative TOTAL Annual Additional STRS Cost to the District
13-14 8.25% $0 $0
14-15 8.88% 0.63% $397,252.64 $397,252.64
15-16 10.73% 2.48% $1,563,788.16 $1,961,040.80
16-17 12.58% 4.33% $2,730,323.67 $4,691,364.47
17-18 14.43% 6.18% $3,896,859.19 $8,588,223.66
18-19 16.28% 8.03% $5,063,394.71 $13,651,618.37
19-20 18.13% 9.88% $6,229,930.23 $19,881,548.60
20-21 19.10% 10.85% $6,841,573.18 $26,723,121.78
STRS District Rate Increase Impact
17
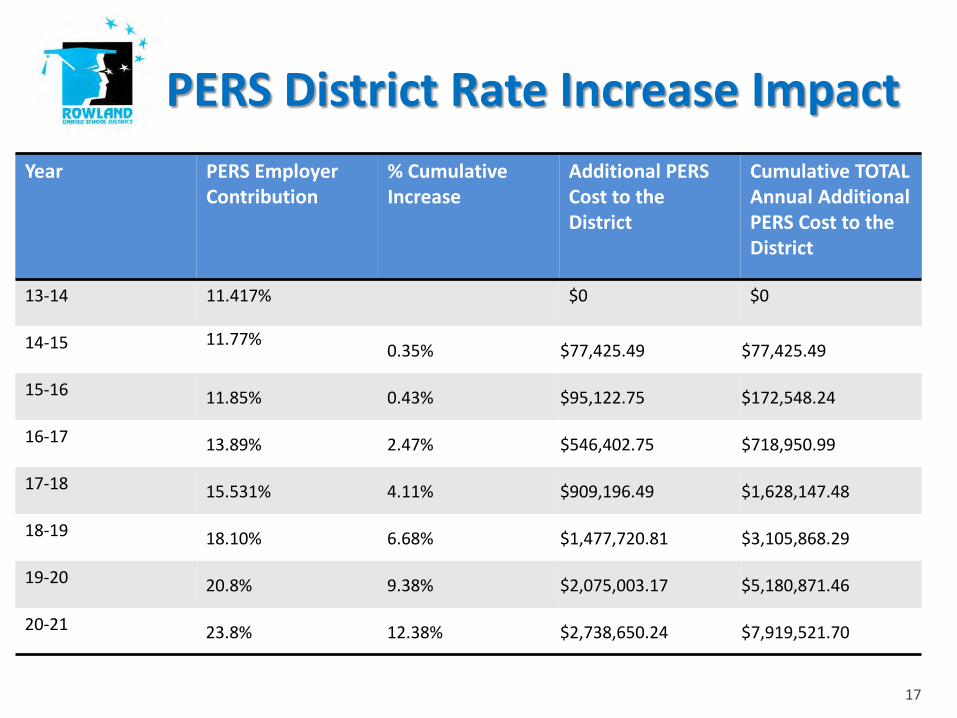
Year PERS Employer Contribution
% Cumulative Increase
Additional PERS Cost to the District
Cumulative TOTAL Annual Additional PERS Cost to the District
13-14 11.417% $0 $0
14-15 11.77% 0.35% $77,425.49 $77,425.49
15-16 11.85% 0.43% $95,122.75 $172,548.24
16-17 13.89% 2.47% $546,402.75 $718,950.99
17-18 15.531% 4.11% $909,196.49 $1,628,147.48
18-19 18.10% 6.68% $1,477,720.81 $3,105,868.29
19-20 20.8% 9.38% $2,075,003.17 $5,180,871.46
20-21 23.8% 12.38% $2,738,650.24 $7,919,521.70
PERS District Rate Increase Impact

Description 2017-18 2018-19 2019-20
REVENUE $117,570,279 $118,560,112 $119,379,598
SALARIES & BENEFITS $104,396,610 $104,406,176 $107,014,785
BOOKS & SUPPLIES $4,863,963 $5,019,123 $5,162,670
SERVICES & OTHER EXP. $7,214,562 $8,244,707 $6,457,626
CAPITAL & OTHER OUTGO $597,838 $616,909 $634,553
TOTAL EXPENDITURES $117,072,973 $118,286,915 $119,269,634
NET CHANGE IN FUND BALANCE $497,306 $273,197 $109,964
ENDING FUND BALANCE $38,230,613 $38,503,810 $38,613,774
18
Multi-Year Projections (Unrestricted)

Description 2017-18 2018-19 2019-20
REVENUE $46,237,275 $46,877,666 $47,525,887
SALARIES & BENEFITS $36,796,725 $37,572,482 $38,420,044
BOOKS & SUPPLIES $8,739,805 $4,618,605 $4,750,697
SERVICES & OTHER EXP. $4,284,175 $4,420,840 $4,547,276
CAPITAL & OTHER OUTGO $714,769 $737,570 $758,664
TOTAL EXPENDITURES $50,535,474 $47,349,497 $48,476,681
NET CHANGE IN FUND BALANCE $ (4,298,199) $(471,831) $(950,794)
ENDING FUND BALANCE $10,331,884 $9,860,053 $8,909,25919
Multi-Year Projections (Restricted)

THANK YOU!
20

21
Questions