role of ultrasound and color doppler in evaluation of ... · role of ultrasound and color doppler...
TRANSCRIPT
Role of ultrasound and color Doppler in evaluation
of musculoskeletal soft tissue masses
Essay
Submitted for partial fulfillment of Master Degree in radiodiagnosis
By Amr Osman Osman
M.B.B.Ch
Tanta university
Supervisors Dr.Ahmed Mohamed Wafaie
Assistant Professor of radiology
Cairo university
Dr. Nevien Ezzat El Liethy
Lecturer of radiology
Cairo university
Faculty of medicine
Cairo university
2012

Q
V

Acknowledgment
I
Acknowledgment
First and foremost I feel always indepted to god the most kind and the most
merciful .
I would like to express my sincere thanks and deep gratitude to professor
Dr. Ahmed Mohamed Wafaie Assistant Professor of diagnostic radiology,
Cairo university , for his help , guidance , unlimited cooperation , constructive
criticism and deep support .
My special thanks and deep gratitude to professor Dr. Nevien Ezzat El
Liethy Professor of diagnostic radiology, Cairo university, for his sincere help and
guidance to bring this work to reality.
Finally, I would like to express my deep gratitude to all my family
members especially my parents for their unwavering support and love and their
ability to instill within me a thirst for knowledge without which this effort would
not be possible., my wife (my much better half, a fact that anybody who knows me
will thoroughly agree with) for her unlimited cooperation, patience and deep
support. They provide my foundation and strength through their love and support.
List of content
II
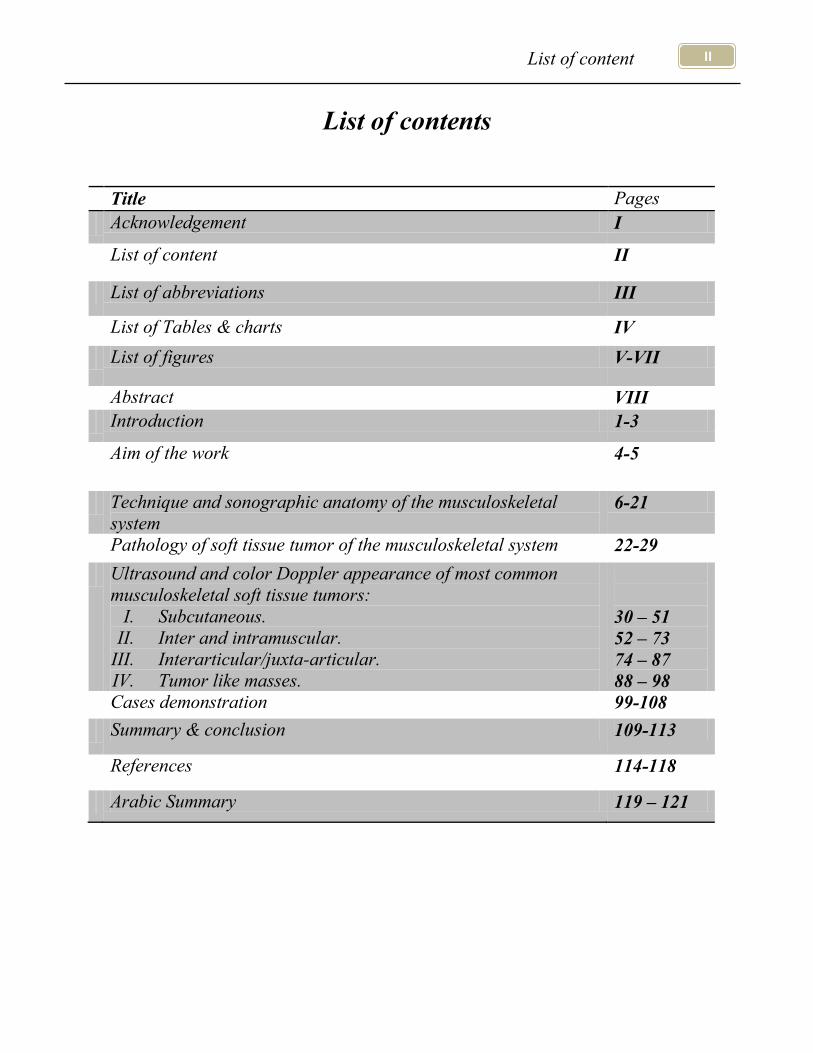
List of contents
Title Pages
Acknowledgement I
List of content II
List of abbreviations III
List of Tables & charts IV
List of figures V-VII
Abstract VIII
Introduction 1-3
Aim of the work 4-5
Technique and sonographic anatomy of the musculoskeletal
system 6-21
Pathology of soft tissue tumor of the musculoskeletal system 22-29
Ultrasound and color Doppler appearance of most common
musculoskeletal soft tissue tumors:
I. Subcutaneous.
II. Inter and intramuscular.
III. Interarticular/juxta-articular.
IV. Tumor like masses.
30 – 51
52 – 73
74 – 87
88 – 98
Cases demonstration 99-108
Summary & conclusion 109-113
References 114-118
Arabic Summary 119 – 121
List of abbreviations
III
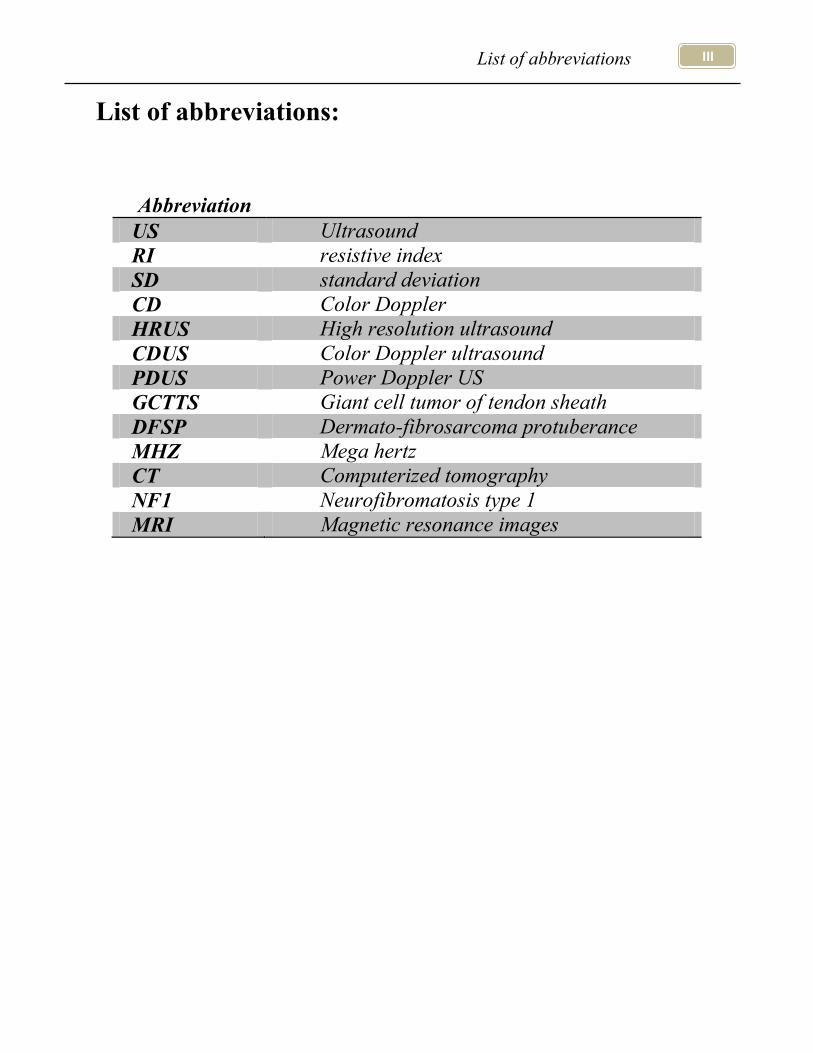
List of abbreviations:
Abbreviation
US Ultrasound
RI resistive index
SD standard deviation
CD Color Doppler
HRUS High resolution ultrasound
CDUS Color Doppler ultrasound
PDUS Power Doppler US
GCTTS Giant cell tumor of tendon sheath
DFSP Dermato-fibrosarcoma protuberance
MHZ Mega hertz
CT Computerized tomography
NF1 Neurofibromatosis type 1
MRI Magnetic resonance images
List of tables and charts
IV
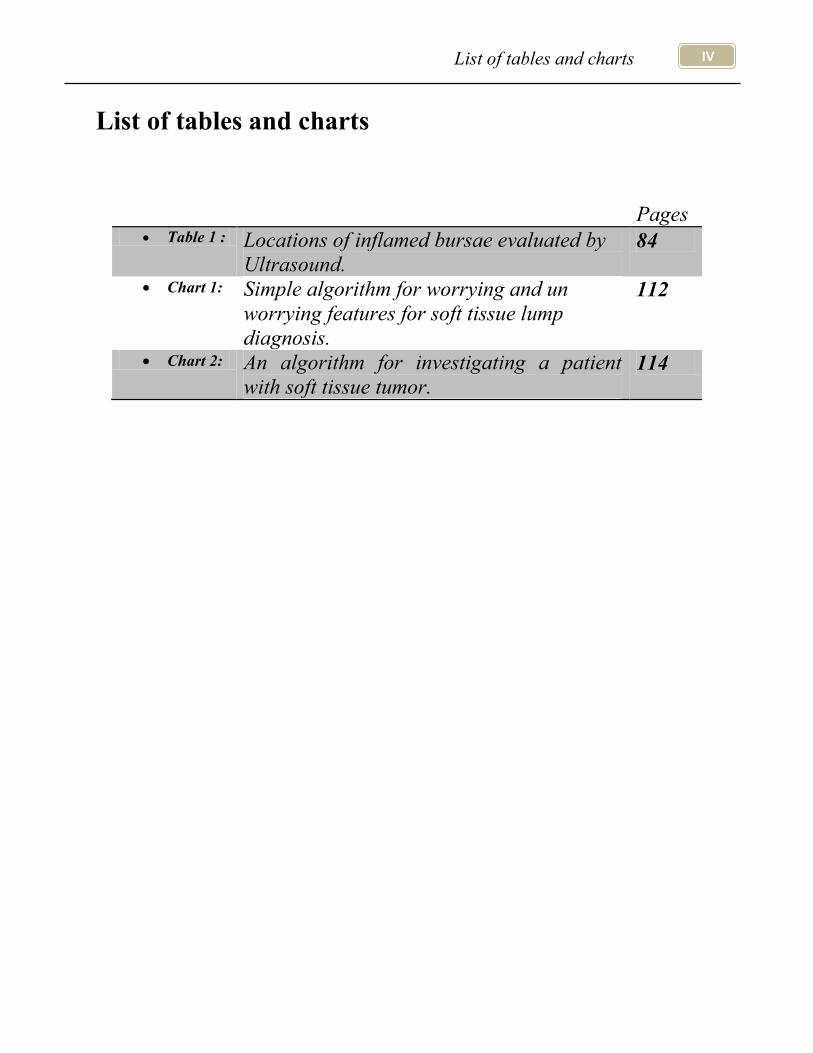
List of tables and charts
Pages Table 1 : Locations of inflamed bursae evaluated by
Ultrasound. 84
Chart 1: Simple algorithm for worrying and un
worrying features for soft tissue lump
diagnosis.
112
Chart 2: An algorithm for investigating a patient
with soft tissue tumor. 114
List of figures
V
List of Figures
Figure Title Page
Figure 1,2 &3 : Commonly used ultrasound transducers in musculoskeletal ultrasound. 8
Figure 4: Color Doppler showing a large serpiginous feeding vessel. 10
Figure 5: Simple Doppler ultrasound instruments 11
Figure 6&7: The angle of insonation changes. 11
Figure 8: Normal skin and subcutaneous tissu photography and US 14
Figure 9: Subcutaneous veins and nerves diagram and US 15
Figure 10: Intramuscular aponeuroses & perimysium 16-17
Figure 12 : Normal quadriceps muscle (A) Longitudinal (B) Panoramic veiw 17
Figure 13: Normal nerve echotexture. 19
Figure 14: cuboid bone cartilage and bone by US. 23
Figure 15&16: US appearance of normal bone surface echotexture. 20
Figure 17-20: Hemangioma of the elbow , foot , thigh , leg , subcutaneous hemangioma 32-33
Figure 21: Subcutaneous hemangioma of the leg, 34
Figure 22: Cavernous hemangioma of the foot . 34
Figure 23: Intramuscular hemangioma of thelower extremity.photgraphy 35
Figure 24: Cystic lymphangioma (A) Grayscale ultrasonography (B) Color Doppler
ultrasonography. 36
Figure 25: Glomus tumor in index finger. (A) Grayscale ultrasonography (B) Color
Doppler ultrasonography 36
Figure 26: Dermatofibrosarcoma over the left abdominal wall (A&B) Grayscale
ultrasonography (C) CDUS (D): Photograph 37
Figure 27: Dermatofibrosarcoma protuberans of the abdominal wall (A), extended
view long axis (B), Doppler examination 38
Figure 28: Granuloma annulare focused ultrasound over the dorsum of the foot . 38
Figure 29: Leiomyosarcoma of the upper thigh mass A: Ultrasound. B: Color
Doppler 40
Figure 30-32: Superficial (subcutaneous) lipoma over the abdominal wall, the buttock,
left medial arm (grayscale ultrasonography) 41-42
Figure 33: lymphoma cell infiltration to the subcutaneous fat lobule of the right
proximal tibial region (A) Grayscale ultrasonography (B) CDUS . 43
Figure 34: Infantile fibrosarcoma of the forearm. A: Radiograph. (B) Grayscale
ultrasonography (C) CDUS 44
Figure 35: Malignant fibrohistiocytoma in right lateral thigh. (A) Longitudinal
ultrasound section (B) Color Doppler ultrasonography. 45
Figure 36: Fibrosarcoma in the upper leg. (A) Grayscale ultrasonography (B) CDUS
. 45
Figure 37: Low-grade sarcoma posterolateral thigh. (A) Grayscale ultrasonography
(B) CDUS . 46
Figure 38: Loco-regional spread of malignant cutaneous melanoma. 46
Figure 39: Subcutaneous metastasis of the abdominal wall CDUS . 47
Figure 40: metastasis from thyroid carcinoma in the left pelvic region with iliac bone
destruction (A) Grayscale ultrasonography (B) CDUS . 47
Figure 41: Subcutaneous metastasis of the thigh , Grayscale ultrasonography 48
Figure 42: Myxoma. in the plane between the rectus femoris and vastus intermedius
muscles (extended field of veiw) 49

List of figures
VI
Figure 43: Nodular fasciitis in the wrist & upper arm , Grayscale ultrasonography . 49
Figure 44-45: Epidermoid cyst. , Grayscale ultrasonography 50- 51
Figure 46: Fibroma on back. (A) Grayscale ultrasonography (B) CDUS . 51
Figure 47- 49 : Liposarcoma on left elbow &,the thigh. Grayscale ultrasonography- MRI
– intraoperative view - extended field of view 53-54
Figure 50: Palmar fibromatosis. of the third finger , Grayscale ultrasonography 57
Figure 51: Superficial fibromatosis in right thigh. (A) Grayscale ultrasonography (B)
Color Doppler 57
Figure 52: Plantar fibromatosis. of the plantar aspect of the foot Grayscale
ultrasonography 58
Figure 53: Calcifying Aponeurotic Fibroma A. High-resolution US of the phalanx (A)
Grayscale ultrasonography (B) Color Doppler 59
Figure 54: Fibromatosis colli of sternocleudomastoid muscle , Grayscale
ultrasonography 60
Figure 55: Fibrous Hamartoma of Infancy: A.Grayscale ultrasonography B. color
Doppler image. C. Non-enhanced CT scan. D. Sagittal reconstructed
contrast enhanced CT
62
Figure 56-57: Desmoid. Tumor (A) Grayscale ultrasonography (B) Color Doppler 63
Figure 58-59: Stump neuromas , Grayscale ultrasonography & Color Doppler 64-65
Figure 60: Third web space Morton’s neuroma. (A) Grayscale ultrasonography (B)
Color Doppler 65
Figure 61: Schwannoma of the median nerve Grayscale ultrasonography. 66
Figure 62: Neurofibroma in left medial arm. (A) Grayscale ultrasonography (B)
Color Doppler 67
Figure 63: Neurinoma of the leg. (A) Color Doppler (B). 3D CT reconstruction. 67
Figure 64: Benign nerve sheath tumor. (A) Grayscale ultrasonography (B) Color
Doppler 67
Figure 65: Malignant schwannoma of the forearm.,Grayscale ultrasonography 68
Figure 66: Plexiform neurofibroma , Grayscale ultrasonography 69
Figure 67-68: Intramuscular hemangioma of the lower extremity. (A) Grayscale
ultrasonography (B) Color Doppler 70
Figure 69-70: intermuscular lipoma , Grayscale ultrasonography , extended field of
veiw 71-72
Figure 71: rhabdomyosarcoma in the right thigh, Grayscale ultrasonography &
Color Doppler. 73
Figure 72-73: Lipoma arborescens of the knee: Microscopic and gross features, &
Grayscale ultrasonography 74-75
Figure 74: Pigmented villonodular synovitis over her right lower leg(A) Grayscale
ultrasonography (B) Color Doppler 76
Figure 75-76: Giant cell tumor of the tendon sheath in right thumb. (A) Grayscale
ultrasonography (B) Color Doppler 77
Figure 77: A–C. Giant cell tumor of the tendon sheath. (A) Grayscale
ultrasonography (B) Color Doppler.(C) Corresponding anteroposterior
standard radiograph.
78
Figure 78: A–d. Synovial chondromatosis. A Plain radiograph of the index finger. B
Grayscale ultrasonography. C Axial CT imaging. D Surgical specimen 79
Figure 79: a–d. Intra-articular bodies: spectrum of US appearances.- MRI
correlation 80
Figure 80-81: Baker’s cyst., Grayscale ultrasonography. 81
List of figures
VII
Figure 82-83: Iliopectineal and olecranon bursitis (A) Grayscale ultrasonography (B)
Color Doppler 82-83
Figure 84: a–f. Synovial hemangioma. A,B,C Grayscale ultrasonography & Color
Doppler over the suprapatellar region D Sagittal T2-weighted and E fat-
suppressed postcontrast T1-weighted MR imaging F Lateral radiograph
84
Figure 85-86: Synovial sarcoma of theknee and foot. Grayscale ultrasonography ,Color
Doppler and MRI image correlation 85
Figure 87: Volar wrist ganglion cyst. (A) Grayscale ultrasonography (B) Color
Doppler 86
Figure 88: Ganglion of the dorsal wrist Grayscale ultrasonography 87
Figure 89: Atypical digital ganglion in the thumb (A) Grayscale ultrasonography (B)
Color Doppler 87
Figure 90: Rectus femoris muscle tear. , Grayscale ultrasonography 88
Figure 91: Muscle hernia. a Photograph showing the examination technique for
detecting muscle hernias. b,c Schematic drawings illustrate the
mechanism of hernia. d–g Grayscale ultrasonography
90
Figure 92: Muscle hernia with a defect in the muscle fascia 91
Figure 93: Pseudoaneurysm (A) Grayscale ultrasonography (B) Color Doppler 92
Figure 94: Acute Vastus intermedius intramuscular ill-defined muscle hematoma ,
Grayscale ultrasonography 92
Figure 95: Intramuscular hematoma of the leg in various stages. (A) Grayscale
ultrasonography (B) Color Doppler (C) liquefied hematoma. 93
Figure 96-98: Muscle abscess.,Grayscale ultrasonography & Color Doppler 94-95
Figure 99: Idiopathic myositis with torticollis (A) Grayscale ultrasonography (B)
Color Doppler 96
Figure 100-101: Foreign body in right palm and in the superficial tissues of the thigh
Grayscale ultrasonography & Color Doppler 96-97
Figure 102: Myositis ossificans in left anterior thigh. 97
Figure 103: Tumoral calcinosis on shoulder , Grayscale ultrasonography & Color
Doppler 98
Abstract VIII
ABSTRACT
Musculoskeletal sonography is a rapidly growing technique that is gaining popularity for the evaluation and treatment of joint and soft tissue diseases . It can be intimidating due to the vast array of anatomy that is present and the different techniques and dynamic maneuvers required for a complete study. It is reliable, expedient and readily accessible alternative to other more costly techniques such as MR imaging.
In the detection of musculo-skeletal masses especially soft tissue masses , ultrasonography is a readily available , inexpensive and non invasive modality,color Doppler can be also used in assessment of lesion vascularity and detection of neurovascular bundle involvement.
Key word:MR- musculoskeletal- ultrasound- radiodiagnosis

Introduction
1
INTRODUCTION
Introduction
2
Introduction
Soft tissue masses in the extremities and trunk are common
presentations to physicians and surgeons. These growths range from benign
neoplasms and cystic structures based in the epidermis and dermis to
malignant neoplasms arising within the structures below the deep fascia.
(Frassica et al . , 1996).
There are a number of useful applications and advantages of
diagnostic ultrasound in the assessment of musculoskeletal pathology.
Ultrasonography (U/S) may be used to assess superficial tendons and
ligaments that traverse a joint. It can demonstrate the presence and
characteristics of joint effusions, bursae, or cysts, and it also can detect loose
bodies in joints. The advantages lie in the cost-efficiency, shorter
examination time, (Kelvin Chew etal . , 2008 )
Ultrasound is generally unaffected by metallic artifacts (eg, metatarsal
plate in the foot, suture anchors) and delivers no radiation to the patient or
the user, an important consideration when evaluating females of child-
bearing age. Unlike radiographs, CT, and MRI, ultrasound can be readily
used to complete a comparative examination of the contralateral extremity
when clinically indicated. Finally, ultrasound can provide precise, real-time
guidance for interventional procedures. Compared with radiographs and CT
scans, ultrasound can demonstrate soft tissues with great detail, enabling
safe and accurate needle guidance for interventional procedures. Similar to
ultrasound, MRI provides excellent soft tissue visualization, but the
requirement for nonferromagnetic instrumentation coupled equipment size
and expense currently limit MRI use for real-time interventional procedures.
(Smith etal . , 2009)
Dynamic assessment during contraction and relaxation of the structure
of interest is essential. This helps in establishing the exact relationship of the
mass with the muscle and or the tendon. Soft tissue masses in the anterior
abdominal wall should also be evaluated during deep inspiration and
Introduction
3
expiration to define the relationship of the mass with the peritoneum .
(Kinare etal . , 2007)
Physicians should recognize several clinically relevant limitations of
musculoskeletal ultrasound. Perhaps the most important limitations pertain
to field of view and penetration. Ultrasound provides a very high quality
picture of a relatively small area. Clinicians should use ultrasound to
confirm or characterize pathological changes within a defined body region.
ultrasound‟s limited resolution at greater depths and inability to penetrate
bone limit its ability to adequately image deep body regions, morbidly obese
patients, areas deep to bones, and central intra-articular regions. Finally, as
an interactive and technologically intensive examination, musculoskeletal
ultrasound is also limited by both the ultrasound machine and the skill of the
examiner using it. (Smith etal . , 2009)
Combining grayscale ultrasound with Doppler imaging allows unique
real-time evaluation of regional blood flow, which may be altered in a
variety of disease processes. The presence of Doppler signal can also help
differentiate solid from cystic lesions. (James . , 2006).
US have a high sensitivity when detecting tumors, but it has not
proven to be useful in differentiating benign from malignant conditions.
Power Doppler US (PDUS) or color Doppler US (CDUS) and spectral
analysis can depict the vascular irregularities in malignant tumor, but the
reported criteria for malignancy vary widely. (Chiou et al . , 2009).
HRUS does have a high sensitivity in detecting tumors. Recent advances in
ultrasound technology have enabled the echotexture of soft tissue tumors to
be presented in greater detail. (Chiou et al . , 2007).
Using split-screen technology (which basically allows combining two
images from two adjacent areas) the field of view can be doubled to 12 cm.
Extended field of view enable panoramic imaging with real time probes.

Aim of the work
4
AIM OF WORK

Aim of the work
5
Aim of the work:
To evaluate the usefulness and high light the indications, advantages
and disadvantages of high-resolution grayscale and color Doppler ultrasound
evaluation in musculo-skeletal soft tissue masses and to differentiate benign
from malignant masses.
Technique &Sonographic anatomy of the musculoskeletal system
6
TECHNIQUE &
SONOGRAPHIC
ANATOMY OF THE
MUSKULOSKELETAL
SYSTEM
Ultrasound technique
7
MUSCULOSKELETAL ULTRASOUND
THE PREREQUISITES
Musculoskeletal ultrasound is perhaps the most operator dependent imaging
modality currently available. The primary reason for this is the need to physically
acquire an acceptable image, using appropriately adjusted equipment, with specific
attention to transducer positioning, all within the context of an in-depth
understanding of neurological and musculoskeletal anatomy (Bates , 2004).
To successfully integrate diagnostic or interventional musculoskeletal
ultrasound into clinical practice, the practitioner must therefore acquire the
necessary equipment, education, and scanning skills (Bates , 2004).
Ultrasound Equipment
Types of probes used in musculoskeletal examinations (John et al . ,2007):
Linear Array Probes
Linear array probes have a flat face along which a sequence of crystals is
arranged. The sector size of the linear probe is identical to the footprint of the
probe itself and the resulting image is rectangular or square (Fig. 1). Linear probes
are generally used to view superficial structures and are therefore constructed to
produce higher frequencies. Linear probes are used for various musculoskeletal
applications (John et al . ,2007).
Convex Array Probes
The crystals in convex arrays are arranged along a curved face. The resulting
image has a sector size larger than the footprint of the probe. The range of
frequencies and overall construction of curved array probes are important
Ultrasound technique
8
determinants regarding where they are most beneficial. Larger footprint probes
with less curvature typically provide greater lateral resolution at a given frequency
in the far fields. However, smaller footprint probes with a tighter curvature allow
for easier access through the intercostal spaces. (Fig.1 , 2 &3 ) (John et al. ,2007).
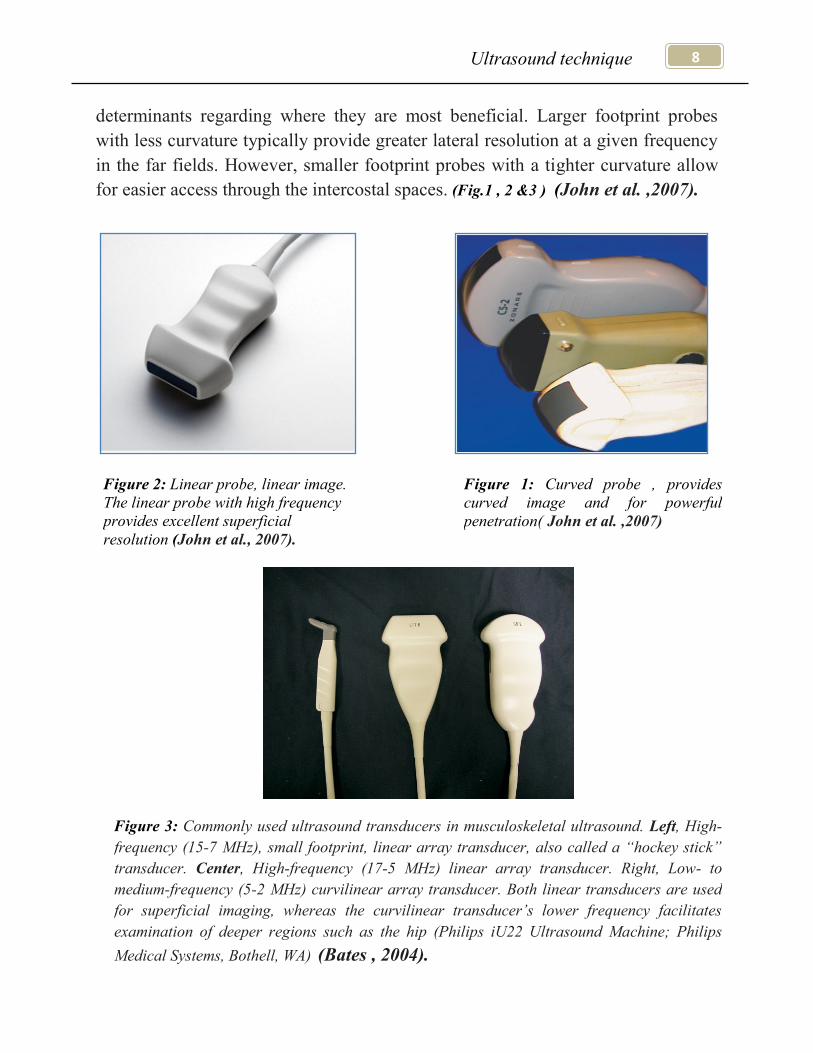
Figure 3: Commonly used ultrasound transducers in musculoskeletal ultrasound. Left, High-
frequency (15-7 MHz), small footprint, linear array transducer, also called a “hockey stick”
transducer. Center, High-frequency (17-5 MHz) linear array transducer. Right, Low- to
medium-frequency (5-2 MHz) curvilinear array transducer. Both linear transducers are used
for superficial imaging, whereas the curvilinear transducer’s lower frequency facilitates
examination of deeper regions such as the hip (Philips iU22 Ultrasound Machine; Philips
Medical Systems, Bothell, WA) (Bates , 2004).
Figure 1: Curved probe , provides
curved image and for powerful
penetration( John et al. ,2007)
Figure 2: Linear probe, linear image.
The linear probe with high frequency
provides excellent superficial
resolution (John et al., 2007).
Ultrasound technique
9
Protocol for ultrasound of superficial lumps
Equipment selection and technique : (Martino et al. , 2006)
Use of a high resolution probe (7-15 MHZ) is essential when assessing
superficial structures.
Careful scanning technique to avoid anisotropy (and possible misdiagnosis).
Use panoramic to get both edges in the same image
May need to use a curved linear array probe if it travels deep or it is a high
attenuating lesion with calcification etc
Beam steering or compounding can help to overcome anisotropy in linear
structures such as tendons.
Good color / power / Doppler capabilities when assessing vessels or
vascularity of a structure.
Be prepared to change frequency output of probe (or probes) to adequately
assess both superficial and deeper structures. (Martino et al. , 2006)
I. Role of grey scale ultrasound : (Chiou etal . ,2009). Location :
Label surrounding anatomy; use a body marker on the film.
Compare to the other side
Measure
in 3 planes:
1. Anterior-posterior .
2. Longitudinal
3. Transverse.
Tumor size was defined as large (> 5 cm), medium (1–5 cm) or small
(< 1 cm).
Volume
Echogenicity:
Hypo, hyper, isoechoic ,anechoic, calcified compared to the surrounding
tissue and its composition was solid, cystic, necrotic content or septate.
Texture:
Homogenous, heterogeneous, simple or complex.
Ultrasound technique
10
Margins :
Were assessed as well-defined (clear-cut and thin capsule-like), ill-defined
(uncertain margin with respect to adjacent normal tissue) or infiltrated
(certain irregular margin with adjacent normal tissue and wider transitional
zone)
Shape :
Was defined as round, ovoid, lobulated or scalloped
Check the lump for spread into the muscle:
Has it broken the fascia, the skin or invasion anywhere else
Is it compressing any vessels or ducts
Shadowing ,posterior enhancement or no change . (Chiou,etal,2009).
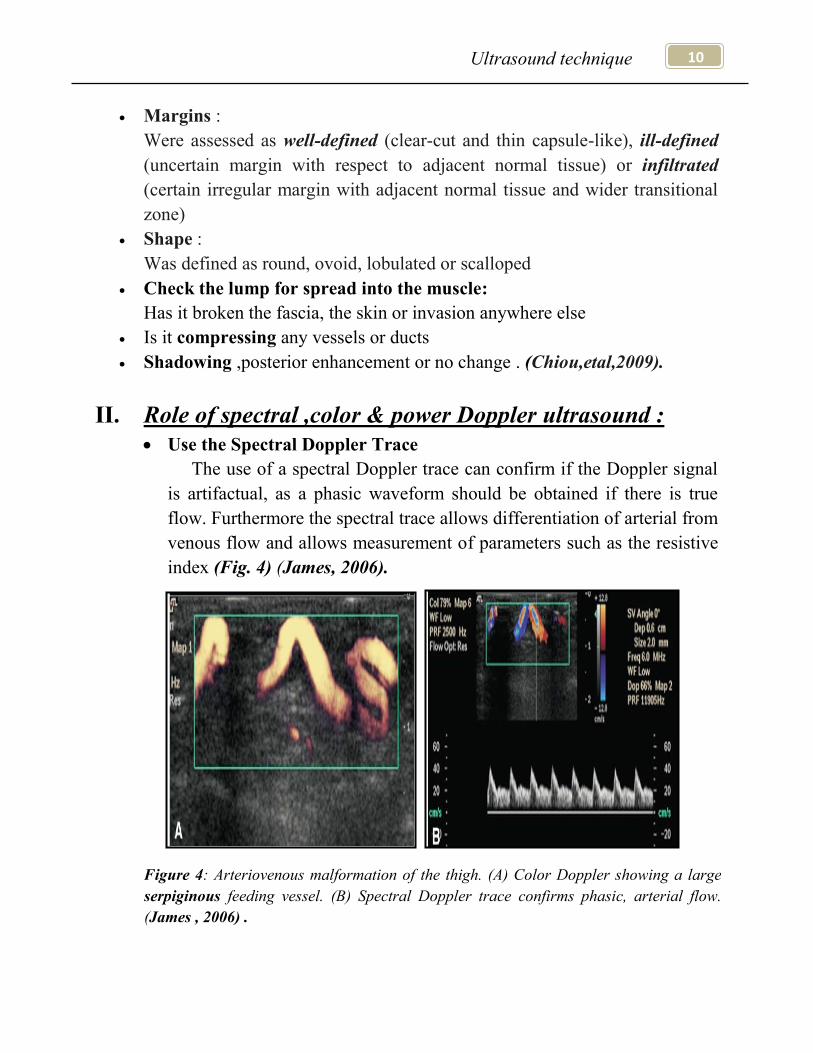
II. Role of spectral ,color & power Doppler ultrasound :
Use the Spectral Doppler Trace
The use of a spectral Doppler trace can confirm if the Doppler signal
is artifactual, as a phasic waveform should be obtained if there is true
flow. Furthermore the spectral trace allows differentiation of arterial from
venous flow and allows measurement of parameters such as the resistive
index (Fig. 4) (James, 2006).
Figure 4: Arteriovenous malformation of the thigh. (A) Color Doppler showing a large
serpiginous feeding vessel. (B) Spectral Doppler trace confirms phasic, arterial flow.
(James , 2006) .