role of eye movements in chromatic induction - fb06 of eye movements in... · role of eye movements...
TRANSCRIPT
Role of eye movements in chromatic induction
Jeroen J. M. Granzier,* Matteo Toscani, and Karl R. Gegenfurtner
Department of Psychology, Justus-Liebig University, Otto-Behaghel Strasse 10, Giessen 35394, Germany*Corresponding author: [email protected]‐giessen.de
Received October 25, 2011; revised December 1, 2011; accepted December 16, 2011;posted December 19, 2011 (Doc. ID 157060); published February 1, 2012
There exist large interindividual differences in the amount of chromatic induction [Vis. Res. 49, 2261 (2009)]. Onepossible reason for these differences between subjects could be differences in subjects’ eye movements. In experi-ment 1, subjects either had to look exclusively at the background or at the adjustable disk while they set the disk toa neutral gray as their eye position was being recorded. We found a significant difference in the amount of in-duction between the two viewing conditions. In a second experiment, subjects were freely looking at the display.We found no correlation between subjects’ eye movements and the amount of induction. We conclude that eyemovements only play a role under artificial (forced looking) viewing conditions and that eye movements do notseem to play a large role for chromatic induction under natural viewing conditions. © 2012 Optical Society ofAmerica
OCIS codes: 330.0330, 330.1720, 330.2210, 330.5510.
1. INTRODUCTIONPlacing a gray surface within a green surround makes it lookpink. This is known as chromatic induction. Its origin is bestunderstood in relation to color constancy [1,2]. Chromatic in-duction arises when the color of the surrounding is incorrectlyattributed to the illumination. For instance, if part of the greencolor of the surround is attributed to the illumination beinggreenish, then the fact that the light from the target is notgreenish implies that the target surface must be pink (i.e.,it must reflect less green light than red light).
Chromatic induction (also known as simultaneous colorcontrast) depends on many different variables [3,4], such asthe spatial parameters of the stimulus [5,6], the current stateof adaptation [7], perceptual organization [8–10], and observerinstructions [11].
With respect to the spatial parameter, it is known that chro-matic induction is primarily determined by the color of di-rectly adjacent surfaces [12–15]. This is consistent with theidea that information at the borders is critical in determiningthe perceived color [16]. However, more distant surfaces canalso influence the perceived color. Eye movements and coneadaptation could mediate such global interactions [17–19].
Most studies on chromatic induction have concentrated onstudying the dependence on stimulus variables and largely ne-glected the possibility of substantial differences across obser-vers. Most studies have been performed with just a couple ofobservers. There are, however, indications that there existdifferences between subjects in their amount of chromaticinduction [20–24].
Besides the often large differences between subjects in theamount of chromatic induction, there is a second factor that islargely ignored in color vision research—eye movements. Eyemovements are almost never recorded or controlled whenstudying color vision, with notably very few exceptions[18]. This is remarkable, as subjects’ eye movements can toa large extent influence the adaptation of the cones in the sub-jects’ retina and therefore influence how colors are being per-ceived. Eye movements raise two questions for color vision
research: whether where one is looking matters for the per-ceived color of a surface of interest (for an example in thelightness domain; see [25]) and whether where one was pre-viously looking matters in this respect (for examples in thechromatic domain, see [26,27]).
If we stare at a scene for some time and then divert our gazeto a large blank surface, we are likely to temporarily see anafterimage of the original scene in complementary colors. Thisafterimage arises because photoreceptors in the retina haveadapted to the light coming from different parts of the originalscene and therefore respond differently to exposure to thelight from the blank surface. Thus where one was previouslylooking matters for color vision. The notion that a combina-tion of eye movements and retinal adaptation can contributeto color vision is often acknowledged, and there is clear evi-dence that restricting eye movements can make a significantdifference in a color-matching task [17] when studying chro-matic induction. However, eye movements may not only influ-ence the perceived color by exposing the fovea successivelyin time to different parts of the scene. Eye movements alsodetermine precisely which part of the scene the fovea willbe exposed to at a time. Very little is known about whetherthe precise point at which one is directing one’s gaze makesany difference for the perceived color. A study by Hansen andGegenfurtner [26] suggests that it does. These authors foundthat subjects clearly relied most on the colors near the fixationpoint. Brenner et al. [27] showed that where people directtheir gaze affects how they evaluate chromatic stimuli. Thisimplies that the image on the fovea will generally dominatethe percept. The fact that the perceived color depends onwhere one is looking implies that the way we direct our gazeinfluences how we see objects’ colors. In daily life, suchchanges will mainly occur when we shift our gaze by makingsaccades.
Golz [28] investigated whether subjects’ eye movementsaffect how they perceive chromatic stimuli. In this study, sub-jects were instructed to either look at the background or tolook only at the adjustable disk when making achromatic
Granzier et al. Vol. 29, No. 2 / February 2012 / J. Opt. Soc. Am. A A353
1084-7529/12/02A353-13$15.00/0 © 2012 Optical Society of America
settings. He found higher amounts of induction when directingsubjects’ gaze more to the background. These results are in-teresting as these data suggest that subjects’ eye movementscan have an effect on subjects’ color percept in a chromaticinduction experiment. However, Golz [28] did not measureeye movements directly but only instructed subjects whereto look. Therefore, one cannot tell whether subjects were fol-lowing the instructions or not. Moreover, Golz used a verysmall adjustable disk with a radius of 0.75°. It is very hardto fixate one’s gaze at an adjustable disk of this size as wemake microsaccades, which makes controlling for the fovealinformation problematic. For example [29] showed that themean amplitude of microsaccades for subjects during a40 s fixation task (about the amount of time that subjectshad to fixate their gaze in Golz’s experiment) was within arange of 0.223° and 1.079°. It could therefore be the case thatthe size of the effect of where one looks has an even largereffect than Golz’s [28] data show. The most important caveat,however, in Golz’s [28] study is that he did not study eye move-ments under normal (free-looking) conditions. Therefore, weare still left with the fundamental question of whether sub-jects’ eye movements have an effect on the achromatic set-tings that they make. Because Golz [28] only studied foursubjects, it is impossible to draw any firm conclusions regard-ing the effects of eye movements in explaining between-subject variability in the amount of induction obtained.
In this paper we want to investigate whether the variabilitybetween subjects in the amount of chromatic induction can beexplained by differences in viewing strategies between sub-jects. We examined this by analyzing whether the amountof chromatic induction shown by different subjects is influ-enced by their eye movements. It could be that some subjectsspend more time looking, or look more often than others, atthe background and, consequently, expose their foveae to thecolors of the surround to a larger extent. This could lead to adifferent state of adaptation at the moment subjects switchtheir gaze toward the center test patch. Consequently, sub-jects might perceive colors differently and make achromaticsettings that are more influenced by the chromaticity of thebackground. In line with this form of reasoning are the resultsof studies showing that adaptation plays an important role inboth color constancy and in chromatic induction [17,30,31].To test the hypothesis, we measured subjects’ eye movementsboth while they were forced to look either at the backgroundor exclusively at the central patch that they had to set to gray(experiment 1) and when they were free in making eye move-ments while performing achromatic settings (experiment 2).By combining the information from these two experiments,we could estimate to what extent eye movements have alteredthe settings in the induction experiment. We compared thisestimate with the actual difference between achromaticsettings. We used variegated-colored backgrounds for experi-ment 1 and both variegated-colored backgrounds and uni-form-colored backgrounds for experiment 2.
2. EXPERIMENT 1: “FORCED-VIEWING”
CONDITIONThe purpose of the first experiment was to replicate the re-sults of Golz [28]. When subjects are forced to look more oftenat the background, the amount of adaptation toward the back-ground is enhanced. If eye movements have an effect on the
magnitude of chromatic induction, we hypothesize that theamount of induction will be larger when forcing subjects tolook more often at the background compared to when forcingsubjects to only look at the adjustable disk when makingachromatic settings. Our hypothesis is that adaptation occurslocally, as there is direct support for this [17]. Thus, we onlyadapt to those parts of the scene that we have looked at. Ifhowever, one assumes global processing of color [32], onedoes not expect a large difference in the amount of chromaticinduction between the “normal viewing” condition and the“forced-viewing” condition.
A. MethodFor this experiment, we used four variegated-colored back-ground conditions (see below) with a disk radius size of both4° and 8° (see Fig. 1). Subjects sat 46 cm from the CRT screenwith their chins supported by a chin rest. Subjects had tomake achromatic settings. Subjects entered the room anddark-adapted for 10 min during which time instructions weregiven. A demo of the experiment was shown to the subjects tomake sure that they understood the task. Before the start ofthe experiment, subjects could practice the task. Subjectsmade achromatic settings for 64 trials (four differentbackgrounds × two looking instructions × eight replica-tions). Each session took about 1 h and 45 min. Halfwaythrough the session, there was a break of 10 min. The orderof looking condition (fixate background versus fixate disk; seebelow) was randomized within a session. Subjects were testedfor the 8° and 4° radii disks in two separate sessions.
1. MonitorThe stimuli were presented on a calibrated Samsung SyncMaster (1100 MB) monitor (40 cm × 30 cm, 1280 × 960 pixels,85 Hz, 8 bits per gun). The nonlinear relationship betweenvoltage output and luminance was linearized by a colorlook-up table for each primary. To generate the three red-green-blue (RGB) look-up tables, we measured the luminanceof each phosphor at various voltage levels using a GrasebyOptronics Model 307 radiometer with a Model 265 photo-metric filter, and a smooth function was used to interpolatebetween the measured data. The spectrum of each of the threeprimaries at their maximum intensity was measured with thePhoto Research PR-650 spectroradiometer. The obtainedspectra were then multiplied with the Judd-revised CIE1931 color-matching functions [33,34] to derive CIE xyY coor-dinates of the monitor phosphors. The xyY coordinates werethen used to convert between RGB and the DKL color space(see below).
2. Adjustable DiskThe stimulus consisted of either a 4° or an 8° radius adjustabledisk (see Fig. 1). The luminance of the adjustable disk was54 cd∕m2. Subjects could adjust the disk’s color (within therange that could be rendered at this luminance) by movingthe computer mouse in a two-dimensional opponent-colorspace (“DKL” [35]). The two isoluminant axes of this spacerefer to color directions that exclusively stimulate the L −Mand S − �L�M� postreceptoral mechanisms. The end pointsof these color directions correspond to CIE coordinates(0.3273, 0.3111; 0.2764, 0.2722; 0.2621, 0.3412 and 0.3257,0.4045). Data will be presented in this DKL color space.
A354 J. Opt. Soc. Am. A / Vol. 29, No. 2 / February 2012 Granzier et al.
All stimuli were described in the isoluminant plane of theDKL color space [35,36]. The DKL color space is a second-stage cone opponent color space, which reflects the prefer-ences of retinal ganglion cells and LGN neurons. It is spannedby an achromatic luminance axis, the L+M axis, and two chro-matic axes, the L −M axis and the S − �L�M� axis. The twochromatic axes define an isoluminant plane. These three so-called cardinal axes intersect at the white point. The L+M axisis determined by the sum of the signal generated by the long-wavelength cones (L cones) and the middle-wavelength cones(M cones). The L −M axis is determined by the differences inthe signals as generated by the L cones and the M cones. Alongthe L −M axis, the L- and M-cone excitations covary at a con-stant sum, while the short-wavelength cone (S-cone) excita-tion does not change. Colors along the L −M axis varybetween reddish and bluish–greenish. The S − �L�M� axisis determined by the difference in the signals generated bythe S cones and the sum of the L and M cones. Along the S −
�L�M� axis, only the excitation of the S cones changes andcolors vary between yellow–greenish and purple. The axes ofthe DKL color space were scaled from −1 to 1, where �1 cor-responds to the maximum contrast achievable for the particu-lar axis on the monitor used. Subjects were asked to set thedisk to appear to be gray (achromatic). If subjects found ithard to achieve an achromatic setting, they were instructedto choose the closest match they could find to gray.
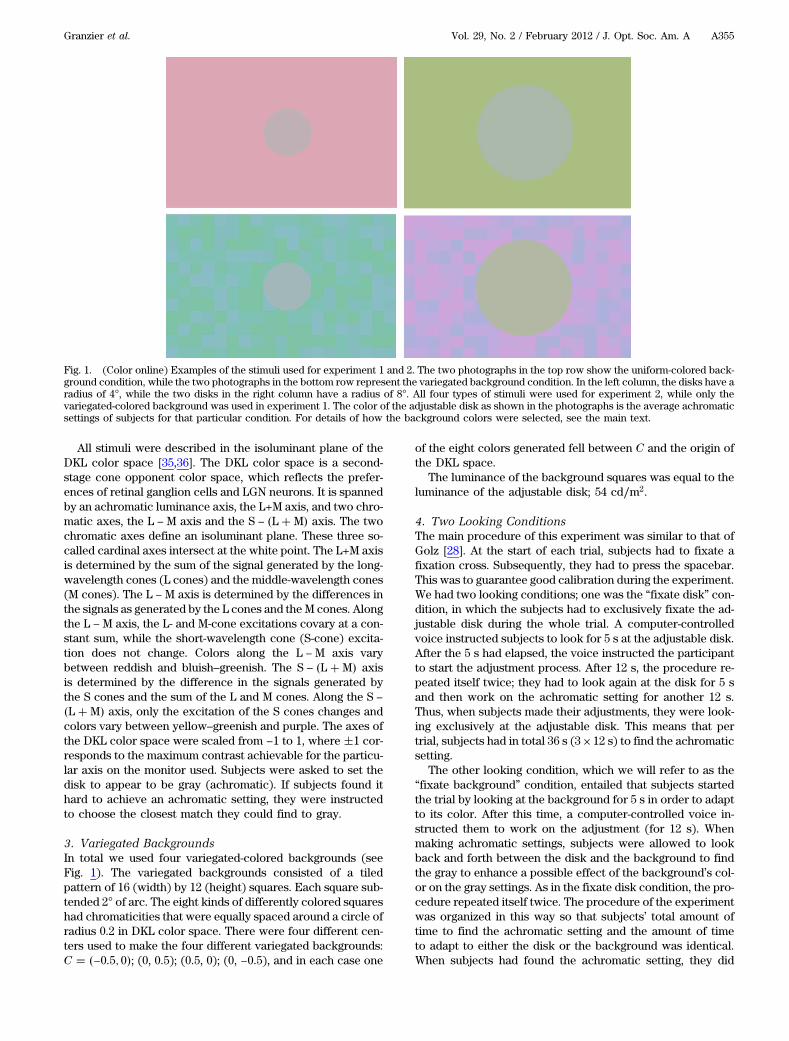
3. Variegated BackgroundsIn total we used four variegated-colored backgrounds (seeFig. 1). The variegated backgrounds consisted of a tiledpattern of 16 (width) by 12 (height) squares. Each square sub-tended 2° of arc. The eight kinds of differently colored squareshad chromaticities that were equally spaced around a circle ofradius 0.2 in DKL color space. There were four different cen-ters used to make the four different variegated backgrounds:C � �−0.5; 0�; (0, 0.5); (0.5, 0); (0, −0.5), and in each case one
of the eight colors generated fell between C and the origin ofthe DKL space.
The luminance of the background squares was equal to theluminance of the adjustable disk; 54 cd∕m2.
4. Two Looking ConditionsThe main procedure of this experiment was similar to that ofGolz [28]. At the start of each trial, subjects had to fixate afixation cross. Subsequently, they had to press the spacebar.This was to guarantee good calibration during the experiment.We had two looking conditions; one was the “fixate disk” con-dition, in which the subjects had to exclusively fixate the ad-justable disk during the whole trial. A computer-controlledvoice instructed subjects to look for 5 s at the adjustable disk.After the 5 s had elapsed, the voice instructed the participantto start the adjustment process. After 12 s, the procedure re-peated itself twice; they had to look again at the disk for 5 sand then work on the achromatic setting for another 12 s.Thus, when subjects made their adjustments, they were look-ing exclusively at the adjustable disk. This means that pertrial, subjects had in total 36 s (3 × 12 s) to find the achromaticsetting.
The other looking condition, which we will refer to as the“fixate background” condition, entailed that subjects startedthe trial by looking at the background for 5 s in order to adaptto its color. After this time, a computer-controlled voice in-structed them to work on the adjustment (for 12 s). Whenmaking achromatic settings, subjects were allowed to lookback and forth between the disk and the background to findthe gray to enhance a possible effect of the background’s col-or on the gray settings. As in the fixate disk condition, the pro-cedure repeated itself twice. The procedure of the experimentwas organized in this way so that subjects’ total amount oftime to find the achromatic setting and the amount of timeto adapt to either the disk or the background was identical.When subjects had found the achromatic setting, they did
Fig. 1. (Color online) Examples of the stimuli used for experiment 1 and 2. The two photographs in the top row show the uniform-colored back-ground condition, while the two photographs in the bottom row represent the variegated background condition. In the left column, the disks have aradius of 4°, while the two disks in the right column have a radius of 8°. All four types of stimuli were used for experiment 2, while only thevariegated-colored background was used in experiment 1. The color of the adjustable disk as shown in the photographs is the average achromaticsettings of subjects for that particular condition. For details of how the background colors were selected, see the main text.
Granzier et al. Vol. 29, No. 2 / February 2012 / J. Opt. Soc. Am. A A355
not have to press a computer button as the computer programstored the last chromatic values at the end of each trial. Thismeant that if subjects already found the achromatic setting inthe first or second part of the 36 s trial, they had to wait untilthe trial had ended. Subjects were encouraged that once theyhad found the perfect achromatic setting that they shouldcheck during the remaining time of the trial whether theachromatic setting was still acceptable for them.
5. Eye Movement RecordingsGaze position signals were recorded with a head-mounted,video-based eye tracker (EyeLink II, SR Research, Ltd., Os-goode, Ontario, Canada) and were sampled at 500 Hz. Obser-vers viewed the display binocularly, but only the right eye wassampled. Stimulus display and data collection were controlledby a PC. The eye tracker was calibrated at the beginning ofeach session. During the calibration, the subject fixated ninecalibration points on the face of the display for 1 s each. Thelocation of the nine fixation points was at the four corners ofthe display, in the middle of the display, and to both the leftand the right and below and above the middle of the screen.The order of presentation of the calibration points was rando-mized. In order to measure where subjects fixate their eyes,we measured subjects’ pupil area. Calibrations before andduring the experiment confirmed the high stability of the eyeposition recordings. A calibration was accepted only if the va-lidation procedure revealed a mean error smaller than 0.4° ofvisual angle. Eye positions were transformed into positions onthe screen on the basis of the calibrations immediately beforeand during the experiment. We determined the location andthe time subjects spent looking at different positions withinthe stimulus. The data were analyzed over the full time of therecording. The duration of the experimental sessions was notlimited. The achromatic settings, therefore, may therefore beconsidered as accurate as in a “normal” psychophysical ex-periment.
During the whole experiment, subjects’ eye movementswere recorded. However, for this experiment we did notuse the eye movement data as such. We only used the eyemovement data to check whether subjects followed the in-structions. When subjects were forced to look at the back-ground, but looked at the disk instead, the disk’s colorblended with the background’s color and vice versa. In thisway, we had control over subjects’ state of adaptation. Be-tween each trial, a white screen was presented for 5 s in orderto diminish color aftereffects.
6. SubjectsSix subjects participated in the experiment, including authorsJ.G. and M.T. Three of the six subjects participated in bothsessions (4° and 8° radii disks). All subjects had normal colorvision as tested with Ishihara color plates [37]. All subjectswere between 18 and 39 years of age. All had normal orcorrected-to-normal visual acuity. The subjects (except ofauthors J.G. and M.T.) were naïve as to the purpose of theexperiment.
7. Subjective GrayIn addition to performing in the main experiment, subjectswere asked to set an 8° radius adjustable disk at the centerof a white background to appear gray. The reason for perform-
ing this task is to measure what subjects regarded as beinggray without having a chromatic bias in the background.The luminance of the adjustable disk was fixed at 54 cd∕m2.The background was always white with the chromaticity ofthe neutral point in DKL space (0.280, 0.295, 100 cd∕m2 inCIE space). The subjects changed the disk color (but notits luminance) by moving the computer mouse in an identicalfashion to the main experiment. This was done 10 times, andthe average setting was used as the subjective gray for thatsubject. The average within-subject standard deviation is0.0788 for the L −M axis and 0.0980 for the S − �L�M� axisin the DKL color space. The subjective gray values for eachsubject were used to calculate the chromatic induction indexof each subject (see below). We have chosen the method ofsubjective gray to measure the magnitude of chromatic induc-tion as simply using the neutral point in DKL color spacewould not be a neutral color for each subject. In order touse a neutral point that is indeed neutral for each observer,we used subjective gray settings.
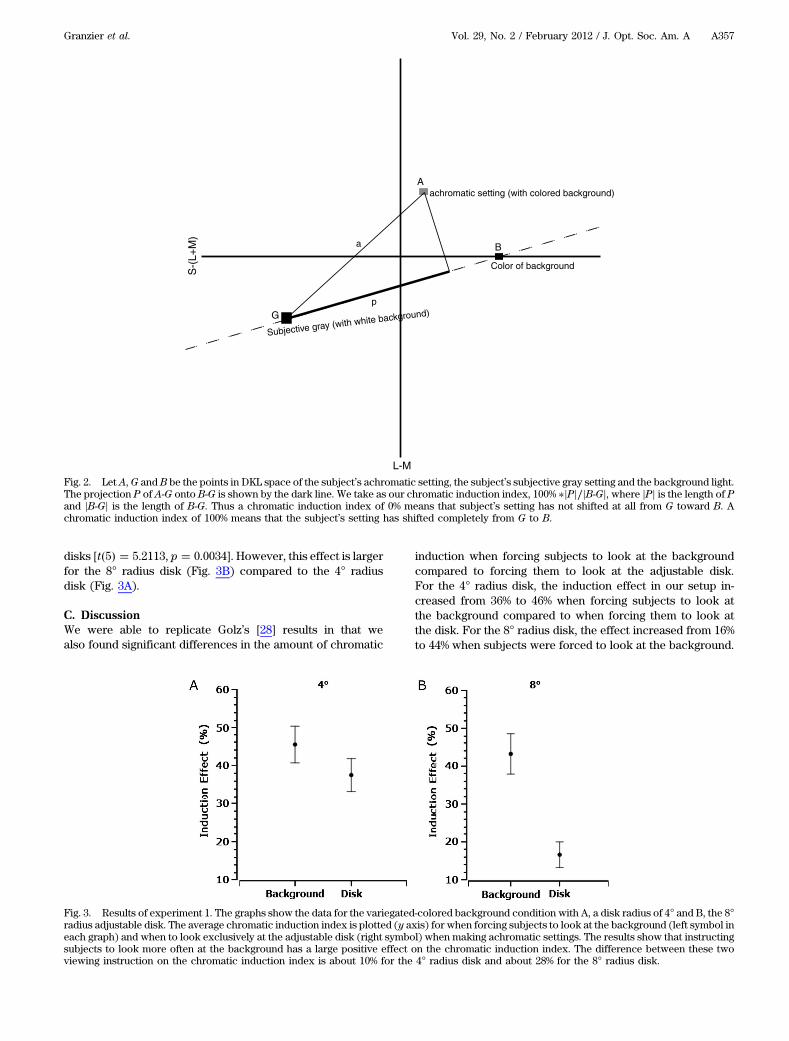
8. AnalysisWe first determined the mean value in the DKL color space ofeach subjects’ achromatic setting for each background condi-tion. To obtain a measure of how the color of the backgroundinfluenced what subjects perceived as gray, a chromatic-induction index was calculated for each subject, for each trialfor each background. The chromatic induction index was cal-culated in the following way: we took subjects’ achromaticsettings (made during the main experiment with an inducer)in the DKL color space and projected those on a line that liesbetween the color of the background and the subjective graysetting (subjects’ gray settings with no inducer present). Werepresented the amount of chromatic induction as the dis-tance (in the DKL color space) between subjects’ subjectivegray and the projected settings on the direction of the back-ground (p in Fig. 2). Thus the chromatic induction index is thedifference between the projected setting of the adjustable diskand the subjective gray setting, as a percentage of the differ-ence that we would expect if subjects attributed all differ-ences in the background to differences in illumination. So100% indicates that subjects set the color of the adjustabledisk to the color of the background (full chromatic induction),and 0% indicates that subjects set the disk to the same grayvalue as when no inducer was present (subjective graysettings). Paired t-tests were used to see whether the differ-ence in the amount of induction was significantly differentfrom zero between the fixate background and the fixate diskcondition.
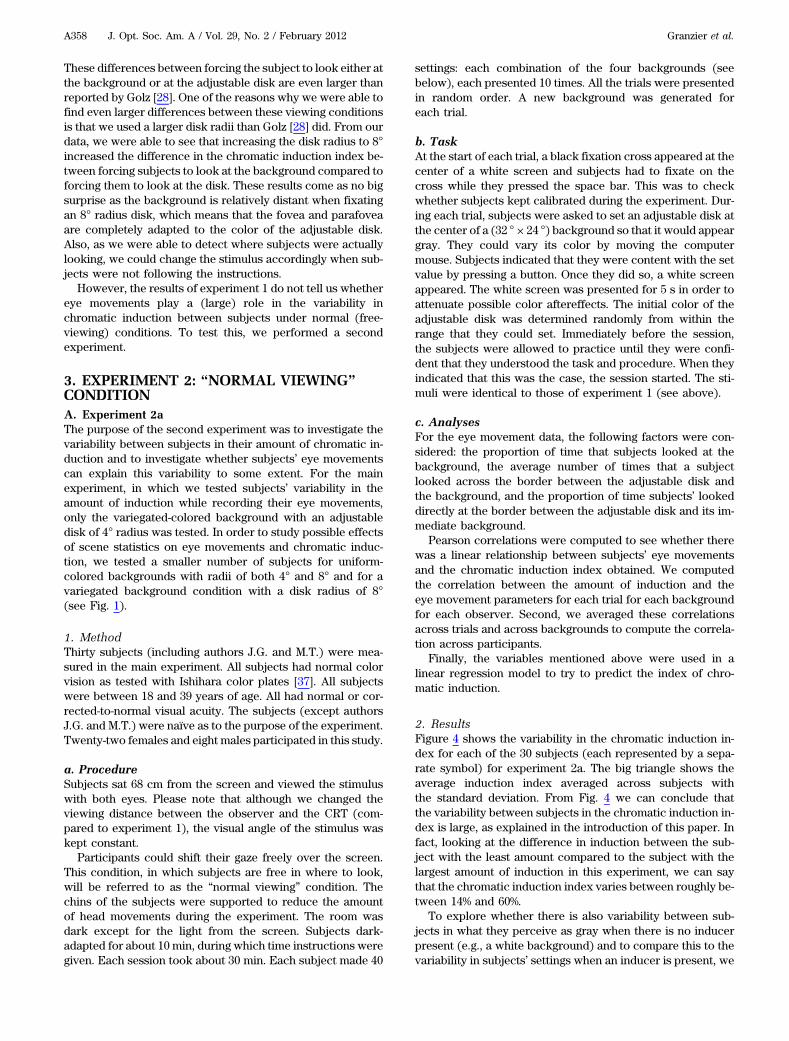
B. ResultsFigure 3 shows the chromatic induction index (plotted on they axes) when tested with the 4° radius disk and an 8° radiusdisk (Figs. 3A and 3B, respectively). Each panel plots thechromatic induction index when subjects were instructedto look at the background or to look exclusively at the adjus-table disk (depicted on the x axes of both panels). From thesedata, we can conclude that our hypothesis is confirmed: sub-jects’ chromatic induction index is significantly larger wheninstructed to look at the background compared to whenforced to look only at the adjustable disk. This effect is appar-ent for both the 4° [t�5� � 2.8046, p � 0.0378] and 8° radii
A356 J. Opt. Soc. Am. A / Vol. 29, No. 2 / February 2012 Granzier et al.
disks [t�5� � 5.2113, p � 0.0034]. However, this effect is largerfor the 8° radius disk (Fig. 3B) compared to the 4° radiusdisk (Fig. 3A).
C. DiscussionWe were able to replicate Golz’s [28] results in that wealso found significant differences in the amount of chromatic
induction when forcing subjects to look at the backgroundcompared to forcing them to look at the adjustable disk.For the 4° radius disk, the induction effect in our setup in-creased from 36% to 46% when forcing subjects to look atthe background compared to when forcing them to look atthe disk. For the 8° radius disk, the effect increased from 16%to 44% when subjects were forced to look at the background.
L-M
S-(
L+M
)achromatic setting (with colored background)
Color of background
Subjective gray (with white background)
a
p
A
B
G
Fig. 2. Let A,G and B be the points in DKL space of the subject’s achromatic setting, the subject’s subjective gray setting and the background light.The projection P of A-G onto B-G is shown by the dark line. We take as our chromatic induction index, 100% �jPj∕jB-Gj, where jPj is the length of Pand jB-Gj is the length of B-G. Thus a chromatic induction index of 0% means that subject’s setting has not shifted at all from G toward B. Achromatic induction index of 100% means that the subject’s setting has shifted completely from G to B.
Fig. 3. Results of experiment 1. The graphs show the data for the variegated-colored background condition with A, a disk radius of 4° and B, the 8°radius adjustable disk. The average chromatic induction index is plotted (y axis) for when forcing subjects to look at the background (left symbol ineach graph) and when to look exclusively at the adjustable disk (right symbol) when making achromatic settings. The results show that instructingsubjects to look more often at the background has a large positive effect on the chromatic induction index. The difference between these twoviewing instruction on the chromatic induction index is about 10% for the 4° radius disk and about 28% for the 8° radius disk.
Granzier et al. Vol. 29, No. 2 / February 2012 / J. Opt. Soc. Am. A A357
These differences between forcing the subject to look either atthe background or at the adjustable disk are even larger thanreported by Golz [28]. One of the reasons why we were able tofind even larger differences between these viewing conditionsis that we used a larger disk radii than Golz [28] did. From ourdata, we were able to see that increasing the disk radius to 8°increased the difference in the chromatic induction index be-tween forcing subjects to look at the background compared toforcing them to look at the disk. These results come as no bigsurprise as the background is relatively distant when fixatingan 8° radius disk, which means that the fovea and parafoveaare completely adapted to the color of the adjustable disk.Also, as we were able to detect where subjects were actuallylooking, we could change the stimulus accordingly when sub-jects were not following the instructions.
However, the results of experiment 1 do not tell us whethereye movements play a (large) role in the variability inchromatic induction between subjects under normal (free-viewing) conditions. To test this, we performed a secondexperiment.
3. EXPERIMENT 2: “NORMAL VIEWING”
CONDITIONA. Experiment 2aThe purpose of the second experiment was to investigate thevariability between subjects in their amount of chromatic in-duction and to investigate whether subjects’ eye movementscan explain this variability to some extent. For the mainexperiment, in which we tested subjects’ variability in theamount of induction while recording their eye movements,only the variegated-colored background with an adjustabledisk of 4° radius was tested. In order to study possible effectsof scene statistics on eye movements and chromatic induc-tion, we tested a smaller number of subjects for uniform-colored backgrounds with radii of both 4° and 8° and for avariegated background condition with a disk radius of 8°(see Fig. 1).
1. MethodThirty subjects (including authors J.G. and M.T.) were mea-sured in the main experiment. All subjects had normal colorvision as tested with Ishihara color plates [37]. All subjectswere between 18 and 39 years of age. All had normal or cor-rected-to-normal visual acuity. The subjects (except authorsJ.G. and M.T.) were naïve as to the purpose of the experiment.Twenty-two females and eight males participated in this study.
a. ProcedureSubjects sat 68 cm from the screen and viewed the stimuluswith both eyes. Please note that although we changed theviewing distance between the observer and the CRT (com-pared to experiment 1), the visual angle of the stimulus waskept constant.
Participants could shift their gaze freely over the screen.This condition, in which subjects are free in where to look,will be referred to as the “normal viewing” condition. Thechins of the subjects were supported to reduce the amountof head movements during the experiment. The room wasdark except for the light from the screen. Subjects dark-adapted for about 10 min, during which time instructions weregiven. Each session took about 30 min. Each subject made 40
settings: each combination of the four backgrounds (seebelow), each presented 10 times. All the trials were presentedin random order. A new background was generated foreach trial.
b. TaskAt the start of each trial, a black fixation cross appeared at thecenter of a white screen and subjects had to fixate on thecross while they pressed the space bar. This was to checkwhether subjects kept calibrated during the experiment. Dur-ing each trial, subjects were asked to set an adjustable disk atthe center of a (32 ° × 24 °) background so that it would appeargray. They could vary its color by moving the computermouse. Subjects indicated that they were content with the setvalue by pressing a button. Once they did so, a white screenappeared. The white screen was presented for 5 s in order toattenuate possible color aftereffects. The initial color of theadjustable disk was determined randomly from within therange that they could set. Immediately before the session,the subjects were allowed to practice until they were confi-dent that they understood the task and procedure. When theyindicated that this was the case, the session started. The sti-muli were identical to those of experiment 1 (see above).
c. AnalysesFor the eye movement data, the following factors were con-sidered: the proportion of time that subjects looked at thebackground, the average number of times that a subjectlooked across the border between the adjustable disk andthe background, and the proportion of time subjects’ lookeddirectly at the border between the adjustable disk and its im-mediate background.
Pearson correlations were computed to see whether therewas a linear relationship between subjects’ eye movementsand the chromatic induction index obtained. We computedthe correlation between the amount of induction and theeye movement parameters for each trial for each backgroundfor each observer. Second, we averaged these correlationsacross trials and across backgrounds to compute the correla-tion across participants.
Finally, the variables mentioned above were used in alinear regression model to try to predict the index of chro-matic induction.
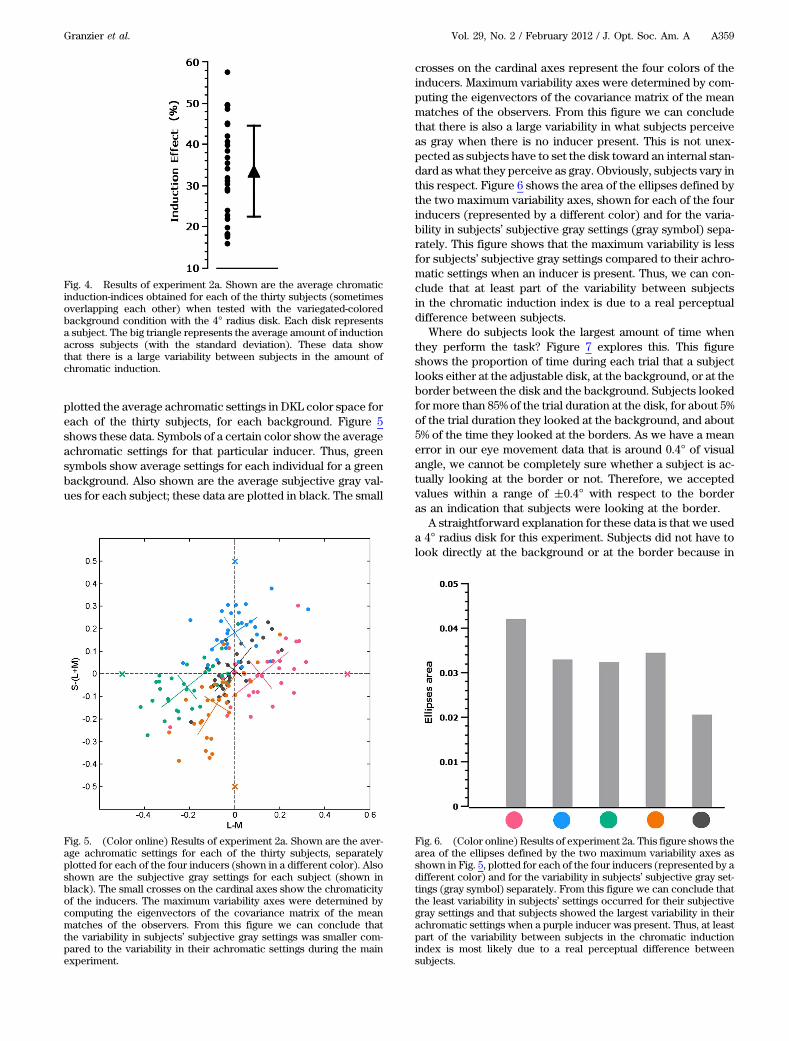
2. ResultsFigure 4 shows the variability in the chromatic induction in-dex for each of the 30 subjects (each represented by a sepa-rate symbol) for experiment 2a. The big triangle shows theaverage induction index averaged across subjects withthe standard deviation. From Fig. 4 we can conclude thatthe variability between subjects in the chromatic induction in-dex is large, as explained in the introduction of this paper. Infact, looking at the difference in induction between the sub-ject with the least amount compared to the subject with thelargest amount of induction in this experiment, we can saythat the chromatic induction index varies between roughly be-tween 14% and 60%.
To explore whether there is also variability between sub-jects in what they perceive as gray when there is no inducerpresent (e.g., a white background) and to compare this to thevariability in subjects’ settings when an inducer is present, we
A358 J. Opt. Soc. Am. A / Vol. 29, No. 2 / February 2012 Granzier et al.
plotted the average achromatic settings in DKL color space foreach of the thirty subjects, for each background. Figure 5shows these data. Symbols of a certain color show the averageachromatic settings for that particular inducer. Thus, greensymbols show average settings for each individual for a greenbackground. Also shown are the average subjective gray val-ues for each subject; these data are plotted in black. The small
crosses on the cardinal axes represent the four colors of theinducers. Maximum variability axes were determined by com-puting the eigenvectors of the covariance matrix of the meanmatches of the observers. From this figure we can concludethat there is also a large variability in what subjects perceiveas gray when there is no inducer present. This is not unex-pected as subjects have to set the disk toward an internal stan-dard as what they perceive as gray. Obviously, subjects vary inthis respect. Figure 6 shows the area of the ellipses defined bythe two maximum variability axes, shown for each of the fourinducers (represented by a different color) and for the varia-bility in subjects’ subjective gray settings (gray symbol) sepa-rately. This figure shows that the maximum variability is lessfor subjects’ subjective gray settings compared to their achro-matic settings when an inducer is present. Thus, we can con-clude that at least part of the variability between subjectsin the chromatic induction index is due to a real perceptualdifference between subjects.
Where do subjects look the largest amount of time whenthey perform the task? Figure 7 explores this. This figureshows the proportion of time during each trial that a subjectlooks either at the adjustable disk, at the background, or at theborder between the disk and the background. Subjects lookedfor more than 85% of the trial duration at the disk, for about 5%of the trial duration they looked at the background, and about5% of the time they looked at the borders. As we have a meanerror in our eye movement data that is around 0.4° of visualangle, we cannot be completely sure whether a subject is ac-tually looking at the border or not. Therefore, we acceptedvalues within a range of �0.4° with respect to the borderas an indication that subjects were looking at the border.
A straightforward explanation for these data is that we useda 4° radius disk for this experiment. Subjects did not have tolook directly at the background or at the border because in
Fig. 4. Results of experiment 2a. Shown are the average chromaticinduction-indices obtained for each of the thirty subjects (sometimesoverlapping each other) when tested with the variegated-coloredbackground condition with the 4° radius disk. Each disk representsa subject. The big triangle represents the average amount of inductionacross subjects (with the standard deviation). These data showthat there is a large variability between subjects in the amount ofchromatic induction.
Fig. 5. (Color online) Results of experiment 2a. Shown are the aver-age achromatic settings for each of the thirty subjects, separatelyplotted for each of the four inducers (shown in a different color). Alsoshown are the subjective gray settings for each subject (shown inblack). The small crosses on the cardinal axes show the chromaticityof the inducers. The maximum variability axes were determined bycomputing the eigenvectors of the covariance matrix of the meanmatches of the observers. From this figure we can conclude thatthe variability in subjects’ subjective gray settings was smaller com-pared to the variability in their achromatic settings during the mainexperiment.
Fig. 6. (Color online) Results of experiment 2a. This figure shows thearea of the ellipses defined by the two maximum variability axes asshown in Fig. 5, plotted for each of the four inducers (represented by adifferent color) and for the variability in subjects’ subjective gray set-tings (gray symbol) separately. From this figure we can conclude thatthe least variability in subjects’ settings occurred for their subjectivegray settings and that subjects showed the largest variability in theirachromatic settings when a purple inducer was present. Thus, at leastpart of the variability between subjects in the chromatic inductionindex is most likely due to a real perceptual difference betweensubjects.
Granzier et al. Vol. 29, No. 2 / February 2012 / J. Opt. Soc. Am. A A359
their peripheral vision they could still see the border and thebackground. This could also explain the fact that the back-ground’s color has an influence on subjects’ achromatic set-tings, although subjects do not directly look at the backgroundnor at the border.
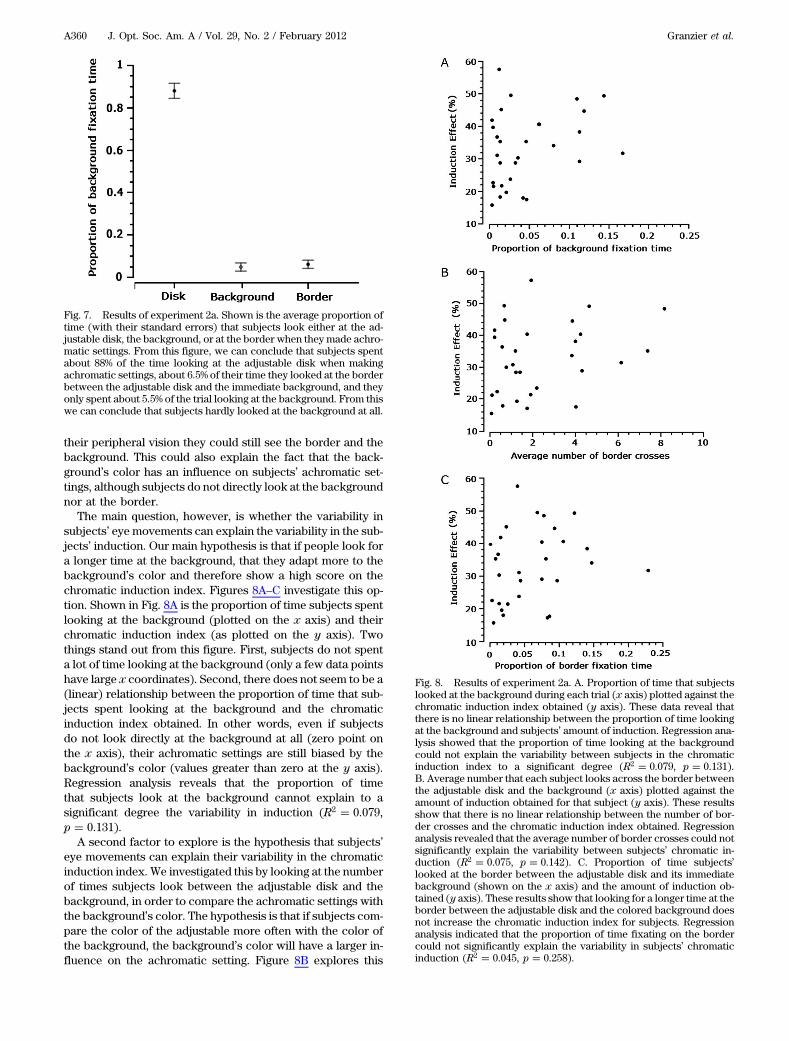
The main question, however, is whether the variability insubjects’ eye movements can explain the variability in the sub-jects’ induction. Our main hypothesis is that if people look fora longer time at the background, that they adapt more to thebackground’s color and therefore show a high score on thechromatic induction index. Figures 8A–C investigate this op-tion. Shown in Fig. 8A is the proportion of time subjects spentlooking at the background (plotted on the x axis) and theirchromatic induction index (as plotted on the y axis). Twothings stand out from this figure. First, subjects do not spenta lot of time looking at the background (only a few data pointshave large x coordinates). Second, there does not seem to be a(linear) relationship between the proportion of time that sub-jects spent looking at the background and the chromaticinduction index obtained. In other words, even if subjectsdo not look directly at the background at all (zero point onthe x axis), their achromatic settings are still biased by thebackground’s color (values greater than zero at the y axis).Regression analysis reveals that the proportion of timethat subjects look at the background cannot explain to asignificant degree the variability in induction (R2 � 0.079,p � 0.131).
A second factor to explore is the hypothesis that subjects’eye movements can explain their variability in the chromaticinduction index. We investigated this by looking at the numberof times subjects look between the adjustable disk and thebackground, in order to compare the achromatic settings withthe background’s color. The hypothesis is that if subjects com-pare the color of the adjustable more often with the color ofthe background, the background’s color will have a larger in-fluence on the achromatic setting. Figure 8B explores this
Fig. 7. Results of experiment 2a. Shown is the average proportion oftime (with their standard errors) that subjects look either at the ad-justable disk, the background, or at the border when they made achro-matic settings. From this figure, we can conclude that subjects spentabout 88% of the time looking at the adjustable disk when makingachromatic settings, about 6.5% of their time they looked at the borderbetween the adjustable disk and the immediate background, and theyonly spent about 5.5% of the trial looking at the background. From thiswe can conclude that subjects hardly looked at the background at all.
Fig. 8. Results of experiment 2a. A. Proportion of time that subjectslooked at the background during each trial (x axis) plotted against thechromatic induction index obtained (y axis). These data reveal thatthere is no linear relationship between the proportion of time lookingat the background and subjects’ amount of induction. Regression ana-lysis showed that the proportion of time looking at the backgroundcould not explain the variability between subjects in the chromaticinduction index to a significant degree (R2 � 0.079, p � 0.131).B. Average number that each subject looks across the border betweenthe adjustable disk and the background (x axis) plotted against theamount of induction obtained for that subject (y axis). These resultsshow that there is no linear relationship between the number of bor-der crosses and the chromatic induction index obtained. Regressionanalysis revealed that the average number of border crosses could notsignificantly explain the variability between subjects’ chromatic in-duction (R2 � 0.075, p � 0.142). C. Proportion of time subjects’looked at the border between the adjustable disk and its immediatebackground (shown on the x axis) and the amount of induction ob-tained (y axis). These results show that looking for a longer time at theborder between the adjustable disk and the colored background doesnot increase the chromatic induction index for subjects. Regressionanalysis indicated that the proportion of time fixating on the bordercould not significantly explain the variability in subjects’ chromaticinduction (R2 � 0.045, p � 0.258).
A360 J. Opt. Soc. Am. A / Vol. 29, No. 2 / February 2012 Granzier et al.
idea; shown are the average number of border crosses whenmaking the achromatic setting (plotted on the x axis) and theaverage chromatic induction index obtained (plotted on the yaxis). From this figure we can conclude that there once againis no significant linear relationship between the score on thechromatic induction index and the number of times a subjectlooks back and forth between the disk and the background.Regression analysis revealed no significant contribution ofthe number of times looking back and forth between the diskand the background in explaining the variability in inductionbetween subjects (R2 � 0.075, p � 0.142).
Finally, in the introduction, it was explained that the infor-mation at the borders is critical in determining the perceivedcolor (e.g., local color contrast). To study whether looking atthe borders had an effect on the chromatic induction index,we analyzed the proportion of time that subjects fixated onthe border between the disk and the background when mak-ing achromatic settings. Figure 8C shows the results of thisanalysis. Shown in this figure is the time looking at the border(displayed on the x axis) and the chromatic induction index.No significant correlation could be detected between the timespent looking at the border and the chromatic induction in-dex. Once again, regression analysis revealed that the propor-tion of time fixating the border did not significantly contributein explaining the variability in induction between subjects(R2 � 0.045, p � 0.258).
3. DiscussionThe results from the main experiment do not confirm our hy-pothesis that there is a correlation between subjects’ eyemovements and the score on the chromatic induction index.It could be the case that we were unable to find any statisticalcorrelation between the two factors because of the particularstimuli that we used. In order to test whether this lack ofcorrelation can be generalized to other scene statistics, weperformed additional experiments.
4. Additional ResultsIn order to investigate whether scene statistics would haveany effect on the correlation between eye movements andthe chromatic induction index, we tested subjects in four uni-form-colored backgrounds with disk radii of both 8° and 4°and in the same variegated backgrounds as used in the mainexperiment, but now with a disk radius of 8° (see Fig. 1). Thetwo different disk sizes (8° and 4° radii sizes) and the uniformand the variegated-colored background conditions were eachtested in separate sessions. The order of the sessions was ran-domized between subjects. The procedure and anal-yses was identical to the main experiment.
a. SubjectsFor the uniformed-colored background with a disk radius of4°, eight subjects participated, including the first author. Sixsubjects also participated in the main experiment. For the uni-form-colored background with a disk radius of 8°, seven sub-jects participated (including the same six participants whoalso participated in the main experiment). Finally, for the var-iegated-colored background condition with a disk radius of 8°,fifteen subjects participated, including the first author. Sevensubjects also participated in the main experiment. All subjects(except the author) were naïve as to the purpose of the experi-
ment and all had normal color vision as tested with theIshihara color plates.
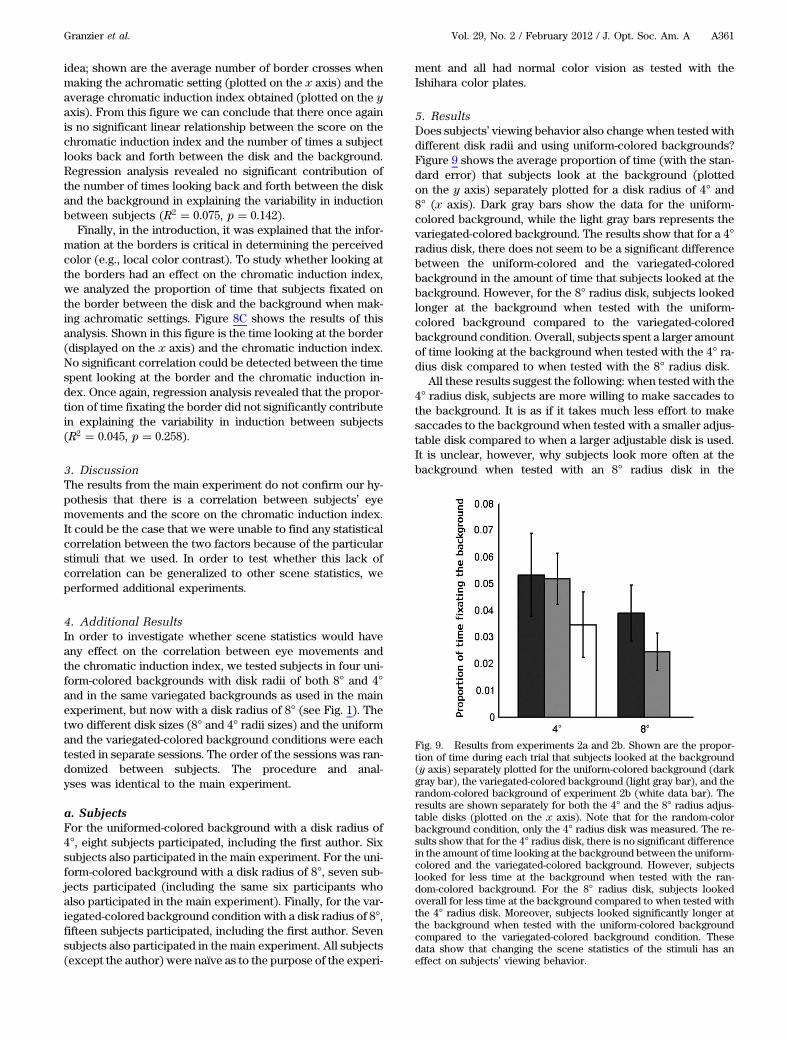
5. ResultsDoes subjects’ viewing behavior also change when tested withdifferent disk radii and using uniform-colored backgrounds?Figure 9 shows the average proportion of time (with the stan-dard error) that subjects look at the background (plottedon the y axis) separately plotted for a disk radius of 4° and8° (x axis). Dark gray bars show the data for the uniform-colored background, while the light gray bars represents thevariegated-colored background. The results show that for a 4°radius disk, there does not seem to be a significant differencebetween the uniform-colored and the variegated-coloredbackground in the amount of time that subjects looked at thebackground. However, for the 8° radius disk, subjects lookedlonger at the background when tested with the uniform-colored background compared to the variegated-coloredbackground condition. Overall, subjects spent a larger amountof time looking at the background when tested with the 4° ra-dius disk compared to when tested with the 8° radius disk.
All these results suggest the following: when tested with the4° radius disk, subjects are more willing to make saccades tothe background. It is as if it takes much less effort to makesaccades to the background when tested with a smaller adjus-table disk compared to when a larger adjustable disk is used.It is unclear, however, why subjects look more often at thebackground when tested with an 8° radius disk in the
Fig. 9. Results from experiments 2a and 2b. Shown are the propor-tion of time during each trial that subjects looked at the background(y axis) separately plotted for the uniform-colored background (darkgray bar), the variegated-colored background (light gray bar), and therandom-colored background of experiment 2b (white data bar). Theresults are shown separately for both the 4° and the 8° radius adjus-table disks (plotted on the x axis). Note that for the random-colorbackground condition, only the 4° radius disk was measured. The re-sults show that for the 4° radius disk, there is no significant differencein the amount of time looking at the background between the uniform-colored and the variegated-colored background. However, subjectslooked for less time at the background when tested with the ran-dom-colored background. For the 8° radius disk, subjects lookedoverall for less time at the background compared to when tested withthe 4° radius disk. Moreover, subjects looked significantly longer atthe background when tested with the uniform-colored backgroundcompared to the variegated-colored background condition. Thesedata show that changing the scene statistics of the stimuli has aneffect on subjects’ viewing behavior.
Granzier et al. Vol. 29, No. 2 / February 2012 / J. Opt. Soc. Am. A A361
uniform-colored background condition compared to whentested with the variegated background condition. Subjects re-ported that looking at the variegated background confusedthem when making gray settings; they had the impression thatthe background’s color had an influence on what they per-ceived as gray. This dependency on the background’s colorwhen considering what they perceived as gray was less appar-ent when tested with the uniform-colored background condi-tion. However, this hypothesis cannot explain the fact whysubjects were equally willing to look at the background be-tween when tested with the uniform-colored backgroundcompared to when tested with the variegated-colored back-ground with a 4° radius disk.
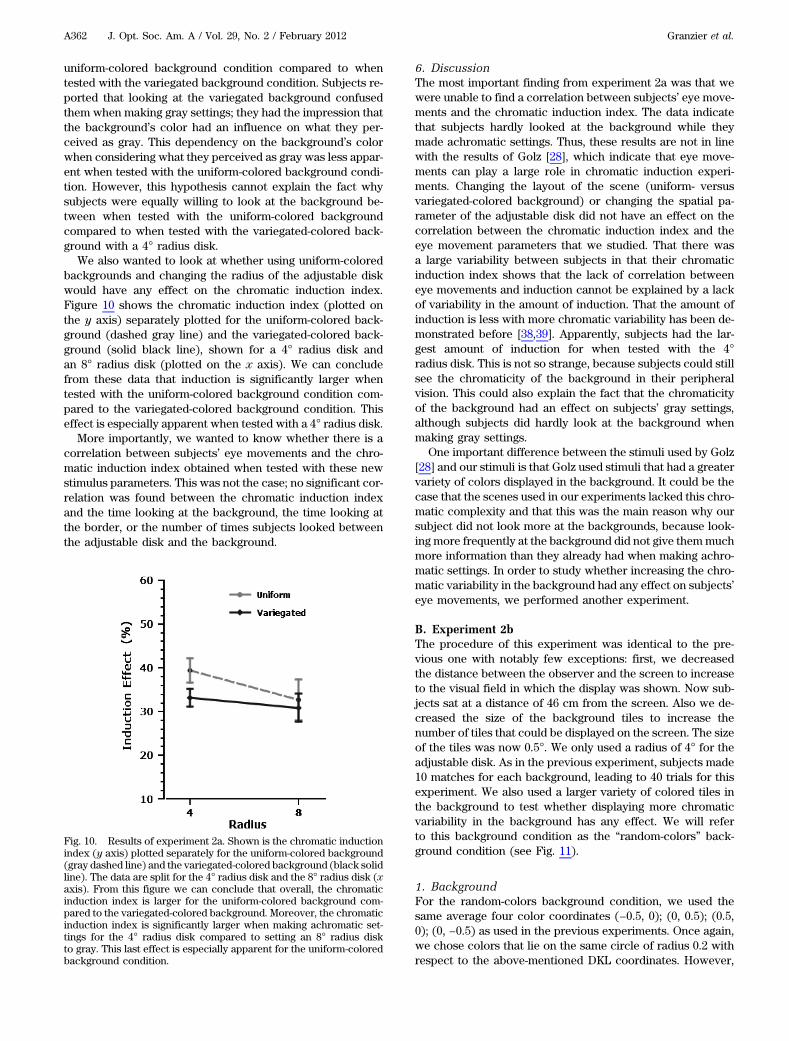
We also wanted to look at whether using uniform-coloredbackgrounds and changing the radius of the adjustable diskwould have any effect on the chromatic induction index.Figure 10 shows the chromatic induction index (plotted onthe y axis) separately plotted for the uniform-colored back-ground (dashed gray line) and the variegated-colored back-ground (solid black line), shown for a 4° radius disk andan 8° radius disk (plotted on the x axis). We can concludefrom these data that induction is significantly larger whentested with the uniform-colored background condition com-pared to the variegated-colored background condition. Thiseffect is especially apparent when tested with a 4° radius disk.
More importantly, we wanted to know whether there is acorrelation between subjects’ eye movements and the chro-matic induction index obtained when tested with these newstimulus parameters. This was not the case; no significant cor-relation was found between the chromatic induction indexand the time looking at the background, the time looking atthe border, or the number of times subjects looked betweenthe adjustable disk and the background.
6. DiscussionThe most important finding from experiment 2a was that wewere unable to find a correlation between subjects’ eye move-ments and the chromatic induction index. The data indicatethat subjects hardly looked at the background while theymade achromatic settings. Thus, these results are not in linewith the results of Golz [28], which indicate that eye move-ments can play a large role in chromatic induction experi-ments. Changing the layout of the scene (uniform- versusvariegated-colored background) or changing the spatial pa-rameter of the adjustable disk did not have an effect on thecorrelation between the chromatic induction index and theeye movement parameters that we studied. That there wasa large variability between subjects in that their chromaticinduction index shows that the lack of correlation betweeneye movements and induction cannot be explained by a lackof variability in the amount of induction. That the amount ofinduction is less with more chromatic variability has been de-monstrated before [38,39]. Apparently, subjects had the lar-gest amount of induction for when tested with the 4°radius disk. This is not so strange, because subjects could stillsee the chromaticity of the background in their peripheralvision. This could also explain the fact that the chromaticityof the background had an effect on subjects’ gray settings,although subjects did hardly look at the background whenmaking gray settings.
One important difference between the stimuli used by Golz[28] and our stimuli is that Golz used stimuli that had a greatervariety of colors displayed in the background. It could be thecase that the scenes used in our experiments lacked this chro-matic complexity and that this was the main reason why oursubject did not look more at the backgrounds, because look-ing more frequently at the background did not give themmuchmore information than they already had when making achro-matic settings. In order to study whether increasing the chro-matic variability in the background had any effect on subjects’eye movements, we performed another experiment.
B. Experiment 2bThe procedure of this experiment was identical to the pre-vious one with notably few exceptions: first, we decreasedthe distance between the observer and the screen to increaseto the visual field in which the display was shown. Now sub-jects sat at a distance of 46 cm from the screen. Also we de-creased the size of the background tiles to increase thenumber of tiles that could be displayed on the screen. The sizeof the tiles was now 0.5°. We only used a radius of 4° for theadjustable disk. As in the previous experiment, subjects made10 matches for each background, leading to 40 trials for thisexperiment. We also used a larger variety of colored tiles inthe background to test whether displaying more chromaticvariability in the background has any effect. We will referto this background condition as the “random-colors” back-ground condition (see Fig. 11).
1. BackgroundFor the random-colors background condition, we used thesame average four color coordinates (−0.5, 0); (0, 0.5); (0.5,0); (0, −0.5) as used in the previous experiments. Once again,we chose colors that lie on the same circle of radius 0.2 withrespect to the above-mentioned DKL coordinates. However,
Fig. 10. Results of experiment 2a. Shown is the chromatic inductionindex (y axis) plotted separately for the uniform-colored background(gray dashed line) and the variegated-colored background (black solidline). The data are split for the 4° radius disk and the 8° radius disk (xaxis). From this figure we can conclude that overall, the chromaticinduction index is larger for the uniform-colored background com-pared to the variegated-colored background. Moreover, the chromaticinduction index is significantly larger when making achromatic set-tings for the 4° radius disk compared to setting an 8° radius diskto gray. This last effect is especially apparent for the uniform-coloredbackground condition.
A362 J. Opt. Soc. Am. A / Vol. 29, No. 2 / February 2012 Granzier et al.
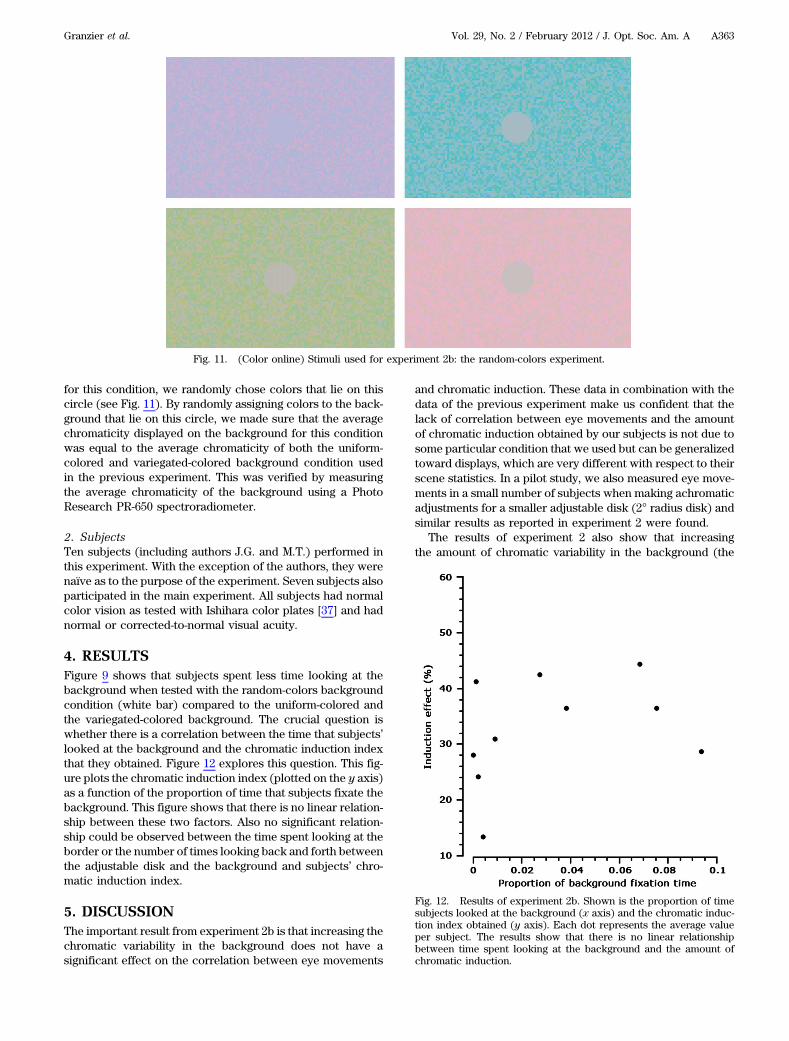
for this condition, we randomly chose colors that lie on thiscircle (see Fig. 11). By randomly assigning colors to the back-ground that lie on this circle, we made sure that the averagechromaticity displayed on the background for this conditionwas equal to the average chromaticity of both the uniform-colored and variegated-colored background condition usedin the previous experiment. This was verified by measuringthe average chromaticity of the background using a PhotoResearch PR-650 spectroradiometer.
2. SubjectsTen subjects (including authors J.G. and M.T.) performed inthis experiment. With the exception of the authors, they werenaïve as to the purpose of the experiment. Seven subjects alsoparticipated in the main experiment. All subjects had normalcolor vision as tested with Ishihara color plates [37] and hadnormal or corrected-to-normal visual acuity.
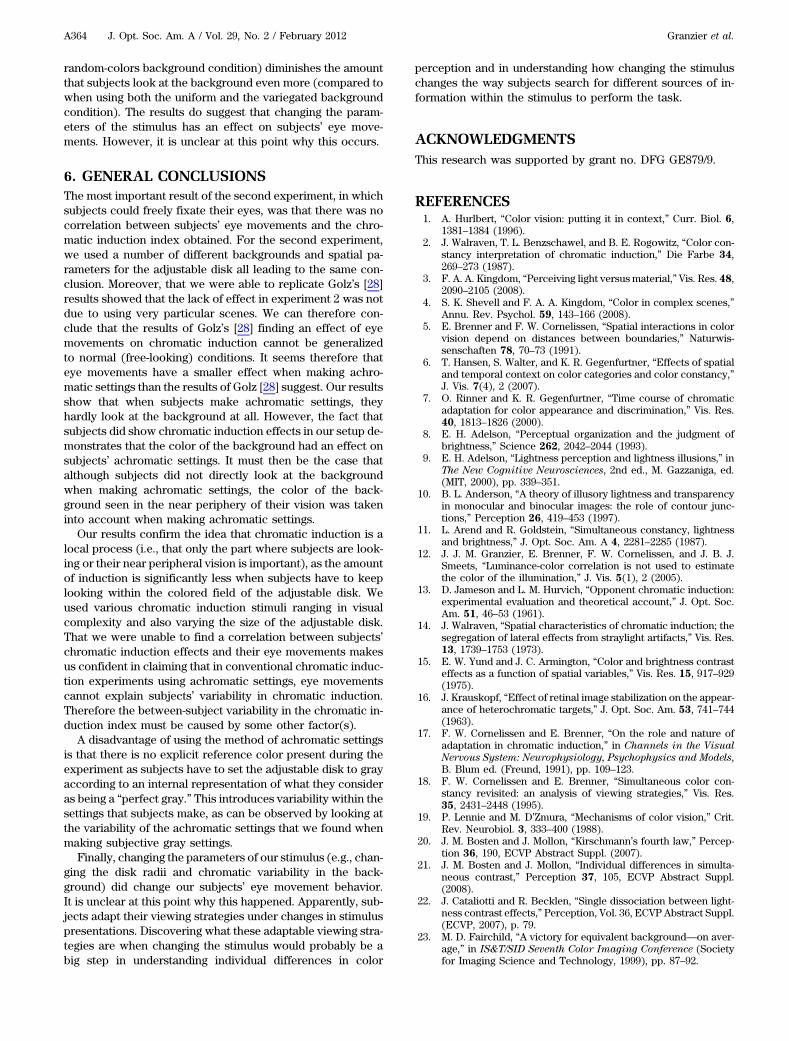
4. RESULTSFigure 9 shows that subjects spent less time looking at thebackground when tested with the random-colors backgroundcondition (white bar) compared to the uniform-colored andthe variegated-colored background. The crucial question iswhether there is a correlation between the time that subjects’looked at the background and the chromatic induction indexthat they obtained. Figure 12 explores this question. This fig-ure plots the chromatic induction index (plotted on the y axis)as a function of the proportion of time that subjects fixate thebackground. This figure shows that there is no linear relation-ship between these two factors. Also no significant relation-ship could be observed between the time spent looking at theborder or the number of times looking back and forth betweenthe adjustable disk and the background and subjects’ chro-matic induction index.
5. DISCUSSIONThe important result from experiment 2b is that increasing thechromatic variability in the background does not have asignificant effect on the correlation between eye movements
and chromatic induction. These data in combination with thedata of the previous experiment make us confident that thelack of correlation between eye movements and the amountof chromatic induction obtained by our subjects is not due tosome particular condition that we used but can be generalizedtoward displays, which are very different with respect to theirscene statistics. In a pilot study, we also measured eye move-ments in a small number of subjects when making achromaticadjustments for a smaller adjustable disk (2° radius disk) andsimilar results as reported in experiment 2 were found.
The results of experiment 2 also show that increasingthe amount of chromatic variability in the background (the
Fig. 11. (Color online) Stimuli used for experiment 2b: the random-colors experiment.
Fig. 12. Results of experiment 2b. Shown is the proportion of timesubjects looked at the background (x axis) and the chromatic induc-tion index obtained (y axis). Each dot represents the average valueper subject. The results show that there is no linear relationshipbetween time spent looking at the background and the amount ofchromatic induction.
Granzier et al. Vol. 29, No. 2 / February 2012 / J. Opt. Soc. Am. A A363
random-colors background condition) diminishes the amountthat subjects look at the background even more (compared towhen using both the uniform and the variegated backgroundcondition). The results do suggest that changing the param-eters of the stimulus has an effect on subjects’ eye move-ments. However, it is unclear at this point why this occurs.
6. GENERAL CONCLUSIONSThe most important result of the second experiment, in whichsubjects could freely fixate their eyes, was that there was nocorrelation between subjects’ eye movements and the chro-matic induction index obtained. For the second experiment,we used a number of different backgrounds and spatial pa-rameters for the adjustable disk all leading to the same con-clusion. Moreover, that we were able to replicate Golz’s [28]results showed that the lack of effect in experiment 2 was notdue to using very particular scenes. We can therefore con-clude that the results of Golz’s [28] finding an effect of eyemovements on chromatic induction cannot be generalizedto normal (free-looking) conditions. It seems therefore thateye movements have a smaller effect when making achro-matic settings than the results of Golz [28] suggest. Our resultsshow that when subjects make achromatic settings, theyhardly look at the background at all. However, the fact thatsubjects did show chromatic induction effects in our setup de-monstrates that the color of the background had an effect onsubjects’ achromatic settings. It must then be the case thatalthough subjects did not directly look at the backgroundwhen making achromatic settings, the color of the back-ground seen in the near periphery of their vision was takeninto account when making achromatic settings.
Our results confirm the idea that chromatic induction is alocal process (i.e., that only the part where subjects are look-ing or their near peripheral vision is important), as the amountof induction is significantly less when subjects have to keeplooking within the colored field of the adjustable disk. Weused various chromatic induction stimuli ranging in visualcomplexity and also varying the size of the adjustable disk.That we were unable to find a correlation between subjects’chromatic induction effects and their eye movements makesus confident in claiming that in conventional chromatic induc-tion experiments using achromatic settings, eye movementscannot explain subjects’ variability in chromatic induction.Therefore the between-subject variability in the chromatic in-duction index must be caused by some other factor(s).
A disadvantage of using the method of achromatic settingsis that there is no explicit reference color present during theexperiment as subjects have to set the adjustable disk to grayaccording to an internal representation of what they consideras being a “perfect gray.” This introduces variability within thesettings that subjects make, as can be observed by looking atthe variability of the achromatic settings that we found whenmaking subjective gray settings.
Finally, changing the parameters of our stimulus (e.g., chan-ging the disk radii and chromatic variability in the back-ground) did change our subjects’ eye movement behavior.It is unclear at this point why this happened. Apparently, sub-jects adapt their viewing strategies under changes in stimuluspresentations. Discovering what these adaptable viewing stra-tegies are when changing the stimulus would probably be abig step in understanding individual differences in color
perception and in understanding how changing the stimuluschanges the way subjects search for different sources of in-formation within the stimulus to perform the task.
ACKNOWLEDGMENTSThis research was supported by grant no. DFG GE879/9.
REFERENCES1. A. Hurlbert, “Color vision: putting it in context,” Curr. Biol. 6,
1381–1384 (1996).2. J. Walraven, T. L. Benzschawel, and B. E. Rogowitz, “Color con-
stancy interpretation of chromatic induction,” Die Farbe 34,269–273 (1987).
3. F. A. A. Kingdom, “Perceiving light versus material,” Vis. Res. 48,2090–2105 (2008).
4. S. K. Shevell and F. A. A. Kingdom, “Color in complex scenes,”Annu. Rev. Psychol. 59, 143–166 (2008).
5. E. Brenner and F. W. Cornelissen, “Spatial interactions in colorvision depend on distances between boundaries,” Naturwis-senschaften 78, 70–73 (1991).
6. T. Hansen, S. Walter, and K. R. Gegenfurtner, “Effects of spatialand temporal context on color categories and color constancy,”J. Vis. 7(4), 2 (2007).
7. O. Rinner and K. R. Gegenfurtner, “Time course of chromaticadaptation for color appearance and discrimination,” Vis. Res.40, 1813–1826 (2000).
8. E. H. Adelson, “Perceptual organization and the judgment ofbrightness,” Science 262, 2042–2044 (1993).
9. E. H. Adelson, “Lightness perception and lightness illusions,” inThe New Cognitive Neurosciences, 2nd ed., M. Gazzaniga, ed.(MIT, 2000), pp. 339–351.
10. B. L. Anderson, “A theory of illusory lightness and transparencyin monocular and binocular images: the role of contour junc-tions,” Perception 26, 419–453 (1997).
11. L. Arend and R. Goldstein, “Simultaneous constancy, lightnessand brightness,” J. Opt. Soc. Am. A 4, 2281–2285 (1987).
12. J. J. M. Granzier, E. Brenner, F. W. Cornelissen, and J. B. J.Smeets, “Luminance-color correlation is not used to estimatethe color of the illumination,” J. Vis. 5(1), 2 (2005).
13. D. Jameson and L. M. Hurvich, “Opponent chromatic induction:experimental evaluation and theoretical account,” J. Opt. Soc.Am. 51, 46–53 (1961).
14. J. Walraven, “Spatial characteristics of chromatic induction; thesegregation of lateral effects from straylight artifacts,” Vis. Res.13, 1739–1753 (1973).
15. E. W. Yund and J. C. Armington, “Color and brightness contrasteffects as a function of spatial variables,” Vis. Res. 15, 917–929(1975).
16. J. Krauskopf, “Effect of retinal image stabilization on the appear-ance of heterochromatic targets,” J. Opt. Soc. Am. 53, 741–744(1963).
17. F. W. Cornelissen and E. Brenner, “On the role and nature ofadaptation in chromatic induction,” in Channels in the Visual
Nervous System: Neurophysiology, Psychophysics and Models,B. Blum ed. (Freund, 1991), pp. 109–123.
18. F. W. Cornelissen and E. Brenner, “Simultaneous color con-stancy revisited: an analysis of viewing strategies,” Vis. Res.35, 2431–2448 (1995).
19. P. Lennie and M. D’Zmura, “Mechanisms of color vision,” Crit.Rev. Neurobiol. 3, 333–400 (1988).
20. J. M. Bosten and J. Mollon, “Kirschmann’s fourth law,” Percep-tion 36, 190, ECVP Abstract Suppl. (2007).
21. J. M. Bosten and J. Mollon, “Individual differences in simulta-neous contrast,” Perception 37, 105, ECVP Abstract Suppl.(2008).
22. J. Cataliotti and R. Becklen, “Single dissociation between light-ness contrast effects,” Perception, Vol. 36, ECVP Abstract Suppl.(ECVP, 2007), p. 79.
23. M. D. Fairchild, “A victory for equivalent background—on aver-age,” in IS&T/SID Seventh Color Imaging Conference (Societyfor Imaging Science and Technology, 1999), pp. 87–92.
A364 J. Opt. Soc. Am. A / Vol. 29, No. 2 / February 2012 Granzier et al.
24. V. Ekroll and F. Faul, “A simple model describes large individualdifferences in simultaneous color contrast,” Vis. Res. 49,2261–2272 (2009).
25. M. Toscani, M. Valsecchi, and K. R. Gegenfurtner, “Where welook determines what we see,” J. Vis. 11 (11), 346 (2011).
26. T. Hansen and K. R. Gegenfurtner, “Classification images forchromatic signal detection,” J. Opt. Soc. Am. A 22, 2081–2089(2005).
27. E. Brenner, J. J. M. Granzier, and J. B. J. Smeets, “Perceivingcolor at a glimpse: the relevance of where one fixates,” Vis.Res. 47, 2557–2568 (2007).
28. J. Golz, “Color constancy: influence of viewing behaviour ongray settings,” Perception 39, 606–619 (2010).
29. F. Moller, M. L. Laursen, J. Tygesen, and A. K. Sjolie, “Binocularquantification and characterization of microsaccades,” Graefe’sArchive Clin. Exper. Ophthalmol. 240, 765–770 (2002).
30. M. P. Lucassen and J. Walraven, “Quantifying color constancy:evidence for nonlinear processing of cone-specific contrast,”Vis. Res. 33, 739–757 (1993).
31. D. H. Brainard and B. A. Wandell, “Asymmetric color matching:how color appearance depends on the illuminant,” J. Opt. Soc.Am. A 9, 1433–1448 (1992).
32. E. H. Land, “Recent advances in retinex theory,” Vis. Res. 26,7–21 (1986).
33. D. B. Judd, “Report on U.S. Secretariat Committee on colorime-try and artificial daylight,” in Proceedings of the Twelfth Session
of the CIE (Bureau Central de la CIE, 1951).34. G. Wyszecki and W. S. Stiles, Color Science Concepts and
Methods, Quantitative Data and Formulae (Wiley, 1982).35. A. M. Derrington, J. Krauskopf, and P. Lennie, “Chromatic me-
chanisms in lateral geniculate nucleus of macaque,” J. Physiol.357, 241–265 (1984).
36. J. Krauskopf, D. R. Williams, and D. W. Heeley, “Cardinaldirections of color space,” Vis. Res. 22, 1123–1131 (1982).
37. S. Ishihara, Ishihara’s Tests for Color Deficiency (KaneharaTrading, 2004).
38. E. Brenner and F. W. Cornelissen, “The influence of chromaticand achromatic variability on chromatic induction andperceived color,” Perception 31, 225–232 (2002).
39. J. J. M. Granzier, T. C. W. Nijboer, J. B. J. Smeets, and E.Brenner, “Does realistic rendering of a gradient in illuminationincrease chromatic induction?” in AIC Colour 05—10th Con-
gress of the International Colour Association (2005),pp. 227–230.
Granzier et al. Vol. 29, No. 2 / February 2012 / J. Opt. Soc. Am. A A365