role of cell regularity and relative density on elasto ... · role of cell regularity and relative...
TRANSCRIPT
International Journal of Solids and Structures xxx (2014) xxx–xxx
Contents lists available at ScienceDirect
International Journal of Solids and Structures
journal homepage: www.elsevier .com/locate / i jsols t r
Role of cell regularity and relative density on elasto-plastic compressionresponse of random honeycombs generated using Voronoi diagrams
http://dx.doi.org/10.1016/j.ijsolstr.2014.07.0090020-7683/� 2014 Elsevier Ltd. All rights reserved.
⇑ Corresponding author. Tel.: +1 334 844 3327.E-mail address: [email protected] (H.V. Tippur).
1 In a Polyjet Technology, a thin layer of photopolymer in the liquid state isor sprayed over a build-tray followed UV radiation to cure the polymer. The bmoves down incrementally and the computer controlled process isaccording to a CAD model.
Please cite this article in press as: Sotomayor, O.E., Tippur, H.V. Role of cell regularity and relative density on elasto-plastic compression responsedom honeycombs generated using Voronoi diagrams. Int. J. Solids Struct. (2014), http://dx.doi.org/10.1016/j.ijsolstr.2014.07.009
Oscar E. Sotomayor, Hareesh V. Tippur ⇑Department of Mechanical Engineering, Auburn University, AL 36849, United States
a r t i c l e i n f o a b s t r a c t
Article history:Received 9 November 2013Received in revised form 13 February 2014Available online xxxx
Keywords:Cellular solidsVoronoi diagramsVirtual designCell regularityCompressionElasto-plastic analysisFinite elements
The Voronoi tessellation technique and solid modeling methods are used in this work to create virtualrandom structures and link cell morphology with the mechanical behavior. Their compression responsesare analyzed using the finite element method. First, the effect of loading direction is analyzed forstructures with different levels of randomness characterized by a regularity parameter to assess thedegree of scatter in the results. Subsequently, morphological characteristics such as arrangement of cellsand randomness are analyzed separately. The effect of relative density on structures with different levelsof randomness is also studied. Simulations suggest that at low relative densities the arrangement of cellshas a negligible effect on the compression response of random honeycombs. On the contrary, the cellularrandomness has significant influence on the elastic and plastic characteristics especially when fullyrandom structures are compared with the regular counterparts.
� 2014 Elsevier Ltd. All rights reserved.
1. Introduction
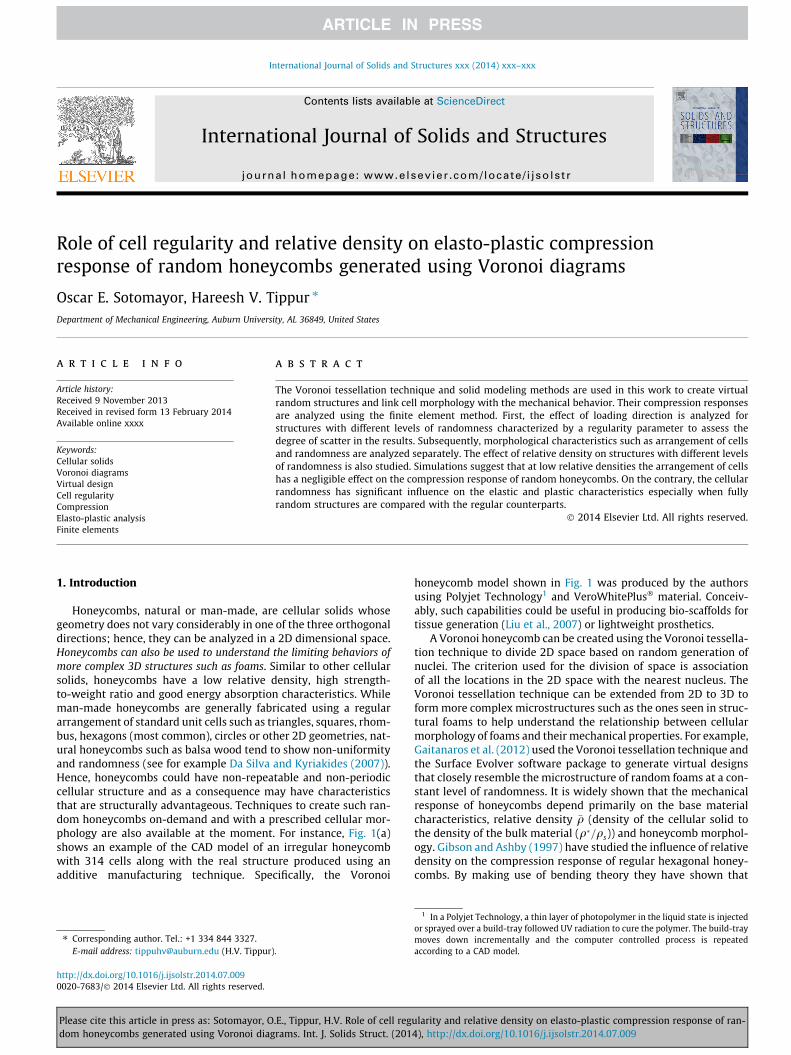
Honeycombs, natural or man-made, are cellular solids whosegeometry does not vary considerably in one of the three orthogonaldirections; hence, they can be analyzed in a 2D dimensional space.Honeycombs can also be used to understand the limiting behaviors ofmore complex 3D structures such as foams. Similar to other cellularsolids, honeycombs have a low relative density, high strength-to-weight ratio and good energy absorption characteristics. Whileman-made honeycombs are generally fabricated using a regulararrangement of standard unit cells such as triangles, squares, rhom-bus, hexagons (most common), circles or other 2D geometries, nat-ural honeycombs such as balsa wood tend to show non-uniformityand randomness (see for example Da Silva and Kyriakides (2007)).Hence, honeycombs could have non-repeatable and non-periodiccellular structure and as a consequence may have characteristicsthat are structurally advantageous. Techniques to create such ran-dom honeycombs on-demand and with a prescribed cellular mor-phology are also available at the moment. For instance, Fig. 1(a)shows an example of the CAD model of an irregular honeycombwith 314 cells along with the real structure produced using anadditive manufacturing technique. Specifically, the Voronoi
honeycomb model shown in Fig. 1 was produced by the authorsusing Polyjet Technology1 and VeroWhitePlus� material. Conceiv-ably, such capabilities could be useful in producing bio-scaffolds fortissue generation (Liu et al., 2007) or lightweight prosthetics.
A Voronoi honeycomb can be created using the Voronoi tessella-tion technique to divide 2D space based on random generation ofnuclei. The criterion used for the division of space is associationof all the locations in the 2D space with the nearest nucleus. TheVoronoi tessellation technique can be extended from 2D to 3D toform more complex microstructures such as the ones seen in struc-tural foams to help understand the relationship between cellularmorphology of foams and their mechanical properties. For example,Gaitanaros et al. (2012) used the Voronoi tessellation technique andthe Surface Evolver software package to generate virtual designsthat closely resemble the microstructure of random foams at a con-stant level of randomness. It is widely shown that the mechanicalresponse of honeycombs depend primarily on the base materialcharacteristics, relative density �q (density of the cellular solid tothe density of the bulk material (q�=qs)) and honeycomb morphol-ogy. Gibson and Ashby (1997) have studied the influence of relativedensity on the compression response of regular hexagonal honey-combs. By making use of bending theory they have shown that
injecteduild-trayrepeated
of ran-
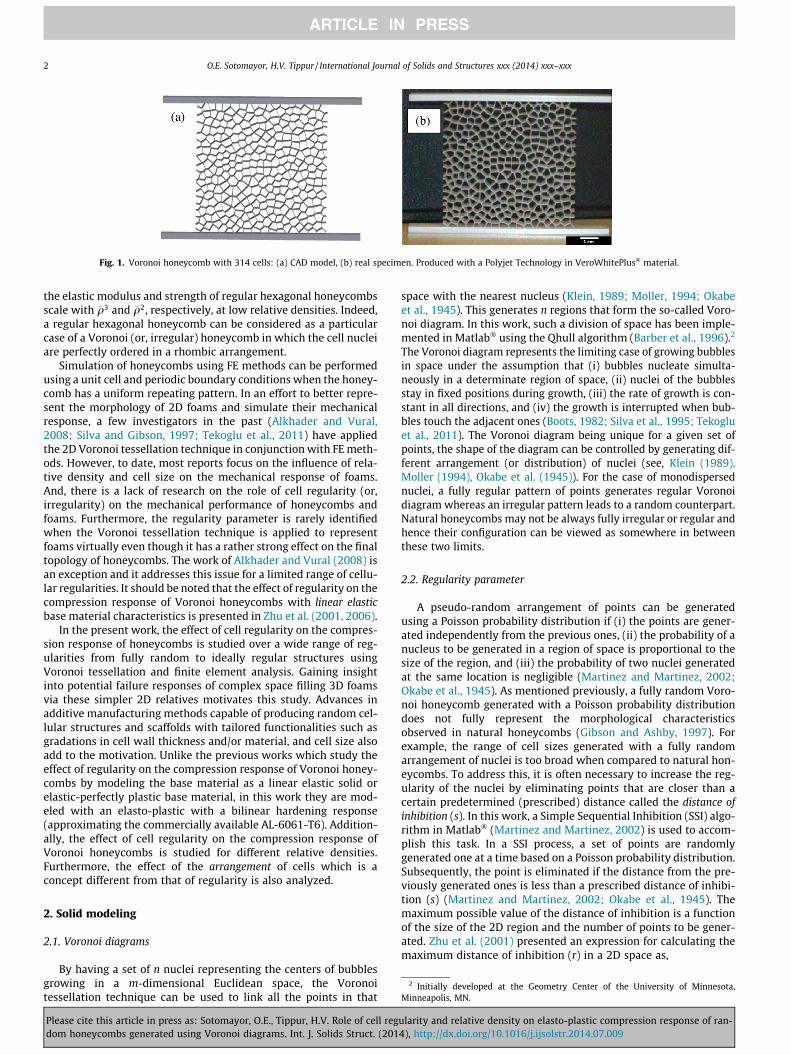
Fig. 1. Voronoi honeycomb with 314 cells: (a) CAD model, (b) real specimen. Produced with a Polyjet Technology in VeroWhitePlus� material.
2 O.E. Sotomayor, H.V. Tippur / International Journal of Solids and Structures xxx (2014) xxx–xxx
the elastic modulus and strength of regular hexagonal honeycombsscale with �q3 and �q2, respectively, at low relative densities. Indeed,a regular hexagonal honeycomb can be considered as a particularcase of a Voronoi (or, irregular) honeycomb in which the cell nucleiare perfectly ordered in a rhombic arrangement.
Simulation of honeycombs using FE methods can be performedusing a unit cell and periodic boundary conditions when the honey-comb has a uniform repeating pattern. In an effort to better repre-sent the morphology of 2D foams and simulate their mechanicalresponse, a few investigators in the past (Alkhader and Vural,2008; Silva and Gibson, 1997; Tekoglu et al., 2011) have appliedthe 2D Voronoi tessellation technique in conjunction with FE meth-ods. However, to date, most reports focus on the influence of rela-tive density and cell size on the mechanical response of foams.And, there is a lack of research on the role of cell regularity (or,irregularity) on the mechanical performance of honeycombs andfoams. Furthermore, the regularity parameter is rarely identifiedwhen the Voronoi tessellation technique is applied to representfoams virtually even though it has a rather strong effect on the finaltopology of honeycombs. The work of Alkhader and Vural (2008) isan exception and it addresses this issue for a limited range of cellu-lar regularities. It should be noted that the effect of regularity on thecompression response of Voronoi honeycombs with linear elasticbase material characteristics is presented in Zhu et al. (2001, 2006).
In the present work, the effect of cell regularity on the compres-sion response of honeycombs is studied over a wide range of reg-ularities from fully random to ideally regular structures usingVoronoi tessellation and finite element analysis. Gaining insightinto potential failure responses of complex space filling 3D foamsvia these simpler 2D relatives motivates this study. Advances inadditive manufacturing methods capable of producing random cel-lular structures and scaffolds with tailored functionalities such asgradations in cell wall thickness and/or material, and cell size alsoadd to the motivation. Unlike the previous works which study theeffect of regularity on the compression response of Voronoi honey-combs by modeling the base material as a linear elastic solid orelastic-perfectly plastic base material, in this work they are mod-eled with an elasto-plastic with a bilinear hardening response(approximating the commercially available AL-6061-T6). Addition-ally, the effect of cell regularity on the compression response ofVoronoi honeycombs is studied for different relative densities.Furthermore, the effect of the arrangement of cells which is aconcept different from that of regularity is also analyzed.
2 Initially developed at the Geometry Center of the University of Minnesota,Minneapolis, MN.
2. Solid modeling
2.1. Voronoi diagrams
By having a set of n nuclei representing the centers of bubblesgrowing in a m-dimensional Euclidean space, the Voronoitessellation technique can be used to link all the points in that
Please cite this article in press as: Sotomayor, O.E., Tippur, H.V. Role of cell regdom honeycombs generated using Voronoi diagrams. Int. J. Solids Struct. (201
space with the nearest nucleus (Klein, 1989; Moller, 1994; Okabeet al., 1945). This generates n regions that form the so-called Voro-noi diagram. In this work, such a division of space has been imple-mented in Matlab� using the Qhull algorithm (Barber et al., 1996).2
The Voronoi diagram represents the limiting case of growing bubblesin space under the assumption that (i) bubbles nucleate simulta-neously in a determinate region of space, (ii) nuclei of the bubblesstay in fixed positions during growth, (iii) the rate of growth is con-stant in all directions, and (iv) the growth is interrupted when bub-bles touch the adjacent ones (Boots, 1982; Silva et al., 1995; Tekogluet al., 2011). The Voronoi diagram being unique for a given set ofpoints, the shape of the diagram can be controlled by generating dif-ferent arrangement (or distribution) of nuclei (see, Klein (1989),Moller (1994), Okabe et al. (1945)). For the case of monodispersednuclei, a fully regular pattern of points generates regular Voronoidiagram whereas an irregular pattern leads to a random counterpart.Natural honeycombs may not be always fully irregular or regular andhence their configuration can be viewed as somewhere in betweenthese two limits.
2.2. Regularity parameter
A pseudo-random arrangement of points can be generatedusing a Poisson probability distribution if (i) the points are gener-ated independently from the previous ones, (ii) the probability of anucleus to be generated in a region of space is proportional to thesize of the region, and (iii) the probability of two nuclei generatedat the same location is negligible (Martinez and Martinez, 2002;Okabe et al., 1945). As mentioned previously, a fully random Voro-noi honeycomb generated with a Poisson probability distributiondoes not fully represent the morphological characteristicsobserved in natural honeycombs (Gibson and Ashby, 1997). Forexample, the range of cell sizes generated with a fully randomarrangement of nuclei is too broad when compared to natural hon-eycombs. To address this, it is often necessary to increase the reg-ularity of the nuclei by eliminating points that are closer than acertain predetermined (prescribed) distance called the distance ofinhibition (s). In this work, a Simple Sequential Inhibition (SSI) algo-rithm in Matlab� (Martinez and Martinez, 2002) is used to accom-plish this task. In a SSI process, a set of points are randomlygenerated one at a time based on a Poisson probability distribution.Subsequently, the point is eliminated if the distance from the pre-viously generated ones is less than a prescribed distance of inhibi-tion (s) (Martinez and Martinez, 2002; Okabe et al., 1945). Themaximum possible value of the distance of inhibition is a functionof the size of the 2D region and the number of points to be gener-ated. Zhu et al. (2001) presented an expression for calculating themaximum distance of inhibition (r) in a 2D space as,
ularity and relative density on elasto-plastic compression response of ran-4), http://dx.doi.org/10.1016/j.ijsolstr.2014.07.009
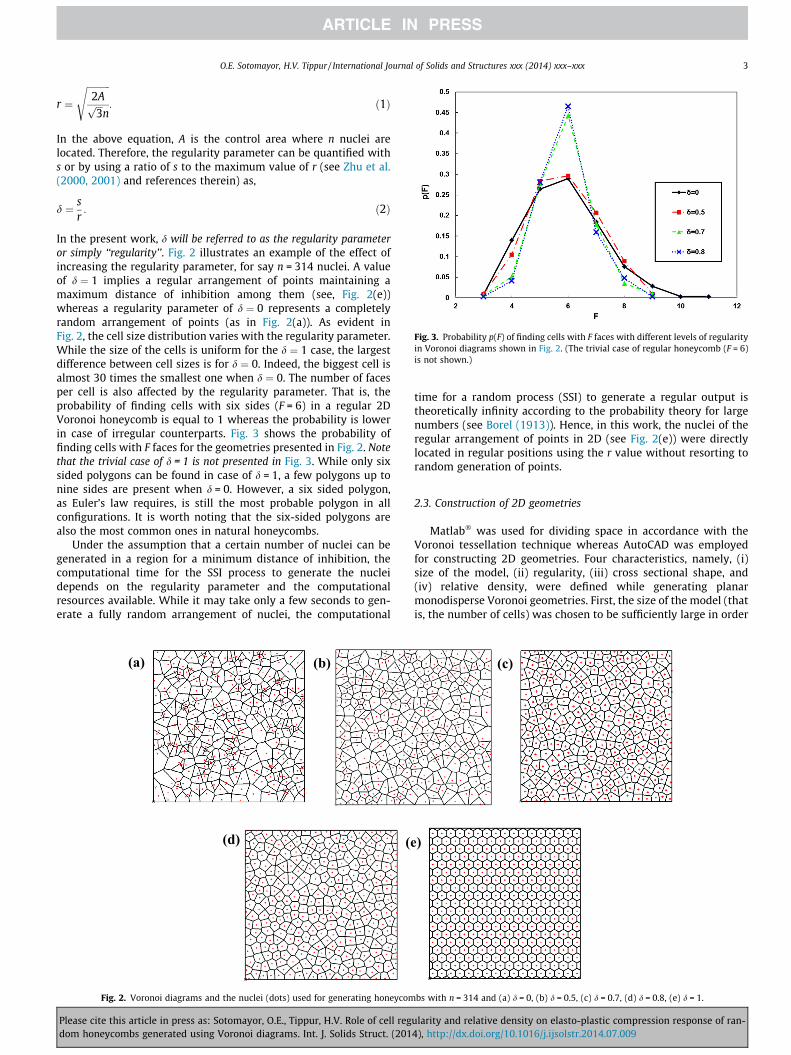
Fig. 3. Probability p(F) of finding cells with F faces with different levels of regularityin Voronoi diagrams shown in Fig. 2. (The trivial case of regular honeycomb (F = 6)is not shown.)
O.E. Sotomayor, H.V. Tippur / International Journal of Solids and Structures xxx (2014) xxx–xxx 3
r ¼
ffiffiffiffiffiffiffiffiffiffi2Affiffiffi3p
n
s: ð1Þ
In the above equation, A is the control area where n nuclei arelocated. Therefore, the regularity parameter can be quantified withs or by using a ratio of s to the maximum value of r (see Zhu et al.(2000, 2001) and references therein) as,
d ¼ sr: ð2Þ
In the present work, d will be referred to as the regularity parameteror simply ‘‘regularity’’. Fig. 2 illustrates an example of the effect ofincreasing the regularity parameter, for say n = 314 nuclei. A valueof d ¼ 1 implies a regular arrangement of points maintaining amaximum distance of inhibition among them (see, Fig. 2(e))whereas a regularity parameter of d ¼ 0 represents a completelyrandom arrangement of points (as in Fig. 2(a)). As evident inFig. 2, the cell size distribution varies with the regularity parameter.While the size of the cells is uniform for the d ¼ 1 case, the largestdifference between cell sizes is for d ¼ 0. Indeed, the biggest cell isalmost 30 times the smallest one when d ¼ 0. The number of facesper cell is also affected by the regularity parameter. That is, theprobability of finding cells with six sides (F = 6) in a regular 2DVoronoi honeycomb is equal to 1 whereas the probability is lowerin case of irregular counterparts. Fig. 3 shows the probability offinding cells with F faces for the geometries presented in Fig. 2. Notethat the trivial case of d = 1 is not presented in Fig. 3. While only sixsided polygons can be found in case of d = 1, a few polygons up tonine sides are present when d = 0. However, a six sided polygon,as Euler’s law requires, is still the most probable polygon in allconfigurations. It is worth noting that the six-sided polygons arealso the most common ones in natural honeycombs.
Under the assumption that a certain number of nuclei can begenerated in a region for a minimum distance of inhibition, thecomputational time for the SSI process to generate the nucleidepends on the regularity parameter and the computationalresources available. While it may take only a few seconds to gen-erate a fully random arrangement of nuclei, the computational
(a) (b)
(d) (e
Fig. 2. Voronoi diagrams and the nuclei (dots) used for generating honeycom
Please cite this article in press as: Sotomayor, O.E., Tippur, H.V. Role of cell regdom honeycombs generated using Voronoi diagrams. Int. J. Solids Struct. (201
time for a random process (SSI) to generate a regular output istheoretically infinity according to the probability theory for largenumbers (see Borel (1913)). Hence, in this work, the nuclei of theregular arrangement of points in 2D (see Fig. 2(e)) were directlylocated in regular positions using the r value without resorting torandom generation of points.
2.3. Construction of 2D geometries
Matlab� was used for dividing space in accordance with theVoronoi tessellation technique whereas AutoCAD was employedfor constructing 2D geometries. Four characteristics, namely, (i)size of the model, (ii) regularity, (iii) cross sectional shape, and(iv) relative density, were defined while generating planarmonodisperse Voronoi geometries. First, the size of the model (thatis, the number of cells) was chosen to be sufficiently large in order
(c)
)
bs with n = 314 and (a) d = 0, (b) d = 0.5, (c) d = 0.7, (d) d = 0.8, (e) d = 1.
ularity and relative density on elasto-plastic compression response of ran-4), http://dx.doi.org/10.1016/j.ijsolstr.2014.07.009
4 O.E. Sotomayor, H.V. Tippur / International Journal of Solids and Structures xxx (2014) xxx–xxx
to represent a continuum foam model while keeping the size of themodel small enough to be able to manage it using the availablesolid modeling and FE software resources. A few previous studiesanalyze the effects of the model size on the compression responseof Voronoi honeycombs. For the 2D case, Tekoglu et al. (2011) haveshown that for uniaxial compression a ratio of the control area tothe cell size of greater than or equal to 16 produces tolerableelastic modulus and plastic collapse strength variations. Hence,the plastic collapse strength is defined as the maximum strengthreached in the stress–strain curve before collapse and reaching astable plateau stress. A similar assertion has been made byAlkhader and Vural (2008) by showing that 10–15 cells in the load-ing direction produce convergence in elastic modulus and crushingstress. Accordingly, in this work, a control area corresponding to aratio of the area to cell size equal to approximately 16 wasselected. The choice were further validated by an independent con-vergence study, presented in Appendix A. For an arrangement ofnuclei in a regular (hexagonal) honeycomb, this corresponds ton = 314 cells. Second, in order to study the effect of cell regularityover the complete range, from to d ¼ 1, Voronoi honeycombs withn = 314 cells and regularity d ¼ f0, 0.5, 0.7, 0.8 and 1} were gener-ated. Regarding the cross-sectional shape of the ligaments, Gongand Kyriakides (2005), Gong et al. (2005), Jang et al. (2008), Jangand Kyriakides (2009) studied the morphology of open-cell alumi-num foams by means of micro-computed X-ray tomography. Theyobserved that the cross-sectional shape of the ligaments were inbetween a triangle and a circle. In the present work, for simplicity,the cross-sectional shape of the ligaments was modeled with aconstant circular cross-section. (Though unusual, this choice wasto help compare the results with 3D Voronoi foam behavior undersimilar loading conditions and minimize the effect of the orienta-tion of the cross section.) The accumulation of material at the junc-tions of ligaments, typical of structural 2D foam representations,has been modeled by overlapping cross-sections of beam elements.Additionally, the analysis has been limited to a relative density ofup to �q ¼ 9% to minimize this effect (see, Gan et al. (2005), Janget al. (2008) and references therein). With these considerations,the value of the radius/thickness of struts depends on the relativedensity of the honeycomb. In 2D it can be calculated as (Liu et al.,2009; Tekoglu et al., 2011; Zhu et al., 2000),
�q ¼ 1A
� �XN
i¼1
hili ð3Þ
where �q is the relative density of the foam, N is the number of strutsin the cell, hi is the thickness of struts, li is the cell wall length and Ais the control area. Additionally, considering that the open-cell alu-minum foams are normally produced in the range of 3–12%, theanalyses were limited to an upper value of 9%. Specifically, four rel-ative densities �q ¼ f3%;5%;7% and 9%g were analyzed in thiswork. Based on this, for a given value of A, the thickness of strutswas calculated. Additionally, to study the compression responsein the vertical direction (x2), left and right borders of the controlarea were eliminated to emulate real foams compressed in a sand-wich-like configuration with free ligaments on the lateral faces.Similarly, the top and bottom borders of the control area were elim-inated when the compression response in the horizontal direction(x1) was simulated.
3. Finite element modeling
Structural analysis of the foam models was performed using thefinite element software package Abaqus/Standard (Hibbitt, 2002).In the pre-processing stage, geometries described in Section 2.3were imported from AutoCAD into Abaqus�. The base materialwas modeled as an elasto-plastic material with a bilinear isotropic
Please cite this article in press as: Sotomayor, O.E., Tippur, H.V. Role of cell regdom honeycombs generated using Voronoi diagrams. Int. J. Solids Struct. (201
hardening response corresponding to the reported stress–straincharacteristic for AL-6101-T6 (Aluminum Association). Specifically,the elastic region was described by an elastic modulus of 68.9 GPaand a Poisson’s ratio of 0.33 whereas the plastic region had an ini-tial yield stress of 193 MPa and a slope of Dr=D 2¼ 149 MPa up toa strain of 19%. Beyond that strain the stress was assumed constantat 221 MPa. Further, interactions among cell walls when largedeformations occur play an important role in the overall mechan-ical response of the Voronoi honeycombs. If interactions betweencells are not simulated correctly, interpenetration of elementscan affect the results at higher strains. In view of this, surfaceswere created in the interior of each closed cell at the mid-surfaceof the beam elements and frictionless interaction of the self-contact type was stipulated for these surfaces. (In reality, interac-tions between cells occur at the ligament surface instead of themid-surface. However, the idealization was considered reasonablyaccurate for low relative densities.) Nonlinear effects due to largedeformations were activated in a generalized static analysisperformed in Abaqus/Standard. Moreover, convergence of unstablenonlinear problems was improved using an adaptive automaticstabilization scheme (Hibbitt, 2002; Jhaver, 2009). Values of2 � 10�4 and 0.05 for dissipated energy fraction and ratio of stabil-ization energy to strain energy were used in this work.
When the response was studied for compression in thex2-direction, a displacement boundary condition was applied onthe top surface while constraining the bottom surface fromdisplacing in the x2-direction. Additionally, a point in the middleof top and bottom surfaces was constrained from displacing inthe x1-direction. The boundary conditions were rotated by 90�when the compression response in the x1-direction was sought.
Beam elements with three active degrees of freedom per nodeand a quadratic interpolation within the domain were selectedfor FE discretization. The elements, identified as B22 in Abaqus�,are formulated on Timoshenko’s beam theory to take into accountshear deformations in addition to flexure, which could be signifi-cant in short beams. Typically five nodes per ligament were gener-ated during discretization although the number of nodes in case ofshort ligaments was reduced to three. This was to avoid generationof extremely short elements unsuitable for capturing beam-likedeformations (Silva et al., 1995). Computations were performedas a batch job in a parallel processing environment. The numberof elements in a typical simulation was in the range of 1846–1906 and more than 10,000 degrees of freedom.
In the post-processing stage, reaction forces at the bottom sur-face were added in order to obtain the net reaction force (F). Theapparent stress on the Voronoi honeycombs was calculated bydividing F by the area of the base (Silva and Gibson, 1997). Theaverage strain was calculated by dividing the displacement bythe original length in the loading direction. A comparable analysiswas performed when the displacement was imposed in thex1-direction. All these calculations were accomplished for eachload increment in order to get a relatively continuous mechanicalresponse curves.
The response for the Voronoi honeycomb with a regularity ofd = 1, �q ¼ 9%, loaded in the x2-direction is presented in Fig. 4.The figure also depicts deformed honeycomb structure at fivepoints of interest. In Fig. 4, the stress–strain response of the regularhoneycomb presents two characteristic regions. First, an elasticregion with a uniform deformation at small strains can be observedin Fig. 4. Then, a change in the slope of the stress–strain variationwithout an appreciable or noticeable area of localization of defor-mation is seen in the response. The deformations start to localizeat the center of the model causing a collapse of a horizontal rowof cells until the opposing cell walls contact each other. This pro-duces an oscillatory characteristic. Others have previously reportedcomparable behaviors in the literature as well (see, Cricri et al.
ularity and relative density on elasto-plastic compression response of ran-4), http://dx.doi.org/10.1016/j.ijsolstr.2014.07.009
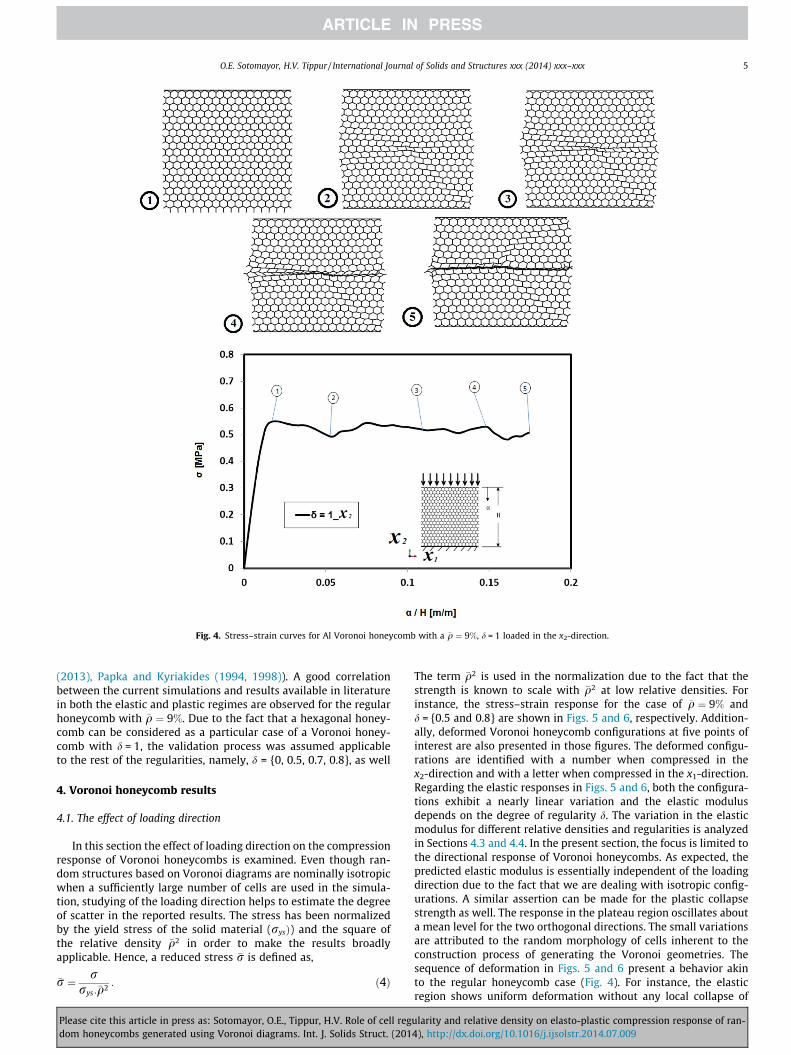
Fig. 4. Stress–strain curves for Al Voronoi honeycomb with a �q ¼ 9%, d = 1 loaded in the x2-direction.
O.E. Sotomayor, H.V. Tippur / International Journal of Solids and Structures xxx (2014) xxx–xxx 5
(2013), Papka and Kyriakides (1994, 1998)). A good correlationbetween the current simulations and results available in literaturein both the elastic and plastic regimes are observed for the regularhoneycomb with �q ¼ 9%. Due to the fact that a hexagonal honey-comb can be considered as a particular case of a Voronoi honey-comb with d = 1, the validation process was assumed applicableto the rest of the regularities, namely, d = {0, 0.5, 0.7, 0.8}, as well
4. Voronoi honeycomb results
4.1. The effect of loading direction
In this section the effect of loading direction on the compressionresponse of Voronoi honeycombs is examined. Even though ran-dom structures based on Voronoi diagrams are nominally isotropicwhen a sufficiently large number of cells are used in the simula-tion, studying of the loading direction helps to estimate the degreeof scatter in the reported results. The stress has been normalizedby the yield stress of the solid material (rysÞ) and the square ofthe relative density �q2 in order to make the results broadlyapplicable. Hence, a reduced stress �r is defined as,
�r ¼ rrys:�q2 : ð4Þ
Please cite this article in press as: Sotomayor, O.E., Tippur, H.V. Role of cell regdom honeycombs generated using Voronoi diagrams. Int. J. Solids Struct. (201
The term �q2 is used in the normalization due to the fact that thestrength is known to scale with �q2 at low relative densities. Forinstance, the stress–strain response for the case of �q ¼ 9% andd = {0.5 and 0.8} are shown in Figs. 5 and 6, respectively. Addition-ally, deformed Voronoi honeycomb configurations at five points ofinterest are also presented in those figures. The deformed configu-rations are identified with a number when compressed in thex2-direction and with a letter when compressed in the x1-direction.Regarding the elastic responses in Figs. 5 and 6, both the configura-tions exhibit a nearly linear variation and the elastic modulusdepends on the degree of regularity d. The variation in the elasticmodulus for different relative densities and regularities is analyzedin Sections 4.3 and 4.4. In the present section, the focus is limited tothe directional response of Voronoi honeycombs. As expected, thepredicted elastic modulus is essentially independent of the loadingdirection due to the fact that we are dealing with isotropic config-urations. A similar assertion can be made for the plastic collapsestrength as well. The response in the plateau region oscillates abouta mean level for the two orthogonal directions. The small variationsare attributed to the random morphology of cells inherent to theconstruction process of generating the Voronoi geometries. Thesequence of deformation in Figs. 5 and 6 present a behavior akinto the regular honeycomb case (Fig. 4). For instance, the elasticregion shows uniform deformation without any local collapse of
ularity and relative density on elasto-plastic compression response of ran-4), http://dx.doi.org/10.1016/j.ijsolstr.2014.07.009
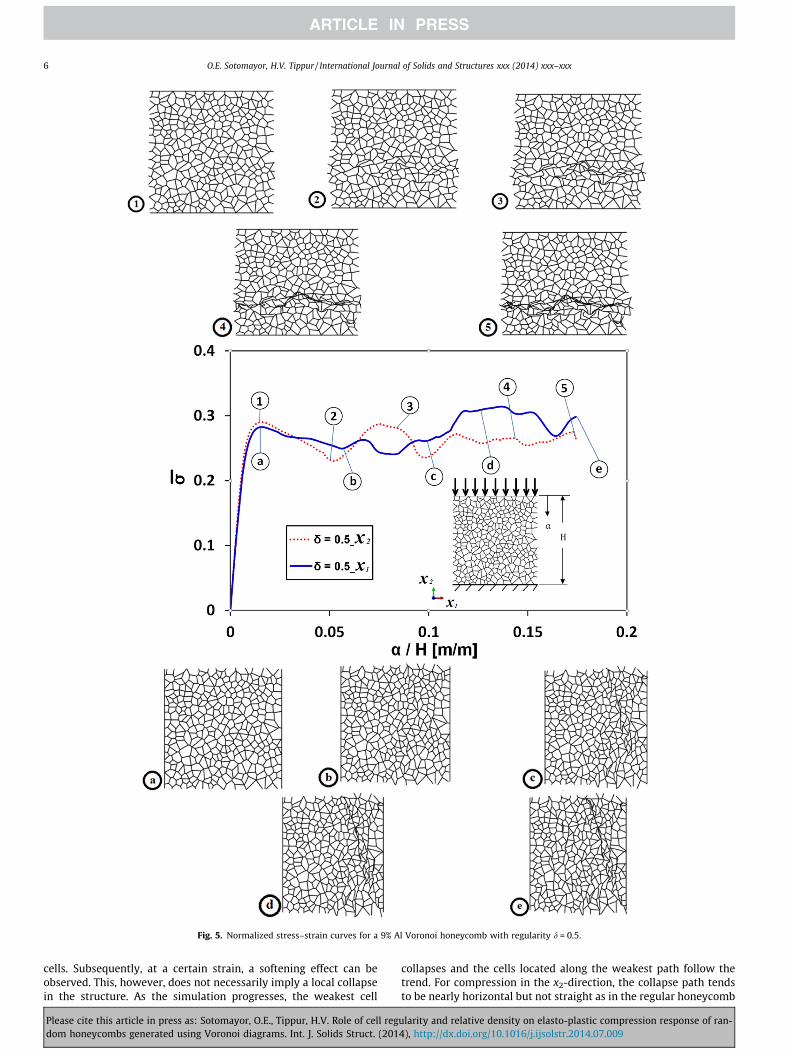
Fig. 5. Normalized stress–strain curves for a 9% Al Voronoi honeycomb with regularity d = 0.5.
6 O.E. Sotomayor, H.V. Tippur / International Journal of Solids and Structures xxx (2014) xxx–xxx
cells. Subsequently, at a certain strain, a softening effect can beobserved. This, however, does not necessarily imply a local collapsein the structure. As the simulation progresses, the weakest cell
Please cite this article in press as: Sotomayor, O.E., Tippur, H.V. Role of cell regdom honeycombs generated using Voronoi diagrams. Int. J. Solids Struct. (201
collapses and the cells located along the weakest path follow thetrend. For compression in the x2-direction, the collapse path tendsto be nearly horizontal but not straight as in the regular honeycomb
ularity and relative density on elasto-plastic compression response of ran-4), http://dx.doi.org/10.1016/j.ijsolstr.2014.07.009
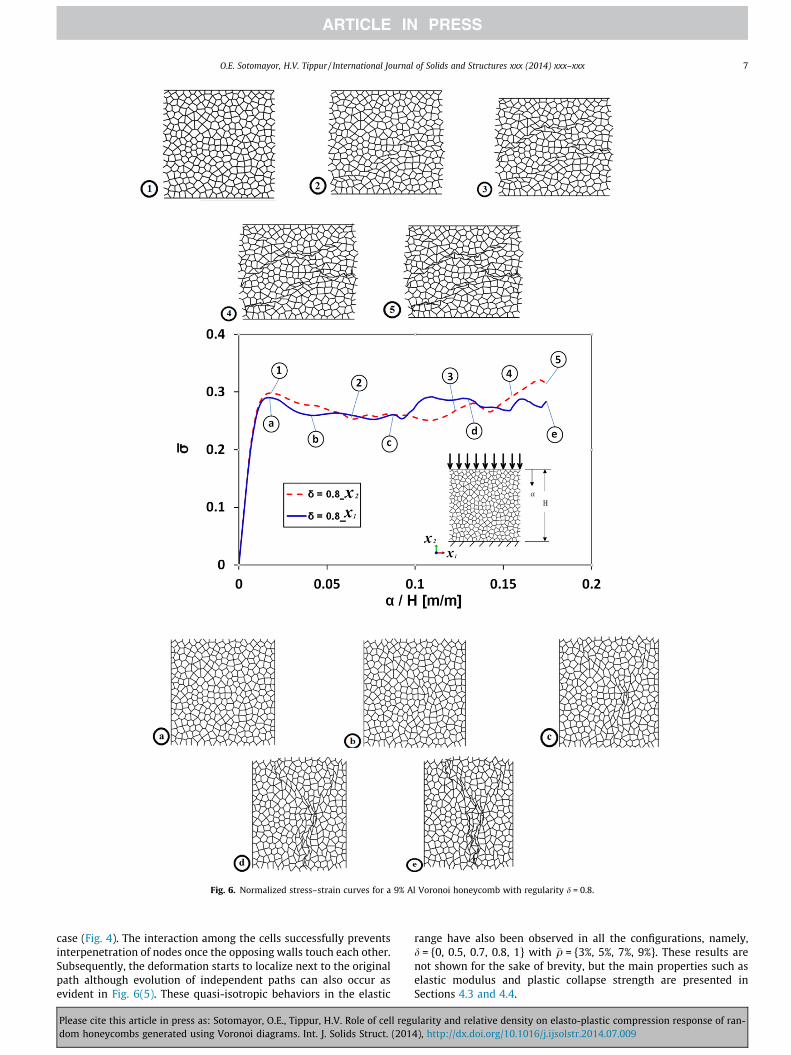
Fig. 6. Normalized stress–strain curves for a 9% Al Voronoi honeycomb with regularity d = 0.8.
O.E. Sotomayor, H.V. Tippur / International Journal of Solids and Structures xxx (2014) xxx–xxx 7
case (Fig. 4). The interaction among the cells successfully preventsinterpenetration of nodes once the opposing walls touch each other.Subsequently, the deformation starts to localize next to the originalpath although evolution of independent paths can also occur asevident in Fig. 6(5). These quasi-isotropic behaviors in the elastic
Please cite this article in press as: Sotomayor, O.E., Tippur, H.V. Role of cell regdom honeycombs generated using Voronoi diagrams. Int. J. Solids Struct. (201
range have also been observed in all the configurations, namely,d = {0, 0.5, 0.7, 0.8, 1} with �q = {3%, 5%, 7%, 9%}. These results arenot shown for the sake of brevity, but the main properties such aselastic modulus and plastic collapse strength are presented inSections 4.3 and 4.4.
ularity and relative density on elasto-plastic compression response of ran-4), http://dx.doi.org/10.1016/j.ijsolstr.2014.07.009
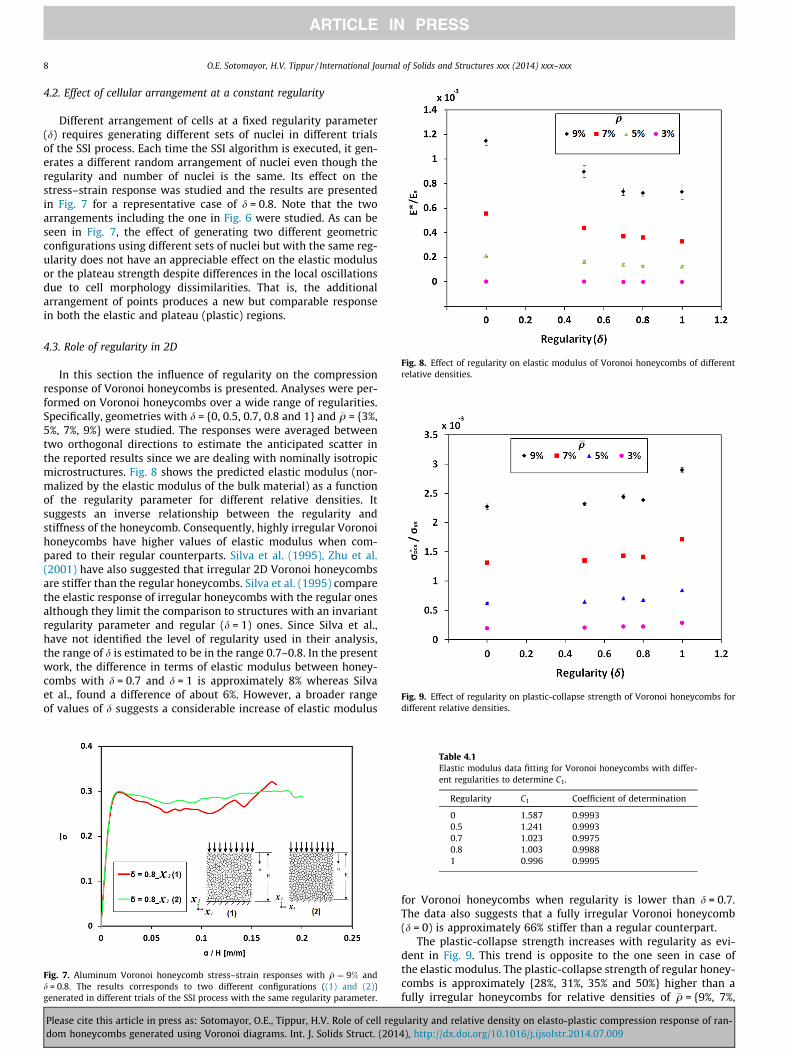
Fig. 8. Effect of regularity on elastic modulus of Voronoi honeycombs of differentrelative densities.
Fig. 9. Effect of regularity on plastic-collapse strength of Voronoi honeycombs fordifferent relative densities.
8 O.E. Sotomayor, H.V. Tippur / International Journal of Solids and Structures xxx (2014) xxx–xxx
4.2. Effect of cellular arrangement at a constant regularity
Different arrangement of cells at a fixed regularity parameter(d) requires generating different sets of nuclei in different trialsof the SSI process. Each time the SSI algorithm is executed, it gen-erates a different random arrangement of nuclei even though theregularity and number of nuclei is the same. Its effect on thestress–strain response was studied and the results are presentedin Fig. 7 for a representative case of d = 0.8. Note that the twoarrangements including the one in Fig. 6 were studied. As can beseen in Fig. 7, the effect of generating two different geometricconfigurations using different sets of nuclei but with the same reg-ularity does not have an appreciable effect on the elastic modulusor the plateau strength despite differences in the local oscillationsdue to cell morphology dissimilarities. That is, the additionalarrangement of points produces a new but comparable responsein both the elastic and plateau (plastic) regions.
4.3. Role of regularity in 2D
In this section the influence of regularity on the compressionresponse of Voronoi honeycombs is presented. Analyses were per-formed on Voronoi honeycombs over a wide range of regularities.Specifically, geometries with d = {0, 0.5, 0.7, 0.8 and 1} and �q = {3%,5%, 7%, 9%} were studied. The responses were averaged betweentwo orthogonal directions to estimate the anticipated scatter inthe reported results since we are dealing with nominally isotropicmicrostructures. Fig. 8 shows the predicted elastic modulus (nor-malized by the elastic modulus of the bulk material) as a functionof the regularity parameter for different relative densities. Itsuggests an inverse relationship between the regularity andstiffness of the honeycomb. Consequently, highly irregular Voronoihoneycombs have higher values of elastic modulus when com-pared to their regular counterparts. Silva et al. (1995), Zhu et al.(2001) have also suggested that irregular 2D Voronoi honeycombsare stiffer than the regular honeycombs. Silva et al. (1995) comparethe elastic response of irregular honeycombs with the regular onesalthough they limit the comparison to structures with an invariantregularity parameter and regular (d = 1) ones. Since Silva et al.,have not identified the level of regularity used in their analysis,the range of d is estimated to be in the range 0.7–0.8. In the presentwork, the difference in terms of elastic modulus between honey-combs with d = 0.7 and d = 1 is approximately 8% whereas Silvaet al., found a difference of about 6%. However, a broader rangeof values of d suggests a considerable increase of elastic modulus
Fig. 7. Aluminum Voronoi honeycomb stress–strain responses with �q ¼ 9% andd = 0.8. The results corresponds to two different configurations ((1) and (2))generated in different trials of the SSI process with the same regularity parameter.
Table 4.1Elastic modulus data fitting for Voronoi honeycombs with differ-ent regularities to determine C1.
Regularity C1 Coefficient of determination
0 1.587 0.99930.5 1.241 0.99930.7 1.023 0.99750.8 1.003 0.99881 0.996 0.9995
Please cite this article in press as: Sotomayor, O.E., Tippur, H.V. Role of cell regdom honeycombs generated using Voronoi diagrams. Int. J. Solids Struct. (201
for Voronoi honeycombs when regularity is lower than d = 0.7.The data also suggests that a fully irregular Voronoi honeycomb(d = 0) is approximately 66% stiffer than a regular counterpart.
The plastic-collapse strength increases with regularity as evi-dent in Fig. 9. This trend is opposite to the one seen in case ofthe elastic modulus. The plastic-collapse strength of regular honey-combs is approximately {28%, 31%, 35% and 50%} higher than afully irregular honeycombs for relative densities of �q = {9%, 7%,
ularity and relative density on elasto-plastic compression response of ran-4), http://dx.doi.org/10.1016/j.ijsolstr.2014.07.009
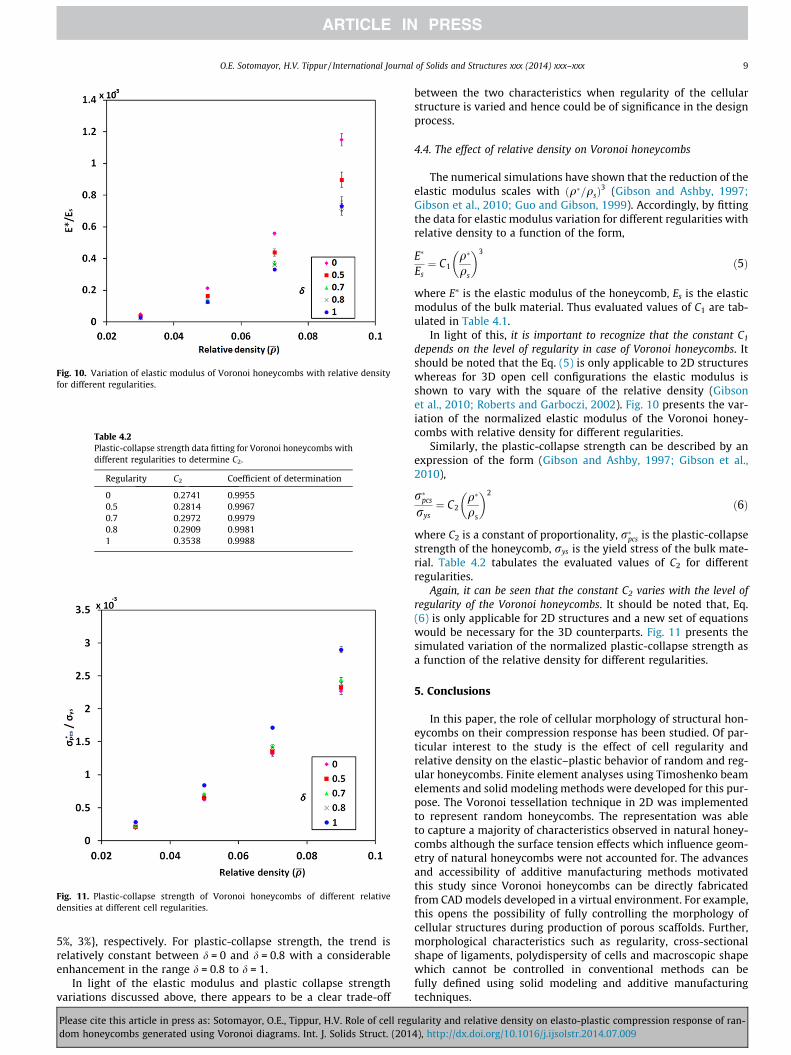
Fig. 10. Variation of elastic modulus of Voronoi honeycombs with relative densityfor different regularities.
Table 4.2Plastic-collapse strength data fitting for Voronoi honeycombs withdifferent regularities to determine C2.
Regularity C2 Coefficient of determination
0 0.2741 0.99550.5 0.2814 0.99670.7 0.2972 0.99790.8 0.2909 0.99811 0.3538 0.9988
Fig. 11. Plastic-collapse strength of Voronoi honeycombs of different relativedensities at different cell regularities.
O.E. Sotomayor, H.V. Tippur / International Journal of Solids and Structures xxx (2014) xxx–xxx 9
5%, 3%}, respectively. For plastic-collapse strength, the trend isrelatively constant between d = 0 and d = 0.8 with a considerableenhancement in the range d = 0.8 to d = 1.
In light of the elastic modulus and plastic collapse strengthvariations discussed above, there appears to be a clear trade-off
Please cite this article in press as: Sotomayor, O.E., Tippur, H.V. Role of cell regdom honeycombs generated using Voronoi diagrams. Int. J. Solids Struct. (201
between the two characteristics when regularity of the cellularstructure is varied and hence could be of significance in the designprocess.
4.4. The effect of relative density on Voronoi honeycombs
The numerical simulations have shown that the reduction of theelastic modulus scales with ðq�=qsÞ
3 (Gibson and Ashby, 1997;Gibson et al., 2010; Guo and Gibson, 1999). Accordingly, by fittingthe data for elastic modulus variation for different regularities withrelative density to a function of the form,
E�
Es¼ C1
q�
qs
� �3
ð5Þ
where E⁄ is the elastic modulus of the honeycomb, Es is the elasticmodulus of the bulk material. Thus evaluated values of C1 are tab-ulated in Table 4.1.
In light of this, it is important to recognize that the constant C1
depends on the level of regularity in case of Voronoi honeycombs. Itshould be noted that the Eq. (5) is only applicable to 2D structureswhereas for 3D open cell configurations the elastic modulus isshown to vary with the square of the relative density (Gibsonet al., 2010; Roberts and Garboczi, 2002). Fig. 10 presents the var-iation of the normalized elastic modulus of the Voronoi honey-combs with relative density for different regularities.
Similarly, the plastic-collapse strength can be described by anexpression of the form (Gibson and Ashby, 1997; Gibson et al.,2010),
r�pcs
rys¼ C2
q�
qs
� �2
ð6Þ
where C2 is a constant of proportionality, r�pcs is the plastic-collapsestrength of the honeycomb, rys is the yield stress of the bulk mate-rial. Table 4.2 tabulates the evaluated values of C2 for differentregularities.
Again, it can be seen that the constant C2 varies with the level ofregularity of the Voronoi honeycombs. It should be noted that, Eq.(6) is only applicable for 2D structures and a new set of equationswould be necessary for the 3D counterparts. Fig. 11 presents thesimulated variation of the normalized plastic-collapse strength asa function of the relative density for different regularities.
5. Conclusions
In this paper, the role of cellular morphology of structural hon-eycombs on their compression response has been studied. Of par-ticular interest to the study is the effect of cell regularity andrelative density on the elastic–plastic behavior of random and reg-ular honeycombs. Finite element analyses using Timoshenko beamelements and solid modeling methods were developed for this pur-pose. The Voronoi tessellation technique in 2D was implementedto represent random honeycombs. The representation was ableto capture a majority of characteristics observed in natural honey-combs although the surface tension effects which influence geom-etry of natural honeycombs were not accounted for. The advancesand accessibility of additive manufacturing methods motivatedthis study since Voronoi honeycombs can be directly fabricatedfrom CAD models developed in a virtual environment. For example,this opens the possibility of fully controlling the morphology ofcellular structures during production of porous scaffolds. Further,morphological characteristics such as regularity, cross-sectionalshape of ligaments, polydispersity of cells and macroscopic shapewhich cannot be controlled in conventional methods can befully defined using solid modeling and additive manufacturingtechniques.
ularity and relative density on elasto-plastic compression response of ran-4), http://dx.doi.org/10.1016/j.ijsolstr.2014.07.009
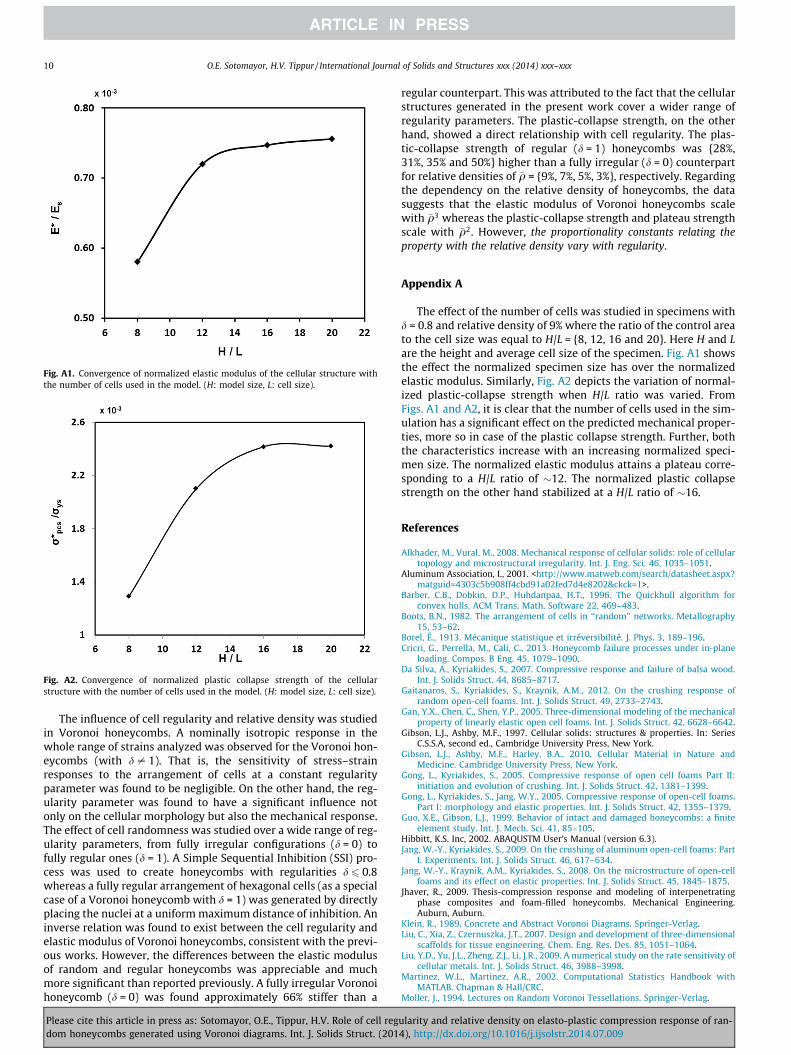
Fig. A1. Convergence of normalized elastic modulus of the cellular structure withthe number of cells used in the model. (H: model size, L: cell size).
Fig. A2. Convergence of normalized plastic collapse strength of the cellularstructure with the number of cells used in the model. (H: model size, L: cell size).
10 O.E. Sotomayor, H.V. Tippur / International Journal of Solids and Structures xxx (2014) xxx–xxx
The influence of cell regularity and relative density was studiedin Voronoi honeycombs. A nominally isotropic response in thewhole range of strains analyzed was observed for the Voronoi hon-eycombs (with d – 1). That is, the sensitivity of stress–strainresponses to the arrangement of cells at a constant regularityparameter was found to be negligible. On the other hand, the reg-ularity parameter was found to have a significant influence notonly on the cellular morphology but also the mechanical response.The effect of cell randomness was studied over a wide range of reg-ularity parameters, from fully irregular configurations (d = 0) tofully regular ones (d = 1). A Simple Sequential Inhibition (SSI) pro-cess was used to create honeycombs with regularities d 6 0.8whereas a fully regular arrangement of hexagonal cells (as a specialcase of a Voronoi honeycomb with d = 1) was generated by directlyplacing the nuclei at a uniform maximum distance of inhibition. Aninverse relation was found to exist between the cell regularity andelastic modulus of Voronoi honeycombs, consistent with the previ-ous works. However, the differences between the elastic modulusof random and regular honeycombs was appreciable and muchmore significant than reported previously. A fully irregular Voronoihoneycomb (d = 0) was found approximately 66% stiffer than a
Please cite this article in press as: Sotomayor, O.E., Tippur, H.V. Role of cell regdom honeycombs generated using Voronoi diagrams. Int. J. Solids Struct. (201
regular counterpart. This was attributed to the fact that the cellularstructures generated in the present work cover a wider range ofregularity parameters. The plastic-collapse strength, on the otherhand, showed a direct relationship with cell regularity. The plas-tic-collapse strength of regular (d = 1) honeycombs was {28%,31%, 35% and 50%} higher than a fully irregular (d = 0) counterpartfor relative densities of �q = {9%, 7%, 5%, 3%}, respectively. Regardingthe dependency on the relative density of honeycombs, the datasuggests that the elastic modulus of Voronoi honeycombs scalewith �q3 whereas the plastic-collapse strength and plateau strengthscale with �q2. However, the proportionality constants relating theproperty with the relative density vary with regularity.
Appendix A
The effect of the number of cells was studied in specimens withd = 0.8 and relative density of 9% where the ratio of the control areato the cell size was equal to H/L = {8, 12, 16 and 20}. Here H and Lare the height and average cell size of the specimen. Fig. A1 showsthe effect the normalized specimen size has over the normalizedelastic modulus. Similarly, Fig. A2 depicts the variation of normal-ized plastic-collapse strength when H/L ratio was varied. FromFigs. A1 and A2, it is clear that the number of cells used in the sim-ulation has a significant effect on the predicted mechanical proper-ties, more so in case of the plastic collapse strength. Further, boththe characteristics increase with an increasing normalized speci-men size. The normalized elastic modulus attains a plateau corre-sponding to a H/L ratio of �12. The normalized plastic collapsestrength on the other hand stabilized at a H/L ratio of �16.
References
Alkhader, M., Vural, M., 2008. Mechanical response of cellular solids: role of cellulartopology and microstructural irregularity. Int. J. Eng. Sci. 46, 1035–1051.
Aluminum Association, I., 2001. <http://www.matweb.com/search/datasheet.aspx?matguid=4303c5b908ff4cbd91a02fed7d4e8202&ckck=1>.
Barber, C.B., Dobkin, D.P., Huhdanpaa, H.T., 1996. The Quickhull algorithm forconvex hulls. ACM Trans. Math. Software 22, 469–483.
Boots, B.N., 1982. The arrangement of cells in ‘‘random’’ networks. Metallography15, 53–62.
Borel, É., 1913. Mécanique statistique et irréversibilité. J. Phys. 3, 189–196.Cricri, G., Perrella, M., Cali, C., 2013. Honeycomb failure processes under in-plane
loading. Compos. B Eng. 45, 1079–1090.Da Silva, A., Kyriakides, S., 2007. Compressive response and failure of balsa wood.
Int. J. Solids Struct. 44, 8685–8717.Gaitanaros, S., Kyriakides, S., Kraynik, A.M., 2012. On the crushing response of
random open-cell foams. Int. J. Solids Struct. 49, 2733–2743.Gan, Y.X., Chen, C., Shen, Y.P., 2005. Three-dimensional modeling of the mechanical
property of linearly elastic open cell foams. Int. J. Solids Struct. 42, 6628–6642.Gibson, L.J., Ashby, M.F., 1997. Cellular solids: structures & properties. In: Series
C.S.S.A, second ed., Cambridge University Press, New York.Gibson, L.J., Ashby, M.F., Harley, B.A., 2010. Cellular Material in Nature and
Medicine. Cambridge University Press, New York.Gong, L., Kyriakides, S., 2005. Compressive response of open cell foams Part II:
initiation and evolution of crushing. Int. J. Solids Struct. 42, 1381–1399.Gong, L., Kyriakides, S., Jang, W.Y., 2005. Compressive response of open-cell foams.
Part I: morphology and elastic properties. Int. J. Solids Struct. 42, 1355–1379.Guo, X.E., Gibson, L.J., 1999. Behavior of intact and damaged honeycombs: a finite
element study. Int. J. Mech. Sci. 41, 85–105.Hibbitt, K.S. Inc, 2002. ABAQUSTM User’s Manual (version 6.3).Jang, W.-Y., Kyriakides, S., 2009. On the crushing of aluminum open-cell foams: Part
I. Experiments. Int. J. Solids Struct. 46, 617–634.Jang, W.-Y., Kraynik, A.M., Kyriakides, S., 2008. On the microstructure of open-cell
foams and its effect on elastic properties. Int. J. Solids Struct. 45, 1845–1875.Jhaver, R., 2009. Thesis-compression response and modeling of interpenetrating
phase composites and foam-filled honeycombs. Mechanical Engineering.Auburn, Auburn.
Klein, R., 1989. Concrete and Abstract Voronoi Diagrams. Springer-Verlag.Liu, C., Xia, Z., Czernuszka, J.T., 2007. Design and development of three-dimensional
scaffolds for tissue engineering. Chem. Eng. Res. Des. 85, 1051–1064.Liu, Y.D., Yu, J.L., Zheng, Z.J., Li, J.R., 2009. A numerical study on the rate sensitivity of
cellular metals. Int. J. Solids Struct. 46, 3988–3998.Martinez, W.L., Martinez, A.R., 2002. Computational Statistics Handbook with
MATLAB. Chapman & Hall/CRC.Moller, J., 1994. Lectures on Random Voronoi Tessellations. Springer-Verlag.
ularity and relative density on elasto-plastic compression response of ran-4), http://dx.doi.org/10.1016/j.ijsolstr.2014.07.009

O.E. Sotomayor, H.V. Tippur / International Journal of Solids and Structures xxx (2014) xxx–xxx 11
Okabe, A., Boots, B., Sugihara, K., Chiu, S.N., 1945. Spatial Tessellations: Conceptsand Applications of Voronoi Diagrams, second ed. John Wiley & Sons Ltd.
Papka, S.D., Kyriakides, S., 1994. In-plane compressive response and crushing ofhoneycomb. J. Mech. Phys. Solids 42, 1499–1532.
Papka, S.D., Kyriakides, S., 1998. Experiments and full-scale numerical simulationsof in-plane crushing of a honeycomb. Acta Mater. 46, 2765–2776.
Roberts, A.P., Garboczi, E.J., 2002. Elastic properties of model random three-dimensional open-cell solids. J. Mech. Phys. Solids 50, 33–55.
Silva, M.J., Gibson, L.J., 1997. Effects of non-periodic microstructure and defects onthe compressive strength of two-dimensional cellular solids. Int. J. Mech. Sci.39, 549–563.
Please cite this article in press as: Sotomayor, O.E., Tippur, H.V. Role of cell regdom honeycombs generated using Voronoi diagrams. Int. J. Solids Struct. (201
Silva, M.J., Hayes, W.C., Gibson, L.J., 1995. The effects of non-periodic microstructureon the elastic properties of two-dimensional cellular solids. Int. J. Mech. Sci. 37,1161–1177.
Tekoglu, C., Gibson, L.J., Pardoen, T., Onck, P.R., 2011. Size effects in foams:experiments and modeling. Prog. Mater Sci. 56, 109–138.
Zhu, H.X., Hobdell, J.R., Windle, A.H., 2000. Effects of cell irregularity on the elasticproperties of open-cell foams. Acta Mater. 48, 4893–4900.
Zhu, H.X., Hobdell, J.R., Windle, A.H., 2001. Effects of cell irregularity on the elasticproperties of 2D Voronoi honeycombs. J. Mech. Phys. Solids 49, 857–870.
Zhu, H.X., Thorpe, S.M., Windle, A.H., 2006. The effect of cell irregularity on the highstrain compression of 2D Voronoi honeycombs. Int. J. Solids Struct. 43, 1061–1078.
ularity and relative density on elasto-plastic compression response of ran-4), http://dx.doi.org/10.1016/j.ijsolstr.2014.07.009