rojecting ield and tilization otential of … proof by: qc by: projectacronym:bs:agron volume:90007...
TRANSCRIPT
Comp. by: bala Date:28/4/06 Time:17:13:48 Stage:First Proof File Path://Spsind002s/Production/PRODENV/0000000001/0000000860/0000000016/0000075788.3D Proof by: QC by: ProjectAcronym:bs:AGRON Volume:90007
UNCORRECTEDPROOF
PROJECTING YIELD AND UTILIZATION
POTENTIAL OF SWITCHGRASS AS
AN ENERGY CROP
Samuel B. McLaughlin,1 James R. Kiniry,2
Charles M. Taliaferro3 and Daniel De La Torre Ugarte4
1Bioenergy Feedstock Development Program, Environmental Sciences Division,Oak Ridge National Laboratory, Mississippi 64222USDA Agricultural Research Service, Grassland,
Soil and Water Research Laboratory, Temple, Texas 76502‐67123Department of Plant and Soil Sciences,
Oklahoma State University, Stillwater, Oklahoma 74078‐60284US Department of Energy, Agricultural Policy Analysis Center,
University of Tennessee, Knoxville, Tennessee 37996–4519
I. Introduction
II. Projecting Yield Gains in Switchgrass Relative to Maize
A. Breeding History of Maize
B. Breeding Gains with Perennial Grasses Including Switchgrass
C. Potential Yields in Maize and Switchgrass
D. Whole Plant Production in Maize and Switchgrass
III. Projecting Switchgrass Performance in Time and Space
with the Almanac Model
A. Physiological and Ecological Traits of Switchgrass
B. Parametrization of the ALMANAC Model
C. Simulated Yields from ALMANAC Versus Actual Yields Within
the Region
IV. Assessing Economic Impacts of Widespread Deployment of
Switchgrass in a National Bioenergy Program
V. Conclusions
Acknowledgments
References
The potential utilization of switchgrass (Panicum virgatum L.) as a cellu-
losic energy crop was evaluated as a component of a projected future
national network of biorefineries designed to increase national reliance on
renewable energy from American farms. Empirical data on yields of switch-
grass from a network of experimental plots were coupled with data on
switchgrass physiology and switchgrass breeding progress to provide reason-
able expectations for rates of improvement over yields. Historical breeding
267
Advances in Agronomy, Volume 90Copyright 2006, Elsevier Inc. All rights reserved.
0065-2113/06 $35.00DOI: 10.1016/S0065-2113(06)90007-8
Comp. by: bala Date:28/4/06 Time:17:13:48 Stage:First Proof File Path://Spsind002s/Production/PRODENV/0000000001/0000000860/0000000016/0000075788.3D Proof by: QC by: ProjectAcronym:bs:AGRON Volume:90007
UNCORRECTEDPROOF
success with maize (Zea mays L.) was found to provide a reasonable model
for projected linear rates of yield improvement of switchgrass based on
documented progress to date. A physiologically based crop production
model, ALMANAC, and an econometric model, POLYSYS, were utilized
to estimate variability in switchgrass yield and resource utilization across the
eastern two‐thirds of the United States. ALMANAC provided yield esti-
mates across 27 regional soil types and 13 years of weather data to estimate
variability in relative rates of production and water use between switchgrass
and maize. Current and future yield projections were used with POLYSYS to
forecast rates of adaptation and economic impacts on regional agricultural
markets. Significant positive impacts on US markets, including significant
increases in farm income and significant reduction in the need for govern-
ment subsidies, were projected. This was based on expected technological
progress in developing biorefineries that will significantly increase national
energy self‐suYciency by producing feed protein, transportation fuel, and
electrical power from cellulosic feedstocks. # 2006, Elsevier Inc.
I. INTRODUCTION
While ethanol from maize (Zea mays L.) is the dominant means by which
renewable energy is channeled from sunlight to the transportation industry
(Shapouri et al., 1995), switchgrass (Panicum virgatum L.) has become
another strong candidate for production of bioenergy. Switchgrass is a
native perennial, warm‐season grass species within which selection has
been practiced for forage and conservation uses over the past half‐century(Vogel et al., 1985). In 1991 it was selected as a candidate for utilization in
production of bioenergy and bioproducts (McLaughlin and Kszos, 2005). Its
strongest attributes include high biomass production capability and energy
recovery capacity with low energy and material inputs, and excellent com-
patibility with existing agricultural practices. These qualities, combined with
strong soil and water conservation values, and a high capacity to reduce
emissions of greenhouse gases have led to switchgrass being considered as a
potentially important component of a national energy strategy (McLaughlin
et al., 2002).
Despite criticism of ethanol production from maize based on low energy
eYciency and adverse environmental impacts (Pimmentel et al., 2002),
maize‐based ethanol production has made an important beginning in the
reduction of reliance of the United States on imported oil. Maize‐basedethanol does displace significantly more oil than is used in its production
(Shapouri et al., 1995). However, McLaughlin and Walsh (1998) suggested
that the eYciency of energy conversion and reduction of greenhouse emis-
sions through production of cellulosic ethanol from switchgrass could
AU:14 268 S. B. MCLAUGHLIN
Comp. by: bala Date:28/4/06 Time:17:13:48 Stage:First Proof File Path://Spsind002s/Production/PRODENV/0000000001/0000000860/0000000016/0000075788.3D Proof by: QC by: ProjectAcronym:bs:AGRON Volume:90007
UNCORRECTEDPROOF
exceed that from maize ethanol by more than an order of magnitude. Yet
maize remains the standard biofuel feedstock, which provides a base that can
ultimately be supplemented by other feedstocks, providing greater economic
and environmental eYciencies.
If switchgrass is to provide a viable supplement to ethanol from maize,
biomass production levels of switchgrass must be determined as input for
a national renewable energy strategy. The Role of Biomass in America’s
Energy Future (RBAEF) project was initiated to help formulate such a
strategy. The RBAEF project represents the most comprehensive eVort inthe United States to date that has focused on analysis of mature technology
for production of energy from biomass. It has involved experts from gov-
ernment and university bioenergy analysis coupled with active involvement
of both conservation (Natural Resources Defense Council) and policy
(OYce of Energy Policy) organizations. The RBAEF project has considered
over 20 mature process technology scenarios for production of a broad
range of fuels and electrical power from cellosic biomass. Reasonably opti-
mistic forecasts for both biomass production and bioenergy conversion were
evaluated for a projected national network of biorefineries that could con-
tribute to national energy self‐suYciency (Greene, 2004). Switchgrass was
selected as the model crop for this study and in that context the research
described herein has formed a basis for considering what role switchgrass
could play in a national energy supply system that incorporated the best
foreseeable technology to produce energy and value‐added products such as
animal feed protein from cellulosic feedstocks. Yield levels will play a key
role in the economics of such production and utilization systems as well as in
determining the demographics of production.
When discussing methods for increasing plant biomass yield, some terms
describing yield must be defined. Two such terms commonly used are ‘‘yield
potential’’ and ‘‘potential yield.’’ As used in this study, yield potential is the
maximum yield (biomass or grain) levels that have been attained at any time
for a specific genotype of a crop or grass under field conditions. In contrast,
potential yield is the maximum predicted yield based on simulations founded
in plausible physics, biochemistry, and physiology of the crop in its normal
growing environment (Fischer and Evans, 1999). This yield is considered
theoretically and physiologically possible based on maximum light inter-
ception and biochemical conversion of solar radiation into dry matter
accumulation.
Because maize production is a cornerstone of agricultural economics in
North America, the historical improvement of maize yields represents an
important standard from which to project future yield gains of other species
with comparable production characteristics. Maize yield records for North
America extend back more than 100 years and provide a template for both
defining and understanding yield improvement through breeding and crop
AU:13 PROJECTING YIELD AND UTILIZATION OF SWITCHGRASS 269
Comp. by: bala Date:28/4/06 Time:17:13:48 Stage:First Proof File Path://Spsind002s/Production/PRODENV/0000000001/0000000860/0000000016/0000075788.3D Proof by: QC by: ProjectAcronym:bs:AGRON Volume:90007
UNCORRECTEDPROOF
physiological studies (Duvick, 1997; Tollenaar et al., 1994). Maize and
switchgrass not only share the common trait of being useful bioenergy
crops but are also similar in that both are warm‐season, C4 species. Howev-
er, maize is an annual with only the grain used for ethanol production while
switchgrass is a perennial with the entire aboveground biomass used when
energy is the endpoint. Maize is a good standard of comparison because of
the extensive breeding for increased yields and the extensive physiological
research on processes contributing to yield. Investigation of the physiology
and breeding history of these two plant species, as related to increased yields,
becomes important for studies of yield potential as a theoretical upper limit
of yield increases achievable through breeding.
In this chapter, we examine the past record of yield improvement in maize
and the basis of those gains to provide a framework for projecting gains in
yield of switchgrass. A necessary component of these analyses has been
comparisons of the agronomic characteristics, breeding history, and under-
lying physiology of maize and switchgrass. We had three objectives in
initiating this study. First, we wanted to evaluate potential yield improve-
ment in switchgrass using maize breeding advances as a model. Second, we
wanted to test and apply a physiologically based crop production model,
ALMANAC (Kiniry et al., 1992), parametrized to switchgrass physiology
to estimate both potential yield and yield potential of switchgrass. Finally,
we wanted to describe links between productivity and production costs for
regional projections of switchgrass utilization that would require widespread
participation of the agricultural community of the United States in support-
ing renewable energy production. Such participation must be based on
switchgrass, providing attractive economic alternatives to conventional
crops. For these analyses we have used the econometric model POLYSYS
(Ugarte and Ray, 2000).
II. PROJECTING YIELD GAINS IN SWITCHGRASSRELATIVE TO MAIZE
A. BREEDING HISTORY OF MAIZE
While maize was domesticated more than 7000 years ago (Goodman and
Brown, 1988), the largest increases in yields occurred in the past 75 years as
modern breeding techniques evolved (Duvick, 1997, 1999; Tollenaar et al.,
1994). Switchgrass breeding has a much shorter history, with selection for
yield increases and trait improvement having occurred only in the last few
decades. However, this genetically diverse grass is an important component
of the North American tallgrass prairies and has undergone thousands of
AU:1
270 S. B. MCLAUGHLIN
Comp. by: bala Date:28/4/06 Time:17:13:48 Stage:First Proof File Path://Spsind002s/Production/PRODENV/0000000001/0000000860/0000000016/0000075788.3D Proof by: QC by: ProjectAcronym:bs:AGRON Volume:90007
UNCORRECTEDPROOF
years of natural selection for persistence under the stresses imposed by
grazing animals, principally bison (Bison bison), and fires (Steinauer and
Collins, 1996).
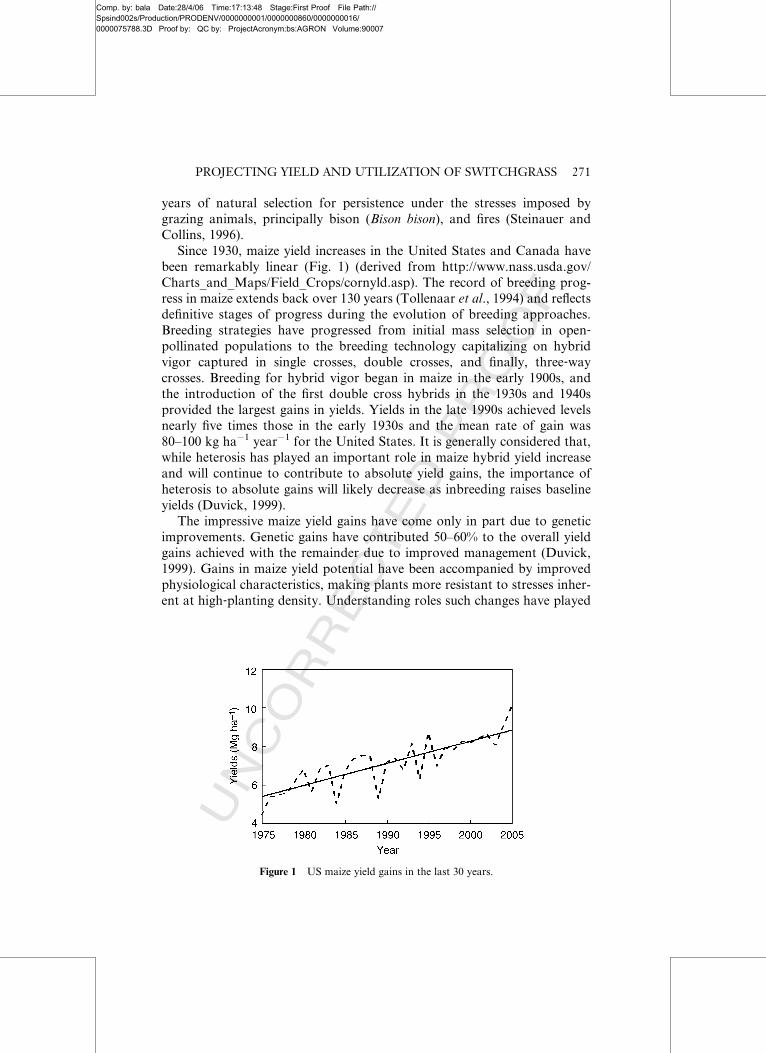
Since 1930, maize yield increases in the United States and Canada have
been remarkably linear (Fig. 1) (derived from http://www.nass.usda.gov/
Charts_and_Maps/Field_Crops/cornyld.asp). The record of breeding prog-
ress in maize extends back over 130 years (Tollenaar et al., 1994) and reflects
definitive stages of progress during the evolution of breeding approaches.
Breeding strategies have progressed from initial mass selection in open‐pollinated populations to the breeding technology capitalizing on hybrid
vigor captured in single crosses, double crosses, and finally, three‐waycrosses. Breeding for hybrid vigor began in maize in the early 1900s, and
the introduction of the first double cross hybrids in the 1930s and 1940s
provided the largest gains in yields. Yields in the late 1990s achieved levels
nearly five times those in the early 1930s and the mean rate of gain was
80–100 kg ha�1 year�1 for the United States. It is generally considered that,
while heterosis has played an important role in maize hybrid yield increase
and will continue to contribute to absolute yield gains, the importance of
heterosis to absolute gains will likely decrease as inbreeding raises baseline
yields (Duvick, 1999).
The impressive maize yield gains have come only in part due to genetic
improvements. Genetic gains have contributed 50–60% to the overall yield
gains achieved with the remainder due to improved management (Duvick,
1999). Gains in maize yield potential have been accompanied by improved
physiological characteristics, making plants more resistant to stresses inher-
ent at high‐planting density. Understanding roles such changes have played
Figure 1 US maize yield gains in the last 30 years.
PROJECTING YIELD AND UTILIZATION OF SWITCHGRASS 271
Comp. by: bala Date:28/4/06 Time:17:13:49 Stage:First Proof File Path://Spsind002s/Production/PRODENV/0000000001/0000000860/0000000016/0000075788.3D Proof by: QC by: ProjectAcronym:bs:AGRON Volume:90007
UNCORRECTEDPROOF
in yield gains is important to our objective of estimating how such gains can
be mirrored with switchgrass.
B. BREEDING GAINS WITH PERENNIAL GRASSES
INCLUDING SWITCHGRASS
Scientific breeding of perennial grasses largely began in the mid‐20thcentury and has been on a much smaller scale than for maize. Consequently,
performance gains attributable to sustained breeding of perennial grasses, in
general, are much less than for maize. Additionally, the number, scope, and
duration of breeding programs have varied greatly with perennial grass
species, contributing to substantial diVerences among species in breeding
gains.
Articles addressing genetic gains, made mainly in important cool‐seasonperennial grass species, indicate diVerences associated with traits, species,
and geographic regions (Casler, 2001; Casler et al., 2000; Wilkins and
Humphreys, 2003). Casler et al. (2000) compared smooth bromegrass
(Bromus inermis Leyss) cultivars developed in the United States between
1942 and 1995 with cultivars predating 1942. While there were no genetic
gains in dry biomass yields (DBY) were detected among the cultivars
developed between 1942 and 1995, the DBY of the post 1942 cultivars
averaged 0.54 Mg ha�1 year�1 (7.2%) higher than the DBY of ‘‘Lincoln,’’
a direct representative of the first smooth bromegrass introduced into
North America. They also reported small gains in brown leaf‐spot resistance(0.21 units per decade), in vitro dry matter digestibility (IVDMD) (9 g kg�1,
1.4%), and neutral detergent fiber (NDF) (–8 g kg�1, �1.2%). The slow rate
of genetic gain for DBY was attributed to the complex polyploid inheritance
of smooth bromegrass, breeding emphasis on traits other than forage yield,
and relatively little concerted attention from public and private breeders.
Casler (2001) reviewed breeding eVorts for improved forage nutritional
value, reporting enhancements for several diVerent species and indices
[increased IVDMD, nylon bag dry matter digestibility (NBDMD), and
protein, and decreased acid detergent fiber (ADF) and lignin] ranging from
1 to 7% per cycle. Wilkins and Humphreys (2003) reported that over the past
50 years, gains in DBY of the important forage grass species have been 4–5%
per decade in northwestern Europe, but only 0–1% per decade in the United
States. Additionally, they state that gains in the dry matter digestibility
(DMD) of perennial ryegrass (Lolium perenne L.) in the United Kingdom
have been 10 g kg�1 per decade, whereas in the United States little or no gain
has been made, presumably reflecting the continental diVerences in amount
of breeding eVort and/or breeding objectives. Common expressions in the
previously cited articles are that genetic gains in the perennial grasses have
272 S. B. MCLAUGHLIN
Comp. by: bala Date:28/4/06 Time:17:13:49 Stage:First Proof File Path://Spsind002s/Production/PRODENV/0000000001/0000000860/0000000016/0000075788.3D Proof by: QC by: ProjectAcronym:bs:AGRON Volume:90007
UNCORRECTEDPROOF
been limited mainly by lack of breeding eVort and that the largely unmined
genetic diversity within these species oVers potential for enormous breeding
improvement.
Significant breeding advances have been documented in several warm‐season (C4) perennial grasses for DBY and other attributes. One well‐knownsuccess story is with bermudagrass [Cynodon dactylon L. Pers.]. Bermuda-
grass breeding initiated by Burton in 1937 at Tifton, GA led to the release
of ‘‘Coastal’’ bermudagrass in 1943 (Burton, 1947, 1954). Coastal bermuda-
grass DBY is nearly twice that of unselected common bermudagrass
strains found in the southeastern United States (Adams and Stelly, 1958;
Carreker et al., 1972). In addition, Burton (1982, 1985, 1992) and Burton
and Mullinix (1998) increased DBY of bahiagrass (Paspalum notatum
Flugge var saurae Parodi) through systematic restricted recurrent pheno-
typic selection (RRPS). Mean individual spaced plant DBY increased in
bahiagrass population ‘‘A’’ from 364 g per plant in cycle 0 to 1767 g per
plant in cycle 18, a gain in mean individual plant DBY of 78 g RRPS
per cycle. In narrow base population ‘‘B,’’ mean spaced plant DBY
increased from 823 g per plant in cycle 0 to 1427 g per plant in cycle 10, a
gain in mean individual plant DBY of 60 g RRPS per cycle. While RRPS
increased the number of high‐yielding plants and reduced the number of
low‐yielding plants in successive cycles, genetic variation for DBY remained
high in the populations. Population A RRPS cycle 18 had two plants with
DBY of 4540 g and 27 plants with DBY of only 454 g.
Systematic breeding within switchgrass populations specifically for
increased DBY is in its infancy, and yield gains of the first few breeding
cycles have just been reported (McLaughlin and Kszoz, 2005). Many com-
monly grown switchgrass cultivars are direct increase of naturally occurring
strains (Vogel, 2000, 2004). Examples include the lowland ecotypes ‘‘Alamo’’
and ‘‘Kanlow,’’ and the upland ecotypes ‘‘Blackwell’’ and ‘‘Cave‐in‐rock.’’Cyclic selection in switchgrass for increased nutritive value has been eVectiveand has resulted in the release of ‘‘Trailblazer’’ and ‘‘Shawnee,’’ upland type
cultivars adapted to the central United States (Vogel, 2004).
The potential for increasing DBY in switchgrass is significant because of
the large genetic variation within the species. There is substantial heritable
variation in switchgrass for DBY and related performance traits (Hopkins
et al., 1993; Newell and Eberhart, 1961; Talbert et al., 1983; Taliaferro et al.,
1999; Vogel et al., 1981). Additional basic information generated over the
past decade has strengthened understanding of the biology of the species,
providing a firm foundation for applied breeding improvement.
Future breeding gains in switchgrass DBY will depend on the amount
and consistency of eVort expended and on continued refinement of breed-
ing protocols. Better screens are needed to enhance the eVectivenessand eYciency of selection. The RRPS protocol, used so successfully with
PROJECTING YIELD AND UTILIZATION OF SWITCHGRASS 273
Comp. by: bala Date:28/4/06 Time:17:13:49 Stage:First Proof File Path://Spsind002s/Production/PRODENV/0000000001/0000000860/0000000016/0000075788.3D Proof by: QC by: ProjectAcronym:bs:AGRON Volume:90007
UNCORRECTEDPROOF
bahiagrass, did not achieve the desired results with switchgrass in Nebraska
and Oklahoma (Hopkins et al., 1993; Taliaferro, 2002). Two cycles of RRPS
failed to increase DBY in an upland population, but did provide linear
gains in IVDMD through three cycles (Hopkins et al., 1993). Three cycles
of RRPS for increased DBY in each of four populations (two upland
and two lowland) gave generally desirable but mixed results in Oklahoma
(Taliaferro, 2002). Yield gains per cycle varied from near 0 to a maximum of
6% and were not linear across cycles. Use of RRPS was relatively ineVectivein identifying plants of superior breeding value in the establishment year, in
large part, because much of the growth during that year is belowground and
not readily assessed by these techniques. Some switchgrass breeding pro-
grams are now using progeny testing as a basis for selection of plants with
superior breeding value for DBY, a process known as genotypic recurrent
selection. This procedure has been successful with many crops for many
traits but is the most time consuming of the recurrent selection procedures
(Fehr, 1987). Four to five years are required for each cycle.
Rapid progress has been made using a novel honeycomb planting
design (Fasoula and Fasoula, 1995) to promote phenotypic selection within
a lowland switchgrass population developed from Alamo and Kanlow
(Bouton, 2002). Data from preliminary testing indicated four synthetic culti-
vars developed using elite plants selected from the population had 30% yield
gains relative to parent populations of Alamo and Kanlow. The selection
process occurred over 4 years equated to an annual gain of 7.5%. This
compares favorably with early gains in maize improvement in the United
States, which ranged from 3.5–6.0% of baseline yields in the 1930s to 1.3–1.8%
of those attained in the 1990s (Tollenaar et al., 1994). Average yield gains for
maize made over 70 years of breeding for commercial markets in Iowa have,
as expected, been lower (0.7–1.2% per year) (Duvick, 1997).
C. POTENTIAL YIELDS IN MAIZE AND SWITCHGRASS
Our analyses suggest that upper limit yields (potential yields) of maize
and switchgrass are similar. In simplest terms, potential yield is governed by
how much radiant energy can be captured by the plant canopy and con-
verted to harvestable biomass over an annual growing season. The key
processes regulating potential yield are the leaf canopy size and longevity,
and eYciency of canopy interception of radiant energy; the eYciency of
conversion of radiant energy to photosynthetic products and plant biomass;
and the relative allocation of carbohydrates to the physical and metabolic
support of the whole plant system. Loomis and Amthor (1996, 1999) con-
cluded that genetic control of photosynthesis and respiration is complex and
relatively stable, such that the basic eYciency of these processes appears little
274 S. B. MCLAUGHLIN
Comp. by: bala Date:28/4/06 Time:17:13:49 Stage:First Proof File Path://Spsind002s/Production/PRODENV/0000000001/0000000860/0000000016/0000075788.3D Proof by: QC by: ProjectAcronym:bs:AGRON Volume:90007
UNCORRECTEDPROOF
altered by crop domestication and breeding. They estimated that radiation
use eYciency (RUE) of maize should be 4.6 g MJ�1 of intercepted photo-
synthetically active radiation. However, measured RUE values with high‐yielding maize in the field are only 3.7–3.8 (Kiniry et al., 2004; Lindquist
et al., 2005; Tollenaar and Aguilar, 1992).
While neither the upper limits of photosynthesis nor the upper limits of
yield potential have changed measurably (Tollenaar and Wu, 1999), the
yielding ability of maize in the field has increased dramatically (Fig. 1).
This is because maize yields are aVected by tolerances to natural stress and
responsiveness to management inputs (Fasoula and Fasoula, 2000).
A side benefit of selecting higher maize yield has been increased resistance
to stresses associated with high‐yield production systems (Duvick, 1997;
Tollenaar and Lee, 2002; Tollenaar and Wu, 1999; Tollenaar et al., 1994).
Among the performance traits that have improved as maize yields have
increased are: increased resistance to competition in high‐density plantings
(Tokatlidis, 2001); increased resistance to drought stress (Dwyer et al.,
1992); improved nitrogen use eYciency (McKay and Barber, 1986); reduced
dark respiration (Earl and Tollenaar, 1998); improved source:sink relations
(Rajcan and Tollenaar, 1999); improved canopy level eYciency at intercep-
tion and utilization of radiation (Dwyer et al., 1991); and increased longevity
of the productive maize canopy, a phenomenon referred to as ‘‘stay‐green’’(Tollenaar et al., 1994). While these traits have not played significant roles in
breeding strategies to date, they could be important for increased future
yields of maize or switchgrass. Their improvement for maize has been
attributed to the trend in commercial breeding to include testing and selec-
tion for performance across diverse testing environments, which included
wide variations in these stresses (Tollenaar and Lee, 2002).
Maximum grain yield potential attained by maize under field conditions is
in the range of 15–20 Mg ha�1 (Tollenaar and Wu, 1999). These data
represent record yields from a few individual fields. Maximum regional
yields and countrywide commercial yields are lower than these maxima,
in the range of 11.2 Mg ha�1 for individual counties (National Agricultural
Statistical Service, ftp://www.nass.usda.gov/pub/county/byyear/) to 13.3 Mg
ha�1 (5‐year average) for the highest yielding hybrids in Texas (Pietsch
et al., 1999). Yield potential of such irrigated maize in the field is 36–48%
below potential yield, which has a theoretical maximum of 25 Mg ha�1
(Tollenaar, 1983). Average commercial yields of maize between 1980 and
2000 in central North America were considerably less, in the range of 6–7
Mg ha�1 (Tollenaar and Lee, 2002).
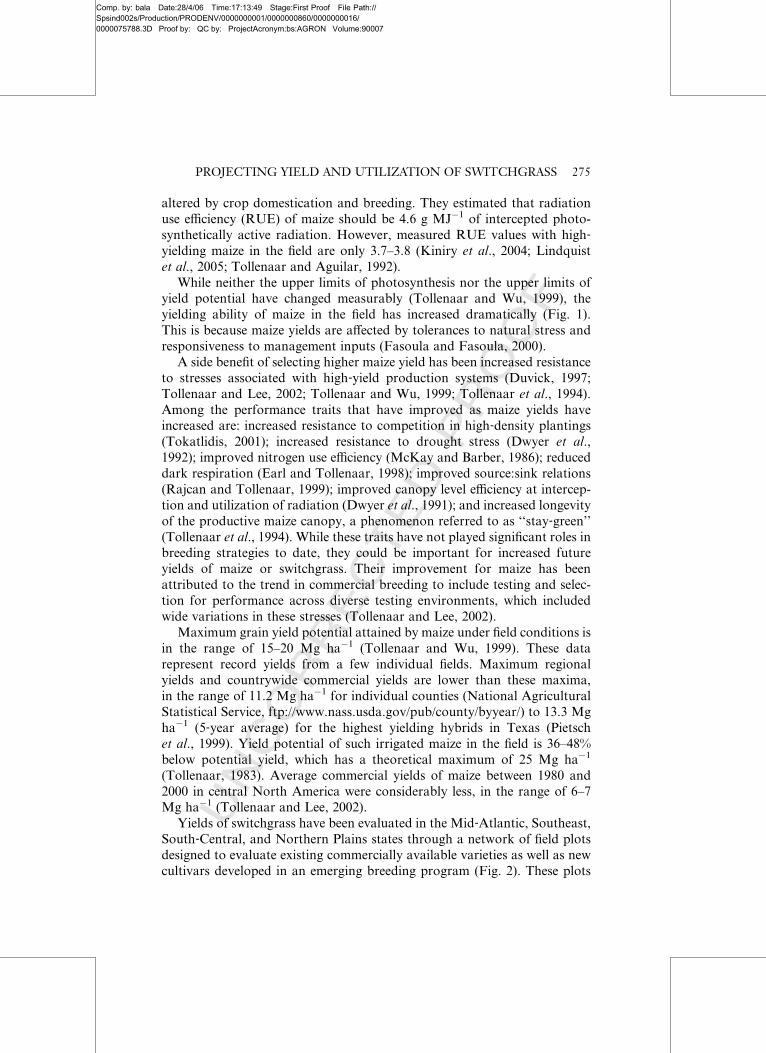
Yields of switchgrass have been evaluated in the Mid‐Atlantic, Southeast,
South‐Central, and Northern Plains states through a network of field plots
designed to evaluate existing commercially available varieties as well as new
cultivars developed in an emerging breeding program (Fig. 2). These plots
PROJECTING YIELD AND UTILIZATION OF SWITCHGRASS 275
Comp. by: bala Date:28/4/06 Time:17:13:49 Stage:First Proof File Path://Spsind002s/Production/PRODENV/0000000001/0000000860/0000000016/0000075788.3D Proof by: QC by: ProjectAcronym:bs:AGRON Volume:90007
UNCORRECTEDPROOF
have served to identify both the most productive varieties for various lati-
tudes and to evaluate the influences of various management regimes, includ-
ing cutting regimes (one or two harvests per year with variable harvesting
dates), nitrogen form and application rates, and row spacing (45–120 cm).
Early yield gains of 50% were made by identifying varieties that were best
suited to each production region (McLaughlin and Kszos, 2005).
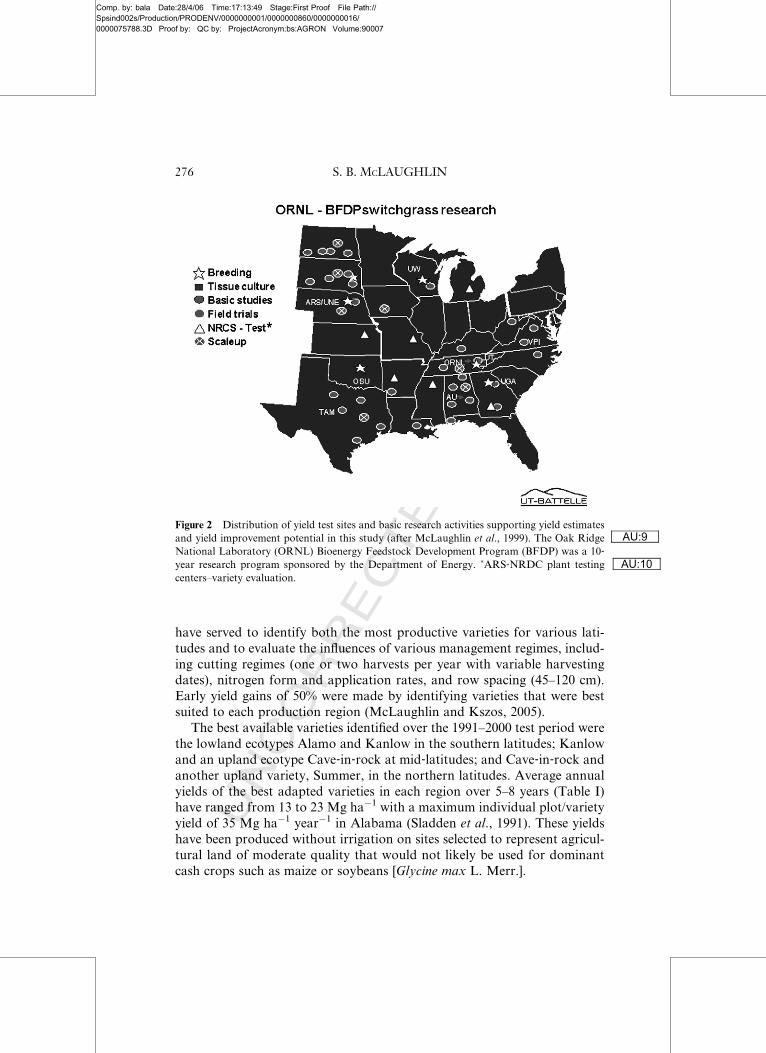
The best available varieties identified over the 1991–2000 test period were
the lowland ecotypes Alamo and Kanlow in the southern latitudes; Kanlow
and an upland ecotype Cave‐in‐rock at mid‐latitudes; and Cave‐in‐rock and
another upland variety, Summer, in the northern latitudes. Average annual
yields of the best adapted varieties in each region over 5–8 years (Table I)
have ranged from 13 to 23 Mg ha�1 with a maximum individual plot/variety
yield of 35 Mg ha�1 year�1 in Alabama (Sladden et al., 1991). These yields
have been produced without irrigation on sites selected to represent agricul-
tural land of moderate quality that would not likely be used for dominant
cash crops such as maize or soybeans [Glycine max L. Merr.].
Figure 2 Distribution of yield test sites and basic research activities supporting yield estimates
and yield improvement potential in this study (after McLaughlin et al., 1999). The Oak Ridge
National Laboratory (ORNL) Bioenergy Feedstock Development Program (BFDP) was a 10‐year research program sponsored by the Department of Energy. �ARS‐NRDC plant testing
centers–variety evaluation.
AU:9
AU:10
276 S. B. MCLAUGHLIN
Comp. by: bala Date:28/4/06 Time:17:13:49 Stage:First Proof File Path://Spsind002s/Production/PRODENV/0000000001/0000000860/0000000016/0000075788.3D Proof by: QC by: ProjectAcronym:bs:AGRON Volume:90007
UNCORRECTEDPROOF
D. WHOLE PLANT PRODUCTION IN MAIZE AND SWITCHGRASS
Because harvested maize grain crop represents allocation of a portion of
the captured and converted solar energy from the maize canopy, one must
also know the harvest index (grain weight divided by total aboveground
plant weight) to calculate total productivity of the maize crop. This is
particularly relevant in comparing results of yield increase of a grain crop,
like maize, with a cellulosic crop, like switchgrass, where total biomass
production is the major emphasis. The harvest index of maize is 50–54%
(Escharte and Andrade, 2003; Kiniry et al., 2002, 2004; Tollenaar, 1992).
Unlike the increasing harvest index values that have tracked the trend in
yield gains in some of the cereal grains, such as wheat (Fischer et al., 1998),
the harvest index of maize has remained largely unchanged (Tollenaar,
1989). With a maximum theoretical yield for maize of 25 Mg ha�1 and a
harvest index of 54% (Escharte and Andrade, 2003; Kiniry et al., 2004), the
calculated maximum aboveground productivity of maize is 46.3 Mg ha�1.
Potential yield of maize on an individual plant basis is considered to have
remained largely unchanged over the last several decades of yield increase
(Duvick, 1997). What has improved is the performance of leaf canopies
under intensive management for high yields.
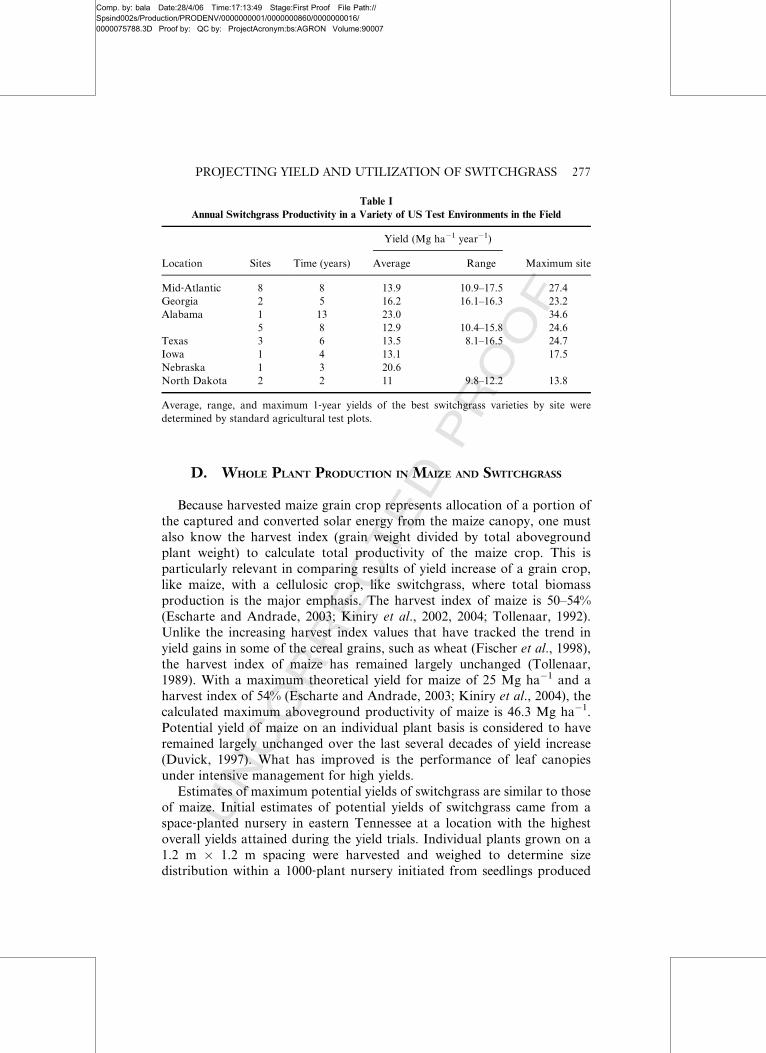
Estimates of maximum potential yields of switchgrass are similar to those
of maize. Initial estimates of potential yields of switchgrass came from a
space‐planted nursery in eastern Tennessee at a location with the highest
overall yields attained during the yield trials. Individual plants grown on a
1.2 m � 1.2 m spacing were harvested and weighed to determine size
distribution within a 1000‐plant nursery initiated from seedlings produced
Table I
Annual Switchgrass Productivity in a Variety of US Test Environments in the Field
Location Sites Time (years)
Yield (Mg ha�1 year�1)
Maximum siteAverage Range
Mid‐Atlantic 8 8 13.9 10.9–17.5 27.4
Georgia 2 5 16.2 16.1–16.3 23.2
Alabama 1 13 23.0 34.6
5 8 12.9 10.4–15.8 24.6
Texas 3 6 13.5 8.1–16.5 24.7
Iowa 1 4 13.1 17.5
Nebraska 1 3 20.6
North Dakota 2 2 11 9.8–12.2 13.8
Average, range, and maximum 1‐year yields of the best switchgrass varieties by site were
determined by standard agricultural test plots.
PROJECTING YIELD AND UTILIZATION OF SWITCHGRASS 277
Comp. by: bala Date:28/4/06 Time:17:13:50 Stage:First Proof File Path://Spsind002s/Production/PRODENV/0000000001/0000000860/0000000016/0000075788.3D Proof by: QC by: ProjectAcronym:bs:AGRON Volume:90007
UNCORRECTEDPROOF
in the greenhouse from tissue culture explants (Conger et al., 1996). These
plots produced some of the highest yields in the test network in 1995.
Estimates of the upper limits of field‐scale yields based on the distribution
of yields within the stand projected a maximum of 48.6 Mg ha�1 year�1
(based on a population at the level of the highest yielding plant). Similar
calculations based on the mode and average yields of individual plants were
22.8 and 20.6 Mg ha�1 year�1, respectively.
The estimates of maximum annual potential yields of maize (46.3Mg ha�1
year�1) and switchgrass biomass (48.6 Mg ha�1 year�1) (Table II) are
Table II
Some Physiologically Based Production Characteristics of Switchgrass Based on Field
Measurements of Accessions at a Germplasm Nursery in Tennessee and Oklahoma (see text)
Maximum single‐plant yield in a space‐planted nursery from a 1000‐plant nursery in
tennessee (projected from 1.2 m � 1.2 m spaced planting)
Average yield all plants: 20.6 Mg ha�1 year�1
Most frequent yield: 22.9 Mg ha�1 year�1
Highest yielding plant: 7.0 kg
‘‘Max plot’’a: 48.6 Mg ha�1 year�1
Physiological characteristics
Single‐leaf photosynthesis Range: 17.5–30.8 mmol m�2 s�1
Top 3: 30.5
Alamo: 27.9
Transpiration Range: 6.2–13.0 mmol m�2 s�1
Top 3: 11.83
Alamo: 8.2
Stomatal conductance Range: 0.16–0.30 mol m�2 s�1
Top 3: 0.29
Alamo: 0.23
Water use eYciency Range: 2.08–3.77 mmol mmol�1
(Ps/Tr) Top3(WUE): 3.71
Top 3(Ps): 2.67
Alamo: 3.6
Dark respiration (4 varieties at 3 sites) Range: 1.76–2.24 mmol m�2 s�1
3 Site average: 2.12
Alamo: 1.98
Seasonal PS Phenology Alamo: Photosynthesis
Stephensville, Texas, 1993 Early (May 18): 30.6 mmol m�2 s�1
Later (July 16): 18.1
Cave‐in‐rockEarly (May 18): 27
Later (July 16): 16.2
aThis is a projection of the yield potential of a field of plants all of which have the productive
potential of the best plant in this 0.40 ha unirrigated test plot with a 1.2 m � 1.2 m planting
density.
WUE, water use eYciency; Ps, photosynthesis; Tr, transpiration.
Source: Wullschleger et al. (1996a,b).AU:11
278 S. B. MCLAUGHLIN
Comp. by: bala Date:28/4/06 Time:17:13:50 Stage:First Proof File Path://Spsind002s/Production/PRODENV/0000000001/0000000860/0000000016/0000075788.3D Proof by: QC by: ProjectAcronym:bs:AGRON Volume:90007
UNCORRECTEDPROOF
remarkably similar, despite the diVerences in life strategy. Although both
have the eYcient C4 metabolism, the perennial life strategy of switchgrass
dictates that the species’ persistence rests strongly on energy storage and
mobilization from a much larger root system than the annual crop maize,
which invests half of annual dry matter accumulation in grain. Estimates of
the root mass of switchgrass from excavation studies at eight sites in the mid‐Atlantic region averaged 15.1 Mg ha�1 and ranged from 31% to 60% of the
total biomass above and below ground at harvest (Parrish et al., 2003).
Similar work with Alamo switchgrass roots sampled with soil coring at
final harvest in Texas showed that 30% and 37% of the total biomass were
in the roots in a wet year and 60% and 73% in a dry year (Kiniry et al., 1999).
III. PROJECTING SWITCHGRASSPERFORMANCE IN TIME AND SPACE
WITH THE ALMANAC MODEL
A. PHYSIOLOGICAL AND ECOLOGICAL TRAITS OF SWITCHGRASS
While physiological criteria have had limited utility in increasing maize
yields, the eVects of maize breeding for increased yield on physiological
traits indicate that such characteristics may be valuable in targeting
increased yield in future breeding eVorts when applied with the tools of
molecular biology (Tollenaar et al., 1994). As a C4 species, switchgrass
has high carbon fixation eYciency per unit of radiant energy absorbed. At
0.060 mol CO2 E�1, the quantum yield (moles of CO2 absorbed per micro-
mole) is only slightly below that of maize (0.062 mol CO2 E�1) (Ehleringer
and Pearcy, 1983). Additional physiological characterization of switchgrass
has been obtained from measurements within a switchgrass germplasm
nursery near Stillwater, Oklahoma (Table III). Measurements included
characterization of leaf level exchange of CO2 and H2O, and seasonal
changes in rates of photosynthesis. From such measurements, it was deter-
mined that there was high intraspecific variability in physiological character-
istics of switchgrass cultivars and both the highest photosynthetic rates
and water use eYciencies were clearly associated with highest yields among
the 45 varieties tested. Additional traits of switchgrass that are considered
by the ALMANAC model (Kiniry et al., 1996) in estimating switchgrass
yield potential include canopy bioenergetics and developmental character-
istics, nutrient requirements at diVerent growth stages, and contributions to
soil quality (soil erosion, soil nutrient status, and soil carbon status). These
traits influence total carbon fixation and production potential, life cycle
PROJECTING YIELD AND UTILIZATION OF SWITCHGRASS 279
Comp. by: bala Date:28/4/06 Time:17:13:51 Stage:First Proof File Path://Spsind002s/Production/PRODENV/0000000001/0000000860/0000000016/0000075788.3D Proof by: QC by: ProjectAcronym:bs:AGRON Volume:90007
UNCORRECTEDPROOF
energetics, production economics, and potential environmental benefits
from switchgrass production as a biofuel.
The high investment by switchgrass and other perennial species in root
biomass for storage and recovery of nutrients, diverting fixed carbon from
harvestable aboveground biomass, represents an important agronomic
benefit of these species. It leads to lower requirements for supplemental
water and nutrients and hence more stable and cost‐eVective yields. In
addition, the high root turnover in the soil can increase soil organic carbon,
which improves soil quality, and both soil and water conservation (Garten
and Wullschleger, 2000; McLaughlin and Walsh, 1998). Ultimately, optimi-
zation of switchgrass production to balance the mixture of resource use
eYciency, total energy and bioproduct recovery, production economics,
and fuel quality should be important components of an implementation
strategy for utilization of cellulosic crops in bioenergy and bioproduct
production.
B. PARAMETRIZATION OF THE ALMANAC MODEL
ALMANAC is a physiologically based crop production model designed
to quantify key plant–environment interactions that influence productivity
and resource use by a wide variety of agricultural crops (Kiniry et al., 1992).
Parametrization of ALMANAC for estimating switchgrass productivity was
based on previous work with Alamo switchgrass at several sites in Texas
(Kiniry et al., 1996). Work at locations outside of Texas involved developing
appropriate soil parameters to characterize water and nutrient supply po-
tential of each location, and working with the degree days to maturity and
the potential leaf area index (LAI) to provide realistic simulations of growth
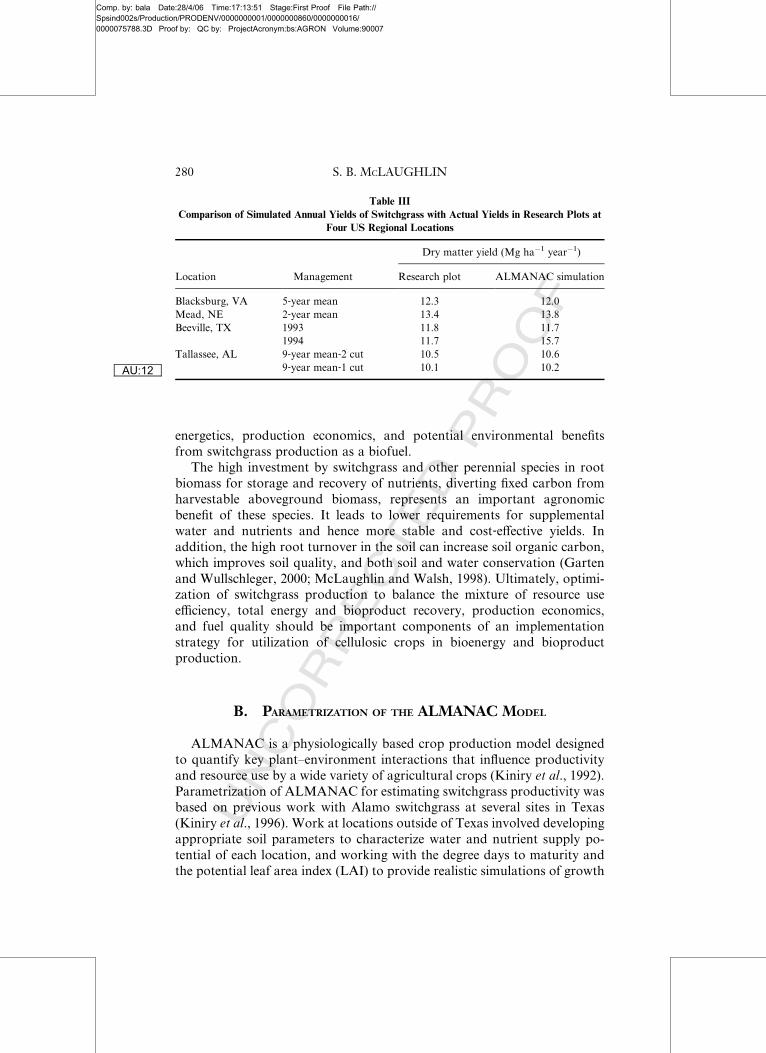
Table III
Comparison of Simulated Annual Yields of Switchgrass with Actual Yields in Research Plots at
Four US Regional Locations
Location Management
Dry matter yield (Mg ha�1 year�1)
Research plot ALMANAC simulation
Blacksburg, VA 5‐year mean 12.3 12.0
Mead, NE 2‐year mean 13.4 13.8
Beeville, TX 1993 11.8 11.7
1994 11.7 15.7
Tallassee, AL 9‐year mean‐2 cut 10.5 10.6
9‐year mean‐1 cut 10.1 10.2AU:12
280 S. B. MCLAUGHLIN
Comp. by: bala Date:28/4/06 Time:17:13:51 Stage:First Proof File Path://Spsind002s/Production/PRODENV/0000000001/0000000860/0000000016/0000075788.3D Proof by: QC by: ProjectAcronym:bs:AGRON Volume:90007
UNCORRECTEDPROOF
rates and growth dynamics. The model simulates the soil water balance,
which requires realistic values for soil depth, soil water–holding capacity,
and runoV curve number. Water availability for plant growth is simulated as
a function of plant demand, atmospheric demand, rainfall input, and soil
water drainage from the upper soil layers. Dry matter production is
simulated with light interception using the Beer’s law (Monsi and Saeki,
1953) and daily predictions of LAI. A realistic value for potential LAI is
needed for each site. Stresses, such as drought or nutrient deficiency, can
reduce LAI and biomass in the model.
For analyses in this chapter, ALMANAC was used to check assumptions,
concerning current and potential yields of switchgrass across regions for
which biocellulosic energy supply estimates were of interest. Four repre-
sentative US locations were selected from a region‐wide network of test
locations for switchgrass productivity (McLaughlin and Kszos, 2005) with
the idea of using published switchgrass yields to calibrate simulated yields
before extending simulations across broader regions. These sites and respon-
sible investigators were Beeville, TX (Bill Occumpaugh), the E.V. Smith site
research stations near Tallassee, AL (David Bransby), an eastern Nebraska
site near Nickerson, NE (Ken Vogel), and Blacksburg, VA (David Parrish).
Plant parameters used in these simulations included RUE and light
extinction coeYcient (k) for Beer’s Law. The RUE was 4.7 g MJ�1 inter-
cepted PAR and the k was �0.33 for all locations. These values were derived
from field measurements at Temple, TX (Kiniry et al., 1999). We assumed
the potential LAI was near 6.0 for the longer growing season locations and
about half as large for the shortest growing season, driest location. Potential
LAI was 5.8 for three of the locations and 2.7 for Mead, NE. The base
temperature for calculation of growing degree days was 12�C, with an
optimum of 25�C (Van Esbroeck, 1996). Values for degree days to maturity
were calculated using the actual weather data for the sites. The values for
degree days to maturity each year were 2600 in Alabama and Texas, 1400 in
Nebraska, and 1100 in Virginia.
C. SIMULATED YIELDS FROM ALMANAC VERSUS ACTUAL
YIELDS WITHIN THE REGION
Working with USDA‐NRCS soils data and NOAA weather data, we
were able to simulate switchgrass yields for these four locations. When
compared with available measured Alamo switchgrass yields, ALMANAC
yield simulations were found to be in good agreement with yields attained in
field test plots at these four locations (Table III).
Switchgrass yield potential was simulated with ALMANAC in this proj-
ect to both estimate upper yield limits in the field under nonlimiting water
AU:2,3
PROJECTING YIELD AND UTILIZATION OF SWITCHGRASS 281
Comp. by: bala Date:28/4/06 Time:17:13:51 Stage:First Proof File Path://Spsind002s/Production/PRODENV/0000000001/0000000860/0000000016/0000075788.3D Proof by: QC by: ProjectAcronym:bs:AGRON Volume:90007
UNCORRECTEDPROOF
and nutrient supply and to provide estimates of time‐averaged regional
yields that considered both temporal variability in climate and spatial
variability in soils within regions. Simulated upper limit yields under
field conditions with water and nutrient limitations removed were in the
range of 50 Mg ha�1 year�1 (results not shown), very similar to the scaled
maximum plant yield observed in the Tennessee clonal nursery (Table II).
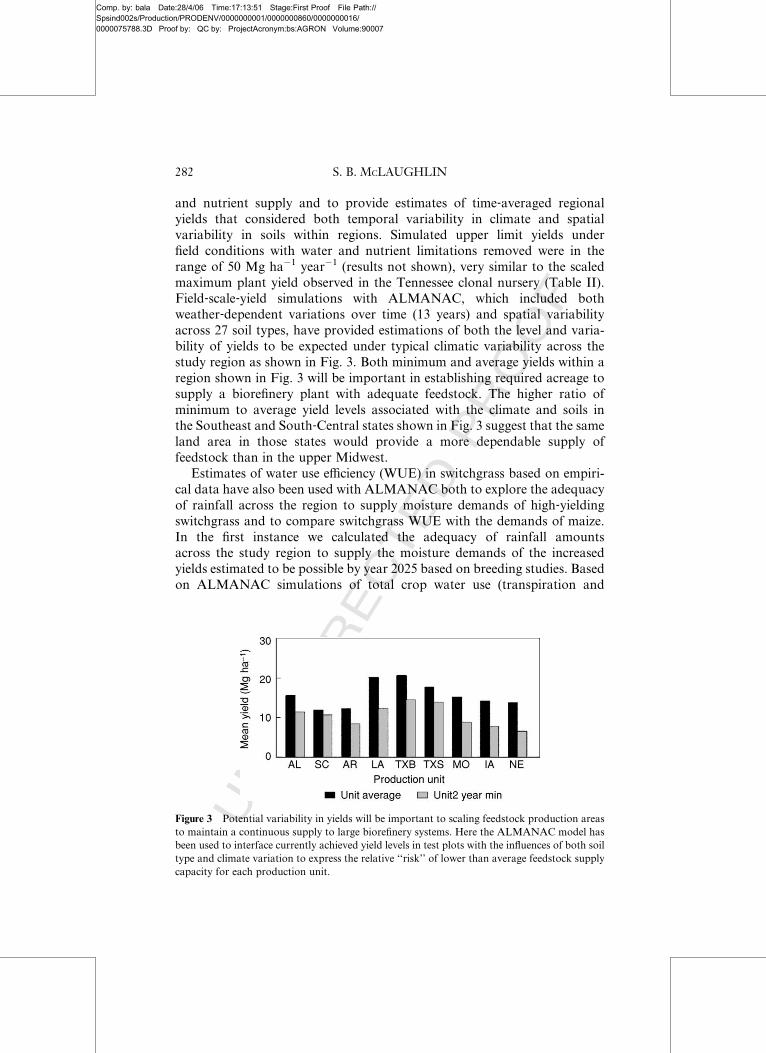
Field‐scale‐yield simulations with ALMANAC, which included both
weather‐dependent variations over time (13 years) and spatial variability
across 27 soil types, have provided estimations of both the level and varia-
bility of yields to be expected under typical climatic variability across the
study region as shown in Fig. 3. Both minimum and average yields within a
region shown in Fig. 3 will be important in establishing required acreage to
supply a biorefinery plant with adequate feedstock. The higher ratio of
minimum to average yield levels associated with the climate and soils in
the Southeast and South‐Central states shown in Fig. 3 suggest that the same
land area in those states would provide a more dependable supply of
feedstock than in the upper Midwest.
Estimates of water use eYciency (WUE) in switchgrass based on empiri-
cal data have also been used with ALMANAC both to explore the adequacy
of rainfall across the region to supply moisture demands of high‐yieldingswitchgrass and to compare switchgrass WUE with the demands of maize.
In the first instance we calculated the adequacy of rainfall amounts
across the study region to supply the moisture demands of the increased
yields estimated to be possible by year 2025 based on breeding studies. Based
on ALMANAC simulations of total crop water use (transpiration and
Figure 3 Potential variability in yields will be important to scaling feedstock production areas
to maintain a continuous supply to large biorefinery systems. Here the ALMANAC model has
been used to interface currently achieved yield levels in test plots with the influences of both soil
type and climate variation to express the relative ‘‘risk’’ of lower than average feedstock supply
capacity for each production unit.
282 S. B. MCLAUGHLIN
Comp. by: bala Date:28/4/06 Time:17:13:51 Stage:First Proof File Path://Spsind002s/Production/PRODENV/0000000001/0000000860/0000000016/0000075788.3D Proof by: QC by: ProjectAcronym:bs:AGRON Volume:90007
UNCORRECTEDPROOF
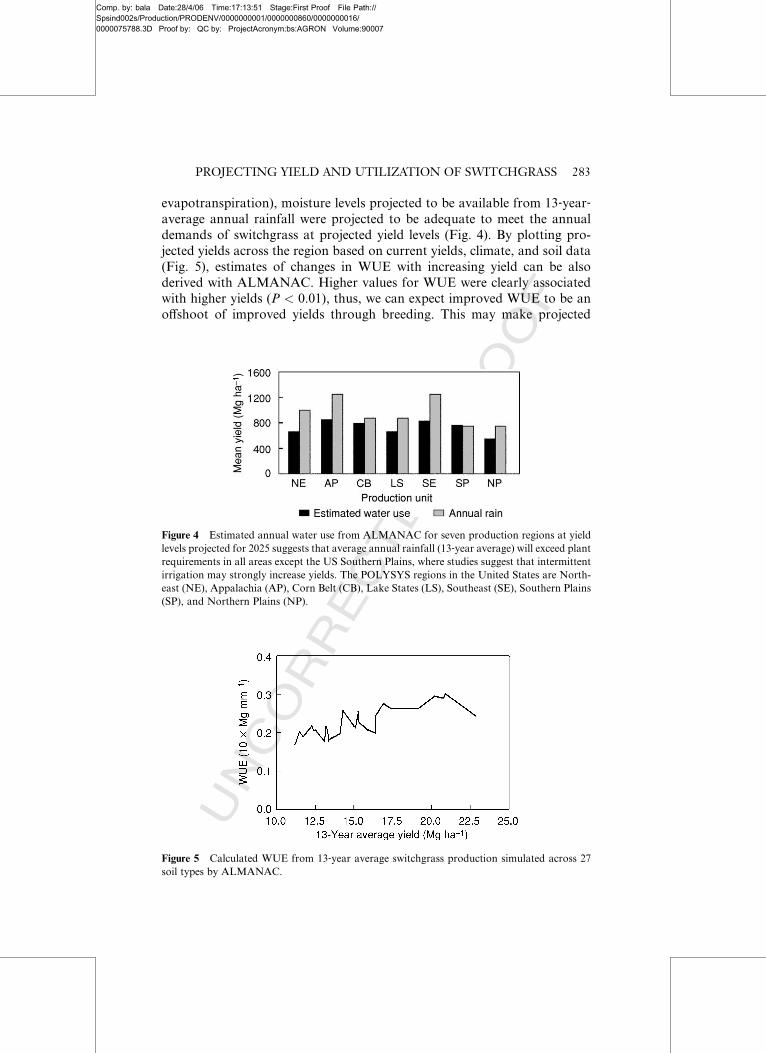
evapotranspiration), moisture levels projected to be available from 13‐year‐average annual rainfall were projected to be adequate to meet the annual
demands of switchgrass at projected yield levels (Fig. 4). By plotting pro-
jected yields across the region based on current yields, climate, and soil data
(Fig. 5), estimates of changes in WUE with increasing yield can be also
derived with ALMANAC. Higher values for WUE were clearly associated
with higher yields (P < 0.01), thus, we can expect improved WUE to be an
oVshoot of improved yields through breeding. This may make projected
Figure 4 Estimated annual water use from ALMANAC for seven production regions at yield
levels projected for 2025 suggests that average annual rainfall (13‐year average) will exceed plant
requirements in all areas except the US Southern Plains, where studies suggest that intermittent
irrigation may strongly increase yields. The POLYSYS regions in the United States are North-
east (NE), Appalachia (AP), Corn Belt (CB), Lake States (LS), Southeast (SE), Southern Plains
(SP), and Northern Plains (NP).
Figure 5 Calculated WUE from 13‐year average switchgrass production simulated across 27
soil types by ALMANAC.
PROJECTING YIELD AND UTILIZATION OF SWITCHGRASS 283

Comp. by: bala Date:28/4/06 Time:17:13:52 Stage:First Proof File Path://Spsind002s/Production/PRODENV/0000000001/0000000860/0000000016/0000075788.3D Proof by: QC by: ProjectAcronym:bs:AGRON Volume:90007
UNCORRECTEDPROOF
water demand (Fig. 4) somewhat less than we assumed. Such simulations
will require additional field data for validation but are compatible with
physiological measurements of switchgrass under field conditions in a breed-
ing nursery (Table III).
In a second application of ALMANAC’s projections of WUE, we com-
pared the relative water use of switchgrass and maize. Across all regions, the
WUE ratio of switchgrass to maize was 40% higher on a biomass production
basis and over 300% higher on the basis of biomass production for bioenergy
(grain only for maize). In this application we have contrasted total crop
water used by both cropping systems across 27 soil types, 13 years, and 9 test
regions. We compared WUE calculated both in terms of whole plant yield
and on the basis of biomass actually used in energy conversion (Fig. 6). In
the primary maize production regions of the Midwest, WUE expressed as
total biomass production per unit of water used for maize and switchgrass is
highly influenced by soil type, but these WUE values for the two species were
similar overall. As one moves outside this region, however, the relative WUE
is much higher for switchgrass than for maize. However, the grain is typical-
ly the only plant part of maize used for ethanol production. Because maize
grain is only about half of the total aboveground biomass, maize grain WUE
necessarily is less favorable relative to switchgrass.
Finally, switchgrass yield estimates with ALMANAC have been used in
providing important validation of yield assumptions in the region with an
econometric model, POLYSYS (Ugarte and Ray, 2000). The POLYSYS
Figure 6 Relationship between price oVered to farmers for switchgrass and total switchgrass
production at 10 and 20 years after an aggressive breeding program is projected to begin.
The increase in total production in 2025 is due to rather modest increase in average yield of
4.48 Mg ha�1 year�1 (from 11.4 to 15.9 Mg ha�1 year�1 in 10 years).
284 S. B. MCLAUGHLIN
Comp. by: bala Date:28/4/06 Time:17:13:52 Stage:First Proof File Path://Spsind002s/Production/PRODENV/0000000001/0000000860/0000000016/0000075788.3D Proof by: QC by: ProjectAcronym:bs:AGRON Volume:90007
UNCORRECTEDPROOF
model was used to evaluate the potential eVects of yield and price of
switchgrass on the US agricultural economy as discussed later.
IV. ASSESSING ECONOMIC IMPACTS OFWIDESPREAD DEPLOYMENT OF SWITCHGRASS
IN A NATIONAL BIOENERGY PROGRAM
Regional analyses of the economic impacts of widespread utilization of a
bioenergy crop have been assessed with POLYSYS, an econometric model
developed for evaluating regional crop production economics (Ugarte and
Ray, 2000). The POLYSYS model incorporates crop production data across
305 agricultural districts within the eastern two‐thirds of the United States
for which USDA baseline crop production data are available. The model
integrates data on crop yields, production costs, and sale prices to evaluate
relative profitability and market penetration. Such information is important
for policy analysis but can also reveal important information about relation-
ships among price, yield, demand, and production demographics. The
POLYSYS analyses indicated that average yields of a crop like switchgrass,
which will likely be grown on marginal lands, will be influenced by the
price paid for switchgrass (McLaughlin et al., 2002). Average US switch-
grass yield was predicted to decrease from 11 to 9.0 Mg ha�1 year�1 as the
farm gate price increased from $30.3 Mg�1 and 3.1 million ha of supply area
to $52.37 Mg�1 and 21 million ha of production (McLaughlin et al., 2002).
This eVect results from the influence of price on the minimum site quality
on which the crop can be profitably grown and, hence, the minimum yield
that will be economically viable in the induced supply stream. To project
future yields of switchgrass we have assumed that, like maize, a steady rate
of yield improvement of base yield levels can be maintained over multiple
decades with a sustained and vigorous breeding program. Based on 3–5%
per year gain demonstrated for some upland switchgrass varieties in the
Midwest (Taliaferro, 2002) and the 7.5% per year gain for lowland varieties
realized in a single study in the southeastern United States (Bouton, 2002),
we estimated three average rates of improvement of baseline yield levels: one
for upland varieties best adapted to the cooler, shorter growing season of the
Northern Plains and Lake States (1.5% gain per year above baseline); an
intermediate rate of 3% per year for the Cornbelt with intermediate condi-
tions; and the highest rates (5% per year for lowland varieties grown in the
southeastern United States). These improvement rates represent the mid to
upper range of improvement for commercial varieties based on past breeding
research (McLaughlin and Kszos, 2005).
PROJECTING YIELD AND UTILIZATION OF SWITCHGRASS 285
Comp. by: bala Date:28/4/06 Time:17:13:52 Stage:First Proof File Path://Spsind002s/Production/PRODENV/0000000001/0000000860/0000000016/0000075788.3D Proof by: QC by: ProjectAcronym:bs:AGRON Volume:90007
UNCORRECTEDPROOF
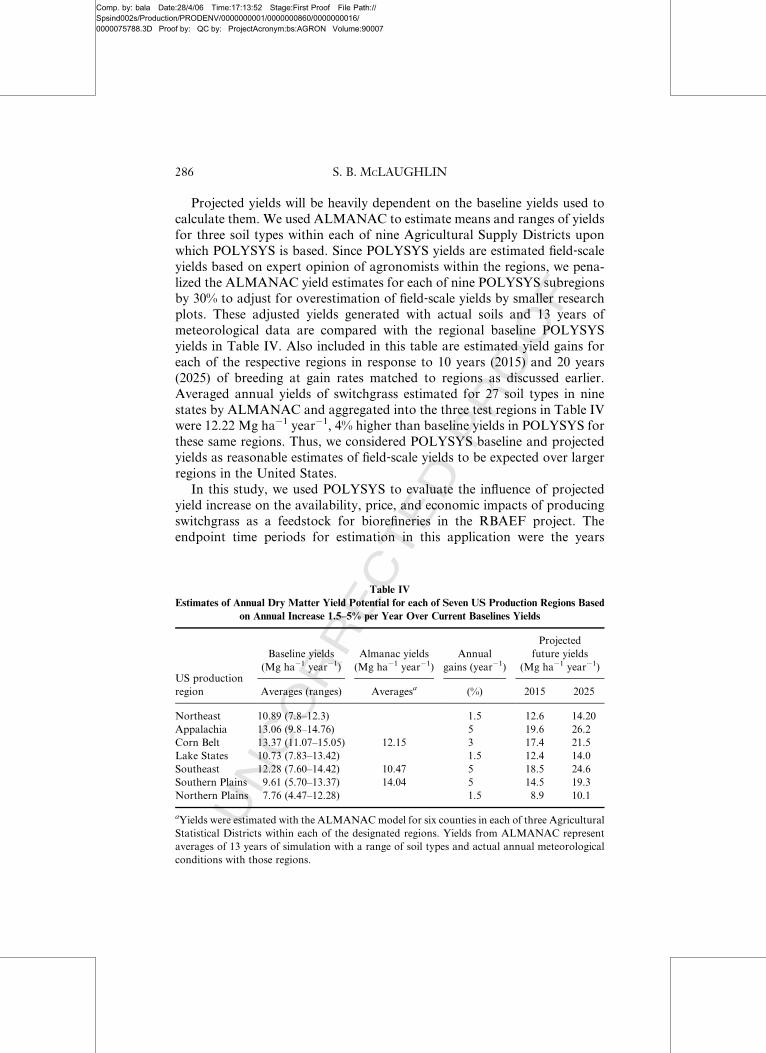
Projected yields will be heavily dependent on the baseline yields used to
calculate them. We used ALMANAC to estimate means and ranges of yields
for three soil types within each of nine Agricultural Supply Districts upon
which POLYSYS is based. Since POLYSYS yields are estimated field‐scaleyields based on expert opinion of agronomists within the regions, we pena-
lized the ALMANAC yield estimates for each of nine POLYSYS subregions
by 30% to adjust for overestimation of field‐scale yields by smaller research
plots. These adjusted yields generated with actual soils and 13 years of
meteorological data are compared with the regional baseline POLYSYS
yields in Table IV. Also included in this table are estimated yield gains for
each of the respective regions in response to 10 years (2015) and 20 years
(2025) of breeding at gain rates matched to regions as discussed earlier.
Averaged annual yields of switchgrass estimated for 27 soil types in nine
states by ALMANAC and aggregated into the three test regions in Table IV
were 12.22 Mg ha�1 year�1, 4% higher than baseline yields in POLYSYS for
these same regions. Thus, we considered POLYSYS baseline and projected
yields as reasonable estimates of field‐scale yields to be expected over larger
regions in the United States.
In this study, we used POLYSYS to evaluate the influence of projected
yield increase on the availability, price, and economic impacts of producing
switchgrass as a feedstock for biorefineries in the RBAEF project. The
endpoint time periods for estimation in this application were the years
Table IV
Estimates of Annual Dry Matter Yield Potential for each of Seven US Production Regions Based
on Annual Increase 1.5–5% per Year Over Current Baselines Yields
US production
region
Baseline yields
(Mg ha�1 year�1)
Almanac yields
(Mg ha�1 year�1)
Annual
gains (year�1)
Projected
future yields
(Mg ha�1 year�1)
Averages (ranges) Averagesa (%) 2015 2025
Northeast 10.89 (7.8–12.3) 1.5 12.6 14.20
Appalachia 13.06 (9.8–14.76) 5 19.6 26.2
Corn Belt 13.37 (11.07–15.05) 12.15 3 17.4 21.5
Lake States 10.73 (7.83–13.42) 1.5 12.4 14.0
Southeast 12.28 (7.60–14.42) 10.47 5 18.5 24.6
Southern Plains 9.61 (5.70–13.37) 14.04 5 14.5 19.3
Northern Plains 7.76 (4.47–12.28) 1.5 8.9 10.1
aYields were estimated with the ALMANACmodel for six counties in each of three Agricultural
Statistical Districts within each of the designated regions. Yields from ALMANAC represent
averages of 13 years of simulation with a range of soil types and actual annual meteorological
conditions with those regions.
286 S. B. MCLAUGHLIN
Comp. by: bala Date:28/4/06 Time:17:13:52 Stage:First Proof File Path://Spsind002s/Production/PRODENV/0000000001/0000000860/0000000016/0000075788.3D Proof by: QC by: ProjectAcronym:bs:AGRON Volume:90007
UNCORRECTEDPROOF
2013 and 2025. The 2013 estimation provided a 10‐year maximum forward
projection from a 2003 USDA forecasting baseline available at the time
these analyses began (i.e., the initiation year was 2004). Yield gains during
this time period were at the rate specified in Table IV. The second projection
endpoint, 2025, required extension beyond the USDA forecasts. For this
application, the USDA forecasting framework was fixed at 2013 levels and
dynamic factors were rates of yield gain (constant increase per year at 2013
levels) and prices oVered for switchgrass. Agricultural policy changes were
restricted to assumptions about allowable export markets (constant or vari-
able) and associated crop prices influenced by supply and demand. Annual
rates of yield gain through breeding (Table IV) were considered to extend for
a total of 22 years from the 2003 baseline for this application. With the
POLYSYS model we combined anticipated rates of yield increase with a
range of projected feedstock prices. Outputs from these simulations included
total area on which switchgrass would likely be grown based on its relative
profitability to farmers compared to conventional crops within each produc-
tion region; the average yields and total production of switchgrass on these
areas; changes in net returns to agriculture from switchgrass and other
crops; and finally, reductions in government price support needed as a result
of improved prices and farm income.
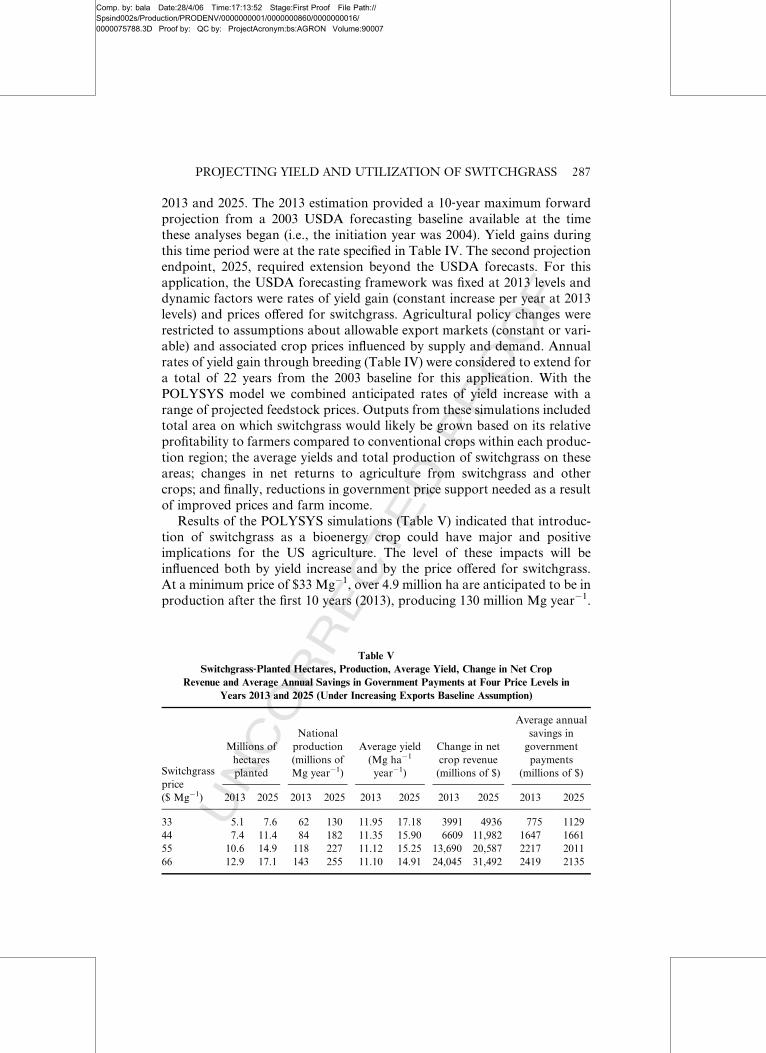
Results of the POLYSYS simulations (Table V) indicated that introduc-
tion of switchgrass as a bioenergy crop could have major and positive
implications for the US agriculture. The level of these impacts will be
influenced both by yield increase and by the price oVered for switchgrass.
At a minimum price of $33 Mg�1, over 4.9 million ha are anticipated to be in
production after the first 10 years (2013), producing 130 million Mg year�1.
Table V
Switchgrass‐Planted Hectares, Production, Average Yield, Change in Net Crop
Revenue and Average Annual Savings in Government Payments at Four Price Levels in
Years 2013 and 2025 (Under Increasing Exports Baseline Assumption)
Switchgrass
price
($ Mg�1)
Millions of
hectares
planted
National
production
(millions of
Mg year�1)
Average yield
(Mg ha�1
year�1)
Change in net
crop revenue
(millions of $)
Average annual
savings in
government
payments
(millions of $)
2013 2025 2013 2025 2013 2025 2013 2025 2013 2025
33 5.1 7.6 62 130 11.95 17.18 3991 4936 775 1129
44 7.4 11.4 84 182 11.35 15.90 6609 11,982 1647 1661
55 10.6 14.9 118 227 11.12 15.25 13,690 20,587 2217 2011
66 12.9 17.1 143 255 11.10 14.91 24,045 31,492 2419 2135
PROJECTING YIELD AND UTILIZATION OF SWITCHGRASS 287
Comp. by: bala Date:28/4/06 Time:17:13:52 Stage:First Proof File Path://Spsind002s/Production/PRODENV/0000000001/0000000860/0000000016/0000075788.3D Proof by: QC by: ProjectAcronym:bs:AGRON Volume:90007
UNCORRECTEDPROOF
At $66 Mg�1 these figures more than double in 2013 and more than triple by
2025. Net farm income increases dramatically due to both improved profit-
ability derived from substituting switchgrass for less productive crops as well
as improved prices for other crops. The range in this projected eVect is from$3.99 billion at $33 Mg�1 in 2013 to $32.5 billion at $66 Mg�1 in 2025.
Combined with and resulting from improved farm income are substantial
reductions in the need for government subsidy payments. The magnitude
of these reductions prorated to the quantity of switchgrass produced is on
the order of $8.26 Mg�1 of switchgrass produced. Total benefits to agricul-
ture of switchgrass produced under this scenario would be $123 Mg�1 or
nearly twice the price oVered for switchgrass as a bioenergy feedstock at the
$66 Mg�1 level in 2025.
The relative eVectiveness of price and yield on farm profitability are of
particular interest relative to the emphasis of this paper on breeding poten-
tial of switchgrass. Yields attained by 2013 and 2025 in Table V are lower
than the projected yields based on breeding progress in Table IV. This is
because POLYSY is a dynamic modeling tool that incorporates new and
improved seed at the time when demand develops and fields planted to those
seed sources remain in production for 10 years before they are planted to
newer seed sources that become available later. Thus, the innate yield
potential of fields in production in 2013 will be an aggregate of seed sources
planted from 1 to 10 years earlier.
Increasing yields through breeding as well as increasing the price oVeredto farmers for switchgrass can have dramatic eVects on total switchgrass
production (Fig. 6). Because of the dynamic nature of switchgrass introduc-
tion into the marketplace discussed earlier, average switchgrass yields are
projected to be only marginally improved by 2013. The geometric average
yield across regions in the baseline condition in Table IV was 11.33 Mg ha�1
year�1. For this application we reduced this baseline yield by 10% by
increasing the cutting height from 10 to 15 cm.1
By 2014 the average simulated yield varies between 11.10 and 11.95 Mg
ha�1 year�1, a 10% increase over baseline. By 2025 the gain is an additional
45% to 15.81 Mg ha�1 year�1. Projections of the eVects of an aggressive and
successful breeding program must consider the time it will take to incorpo-
rate genetically improved material into a large‐scale production system.
Because switchgrass takes 2–3 years to attain maximum yields after planting,
reestablishing a switchgrass field with an improved variety will reduce aver-
age yields over a 10‐year cycle by around 15% from levels that might have
been attained at full yield capacity for 10 years.
1This translates into a baseline yield of 10.20 Mg ha�1 year�1 after imposing the 10% harvest
penalty, resulting from increasing cutting height from 10 to 15 cm in the POLYSYS runs for this
application.
288 S. B. MCLAUGHLIN

Comp. by: bala Date:28/4/06 Time:17:13:53 Stage:First Proof File Path://Spsind002s/Production/PRODENV/0000000001/0000000860/0000000016/0000075788.3D Proof by: QC by: ProjectAcronym:bs:AGRON Volume:90007
UNCORRECTEDPROOF
The other major variable that will influence the rate of development of
biofuels supply systems is the regional variability in production potential, a
result of both land production capacity and regional economic factors which
favor specific crops. Based on regional variability in production potential for
the United States at ($44 Mg�1) in 2015 and 2025 (Figs. 7 and 8), potential
productivity within the eastern half for the United States varies from 0 to
over 4.5 million Mg within individual POLYSYS production units. Numer-
ous locations are already projected to be able to supply more than the 1.59
million Mg year�1 required to fuel a 4540 Mg day�1 biorefinery of the type
being proposed by the RBAEF project by 2013. This is based on a modest
fuel price of $40 dry Mg �1 and relatively small eVective increases in yield
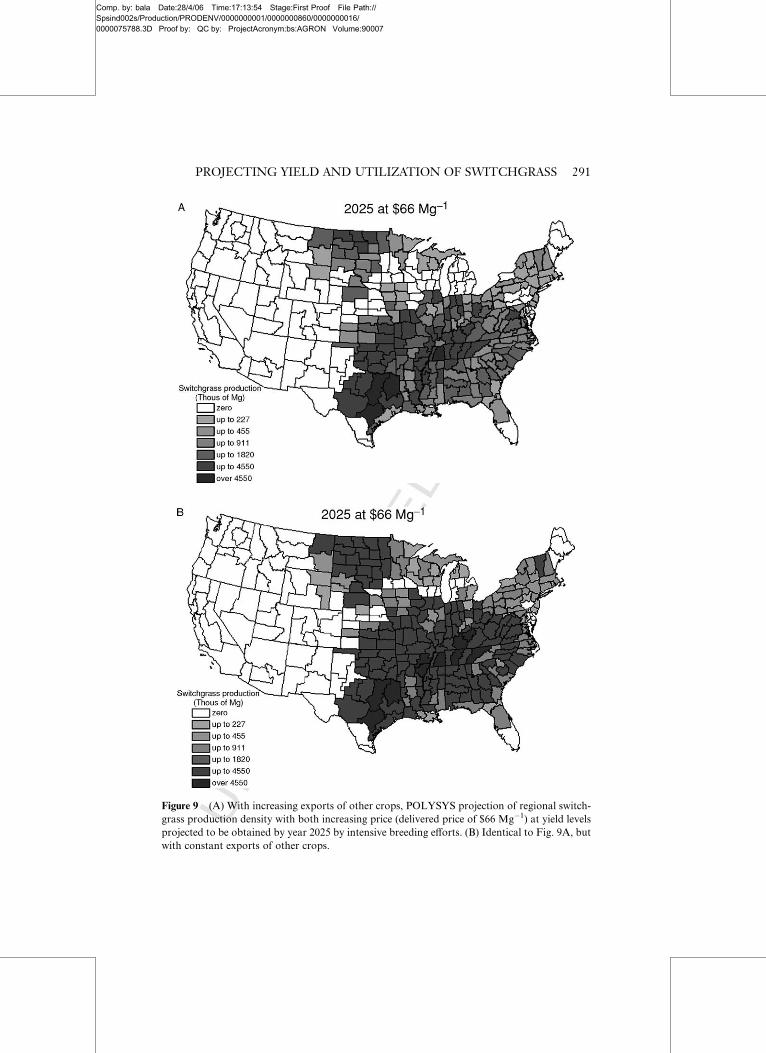
potential over present levels. In Fig. 9A and B the combined eVects of
projected yield increases to 2025, increasing the delivered price of switch-
grass to $66 Mg �1, and altering agricultural export policy are considered.
Combined price and yield increase in 2025 would significantly increase the
production density of switchgrass (Fig. 8 vs Fig. 9A) and the total produc-
tion by approximately threefolds (see also Fig. 6). In addition, changes in
crop export limits posed on conventional crops with which switchgrass
would compete for land can also influence switchgrass production levels.
Figure 7 For year 2013, projected switchgrass production density at a delivered price of
$44 Mg�1 at projected yield levels using POLYSYS simulations of market penetration. Export
levels of other crops are allowed to increase as switchgrass production increases.
PROJECTING YIELD AND UTILIZATION OF SWITCHGRASS 289
Comp. by: bala Date:28/4/06 Time:17:13:53 Stage:First Proof File Path://Spsind002s/Production/PRODENV/0000000001/0000000860/0000000016/0000075788.3D Proof by: QC by: ProjectAcronym:bs:AGRON Volume:90007
UNCORRECTEDPROOF
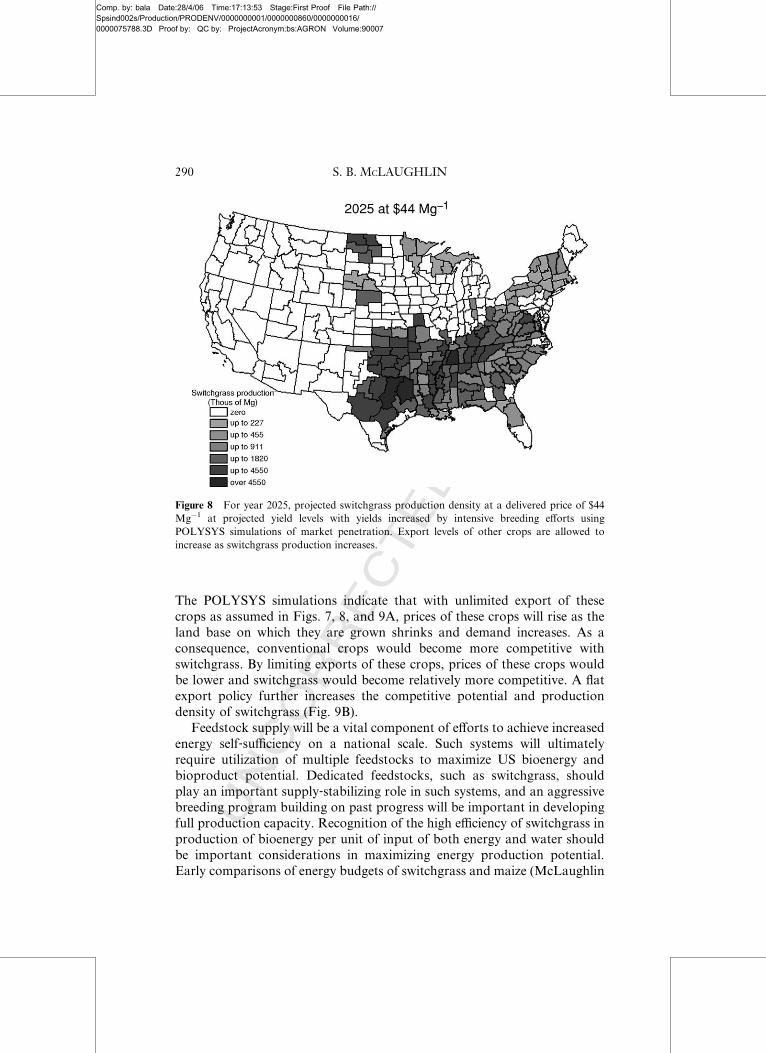
The POLYSYS simulations indicate that with unlimited export of these
crops as assumed in Figs. 7, 8, and 9A, prices of these crops will rise as the
land base on which they are grown shrinks and demand increases. As a
consequence, conventional crops would become more competitive with
switchgrass. By limiting exports of these crops, prices of these crops would
be lower and switchgrass would become relatively more competitive. A flat
export policy further increases the competitive potential and production
density of switchgrass (Fig. 9B).
Feedstock supply will be a vital component of eVorts to achieve increased
energy self‐suYciency on a national scale. Such systems will ultimately
require utilization of multiple feedstocks to maximize US bioenergy and
bioproduct potential. Dedicated feedstocks, such as switchgrass, should
play an important supply‐stabilizing role in such systems, and an aggressive
breeding program building on past progress will be important in developing
full production capacity. Recognition of the high eYciency of switchgrass in
production of bioenergy per unit of input of both energy and water should
be important considerations in maximizing energy production potential.
Early comparisons of energy budgets of switchgrass and maize (McLaughlin
Figure 8 For year 2025, projected switchgrass production density at a delivered price of $44
Mg�1 at projected yield levels with yields increased by intensive breeding eVorts using
POLYSYS simulations of market penetration. Export levels of other crops are allowed to
increase as switchgrass production increases.
290 S. B. MCLAUGHLIN
Comp. by: bala Date:28/4/06 Time:17:13:54 Stage:First Proof File Path://Spsind002s/Production/PRODENV/0000000001/0000000860/0000000016/0000075788.3D Proof by: QC by: ProjectAcronym:bs:AGRON Volume:90007
UNCORRECTEDPROOF
Figure 9 (A) With increasing exports of other crops, POLYSYS projection of regional switch-
grass production density with both increasing price (delivered price of $66 Mg�1) at yield levels
projected to be obtained by year 2025 by intensive breeding eVorts. (B) Identical to Fig. 9A, but
with constant exports of other crops.
PROJECTING YIELD AND UTILIZATION OF SWITCHGRASS 291
Comp. by: bala Date:28/4/06 Time:17:13:54 Stage:First Proof File Path://Spsind002s/Production/PRODENV/0000000001/0000000860/0000000016/0000075788.3D Proof by: QC by: ProjectAcronym:bs:AGRON Volume:90007
UNCORRECTEDPROOF
andWalsh, 1998) indicated that energy gains from producing and converting
switchgrass bioenergy to ethanol energy will be large (over threefold)
for switchgrass. The input energy to produce switchgrass is only about 8%
of the output energy in the biomass. With projected yield improvements
described here, we expect this input energy to decrease even further. In
addition, the favorable WUE of switchgrass should make it increasingly
attractive in maximizing energy output eYciency on a landscape level.
In the shorter term, strategic location of initial plants in regions with
high innate production potential using the best available varieties should
allow earlier initial deployment of commercial scale plants and testing of
economically viable feedstock supply systems.
V. CONCLUSIONS
Similarities in the physiology and early breeding success between maize
and switchgrass indicate that an aggressive breeding program similar to
that of maize could lead to a doubling of yield of the best lowland varieties
in 20–30 years to around 22 Mg ha�1 year�1 on areas of high production
potential. The ALMANAC model and the POLYSYS model were used to
make regional forecasts of the increase in switchgrass in regions having
conventional agricultural markets. These models simulated the total dry
tonnage of switchgrass production, the increase in farm income, and reduc-
tions in the level of government subsidies needed. Within 10 years of initiat-
ing intensive breeding eVorts, even at relatively lower switchgrass prices of
$44 Mg�1, significant increase in farm income ($24 billion) and government
subsidy reductions ($1.6 billion) are projected at yields only 10% higher than
current capacity. Significant opportunities would exist for locating the first
4540 Mg day�1 biorefinery even at this early stage. After 20 years of yield
improvement it is estimated that, at a price of $66 Mg�1, 254 million Mg of
switchgrass would be produced on more than 17 million ha of cropland on
which switchgrass would be more profitable than conventional crops. This
production is projected to increase net farm income by $31 billion and
reduce the need for government subsidies by $21 billion. An aggressive
switchgrass breeding program using modern breeding techniques, including
molecular biology, would provide significant economic gains to the nation as
it searches for avenues of greater energy self‐suYciency. The lag time for
incorporating the best new varieties into perennial grass agriculture systems
dictates that such eVorts should be initiated very early in the planning cycle
to maximize their eVects.Finally, the coupling of research results in basic physiology, breeding,
yield management, and modeling production demographics and economics
292 S. B. MCLAUGHLIN
Comp. by: bala Date:28/4/06 Time:17:13:55 Stage:First Proof File Path://Spsind002s/Production/PRODENV/0000000001/0000000860/0000000016/0000075788.3D Proof by: QC by: ProjectAcronym:bs:AGRON Volume:90007
UNCORRECTEDPROOF
described here has been most useful in feeding national energy policy analy-
sis in the RBAEF project. The results have contributed significantly to
RBAEF analyses and recommendations, several of which were included in
the Energy Policy Act (2005), and these results have important implications
for future agronomic research and development. On the one hand they
suggest that a large fraction of this nation’s transportation energy require-
ments could be met with bioenergy feedstock production on currently man-
aged lands with little or no additional land requirements. On the other hand
they suggest that it can be very useful to address significant policy issues
by coupling basic agronomic research with linked simulation models at
multiple scales.
ACKNOWLEDGMENTS
This research is part of a larger project entitled Role of Biomass in
America’s Energy Future (RBAEF). This larger project has been led by
Dr. Lee Lynd of Dartmouth College and represents a multi‐institutional,multidisciplinary eVort to provide credible forecasting of the extent to
which the United States could rely in the future on cellulosic fuels such as
switchgrass to reduce dependence on imported oil.
REFERENCES
Adams, W. E., and Stelly, M. (1958). A comparison of Coastal and common bermudagrass
(Cynodon dactylon (L) Pers.) in the Piedmont Region: I. Yield response to fertilization.
Agron. J. 50, 457–459.
Bouton, J. H. (2002). Bioenergy Crop Breeding and Production Research in the Southeast.
Final Report for 1996–2001. ORNL/SUB‐02–19XSV810C/01, Oak Ridge National labor-
atory, Oak Ridge, Tennessee.
Burton, G. W. (1947). Breeding bermuda grass for the southeastern United States. J. Am. Soc.
Agron. 39, 551–569.
Burton, G. W. (1954). Coastal bermuda grass Bull. N.S. 2. GA Agric. Exp. Stn., Athens.
Burton, G. W. (1982). Improved recurrent restricted phenotypic selection increases bahiagrass
forage yields. Crop Sci. 22, 1058–1061.
Burton, G. W. (1985). Spaced‐plant‐population‐progress test. Crop Sci. 25, 63–65.
Burton, G. W. (1992). Recurrent restricted phenotypic selection. Plant Breed. Rev. 9, 101–113.
Burton, G. W., andMullinix, B. G. (1998). Yield distributions of spaced plants within Pensacola
bahiagrass populations developed by recurrent restricted phenotypic selection. Crop Sci.
38, 333–336.
Carreker, J., Adams, W. E., Jackson, W. A., and Dawson, R. N. (1972). Management factors
aVecting Coastal bermudagrass yield and water use. J. Soil Water Conserv. 27, 14–17.
PROJECTING YIELD AND UTILIZATION OF SWITCHGRASS 293
Comp. by: bala Date:28/4/06 Time:17:13:55 Stage:First Proof File Path://Spsind002s/Production/PRODENV/0000000001/0000000860/0000000016/0000075788.3D Proof by: QC by: ProjectAcronym:bs:AGRON Volume:90007
UNCORRECTEDPROOF
Casler, M. D. (2001). Breeding forage crops for increased nutritional value. Adv. Agron. 71,
51–107.
Casler, M. D., Vogel, K. P., Balasko, J. A., Berdahl, J. D., Miller, D. A., Hansen, J. L., and
Fritz, J. O. (2000). Genetic progress from 50 years of smooth bromegrass breeding. Crop
Sci. 40, 13–22.
Conger, B. V., Denchev, P. D., and Alexandrova, K. S. (1996). Development of in vitro systems
for switchgrass (Panicum virgatum).1995 Annual Report to ORNL, Bioenergy Feedstock
Development Program.
Duvick, D. N. (1997). What is yield? In ‘‘Developing Drought Tolerant and Low N‐TolerantMaize’’ (G. O. Edmeades, et al., Eds.), pp. 332–335. Proc. Symp, March 25–29, CIMMYT,
El Batan, Mexico.
Duvick, D. N. (1999). Heterosis: Feeding people and protecting natural resources. In ‘‘Heterosis
in Crops,’’ Chapter 3, pp. 19–29. Proc. Intern. Symp. Genetics and Exploitation of
Heterosis in Crops.
Dwyer, L. M., Tollenaar, M., and Stewart, D. W. (1991). Changes in plant density dependence
of leaf photosynthesis of maize (Zea mays L.) hybrids, 1959 to 1988. Can. J. Plant Sci. 71,
1–11.
Dwyer, L. M., Stewart, D. W., and Tollenaar, M. (1992). Analysis of maize leaf photosynthesis
under drought stress. Can. J. Plant Sci. 72, 477–481.
Earl, H., and Tollenaar, M. (1998). DiVerences among commercial maize (Zea mays L.) hybrids
in respiration rates of mature leaves. Field Crops Res. 59, 9–19.
Escharte, L., and Andrade, F. H. (2003). Harvest index stability of Argentinean maize hybrids
released between 1965 and 1993. Field Crops Res. 82, 1–12.
Energy Policy Act. (2005). In Public Law 109‐58, passed by the U.S. Congress on July 29, 2005, .
Ehleringer, J. R., and Pearcy, R. W. (1983). Variation in quantum yields for CO2 uptake among
C3 and C4 plants. Plant Physiol. 73, 555–559.
Fasoulas, A. C., and Fasoula, V. A. (1995). Honeycomb selection designs. Plant Breed. Rev. 13,
87–139.
Fasoulas, A. C., and Fasoula, V. A. (2000). Honeycomb breeding: Principles and applications.
Plant Breed. Rev. 18, 177–250.
Fehr, W. R. (1987). ‘‘Principles of Cultivar Development.’’ Macmillan, New York.
Fischer, R. A., and Evans, L. T. (1999). Yield potential: Its definition, measurement, and
significance. Crop Sci. 39, 1544–1551.
Fischer, R. A., Rees, D., Sayre, K. D., Lu, Z.‐M, Condon, A. G., and Saavedra, A. L. (1998).
Wheat yields associated with higher stomatal conductance and photosynthetic rates and
cooler canopies. Crop. Sci. 38, 1467–1475.
Garten, C. T., Jr., and Wullschleger, S. D. (2000). Soil carbon dynamics beneath switchgrass as
indicated by stable isotope analysis. J. Environ. Qual. 29, 1–9.
Goodman, M. M., and Brown, W. L. (1988). Races of corn. In ‘‘Corn and Corn Improvement’’
(G. F. Sprague and J. W. Dudley, Eds.), pp. 33–79. American Society of Agronomy, Inc.,
Madison, Wisc..
Greene, N. (2004). Growing Energy. How Biofuels Can Help End America’s Oil Dependence.
(Natural Resources Defense Council available at http://www.nrdc.org/air/energy/biofuels/
contents.asp).
Hopkins, A. A., Vogel, K. P., and Moore, K. J. (1993). Predicted and realized gains from
selection for in vitro dry matter digestibiltity and forage yield in switchgrass. Crop Sci. 33,
253–258.
Kiniry, J. R., Williams, J. R., Gassman, P. W., and Debaeke, P. (1992). A general, process‐oriented model for two competing plant species. Trans. ASAE. 35, 801–810.
AU:4
AU:5
294 S. B. MCLAUGHLIN
Comp. by: bala Date:28/4/06 Time:17:13:55 Stage:First Proof File Path://Spsind002s/Production/PRODENV/0000000001/0000000860/0000000016/0000075788.3D Proof by: QC by: ProjectAcronym:bs:AGRON Volume:90007
UNCORRECTEDPROOF
Kiniry, J. R., Sanderson, M. A., Williams, J. R., Tischler, C. R., Hussey, M. A., Ocumpaugh,
W. R., Read, J. R., Van Esbroek, G. A., and Reed, R. R. (1996). Simulating Alamo
switchgrass with the ALMANAC model. Agron. J. 88, 602–606.
Kiniry, J. R., Tischler, C. R., and Van Esbroek, G. A. (1999). Radiation use eYciency and leaf
CO2 exchange for diverse C4 grasses. Biomass Bioenergy 17, 95–112.
Kiniry, J. R., Xie, Y., and Gerik, T. J. (2002). Similarity of maize seed number responses for a
diverse set of sites. Agronomie 22, 265–272.
Kiniry, J. R., Bean, B., Xie, Y., and Chen, Pei‐yu. (2004). Maize yield potential: Processes and
simulation modeling in a high‐yielding environment. Agric. Systems 82, 45–56.
Lindquist, J. L., Arkebauer, T. J., Walters, D. T., Cassman, K. G., and Dobermann, A. (2005).
Maize radiation use eYciency under optimal growth conditions. Agron. J. 97, 72–78.
Loomis, R. S., and Amthor, J. S. (1996). Limits of yield revisited. In ‘‘Increasing Yield Potential
in Wheat: Breaking the Barriers’’ (P. Reynolds, S. Rajaram, and A. McNab, Eds.),
pp. 76–89. Mexico, DF, CIMMYT.
Loomis, R. S., and Amthor, J. S. (1999). Yield potential, plant assimilatory capacity, and
metabolic eYciencies. Crop Sci. 39, 1584–1596.
McKay, A. D., and Barber, S. A. (1986). EVect of nitrogen on root growth of two corn
genotypes in the field. Agron. J. 78, 699–703.
McLaughlin, S. B., De La Torre Ugarte, D. G., Garten, C. T., Jr., Lynd, L. R., Sanderson,
M. A., Tolbert, V. R., and Wolf, D. D. (2002). High‐value renewable energy from prairie
grasses. Environ. Sci. Technol. 36, 2122–2129.
McLaughlin, S. B., and Kszos, L. A. (2005). Development of switchgrass (Panicum virgatum) as
a bioenergy feedstock in the United States. Biomass Bioenergy 28, 515–535.
McLaughlin, S. B., andWalsh, M. (1998). Evaluating environmental consequences of producing
herbaceous crops for bioenergy. Biomass Bioenergy 10, 1–8.
Monsi, M., and Saeki, T. (1953). Uber den lichtfaktor in den pflanzengesellschaften und seine
bedeutung fur die stoVproduktion. Jpn. J. Bot. 14, 22–52.
Newell, L. C., and Eberhart, S. A. (1961). Clone and progeny evaluation in the improvement of
switchgrass, Panicum virgatum L. Crop Sci. 1, 117–121.
Parrish, D. J., Wolf, D. D., Fike, J. H., and Daniels, W. L. (2003). Switchgrass as a biofuels
crop for the upper southeast: Variety trials and cultural improvements. Final report for
1997 to 2001. ORNL/SUB‐03–19SY163C/01. Oak Ridge National Laboratory, Oak Ridge,
Tennessee.
Pietsch, D., Synatschk, L., Bertran, J., and Foyt, F., III (1999). Corn performance tests in Texas.
Technical Report 99‐25. Texas Agricultural Experiment Station, College Station.
Pimmentel, D., Doughty, R., Carothers, S., Lamberson, S., Bora, N., and Lee, K. (2002).
Energy inputs in crop production: Comparison of developed and developing countries.
In ‘‘Food Security and Environmental Quality in the Developing World’’ (R. Lal, D.
Hansen, N. UphoV, and S. Slack, Eds.), pp. 129–151. CRC Press, Boca Raton, FL.
Rajcan, I., and Tollenaar, M. (1999). Source:Sink ratio and leaf senscence in maize: I. Dry
matter accumulation and partitioning during grain filling. Field Crops Res. 60, 245–253.
Shapouri, H., DuYeld, J. A., and Graboski, M. S. (1995). Estimating the Net Energy Balance of
Corn ethanol. Agric. Econ. Report No. 721 US Dept. of Agric., Econ. Res. Service, OYce
of Energy.
Sladden, S. E., Bransby, D. L., and Aiken, G. E. (1991). Biomass yield, composition, and
production costs for eight switchgrass varieties in Alabana. Biomass and Bioenergy 1,
119–122.
Steinauer, E. M., and Collins, S. L. (1996). In ‘‘Prairie Ecology‐The Tallgrass Prairie’’ (R. B.
Samson and F. L. Knopf, Eds.), pp. 39–52. Prairie Conservation: Island Press,
Washington, DC.
AU:6
PROJECTING YIELD AND UTILIZATION OF SWITCHGRASS 295
Comp. by: bala Date:28/4/06 Time:17:13:56 Stage:First Proof File Path://Spsind002s/Production/PRODENV/0000000001/0000000860/0000000016/0000075788.3D Proof by: QC by: ProjectAcronym:bs:AGRON Volume:90007
UNCORRECTEDPROOF
Talbert, L. E., Timothy, D. H., Burns, J. C., Rawlings, J. O., and Moll, R. H. (1983). Estimates
of genetic parameters in switchgrass. Crop Sci. 23, 725–728.
Taliaferro, C. M. (2002). Breeding and selection of new switchgrass varieties for increased
biomass production. ORNL Technical Report ORNL/SUB‐02–19XSY162C/01, 2002.
Taliaferro, C. M., Vogel, K. P., Bouton, J. H., McLaughlin, S. B., and Tuskan, G. A. (1999).
Reproductive characteristics and breeding improvement potential of switchgrass.
In ‘‘Proceedings of the 4th Biomass Conference of the Americas Biomass, A Growth
Opportunity in Green Energy and Value‐Added Products’’ (R. Overend and E. Chornet,
Eds.), pp. 147–153. Elsevier Sciences, Oxford, United Kingdom.
Tokatlidis, I. S. (2001). The eVect of improved potential yield per plant on crop yield potential
and optimum plant density in maize hybrids. J. Agric. Sci. 137, 299–305.
Tollenaar, M. (1983). Potential vegetative productivity in Canada. Can. J. Plant Sci. 63, 1–10.
Tollenaar, M. (1989). Genetic improvement in grain yield of commercial maize hybrids grown in
Ontario from 1959 to 1988. Crop Sci. 29, 1365–1371.
Tollenaar, M. (1992). Is low plant density a stress in maize? Maydica 37, 305–311.
Tollenaar, M., and Aguilera, A. (1992). Radiation use eYciency of an old and a new maize
hybrid. Agron. J. 84, 536–541.
Tollenaar, M., McCullough, D. E., and Dwyer, L. M. (1994). Physiological basis of the genetic
improvement of corn. In ‘‘Genetic Improvement of Field Crops’’ (G. A. Shafer, Ed.),
pp. 183–236. Marcel Dekker, New York.
Tollenaar, M., and Wu, J. (1999). Yield improvement in temperate maize is attributable to
greater stress tolerance. Crop. Sci. 39, 1597–1604.
Tollenaar, M., and Lee, E. A. (2002). Yield potential, yield stability, and stress tolerance in
maize. Field Crops Res. 75, 161–169.
Ugarte, D. G. D., and Ray, D. E. (2000). Biomass and bioenergy applications of the POLYSYS
modeling framework. Biomass Bioenergy 18, 291–308.
Van Esbroeck, G. A. (1996). Genetic control of switchgrass growth and development. (Ph.D.
Dissertation). Texas A&M University.
Vogel, K. P., Dewald, C. I., Gorz, H. J., and Haskins, F. A. (1985). Development of switchgrass,
indiangrass, and eastern gamagrass: Current status and future. Range improvement in
Western North America. Proceedings Range Management, Salt Lake City, Utah, February
14, 1985, pp. 51–62.
Vogel, K. P., Haskins, F. A., and Gorz, H. J. (1981). Divergent selection for in vitro dry matter
digestibility in switchgrass. Crop Sci. 21, 39–41.
Vogel, K. P. (2000). Improving warm‐season grasses using selection, breeding, and biotech-
nology. In ‘‘Native Warm‐Season Grasses: Research Trends and Issues’’ (K. J. Moore and
B. Anderson, Eds.), pp. 83–106.
Vogel, K. P. (2004). Switchgrass. In ‘‘Warm‐Season Grasses’’ (L. E. Moser, L. Sollenberger, and
B. Burson, Eds.). ASA‐CSSA‐SSSA Monograph, Madison, WI (in press).
Wilkins, P. W., and Humphreys, M. O. (2003). Progress in breeding perennial forage grasses
for temperate agriculture. J. Agric. Sci. 140, 129–150.
AU:7
AU:8
296 S. B. MCLAUGHLIN

Comp. by: bala Date:28/4/06 Time:17:13:56 Stage:First Proof File Path://Spsind002s/Production/PRODENV/0000000001/0000000860/0000000016/0000075788.3D Proof by: QC by: ProjectAcronym:bs:AGRON Volume:90007
Author Query Form
Journal: Advances In Agronomy
Volume No. 90, Chapter No.: 7
_____________________________________________________Dear Author,
During the preparation of your manuscript for typesetting some questions have arisen.These are listed below. Please check your typeset proof carefully and mark anycorrections in the margin of the proof or compile them as a separate list. This formshould then be returned with your marked proof/list of corrections to Elsevier Science.
Disk use
In some instances we may be unable to process the electronic file of your article and/orartwork. In that case we have, for efficiency reasons, proceeded by using the hard copyof your manuscript. If this is the case the reasons are indicated below:
¨ Disk damaged ¨ Incompatible file format ¨ LaTeX file for non-LaTeX journal
¨ Virus infected ¨ Discrepancies between electronic file and (peer-reviewed,therefore definitive) hard copy.
¨ Other: ...................................................
We have proceeded as follows:
¨ Manuscript scanned ¨ Manuscript keyed in ¨ Artwork scanned
¨ Files only partly used (parts processed differently:.......................................................)
Bibliography
If discrepancies were noted between the literature list and the text references, thefollowing may apply:
¨ The references listed below were noted in the text but appear to be missing from yourliterature list. Please complete the list or remove the references from the text.
¨ Uncited references: This section comprises references which occur in the referencelist but not in the body of the text. Please position each reference in the text or,alternatively, delete it. Any reference not dealt with will be retained in this section.
Query Refs. Details Required Author’s response
AU1 As per the reference list thereare two authors Goodman andBrown, 1988. So we have fol-lowed the reference list andmade the change. Kindly checkthe change for accuracy.
AU2 Please define the acronyms ifnecessary.
AU3 Please define the acronyms ifnecessary.
AU4 Please provide rest of the editornames instead of et al.
AU5 Kindly check the change madein the name of the author as perthe citation in the text.
AU6 As the complete information isprovided in the reference wehave deleted "in press". Pleasecheck the deletion.
Comp. by: bala Date:28/4/06 Time:17:13:56 Stage:First Proof File Path://Spsind002s/Production/PRODENV/0000000001/0000000860/0000000016/0000075788.3D Proof by: QC by: ProjectAcronym:bs:AGRON Volume:90007
AU7 Please provide the publishername and location.
AU8 Please update the status of thisreference.
AU9 Not cited in reference list.
AU10 Please check the insertion ofthis information from the figurein the figure legend in form ofnote.
AU11 This reference is not listed in thereference list. Please provide allthe necessary details to beincluded in the reference.
AU12 Please check the insertion.
AU13 Kindly check the Running headfor accuracy.
AU14 Kindly check the styling of thename of the author.
Typesetter Query
Attention authors: Please address every typesetter query below. Failure to do so mayresult in references being deleted from your proofs. Thanks for your cooperation.
Query Refs. Details Required Author’s response
TS1 Please provide article title for the ReferenceSteinauer and Collins (1996).