roi guide cover - center for health care strategies · support effective policymaking in medicaid....
TRANSCRIPT

April 2009
Made possible through support from The Commonwealth Fund and the Robert Wood Johnson Foundation.
CHCS Center for Health Care Strategies, Inc.
User’s Guide to the ROI Forecasting Calculator: Estimating ROI for Medicaid Quality Improvement Programs
WWW.CHCSROI.ORG

© 2008 Center for Health Care Strategies, Inc.
A. Hamblin and C. Shearer. “User’s Guide to the ROI Forecasting Calculator: Estimating ROI for Medicaid Quality Improvement Programs.” Center for Health Care Strategies, Inc., April 2009.
User’s Guide to the ROI Forecasting Calculator: Estimating ROI for Medicaid Quality Improvement Programs
Authors
Allison Hamblin, MSPH Chad Shearer, JD, MHA Center for Health Care Strategies
Acknowledgements
The Center for Health Care Strategies (CHCS) is grateful to the Robert Wood Johnson Foundation and The Commonwealth Fund for their support of this User’s Guide, and for their support of the ROI Purchasing Institute (ROI PI), which led to many of the best practices identified herein. CHCS would like to recognize the contributions of the eight states that participated in the ROI PI -- Arizona, Colorado, Connecticut, Idaho, Louisiana, Oklahoma, Pennsylvania, and Washington. These states pilot tested the ROI Forecasting Calculator, offered suggestions for improved functioning and usability, and, most importantly, demonstrated how ROI forecasting can be used to support effective policymaking in Medicaid. CHCS is additionally grateful to the Robert Wood Johnson Foundation for its support of the ROI Forecasting Calculator, for which this guide has been developed, and to the HSM Group, which was instrumental in bringing the ROI Calculator online.
The Center for Health Care Strategies is a nonprofit health policy resource center dedicated to improving health care quality for low-income children and adults, people with chronic illnesses and disabilities, frail elders, and racially and ethnically diverse populations experiencing disparities in care. CHCS works with state and federal agencies, health plans, and providers to develop innovative programs that better serve people with complex and high-cost health care needs. Its program priorities are: improving quality and reducing racial and ethnic disparities; integrating care for people with complex and special needs; and building Medicaid leadership and capacity. For more information, visit www.chcs.org.

User’s Guide to the ROI Forecasting Calculator: Estimating ROI for Medicaid Quality Improvement Programs
Contents I. Introduction .............................................................................................................................................. 3
Why Conduct ROI Analyses? ................................................................................................................ 3
II. Understanding ROI Analysis ............................................................................................................. 5
Framework for Calculating ROI ............................................................................................................ 5
III. Best Practices in ROI Forecasting .................................................................................................. 7
A. Analytical Perspectives ..................................................................................................................... 7 B. Target Population ............................................................................................................................. 8 C. Utilization ....................................................................................................................................... 10 D. Trend ............................................................................................................................................... 12 E. Utilization Changes ........................................................................................................................ 13 F. Program Costs ................................................................................................................................. 15 G. Scenario Testing and Sensitivity Analysis ..................................................................................... 16 H. Discount Rate .................................................................................................................................. 18 I. Using the ROI Solver ..................................................................................................................... 19 J. Communicating ROI Analyses ....................................................................................................... 20
IV. Conclusion ............................................................................................................................................ 21
2

User’s Guide to the ROI Forecasting Calculator: Estimating ROI for Medicaid Quality Improvement Programs
I. Introduction
ealth care purchasers, faced with rising health care costs, increasing prevalence of chronic illness, and growing recognition of gaps in quality, are interested in programs that have the potential to both
improve health outcomes and curb health care spending growth. Given the disproportionately high burden of chronic illness and the unique budget constraints faced by Medicaid programs, states in particular are challenged to identify initiatives that have both quality improvement and cost savings potential. To assist in these efforts, the Center for Health Care Strategies (CHCS) developed the ROI Forecasting Calculator for Quality Initiatives (ROI Calculator).1
H
The ROI Calculator, made possible through funding from the Robert Wood Johnson Foundation, is a web-based tool designed for use by state Medicaid agencies, health plans, and other stakeholders interested in assessing the cost-savings potential of quality improvement initiatives. Users of the ROI Calculator enter detailed assumptions about their proposed quality improvement initiative, including target population characteristics, program costs, and changes in health care service utilization that are expected to result from the intervention. Based on the assumptions entered, the ROI Calculator examines the return on investment (ROI) that may result from the proposed quality improvement program, including a range of estimates based on sensitivity analysis. This guide was developed to help Medicaid stakeholders maximize use of the ROI Calculator to generate forecasts for proposed quality improvement programs. For examples of how states can use the ROI Calculator to support quality improvement efforts, see Maximizing Quality and Value in Medicaid: Using Return on Investment Forecasting to Support Effective Policymaking, a policy brief published by The Commonwealth Fund in coordination with the release of this guide. 2
Why Conduct ROI Analyses?3
As stewards of limited resources, Medicaid officials are committed to ensuring that each dollar invested in the program is allocated to maximize overall value. The ROI Calculator can facilitate value-based purchasing in a wide range of ways – from aiding resource allocation decisions to establishing realistic cost-savings expectations during various phases of program implementation. By including ROI forecasting as a component of broader program planning activities, purchasers can better position themselves to maximize the impact of their quality investments. As a counter-cyclical program, Medicaid is accustomed to budgetary pressures. In economic downturns, state revenues decrease leading to budget cuts, while Medicaid enrollment increases and demand for services requires more, not less, resources. Historically, states have attempted to contain costs using the policy levers that offered the most quantifiable and immediate savings potential — lowering reimbursement rates to providers and eliminating optional services and/or eligibility groups. However, as states have witnessed time and again, these solutions may provide short-term relief from immediate budget pressures, but do not provide sustainable cost control over the long-term. More recently, states and policymakers across the country have recognized that identifying better ways to organize, finance, and deliver care to those who need it most offers a more promising strategy for “bending the trend” in health care costs. Specifically, expenditures on care for beneficiaries with chronic disease
1 The ROI Calculator is available for public use and can be accessed at www.chcsroi.org. 2 A. Hamblin and C. Shearer. Maximizing Quality and Value in Medicaid: Using Return on Investment Forecasting to Support Effective Policymaking, The Commonwealth Fund, April 2009. 3 Adapted from A. Hamblin and C. Shearer, op. cit.
3

User’s Guide to the ROI Forecasting Calculator: Estimating ROI for Medicaid Quality Improvement Programs
represent 83% of all Medicaid spending.4 By improving care coordination, self-management, and use of targeted clinical interventions for chronically ill populations, states have the opportunity to reduce avoidable complications and associated acute care expenditures. Moreover, as the costliest 4% of beneficiaries account for nearly 50% of total Medicaid spending, and as these high-cost populations include beneficiaries with multiple and complex chronic health care needs, targeting improvements in care for these population subsets can potentially slow the rate of growth in health care spending that otherwise threatens to overwhelm funds available to support other state programs.5
Components of the ROI Forecasting Calculator The ROI Forecasting Calculator for Quality Initiatives is a web-based tool designed to help Medicaid stakeholders assess and demonstrate the cost-savings potential of efforts to improve quality. The chart below summarizes the major components of the ROI Calculator. In creating a forecast, users navigate through each of these components in a step-by-step fashion. This guide addresses the key analytical issues and best practices to consider for each step in the process. Visit CHCSROI.org to use the ROI Forecasting Calculator.
Component Purpose
Forecasts Access, copy, export, or delete saved forecasts
Intervention Define key characteristics such as forecast time horizon and ramp-up period for enrollment in the quality improvement initiative
Target Population
Specify size and composition of target population, including disease prevalence, risk-stratification and expected enrollment rate
Utilization Identify historical medical expenditure, trended growth rates, and changes in utilization patterns expected to result from the quality improvement initiative
Program Costs
Estimate investment required to develop and administer the quality improvement initiative over time
Analysis Define range for sensitivity analysis and discount rate, and review forecast results
Evidence Base
Review results of selected studies from the published literature to assist development of utilization change assumptions
ROI Solver Input a targeted ROI and identify changes in forecast assumptions required to achieve this target
4 G. Anderson. Chronic Conditions: Making the Case for Ongoing Care: September 2004 Update. Partnership for Solutions, Johns Hopkins University, September 2004. Available at: http://www.rwjf.org/files/research/Chronic%20Conditions%20Chartbook%209-2004.ppt#404,1,Slide 1. 5 A. Somers and M. Cohen. Medicaid’s High Cost Enrollees: How Much Do They Drive Program Spending? Kaiser Family Foundation, March 2006. Available at: http://www.kff.org/medicaid/upload/7490.pdf
4
User’s Guide to the ROI Forecasting Calculator: Estimating ROI for Medicaid Quality Improvement Programs
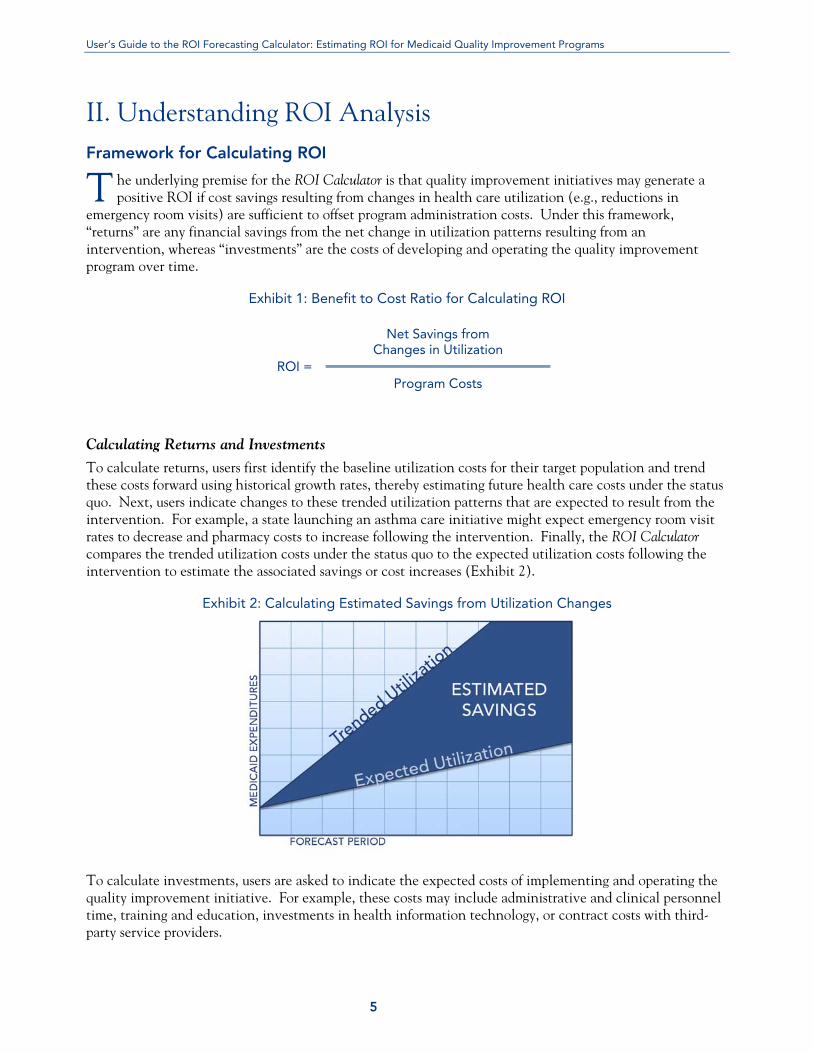
II. Understanding ROI Analysis Framework for Calculating ROI
he underlying premise for the ROI Calculator is that quality improvement initiatives may generate a positive ROI if cost savings resulting from changes in health care utilization (e.g., reductions in
emergency room visits) are sufficient to offset program administration costs. Under this framework, “returns” are any financial savings from the net change in utilization patterns resulting from an intervention, whereas “investments” are the costs of developing and operating the quality improvement program over time.
T
Exhibit 1: Benefit to Cost Ratio for Calculating ROI
ROI =
Net Savings fromChanges in Utilization
Program Costs
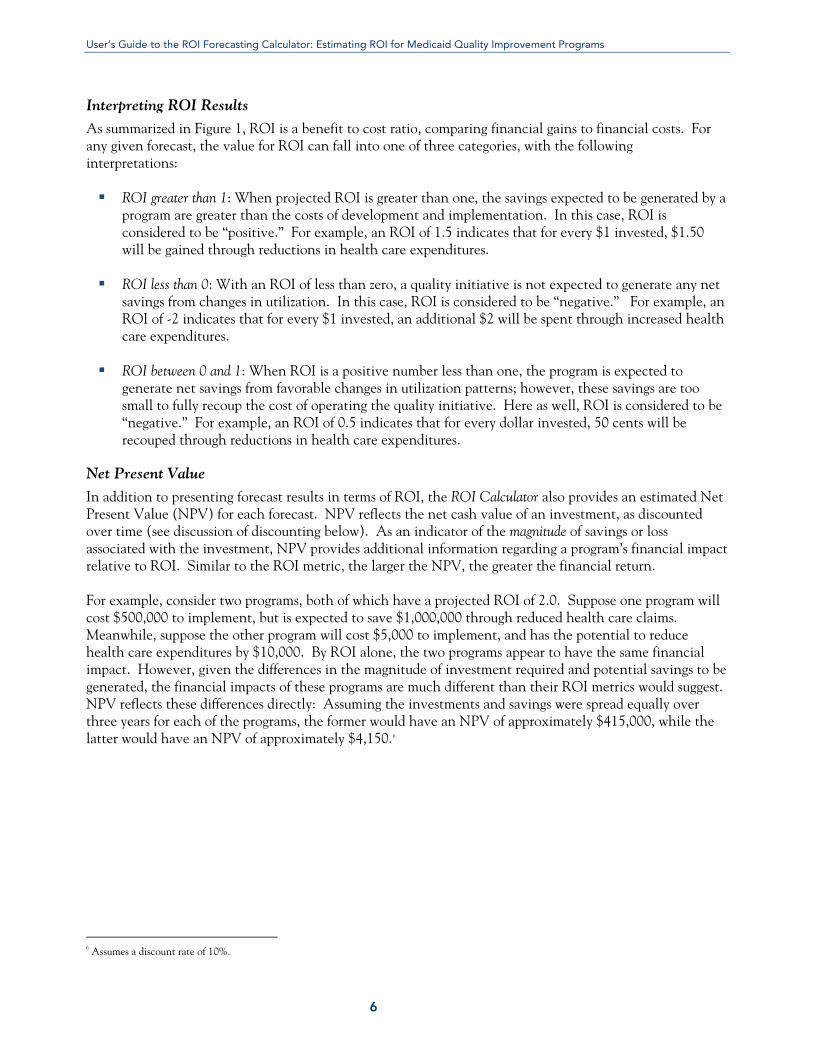
Calculating Returns and Investments
To calculate returns, users first identify the baseline utilization costs for their target population and trend these costs forward using historical growth rates, thereby estimating future health care costs under the status quo. Next, users indicate changes to these trended utilization patterns that are expected to result from the intervention. For example, a state launching an asthma care initiative might expect emergency room visit rates to decrease and pharmacy costs to increase following the intervention. Finally, the ROI Calculator compares the trended utilization costs under the status quo to the expected utilization costs following the intervention to estimate the associated savings or cost increases (Exhibit 2).
Exhibit 2: Calculating Estimated Savings from Utilization Changes
To calculate investments, users are asked to indicate the expected costs of implementing and operating the quality improvement initiative. For example, these costs may include administrative and clinical personnel time, training and education, investments in health information technology, or contract costs with third-party service providers.
5
User’s Guide to the ROI Forecasting Calculator: Estimating ROI for Medicaid Quality Improvement Programs
Interpreting ROI Results
As summarized in Figure 1, ROI is a benefit to cost ratio, comparing financial gains to financial costs. For any given forecast, the value for ROI can fall into one of three categories, with the following interpretations:
ROI greater than 1: When projected ROI is greater than one, the savings expected to be generated by a program are greater than the costs of development and implementation. In this case, ROI is considered to be “positive.” For example, an ROI of 1.5 indicates that for every $1 invested, $1.50 will be gained through reductions in health care expenditures.
ROI less than 0: With an ROI of less than zero, a quality initiative is not expected to generate any net savings from changes in utilization. In this case, ROI is considered to be “negative.” For example, an ROI of -2 indicates that for every $1 invested, an additional $2 will be spent through increased health care expenditures.
ROI between 0 and 1: When ROI is a positive number less than one, the program is expected to generate net savings from favorable changes in utilization patterns; however, these savings are too small to fully recoup the cost of operating the quality initiative. Here as well, ROI is considered to be “negative.” For example, an ROI of 0.5 indicates that for every dollar invested, 50 cents will be recouped through reductions in health care expenditures.
Net Present Value
In addition to presenting forecast results in terms of ROI, the ROI Calculator also provides an estimated Net Present Value (NPV) for each forecast. NPV reflects the net cash value of an investment, as discounted over time (see discussion of discounting below). As an indicator of the magnitude of savings or loss associated with the investment, NPV provides additional information regarding a program’s financial impact relative to ROI. Similar to the ROI metric, the larger the NPV, the greater the financial return. For example, consider two programs, both of which have a projected ROI of 2.0. Suppose one program will cost $500,000 to implement, but is expected to save $1,000,000 through reduced health care claims. Meanwhile, suppose the other program will cost $5,000 to implement, and has the potential to reduce health care expenditures by $10,000. By ROI alone, the two programs appear to have the same financial impact. However, given the differences in the magnitude of investment required and potential savings to be generated, the financial impacts of these programs are much different than their ROI metrics would suggest. NPV reflects these differences directly: Assuming the investments and savings were spread equally over three years for each of the programs, the former would have an NPV of approximately $415,000, while the latter would have an NPV of approximately $4,150.6
6 Assumes a discount rate of 10%.
6

User’s Guide to the ROI Forecasting Calculator: Estimating ROI for Medicaid Quality Improvement Programs
III. Best Practices in ROI Forecasting
he following sections address many of the quantitative and qualitative questions users must answer when using the ROI Calculator. These best practices, which include tips and considerations for each
step of the forecasting process, are intended to be a useful guide for those who are developing forecasts. For technical forecasting issues not addressed in this guide, please refer to the help topics (indicated with a “ ”) located next to most of the individual input questions in the ROI Calculator.
T
A. Analytical Perspectives
Before beginning the forecasting process it is imperative for users to understand how the ROI for a quality improvement intervention may vary for different stakeholders, how the purpose of the analysis can affect forecast inputs, and how different systems of care (e.g., fee-for-service vs. managed care) might affect the analytical perspective.
Building Analyses for the Right Audience
When starting an ROI forecast, one must consider the perspective of the analysis. In other words, ROI to whom? The ROI for a given quality initiative will be different for each stakeholder, depending on the sources of funding (e.g., investments), and on the nature of the financial risk borne by each organization. Any financial costs or benefits not borne by the target audience for the analysis should not affect its ROI. For example, suppose the target population for a proposed intervention includes dual eligibles — that is, patients eligible for both Medicare and Medicaid benefits. As Medicare is responsible for most costs related to inpatient care for this population, a state Medicaid agency would not want to include Medicare-reimbursed inpatient costs in its ROI calculation. Instead, the state would focus on Medicaid-covered expenditures, such as inpatient deductibles and co-payments, as well as non-Medicare-covered, long-term care and home- and community-based services. However, in some cases there may be value in capturing the broader financial impact of a quality initiative for multiple stakeholders. In the case of an initiative to improve care for dual-eligible beneficiaries, a state Medicaid agency may be interested in quantifying the gains that Medicare may realize as a result of its proposed intervention, even though those savings will not directly benefit the state. For example, the state may have a contract with a Special Needs Plan, through which the plan receives integrated financing to provide
The web-based ROI Forecasting Calculator can be accessed by visiting CHCSROI.org.
7
User’s Guide to the ROI Forecasting Calculator: Estimating ROI for Medicaid Quality Improvement Programs
both Medicare and Medicaid benefits to dual eligibles. In this case, the state might want financial projections for proposed quality improvement efforts to include Medicare-covered services, as the plan would realize the savings from any favorable changes in these areas. To accommodate this type of analysis, the ROI Calculator can differentiate between an internally captured ROI and the broader ROI for the quality initiative as a whole. By indicating whether the target audience is financially responsible for specific categories of utilization (e.g., inpatient, pharmacy) on the Utilization Change page of the ROI Calculator, a user can specify which sources of financial return will be included in the “internal ROI” calculation, while preserving the ability to look at the broader impact on multiple stakeholders.
Purpose of the Analysis
The purpose of the analysis will steer the costs and benefits that should be included in the calculations. For example, suppose a state intends to contract with a disease management organization to provide care management for beneficiaries with diabetes. If the state is interested in forecasting ROI for budgetary or funding purposes, it would compare projected savings to the contractual costs of purchasing the care management services from the vendor. However, these contractual costs may not accurately represent what it would otherwise cost the state to deliver these services on its own. Thus, if instead the state is interested in a more generalizable analysis of the ROI potential for improving diabetes care for research or publication purposes, it might be more appropriate to include the estimated costs of staffing and operating the disease management program internally instead of the contractual costs.
Implications for Fee-for-Service versus Managed Care Settings
When state Medicaid agencies use the ROI Calculator, it is important to recognize whether benefits are delivered in a fee-for-service or capitated system of care. The ROI analysis for fee-for-service systems is straightforward, as the state will directly bear the costs or savings associated with changes in utilization among beneficiaries. However, in capitated managed care environments, the state will not be directly affected by changes in utilization patterns until capitation rates are adjusted to reflect the revised patterns of service use among the population. Still, as future rate adjustments will likely reflect these changes, states operating in partial or fully capitated systems should find the ROI Calculator useful for estimating future financial impacts of quality initiatives.
B. Target Population
The first component of the ROI forecasting process involves identifying the target population for the proposed quality improvement initiative. Users start with the entire eligible population, narrow down to a target population based on disease prevalence rates (for disease-specific interventions) and risk stratification, and finally arrive at the group receiving the intervention by estimating the rate of successful outreach or enrollment.
Disease-Specific versus Non-Disease-Specific Interventions
The ROI Calculator is designed for use with both disease-specific and non-disease-specific interventions. For disease-specific interventions, users identify a target population based on the prevalence of disease among the eligible beneficiaries (e.g., percent of children with asthma), and then further target the intervention through risk stratification (e.g., high, medium, or low risk). Forecasts related to asthma, diabetes, congestive heart failure (CHF) and high-risk pregnancy can also take advantage of the Evidence Base resource in the ROI Calculator to predict utilization impacts (see page 14 for more information on the Evidence Base).
8

User’s Guide to the ROI Forecasting Calculator: Estimating ROI for Medicaid Quality Improvement Programs
For non-disease-specific interventions (e.g., a chronic care management program for patients with multiple conditions) users of the ROI Calculator may intend to enroll a fixed number of individuals based on capacity or other constraints, or may plan to enroll a fixed percentage of the eligible population based on predictive modeling, risk-stratification, or other methods. In either case, for forecasting purposes, users directly specify the size of their target population based on the expected number of patients who will be targeted for enrollment.
Identifying Prevalence Rates
For disease-specific forecasts, identification of the target population requires inputting a prevalence rate for the targeted condition. Whereas users can employ any method for identifying disease prevalence, the method used for forecasting purposes should be consistent with the method used for actually targeting and enrolling beneficiaries in the intervention. Users typically rely on diagnosis codes included in administrative claims data to identify prevalence and target individuals for enrollment. If available, information from disease registries may provide another source of information for this purpose. When relying on claims data to identify disease prevalence rates, users will want to consider whether to include only primary diagnoses or secondary diagnoses as well. This decision should be made based on local coding practices as well as clinical considerations. Questions to consider include:
Do providers prioritize between primary and other diagnoses when coding claims, or rather are diagnoses listed in no particular order?
Does the diagnosis of interest need to be the primary reason for the patient encounter to be amenable to the proposed intervention?
For example, suppose a state is launching a care management intervention for children with asthma that focuses on children who have visited the emergency room with an asthma diagnosis in the last 12 months. The state may want to target only those children for whom asthma was the primary reason for visiting the emergency room, thus relying solely on the primary diagnosis for purposes of identification. However, if the state believes that an underlying condition of uncontrolled asthma may be contributing to emergency room visits with other primary diagnoses (e.g., upper respiratory infection), it may choose to include more than the primary diagnosis in its identification of the target population.
Options for Risk Stratification
Another aspect of identifying the target population involves determining which risk groups to target for intervention (e.g., high, medium, or low risk). Users of the ROI Calculator can employ any method of risk stratification, and can also choose to include all risk groups in the target population. In selecting a method for risk stratification, users should consider available tools and data, as well as existing standards or best practices for particular clinical conditions or interventions. In general, options for risk stratification include analysis of historical claims data or use of predictive modeling software (either developed in-house or purchased from a third party). Historical claims can be used to identify risk groups based on prior utilization, expenditures, or diagnostic information.
Prior utilization: Claims can be used to assign risk based on identified utilization criteria. For example, within the asthma literature, “high-risk” is commonly defined as one or more emergency room visits or hospitalizations with a primary diagnosis of asthma in the last 12 months.
9

User’s Guide to the ROI Forecasting Calculator: Estimating ROI for Medicaid Quality Improvement Programs
Prior expenditures: Claims can be used to rank the target population by historical health care expenditures to indicate risk for future expenditures. Once ranked, criteria for inclusion can be made using deciles, quartiles, or other natural cut-off points. With this method, exclusion criteria are often applied to remove patients whose health care expenditures have been affected by conditions not considered to be amenable to proposed interventions (e.g., trauma).
Diagnoses: Claims can be used to identify patients with individual or combinations of diagnoses associated with various levels of health care needs or expenditures. For example, patients with multiple chronic conditions or with co-occurring physical and mental illness may be considered higher-risk than patients with a single chronic condition, and thus may warrant a different intensity of intervention.
Predictive modeling tools link the occurrence of one or more independent factors or variables with dependent variables of interest. For health care purchasers, predictive modeling tools are used to predict or explain medical expenditure variation at an individual level, or to classify individuals in a population into defined groups. Although predictive modeling tools were originally developed for payment and rate-setting purposes, they are also being used by some states and health plans to guide care management interventions. A number of commercial entities offer predictive modeling tools, and some states are beginning to internally develop their own tools as well.7
Estimating Enrollment Rates
Although all members of the target population might benefit from the proposed intervention, it is unlikely that all will be successfully enrolled. To accurately estimate the size of the target population, the ROI Calculator requires that users input an estimated enrollment/outreach rate that accounts for the various challenges associated with patient enrollment. Depending on the target population and the environmental context, these challenges might include imperfect or outdated contact information, inadequate resources to support outreach activities, difficulties with patient engagement or consent (particularly if research is involved), existence of cultural or language barriers, and maintenance of benefit eligibility. The enrollment rate will also be affected by the enrollment model employed, as “opt-in” models typically engender lower participation rates than “”opt-out” approaches. In some cases, users of the ROI Calculator may not have an accurate sense for the expected enrollment rate in a proposed intervention. In these instances, users could run multiple scenarios of their ROI forecast using a range of enrollment rate estimates in order to understand how ROI will be impacted under different assumptions. Alternatively, users could account for the uncertainty in the enrollment rate through the sensitivity analysis, as discussed in more detail below.
C. Utilization
The second component of the ROI forecasting process involves estimating the net increases or decreases in expenditures that are expected to result from changes in health care utilization patterns. Users first identify the baseline health care expenditures for the target population by reviewing historical claims data, and then trend these expenditures forward using historical growth rates to estimate future spending under the status quo. Lastly, users indicate the expected impact of the intervention on these trended expenditures, thereby allowing the calculation of projected savings or cost increases.
7 D. Knutson. Predictive Modeling: A Guide for State Medicaid Purchasers. Center for Health Care Strategies, Inc., to be published in spring 2009.
10
User’s Guide to the ROI Forecasting Calculator: Estimating ROI for Medicaid Quality Improvement Programs
Baseline Costs
Baseline costs represent the historical medical expenditures for the target population. Users analyze claims data to determine the average per member per year costs for the target population, allocating these costs to individual categories of service (e.g., inpatient, pharmacy). In addition, users are also asked to provide baseline costs for the larger eligible populations from which the target population is derived, to allow for savings metrics to be presented in a number of different ways in the final analysis.
Allocating Baseline Costs to Categories of Service
Since the ROI Calculator requires users to indicate expected changes in utilization patterns or service use, baseline costs must be provided by individual category of service. The ROI Calculator specifies six categories, including inpatient, emergency department, outpatient, home-based care, laboratory, and pharmacy. To provide users with additional forecasting flexibility, three optional “blank” categories are available and can be defined by the user. For example, a state may divide its outpatient claims into multiple expenditure categories (e.g., office-based care, outpatient procedures, durable medical equipment, etc.). In identifying baseline costs, the state could either combine all those costs under the outpatient category or could separate them using the blank fields in order to analyze exactly where and how utilization changes in these subcategories may affect ROI.
Including Disease-Specific Costs versus Total Health Care Costs
When determining baseline costs for disease-specific ROI forecasts, users must decide whether the analysis will reflect all health care expenditures, or only those expenditures associated with the disease targeted by the intervention. In some cases, focusing on disease-specific expenditures may provide the best picture of intervention effects; however, this approach might ignore other cost increases or savings that may result from the intervention. For example, in forecasting ROI for a diabetes self-management program, users may choose to focus on diabetes-specific health care costs to gauge intervention impact. However, this approach might underestimate the impact of improved blood pressure, blood sugar, and cholesterol control on overall costs that are not considered diabetes-specific. Users may wish to consider creating multiple ROI forecasts that reflect both disease-specific costs and overall health care costs to provide a complete picture of intervention impacts. It is also important to recognize the choice of including disease-specific versus total health care costs when using the Evidence Base resource to estimate future changes in utilization.8 If relying on outcomes from prior studies to drive utilization change estimates, users should be careful to ensure that included costs are consistent with those reported in the study of interest. For example, suppose a study in the CHF evidence base reported a 20% decrease in overall inpatient costs. In selecting this study to drive forecast assumptions, a user should include all health care costs in the baseline and not just CHF-specific costs to ensure consistency.
Identifying Baseline Costs for the Broader Eligible Population
In addition to identifying baseline costs for the target population, users are also asked to provide baseline costs for the broader eligible population from which the target group is drawn. This information allows the final savings/costs calculations to be presented across a broader population of interest as well as over the target population. For example, for a childhood asthma program, a state may be interested in estimating per person savings across all children in addition to savings/costs per child with asthma. Exhibit 3 summarizes what this analysis might look like.
8 See p.14 for further discussion of the Evidence Base component to the ROI Calculator.
11
User’s Guide to the ROI Forecasting Calculator: Estimating ROI for Medicaid Quality Improvement Programs
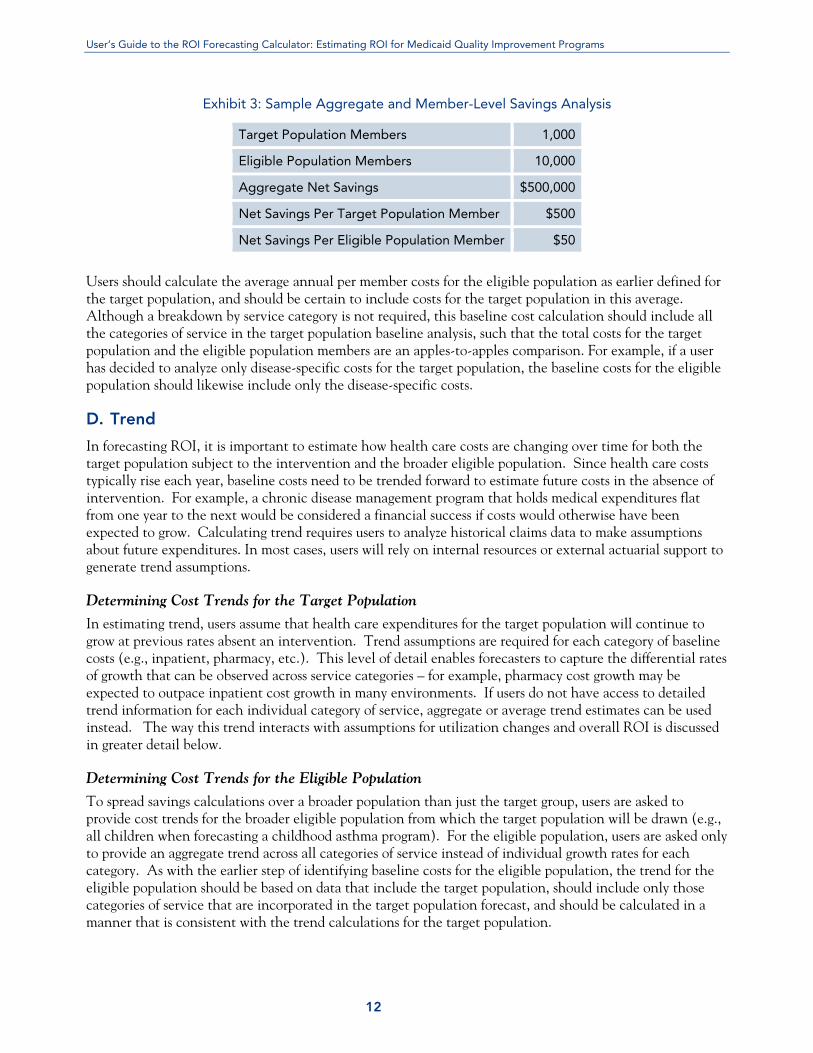
Exhibit 3: Sample Aggregate and Member-Level Savings Analysis
Target Population Members 1,000
Eligible Population Members 10,000
Aggregate Net Savings $500,000
Net Savings Per Target Population Member $500
Net Savings Per Eligible Population Member $50
Users should calculate the average annual per member costs for the eligible population as earlier defined for the target population, and should be certain to include costs for the target population in this average. Although a breakdown by service category is not required, this baseline cost calculation should include all the categories of service in the target population baseline analysis, such that the total costs for the target population and the eligible population members are an apples-to-apples comparison. For example, if a user has decided to analyze only disease-specific costs for the target population, the baseline costs for the eligible population should likewise include only the disease-specific costs.
D. Trend
In forecasting ROI, it is important to estimate how health care costs are changing over time for both the target population subject to the intervention and the broader eligible population. Since health care costs typically rise each year, baseline costs need to be trended forward to estimate future costs in the absence of intervention. For example, a chronic disease management program that holds medical expenditures flat from one year to the next would be considered a financial success if costs would otherwise have been expected to grow. Calculating trend requires users to analyze historical claims data to make assumptions about future expenditures. In most cases, users will rely on internal resources or external actuarial support to generate trend assumptions.
Determining Cost Trends for the Target Population
In estimating trend, users assume that health care expenditures for the target population will continue to grow at previous rates absent an intervention. Trend assumptions are required for each category of baseline costs (e.g., inpatient, pharmacy, etc.). This level of detail enables forecasters to capture the differential rates of growth that can be observed across service categories – for example, pharmacy cost growth may be expected to outpace inpatient cost growth in many environments. If users do not have access to detailed trend information for each individual category of service, aggregate or average trend estimates can be used instead. The way this trend interacts with assumptions for utilization changes and overall ROI is discussed in greater detail below.
Determining Cost Trends for the Eligible Population
To spread savings calculations over a broader population than just the target group, users are asked to provide cost trends for the broader eligible population from which the target population will be drawn (e.g., all children when forecasting a childhood asthma program). For the eligible population, users are asked only to provide an aggregate trend across all categories of service instead of individual growth rates for each category. As with the earlier step of identifying baseline costs for the eligible population, the trend for the eligible population should be based on data that include the target population, should include only those categories of service that are incorporated in the target population forecast, and should be calculated in a manner that is consistent with the trend calculations for the target population.
12
User’s Guide to the ROI Forecasting Calculator: Estimating ROI for Medicaid Quality Improvement Programs
E. Utilization Changes
One of the most challenging components to the ROI forecasting process is estimating the change in utilization patterns that is expected to result from intervention. Whereas users of the ROI Calculator typically have access to substantial data to derive target population, baseline costs, and trend assumptions, many users find themselves without reliable data sources to estimate intervention impacts on cost and utilization. Given the sensitivity of the model to assumptions regarding changes in utilization, it is important to understand how these assumptions affect savings calculations and what evidence is available to generate informed assumptions.
Understanding Utilization Change Calculations
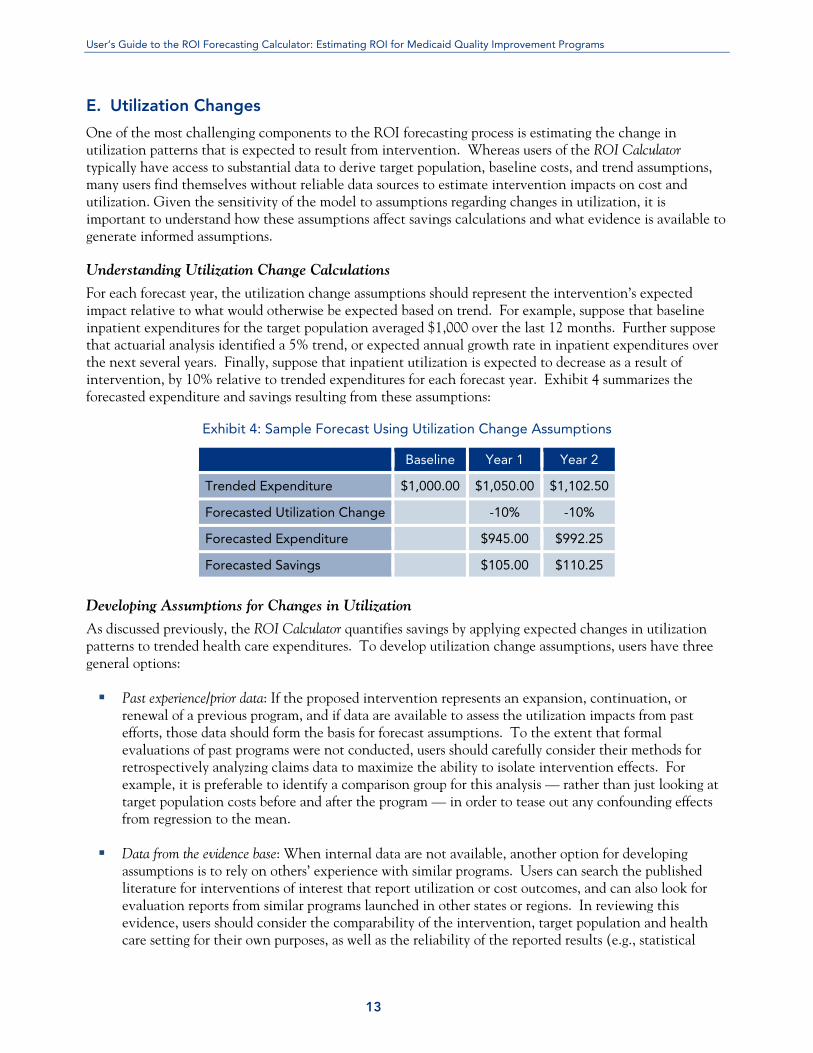
For each forecast year, the utilization change assumptions should represent the intervention’s expected impact relative to what would otherwise be expected based on trend. For example, suppose that baseline inpatient expenditures for the target population averaged $1,000 over the last 12 months. Further suppose that actuarial analysis identified a 5% trend, or expected annual growth rate in inpatient expenditures over the next several years. Finally, suppose that inpatient utilization is expected to decrease as a result of intervention, by 10% relative to trended expenditures for each forecast year. Exhibit 4 summarizes the forecasted expenditure and savings resulting from these assumptions:
Exhibit 4: Sample Forecast Using Utilization Change Assumptions
Baseline Year 1 Year 2
Trended Expenditure $1,000.00 $1,050.00 $1,102.50
Forecasted Utilization Change -10% -10%
Forecasted Expenditure $945.00 $992.25
Forecasted Savings $105.00 $110.25
Developing Assumptions for Changes in Utilization
As discussed previously, the ROI Calculator quantifies savings by applying expected changes in utilization patterns to trended health care expenditures. To develop utilization change assumptions, users have three general options:
Past experience/prior data: If the proposed intervention represents an expansion, continuation, or renewal of a previous program, and if data are available to assess the utilization impacts from past efforts, those data should form the basis for forecast assumptions. To the extent that formal evaluations of past programs were not conducted, users should carefully consider their methods for retrospectively analyzing claims data to maximize the ability to isolate intervention effects. For example, it is preferable to identify a comparison group for this analysis — rather than just looking at target population costs before and after the program — in order to tease out any confounding effects from regression to the mean.
Data from the evidence base: When internal data are not available, another option for developing assumptions is to rely on others’ experience with similar programs. Users can search the published literature for interventions of interest that report utilization or cost outcomes, and can also look for evaluation reports from similar programs launched in other states or regions. In reviewing this evidence, users should consider the comparability of the intervention, target population and health care setting for their own purposes, as well as the reliability of the reported results (e.g., statistical
13

User’s Guide to the ROI Forecasting Calculator: Estimating ROI for Medicaid Quality Improvement Programs
significance, quality of study design). As noted previously and discussed further below, the ROI Calculator includes an Evidence Base resource for a number of clinical conditions (see Using the Evidence Base below).
Hypotheses and best estimates: Until the evidence base is further developed, users may have to rely on their own hypotheses and best estimates for what changes are likely to occur following intervention. Users should think through the logic of their interventions and assess what changes are reasonable to expect. For example, many asthma programs aim to reduce emergency room visits through improved self-management, access to primary care, and use of controller medications. Accordingly, the expected utilization changes for an asthma ROI forecast might include decreases in emergency department claims, at least partially offset by increases in claims for office visits and pharmaceuticals. Quantifying such increases and decreases can be more challenging, however, and it may be most appropriate to test these assumptions through an iterative process, using the ROI Calculator to understand the magnitude of change needed to generate various thresholds of financial impact. Through this process, one may determine that the magnitude of change required to generate a positive ROI is too high to be plausibly achievable within the forecast period. For example, if a state identifies that a 90% reduction in inpatient utilization must occur within one year in order to generate a positive financial return, it might determine that the proposed program will not likely have a positive ROI as currently envisioned, and might adjust either the program features or the expectations of financial savings accordingly. In general, when relying on hypotheses and best estimates, users are strongly encouraged to focus on the sensitivity analysis for their forecasts (discussed in more detail below), so that the appropriate amount of uncertainty is incorporated in the results.
Using the Evidence Base
Determining the likely magnitude of utilization increase or decrease can be difficult, especially considering the lack of internal evidence to generate these assumptions in most instances. As mentioned above, when internal data are not available, users can look to the published literature for studies of interventions similar to their proposed programs. Although the literature is admittedly limited, particularly with regard to interventions for complex populations relevant to Medicaid stakeholders, there are a number of quality studies that users can reference when making utilization change assumptions. A number of these studies are included in the Evidence Base component of the ROI Calculator, which was developed in partnership with Mathematica Policy Research. The Evidence Base includes a selection of studies for clinical conditions of high priority within Medicaid populations, including asthma, diabetes, CHF, and high-risk pregnancy. Studies in the Evidence Base are organized by clinical condition, and can be filtered by target population (e.g., adults, children). The Evidence Base can be accessed through the Utilization Change page of the ROI Calculator, and if relevant, the results of individual studies can be used to forecast assumptions for utilization changes.9 There are number of ways to use the Evidence Base to help estimate prospective changes in utilization. First, if a user determines that the results of a particular study are sufficiently generalizable to their own forecast, the reported utilization changes from that study can be selected to automatically populate the user’s forecast assumptions. Alternatively, users may wish to peruse the Evidence Base to help assess the validity of their own utilization change estimates, or to understand the upper and lower bounds of what changes might be reasonable to expect from similar interventions. When selecting a study from the Evidence Base to drive forecast assumptions, only the utilization change results from the study are incorporated into the
9 A stand-alone version for the ROI Evidence Base also exists and includes additional studies beyond those included in the ROI Calculator. See A. Chen, M. Au, and A. Hamblin. The ROI Evidence Base: Identifying Quality Improvement Strategies with Cost-Saving Potential, Center for Health Care Strategies, Inc. November 2007. Available at www.chcs.org.
14

User’s Guide to the ROI Forecasting Calculator: Estimating ROI for Medicaid Quality Improvement Programs
forecast; all other assumptions (e.g., target population, baseline costs, program implementation costs) are identified and entered directly by the user.
The Law of Large Numbers
The magnitude of calculated savings — and thus ROI — is influenced by three primary factors: 1) the size of the target population; 2) the magnitude of baseline costs; and 3) the percentage change in utilization expected to result from intervention. Therefore, when any one of these factors is “large” – e.g., statewide enrollment, a particularly high-cost patient population, or substantial expected decreases in visits/admissions – it is not difficult to obtain unreasonably high estimates for savings and ROI. There are a few implications to this “law of large numbers” for users to consider. First, when developing utilization change assumptions for large populations, users should carefully consider what magnitude of change is reasonable to expect across thousands of patients (or more). As the utilization change assumption should reflect the average impact across the entire group, users should bear in mind that the desired or potential impact may only be achieved in a subset of the population, with many not affected at all. Second, when deriving utilization change assumptions from the results of prior studies, users should consider differences in scale of the interventions and adjust assumptions accordingly. For example, suppose a previous study observed a 50% decrease in admissions among a sample size of 100 patients. In adapting these results to estimate ROI for a statewide initiative involving several thousand patients, it may not be reasonable to expect a similar impact across the population as a whole. Finally, when targeting particularly high-cost populations for intervention, users should carefully consider which portion of expenditures is truly amenable to intervention. For example, for complex populations with multiple, chronic health care needs, a certain level of utilization in any given service category may be necessary and/or desirable. Therefore, in developing utilization change assumptions for interventions targeting these populations, one should think about which portion of spending may be affected, and that effect should be quantified relative to the total array of expenditure in that service category.
F. Program Costs
The denominator of the ROI calculation is the cost of developing and implementing the quality improvement initiative. Realistic assumptions around program costs are just as critical to accurate ROI forecasting as are the various assumptions around target population and utilization described above. Program costs should reflect all costs associated with launching and administering the proposed initiative, including the opportunity costs for personnel or resources that might otherwise be allocated for other purposes. In the absence of detailed cost-accounting data, identifying program costs often requires some degree of estimation or high-level cost allocation. In making these assumptions, users are encouraged to err on the side of over-allocating costs to a proposed initiative, to ensure that forecasted ROI and the associated payback period are as conservative as possible.
Allocating Staff Time to Program Costs
Most quality improvement initiatives will require internal staff time, even in cases where services are provided via third-party contractors. The time spent developing and managing the initiative should be included in program costs to reflect the opportunity cost of that staff time not being available for other efforts. This should be factored in even if the proposed intervention would normally fall within the duties of the staff allocated to the project. It may be helpful to think about allocated personnel costs on the basis of full-time-equivalent (FTE) percentages, applying those percentages to the fully-loaded costs (salary plus fringe benefits) for each employee. Users should also consider allocating costs for management and support
15
User’s Guide to the ROI Forecasting Calculator: Estimating ROI for Medicaid Quality Improvement Programs
staff resources to the extent they will be dedicating any of their time to the proposed intervention and should either include these costs in the personnel line item or in the indirect cost category discussed below.
Incorporating Contractual Costs or Other External Payments
Depending on how a quality improvement intervention is implemented, the program costs may be primarily external rather than internal. For example, if a state hires a disease management company or other external vendor to manage a quality improvement program, the costs associated with the contract should be entered in the ROI Calculator (e.g., negotiated care management fees). Similarly, a quality initiative that uses incentive payments to providers or consumers should include the aggregate amount of these incentives in program cost calculations. Yet another example can be found where states contract with managed care organizations to implement quality initiatives. The cost of implementing these initiatives may represent one small component of a broader capitation rate, but should be broken out and included in program costs to accurately reflect total investments in the intervention. The Program Cost page of the ROI Calculator includes a blank field that may be useful for inputting external costs such as contract fees, incentive payments, and capitation rates.
Identifying and Including Indirect Costs
Most costs associated with a quality improvement intervention are readily identifiable and can be directly associated with that intervention (e.g., salaries, fringe benefits, travel, consultants, etc.). Other costs may not be directly connected with the intervention, but are still necessary for the general operation of the organization and facilitation of the initiative (e.g., utilities, general supplies, support personnel, accounting, etc.). The components of these indirect costs are often so numerous that it may be impossible or, at the very least, inefficient to identify each individual cost item and determine the correct portion to allocate to the quality improvement intervention. Thus, a more reasonable approach to calculating indirect costs may be to use an indirect cost rate and apply that rate to the direct costs of the intervention. For example, suppose a state agency operates under a total administrative budget of $10,000,000, and that a detailed analysis of individual cost items identifies that $1,500,000 of the total is for indirect costs, for an indirect cost rate of 15%. If that state were considering an investment of $100,000 in direct costs for a new quality improvement initiative, it would be reasonable to assume that the indirect costs would total 15% or $15,000 and the total direct and indirect cost for the intervention would be $115,000. It is important to note that individual accounting systems treat indirect costs differently, and users should consider any internal organization rules regarding allocating indirect costs, or use an otherwise approved indirect cost ratio if one is available from existing grants or other funding sources.
G. Scenario Testing and Sensitivity Analysis
All forecasting efforts rely on estimates and expectations that may or may not materialize as anticipated, although the magnitude of uncertainty may vary between one forecast and another. Users of the ROI Calculator are encouraged to account for the appropriate degree of uncertainty in their forecasts by running multiple scenarios for each forecast (e.g., “best” and “worst” cases), and by using the Sensitivity Analysis component of the ROI Calculator.
16

User’s Guide to the ROI Forecasting Calculator: Estimating ROI for Medicaid Quality Improvement Programs
Exhibit 5: Sample Uses of Scenario Testing and Sensitivity Analysis
Method Examples
Scenario Testing What if enrollment is achieved for 50% of the target population instead of 60%?
What if utilization impacts occur in Year 2 instead of Year 1?
Sensitivity Analysis What if, for any number of reasons, the savings estimates are off by 20%?
Scenario Testing
The ROI Calculator allows users to easily copy and save multiple versions of each forecast by clicking “copy” on the Forecast page and saving the forecast under a new name. This feature can be particularly useful for running multiple forecast scenarios for a given program of interest. For example, a state launching a new chronic care management program may be interested in developing and presenting a number of ROI forecasts for the program based on a range of expected outcomes. Under an optimistic scenario, the state may assume that targeted levels of enrollment are reached and that the intervention achieves the expected evidence-based cost/utilization outcomes. However, the state may also envision a more conservative scenario, under which enrollment takes longer and never reaches targeted levels, and implementation challenges lead to a weaker intervention impact. By forecasting and reviewing both scenarios, the state will have a more informed view of how the range of potential outcomes will affect ROI, and may be more prepared to think about implications of the “best” and “worst” cases for program funding and other planning purposes.
Sensitivity Analysis
Whereas scenario testing allows users to consider what happens to ROI when one or more specific forecast assumptions are changed, sensitivity analysis allows users to account for an overall level of uncertainty across all forecast assumptions. It can also help account for unforeseen variation in assumptions, and can allow users to see where an analysis might cross from positive to negative ROI within a range. Furthermore, sensitivity analysis allows users to develop and communicate a realistic range of expected outcomes for ROI, rather than a single point estimate that may overstate the certainty of forecasted outcomes. To conduct a sensitivity analysis with the ROI Calculator, users input a sensitivity range that will be applied to estimated savings in the final analysis. As the sensitivity range is used to both increase and decrease expected savings by the percentage entered, this analysis creates an upper and lower bound for expected savings and resulting ROI estimates. Exhibit 6 provides an example of how sensitivity analysis is calculated assuming a 25% sensitivity range.
Exhibit 6: Example of Sensitivity Analysis Calculation
If savings are
25% lower Base case If savings are25% higher
Savings $750,000 $1,000,000 $1,250,000
Program Costs* $1,000,000 $1,000,000 $1,000,000
ROI 0.75 1.00 1.25
*Program costs are not affected by sensitivity analysis in the ROI Calculator.
17
User’s Guide to the ROI Forecasting Calculator: Estimating ROI for Medicaid Quality Improvement Programs
Determining an Appropriate Sensitivity Range
In general, the size of the sensitivity range should match the overall degree of uncertainty in the ROI forecast. If users are fairly certain about the accuracy of their forecast assumptions, a narrow sensitivity range may be reasonable. However, increasing degrees of uncertainty should lead to broader sensitivity range percentages. Some users will take a “ball-park” approach to determining a sensitivity range, estimating, for example, that savings projections may be off by approximately “25%” in either direction for any number of reasons. For others seeking a more scientific approach, there are a number of techniques statisticians use to account for uncertainty, including standard deviation and confidence intervals. As desired, users might consider engaging statisticians and/or actuaries in their organizations to discuss appropriate sensitivity ranges given the tools and techniques used for making forecasting assumptions in other program areas (e.g., future cost trends).
Limitations of Sensitivity Analysis
There are a number of limitations to consider regarding sensitivity analysis in the ROI Calculator. First, sensitivity analysis cannot account for grossly incorrect assumptions in underlying forecast parameters. If, for example, an intervention leads to vastly different utilization patterns than anticipated, sensitivity analysis will likely not have captured the full extent of this deviation from expectations. Second, sensitivity analysis is limited to an aggregate accounting of uncertainty across all forecast parameters, as users cannot attach discrete sensitivity ranges to individual forecast assumptions. For example, a user may be very confident about forecasted changes to inpatient utilization, but significantly less confident about assumed changes to outpatient utilization. To account for uncertainty in specific parameters, users are encouraged to conduct scenario testing in addition to sensitivity analysis, as described above. Finally, as indicated in Exhibit 6, sensitivity ranges are applied only to savings estimates and not to forecasted program costs.
H. Discount Rate
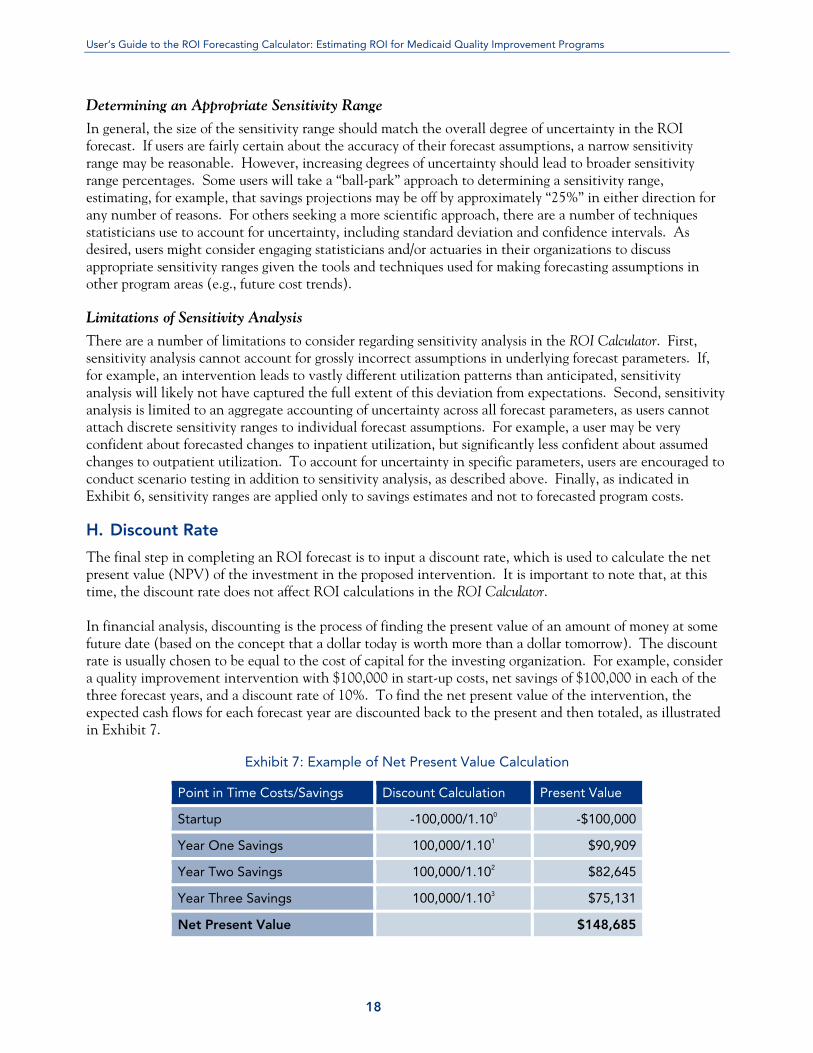
The final step in completing an ROI forecast is to input a discount rate, which is used to calculate the net present value (NPV) of the investment in the proposed intervention. It is important to note that, at this time, the discount rate does not affect ROI calculations in the ROI Calculator. In financial analysis, discounting is the process of finding the present value of an amount of money at some future date (based on the concept that a dollar today is worth more than a dollar tomorrow). The discount rate is usually chosen to be equal to the cost of capital for the investing organization. For example, consider a quality improvement intervention with $100,000 in start-up costs, net savings of $100,000 in each of the three forecast years, and a discount rate of 10%. To find the net present value of the intervention, the expected cash flows for each forecast year are discounted back to the present and then totaled, as illustrated in Exhibit 7.
Exhibit 7: Example of Net Present Value Calculation
Point in Time Costs/Savings Discount Calculation Present Value
Startup -100,000/1.100 -$100,000
Year One Savings 100,000/1.101 $90,909
Year Two Savings 100,000/1.102 $82,645
Year Three Savings 100,000/1.103 $75,131
Net Present Value $148,685
18

User’s Guide to the ROI Forecasting Calculator: Estimating ROI for Medicaid Quality Improvement Programs
Identifying an Appropriate Discount Rate
Discount rates vary by organization, but can generally be thought of as the rate of return that the organization could achieve by investing the allocated funds in an alternative use with similar risk. Some organizations use interest rates as a proxy for the discount rate, as they represent the rate of return one could obtain by investing in available financial instruments rather than in the proposed quality improvement project. These rates can vary greatly based on the risk of these instruments and should closely mirror the perceived risk of the project. Other organizations use a weighted average cost of capital that reflects the organization’s actual cost of capital based on access to equity and debt financing. Users of the ROI Calculator should consider consulting with budgeting and financial analysis experts in their organizations to determine the appropriate discount rate for their forecasts based on organizational practices.
Impact of the Discount Rate
The discount rate can have a significant impact on forecasted NPV, but this impact depends greatly on the rate and the length of time over which the future savings/costs are projected to occur. For common ranges of discount rates (3 to 10%), a forecast horizon of three years is generally not long enough for discounting to have substantive effect (e.g., changing NPV from positive to negative). However, when extending forecasts to five-, 10- or 20-year horizons, small variations in the discount rate can significantly impact expected financial returns. Therefore, when conducting longer-term analyses, it is very important to choose a discount rate that reflects the organizational cost of capital as accurately as possible.
I. Using the ROI Solver
In some cases, users of the ROI Calculator may have a target threshold for financial performance in mind. For example, an initiative launched under federal demonstration authority may require budget neutrality; or in another case, a contract with a disease management organization may guarantee a specified level of savings or ROI. In these instances, users may be interested in working backward, starting with a targeted ROI and using the ROI Calculator to understand what assumptions are required to get there. To facilitate this analysis, the ROI Calculator includes an ROI Solver component. To use the ROI Solver, one must first complete a forecast through the ROI Calculator’s step-by-step process of identifying the target population, baseline costs, utilization changes, and program costs. If the ROI estimate generated by these assumptions does not meet the desired or required threshold for financial performance, users can directly manipulate individual forecast assumptions to test their impact on ROI, or they can visit the ROI Solver page. The ROI Solver allows users to input a targeted ROI and immediately see what changes would be needed in existing forecast parameters in order to achieve that target. Specifically, the ROI Solver identifies needed changes in four discrete forecast parameters:
Target population size; Year 1 inpatient utilization change; Year 1 emergency department utilization change; and Program costs.
In calculating these changes, the ROI Solver holds all other assumptions constant except the parameter in question. For example, suppose a forecast includes the following assumptions and resulting ROI:
19

User’s Guide to the ROI Forecasting Calculator: Estimating ROI for Medicaid Quality Improvement Programs
Exhibit 8: Sample Use of ROI Solver
Target population 2,000
Year 1 inpatient change -10%
Program costs $300,000
Year 2 ROI 1.50
Now suppose that a user is interested in seeing what it would take to generate a higher return of 2.0 in two years. The user would enter a target ROI of 2.0, and would see that to achieve this return, any one of the following assumptions would need to be true — either the target population would have to increase to 2,800, or the Year 1 inpatient utilization impact would have to reach -14%, or the program costs would have to decrease to $215,000. One of the more valuable uses of the ROI Solver is to test the reasonableness of various ROI expectations. For example, if the ROI Solver indicates that in order to achieve a positive ROI, inpatient utilization needs to decrease dramatically in one year’s time, a user can consider whether such a change is reasonable to expect. If not, it may be appropriate to either reset expectations about the program’s ability to pay for itself, or to modify the program design in order to make it more financially sustainable (e.g., target a different or more stratified population, consider changing the intensity of the intervention, etc.).
J. Communicating ROI Analyses
When sharing ROI forecasts with colleagues, managers, government officials, or other stakeholders, it is important to keep a number of considerations in mind.
Importance of Transparency
One of the key benefits to using the ROI Calculator is the transparency it creates for sharing analyses with broader audiences. Accordingly, the ROI Calculator can be used to foster dialogue with multiple stakeholders who may be interested in the prospective financial impact of a given quality initiative. When communicating ROI analyses conducted with the ROI Calculator or elsewhere, users are encouraged to provide maximum transparency including:
Description of the methodology used to calculate costs and savings; Justification for key forecast assumptions; Identification of sources of uncertainty in the estimates; and Indication of how such uncertainty may have been accounted for through scenario testing or
sensitivity analyses. By fully explaining the methodology and limitations of ROI analysis, users of the ROI Calculator can assure their audiences of complete transparency, opening the door for substantive discussions on specific areas of question or dissent and limiting arguments over methodology and assumptions. These conversations have the potential to lead to further refinements of the analyses through collaboration with stakeholders, thereby increasing buy-in for the validity of the results. For example, conversations could concentrate on expected participation rates in the intervention, or around the anticipated effects of the intervention on emergency department use – instead of on skepticism around methodology and concerns of “funny math.”
20
User’s Guide to the ROI Forecasting Calculator: Estimating ROI for Medicaid Quality Improvement Programs
Determining Allowable Uncertainty
For those without access to a crystal ball, forecasting involves an inherent degree of uncertainty. The resulting need to rely on estimates for one forecast parameter or another can be frustrating for both those who seek support to launch a new initiative as well as for those charged with assessing whether funds should be allocated for this purpose. As discussed above, users should make every effort to ensure that estimates for all forecast parameters are as robust as possible, and that the appropriate degree of uncertainty is accounted for through sensitivity analysis and scenario testing. However, 100 percent certainty may not be required to garner support for a new initiative. Depending on the scope and scale of the proposed program, the existence of viable alternatives, and the overall economic or political context in which one is operating, policymakers and other stakeholders may be willing to accept varying levels of uncertainty. The size of a project can have profound effects on the acceptable level of uncertainty. For example, a state legislature will likely require more forecast certainty to support a large-scale program requiring statewide policy change than it would to support a small pilot initiative. As the large project is likely to cost more and be subject to greater political scrutiny than a small pilot, approval will likely require robust analysis of expected cost impacts, with little tolerance for substantial variance from budget estimates post-implementation. Similarly, the burden of proof required to support a new initiative will be higher if a number of competing alternatives have been proposed than if only one policy or program option exists. If only one viable solution to a problem exists, policymakers may be forced to accept greater uncertainty around expected outcomes than otherwise desired. Finally, in some cases, difficult economic realities may make even the most certain of forecasts insufficient to generate funding support. If budget constraints eliminate funds available for investment in new quality initiatives, even the promise of guaranteed ROI may not be enough to make these funds reappear. In other cases, however, the political imperative to find solutions to a salient problem – or unsustainable status quo – might supersede the need for data-driven or evidence-based forecasts of financial sustainability altogether. In these cases, the capacity for stomaching a little uncertainly toward the goal of broader system reforms is likely to be greater.
IV. Conclusion
OI forecasting is a valuable technique for Medicaid policymakers, health plan officials, and other stakeholders interested in both improving quality outcomes and controlling program costs. The ROI
Calculator is one of a number of tools available for this purpose, and presents a straightforward and transparent methodology for projecting the financial impact of proposed quality improvement initiatives. In addition to the help buttons available within the ROI Calculator itself, the information provided in this Guide should provide a useful resource for those interested in developing ROI forecasts and sharing their results with others.
R
21

User’s Guide to the ROI Forecasting Calculator: Estimating ROI for Medicaid Quality Improvement Programs
22
CHCS Resources
The Center for Health Care Strategies (CHCS) works with Medicaid stakeholders across the country to test and demonstrate return on investment for quality improvement initiatives, and to identify where financing realignment is necessary to support improvements in health care quality. To download these and other CHCS resources, visit www.chcs.org/resources: ROI Forecasting Calculator for Quality Initiatives: The ROI Forecasting Calculator for Quality Initiatives is a web-based tool designed to help state Medicaid agencies, health plans, and other stakeholders assess and demonstrate the cost-savings potential of efforts to improve quality. Available at www.chcsroi.org. Return on Investment Evidence Base: Identifying Quality Improvement Strategies with Cost-Saving Potential: This technical assistance resource was developed to help Medicaid stakeholders identify quality improvement strategies with the potential to both improve outcomes and reduce health care costs. The compendium includes studies on asthma, congestive heart failure, depression, diabetes, and high-risk pregnancy. Maximizing Quality and Value in Medicaid: Using Return on Investment Forecasting to Support Effective Policymaking: This policy brief describes how Medicaid stakeholders can use return on investment analyses to support value-based purchasing decisions. The brief includes specific examples of how states can use ROI forecasts to support quality improvement efforts. The Return on Investment Template: This tool is designed for use by states and health plans to retrospectively measure and evaluate the ROI from quality improvement initiatives.
www.chcs.org

200 American Metro Blvd., Suite 119 Hamilton, NJ 08619 Phone: (609) 528-8400 Fax: (609) 586-3679
CHCS Center for Health Care Strategies, Inc.