rmg design build protect
TRANSCRIPT

D e s i g n BuilD Protect
Our Advisory Process For Clients

Asset Class Investing is a passive investment approach that draws on the research of some of the academic community’s most innovative and respected thinkers and economists. As its name suggests, rather than trying to pick stocks or industry sectors, asset class investing focuses on asset classes — which are simply any group of securities (such as U.S. Large Companies and Emerging Markets) that exhibit similar risk and return investment characteristics and perform similarly in any given market environment.
Since asset allocation has a great impact on investment returns, asset class investing carefully controls the investments included in each Asset Class, giving investors truer market returns than similar strategies. While a number of investment vehicles can be employed to implement Asset Class Investing, using institutional mutual funds specifically designed for their asset class characteristics can greatly simplify the process.
? What is Asset class investing?
inVesting Begins WitH You
While it is easy to get caught up in the state of the economy or the latest “hot” stock, we believe passionately that the way you invest should be aligned with where you are in your life…not with the short-term ups and downs of markets.
You should have a financial blueprint to help you manage your opportunities, needs, concerns and goals.
We call this approach Asset Class Investing and believe it makes good sense as you plan for both today and tomorrow.
There are three things to remember about how Asset Class Investing can work for you
and your family:
1. It focuses your investment portfolio on meeting your life goals. It is an approach designed to help you manage towards your most important goals rather than to short-term market trends.
2. It is based on science and academic research. It combines the latest discoveries in economics and investing with more than 80 years of market data and insights as well as in-depth studies of investor psychology and behavior.
3. It is a disciplined and structured approach. It helps protect against the common behavioral mistakes that can compromise your long-term financial goals.
Let us show you how it could work for you.

every good Portfolio is Designed To Meet Your Specific Goals
We like to think of your goals in terms of life goals. It just makes good sense to star t with the things that will be important to you and then construct an investment plan to help you get there.
Consider the ultimate goals that your investment portfolio will have to serve. While it is easy to look at the overall performance of a given investment, you will gain a better sense of how you are doing if you first set your life and financial goals, then measure the effectiveness of your strategy against those goals.
Design A Plan to Meet Your life goalsD e s i g n BuilD Protect
Putting Asset class investing to Work for You — 2

You need to consider these 3 issues For Your Portfolio
1. Short-Term Needs: This is money you will need for immediate expenses, fixed obligations — such as a mortgage — and essential spending, as well as the unexpected.
Remember that a pension plan, savings accounts, insurance payouts, etc. can look after these expenses. If you are still working, you are likely using a portion of your current salary to cover your short-term needs.
2. Future lifestyle: You want to enjoy your lifestyle today AND tomorrow, so consider key factors such as inflation and taxes, as well as fees and expenses.
Your plan should reflect how these factors may affect the overall growth of the money that you will need to reach your goals.
3. Long-Term Comfort: This is money that you will need to invest so that you will not worry unnecessarily. It can also include assets outside your portfolio, such as your house, an inheritance, a pension, etc.
Your Portfolio
short- term needs
long- term needs
Future lifestyle
Putting Asset class investing to Work for You — 3

Design A Plan to Meet Your life goalsD e s i g n BuilD Protect
understanding How “risk” can Affect Your investment Plan
“Risk” can be defined in many ways, but what should concern most investors is the possibility that your plans may not go as expected.
Over the life of your plan, there will be some risks that could affect your ability to reach your goals.
The most common risks that you will have to account for in your investment plan are:
1. Market volatility. Market volatility simply means that the value of your investments will change over time. In fact, prices on investments — including the world’s great companies — are changing all the time, sometimes second by second. But when major changes happen quickly and dramatically, many investors lose sight of the big picture or even panic.
What you can do about it: Remember that market volatility is more a short-term
phenomenon than a long-term risk. In general, the longer you stay invested, the
less volatile your investments should be. Professional guidance can also help.
Entrustyourinvestmentstofinancialadvisors(andmoneymanagers)who
take a long-term approach.
Putting Asset class investing to Work for You — 54 — Putting Asset class investing to Work for You

Putting Asset class investing to Work for You — 5
2. “Headline” and economic risk. Markets are often strongly impacted by investor sentiment. When people are optimistic, they are more likely to invest in the future — if they are pessimistic based on what they read in the morning news, they will tend to keep their money on the sidelines.
What you can do about it: Since there will always be political and economic risks
around the world that can affect your investments in the short-run, reframe how
you view the performance of your portfolio. Rather than compare your holdings to a
benchmark like the S&P 500 or Russell 2000, assess whether your investments are
on track to reach your life goals.
3. Investor risk. If we could remove emotions from investing, markets would be much more predictable. Investor risk not only results from short-term optimism or pessimism about markets — it also results from how you personally handle the day-to-day ups and downs.
What you can do about it: Don’t allow yourself to be swayed by the media or investment
“gurus” who claim that they can predict where markets are going. Also, be aware of
your own emotions and biases and how they can impact your success as an investor.
Working with a trusted advisor can help you keep your life goals in clear view and
avoid making impulsive decisions.

Build Your Plan Using Scientific and Academic research
D e s i g n BuilD Protect
investing to reach Your goals Means gathering As Much expertise on Your side As You can
80+ years of academic research has taught us that there are 3 important decisions that must be made when building an investment portfolio.
1. How you allocate your portfolio between stocks and short-term bonds
2. How you allocate your portfolio between U.S. stocks vs. International stocks
3. Your comfort with key risk factors
Even though each market boom or bust can make it seem as if the old rules no longer apply, we believe — and the data shows — that markets are very consistent over time. We think there will always be companies all around the world worth investing in.
Decision 1 — HoW You AllocAte Your PortFolio
BetWeen stocKs AnD sHort-terM BonDs
From the smartphone in your pocket to the department store where you buy your clothes, many companies that are a big part of our lives are public companies that are listed for trading on a major stock exchange. Not all of them are big with well-known brand names and not all will be successful long term.
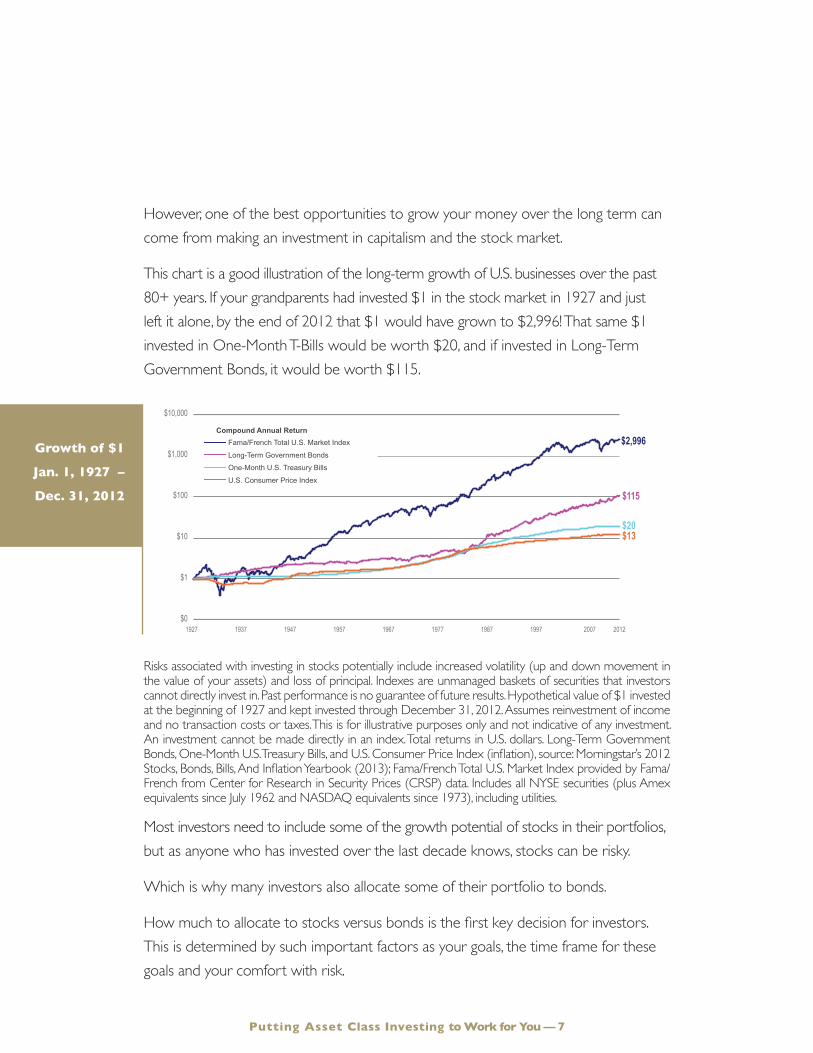
However, one of the best opportunities to grow your money over the long term can come from making an investment in capitalism and the stock market.
This chart is a good illustration of the long-term growth of U.S. businesses over the past 80+ years. If your grandparents had invested $1 in the stock market in 1927 and just left it alone, by the end of 2012 that $1 would have grown to $2,996! That same $1 invested in One-Month T-Bills would be worth $20, and if invested in Long-Term Government Bonds, it would be worth $115.
Risks associated with investing in stocks potentially include increased volatility (up and down movement in the value of your assets) and loss of principal. Indexes are unmanaged baskets of securities that investors cannot directly invest in. Past performance is no guarantee of future results. Hypothetical value of $1 invested at the beginning of 1927 and kept invested through December 31, 2012. Assumes reinvestment of income and no transaction costs or taxes. This is for illustrative purposes only and not indicative of any investment. An investment cannot be made directly in an index. Total returns in U.S. dollars. Long-Term Government Bonds, One-Month U.S. Treasury Bills, and U.S. Consumer Price Index (inflation), source: Morningstar’s 2012 Stocks, Bonds, Bills, And Inflation Yearbook (2013); Fama/French Total U.S. Market Index provided by Fama/French from Center for Research in Security Prices (CRSP) data. Includes all NYSE securities (plus Amex equivalents since July 1962 and NASDAQ equivalents since 1973), including utilities.
Most investors need to include some of the growth potential of stocks in their portfolios, but as anyone who has invested over the last decade knows, stocks can be risky.
Which is why many investors also allocate some of their portfolio to bonds.
How much to allocate to stocks versus bonds is the first key decision for investors. This is determined by such important factors as your goals, the time frame for these goals and your comfort with risk.
$13$20
1927 1997198719771967195719471937 2007 2012
$2,996
$115
Fama/French Total U.S. Market Index 9.7%
Long-Term Government Bonds 5.7%
One-Month U.S. Treasury Bills 3.6%
U.S. Consumer Price Index 3.0%
$10,000
$1,000
$100
$10
$1
$0
Compound Annual Return
growth of $1
Jan. 1, 1927 –
Dec. 31, 2012
Putting Asset class investing to Work for You — 7

Build Your Plan Using Scientific and Academic research
D e s i g n BuilD Protect
We use bonds to try and decrease volatility and manage risk in a portfolio. Like a shock absorber, bonds are intended to create a less bumpy investment ride, with less dramatic ups and downs than a pure stock portfolio. They also provide a steady income stream in a variety of market conditions.
But not all bonds are created equal.
To be an effective “shock absorber,” the portfolio should contain bonds with shorter maturities and higher quality. Here’s why:
• Bonds with shorter maturities typically have a 3 to 5 year “lifespan” and do not go up and down in value at the same time or to the same extent as stocks. Generally, longer maturity bonds entail more risk.
• Higher-quality bonds can help decrease the volatility in your portfolio and lower the risk of a default.
Putting Asset class investing to Work for You — 98 — Putting Asset class investing to Work for You
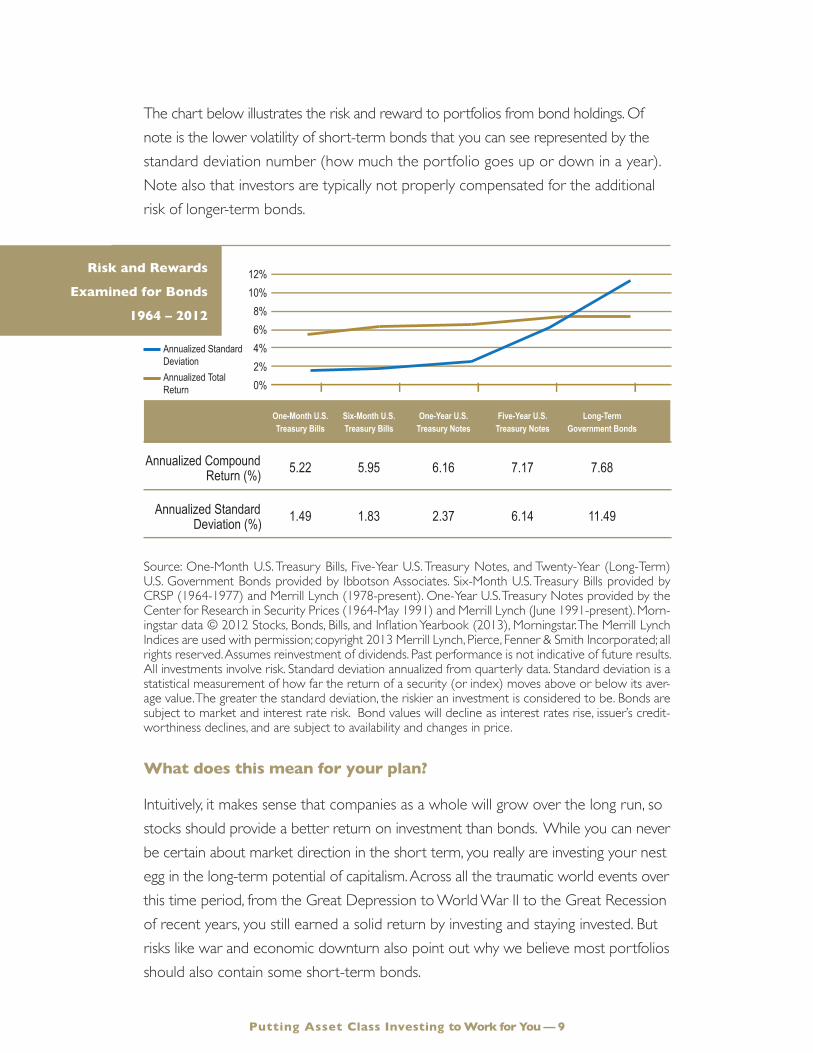
The chart below illustrates the risk and reward to portfolios from bond holdings. Of note is the lower volatility of short-term bonds that you can see represented by the standard deviation number (how much the portfolio goes up or down in a year). Note also that investors are typically not properly compensated for the additional risk of longer-term bonds.
Source: One-Month U.S. Treasury Bills, Five-Year U.S. Treasury Notes, and Twenty-Year (Long-Term) U.S. Government Bonds provided by Ibbotson Associates. Six-Month U.S. Treasury Bills provided by CRSP (1964-1977) and Merrill Lynch (1978-present). One-Year U.S. Treasury Notes provided by the Center for Research in Security Prices (1964-May 1991) and Merrill Lynch (June 1991-present). Morn-ingstar data © 2012 Stocks, Bonds, Bills, and Inflation Yearbook (2013), Morningstar. The Merrill Lynch Indices are used with permission; copyright 2013 Merrill Lynch, Pierce, Fenner & Smith Incorporated; all rights reserved. Assumes reinvestment of dividends. Past performance is not indicative of future results. All investments involve risk. Standard deviation annualized from quarterly data. Standard deviation is a statistical measurement of how far the return of a security (or index) moves above or below its aver-age value. The greater the standard deviation, the riskier an investment is considered to be. Bonds are subject to market and interest rate risk. Bond values will decline as interest rates rise, issuer’s credit-worthiness declines, and are subject to availability and changes in price.
What does this mean for your plan?
Intuitively, it makes sense that companies as a whole will grow over the long run, so stocks should provide a better return on investment than bonds. While you can never be certain about market direction in the short term, you really are investing your nest egg in the long-term potential of capitalism. Across all the traumatic world events over this time period, from the Great Depression to World War II to the Great Recession of recent years, you still earned a solid return by investing and staying invested. But risks like war and economic downturn also point out why we believe most portfolios should also contain some short-term bonds.
risk and rewards
examined for Bonds
1964 – 2012
One-Month U.S. Six-Month U.S. One-Year U.S. Five-Year U.S. Long-Term
Maturity Treasury Bills Treasury Bills Treasury Notes Treasury Notes Government Bonds
Annualized Compound 5.22 5.95 6.16 7.17 7.68 Return (%)
Annualized Standard 1.49 1.83 2.37 6.14 11.49 Deviation (%)
12%10%8%6%4%2%0%
Annualized Standard DeviationAnnualized Total Return
Putting Asset class investing to Work for You — 9
Build Your Plan Using Scientific and Academic research
D e s i g n BuilD Protect
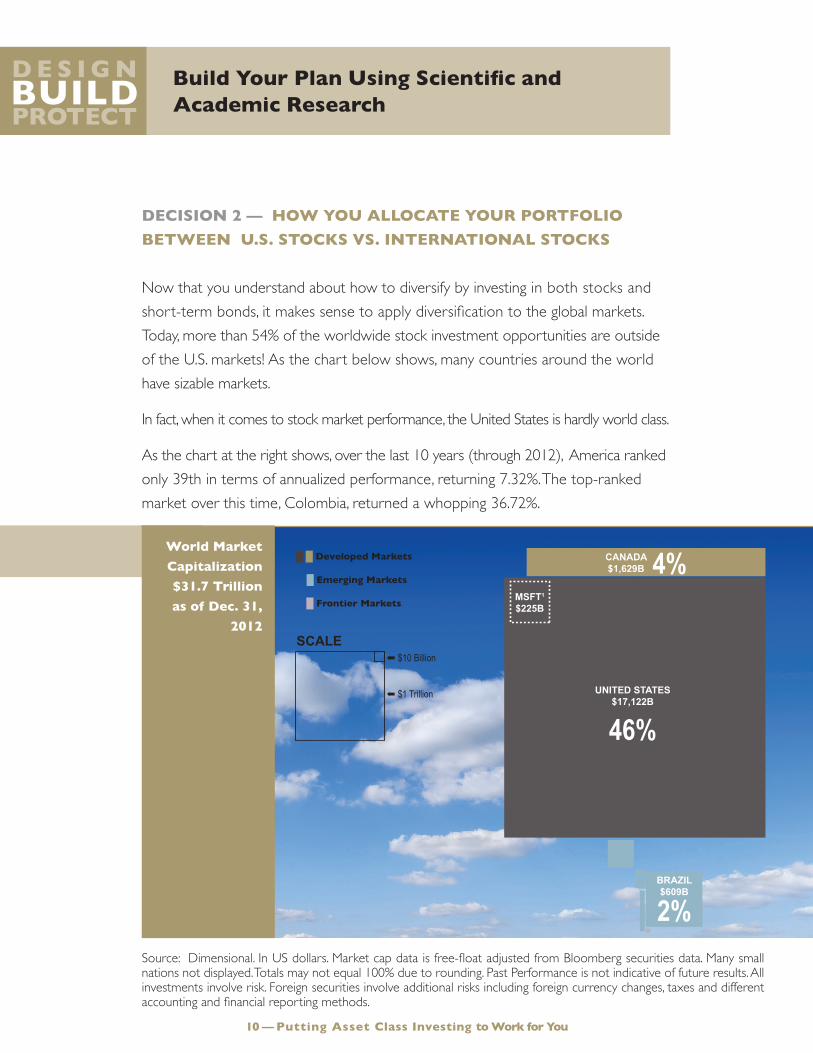
Decision 2 — HoW You AllocAte Your PortFolio
BetWeen u.s. stocKs Vs. internAtionAl stocKs
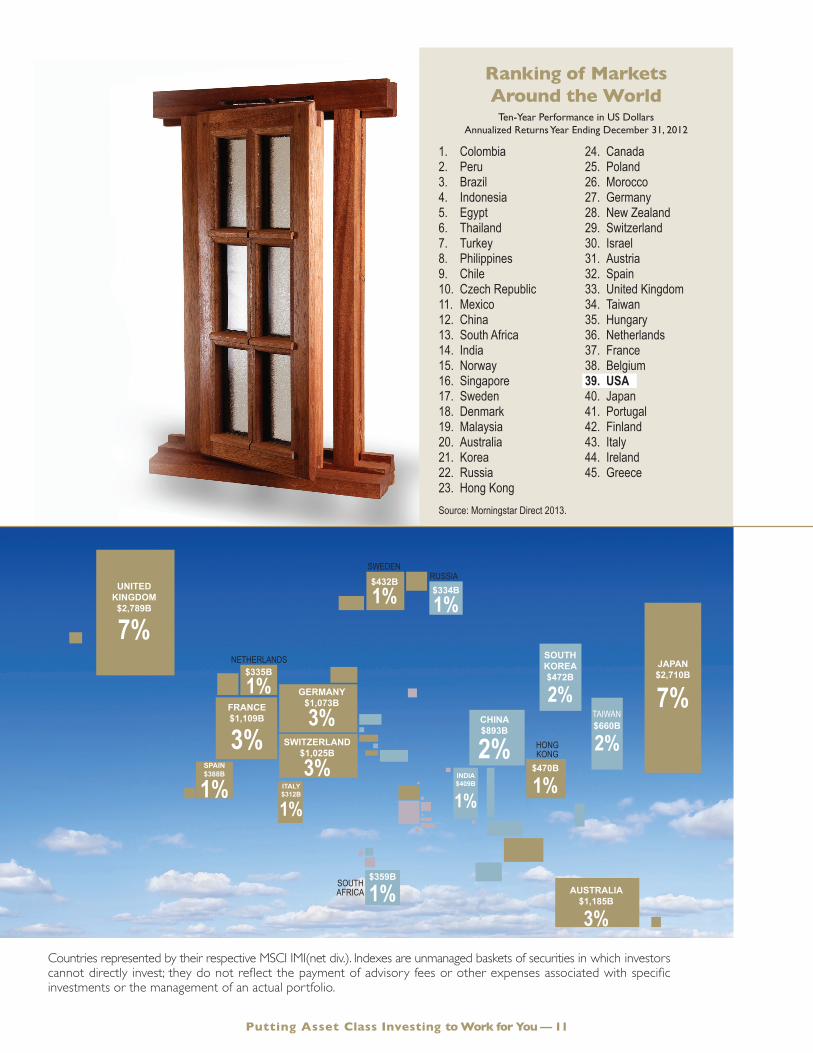
Now that you understand about how to diversify by investing in both stocks and short-term bonds, it makes sense to apply diversification to the global markets. Today, more than 54% of the worldwide stock investment opportunities are outside of the U.S. markets! As the chart below shows, many countries around the world have sizable markets.
In fact, when it comes to stock market performance, the United States is hardly world class.
As the chart at the right shows, over the last 10 years (through 2012), America ranked only 39th in terms of annualized performance, returning 7.32%. The top-ranked market over this time, Colombia, returned a whopping 36.72%.
World Market
capitalization
$31.7 trillion
as of Dec. 31,
2012
Putting Asset class investing to Work for You — 1110 — Putting Asset class investing to Work for You
MEXICO
UNITED STATES$12,129B
42%
COLOMBIA
ARGENTINA
PERU
CHILE
IRELAND
PORTUGAL
BELGIUMNETHERLANDS
NORWAY
DENMARK
OTHEREUROPEANNATIONS
SWEDEN FINLANDRUSSIA
POLANDCZECH REPUBLIC
AUSTRIAHUNGARY
TURKEYGREECE PAKISTAN
LEBANON
ISRAELKUWAIT
BAHRAINQATAR
OMAN
EGYPTMOROCCO
SOUTH AFRICA
UAESRI LANKA
INDONESIA
THAILAND
TAIWAN
HONGKONG
MALAYSIA
SINGAPORE
PHILIPPINES
NEW ZEALAND
VIETNAM
JORDAN
OTHER AFRICAN NATIONS
MSFT1
$269B
CANADA$1,204B 4%
UNITED KINGDOM$2,469B
9%JAPAN$2,429B
9%
AUSTRALIA$969B
3%
SOUTHKOREA$472B
2%
$269B
1%
FRANCE$1,188B
4%CHINA$654B
2%
GERMANY$901B
3%SWITZERLAND
$838B
3%
$464B
2%
$211B
1%
$137B
1%$315B
1%
INDIA$295B
1%
$305B
4%
SPAIN$494B
2% ITALY$393B
2%
$261B
1%BRAZIL$580B
2%
➡
$10 Billion
➡
$1 Trillion
SCALE
█ █ Developed Markets
█ Emerging Markets
█ Frontier Markets
UNITED STATES$17,122B
46%
NETHERLANDS
SWEDENRUSSIA
SOUTH AFRICA
TAIWAN
HONGKONG
MSFT1
$225B
CANADA$1,629B 4%
UNITED KINGDOM$2,789B
7%JAPAN$2,710B
7%
AUSTRALIA$1,185B
3%
SOUTHKOREA$472B
2%
$470B
1%
FRANCE$1,109B
3%CHINA$893B
2%
GERMANY$1,073B
3%SWITZERLAND
$1,025B
3%
$660B
2%
$334B
1%$432B
1%
INDIA$409B
1%
$335B
1%
SPAIN$388B
1% ITALY$312B
1%
$359B
1%BRAZIL$609B
2%
➡ $10 Billion
➡ $1 Trillion
SCALE
█ █ Developed Markets
█ Emerging Markets
█ Frontier Markets
Source: Dimensional. In US dollars. Market cap data is free-float adjusted from Bloomberg securities data. Many small nations not displayed. Totals may not equal 100% due to rounding. Past Performance is not indicative of future results. All investments involve risk. Foreign securities involve additional risks including foreign currency changes, taxes and different accounting and financial reporting methods.
UNITED STATES$17,122B
46%
NETHERLANDS
SWEDENRUSSIA
SOUTH AFRICA
TAIWAN
HONGKONG
MSFT1
$225B
CANADA$1,629B 4%
UNITED KINGDOM$2,789B
7%JAPAN$2,710B
7%
AUSTRALIA$1,185B
3%
SOUTHKOREA$472B
2%
$470B
1%
FRANCE$1,109B
3%CHINA$893B
2%
GERMANY$1,073B
3%SWITZERLAND
$1,025B
3%
$660B
2%
$334B
1%$432B
1%
INDIA$409B
1%
$335B
1%
SPAIN$388B
1% ITALY$312B
1%
$359B
1%BRAZIL$609B
2%
➡ $10 Billion
➡ $1 Trillion
SCALE
█ █ Developed Markets
█ Emerging Markets
█ Frontier Markets
Putting Asset class investing to Work for You — 11
Source: Morningstar Direct 2013.
ranking of Markets Around the World
Ten-Year Performance in US Dollars Annualized Returns Year Ending December 31, 2012
1. Colombia2. Peru 3. Brazil4. Indonesia5. Egypt6. Thailand7. Turkey 8. Philippines9. Chile10. Czech Republic11. Mexico12. China13. South Africa14. India15. Norway16. Singapore17. Sweden18. Denmark19. Malaysia20. Australia21. Korea22. Russia23. Hong Kong
24. Canada25. Poland26. Morocco27. Germany28. New Zealand29. Switzerland30. Israel31. Austria32. Spain33. United Kingdom34. Taiwan35. Hungary36. Netherlands37. France38. Belgium39. Usa40. Japan41. Portugal42. Finland43. Italy44. Ireland45. Greece
Countries represented by their respective MSCI IMI(net div.). Indexes are unmanaged baskets of securities in which investors cannot directly invest; they do not reflect the payment of advisory fees or other expenses associated with specific investments or the management of an actual portfolio.
Build Your Plan Using Scientific and Academic research
D e s i g n BuilD Protect
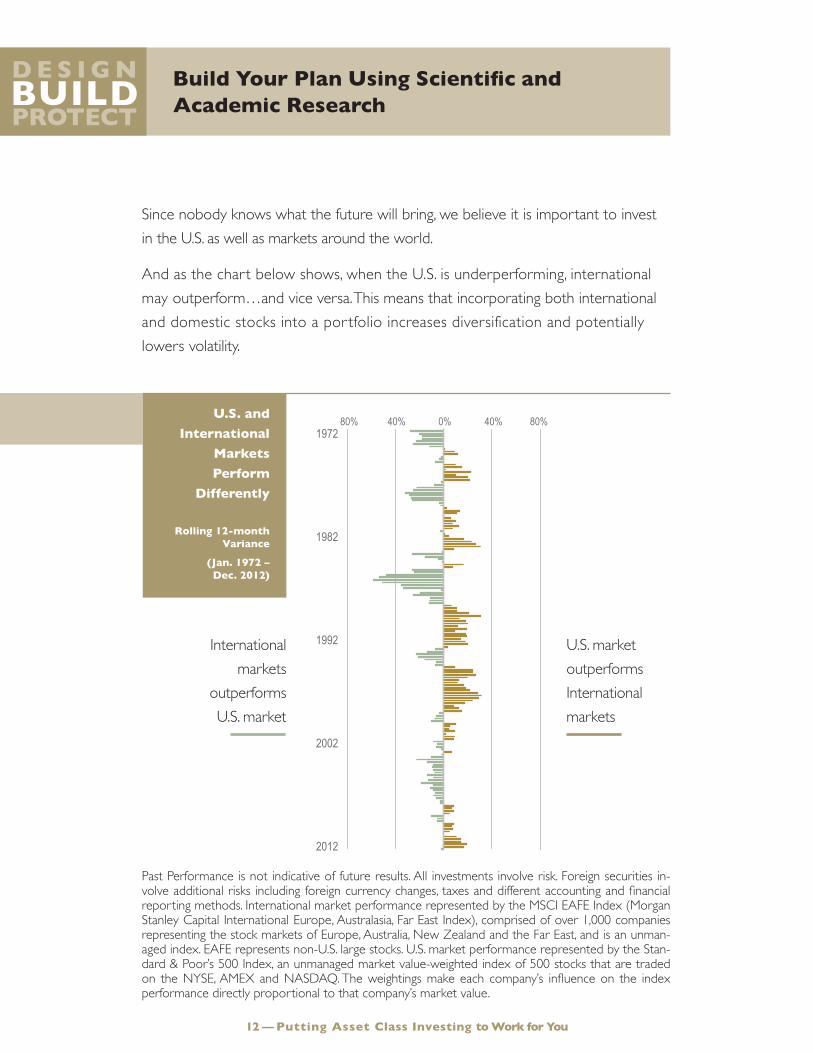
u.s. and
international
Markets
Perform
Differently
rolling 12-month Variance
(Jan. 1972 – Dec. 2012)
Since nobody knows what the future will bring, we believe it is important to invest in the U.S. as well as markets around the world.
And as the chart below shows, when the U.S. is underperforming, international may outperform…and vice versa. This means that incorporating both international and domestic stocks into a portfolio increases diversification and potentially lowers volatility.
1972
1982
1992
2002
2012
80% 40% 0% 40% 80%
Putting Asset class investing to Work for You — 1312 — Putting Asset class investing to Work for You
Past Performance is not indicative of future results. All investments involve risk. Foreign securities in-volve additional risks including foreign currency changes, taxes and different accounting and financial reporting methods. International market performance represented by the MSCI EAFE Index (Morgan Stanley Capital International Europe, Australasia, Far East Index), comprised of over 1,000 companies representing the stock markets of Europe, Australia, New Zealand and the Far East, and is an unman-aged index. EAFE represents non-U.S. large stocks. U.S. market performance represented by the Stan-dard & Poor’s 500 Index, an unmanaged market value-weighted index of 500 stocks that are traded on the NYSE, AMEX and NASDAQ. The weightings make each company’s influence on the index performance directly proportional to that company’s market value.
U.S. market outperforms International markets
International markets
outperforms U.S. market
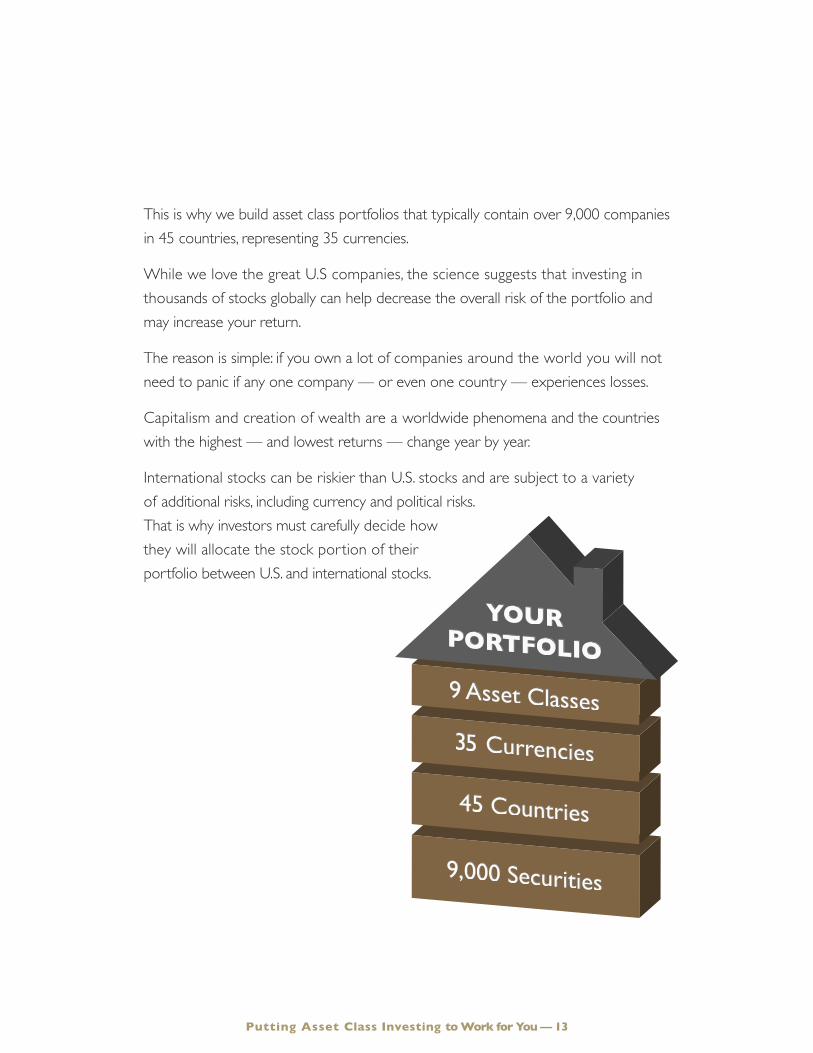
This is why we build asset class portfolios that typically contain over 9,000 companies in 45 countries, representing 35 currencies.
While we love the great U.S companies, the science suggests that investing in thousands of stocks globally can help decrease the overall risk of the portfolio and may increase your return.
The reason is simple: if you own a lot of companies around the world you will not need to panic if any one company — or even one country — experiences losses.
Capitalism and creation of wealth are a worldwide phenomena and the countries with the highest — and lowest returns — change year by year.
International stocks can be riskier than U.S. stocks and are subject to a variety of additional risks, including currency and political risks. That is why investors must carefully decide how they will allocate the stock portion of their portfolio between U.S. and international stocks.
Putting Asset class investing to Work for You — 13
increased expected returns
Decreased risk and
expected returns
Total Stock Market
small company
stocks
large company
stocks
growth company
stocks
Value company
stocks
Build Your Plan Using Scientific and Academic research
D e s i g n BuilD Protect
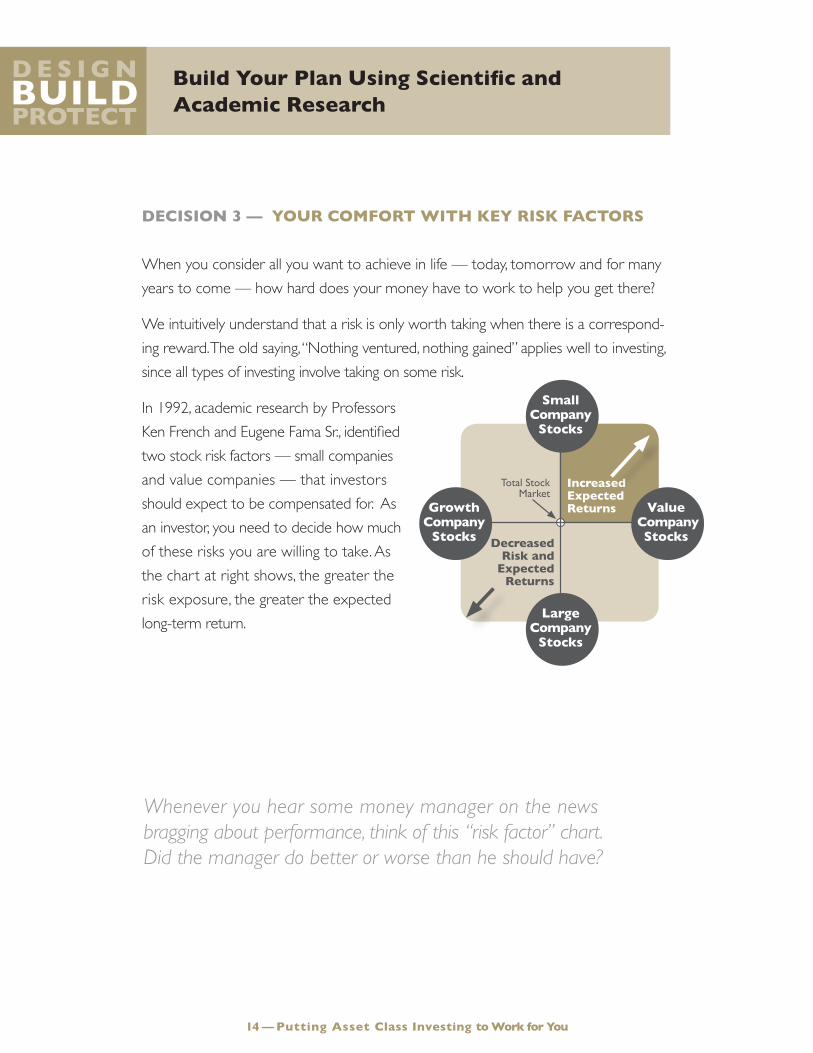
Decision 3 — Your coMFort WitH KeY risK FActors
When you consider all you want to achieve in life — today, tomorrow and for many years to come — how hard does your money have to work to help you get there?
We intuitively understand that a risk is only worth taking when there is a correspond-ing reward. The old saying, “Nothing ventured, nothing gained” applies well to investing, since all types of investing involve taking on some risk.
In 1992, academic research by Professors Ken French and Eugene Fama Sr., identified two stock risk factors — small companies and value companies — that investors should expect to be compensated for. As an investor, you need to decide how much of these risks you are willing to take. As the chart at right shows, the greater the risk exposure, the greater the expected long-term return.
14 — Putting Asset class investing to Work for You
Whenever you hear some money manager on the news bragging about performance, think of this “risk factor” chart. Did the manager do better or worse than he should have?

Small companies are inherently riskier than large companies and historically
have outperformed.
Conventional wisdom might say that we would get better returns by investing in large, well-known companies than we would be investing in smaller, riskier companies.
Surprisingly, the science tells us something quite different. Did you know that from 1927 to 2012, smaller companies in the U.S. have outperformed large companies by almost 2% annually? (See the chart on p. 17 for more details). If you are seeking a greater rate of return, consider allocating a portion of your portfolio to smaller companies to provide you with a potential engine of growth. Though small company stocks are more volatile than large company stocks, their return has been greater over time.
Small company stocks may be subject to a higher degree of market risk than the securities of
more established companies because they may be more volatile and less liquid.
Putting Asset class investing to Work for You — 15
Build Your Plan Using Scientific and Academic research
D e s i g n BuilD Protect
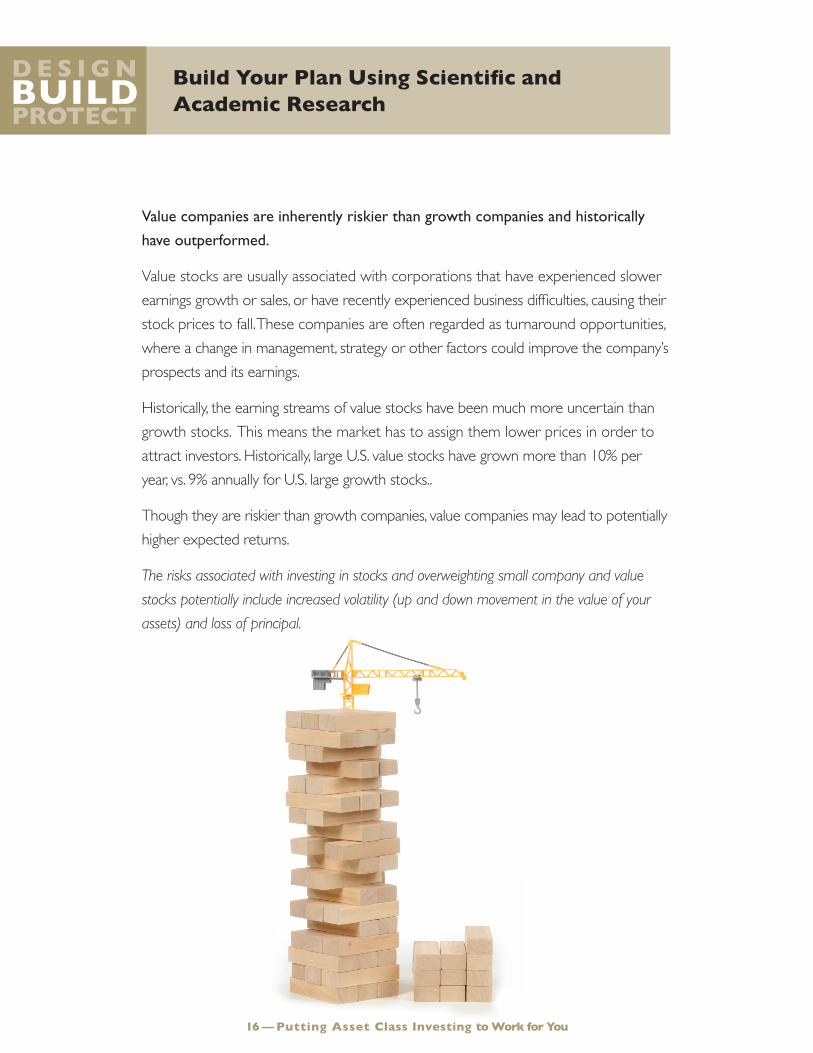
Value companies are inherently riskier than growth companies and historically
have outperformed.
Value stocks are usually associated with corporations that have experienced slower earnings growth or sales, or have recently experienced business difficulties, causing their stock prices to fall. These companies are often regarded as turnaround opportunities, where a change in management, strategy or other factors could improve the company’s prospects and its earnings.
Historically, the earning streams of value stocks have been much more uncertain than growth stocks. This means the market has to assign them lower prices in order to attract investors. Historically, large U.S. value stocks have grown more than 10% per year, vs. 9% annually for U.S. large growth stocks..
Though they are riskier than growth companies, value companies may lead to potentially higher expected returns.
The risks associated with investing in stocks and overweighting small company and value
stockspotentiallyincludeincreasedvolatility(upanddownmovementinthevalueofyour
assets)andlossofprincipal.
Putting Asset class investing to Work for You — 1716 — Putting Asset class investing to Work for You

Size & Value Effects Are Strong Globally
As the chart below shows, the higher historical returns offered by small stocks and value stocks are global — occurring not just in the U.S., but in developed countries around the world and even in emerging markets. But small and value also are much more volatile (that is what a higher “standard deviation” means). You can’t get return without risk.
Disclosure: In US dollars. Indices are not available for direct investment. Their performance does not reflect the expenses associated with the management of an actual portfolio. Past performance is not a guarantee of future results. US value and growth index data (ex utilities) provided by Fama/French. The S&P data are provided by Standard & Poor’s Index Services Group. CRSP data provided by the Center for Research in Security Prices, University of Chicago. International Value data provided by Fama/French from Bloomberg and MSCI securities data. International Small data compiled by Dimensional from Bloomberg, StyleResearch, London Business School, and Nomura Securities data. MSCI EAFE Index is net of foreign withholding taxes on dividends; copyright MSCI 2013, all rights reserved. Emerging markets index data simulated by Fama/French from countries in the IFC Investable Universe; simulations are free-float weighted both within each country and across all countries.The risks associated with investing in stocks and overweighting small company and value stocks potentially include increased volatility (up and down movement in the value of your assets) and loss of principal. Emerging markets involve additional risks, including, but not limited to, currency fluctuation, political insta-bility, foreign taxes, and different methods of accounting and financial reporting. As a result, they may not be suitable investment options for everyone. Emerging Markets represents securities in countries with developing economies and provide potentially high returns. Many Latin American, Eastern European and Asian countries are considered emerging markets. International markets involve additional risks, including, but not limited to, currency fluctuation, political instability, foreign taxes, and different methods of account-ing and financial reporting. As a result, they may not be suitable investment options for everyone.
Putting Asset class investing to Work for You — 17
13.57
10.23 9.82 9.11
11.54
8.84
US Large Value
S&P 500 US Large Growth
US Small Value
CRSP6-10
US Small Growth
14.85
Intl. Value
14.79
Intl. Small
8.79
Intl. Growth
10.26
MSCI EAFE
15.95
Emerging Markets
Value
13.42
Emerging MarketsSmall
12.27
Emerging Markets
10.25
Emerging Markets Growth
Average Return (%) 13.80 11.82 11.36 18.83 15.75 13.72 17.54 18.19 12.48 22.62 20.10 17.82Standard Deviation (%)
Annualized Compound Returns (%)
26.99 20.30 21.69 34.86 30.66 33.70 24.48 27.93 21.9610.9621.81 41.40 39.97 35.67
15.5734.01
Non-US Developed Markets Stocks1975-2012
Emerging Markets Stocks1989-2012
US Large Capitalization Stocks1927-2012
US Small Capitalization Stocks1927-2012

Protect Your Plan with a Disciplined and structured Approach
D e s i g n BuilD Protect
to be a successful investor you need discipline and structure — and ongoing education — to manage tHrougH markets rather than to markets.
You don’t want to “guess” when it comes to investing to meet your life goals. And don’t let emotions derail your best laid plans.
Putting Asset class investing to Work for You — 19
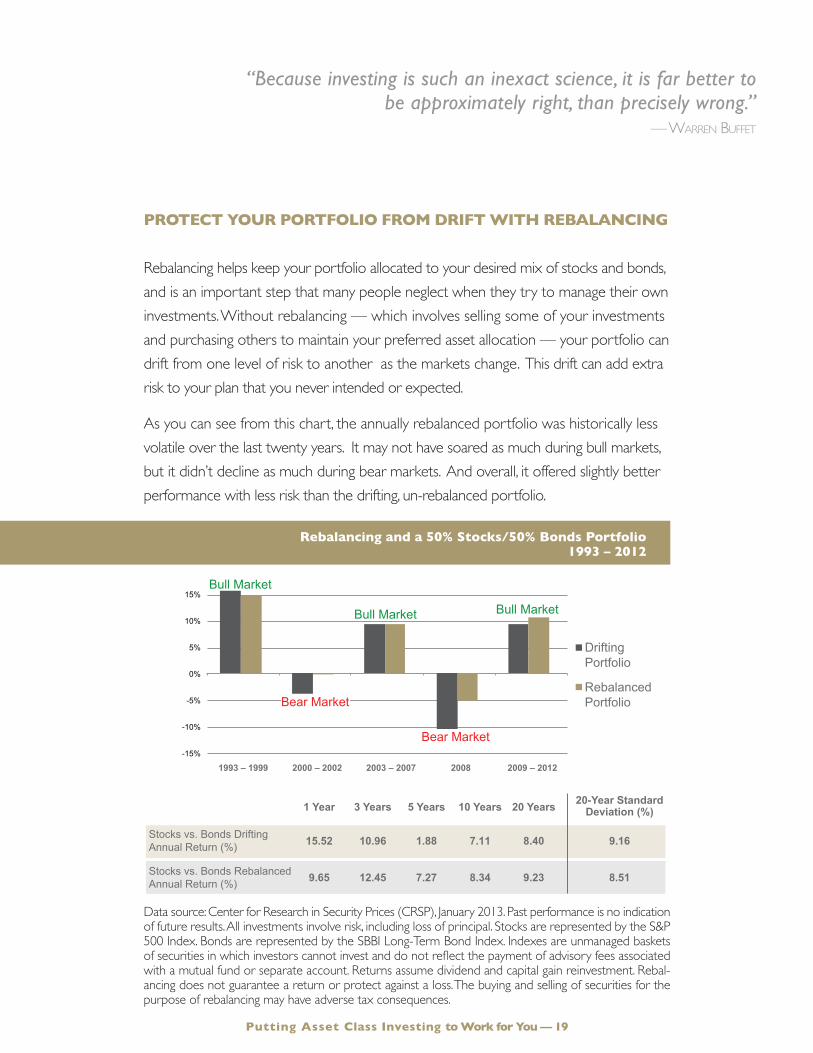
Protect Your PortFolio FroM DriFt WitH reBAlAncing
Rebalancing helps keep your portfolio allocated to your desired mix of stocks and bonds, and is an important step that many people neglect when they try to manage their own investments. Without rebalancing — which involves selling some of your investments and purchasing others to maintain your preferred asset allocation — your portfolio can drift from one level of risk to another as the markets change. This drift can add extra risk to your plan that you never intended or expected.
As you can see from this chart, the annually rebalanced portfolio was historically less volatile over the last twenty years. It may not have soared as much during bull markets, but it didn’t decline as much during bear markets. And overall, it offered slightly better performance with less risk than the drifting, un-rebalanced portfolio.
Data source: Center for Research in Security Prices (CRSP), January 2013. Past performance is no indication of future results. All investments involve risk, including loss of principal. Stocks are represented by the S&P 500 Index. Bonds are represented by the SBBI Long-Term Bond Index. Indexes are unmanaged baskets of securities in which investors cannot invest and do not reflect the payment of advisory fees associated with a mutual fund or separate account. Returns assume dividend and capital gain reinvestment. Rebal-ancing does not guarantee a return or protect against a loss. The buying and selling of securities for the purpose of rebalancing may have adverse tax consequences.
rebalancing and a 50% stocks/50% Bonds Portfolio 1993 – 2012
“Because investing is such an inexact science, it is far better to be approximately right, than precisely wrong.”
— Warren Buffet
Putting Asset class investing to Work for You — 19
-15%
-10%
-5%
0%
5%
10%
15%
1993 – 1999 2000 – 2002 2003 – 2007 2008 2009 – 2012
Drifting Portfolio
Rebalanced Portfolio
Stocks vs. Bonds Rebalanced Annual Return (%)
Stocks vs. Bonds Drifting Annual Return (%)
1 Year
15.52
9.65
3 Years
10.96
12.45
5 Years
1.88
7.27
10 Years
7.11
8.34
20 Years
8.40
9.23
20-Year Standard Deviation (%)
9.16
8.51
Bull Market Bull Market
Bear Market
Bull Market
Bear Market
OPTIMISTIC
EXCITED
ELATED
CONCERNED
NERVOUS
ALARMEDFRIGHTENED
RELIEVED
OPTIMISTIC
Greatest Potential Risk
Greatest Potential Opportunity
“Time to buy”
“Time to re-evaluate”“Time to sell”
“This is only temporary”
Protect Your Plan with a Disciplined and structured Approach
D e s i g n BuilD Protect
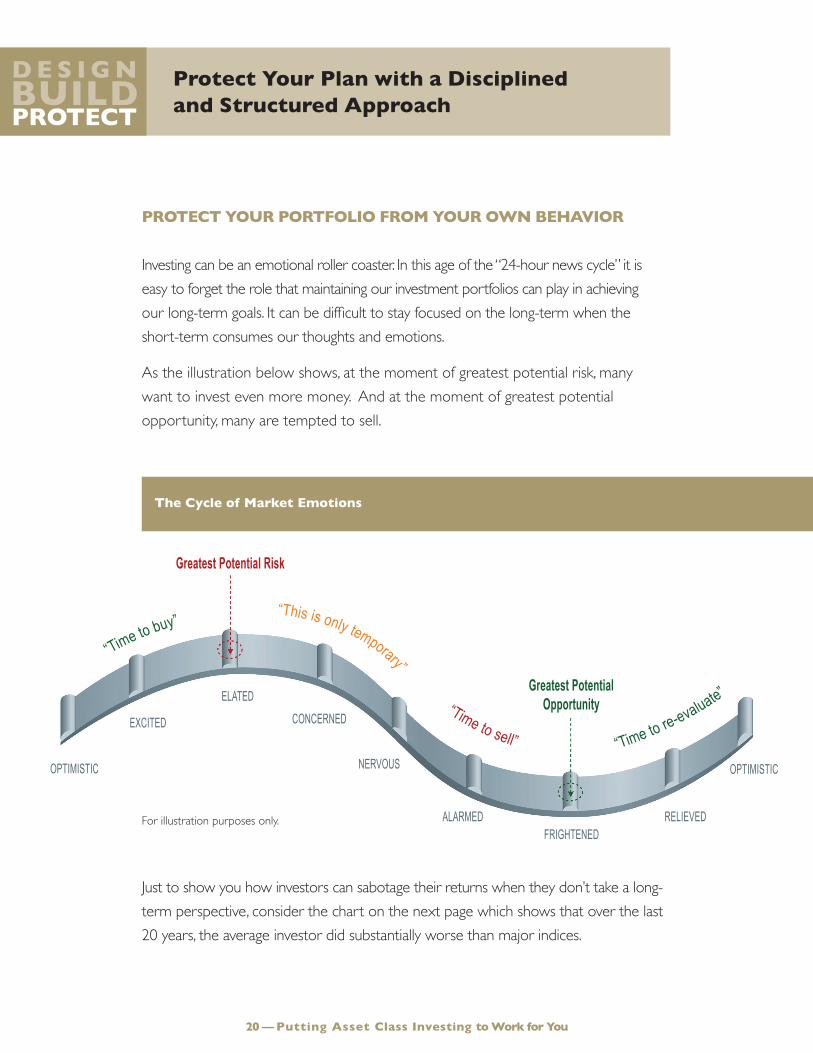
Protect Your PortFolio FroM Your oWn BeHAVior
Investing can be an emotional roller coaster. In this age of the “24-hour news cycle” it is easy to forget the role that maintaining our investment portfolios can play in achieving our long-term goals. It can be difficult to stay focused on the long-term when the short-term consumes our thoughts and emotions.
As the illustration below shows, at the moment of greatest potential risk, many want to invest even more money. And at the moment of greatest potential opportunity, many are tempted to sell.
Just to show you how investors can sabotage their returns when they don’t take a long-term perspective, consider the chart on the next page which shows that over the last 20 years, the average investor did substantially worse than major indices.
the cycle of Market emotions
For illustration purposes only.
20 — Putting Asset class investing to Work for You
For illustration purposes only.
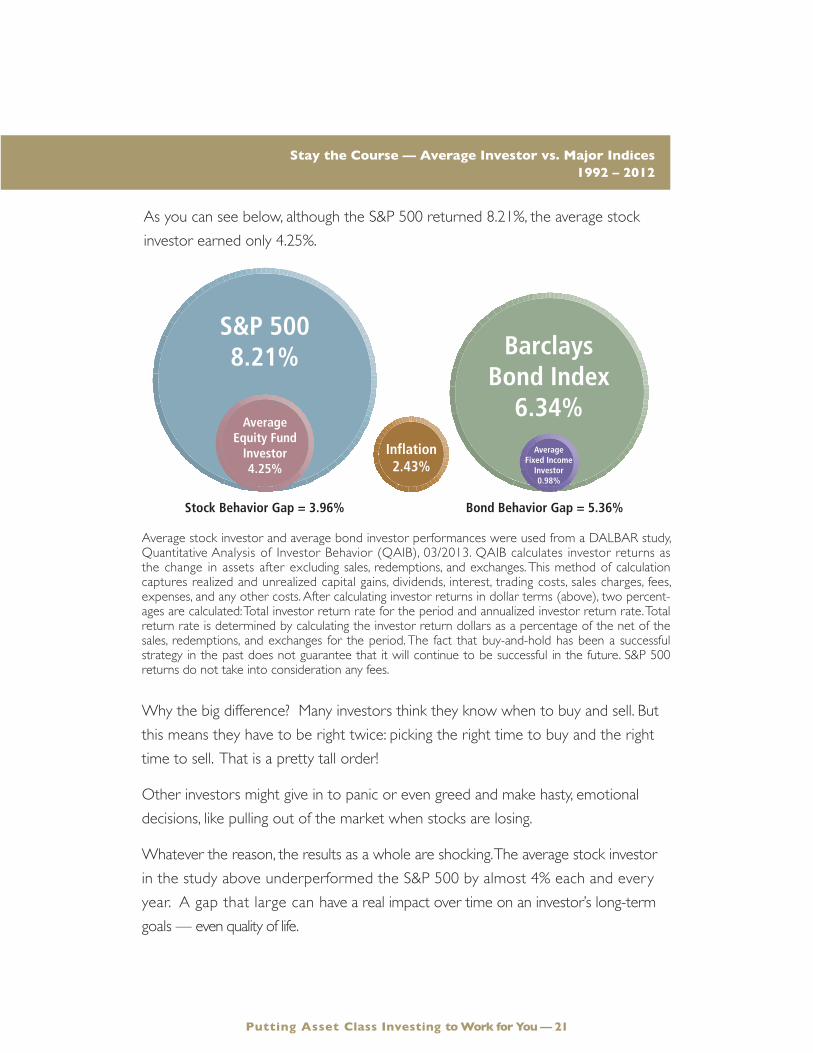
Average stock investor and average bond investor performances were used from a DALBAR study, Quantitative Analysis of Investor Behavior (QAIB), 03/2013. QAIB calculates investor returns as the change in assets after excluding sales, redemptions, and exchanges. This method of calculation captures realized and unrealized capital gains, dividends, interest, trading costs, sales charges, fees, expenses, and any other costs. After calculating investor returns in dollar terms (above), two percent-ages are calculated: Total investor return rate for the period and annualized investor return rate. Total return rate is determined by calculating the investor return dollars as a percentage of the net of the sales, redemptions, and exchanges for the period. The fact that buy-and-hold has been a successful strategy in the past does not guarantee that it will continue to be successful in the future. S&P 500 returns do not take into consideration any fees.
Why the big difference? Many investors think they know when to buy and sell. But this means they have to be right twice: picking the right time to buy and the right time to sell. That is a pretty tall order!
Other investors might give in to panic or even greed and make hasty, emotional decisions, like pulling out of the market when stocks are losing.
Whatever the reason, the results as a whole are shocking. The average stock investor in the study above underperformed the S&P 500 by almost 4% each and every year. A gap that large can have a real impact over time on an investor’s long-term goals — even quality of life.
stay the course — Average investor vs. Major indices 1992 – 2012
Putting Asset class investing to Work for You — 21
Average Fixed Income
Investor0.98%
Inflation2.43%
Average Equity Fund
Investor4.25%
S&P 500 8.21% Barclays
Bond Index6.34%
Stock Behavior Gap = 3.96% Bond Behavior Gap = 5.36%
As you can see below, although the S&P 500 returned 8.21%, the average stock investor earned only 4.25%.
Protect Your Plan with a Disciplined and structured Approach
D e s i g n BuilD Protect
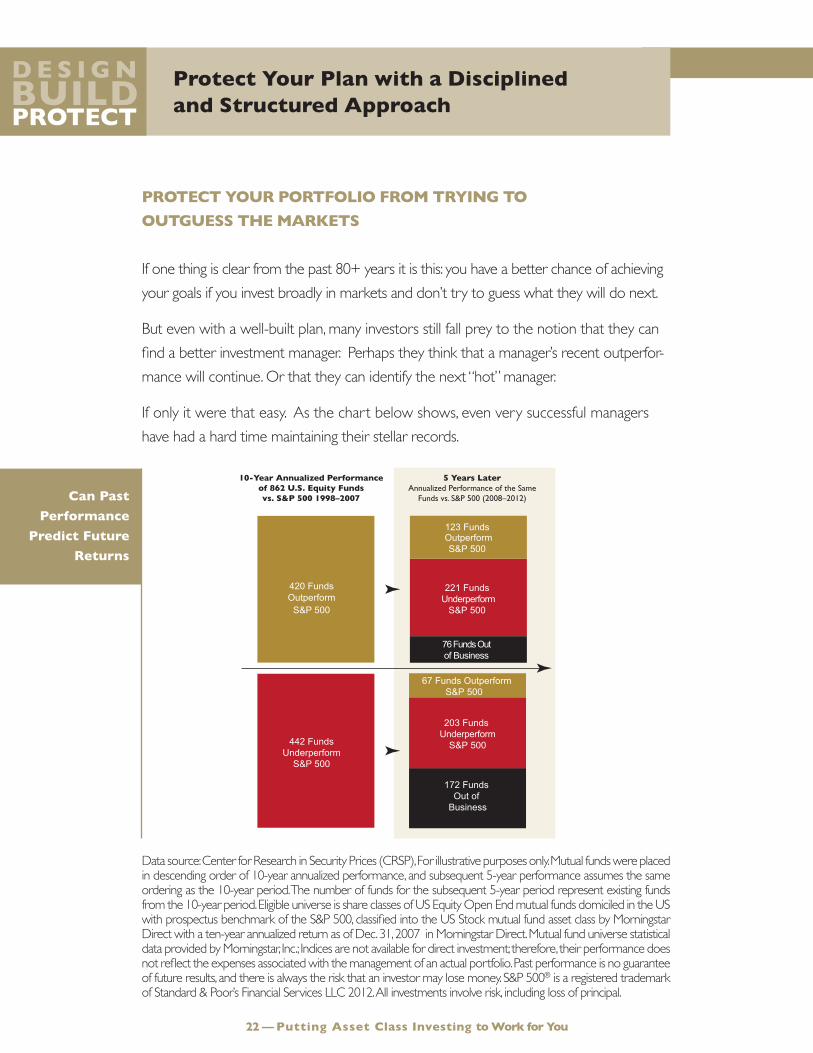
Protect Your PortFolio FroM trYing to
outguess tHe MArKets
If one thing is clear from the past 80+ years it is this: you have a better chance of achieving your goals if you invest broadly in markets and don’t try to guess what they will do next.
But even with a well-built plan, many investors still fall prey to the notion that they can find a better investment manager. Perhaps they think that a manager’s recent outperfor-mance will continue. Or that they can identify the next “hot” manager.
If only it were that easy. As the chart below shows, even very successful managers have had a hard time maintaining their stellar records.
Data source: Center for Research in Security Prices (CRSP), For illustrative purposes only. Mutual funds were placed in descending order of 10-year annualized performance, and subsequent 5-year performance assumes the same ordering as the 10-year period. The number of funds for the subsequent 5-year period represent existing funds from the 10-year period. Eligible universe is share classes of US Equity Open End mutual funds domiciled in the US with prospectus benchmark of the S&P 500, classified into the US Stock mutual fund asset class by Morningstar Direct with a ten-year annualized return as of Dec. 31, 2007 in Morningstar Direct. Mutual fund universe statistical data provided by Morningstar, Inc.; Indices are not available for direct investment; therefore, their performance does not reflect the expenses associated with the management of an actual portfolio. Past performance is no guarantee of future results, and there is always the risk that an investor may lose money. S&P 500® is a registered trademark of Standard & Poor’s Financial Services LLC 2012. All investments involve risk, including loss of principal.
Putting Asset class investing to Work for You — 2322 — Putting Asset class investing to Work for You
5 Years LaterAnnualized Performance of the Same
Funds vs. S&P 500 (2008–2012)
10-Year Annualized Performance of 862 U.S. Equity Funds vs. S&P 500 1998–2007
442 Funds Underperform
S&P 500
67 Funds OutperformS&P 500
203 Funds Underperform
S&P 500
172 Funds Out of
Business
420 Funds Outperform
S&P 500
123 Funds OutperformS&P 500
221 Funds Underperform
S&P 500
76 Funds Out of Business
can Past
Performance
Predict Future
returns
Beating an unmanaged index like the S&P 500 isn’t easy. As the char t on the previous page shows, of the 862 U.S. Equity Funds from 1998 – 2007, only 420 or less than 1/2 managed to beat the S&P 500. So you might think, just invest in one of those winning managers, and you’ll do fine.
But 5 years on, in 2012, 248 funds have closed their doors, merged or gone out of business.
And of the original 420 funds that outperformed, more than 70% failed to sustain their performance or closed their doors.
A few of the underperformers even managed to beat the S&P 500. But there is no predictable pattern to any of this performance — up or down — nothing that we believe offers a sound guide to which manager to invest with for the future.
In fact, these results are broadly consistent with much of the research into the consistency of mutual fund performance and manager skill. As a whole, this research shows that very few managers are able to outperform the markets consistently. Their results are unpredictably unreliable.
And with more than 8,600 mutual funds, finding that consistent outperformer is like looking for a needle in the proverbial haystack.
This is why we believe that instead of trying to beat the markets — you should “join” them, and participate in the potential they offer for long-term growth.
Putting Asset class investing to Work for You — 23

WorKing togetHer
As an independent advisor we act as a valued partner who can help tie your investment plan to your overall life plan. Not only can we provide you with guidance, counseling, monitoring and discipline, we can be a valued catalyst to encourage you to plan ahead for the expected and unexpected.
We are dedicated to helping you reach your goals and believe strongly that our approach can make a real difference as we work together to:
1. Design a plan to meet your life goals
2. Build your plan using scientific and academic research
3. Protect your plan with a disciplined and structured approach
Our Commitment
Weconsideryourlifegoalsfirstandthenworkwithyouasacoach,
guide, mentor and educator to help you keep your plan in focus.
We provide you with clarity, helping you understand the things
you should plan for, the things you should be concerned about
and the things that you shouldn’t.
We provide you with insight, based on our experience and
knowledge of investing and how markets work,
as well as how best to achieve your goals.
We work as your partner, providing you with counsel on an
ongoing basis and are a valuable resource as you make
thebestuseofyourfinancialresourcestoleadafulfillinglife.
24 — Putting Asset class investing to Work for You


LWI Financial Inc. (“Loring Ward”) is an investment adviser registered with the Securities and Exchange Commission. Securities transactions may be offered through Loring Ward Securities Inc., member FINRA/SIPC.
B 12-13-033 (Exp. 4/15) 1013