riskelearning nanotechnology – applications and ... – applications and implications for...
TRANSCRIPT
Organizing Committee:
RISKeLearning Nanotechnology –Applications and Implications for Superfund
March 15, 2007Session 3:
“Nanotechnology – DNAPLRemediation”
Dr. Matt Hull, Luna Innovations, Inc.Dr. Peter Vikesland, Virginia TechDr. Greg Lowry, Carnegie Mellon
University
SBRP/NIEHS EPA MDB
William Suk Michael Gill Nora Savage Maureen Avakian
Heather Henry Jayne Michaud Barbara Walton Larry Whitson
Claudia Thompson Warren Layne Randall Wentsel Larry Reed
Beth Anderson Marian Olsen Mitch Lasat
Kathy Ahlmark Charles Maurice Martha Otto
1
Magnetite Nanoparticles for Remediation of Contaminated
Groundwater
Matthew Hull Principal Investigator Luna Innovations Incorporated Blacksburg, VA 24060
Copyright © Luna Innovations 2006
Peter Vikesland, Ph.D. Assistant Professor, CEE Virginia Tech Blacksburg, VA 24060
Funded by an EPA SBIR grant (Contract No. EP-D-06-079)
2
2
Overview
� EPA SBIR Program
� Magnetite Characterization and Reactivity – Why Magnetite? – Synthesis and Characterization – Carbon Tetrachloride – Preliminary Results
� Encapsulation of Nanoparticles
� Thoughts on Nanotechnology EHS
� Conclusions
Copyright © Luna Innovations 2006
3
3
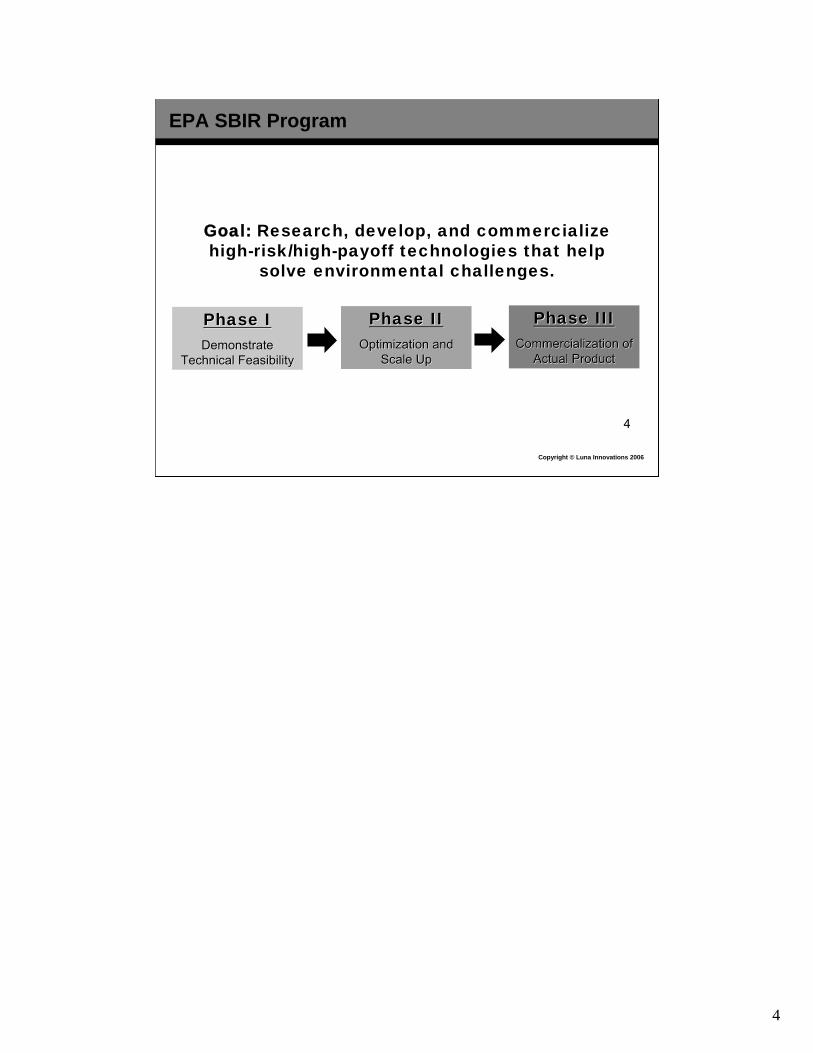
EPA SBIR Program
Goal: Research, develop, and commercialize high-risk/high-payoff technologies that help
solve environmental challenges.
Phase IPhase IDemonstrateDemonstrate
Technical FeasibilityTechnical Feasibility
Phase IIPhase IIOptimization andOptimization and
Scale UpScale Up
Phase IIIPhase IIICommercialization ofCommercialization of
Actual ProductActual Product
Copyright © Luna Innovations 2006
4
4
Luna/VT EPA SBIR Program (Status: Phase II)
� Develop magnetite nanoparticles for remediation of chlorinated organic compounds (other targets)
� Develop delivery strategies that facilitate particle delivery to subsurface and interaction with target
� Scale-up production of Phase II-optimized magnetite form for commercial application
Copyright © Luna Innovations 2006
5
5
Magnetite Characterization and Reactivity
Copyright © Luna Innovations 2006
6
6
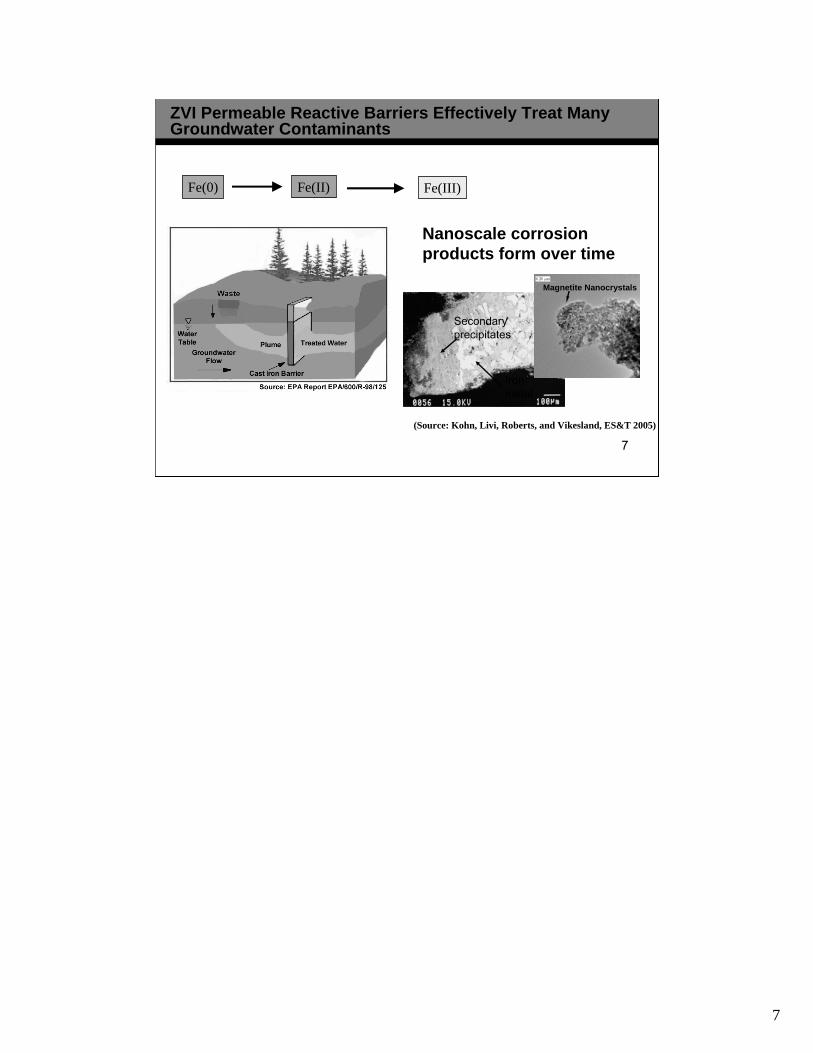
ZVI Permeable Reactive Barriers Effectively Treat Many Groundwater Contaminants
Fe(0) Fe(II) Fe(III)
Iron metal
Secondary precipitates
Magnetite Nanocrystals
(Source: Kohn, Livi, Roberts, and Vikesland, ES&T 2005)
Nanoscale corrosion products form over time
7
7
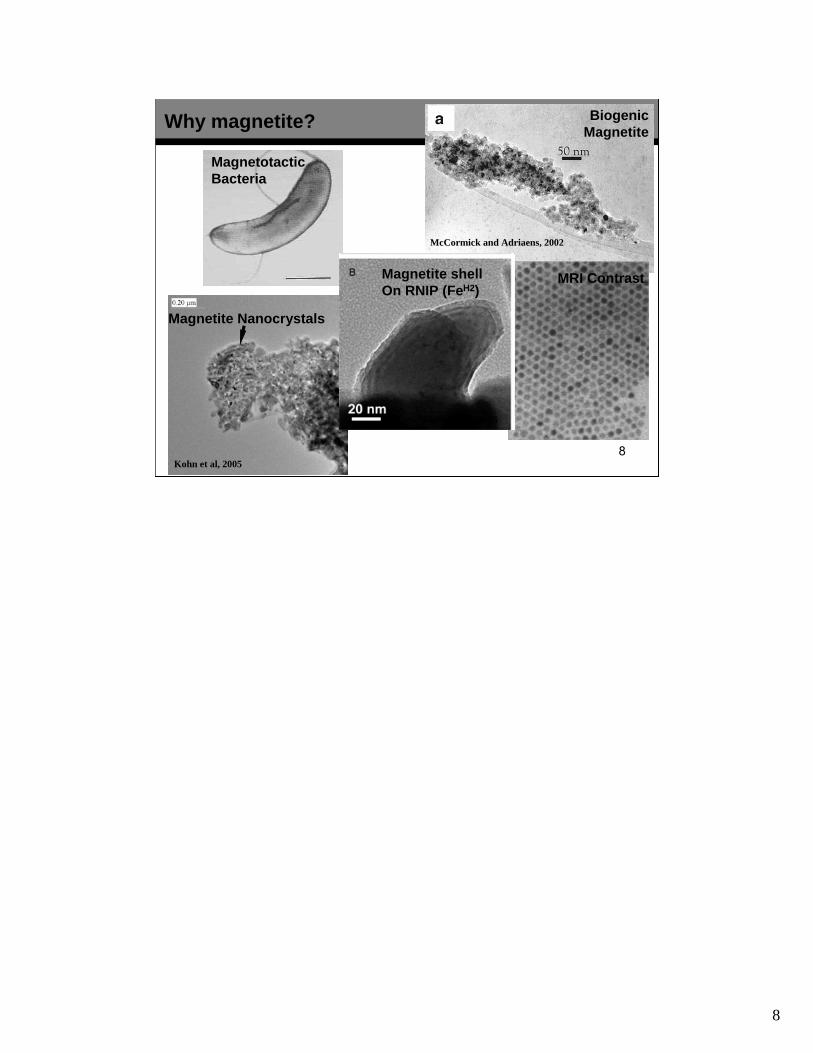
Why magnetite? Biogenic Magnetite
Magnetite Nanocrystals
Kohn et al, 2005
Magnetotactic Bacteria
McCormick and Adriaens, 2002
MRI ContrastMagnetite shell On RNIP (FeH2)
Nurmi et al., 2005
8
8
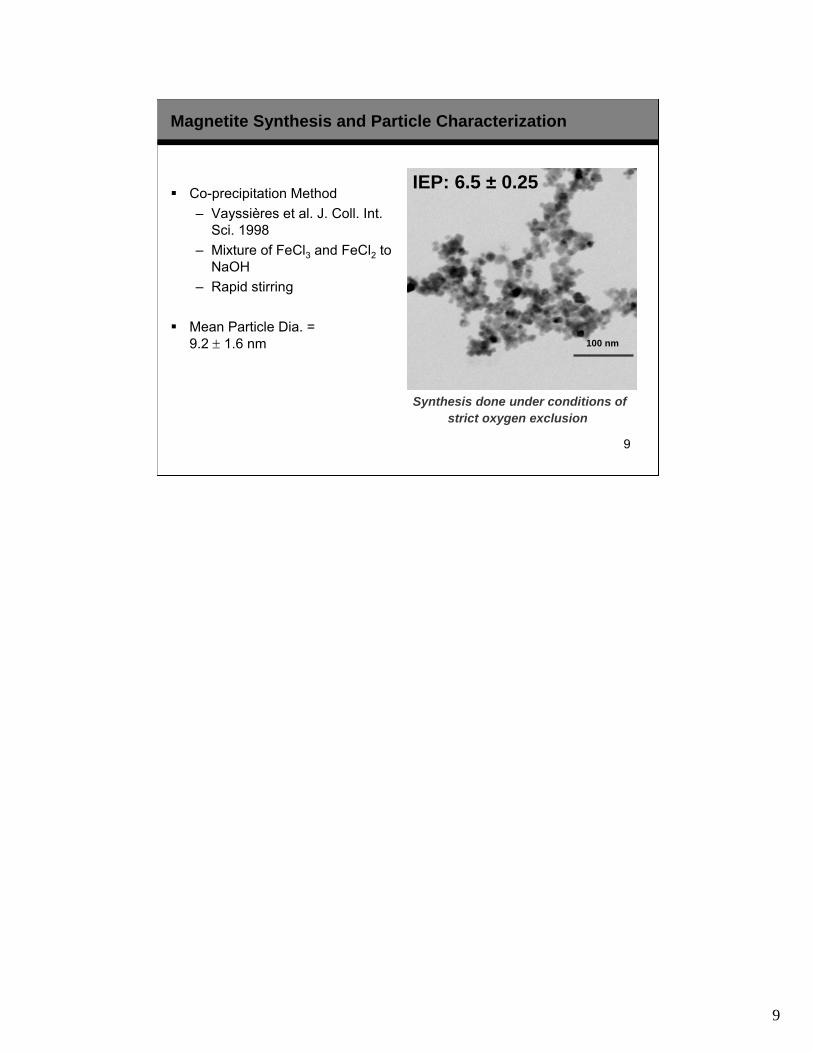
Magnetite Synthesis and Particle Characterization
� Co-precipitation Method
– Vayssières et al. J. Coll. Int. Sci. 1998
– Mixture of FeCl3 and FeCl2 to NaOH
– Rapid stirring
� Mean Particle Dia. = 9.2 ± 1.6 nm 100 nm
Synthesis done under conditions of strict oxygen exclusion
IEP: 6.5 ± 0.25
9
9
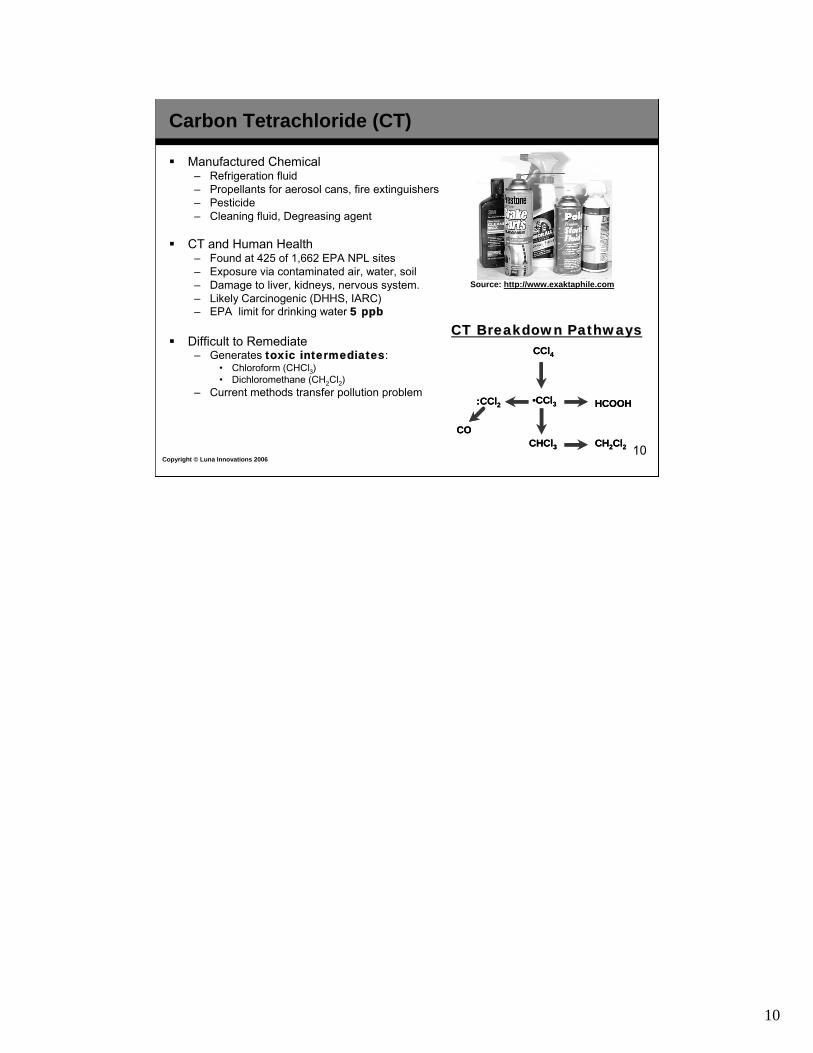
Carbon Tetrachloride (CT)
� Manufactured Chemical – Refrigeration fluid – Propellants for aerosol cans, fire extinguishers – Pesticide – Cleaning fluid, Degreasing agent
� CT and Human Health – Found at 425 of 1,662 EPA NPL sites – Exposure via contaminated air, water, soil – Damage to liver, kidneys, nervous system. – Likely Carcinogenic (DHHS, IARC) – EPA limit for drinking water 5 ppb
� Difficult to Remediate – Generates toxic intermediates:
• Chloroform (CHCl3) • Dichloromethane (CH2Cl2)
– Current methods transfer pollution problem
CCl4CCl
•CCl3 •
CHCl3C CH2Cl2CH
:CCl2:
CO
HCOOH
CO
4
CCl3
HCl3 2Cl2
CCl2 HCOOH
CT Breakdown PathwaysCT Breakdown Pathways
Source: http://www.exaktaphile.com
Copyright © Luna Innovations 2006 10
10
Time (hrs)
0 10 20 30 40 50
CC
l 4 ( μ
M)
0
15
30
45
60
75
90
105
120
135
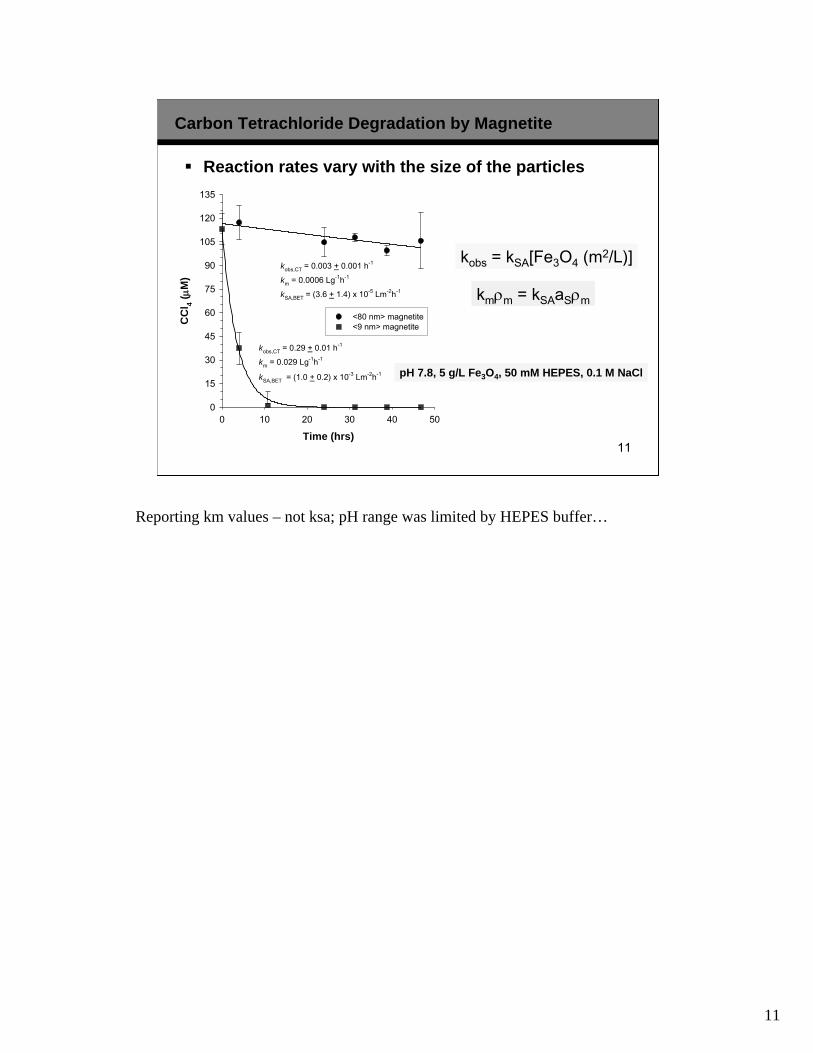
<80 nm> magnetite <9 nm> magnetite
kobs,CT = 0.29 + 0.01 h-1
kobs,CT = 0.003 + 0.001 h-1
kSA,BET = (1.0 + 0.2) x 10-3 Lm-2h-1
kSA,BET = (3.6 + 1.4) x 10-5 Lm-2h-1
k m = 0.0006 Lg-1h-1
k m = 0.029 Lg-1h-1
Carbon Tetrachloride Degradation by Magnetite
� Reaction rates vary with the size of the particles
kobs = kSA[Fe3O4 (m2/L)]
kmρm = kSAaSρm
pH 7.8, 5 g/L Fe3O4, 50 mM HEPES, 0.1 M NaCl
11
Reporting km values – not ksa; pH range was limited by HEPES buffer…
11
501 1 g/L1530 1 g/L1530 3 g/L9002 1 g/L9002 3 g/L
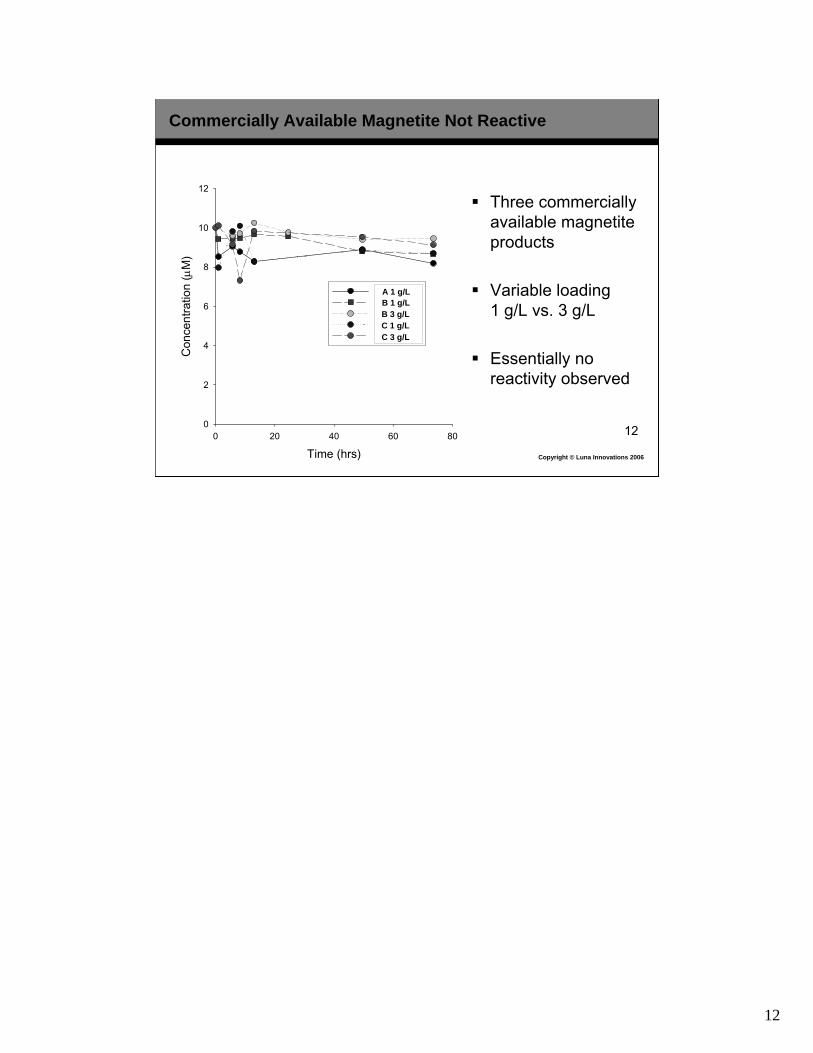
Commercially Available Magnetite Not Reactive
Time (hrs)
0 20 40 60 80
Con
centr
atio
n (μ
M)
0
2
4
6
8
10
12
A 1 g/L B 1 g/L B 3 g/L C 1 g/L C 3 g/L
� Three commercially available magnetite products
� Variable loading 1 g/L vs. 3 g/L
� Essentially no reactivity observed
Copyright © Luna Innovations 2006
12
12
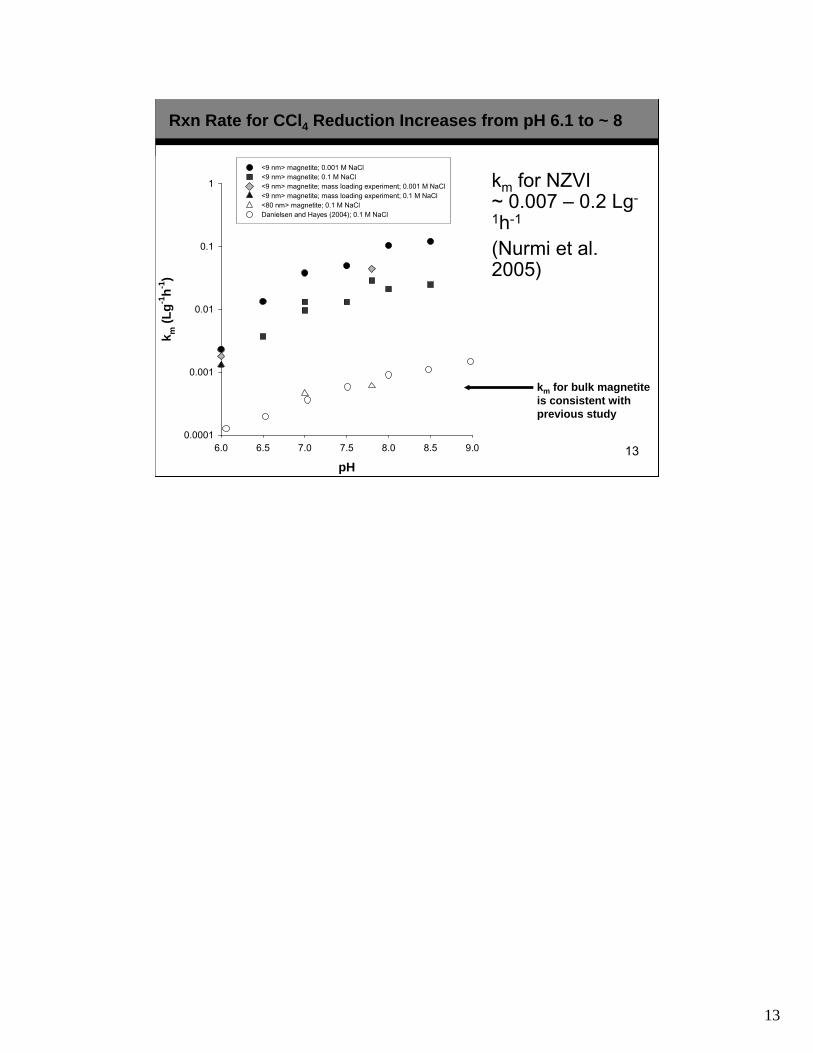
Rxn Rate for CCl4 Reduction Increases from pH 6.1 to ~ 8
pH
6.0 6.5 7.0 7.5 8.0 8.5 9.0
k m (
Lg
-1 h
-1 )
0.0001
0.001
0.01
0.1
1
<9 nm> magnetite; 0.001 M NaCl <9 nm> magnetite; 0.1 M NaCl <9 nm> magnetite; mass loading experiment; 0.001 M NaCl <9 nm> magnetite; mass loading experiment; 0.1 M NaCl <80 nm> magnetite; 0.1 M NaCl Danielsen and Hayes (2004); 0.1 M NaCl
km for bulk magnetite is consistent with previous study
km for NZVI ~ 0.007 – 0.2 Lg
1h-1
(Nurmi et al. 2005)
13
13
pH
6 7 8 9 10 11
Log
(kS
A (L
h -1 m
-2 ))
10-5
10-4
10-3
10-2 5 g/L Experiment BET Normalized 5 g/L Experiment TEM Normalized Danielsen and Hayes (2004)
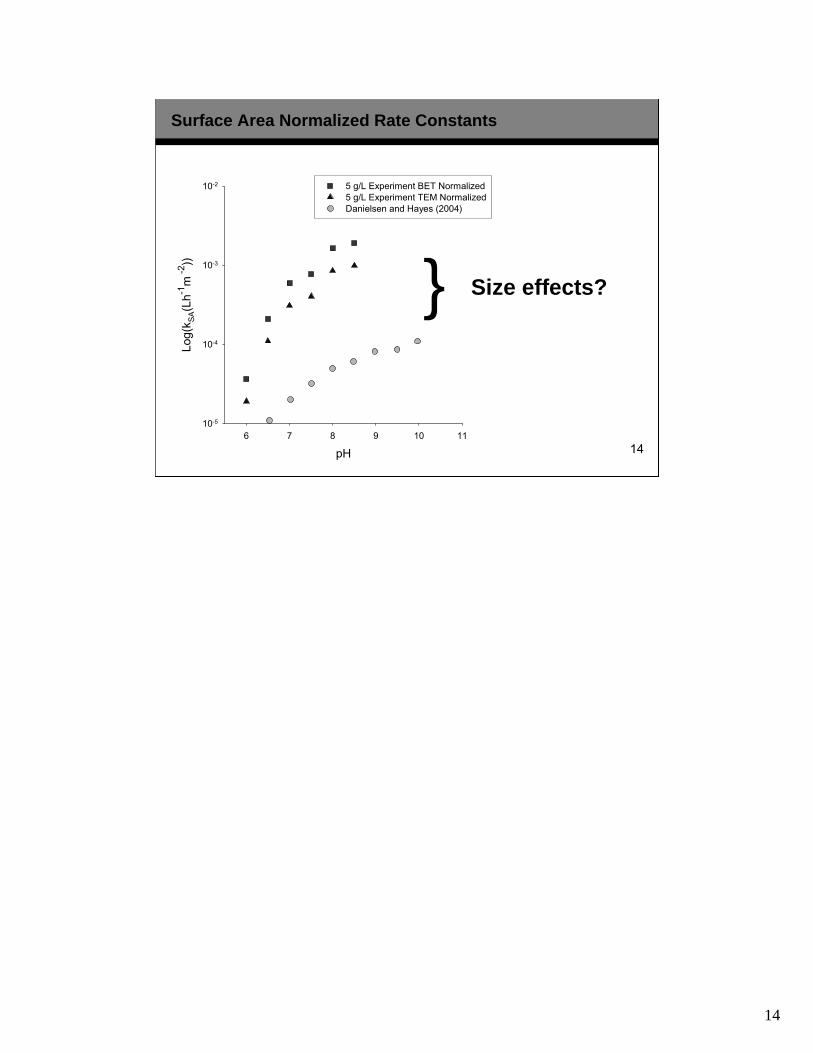
Size effects?
Surface Area Normalized Rate Constants
}
14
14

NaCl
pH 7, 50 mM HEPES, [CT]0 = 100 μM, 5 g/L magnetite
Ionic Strength
0.001 0.01 0.1 1
k m
(L
h -1
g -1
)
0.000
0.001
0.002
0.003
0.004
0.005
0.006
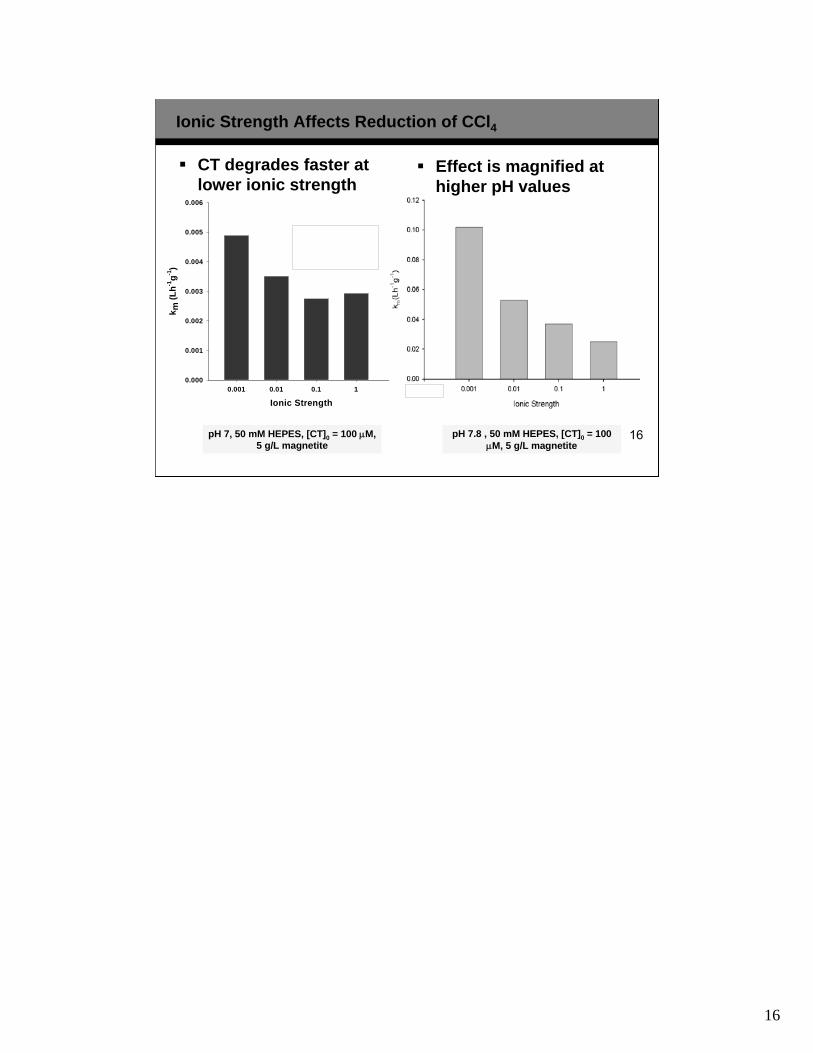
Ionic Strength Affects Reduction of CCl4
� CT degrades faster at lower ionic strength
Time (min)
0 10 20 30 40
Z av
g (
nm
)
0
500
1000
1500
2000
2500
0.01 M
0.001 M
0.1 M
1 M
Stable aggregate size measured using Dynamic Light Scattering
15
15
NaCl
pH 7, 50 mM HEPES, [CT]0 = 100 μM, 5 g/L magnetite
Ionic Strength
0.001 0.01 0.1 1
k m
(L
h -1
g -1
)
0.000
0.001
0.002
0.003
0.004
0.005
0.006
� CT degrades faster at lower ionic strength
pH 7.8 , 50 mM HEPES, [CT]0 = 100 μM, 5 g/L magnetite
� Effect is magnified at higher pH values
Ionic Strength Affects Reduction of CCl4
16
16
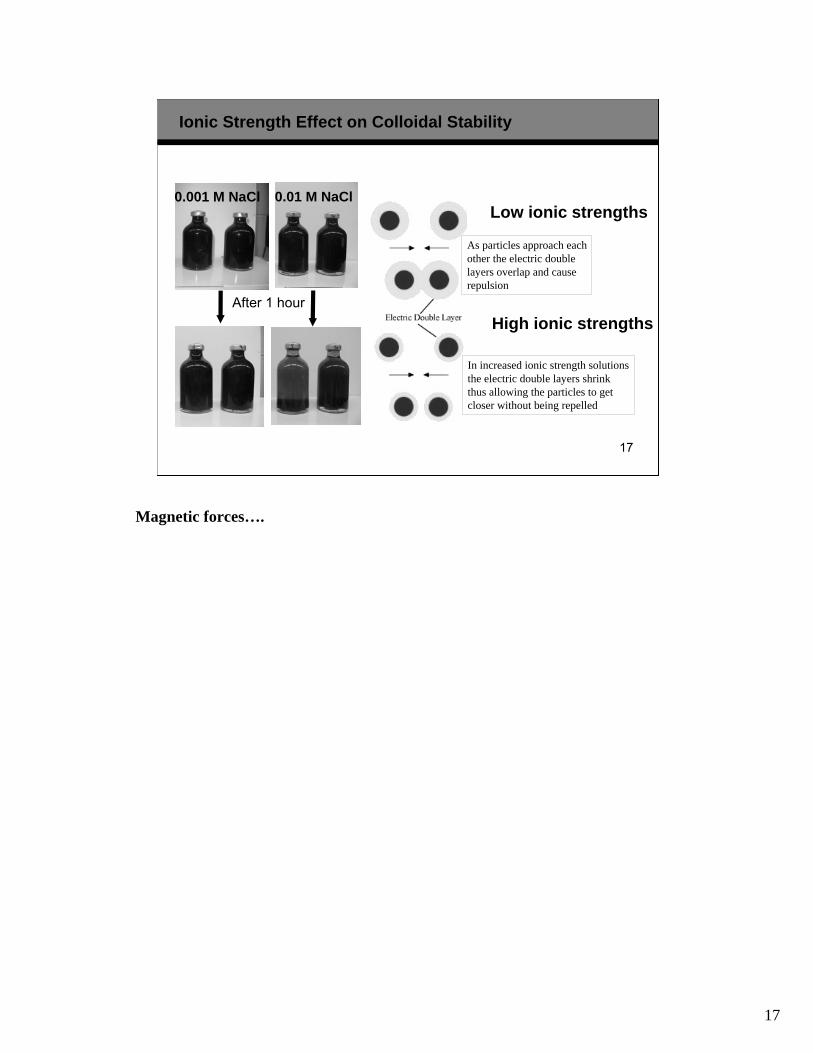
Ionic Strength Effect on Colloidal Stability
0.01 M NaCl0.001 M NaCl
After 1 hour
As particles approach each other the electric double layers overlap and cause repulsion
In increased ionic strength solutions the electric double layers shrink thus allowing the particles to get closer without being repelled
Low ionic strengths
High ionic strengths
17
Magnetic forces….
17
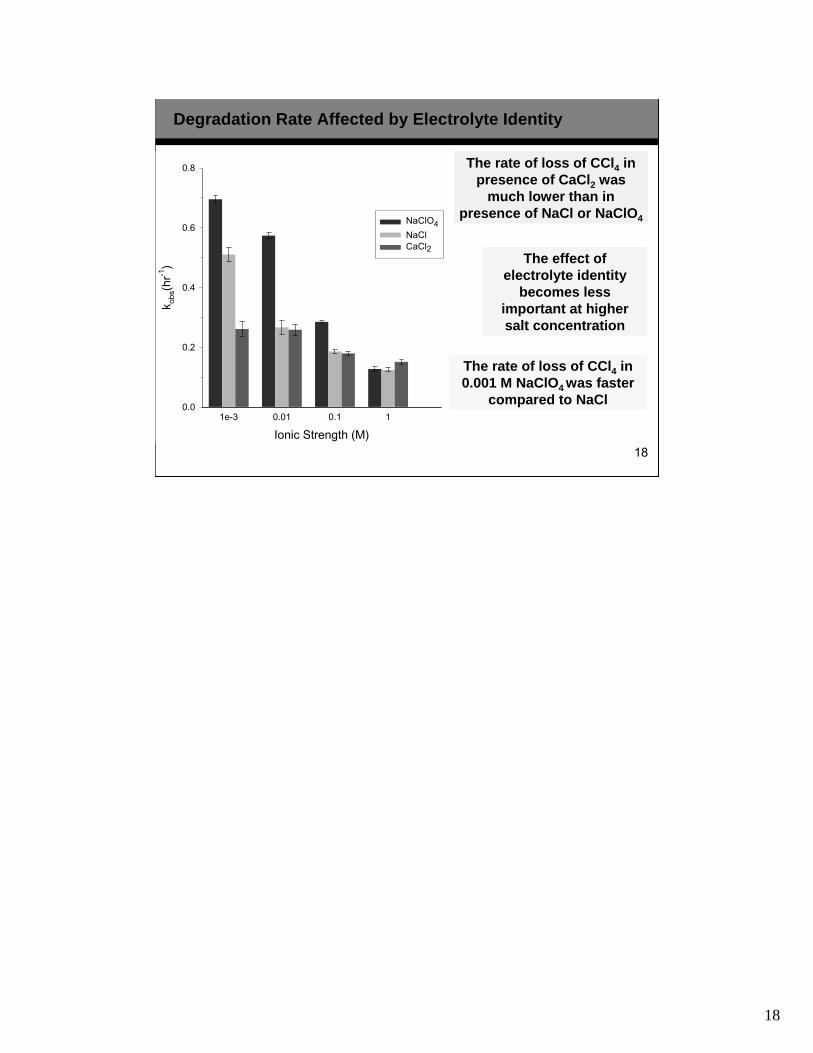
Ionic Strength (M)
1e-3 0.01 0.1 1
k obs (
hr -1
)
0.0
0.2
0.4
0.6
0.8
NaClO4
NaCl CaCl2
The rate of loss of CCl4 in presence of CaCl2 was
much lower than in presence of NaCl or NaClO4
The effect of electrolyte identity
becomes less important at higher salt concentration
The rate of loss of CCl4 in 0.001 M NaClO4 was faster
compared to NaCl
Degradation Rate Affected by Electrolyte Identity
18
18
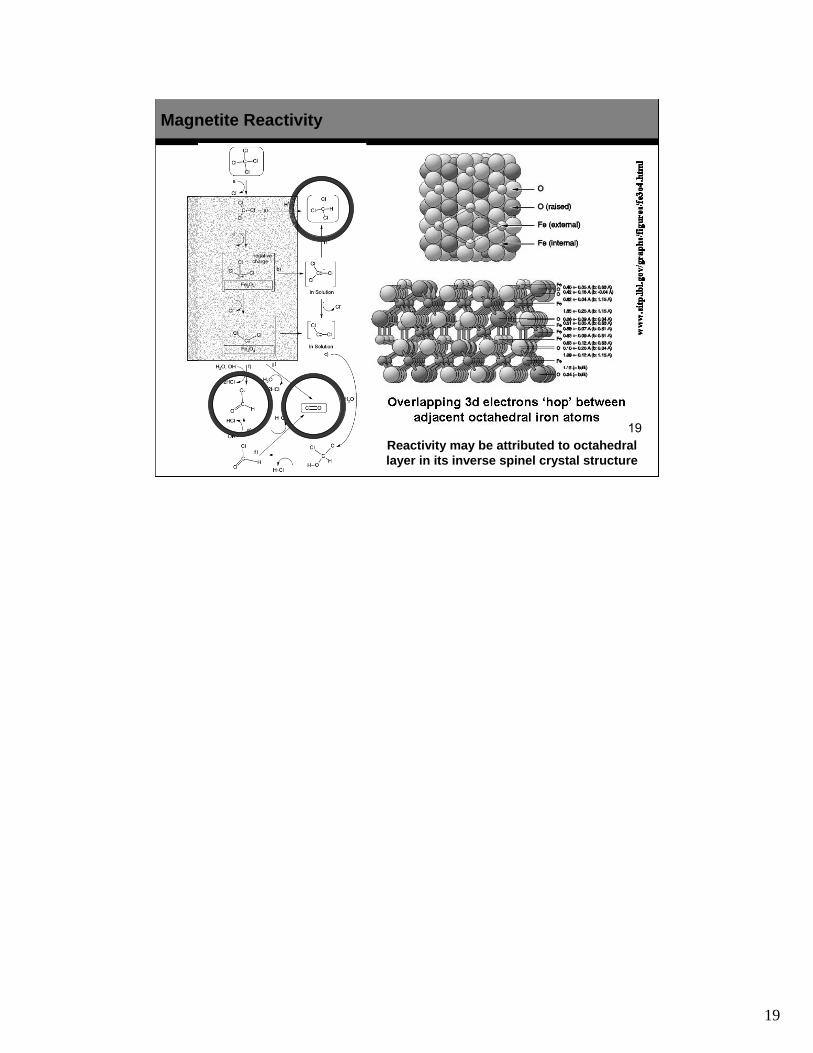
Magnetite Reactivity
Reactivity may be attributed to octahedral layer in its inverse spinel crystal structure
19
19
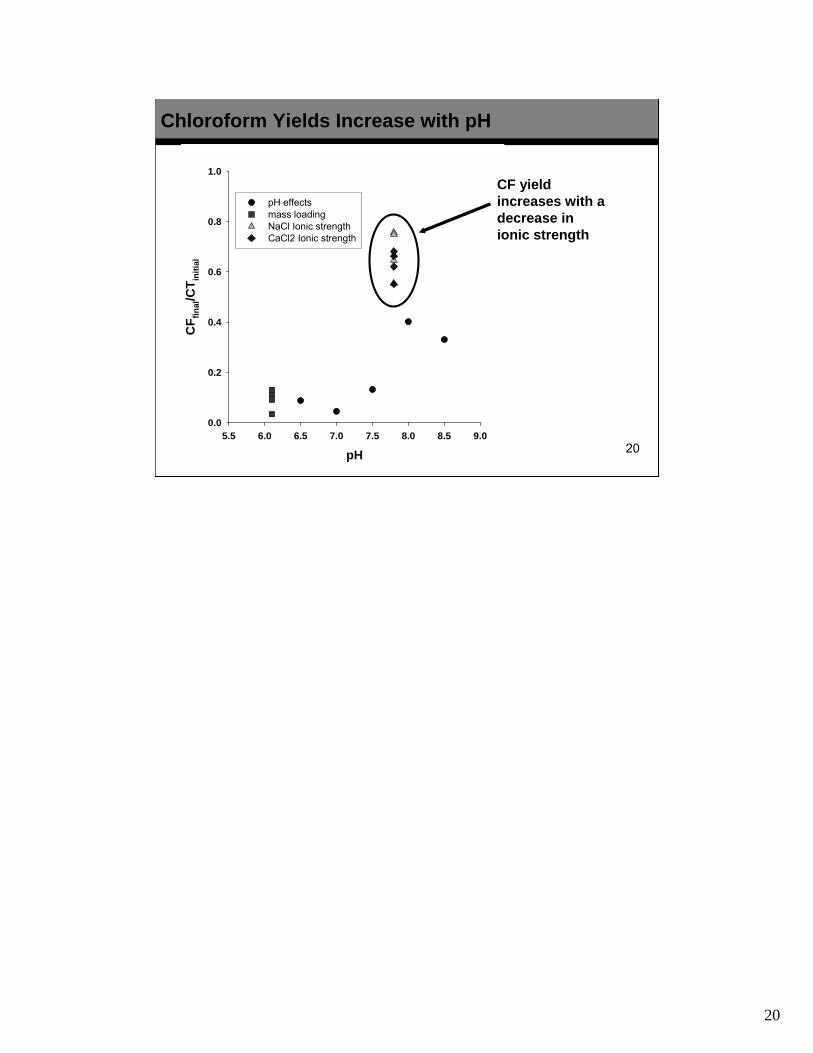
pH
5.5 6.0 6.5 7.0 7.5 8.0 8.5 9.0
CF
fin
al/C
Tin
itia
l
0.0
0.2
0.4
0.6
0.8
1.0
pH effectsmass loading
Chloroform Yields Increase with pH
pH
5.5 6.0 6.5 7.0 7.5 8.0 8.5 9.0
CF
fin
al/C
Tin
itia
l
0.0
0.2
0.4
0.6
0.8
1.0
pH effects mass loading NaCl Ionic strength CaCl2 Ionic strength
CF yield increases with a decrease in ionic strength
20
20
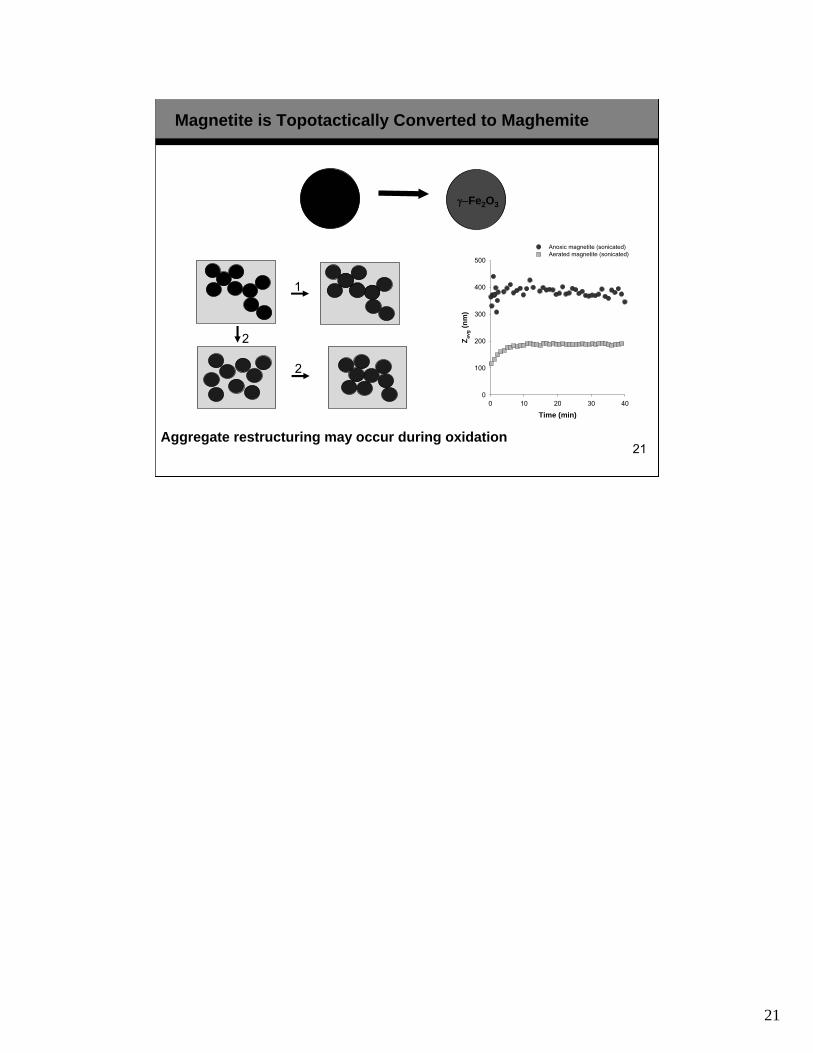
Magnetite is Topotactically Converted to Maghemite
1
2
2
Time (min)
0 10 20 30 40
Z a
vg (
nm
)
0
100
200
300
400
500
Anoxic magnetite (sonicated) Aerated magnetite (sonicated)
Fe3O4
Aggregate restructuring may occur during oxidation
γ−Fe2O3
21
21
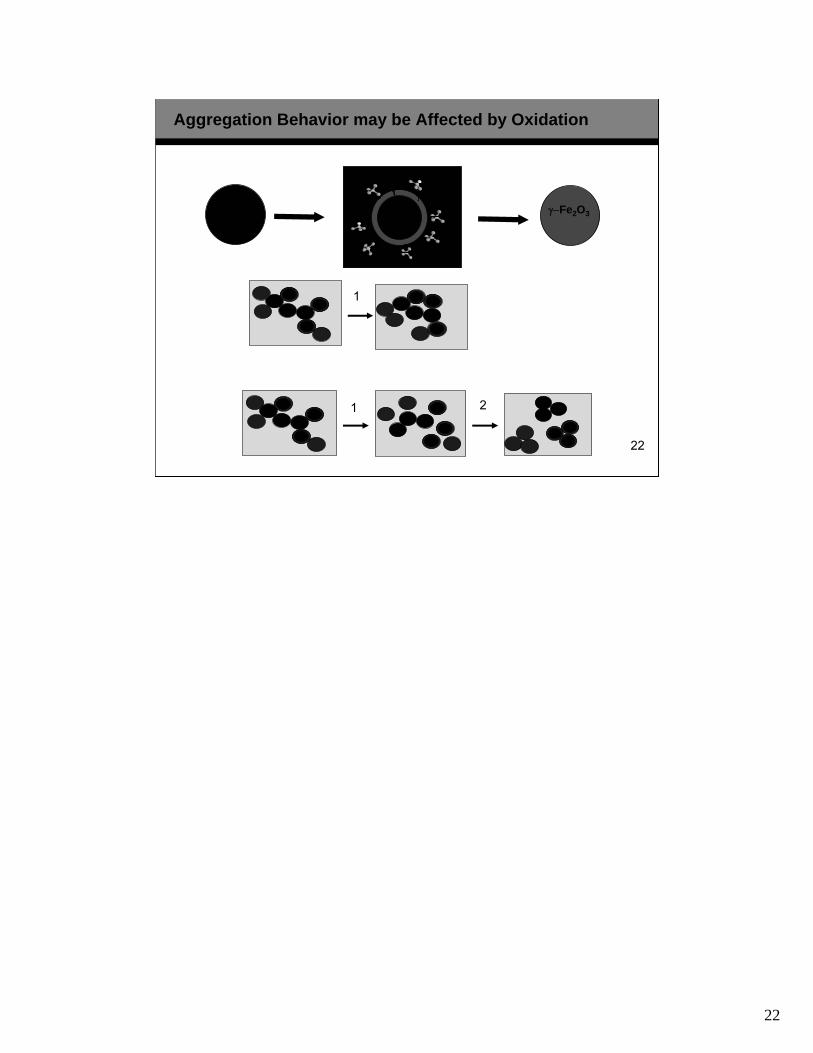
1 2
1
Fe3O4 Fe3O4
γ −Fe2O3
Fe2+
γ−Fe2O3
Aggregation Behavior may be Affected by Oxidation
22
22
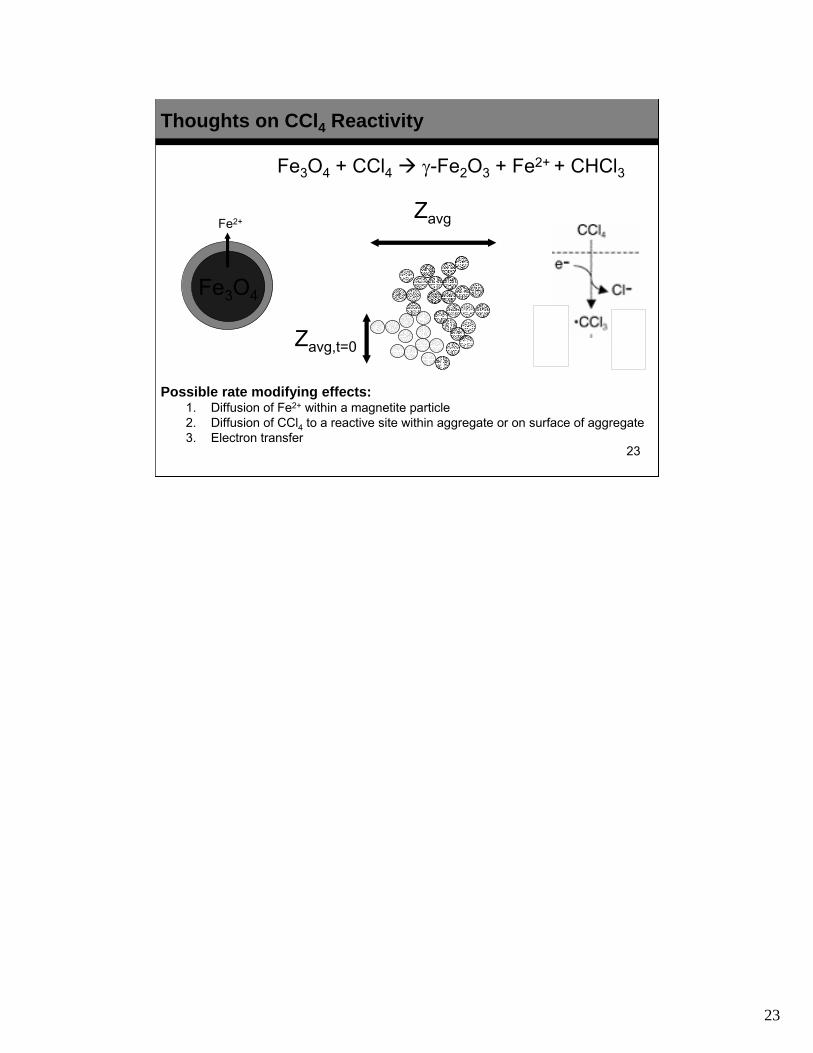
Thoughts on CCl4 Reactivity
Fe3O4 + CCl4 Æ γ-Fe2O3 + Fe2+ + CHCl3
Possible rate modifying effects: 1. Diffusion of Fe2+ within a magnetite particle 2. Diffusion of CCl4 to a reactive site within aggregate or on surface of aggregate 3. Electron transfer
Zavg
Fe3O4
Fe2+
Zavg,t=0
23
23

Encapsulation of Nanoparticles for Environmental and Biological
Applications
Copyright © Luna Innovations 2006
24
24
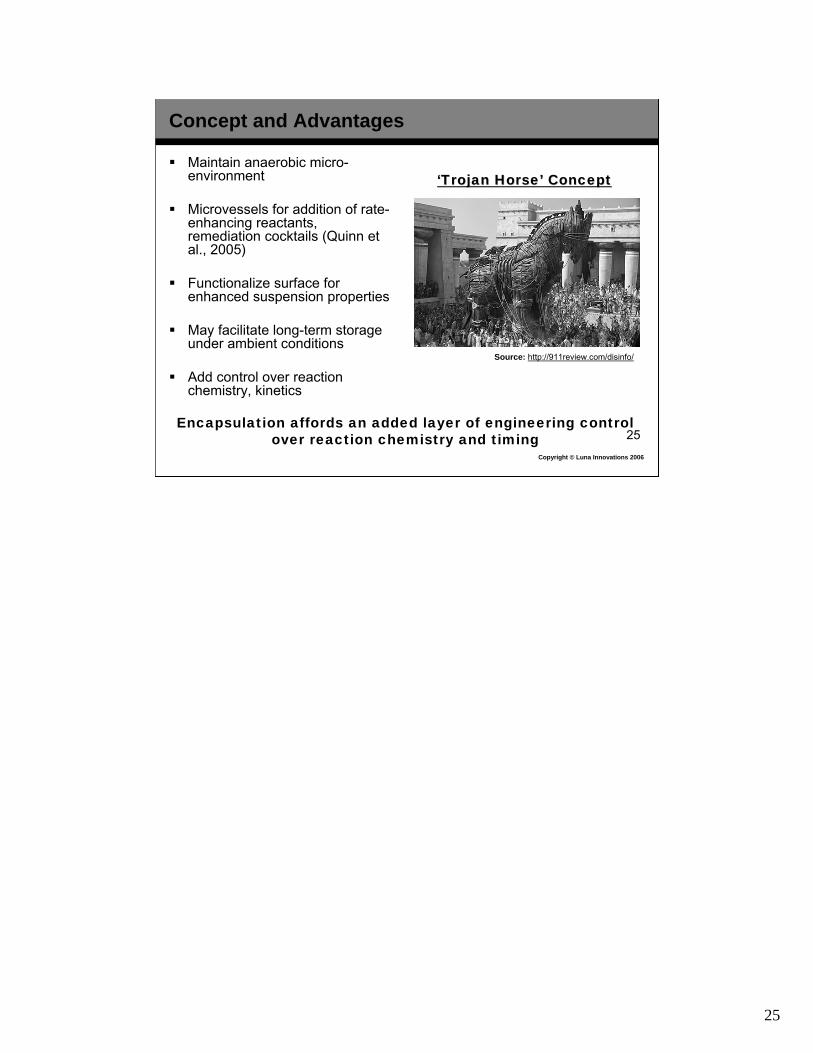
Concept and Advantages
� Maintain anaerobic microenvironment
� Microvessels for addition of rate-enhancing reactants, remediation cocktails (Quinn et al., 2005)
� Functionalize surface for enhanced suspension properties
� May facilitate long-term storage under ambient conditions
� Add control over reaction chemistry, kinetics
Encapsulation affords an added layer of engineering control over reaction chemistry and timing
Source: http://911review.com/disinfo/
‘‘Trojan Horse’ ConceptTrojan Horse’ Concept
Copyright © Luna Innovations 2006
25
25
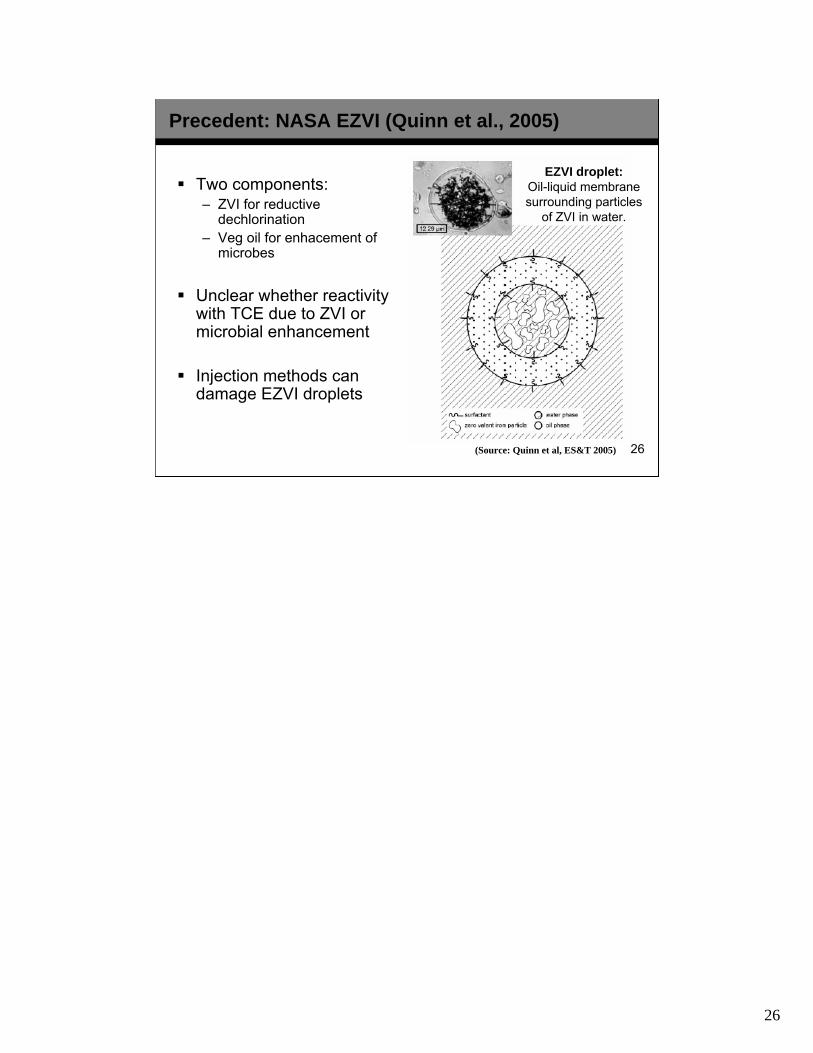
Precedent: NASA EZVI (Quinn et al., 2005)
� Two components: – ZVI for reductive
dechlorination – Veg oil for enhacement of
microbes
� Unclear whether reactivity with TCE due to ZVI or microbial enhancement
� Injection methods can damage EZVI droplets
(Source: Quinn et al, ES&T 2005)
EZVI droplet: Oil-liquid membrane surrounding particles
of ZVI in water.
26
26
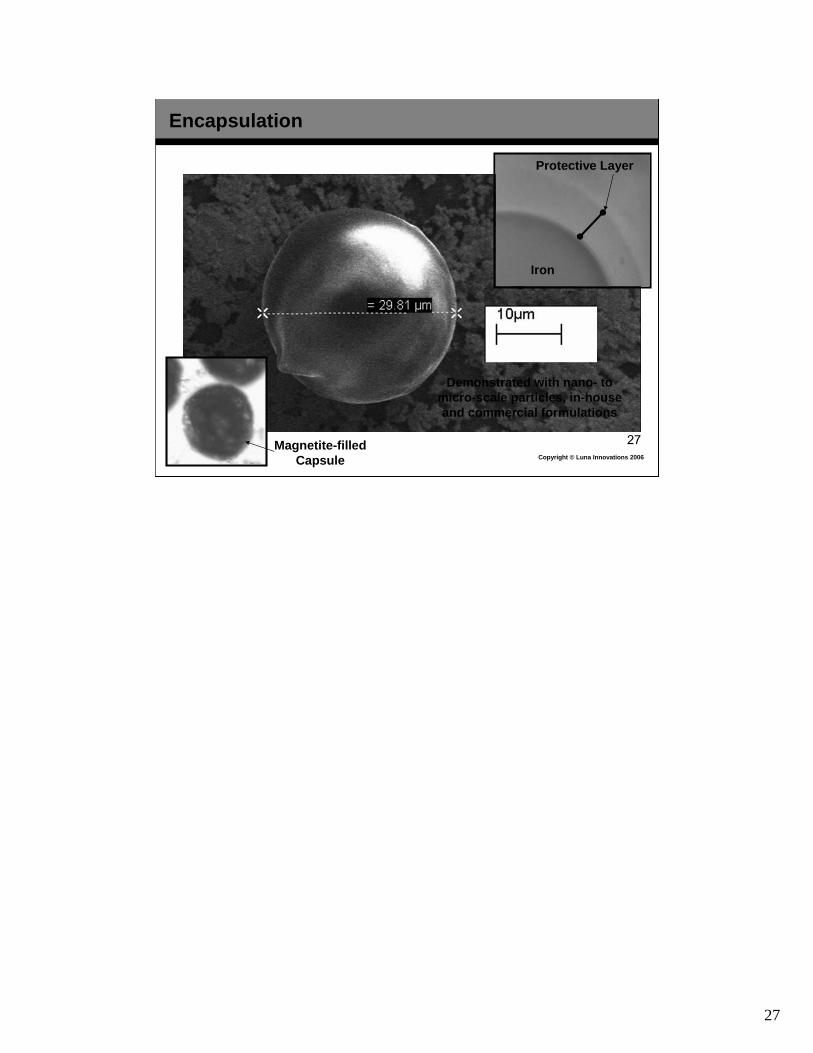
Encapsulation
Protective Layer
Iron
Magnetite-filled Capsule
Demonstrated with nano- to micro-scale particles, in-house and commercial formulations
Copyright © Luna Innovations 2006
27
27
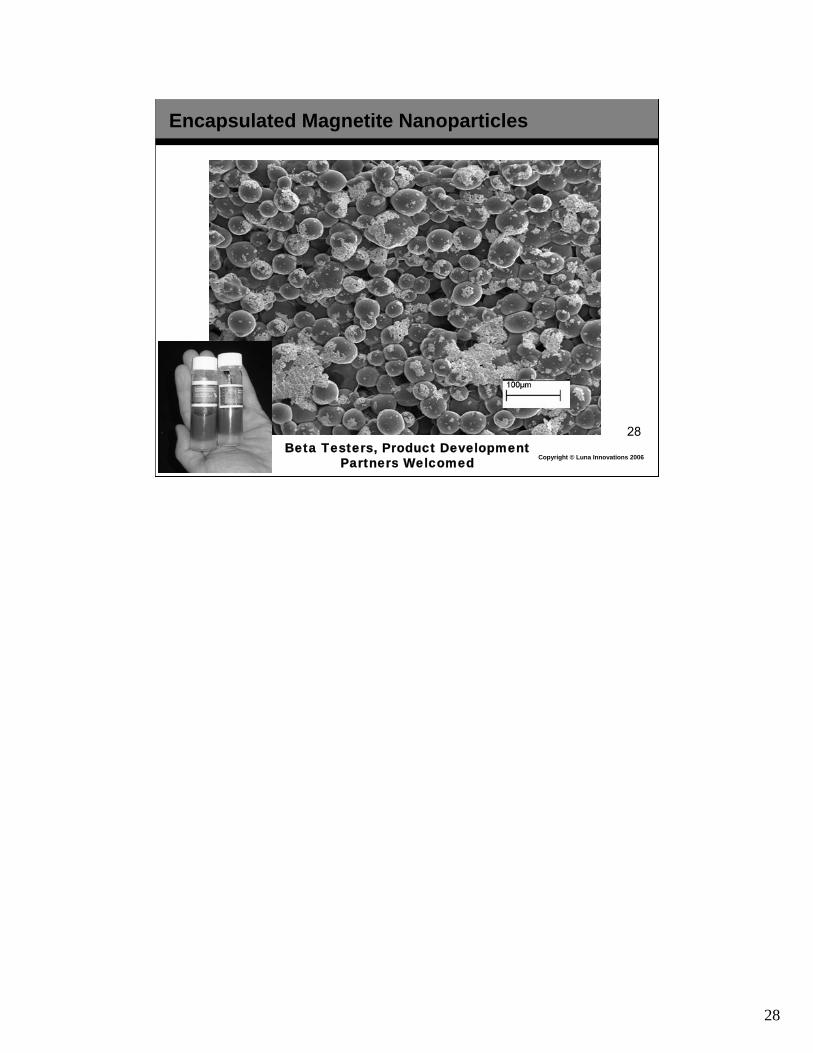
Encapsulated Magnetite Nanoparticles
Copyright © Luna Innovations 2006 Beta Testers, Product Development
Partners Welcomed
28
28
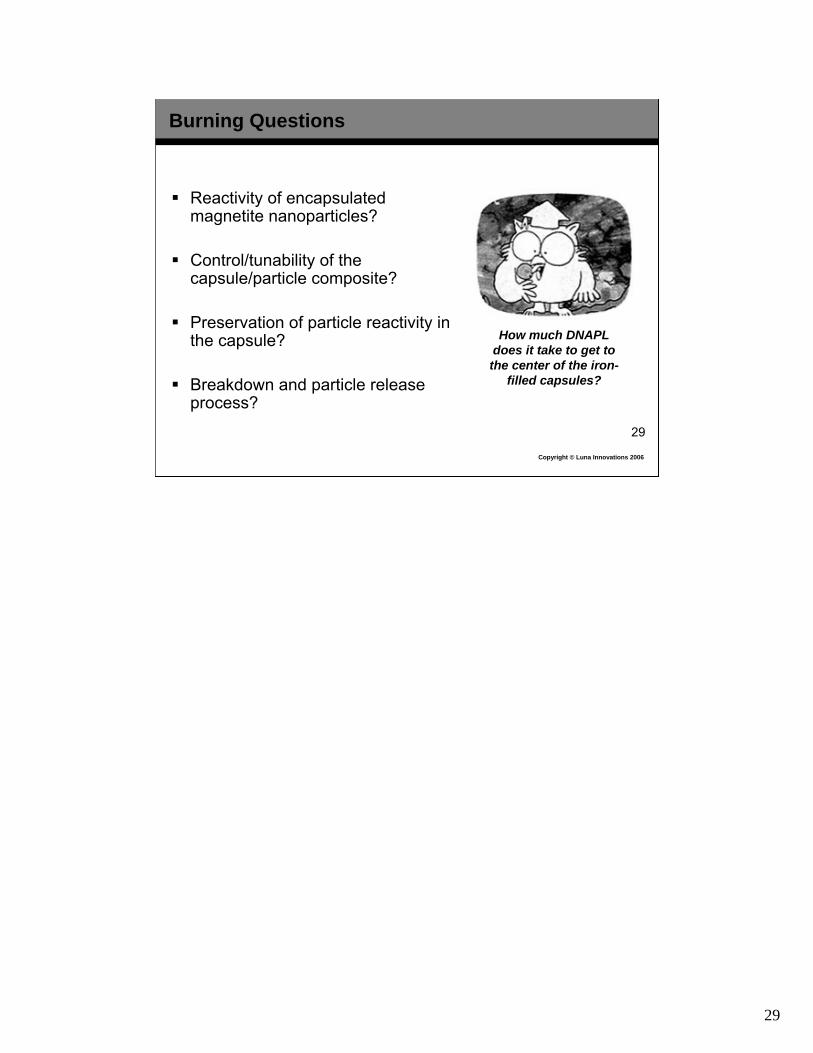
Burning Questions
� Reactivity of encapsulated magnetite nanoparticles?
� Control/tunability of the capsule/particle composite?
� Preservation of particle reactivity in the capsule?
� Breakdown and particle release process?
How much DNAPL does it take to get to the center of the iron-
filled capsules?
Copyright © Luna Innovations 2006
29
29
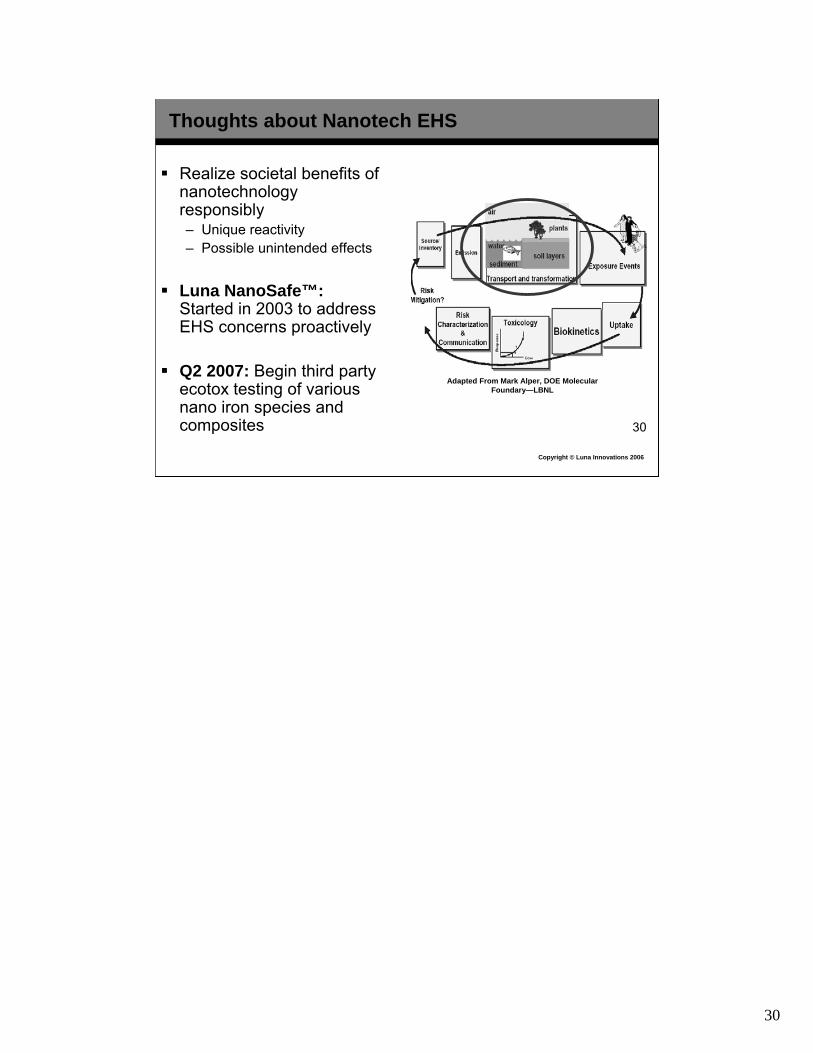
Thoughts about Nanotech EHS
� Realize societal benefits of nanotechnology responsibly – Unique reactivity – Possible unintended effects
� Luna NanoSafe™: Started in 2003 to address EHS concerns proactively
� Q2 2007: Begin third party ecotox testing of various nano iron species and composites
Adapted From Mark Alper, DOE Molecular Foundary—LBNL
Copyright © Luna Innovations 2006
30
30
Conclusions
� Magnetite prepared under strict anaerobic conditions can degrade CT without adding FeII.
� On a mass basis, CT loss rates are enhanced in the presence of nanoparticulate magnetite.
� Chloroform yields are affected by both solution pH and ionic strength.
� Surface normalization of the reactivity of nanoparticle suspensions may be unwise.
� Encapsulation may offer additional engineering control over interaction of particles with remediation target.
� Must determine EHS issues with nano iron Copyright © Luna Innovations 2006
31
31
Acknowledgments
� Funding – US EPA SBIR Program – NSF (Dr. Vikesland’s Lab)
� Virginia Tech – Environmental BioNanoTechnology Lab – April Heathcock – Erik Makus – Rob Rebodos – John Templeton
� Luna Innovations – Life Sciences Group
• Len Comaratta • Steven Abbott • Natasha Belcher
– Advanced Materials Group • Kristen Selde • Bryan Koene
32
32
Matthew HullMatthew HullPrincipal InvestigatorPrincipal Investigator
Phone:Phone: 540.961.4500540.961.4500Email:Email: [email protected]@lunainnovations.com
Contact Information
33
33
Functionalized Reactive Nanoscale FeFunctionalized Reactive Nanoscale Fe00
(NZVI) for in situ DNAPL Remediation:(NZVI) for in situ DNAPL Remediation:Opportunities and ChallengesOpportunities and Challenges
Gregory V. LowryGregory V. LowryAssociate Professor of Environmental Engineering
Carnegie Mellon University, Pittsburgh, PA 15213-3890, USA
R830898R830898
NIEHS Webinar Series on Nanotechnology March 15, 2007
34
34
Students and CollaboratorsStudents and CollaboratorsFacultyFaculty–– Robert Tilton (CRobert T hem Eng)ilton (Chem Eng)–– Krzystzof Matyjaszewski (Chemistry)Krzystzof Matyjaszewski (Chemistry)
Post Docs and StudentsPost Docs and Students–– Dr. Abdulwahab Almusallam, Dr. BrunoDr. Abdulwahab Almusallam, Dr. Bruno
Dufour, Dr. Jeongbin Ok, Dr. Traian SarbDufour, Dr. Jeongbin Ok, Dr. Traian Sar ubu–– Dr. Yueqiang Liu, Tanapon Phenrat, NavidDr. Yueqiang Liu, Tanapon Phenrat, Navid
Saleh, Kevin Sirk, HyeSaleh, Kevin Sirk, Hye--Jin KimJin Kim–– Dan SchoenfelderDan Schoenfelder
35
35
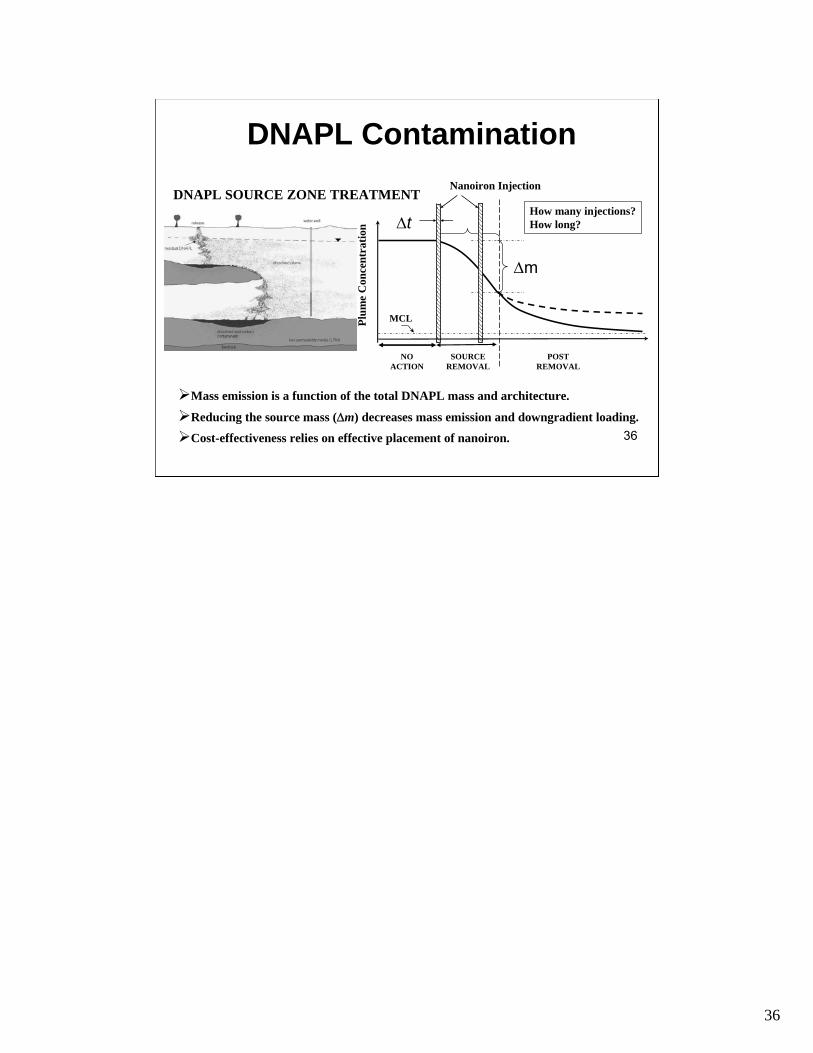
DNAPL ContaminationDNAPL Contamination
Nanoiron Injection DNAPL SOURCE ZONE TREATMENT
How many injections? How long?Δt
Δm
MCLPlu
me
Con
cen
trat
ion
NO SOURCE POST ACTION REMOVAL REMOVAL
¾Mass emission is a function of the total DNAPL mass and architecture.
¾Reducing the source mass (Δm) decreases mass emission and downgradient loading.
¾Cost-effectiveness relies on effective placement of nanoiron. 36
36
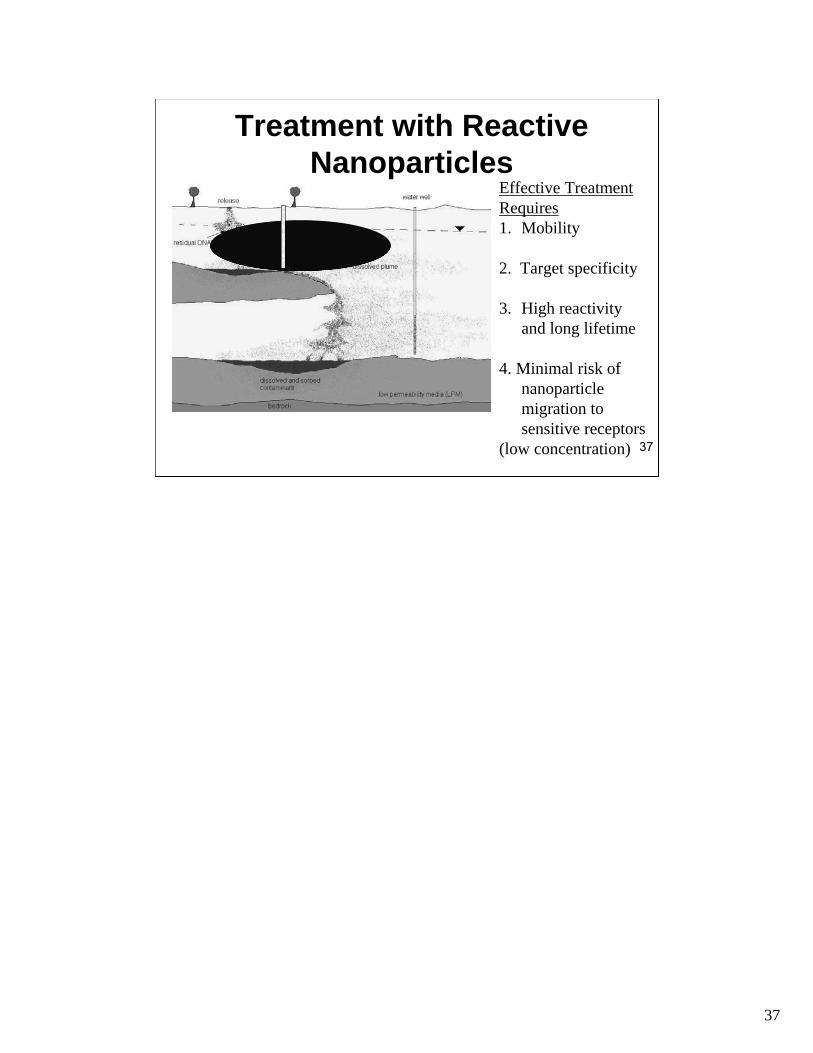
Treatment with ReactiveTreatment with Reactive NanoparticlesNanoparticles
Effective Treatment Requires 1. Mobility
2. Target specificity
3. High reactivity and long lifetime
4. Minimal risk of nanoparticle migration to sensitive receptors
(low concentration) 37
37
–
–
–
–
–
–
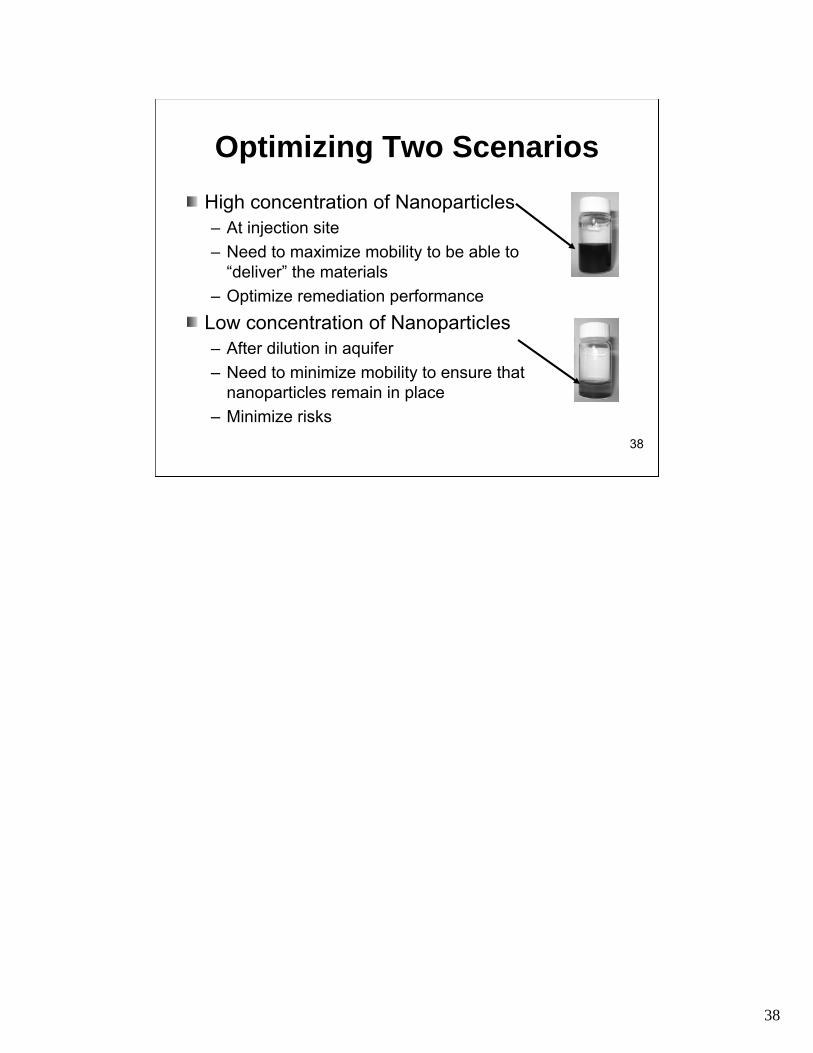
Optimizing Two ScenariosOptimizing Two Scenarios
High concentration of NanoparticlesHigh concentration of Nanoparticles– At injection siteAt injection site
– Need to maxiNeed to max mize mobility to be able toimize mobility to be able to “deliver” the materials“deliver” the materials
– Optimize remediation performanceOptimize remediation performance
Low concentration of NanoparticlesLow concentration of Nanoparticles– After dilution in aquiferAfter dilution in aquifer
– Need to minimize mobility to ensure thatNeed to minimize mobility to ensure that nanoparticles remain in placenanoparticles remain in place
– Minimize risksMinimize risks
38
38
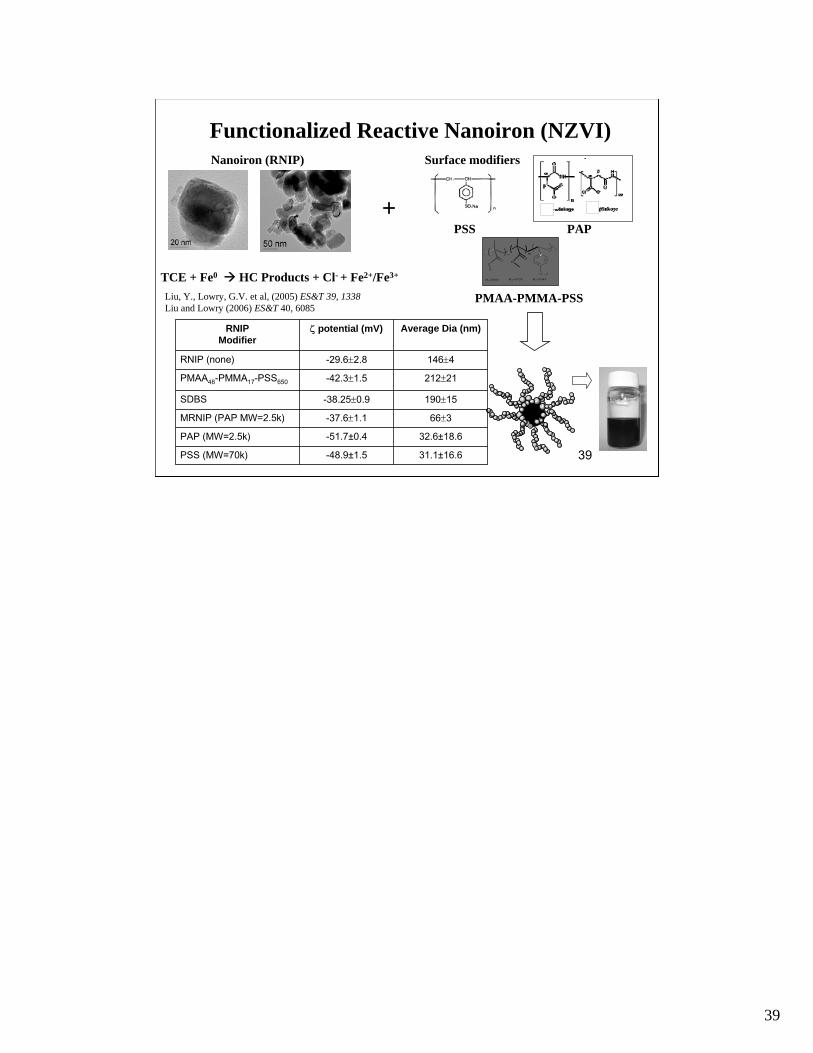
Functionalized Reactive Nanoiron (NZVI)Nanoiron (RNIP) Surface modifiers
+ PSS PAP
p
n m
OO O
O
H
M n= 2 0 0 0 M n= 5 7 0 0 M n= 8 3 4 0TCE + Fe0 Æ HC Products + Cl- + Fe2+/Fe3+ SO 3 H
Liu, Y., Lowry, G.V. et al, (2005) ES&T 39, 1338 PMAA-PMMA-PSSLiu and Lowry (2006) ES&T 40, 6085
RNIPRNIP ζζ potentialp (mV)otential (mV) Average Dia (nm)Average Dia (nm)ModifierModifier
RNIP (none)RNIP (none) --29.629.6±±2.82.8 146146±±44
PMAAPMAA4848--PMMAPMMA1717--PSSPSS650650 --42.342.3±±1.51.5 212212±±2121
SDBSSDBS --38.2538.25±±0.90.9 190190±±1515
MRNIP (PAP MW=2.5k)MRNIP (PAP MW=2.5k) --37.637.6±±1.11.1 6666±±33
PAP (MW=2.5k)PAP (MW=2.5k) --51.751.7±±0.40.4 32.632.6±±18.618.6
PSS (MW=70k)PSS (MW=70k) --48.948.9±±1.51.5 31.131.1±±16.616.6 39
39
OutlineOutline
Getting particles to DNAPL (NP mobility) – Aggregation – Attachment/filtration – Coatings to minimize filtration
DNAPL degradation rates (Reactivity and Lifetime)– Effect of groundwater geochemistry and surface
coatings – Fate of particles and coatings
DNAPL Targeting – Approaches for in situ targeting
40
40
---
---
---
---
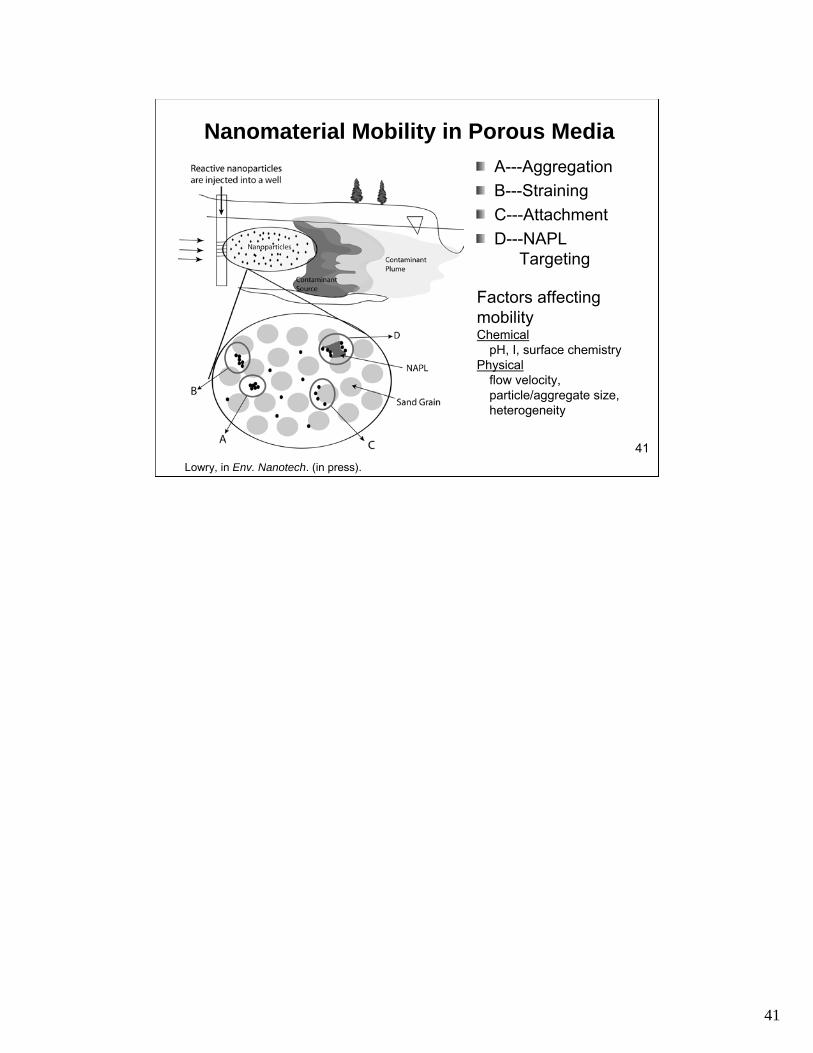
Nanomaterial Mobility in Porous MediaNanomaterial Mobility in Porous Media
Lowry, in Env. Nanotech. (in press).
AA---AggregationAggregation
BB---StrainingStraining
CC---AttachmentAttachment
DD---NAPLNAPL TargetingTargeting
Factors affecting mobility Chemical
pH, I, surface chemistry Physical
flow velocity, particle/aggregate size, heterogeneity
41
41
Nanoparticle AggregationNanoparticle Aggregation
Nanoparticles aggregate in water:Nanoparticles aggregate in water:–– High Hamaker constantHigh Hamaker constant--i.e. attractive van deri.e. attractive van der
Waals forcesWaals forces
–– Chemical bondingChemical bonding
–– HydrophobicityHydrophobicity
–– Magnetic attraction (FeMagnetic attraction (Fe00))
Nanoparticles have high diffusionNanoparticles have high diffusion coefficients and many particle collisionscoefficients and many particle collisions
42
42
–
–
–
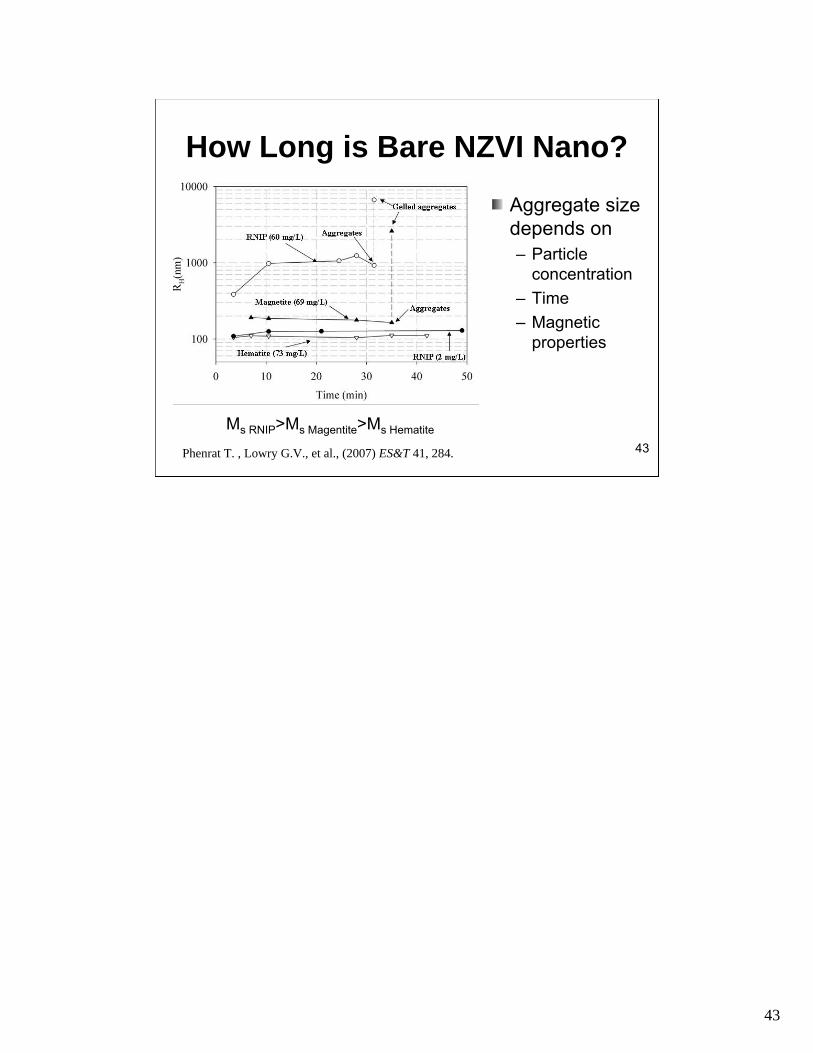
How Long is Bare NZVI Nano?How Long is Bare NZVI Nano?
Aggregate sizeAggregate size depends ondepends on– ParticleParticle
concentrationconcentration
– TimeTime
– MagneticMagnetic propertiesproperties
Ms RNIP>Ms Magentite>Ms Hematite
Phenrat T. , Lowry G.V., et al., (2007) ES&T 41, 284. 43
43
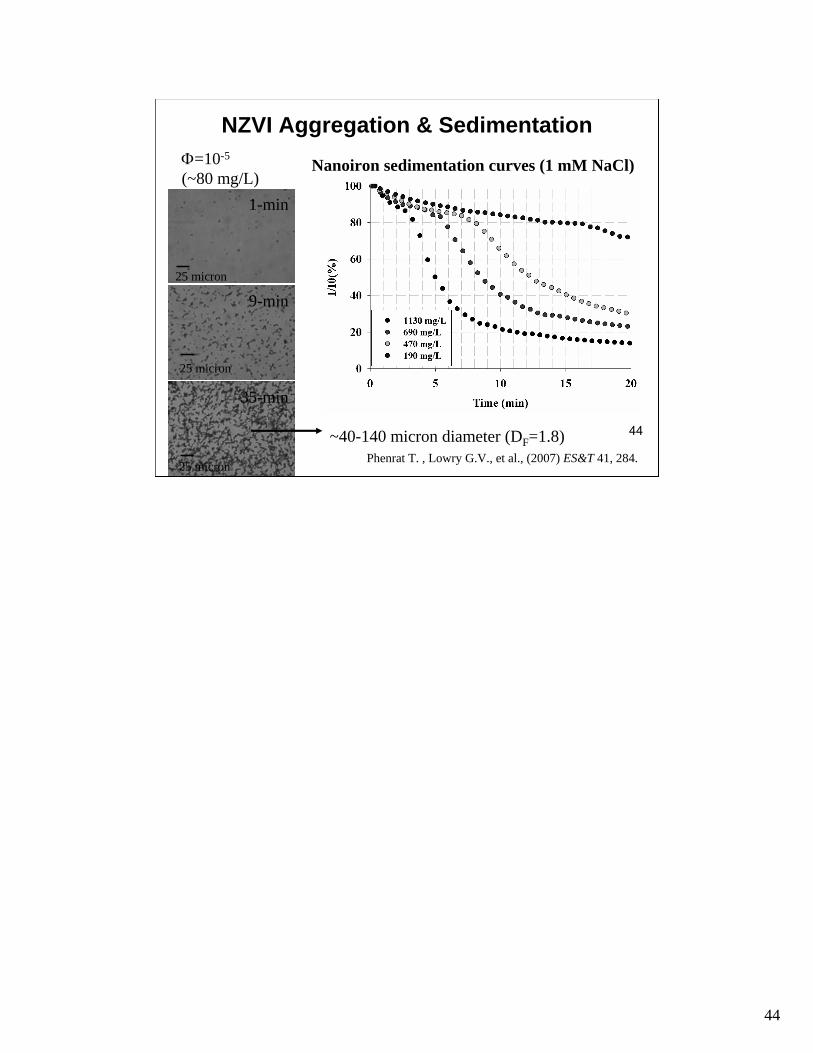
NZVI Aggregation & SedimentationNZVI Aggregation & Sedimentation
1-min
9-min
35-min
Φ=10-5
(~80 mg/L)
25 micron
25 micron
25 micron
~40-140 micron diameter (DF=1.8)
Nanoiron sedimentation curves (1 mM NaCl)
Phenrat T. , Lowry G.V., et al., (2007) ES&T 41, 284.
44
44
Attachment to SurfacesAttachment to Surfaces
Attachment is an important fate processAttachment is an important fate process–– Limits mobility in poroLimits mobility in por us mediaous media
–– May limitMay limit bioavailability/transformation/degradationbioavailability/transformation/degradation
Attachment is a function of the parAttachment is a functi ticle andon of the particle and coating typecoating type–– DiffereDiffer nces betwences between NPs and coatingseen NPs and coatings
45
45
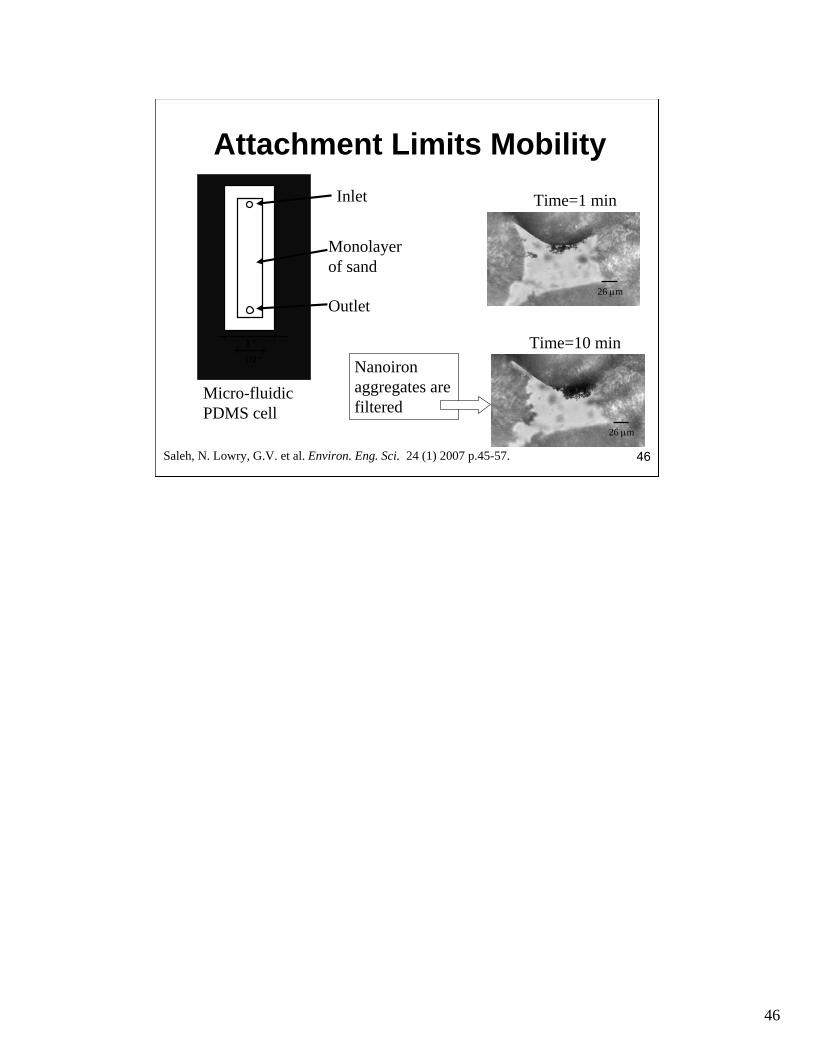
Attachment Limits MobilityAttachment Limits Mobility
1” 1/2”
Monolayer of sand
Inlet
Outlet
Micro-fluidic PDMS cell
26 μm
26 μm
Time=1 min
Time=10 min
Nanoiron aggregates are filtered
Saleh, N. Lowry, G.V. et al. Environ. Eng. Sci. 24 (1) 2007 p.45-57. 46
46
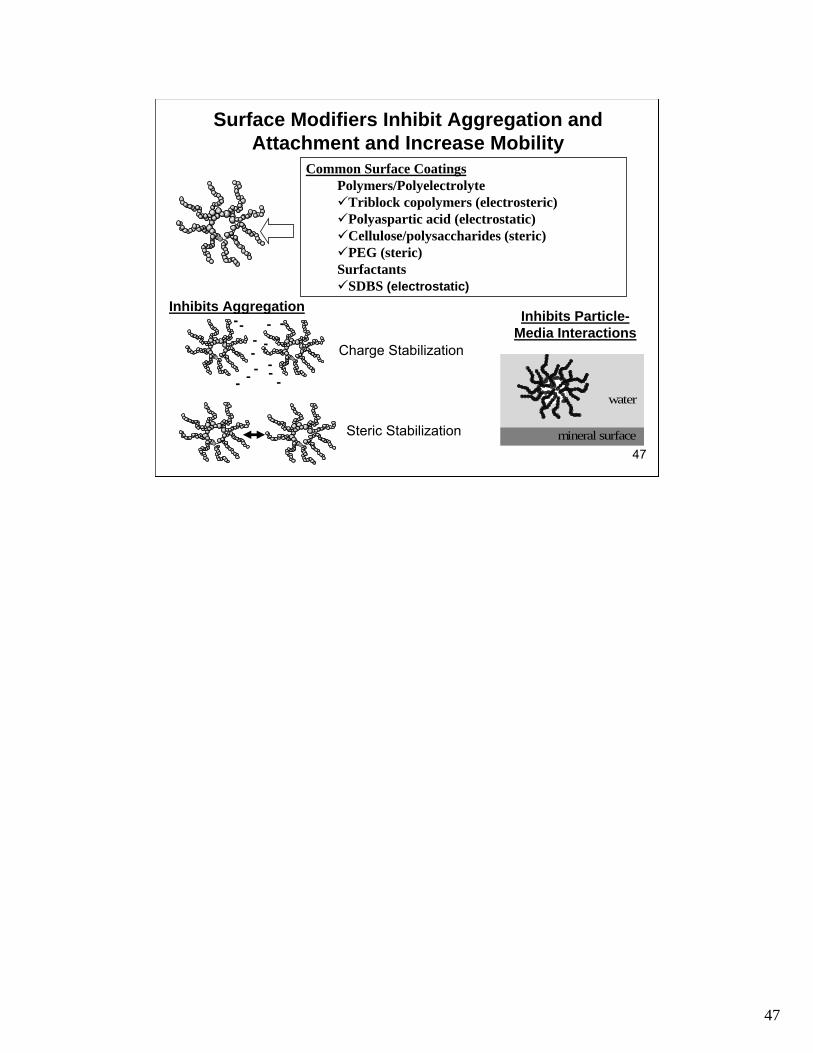
Surface Modifiers Inhibit Aggregation andSurface Modifiers Inhibit Aggregation and Attachment and Increase MobilityAttachment and Increase Mobility
Common Surface Coatings Polymers/Polyelectrolyte 9Triblock copolymers (electrosteric) 9Polyaspartic acid (electrostatic) 9Cellulose/polysaccharides (steric) 9PEG (steric) Surfactants 9SDBS (electrostatic)
Inhibits Aggregation - ---
Inhibits Particle
- Media Interactions-
- Charge Stabilization -- --- -
water
Steric Stabilization mineral surface
47
47

Copolymer (MW=125k) Different ModifiersDifferent ModifiersPMAA48-PMMA17-PSS650
Increasing MW
Polystyrene sulfonate (MW=70k)
Polyelectrolytes
Polyaspartic acid (MW=3k and 10k)
SDBS (MW=350) Surfactant C12H25(C6H4)SO3
- 48
48
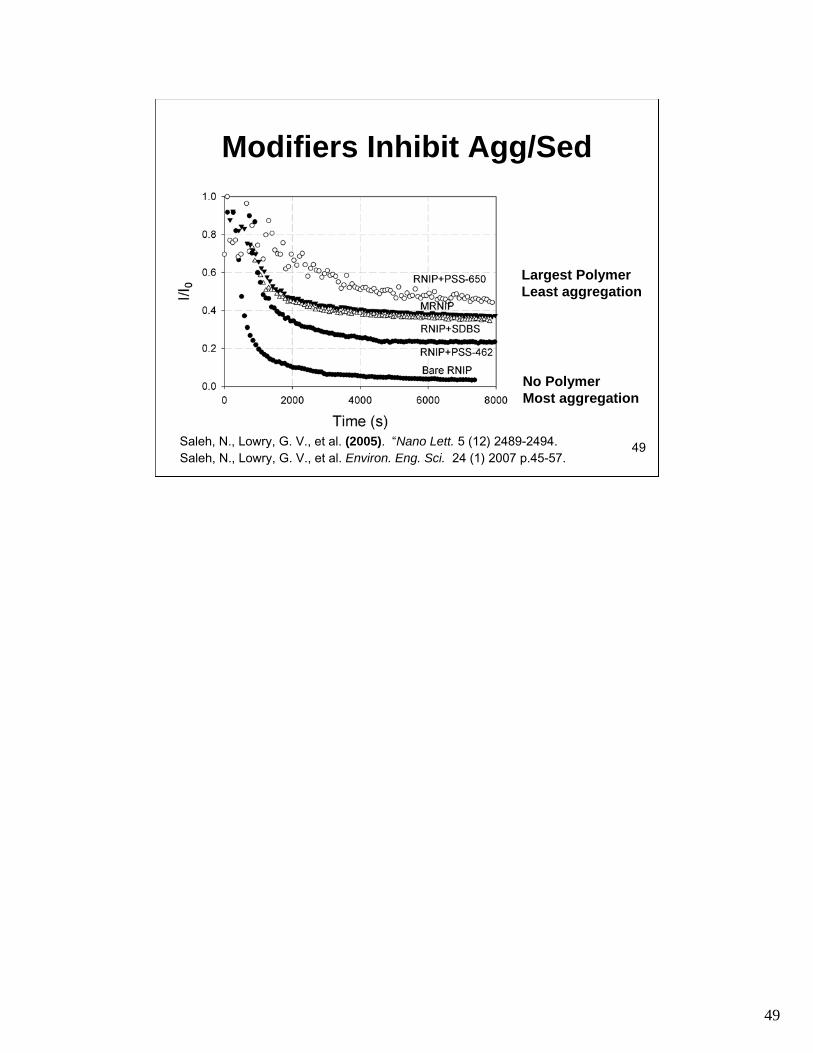
Modifiers Inhibit Agg/SedModifiers Inhibit Agg/Sed
Largest Polymer Least aggregation
No Polymer Most aggregation
Saleh, N., Lowry, G. V., et al. (2005). “Nano Lett. 5 (12) 2489-2494. 49 Saleh, N., Lowry, G. V., et al. Environ. Eng. Sci. 24 (1) 2007 p.45-57.
49
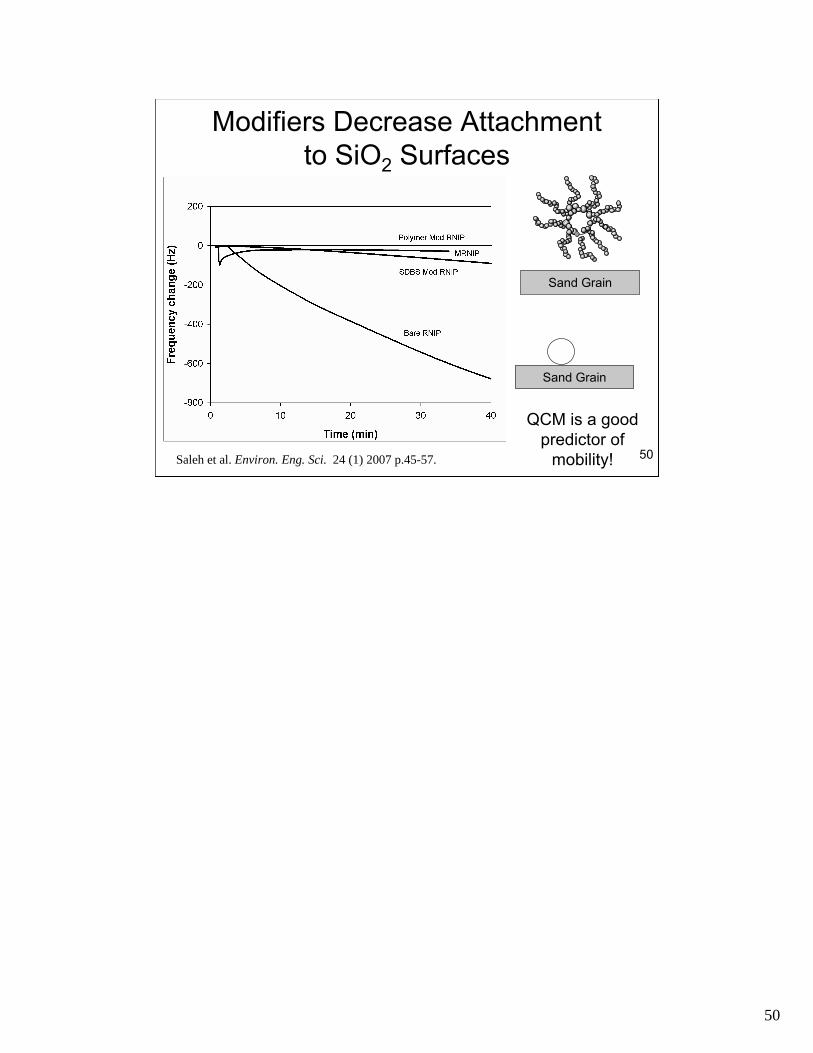
Modifiers Decrease AttachmentModifiers Decrease Attachmentto SiOto SiO22 SurfacesSurfaces
Sand Grain
Sand Grain
QCM is a good predictor of
Saleh et al. Environ. Eng. Sci. 24 (1) 2007 p.45-57. mobility! 50
50
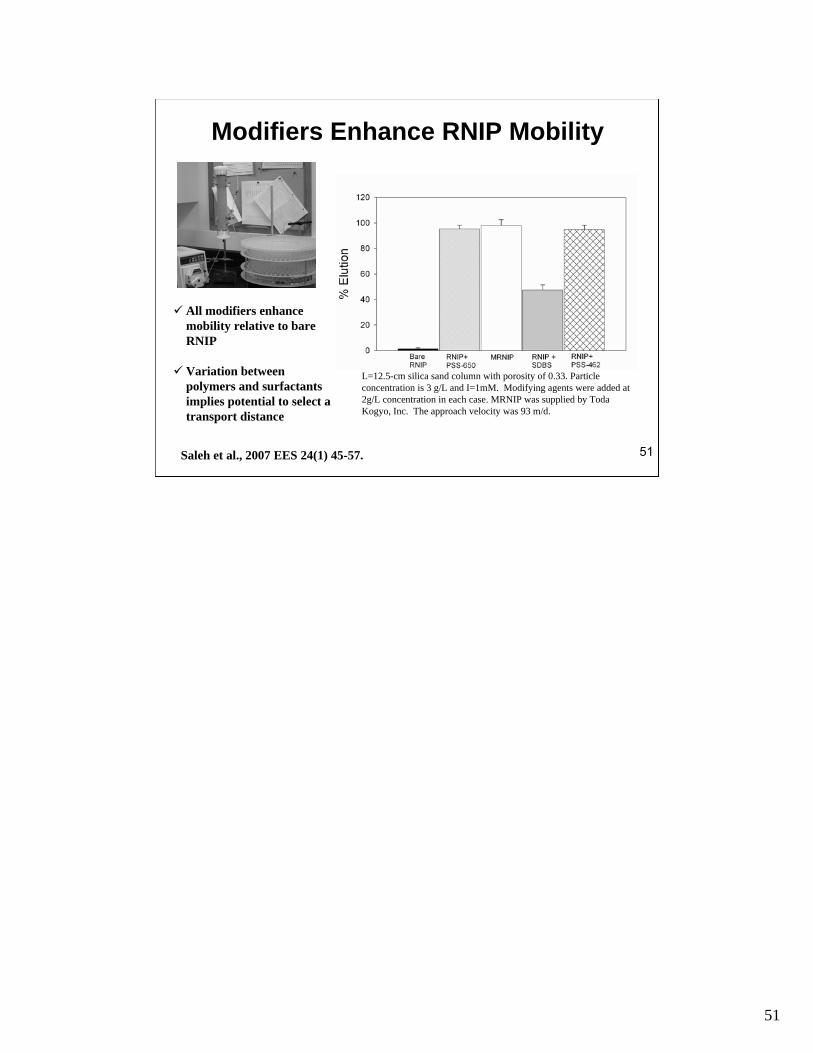
Modifiers Enhance RNIP MobilityModifiers Enhance RNIP Mobility
9 All modifiers enhance mobility relative to bare RNIP
9 Variation between L=12.5-cm silica sand column with porosity of 0.33. Particle polymers and surfactants concentration is 3 g/L and I=1mM. Modifying agents were added at
implies potential to select a 2g/L concentration in each case. MRNIP was supplied by Toda
transport distance Kogyo, Inc. The approach velocity was 93 m/d.
Saleh et al., 2007 EES 24(1) 45-57. 51
51
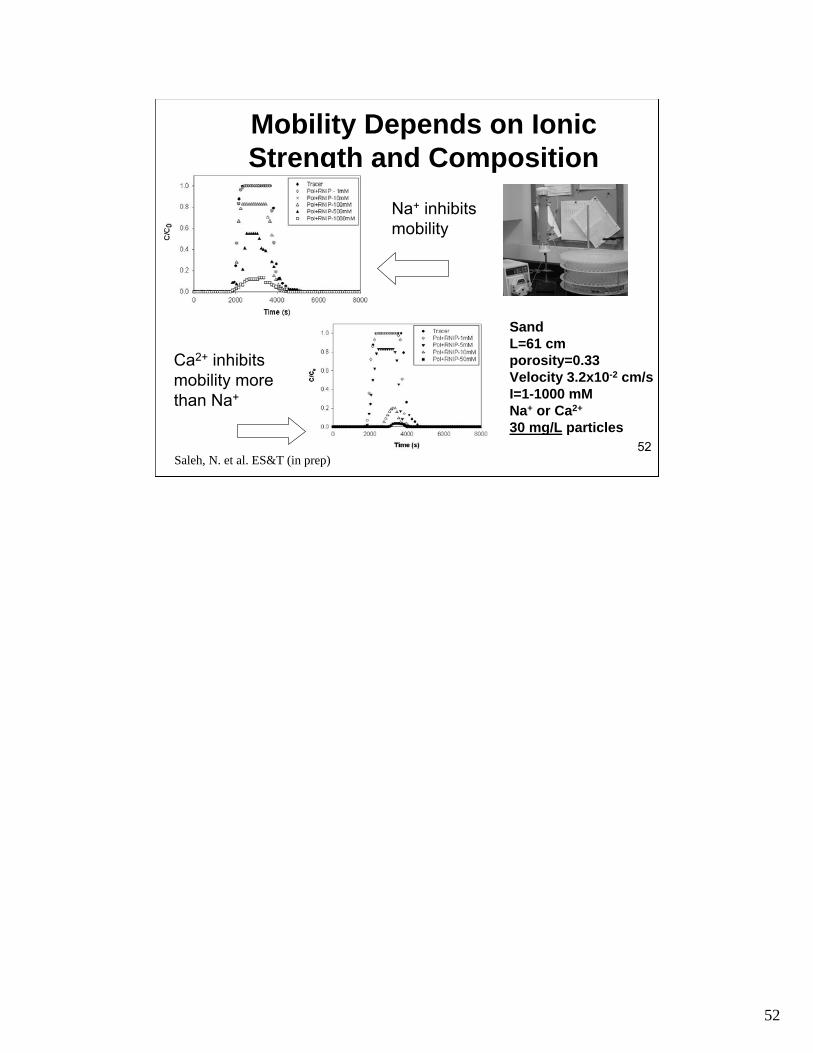
Mobility Depends on IonicMobility Depends on Ionic Strength and CompositionStrength and Composition
Saleh, N. et al. ES&T (in prep)
Sand L=61 cm porosity=0.33 Velocity 3.2x10⁻² cm/s I=1-1000 mM Na+ or Ca2+
30 mg/L particles
Ca2+ inhibits mobility more than Na+
Na+ inhibits mobility
52
52
--
--
--
--
--
--------
----
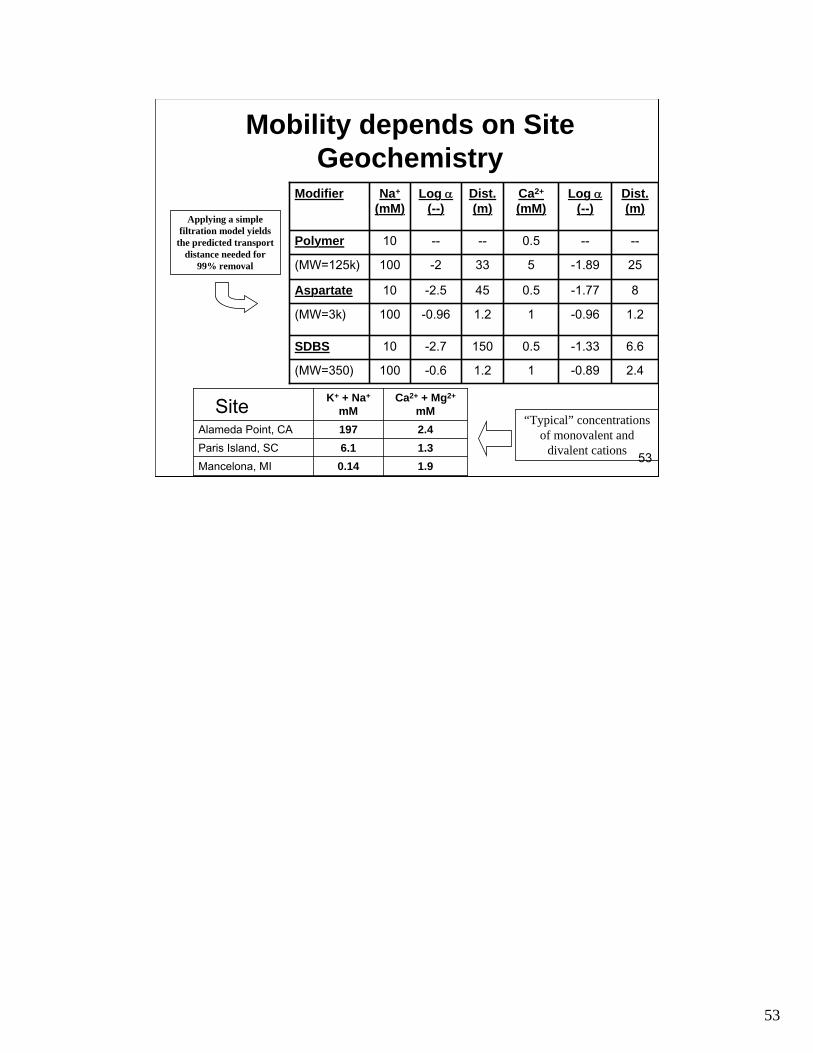
Mobility depends on SiteMobility depends on Site GeochemistryGeochemistry
Applying a simple filtration model yields
the predicted transport distance needed for
99% removal
MoModidififierer NaNa++
(m(mMM))LoLogg αα
((--))Dist.Dist. (m(m))
CaCa2+2+
(m(mMM))LoLogg αα
((--))Dist.Dist. (m(m))
PoPolylymermer 1010 -- -- 0.50.5 -- --
(MW(MW=1=125k25k)) 100100 -22 3333 55 -1.1.8989 2525
AspartateAspartate 1010 -2.2.55 4545 0.50.5 -1.1.7777 88
(MW(MW=3k=3k)) 100100 -0.0.9696 1.21.2 11 -0.0.9696 1.21.2
SDBSSDBS 1010 -2.2.77 150150 0.50.5 -1.1.3333 6.66.6
(MW(MW=3=35050)) 100100 -0.0.66 1.21.2 11 -0.0.8989 2.42.4
SiteSiteK+ + Na+
mM Ca2+ + Mg2+
mM
AlamedAlameda Point, CAa Point, CA 197 2.4
Paris Island, SCParis Island, SC 6.1 1.3
MancelMancelona, MIona, MI 0.14 1.9
“Typical” concentrations of monovalent and
divalent cations 53
53

Incre
asing Complex
it
Real Sites are NOT Sand columns! Scales of Interest Field-Scale
Intermediate-Scale y
2-d cell Need to Up-Scale processColumn
parameters determined in the laboratory to field scales
54
54
NZVI Reactivity and LifetimeNZVI Reactivity and Lifetime
Fundamental QuestionsFundamental Questions–– What are the rWhat are the reaction rates and productsates and products?eaction r
–– How long do the particles remain reactiveeactive?How long do the particles remain r
–– What geochemical factors affect theirWhat geochemical factors affect their reactivireactiv ty and lifetime?ity and lifetime?
–– How do surfacHow do s e modifiers affect reactivity?urface modifiers affect reactivity?
Liu et al, (2005) ES&T 39, 1338
Liu and Lowry, (2006) ES&T, 40 (19) 6085
Liu, Phenrat, and Lowry, (2007) ES&T, (in prep) 55
55
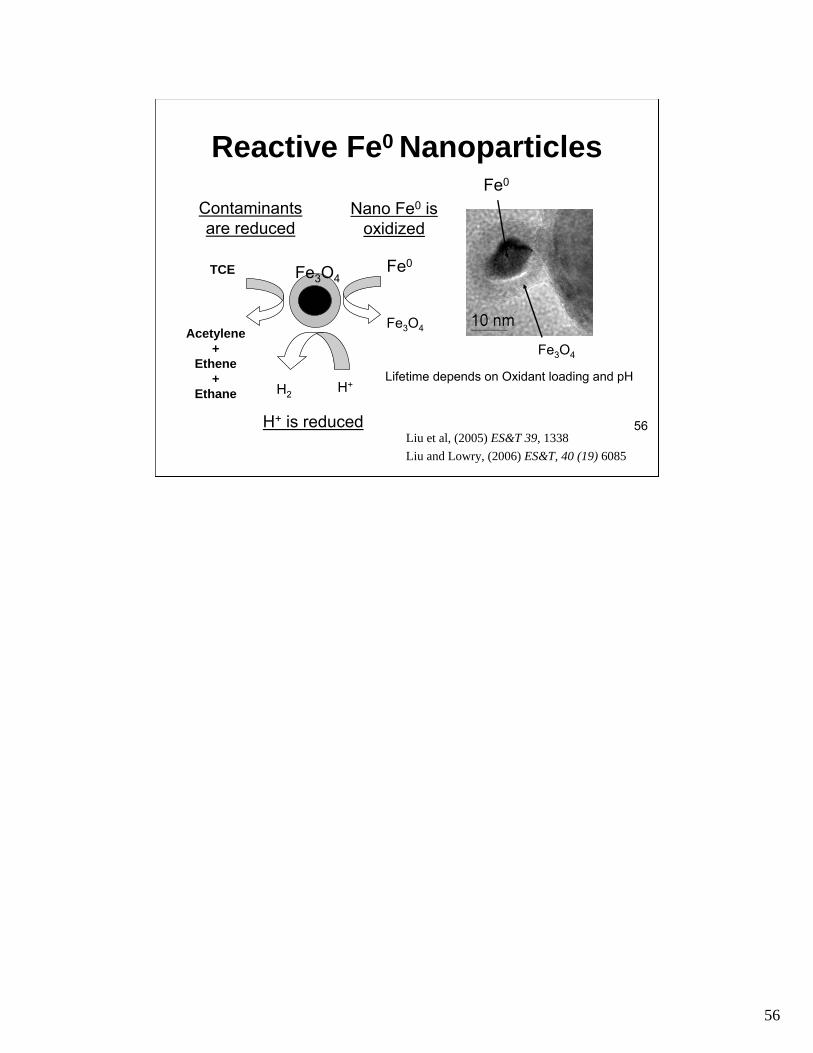
Reactive FeReactive Fe00 NanoparticlesNanoparticlesFe0
Contaminants Nano Fe0 is are reduced oxidized
Fe0
Fe3O4 Fe0TCE
Fe3O4Acetylene+
EtheneFe3O4
+ Lifetime depends on Oxidant loading and pH Ethane H2
H+
H+ is reduced 56 Liu et al, (2005) ES&T 39, 1338
Liu and Lowry, (2006) ES&T, 40 (19) 6085
56
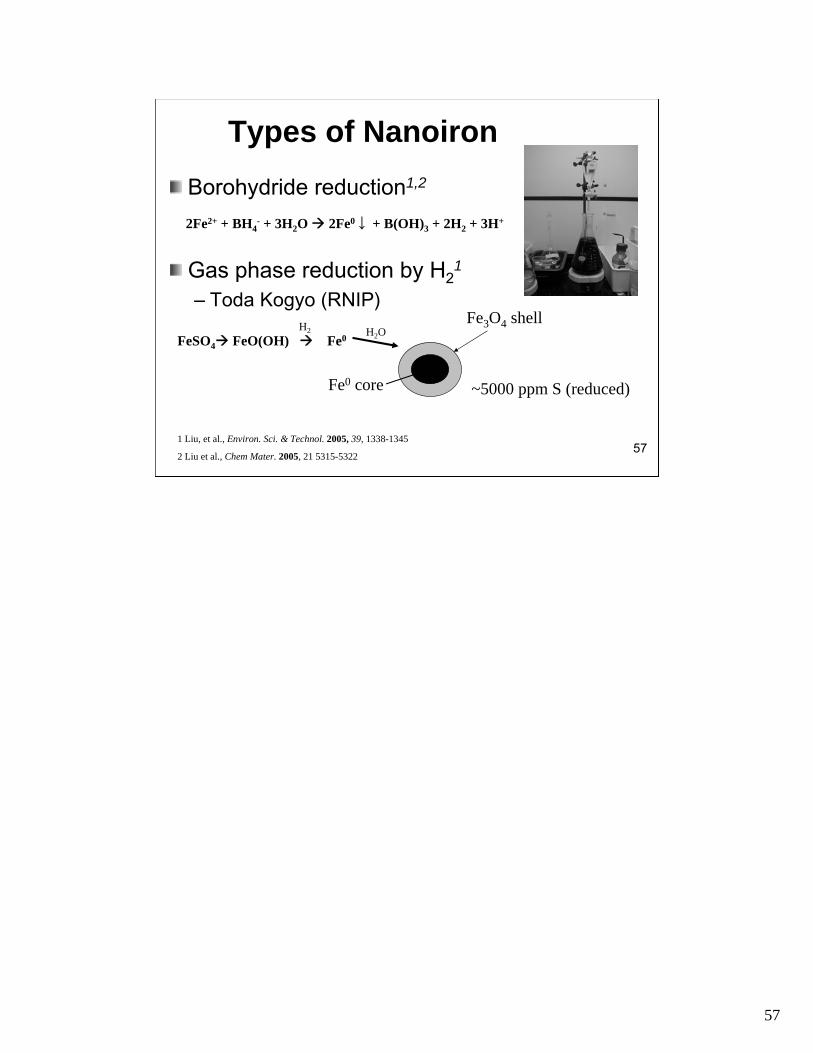
Types of NanoironTypes of Nanoiron
Borohydride reductionBorohydride reduction1,21,2
-2Fe2+ + BH4 + 3H2O Æ 2Fe0↓ + B(OH)3 + 2H2 + 3H+
Gas phase reduction by HGas phase reduction by H2211
–– Toda Kogyo (RNIP)Toda Kogyo (RNIP)Fe3O4 shell
FeSO4Æ FeO(OH) HÆ
2
Fe0 H2O
Fe0 core ~5000 ppm S (reduced)
1 Liu, et al., Environ. Sci. & Technol. 2005, 39, 1338-1345 57
2 Liu et al., Chem Mater. 2005, 21 5315-5322
57
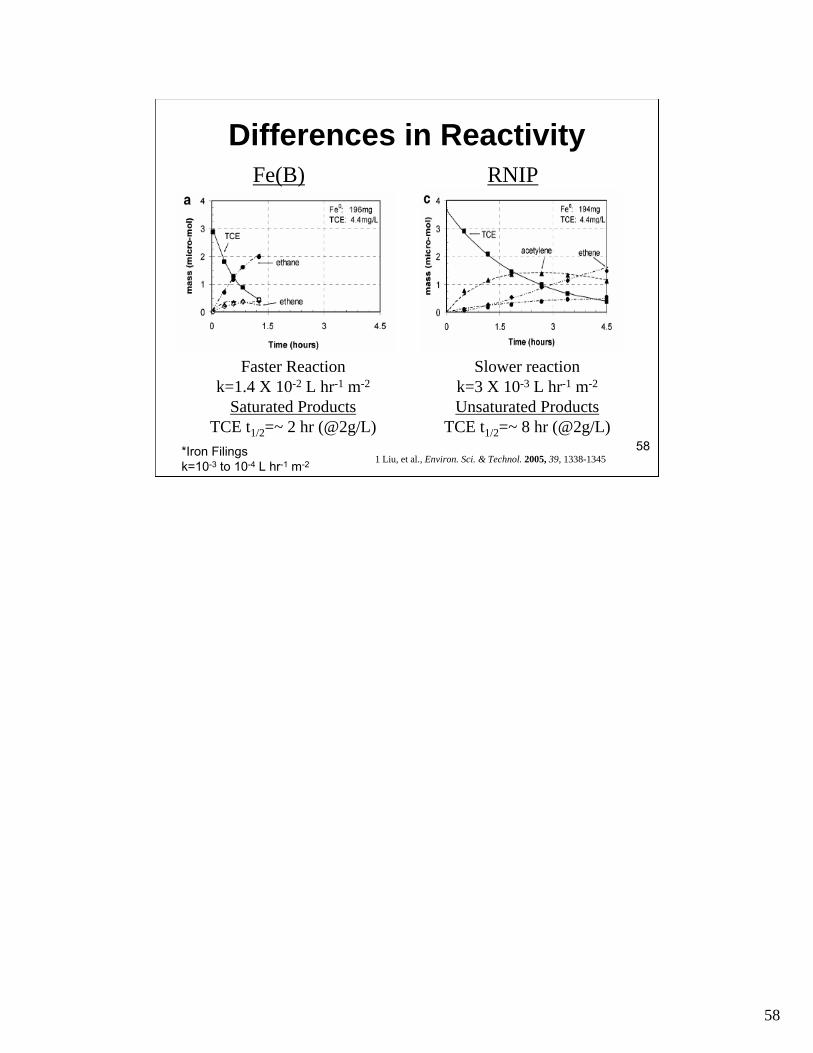
Differences in ReactivityDifferences in ReactivityFe(B) RNIP
Faster Reaction k=1.4 X 10⁻² L hr-1 m-2
Saturated Products TCE t1/2=~ 2 hr (@2g/L)
Slower reaction k=3 X 10⁻³ L hr-1 m-2
Unsaturated Products TCE t1/2=~ 8 hr (@2g/L)
*Iron Filings 581 Liu, et al., Environ. Sci. & Technol. 2005, 39, 1338-1345
k=10-3 to 10-4 L hr-1 m-2
58
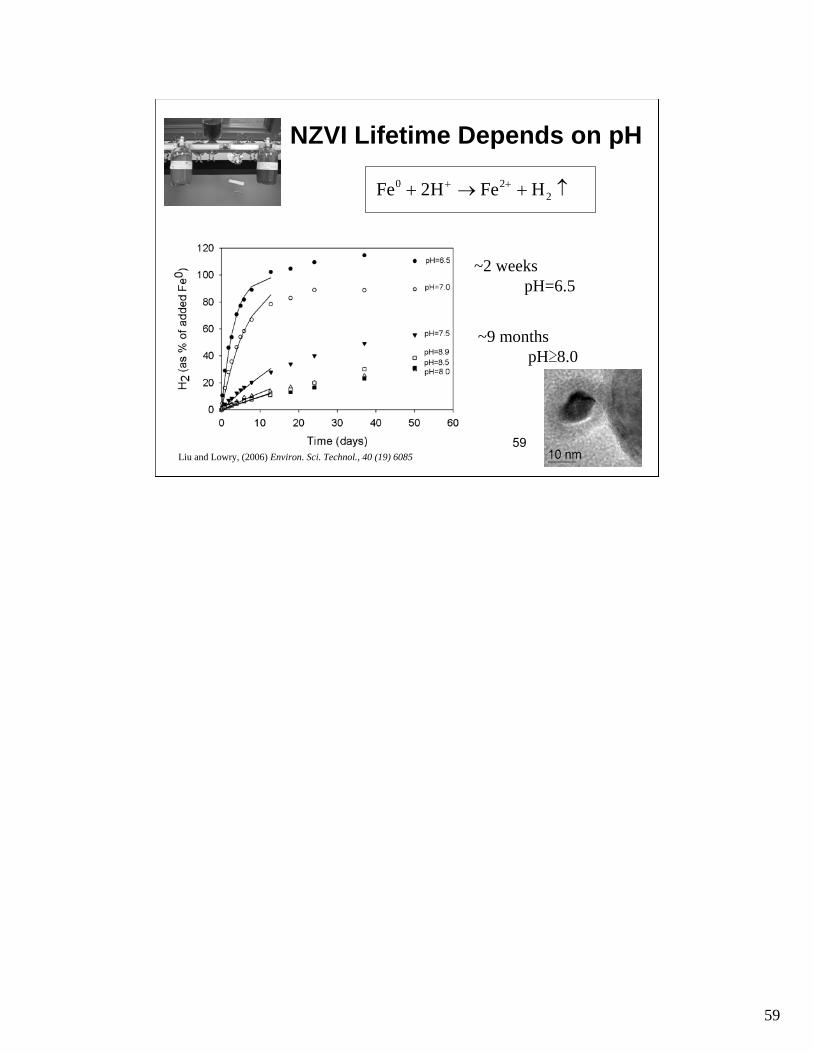
NZVI Lifetime Depends on pHNZVI Lifetime Depends on pH
~2 weeks pH=6.5
~9 months pH≥8.0
↑+→+ ++ 2
20 HFeH2Fe
Liu and Lowry, (2006) Environ. Sci. Technol., 40 (19) 6085 59
59

11
TCE Dechlorination OverTCE Dechlorination Over Particle LifetimeParticle Lifetime
kobs,TCE is relatively constant as particles age
Liu and Lowry, (2006) Environ. Sci. Technol., 40 (19) 6085 60
60
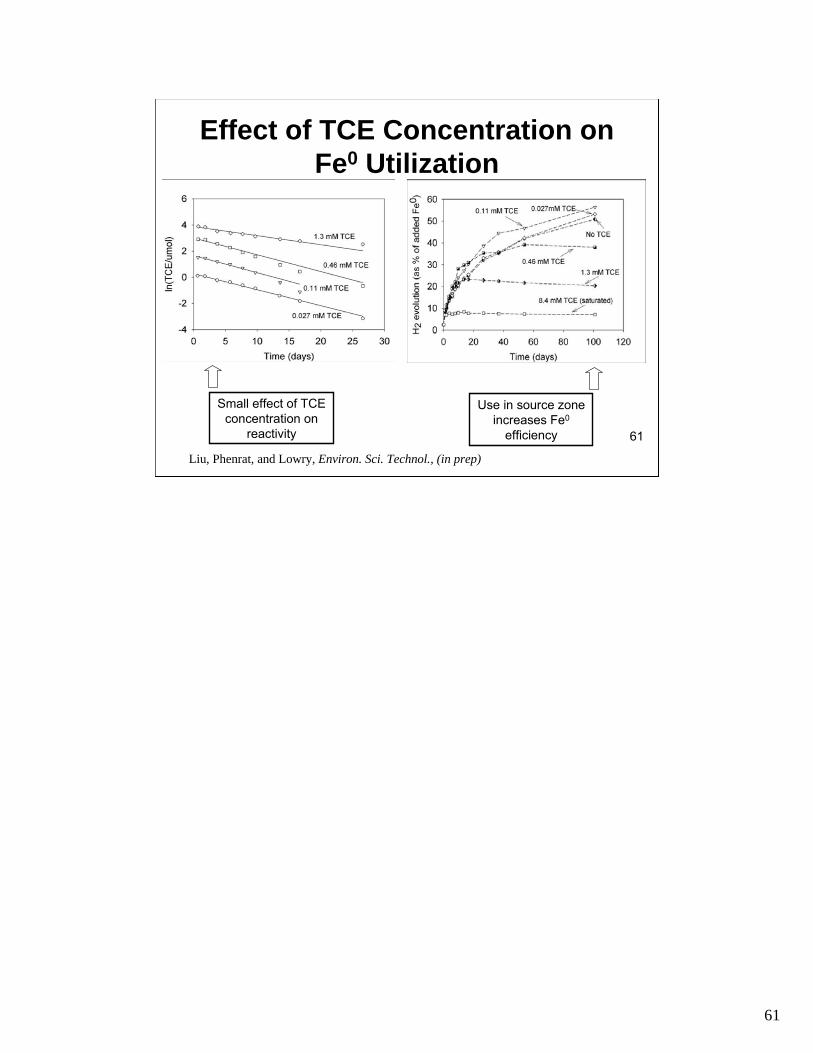
Effect of TCE Concentration onEffect of TCE Concentration on FeFe00 UtilizationUtilization
Small effect of TCE Use in source zone concentration on increases Fe0
reactivity efficiency 61
Liu, Phenrat, and Lowry, Environ. Sci. Technol., (in prep)
61
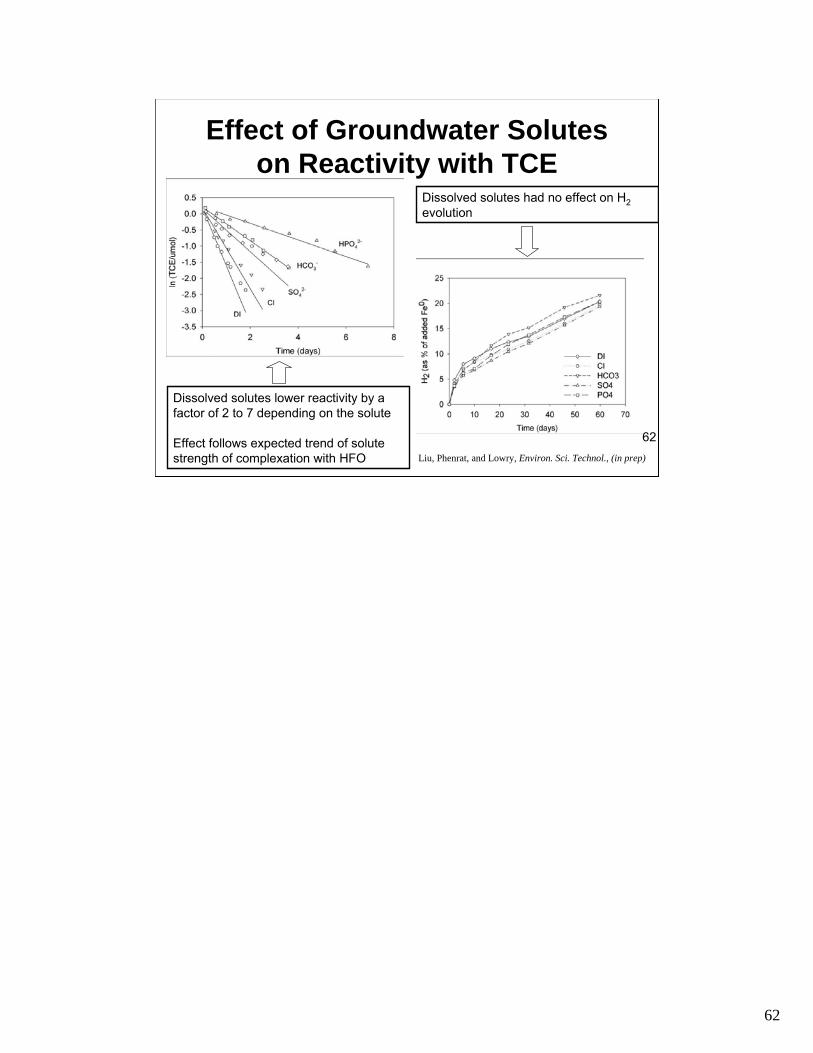
Effect of Groundwater SolutesEffect of Groundwater Solutes on Reactivity with TCEon Reactivity with TCE
Dissolved solutes lower reactivity by a factor of 2 to 7 depending on the solute
Effect follows expected trend of solute strength of complexation with HFO
Dissolved solutes had no effect on H2
evolution
Liu, Phenrat, and Lowry, Environ. Sci. Technol., (in prep)
62
62
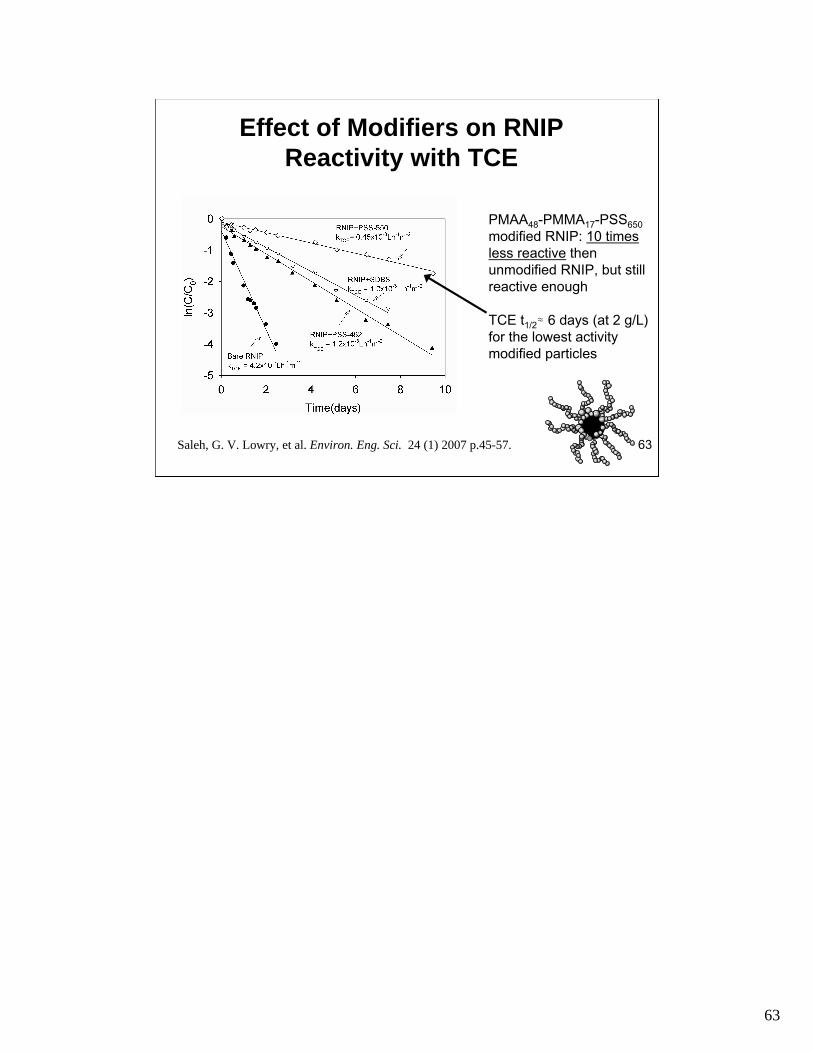
Effect of Modifiers on RNIPEffect of Modifiers on RNIP Reactivity with TCEReactivity with TCE
PMAA48-PMMA17-PSS650
modified RNIP: 10 times less reactive then unmodified RNIP, but still reactive enough
TCE t1/2≈ 6 days (at 2 g/L) for the lowest activity modified particles
Saleh, G. V. Lowry, et al. Environ. Eng. Sci. 24 (1) 2007 p.45-57. 63
63
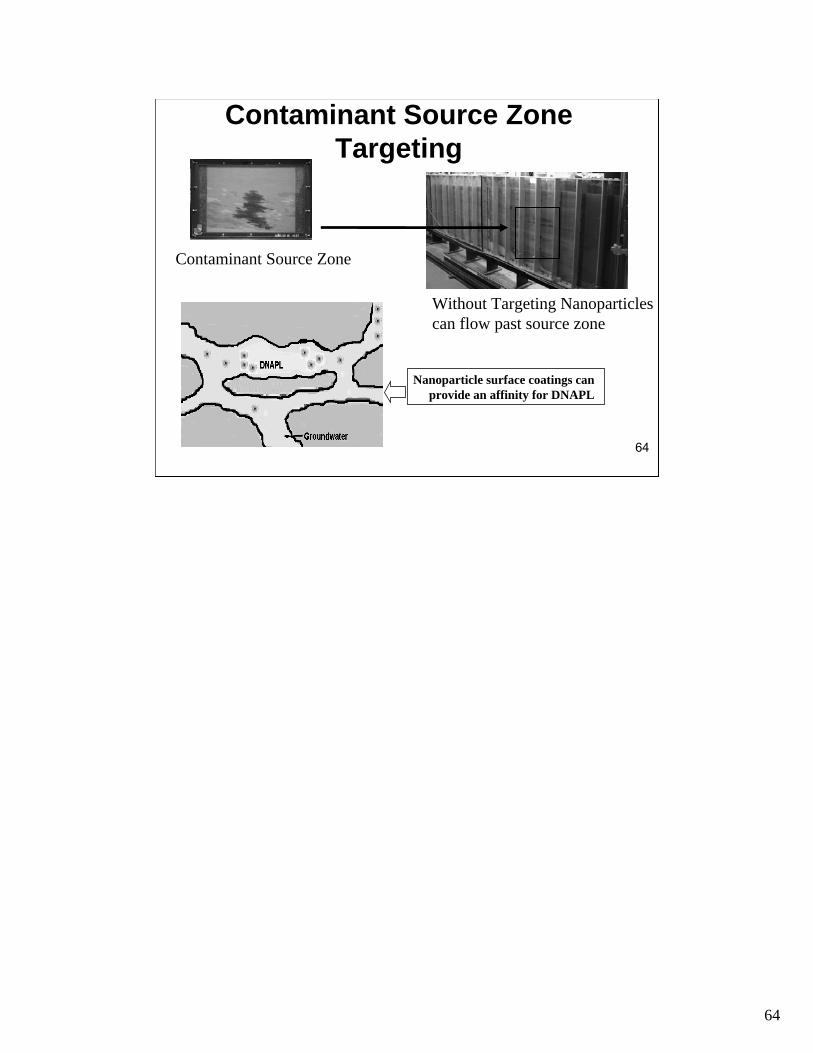
Contaminant Source ZoneContaminant Source Zone TargetingTargeting
Contaminant Source Zone
Without Targeting Nanoparticles can flow past source zone
Nanoparticle surface coatings can provide an affinity for DNAPL
64
64
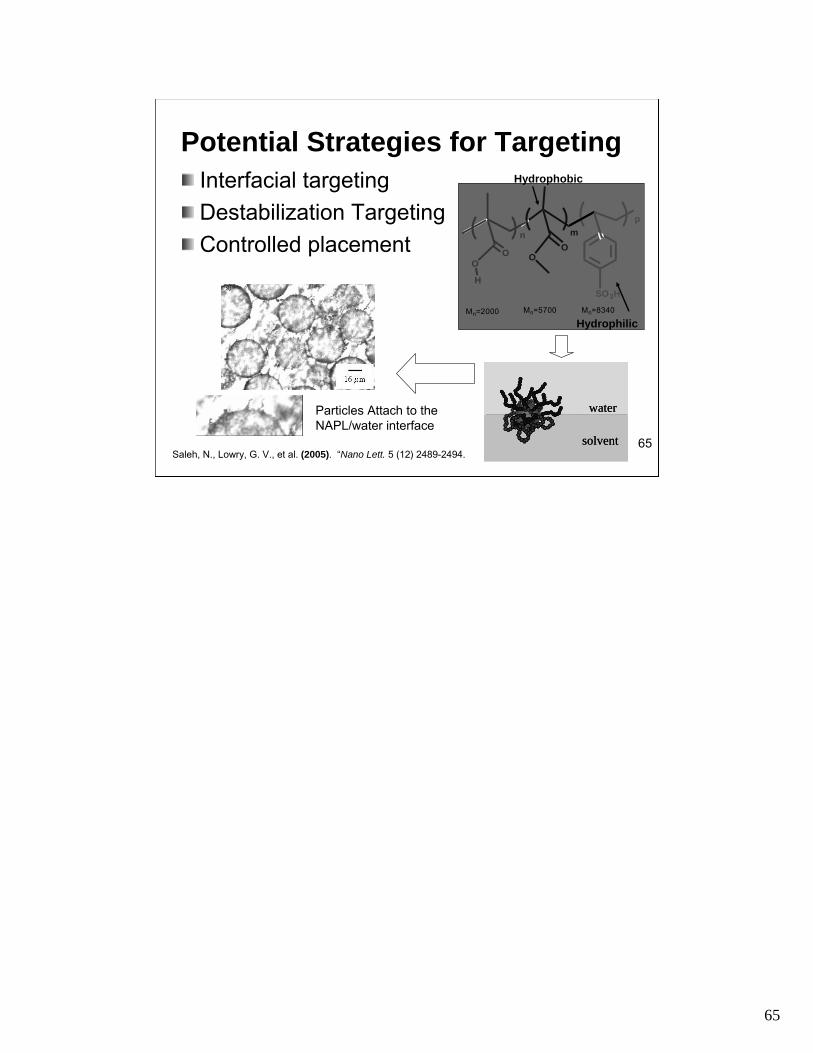
Potential Strategies for Targeting Interfacial targetingInterfacial targeting Hydrophobic
Destabilization TargetingDestabilization Targeting p
n m
OControlled placementControlled placement O O O
H
SO3H
Mn=2000 Mn=5700 Mn=8340
Hydrophilic
Particles Attach to the waterwater
NAPL/water interface solventsolvent 65
Saleh, N., Lowry, G. V., et al. (2005). “Nano Lett. 5 (12) 2489-2494.
65

Interfacial Targeting ChallengesInterfacial Targeting Challenges
TCE
Water
Nanoiron Trajectory at different porewater velocities
• Flow velocities: 30-150 μm/s (2.6-13m/day) •Residence time: 1-10 s
Baumann, T., Keller, A. A., Auset-Vallejo, M., Lowry, G V. (2005). AGU Fall Meeting, San Francisco, CA, December 5-9, 2005.
66
66
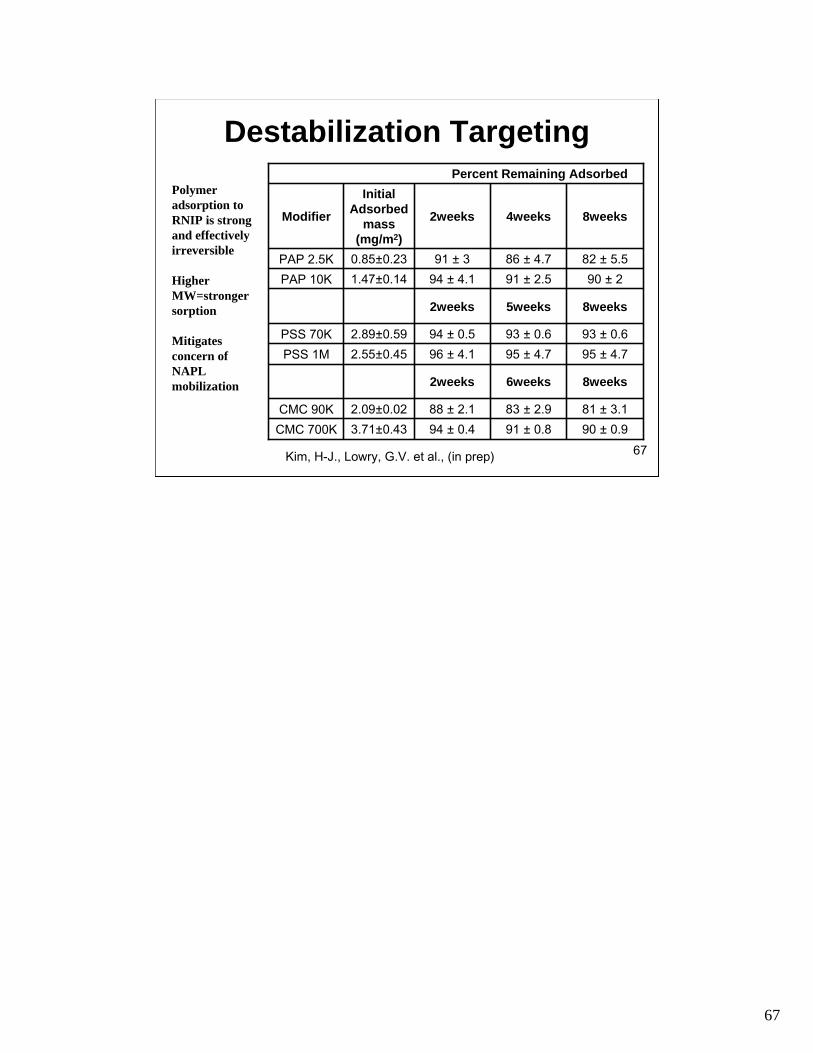
Destabilization Targeting
Polymer adsorption to RNIP is strong and effectively irreversible
Higher MW=stronger sorption
Mitigates concern of NAPL mobilization
PercentPercent RemaininRemaining Adg Adssoorrbbeded
MoModidififierer
IniInittiaiall AdAdsosorbrbeded
massmass(m(mg/mg/m22))
22wweekseeks 44wweekseeks 88wweekseeks
PAP 2.5KPAP 2.5K 0.80.855±±0.0.2323 9191 ±± 33 8686 ±± 4.4.77 8282 ±± 5.5.55
PAP 10KPAP 10K 1.41.477±±0.0.1414 9494 ±± 4.4.11 9191 ±± 2.2.55 9090 ±± 22
22wweekseeks 55wweekseeks 88wweekseeks
PSS 70KPSS 70K 2.82.899±±0.0.5959 9494 ±± 0.0.55 9393 ±± 0.0.66 9393 ±± 0.0.66
PSS 1MPSS 1M 2.52.555±±0.0.4545 9696 ±± 4.4.11 9595 ±± 4.4.77 9595 ±± 4.4.77
22wweekseeks 66wweekseeks 88wweekseeks
CMC 90KCMC 90K 2.02.099±±0.0.0202 8888 ±± 2.2.11 8383 ±± 2.2.99 8181 ±± 3.3.11
CMC 700KCMC 700K 3.73.711±±0.0.4343 9494 ±± 0.0.44 9191 ±± 0.0.88 9090 ±± 0.0.99
Kim, H-J., Lowry, G.V. et al., (in prep) 67
67
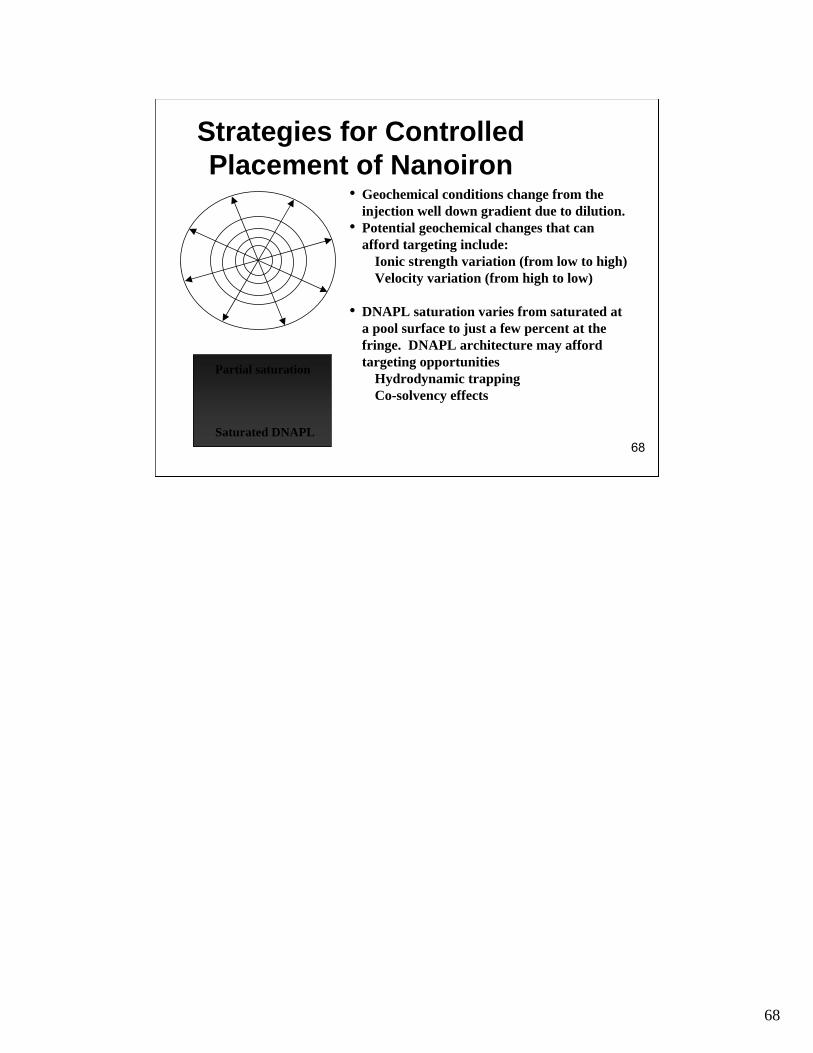
Strategies for ControlledStrategies for Controlled Placement of NanoironPlacement of Nanoiron
• Geochemical conditions change from the injection well down gradient due to dilution.
• Potential geochemical changes that can afford targeting include:
Ionic strength variation (from low to high) Velocity variation (from high to low)
• DNAPL saturation varies from saturated at a pool surface to just a few percent at the fringe. DNAPL architecture may afford targeting opportunities
Hydrodynamic trapping Co-solvency effects
Saturated DNAPL
Partial saturation
68
68
––
––
–
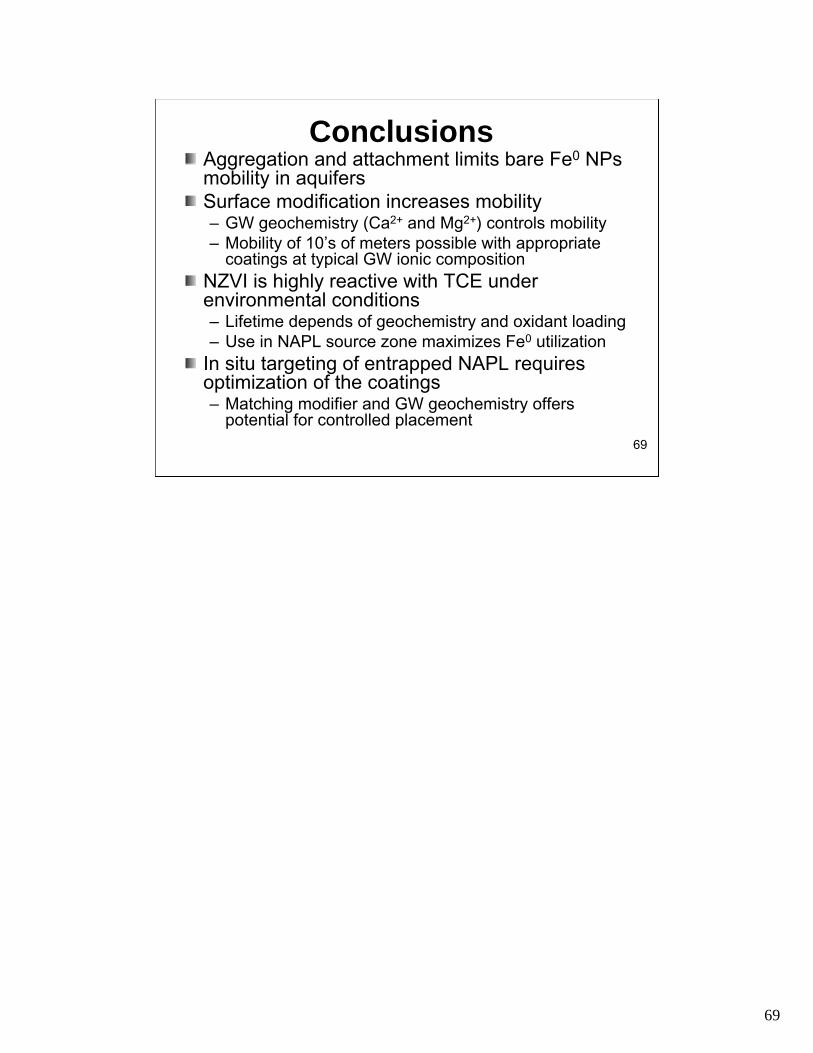
ConclusionsConclusionsAggregation and attachment limits bare FeAggregation and attachment limits bare Fe00 NPsNPs mobility in aquifersmobility in aquifersSurface modification increases mobilitySurface modification increases mobility– GW geochemistry (CaGW geochemistry (Ca2+2+ and Mgand Mg2+2+) controls mobility) controls mobility– Mobility of 10’s of meters possible with appropriateMobility of 10’s of meters possible with appropriate
coatings at typical GW ionic compositioncoatings at typical GW ionic composition
NZVI is highly reactive with TCE underNZVI is highly reactive with TCE under environmental conditionsenvironmental conditions – Lifetime depends of geochemistry and oxiLifetime depends of geochemistry and ox dant loadingidant loading– Use in NAPL source zone maximizes FeUse in NAPL source zone maximizes Fe00 utilizationutilization
In situ tarIn situ targeting of entrapped NAPL requiresequiresgeting of entrapped NAPL r optimization of the coatingsoptimization of the coatings – Matching modifier and GW geochemistry offersMatching modifier and GW geochemistry offers
potential for controlled placementpotential for controlled placement
69
69
––
– -– -
–––
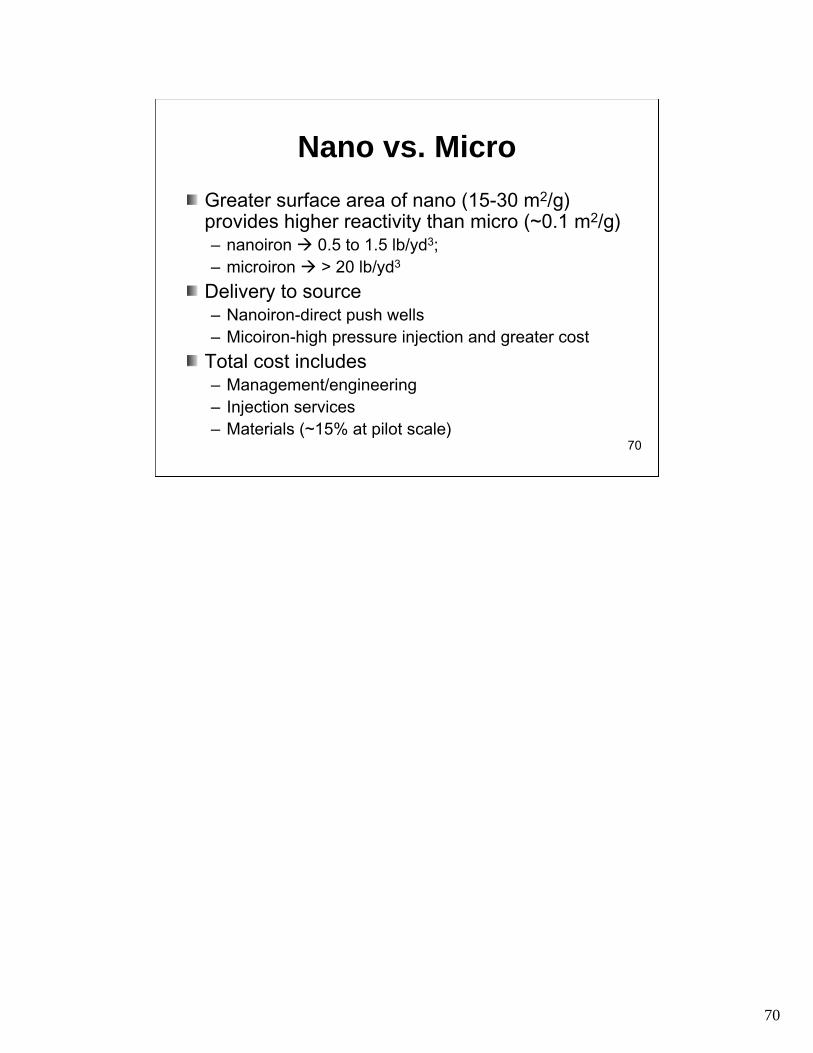
Nano vs. MicroNano vs. Micro
Greater surface area of nano (1Greater surface area of nano ( 515--30 m30 m22/g)/g) provides higher reactivity than micro (~0.1 mprovides higher reactivity than micro (~0.1 m22/g)/g)– nanoironnanoiron ÆÆ 0.5 to 1.5 lb/yd0.5 to 1.5 lb/yd33;;– microironmicroiron ÆÆ > 20 lb/y> 20 lb/ dyd33
Delivery to sourceDelivery to source– NanoironNanoiron-direct push wellsdirect push wells– MicoironMicoiron-high pressure injehigh pressure inj ction and greater costection and greater cost
Total cost includesTotal cost includes– Management/engineeringManagement/engineering– Injection servicesInjection services– Materials (~15% at pilot scale)Materials (~15% at pilot scale)
70
70
Field Validation Needed
Assessment of the effect of treatmAssessment of the effect of tr ent oneatment on the DNAPL mass and mass emission fromthe DNAPL mass and mass emission from the source is neededthe source is neededPilotPilot--scale field demonstration WITHscale field demonstration WITH substantial characterization before, dursubstantial char ing,acterization before, during, and after treatment is neededand after treatment is neededBetter understanding of the between NZVIBetter understanding of the between NZVI and the microbial communities at a siteand the microbial communities at a site are neededare needed
71
71
AcknowledgementAcknowledgementTodaToda KoygoKoygo Corp.Corp.U.S. EPAU.S. EPA--STAR (R830898)STAR (R830898)US DOE EMSP ProgramUS DOE EMSP Program (DE(DE--FG07FG07-02ER63507)02ER63507)USUS DoDDoD (SERDP)(SERDP)((W912HQW912HQ--0606--CC--0038)0038)US NSFUS NSF (CBET(CBET--0608646)0608646)
R830898R83089872
72
73
Thank You
After viewing the links to additional resources, please complete our online feedback form.
Thank You
Links to Additional Resources
73 73