risk management and quality improvement handbook · risk management and quality improvement...
TRANSCRIPT

EQuIPNational Resource
RISK MANAGEMENT & QUALITY IMPROVEMENT HANDBOOK
Page 2 of 81
Copyright © The Australian Council on Healthcare Standards (ACHS) Risk Management and Quality Improvement Handbook. EQuIPNational. July 2013
Risk Management and Quality Improvement Handbook, July 2013
Produced by the Australian Council on Healthcare Standards (ACHS)
Copies available from the ACHS website: www.achs.org.au/
Copyright © the Australian Council on Healthcare Standards (ACHS)
This work is copyright. Apart from any use as permitted under the Copyright Act 1968, no part may be reproduced by any process without prior written permission from The Australian Council on Healthcare Standards. Requests and enquiries concerning reproduction and rights should be addressed to the Chief Executive, The Australian Council on Healthcare Standards, 5 Macarthur Street, ULTIMO NSW 2007 Australia.
Telephone: 61 2 9281 9955
Facsimile: 61 2 9211 9633
Recommended citation: The Australian Council on Healthcare Standards (ACHS), Risk Management and Quality Improvement Handbook. Sydney Australia; ACHS; 2013.
First edition (EQuIP 4): 2007 Second edition (EQuIP5): 2011 Third edition (EQuIPNational): 2013
This Handbook is only available via the ACHS website and may be revised annually. In this case,
the version number and date in the footer will change.
ISBN 13: 978-1-921806-46-9
Developed by Deborah Jones – Manager, Standards and Program Development
The Australian Council on Healthcare Standards.
The ACHS would like to thank the following people for their time and expertise in reviewing the content of this document:
Cathy Balding, Director, Qualityworks P/L
Joy Brumby, ACHS Education Manager
Gillian Clark, ACHS Education Consultant
Karen Edwards, ACHS Surveyor, CEO / DON Calvary Health Care Sydney
Vince Gagliotti, ACHS Surveyor, Quality Manager, St Vincent’s Hospital, Melbourne
Sue Gilham, ACHS Survey Coordinator
Kaye Hogan, ACHS Survey Coordinator
Elizabeth Kingsley ACHS Project Officer Standards and Product Development
Ros Pearson, ACHS Contracted Survey Coordinator
Sandy Thomson, ACHS Contracted Survey Coordinator
Page 3 of 81
Copyright © The Australian Council on Healthcare Standards (ACHS) Risk Management and Quality Improvement Handbook. EQuIPNational. July 2013
Contents
Definitions ................................................................................................. 5
Introduction ............................................................................................... 6
The EQuIPNational Framework ............................................................................................ 6
The EQuIPNational Standards .............................................................................................. 7
Risk Management and Quality Improvement ....................................................................... 8
Developing a Commitment to Risk Management and Quality Improvement using EQuIPNational. ...................................................................................................................... 9
Incorporating Risk Management and Quality Improvement into Organisational Planning .............................................................................................................................................. 10
Section 2 .................................................................................................. 12
Creating an Improving Organisation .................................................................................. 12
Organisational Culture and Change Management ............................................................ 12
The change model .............................................................................................................................. 15
Team building ..................................................................................................................................... 18
Summary .............................................................................................................................. 19
Section 3 .................................................................................................. 20
Risk Management Essentials .............................................................................................. 20
Risk Management System Requirements .......................................................................... 20
Responsibilities and Accountabilities ............................................................................... 23
Risk Management Resources ............................................................................................. 24
Risk Management Processes and Strategies .................................................................... 26
The Risk Register ................................................................................................................ 29
Summary .............................................................................................................................. 32
Section 4 .................................................................................................. 33
Quality Improvement .............................................................................. 33
Quality Cycle ........................................................................................................................ 33
Quality Improvement Essentials ........................................................................................ 36
Identifying Areas Requiring Improvement ......................................................................... 41
Sentinel events, adverse events and root cause analysis .................................................................. 41
Incident monitoring ............................................................................................................................. 44

Page 4 of 81
Copyright © The Australian Council on Healthcare Standards (ACHS) Risk Management and Quality Improvement Handbook. EQuIPNational. July 2013
Gap analysis ....................................................................................................................................... 45
Surveys ............................................................................................................................................... 46
Patient feedback systems ................................................................................................................... 47
Rapid appraisals ................................................................................................................................. 48
Audits .................................................................................................................................................. 49
Accreditation survey results and recommendations ........................................................................... 50
Clinical indicators ................................................................................................................................ 51
Patient journey surveys ...................................................................................................................... 52
Benchmarking ..................................................................................................................................... 53
Summary .............................................................................................................................. 57
Section 5 .................................................................................................. 58
Quality Improvement Tools................................................................................................. 58
Using the Right Tool for the Task....................................................................................... 58
Identifying the current steps in a process ........................................................................................... 59
Analysing the process ......................................................................................................................... 59
Planning solutions to improve the process ......................................................................................... 59
Measuring improvements ................................................................................................................... 60
Affinity diagrams ................................................................................................................................. 61
Bar charts / graphs ............................................................................................................................. 62
Brainstorming ...................................................................................................................................... 63
Cause and Effect (Fishbone) .............................................................................................................. 64
Control charts...................................................................................................................................... 64
Failure Mode Effects Analysis (FMEA) ............................................................................................... 65
Flow charts .......................................................................................................................................... 68
Histograms .......................................................................................................................................... 70
Pareto charts....................................................................................................................................... 70
Run charts / line graphs ...................................................................................................................... 72
Section 6 .................................................................................................. 73
Evaluation ............................................................................................................................ 73
Structure, process and outcome ........................................................................................ 75
Structure ............................................................................................................................................. 76
Process ............................................................................................................................................... 76
Outcome ............................................................................................................................................. 77
Conclusion ........................................................................................................................... 78

Page 5 of 81
Copyright © The Australian Council on Healthcare Standards (ACHS) Risk Management and Quality Improvement Handbook. EQuIPNational. July 2013
Definitions Quality: the extent to which a health care service or product produces a desired outcome.
1
Quality improvement: an ongoing response to quality assessment data about a service in ways that
improve the processes by which services are provided to consumers / patients.2
Quality Improvement Plan: a document that outlines at a minimum what area requires improvement,
how an organisation intends to carry out that improvement, timeframes and responsibilities.
The size, type, complexity and location of the organisation will influence the activities to be undertaken.
The Quality Improvement Plan should be provided to ACHS with the self-assessments in the non-survey
phases of the accreditation cycle. It should also be available for surveyors to review at any onsite surveys.
Risk: the effect of uncertainty on objectives.3 A healthcare organisation’s objectives have different
aspects, such as clinical, financial, health and safety or environmental, and they apply at the strategic,
organisation-wide, unit, project or process levels. In the context of risk, uncertainty is defined as “the state,
even partial, of deficiency of information related to understanding or knowledge of an event, its
consequence, or likelihood”. Any deviation from the expected can result in a positive and/or negative
effect. Therefore, any type of risk, whatever its nature, may have either (or both) positive or negative
consequences.
Risk management: the coordinated activities to direct and control an organisation with regard to risk.3
Risk management process: the systematic application of management policies, procedures and
practices to the activities of communicating, consulting, establishing the context, and identifying,
analysing, evaluating, treating, monitoring and reviewing risk.3
Risk Register: a centralised record that identifies for each known risk:
a description of the risk, its causes and its impact
an outline of the existing controls, including the person accountable for managing the risk
an assessment of the consequences of the risk should it occur and the likelihood of the consequence
occurring, given the controls
a risk rating
an overall priority for the risk.
Page 6 of 81
Copyright © The Australian Council on Healthcare Standards (ACHS) Risk Management and Quality Improvement Handbook. EQuIPNational. July 2013
Introduction
This document is the Risk Management and Quality Improvement Handbook. It is designed to
complement the EQuIPNational programs of The Australian Council on Healthcare Standards
(ACHS) by providing information to assist member organisations with the development of their
Quality Improvement Plan and Risk Register, which are requirements of the EQuIPNational
program, and the National Safety and Quality Health Service (NSQHS) Standards program.
This publication is available from the members’ section of the ACHS website as an eBook.
The EQuIPNational Framework
The key components of EQuIPNational are:
Ten NSQHS Standards that organisations are required to be accredited against
Five ACHS EQuIP-content Standards that build on concepts in the NSQHS Standards and
cover the performance of service delivery, care provision and non-clinical systems
A yearly Self-Assessment to evaluate organisational performance against the Standards
Provision by the member organisation of a Risk Register and a Quality Improvement Plan
ACHS assistance and guidance on the organisation’s Self-Assessment
Biennial onsite surveys by an external, experienced team of ACHS accreditation surveyors,
to provide an independent assessment of the organisation’s performance against the
Standards and recommendations for improvement
The improvement process undertaken by organisations to address the recommendations
from the onsite surveys.
It is envisaged that a planned, systematic approach to implementing the EQuIPNational
Program will support and enable organisations to achieve successfully their mission and goals
and organisational effectiveness.

Page 7 of 81
Copyright © The Australian Council on Healthcare Standards (ACHS) Risk Management and Quality Improvement Handbook. EQuIPNational. July 2013
The EQuIPNational Standards
The ACHS EQuIPNational program consists of 15 Standards, including the ten NSQHS
Standards:
And the five EQuIP-content standards:

Page 8 of 81
Copyright © The Australian Council on Healthcare Standards (ACHS) Risk Management and Quality Improvement Handbook. EQuIPNational. July 2013
Section 1
Risk Management and Quality Improvement Quality improvement has always been an integral part of EQuIP. ACHS provides information on
risk management and quality improvement within this handbook to assist organisations to
manage risks at the organisational, division, department and system levels and to ensure that
quality of care and services are integrated.
The EQuIPNational program provides a framework for organisations to evaluate their
performance in risk management and quality improvement. It is expected that each organisation
will identify and implement effective risk and quality management processes consistently and in
accordance with the organisation’s role. ACHS surveyors will consider risk management
processes, consumer / patient safety and quality of care and services when assessing
organisational performance against each action and when making suggestions and
recommendations on survey results.
Healthcare organisations’ systems for risk management and quality improvement are reviewed
within the National Safety and Quality Health Service (NSQHS) Standards under Standard 1:
Governance for Safety and Quality in Health Service Organisations. In addition, NSQHS
Standards 3-10 require organisations to undertake a risk assessment of their systems. For
example, NSQHS Standard 4 requires a risk assessment of medication management systems.
These risk assessments are managed by the associated governance committees with key risks
also being represented on the organisation-wide Risk Register. The same applies for quality
plans. Organisations are required to submit a Quality Improvement Plan at each phase of their
accreditation cycle and have a register of the organisational risks (Risk Register) available for
ACHS surveyors at each onsite survey. This Risk Management and Quality Improvement
Handbook is provided to assist organisations to develop and monitor both the organisation-wide
Risk Register and the Quality Improvement Plan.
The risk management information in this handbook does not duplicate or replace AS/NZS ISO
31000:2009 Risk Management, but is designed to provide some further healthcare-relevant
information and guidance, and focuses on risk management systems.

Page 9 of 81
Copyright © The Australian Council on Healthcare Standards (ACHS) Risk Management and Quality Improvement Handbook. EQuIPNational. July 2013
Developing a Commitment to Risk Management and Quality Improvement using EQuIPNational. Risk management and quality improvement are not isolated processes. They provide a
framework for considering everything an organisation does, how it is done, and identifying ways
to make it even better – before problems are identified. Many organisations have successfully
implemented effective risk management and quality improvement programs where staff are keen
to participate and share their experiences. Networking and discussion with peers can help to
identify problems and potential solutions to improve outcomes and reduce risk.
For risk management and quality improvement programs to be most effective, the governing
body and leadership team must demonstrate commitment to the processes and define their
expectations for all stakeholders. In addition, the leadership team should ensure that there are
sufficient resources to meet the requirements of the organisation and systems to effectively
mitigate, control and manage all risks, and that attention is focused on the core business of the
organisation – to care for and treat consumers / patients in a safe and high quality clinical
environment
Implementing the systems and processes that assist an organisation to become a safe and
accountable healthcare environment for consumers / patients, staff and healthcare providers
requires ongoing attention. Applying EQuIPNational as an organisation-wide quality program
provides a means to monitor and manage identified risks and continually improve those systems
and processes.
Risk management and quality improvement systems are both directed to providing a structured
framework for identification, analysis, treatment / corrective action, monitoring and review of
risks, problems and/or opportunities. Communication and consultation with stakeholders are
critical for these processes to work effectively.
Continuous improvement and risk management are data driven. They depend on relevant
information being provided to the executive, clinicians, managers and the governing body. The
data and information provided should reflect the issues that are most significant to the
organisation, rather than just for the process of data and information collection itself.
A range of tools that can be used for quality improvement also applies to analysing risk issues.
This handbook provides some examples of these tools to assist organisations to implement risk

Page 10 of 81
Copyright © The Australian Council on Healthcare Standards (ACHS) Risk Management and Quality Improvement Handbook. EQuIPNational. July 2013
management and quality improvement processes and programs. These are not just sets of
management tools; although there are numerous tools and skills available to develop and utilise,
there are also principles and frameworks for using these tools that are required to ensure
effective systems are implemented.
Incorporating Risk Management and Quality Improvement into Organisational Planning Quality improvement and the management of risks in health care should be part of both strategic
and operational planning in every area and service of healthcare delivery, clinical and non-
clinical. Risk management and quality improvement should be considered as an integrated
approach when determining clinical practice, equipment design and procurement, capital
development, information technology, contractor management, workplace health and safety,
workforce management, and financial planning, and all other areas of operation.
To determine the priorities of risk management and quality improvement, the approach to
quality, and the structure of an internal improvement and risk management program, the
organisation should identify:
Its stakeholders
What its priorities are:
What activities has the strategic plan highlighted?
How will risk management and improvement activities relate to the strategic goals?
What problems have been identified and/or are reported?
Are there external requirements that must be achieved?
What aspects of care should be targeted?
Are there particular clinical areas that need support?
What resources are available to make improvements and manage risks?
What expertise do staff have in quality improvement and risk management?
What are the greatest risks to the organisation?
What are the greatest opportunities for the organisation?
What are the consequences of those risks or opportunities?
What is the likelihood of those risks or opportunities occurring?

Page 11 of 81
Copyright © The Australian Council on Healthcare Standards (ACHS) Risk Management and Quality Improvement Handbook. EQuIPNational. July 2013
What approach and structure to take:
How will the governing body be involved?
Who will be responsible for and coordinate the activities and programs?
How will the organisation involve the staff?
How will the organisation communicate its plans for improvement and risk management
to stakeholders?
How will progress be monitored?
How will improvements be monitored?
What body / group / committee will monitor progress and/or improvements?
What tools should be utilised?
Outcomes from the above questions can be incorporated into the organisation’s strategic and
operational plans, which should be linked together. The organisation may choose to develop a
separate plan for risk management and quality improvement, but this should also be reflected in
the operational and strategic plans.
The specific risk management and quality improvement actions in Standard 1 of the NSQHS
Standards focus on the overarching framework that promotes integration of risk management
with quality improvement strategies and informs decision making and planning. The risk
management and quality improvement actions in Standard 1 are core actions and organisations
must obtain a Satisfactorily Met rating in these to gain or maintain accreditation.
The NSQHS Standard 1 risk management item (1.5) and actions (1.5.1 and 1.5.2) require
organisations to establish an organisation-wide “system that incorporates identification,
assessment, rating, controls and monitoring for patient safety and quality”. The quality
improvement item (1.6) and actions (1.6.1 and 1.6.2) require organisations to establish an
organisation-wide system “that monitors and reports on the safety and quality of patient care and
informs changes in practice”.
Both of these items include the requirement for organisations to regularly monitor an
organisation-wide Risk Register and quality management system and to take action to minimise
risks to consumer / patient safety and quality of care.
Systems for risk management and quality improvement apply across all of the 15 EQuIPNational
Standards, and organisations should monitor their ongoing success through its processes of
governance and evaluation.
Page 12 of 81
Copyright © The Australian Council on Healthcare Standards (ACHS) Risk Management and Quality Improvement Handbook. EQuIPNational. July 2013
Section 2
Creating an Improving Organisation
An essential first step when getting started on process improvement is for the governance or
leadership team to make it a priority. The importance of process improvement must be
communicated from the top. Leaders need to foster an organisational environment in which a
process improvement mentality can thrive and staff are using quality-related tools and
techniques on a regular basis.
Instilling a process improvement mentality in an organisation can be challenging as it sometimes
requires a different way of thinking than staff are usually accustomed to. Process improvement
requires thinking to change from ‘fire fighter’ to ‘fire preventer’. The focus is on improving a
process in the long term, not just patching up procedures and processes as problems occur. To
get started on process improvement, leaders should ensure the culture of the organisation is
one of support and encouragement, which provides the necessary resources of people, time and
training. In some cases, this may require organisations to review their culture and instigate
change management if required.
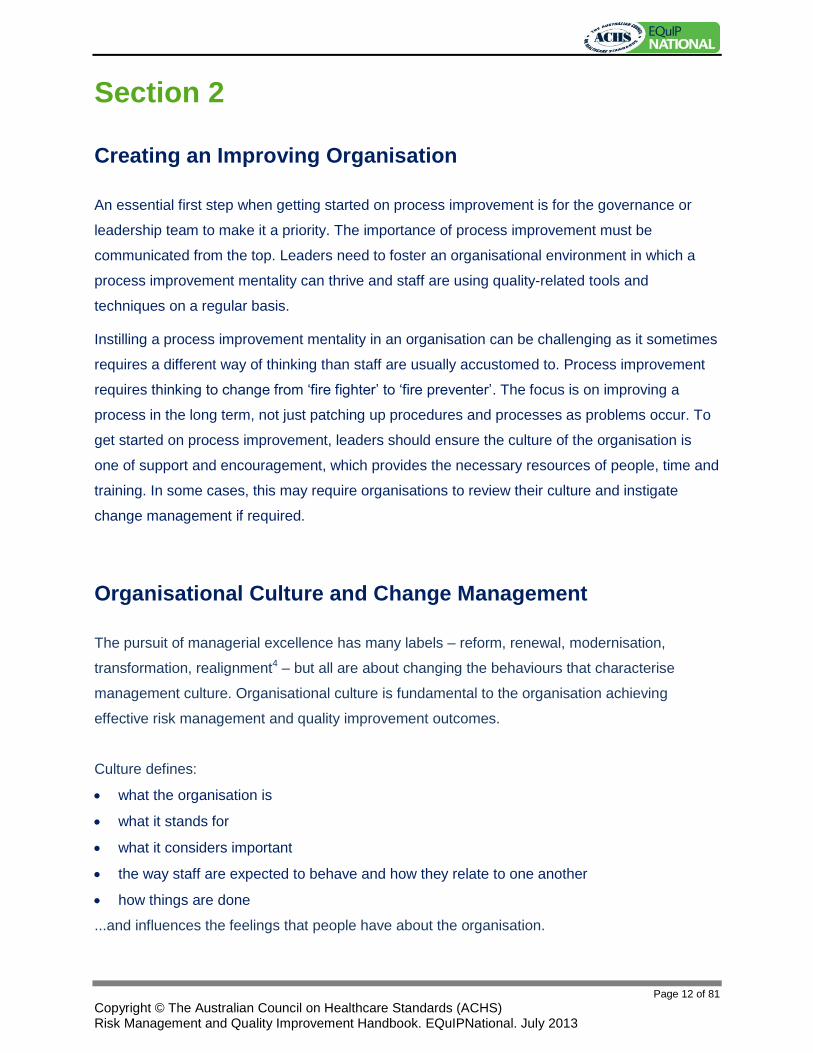
Organisational Culture and Change Management
The pursuit of managerial excellence has many labels – reform, renewal, modernisation,
transformation, realignment4 – but all are about changing the behaviours that characterise
management culture. Organisational culture is fundamental to the organisation achieving
effective risk management and quality improvement outcomes.
Culture defines:
what the organisation is
what it stands for
what it considers important
the way staff are expected to behave and how they relate to one another
how things are done
...and influences the feelings that people have about the organisation.
Page 13 of 81
Copyright © The Australian Council on Healthcare Standards (ACHS) Risk Management and Quality Improvement Handbook. EQuIPNational. July 2013
Cultural change can be successful only when an organisation has a good understanding of the
difference between the culture it currently has, and the culture it is trying to build. Clear and
objective measurement is one common feature of successful cultural change.
People within an organisation often do not recognise the culture of that organisation, its values
and behaviours. It often takes an external person or entity to identify the culture and assist an
organisation to change. This external view can be provided during an onsite survey and in the
survey report; ACHS surveyors may assist and support organisational change through feedback.
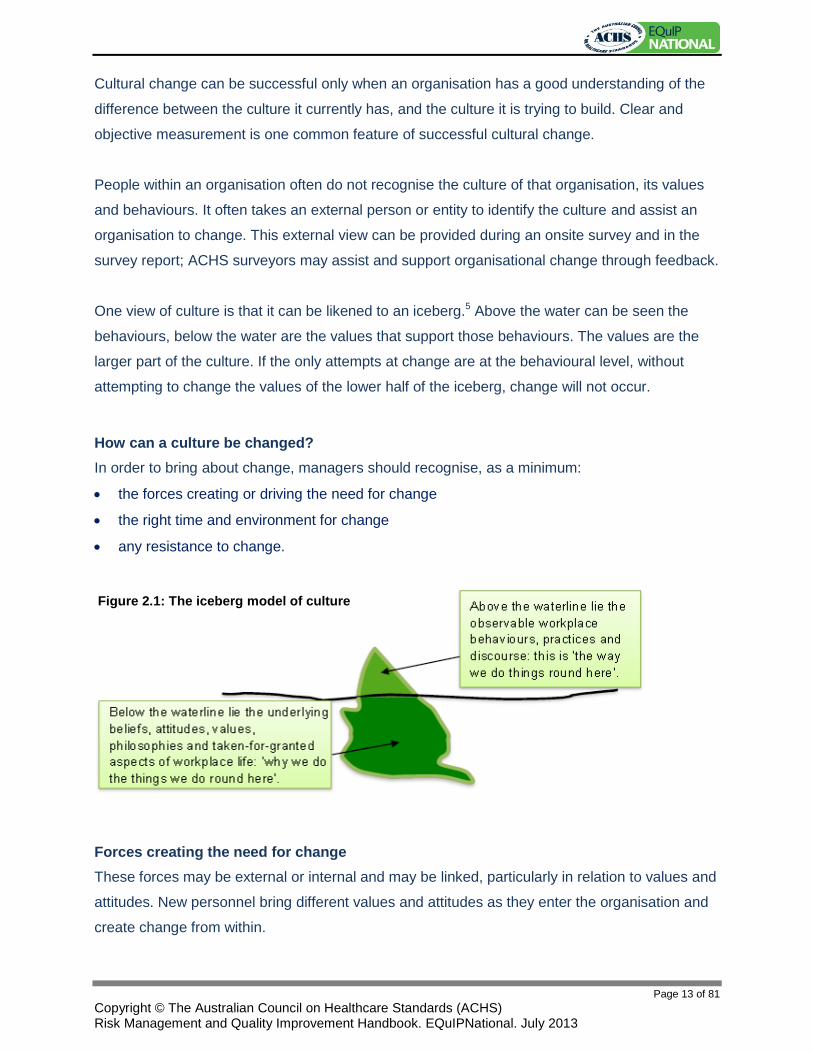
One view of culture is that it can be likened to an iceberg.5 Above the water can be seen the
behaviours, below the water are the values that support those behaviours. The values are the
larger part of the culture. If the only attempts at change are at the behavioural level, without
attempting to change the values of the lower half of the iceberg, change will not occur.
How can a culture be changed?
In order to bring about change, managers should recognise, as a minimum:
the forces creating or driving the need for change
the right time and environment for change
any resistance to change.
Forces creating the need for change
These forces may be external or internal and may be linked, particularly in relation to values and
attitudes. New personnel bring different values and attitudes as they enter the organisation and
create change from within.
Figure 2.1: The iceberg model of culture

Page 14 of 81
Copyright © The Australian Council on Healthcare Standards (ACHS) Risk Management and Quality Improvement Handbook. EQuIPNational. July 2013
Internal forces: any factor in the internal environment that influences the way the organisation
conducts its activities, for example:
advances in technology; automated equipment may require a complete change in work
routines and training requirements
employee attitudes and behaviour; patterns of decision making, ability to adapt to changing
circumstances, morale and motivation
costs and resource allocation.
External forces: any factor in the external environment that influences the way the organisation
or service conducts its activities, for example:
relevant Acts, legislation, regulations, Australian Standards, codes of practice and industry
guidelines
population demographics including social and community groups, changes in consumer
needs
economic pressures, including unemployment, financial constraints and government
involvement
Competition; increase in alternative services.6
The right time and environment for change
Creating acceptance for change requires recognition that change is desirable and feasible and
that something is no longer effective.
Effective change management relies on accepting the need for change and setting some
achievable goals as the first steps.
Executing change is a systematic effort that requires involvement from those who will be
affected by the change, and will assist to gain enough acceptance to make the implementation
of change effective. Remember that:
small changes require minimal planning as they can be handled in a quick and routine
manner.
developing a program of planned change is appropriate when the organisation, or a major
portion of it, must prepare for and adapt to change. This program needs to be designed and
implemented with a structured and innovative approach.

Page 15 of 81
Copyright © The Australian Council on Healthcare Standards (ACHS) Risk Management and Quality Improvement Handbook. EQuIPNational. July 2013
Resistance to change
Major obstacles to the implementation of new goals, policies or operational strategies could
include:
uncertainty about the cause and effect of change leading staff to avoid change, for example:
previous strategies offer consequences and established procedures that are well known
and predictable
employees are uncertain about their ability to learn new skills or achieve what is
required of them
lack of trust about changes that are initiated by managers
changes that may be recognised as beneficial for the organisation may continue to be
resented.
unwillingness to give up existing benefits, as appropriate change may benefit the
organisation but may not benefit the individual or service groups. For some individuals lost
power, prestige, salary and quality of work will not be sufficiently offset by the rewards of
change.
lack of awareness of weaknesses. Weaknesses in the proposed changes are sometimes
identified by those individuals resisting change, but are not seen by those initiating the
change. This form of resistance can prevent change being made for the sake of making
change and allow the organisation to maintain stability while change proposals are
evaluated.
The change model
No single approach can fit all organisations. Every organisation should have its own model of
change corresponding to its needs and issues. When change efforts fail, it can be because of
systemic reasons, such as poor vision, inadequate communications, insufficient planning and
resources, failure to make a compelling case, and inconsistent messages with leaders not
following through. The steps and methods will depend on the organisation and the changes
required.
Change models can fall into three types:
top-down
transformational leadership
strategic approaches.

Page 16 of 81
Copyright © The Australian Council on Healthcare Standards (ACHS) Risk Management and Quality Improvement Handbook. EQuIPNational. July 2013
A top-down approach can be effective, but only if leaders control the levers of recruitment,
promotion, incentives and dismissal - and at the same time pay attention to the people factor
and are open to feedback. New behaviour will eventually be accepted and become the culture.
With transformational leadership, culture change comes through changing the way things are
done in an organisation so that, over time, people will change as well.
The strategic approach holds that if you change how individuals feel and provide them with
new experiences, they will eventually adopt the new behaviours, leading to the emergence of a
new culture.
One longstanding model suggests that to change a culture takes three broad steps, unfreezing
the culture, changing the culture and refreezing the culture.7
Figure 2.2 The change model
Unfreezing involves making the need for change so obvious that individuals or an organisation
can see and accept it. Unfreezing may be accompanied by introducing new information and
decreasing the strength of previous, inappropriate values or demonstrating their lack of
effectiveness.
Changing involves the change agent, in partnership with the organisational members, creating
situations in which new values, attitudes and behaviours are acquired by the organisation.
Refreezing requires the new behaviour to be locked into place with supporting mechanisms.
The individual, the group or the organisation experiences the benefits of the new behaviour or
structure. Reinforcement is a vital component of refreezing. Effective performance should be
recognised and promoted as the ‘new norm’.

Page 17 of 81
Copyright © The Australian Council on Healthcare Standards (ACHS) Risk Management and Quality Improvement Handbook. EQuIPNational. July 2013
There are many processes and methods that can be utilised in these three broad steps. As with
other quality improvement processes, an organisation can use the quality cycle for the change
process, see Figure 4.3 or refer to Figure 2.3, which presents a roadmap for changing
management culture.
Figure 2.3 A roadmap for changing culture
8

Page 18 of 81
Copyright © The Australian Council on Healthcare Standards (ACHS) Risk Management and Quality Improvement Handbook. EQuIPNational. July 2013
Team building
Risk management and quality improvement are often achieved through team activity. There is
no one best approach for developing and implementing a work team. The team should
complement the vision and goals of the organisation.9
In a team-oriented environment, everyone contributes to the overall success of the organisation.
Even though individual staff have a specific job function and belong to a specific department,
they are unified with other staff members to accomplish the overall objectives. The bigger picture
drives their actions and their function exists to serve the bigger picture.
A team approach can help facilitate:
achievement of quality improvement targets
provision of quality service
organisation-wide knowledge
collaboration in work practices
transparency in communication
the achievement of desired outcomes and continuous quality improvement within the
organisation.
A team is a group of people working together towards a common goal. Characteristics of an
effective team include:
having members who share a common purpose and goals and are multi-skilled
flexible management
managers who are facilitators and not just supervisors
the capacity to make decisions which are coordinated and based on expertise and best
practice.
'Team building' is the process of enabling a group of people to reach their goal. Items that may
assist organisations during the development and implementation of teams include:
make time and allow personal space for innovation
recognise achievements and reward appropriately
use measurement systems and information management systems that are aligned with the
goals of the team
recognise team leaders and encourage constructive interactive behaviour
encourage consensus to build ownership of the team’s actions and productivity.

Page 19 of 81
Copyright © The Australian Council on Healthcare Standards (ACHS) Risk Management and Quality Improvement Handbook. EQuIPNational. July 2013
Summary Risk management and quality improvement are organisation-wide processes. They are aligned
in their focus on identifying potential problems and implementing corrective strategies.
Integrating the two programs can increase an organisation’s ability to minimise errors, enhance
efficiency and improve care and services. Figure 2.4 provides a view of how the two systems
relate to each other.
In order to have an integrated organisation-wide risk management and quality improvement
system, all staff need to work as a team. No matter how talented individuals on a staff may be,
unless they can function together efficiently and with excellence, the organisation will not
achieve the level of performance it has planned.
The integrated risk management and quality improvement framework should be documented in
a plan that is provided to all staff members. The plan should:
outline the specific roles of the two systems
explain how the two systems work together
address problem identification, process monitoring and analysis
explain implementation of changed processes
address evaluation of improvements.
Risk Management Overlapping Functions Quality Improvement
Accreditation compliance Claims management Consumer / patient relations
and disclosure Contract / policy review Corporate and regulatory
compliance Mandatory event reporting Risk identification, e.g. near-
miss and adverse event reporting
Risk control, e.g. loss prevention and loss reduction
Risk financing Safety and security Workers compensation
Accreditation issues Analysis of adverse and
sentinel events and trends Board reports Consumer / patient complaint
handling Consumer / patient education Feedback to staff and
healthcare providers Proactive risk assessments Public reporting of quality
data Provider credentialling Root-cause analysis Staff education and training Strategic planning
Accreditation coordination Audits / benchmarking /
clinical indicators etc. Best practice / clinical
guidelines Consumer / patient
satisfaction Improvement projects Peer review Provider performance and
competency Quality methodology Quality of care reviews Utilisation / resource /case
management
Figure 2.4 Functions of a risk management and quality improvement program.
The following chapters provide information on risk management and quality improvement, and
outline some strategies for identifying areas for improvement and evaluating the changes
implemented.

Page 20 of 81
Copyright © The Australian Council on Healthcare Standards (ACHS) Risk Management and Quality Improvement Handbook. EQuIPNational. July 2013
Section 3 Risk Management Essentials All activities of any organisation involve risk that must be managed. This is particularly true of
healthcare organisations, where in addition to the degree of risk inherent to the provision of care,
there is community expectation of safety. ACHS requires that a register of organisational risks
be made available to surveyors at any onsite surveys; organisations may also chose to submit
their Risk Register to ACHS with their self-assessment. As previously noted, NSQHS Standards
3 -10 require risk assessments of systems such as infection control and medication
management, and the associated governance committees would be expected to manage these.
Further information on using a risk management approach to meet the NSQHS Standards is
available on the Australian Commission on Safety and Quality in Health Care’s (ACSQHC’s)
website: www.safetyandquality.gov.au
The goal of risk management in health care is to:
1. minimise the likelihood of possible events that have negative consequences for consumers /
patients, staff and the organisation
2. minimise the risk of death, injury and/or disease for consumers / patients, employees and
others as a result of services provided
3. enhance consumer / patient outcomes
4. manage resources effectively
5. support legislative compliance and to ensure organisational viability and development.
Risk management links to all Standards and criteria within the EQuIPNational framework as
risks to the organisation can arise in both corporate and clinical services. Many of the Standards
are explicit about the management of risk, such as Standard 3, pertaining to healthcare
associated infection risks, and Standard 4, pertaining to medication safety risks.
Risk Management System Requirements A systems approach to implementing risk management should ensure that risk management is
an integral part of all decision making by providing a framework to assess and prioritise risks for
existing services as well as service planning. A system for embedding the risk management
process is required.
Page 21 of 81
Copyright © The Australian Council on Healthcare Standards (ACHS) Risk Management and Quality Improvement Handbook. EQuIPNational. July 2013
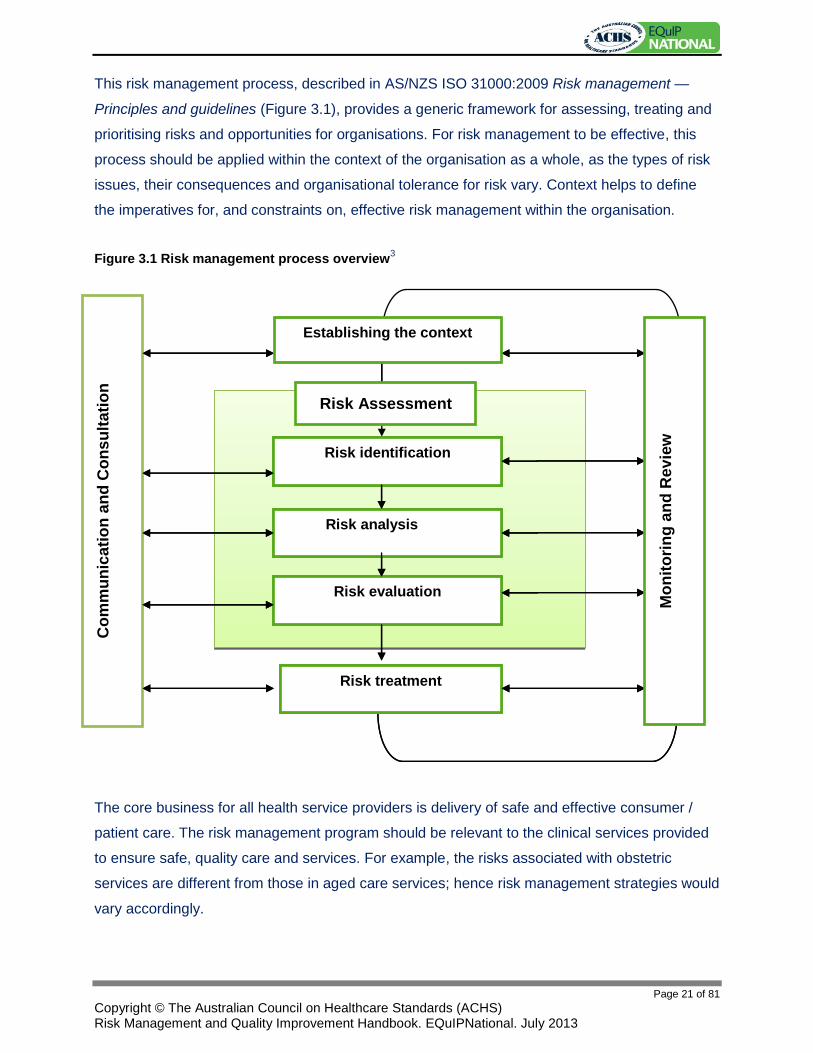
This risk management process, described in AS/NZS ISO 31000:2009 Risk management —
Principles and guidelines (Figure 3.1), provides a generic framework for assessing, treating and
prioritising risks and opportunities for organisations. For risk management to be effective, this
process should be applied within the context of the organisation as a whole, as the types of risk
issues, their consequences and organisational tolerance for risk vary. Context helps to define
the imperatives for, and constraints on, effective risk management within the organisation.
Figure 3.1 Risk management process overview3
The core business for all health service providers is delivery of safe and effective consumer /
patient care. The risk management program should be relevant to the clinical services provided
to ensure safe, quality care and services. For example, the risks associated with obstetric
services are different from those in aged care services; hence risk management strategies would
vary accordingly.
Risk identification
Risk analysis
Risk evaluation
Risk Assessment
Risk treatment
Co
mm
un
ica
tio
n a
nd
Co
ns
ult
ati
on
Risk identification
Risk analysis
Risk evaluation
Risk treatment
Establishing the context
Mo
nit
ori
ng
an
d R
ev
iew

Page 22 of 81
Copyright © The Australian Council on Healthcare Standards (ACHS) Risk Management and Quality Improvement Handbook. EQuIPNational. July 2013
The role and context relevant to the organisation should be documented with consideration
given to:
the mission and values of the organisation
its community
the organisational services
its location, for example rural facilities may have different risk issues from metropolitan
facilities
the funding model, such as public, private, for profit or not-for-profit
jurisdictional requirements
physical infrastructure, whether it is a new facility, leased premises or heritage-listed building
clinical and non-clinical services provided
service delivery models
the governance structure for the organisation
relevant stakeholders.
The organisation’s risk management framework should define the organisation’s risk
management language, tolerances, tools to be used, communication and escalation
requirements and reporting processes, and should be defined as part of establishing the context.
The risk management policy should identify:
Who: is required to report, communicate, action
What: is required to be reported by staff, managers, executives, governance
committees
When: risks are to be reported and when information is to be disseminated to the
clinicians, staff, executive and governance committees / governing body
Where: information is stored, communicated
How: tools and processes are to be used – e.g. risk assessments, risk registers and
when a risk may be removed from the current risk register.
The governing body should endorse the risk management policy and establish clear
requirements for what type of risk issues and level of risk should be communicated. Linking
documents to assist with defining the context for an organisation could include service
agreements, strategic plans, business plans, quality improvement plans, organisational charts,
organisational committee structures, roles and responsibilities, policies and procedures, and
risk-specific management programs.

Page 23 of 81
Copyright © The Australian Council on Healthcare Standards (ACHS) Risk Management and Quality Improvement Handbook. EQuIPNational. July 2013
Figure 3.2 Dimensions of risk in health care
Risk-specific management programs such as Clinical Risk Management, Workplace Health &
Safety or Human Resources should be developed to address the organisation’s identified risks
in a manner consistent with, and contributing to, the integrated Risk Management Policy.
Risk-specific assessments are required for NSQHS Standards 3 -10 and these should also feed
into the main risk system
Responsibilities and Accountabilities Responsibilities and accountabilities for risk management should be formally defined for the
overarching risk management program, for risk-specific programs, and for the identification,
analysing and reporting of risk issues. The governing body should define the communication and
escalation requirements for risk information in accordance with good governance standards. As
described by Neil in the Institute for Healthcare Improvement’s Boards on Board10, “Leaders are
responsible for everything in the organisation, especially everything that goes wrong.” The
Corporate risks Clinical risks
Page 24 of 81
Copyright © The Australian Council on Healthcare Standards (ACHS) Risk Management and Quality Improvement Handbook. EQuIPNational. July 2013
governing body and leaders should ensure that “at the same time as concentrating on strategic
and important matters, [they] also need to be certain that all risks are effectively controlled and
managed and attention is focused on the core business of the organisation – to care for and
treat patients”.11
Accountabilities and responsibilities should be defined for all stakeholders including the
governing body, managers, employees, clinicians, contractors and service providers.
Responsibilities for key risk categories should also be assigned – for example infection control,
quality improvement or work health and safety (WHS).
Roles and responsibilities within organisations and how they will be managed will depend on the
role, size and complexity of the organisation. For example, large organisations may have a
dedicated Risk Manager role to oversee the risk management system, while smaller
organisations may incorporate responsibilities into existing roles.
Risk management responsibilities should be integrated into credentialling requirements, position
descriptions, service level agreements, contracts and agreements and terms of reference for
committees.
Risk Management Resources Resources should be allocated to manage risk issues appropriate to the size and scope of the
organisation and the consequences of failure to manage the risk. Resources may include
financial resources, human resources and physical resources such as building design and
equipment.
Measures to engage stakeholders should be implemented, for example through strategic
planning. Communication and consultation with stakeholders, both internal and external, are
integral to the establishment of a risk management culture and the effective management of risk.
Different individuals and stakeholder groups will have different perceptions about a risk and its
potential impact, so it is necessary to ensure that this is recognised and taken into consideration
when decisions and action plans are made.
The organisation’s key stakeholders should be identified and appropriate mechanisms for
communication with them established. Key stakeholders must include decision makers,
employees, managers, clinicians, contractors, volunteers, regulators, consumers / patients and
Page 25 of 81
Copyright © The Australian Council on Healthcare Standards (ACHS) Risk Management and Quality Improvement Handbook. EQuIPNational. July 2013
their families / carers. As a component of establishing the context of the organisation and for
analysing individual risk issues, identifying the appropriate communication structures should be
undertaken. This process should be supported by a communication plan that addresses the
confidential sharing of information related to the risk itself and the process for its management.
Avenues for communication and consultation should be determined according to the scope of
services provided, the type of information to be disseminated (or being sought), and the size of
the organisation. Mechanisms for communicating risk information may include existing
committees or forums within the organisation or dedicated risk management committees. For
example, in a large organisation the Medical Advisory Committee, Audit Committee, Work
Health and Safety Committee, Clinical Risk Management Committee, Drug and Therapeutics
Committee (or equivalent), Infection Prevention and Control Committee, Quality Committee and
Executive Committee could be used to disseminate risk information. In a small organisation,
where there is a limited number of personnel, this may be conducted through a single committee
or role.
Adequate information to assist with assessing and appropriately treating the risk is required and
may involve data collection, literature review, historical records and risk relevant expertise.
Engaging key stakeholders who bring relevant skills and expertise to assessing risks is critical to
ensure comprehensive analysis of the risk related issues.
Risk relevant data should be gathered and used proactively and reactively. The risk analysis
process can be undertaken using qualitative or quantitative analysis methodology. The possible
impact of risks can affect one or several of the aspects of business operation and organisations
should consider clinical, WHS, human resources, information technology, finances, business
practices, the environment and intangibles such as reputation, loss of community confidence
and incongruence with mission and values.
Training is required to ensure that risk management is part of an organisation’s culture. For risk
management systems to be effective, employees, managers, clinicians and service providers
should understand the system for identifying and reporting risk issues and the tools to be used
within the organisation.
Evaluation of the effectiveness of training should be undertaken and documented to assess
whether employees, managers, accredited practitioners and service providers understand and
use the risk management systems.
Page 26 of 81
Copyright © The Australian Council on Healthcare Standards (ACHS) Risk Management and Quality Improvement Handbook. EQuIPNational. July 2013
Risk Management Processes and Strategies Examples of processes and strategies that assist with risk identification and management
include:
Clinical examples
collection and effective use of clinical indicators
morbidity and mortality reviews
clinical audits
adverse outcome screening and clinical incident reporting
health record audits and clinical content reviews
medical emergency reviews
medication management strategies
consumer / patient risk assessments (e.g. falls, pressure areas, VTE)
peer review and peer supervision
effective use of complaints and feedback from consumers / patients and staff
evidence, literature, research.
Non-clinical examples
collection and effective use of indicators relevant to the organisation
audit processes
budget variance monitoring
project activity reports
purchasing and product evaluation
fraud minimisation schemes
WHS risk assessments and hazard identification
lost time injury reports
political change management strategies
workplace safety strategies
financial management strategies
contingency and disaster planning
redundancy in systems
information technology and data entry system infrastructure and capabilities
workforce planning
credentialling and defining the scope of clinical practice for all clinicians

Page 27 of 81
Copyright © The Australian Council on Healthcare Standards (ACHS) Risk Management and Quality Improvement Handbook. EQuIPNational. July 2013
recruitment and retention strategies
education and mandatory training programs for staff
staff performance review and development
equipment maintenance and replacement schedules
external contract reviews.
Risks should be considered using existing processes such as audits, data, trends, literature and
risk assessment tools, as well as via planned reviews of issues with stakeholders through
mechanisms such as brainstorming sessions. Tools used to screen and/or assess risks will vary
depending on the risk being assessed. For example, consumer / patient risk screening and/or
assessments such as falls risk or mobility assessment tools will be different from tools used to
assess risks to achievement of strategic goals, or workplace safety risks. It is important that any
tool used is validated by an expert internal source and/or agreed for use by the governing body.
While the tools used may vary, the language, responsibilities and escalation requirements
associated with an identified risk should be integrated into the organisation-wide process for
analysis and management of risk issues within an overall risk management framework.
A consequence and likelihood table is provided in Figure 3.3, Table 3. The tables in Figure 3.3
are provided as examples only, for an organisation-wide framework.
Each organisation should define the consequences of risk according to their context and risk
tolerance. For example, catastrophic for some organisations may be $30 million dollars, while for
others this may be $30,000. The governing body and relevant stakeholders should be engaged
in determining the consequence and likelihood of identified risks.
Very few risks have only a single consequence or impact on an organisation and the range of
consequences from risks should be considered. For example, a fall can have consequences for
a patient that range from no harm to additional surgical procedures and in a worst case
scenario, death. Patient falls also have a financial consequence for an organisation through
increased care requirements, additional procedures and increased length of stay. In addition,
employees may be exposed to increased risk of injury through trying to prevent a fall or
retrieving a patient from the floor following a fall.

Page 28 of 81
Copyright © The Australian Council on Healthcare Standards (ACHS) Risk Management and Quality Improvement Handbook. EQuIPNational. July 2013
Figure 3.3 Example of a risk matrix, showing risk definition and classification12
Based on AS/NZS ISO 31000:2009
Table 1. Qualitative measures of likelihood.
Table 2 Qualitative risk analysis matrix – level of risk
Table 3 Consequence and likelihood
Note: The number of categories should reflect the needs and nature of the organisation and activity
under study.
Legend: E: extreme risk; immediate action required H: high risk; senior management needed M: moderate risk; management responsibility must be specified L: low risk; manage by routine procedures
Level Descriptor Example Detail Description
A Almost certain Is expected to occur in most circumstances (e.g. most weeks or months)
B Likely Will probably occur in most circumstances (several times a year)
C Possible Might occur at some time (every 1 to 2 years)
D Unlikely Could occur at some time (possibly in the next 2 to 5 years)
E Rare May occur only in exceptional circumstances (perhaps every 5 to 30 years)
Level Descriptor Example Detail Description
1 Extreme Death, toxic release off-site with detrimental effect, huge financial loss (>$500,000)
2 High Extensive injuries, loss of production capability, off-site release with no detrimental effects, major financial loss ($30,000-$500,000)
3 Moderate Medical treatment required, on-site release contained with outside assistance, high financial loss ($1001-$30,000)
4 Low First aid treatment, on-site release contained, medium financial loss ($101 - $1000)
5 Minimum No injuries, low financial loss (e.g. < $100)
Likelihood
Consequences
Extreme 1
High 2
Moderate 3
Low 4
Minimal 5
A (almost certain) E E H M M
B (likely) E E H M M
C (possible) E H H M L
D (unlikely) E H M L L
E (rare) H M M L L

Page 29 of 81
Copyright © The Australian Council on Healthcare Standards (ACHS) Risk Management and Quality Improvement Handbook. EQuIPNational. July 2013
The Risk Register Risk registers are a tool that can be used to assist prioritisation of risks and appropriate
allocation of resources. Risk registers should be more than just a list of risks to provide to ACHS
surveyors; they are dynamic documents that should support decision making and
communication in key committees / forums. Risk issues should be considered during a planned
review and in response to incidents and factors identified through day to day activities.
The EQuIPNational Standards do not specify whether there should one overarching risk register
for the organisation or one for each department or service. Both models exist and it is an
organisation’s choice as to how risk is managed. If there is a tiered approach to risk registers at
both organisational and department / service level, the registers must be kept up to date and
reviewed regularly according to the individual risk rating. There must be clearly defined
mechanisms to escalate a high risk from a department / service Risk Register to the
organisational Risk Register for Executive attention.
The organisational Risk Register must be available for surveyors at survey. ACHS recognises
that there may be some sensitivity to information on a risk register and this is treated as
confidential in the same way that all other organisational information is confidential.
There is no standard list of components that should be included in the risk register. Some of the
most widely used components are:
Dates: as the register is a living document, it is important to record the date that risks are
identified or modified. Optional dates to include are the target and completion dates.
Description of the risk: a phrase that describes the risk
Risk type or area: classification of the risk: It should be noted what area of the organisation
the risk relates to, for example, a business risk, clinical risk or a risk to the buildings.
Likelihood of occurrence: provides an assessment on how likely it is that this risk will occur.
The Risk Matrix (Figure 3.3) provides information on how to complete this section.
Severity of effect: provides an assessment of the impact that the occurrence of this risk
would have on the project / organisation.
Countermeasures: actions to be taken to prevent, reduce, or transfer the risk. This may
include production of contingency plans.
Responsibility / owner: the individual responsible for ensuring that risks are appropriately
engaged with countermeasures undertaken.
Status: indicates whether this is a current risk or if risk can no longer arise and impact the
project. Example classifications are: C-current or E-ended.

Page 30 of 81
Copyright © The Australian Council on Healthcare Standards (ACHS) Risk Management and Quality Improvement Handbook. EQuIPNational. July 2013
Other columns such as quantitative value can also be added if appropriate.
The following table offers an example of a risk register, and is provided as an example only.
Organisations should develop a risk register to suit their individual purposes.
Figure 3.4 Example of a risk register12
No Risk
area
Risk
description
Action Severity Probability Risk
Rating
Eliminate,
reduce or
tolerate
Start
date
Due
date
Cost Responsibility
KEY
Number (No) A unique reference number for each risk identified
Risk Area How or where the risk was identified
Risk Description A description of the risk and its possible impact upon the organisation / people
Action The action required to manage the task
Severity The degree to which interests of the organisation / people would be harmed by the realisation of the risk
Probability The probability of the realisation of the risk
Risk Rating Severity x probability gives the ‘risk rating’ and allows prioritisation
Eliminate, reduce or tolerate
Decision on the management of the identified risk
Start date / Due date / Cost To be regularly reviewed
Responsibility The individual who has overall responsibility for the management of the risk
Page 31 of 81
Copyright © The Australian Council on Healthcare Standards (ACHS) Risk Management and Quality Improvement Handbook. EQuIPNational. July 2013
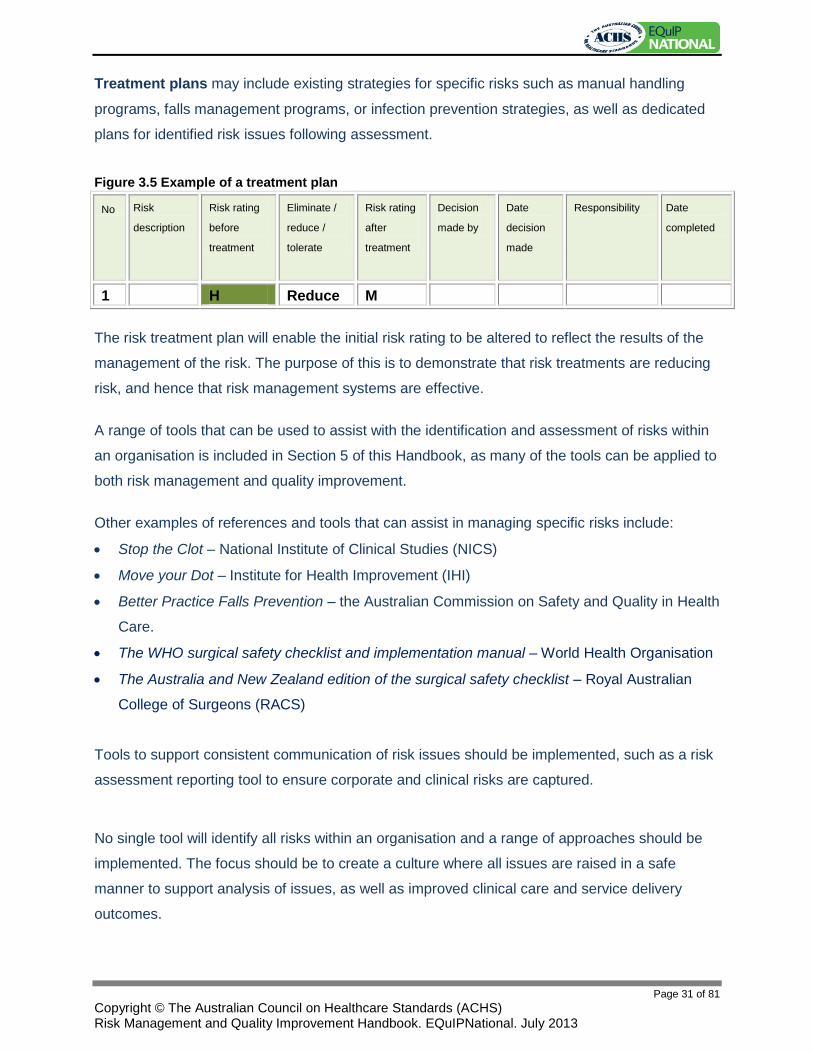
Treatment plans may include existing strategies for specific risks such as manual handling
programs, falls management programs, or infection prevention strategies, as well as dedicated
plans for identified risk issues following assessment.
Figure 3.5 Example of a treatment plan
No Risk
description
Risk rating
before
treatment
Eliminate /
reduce /
tolerate
Risk rating
after
treatment
Decision
made by
Date
decision
made
Responsibility Date
completed
1 H Reduce M
The risk treatment plan will enable the initial risk rating to be altered to reflect the results of the
management of the risk. The purpose of this is to demonstrate that risk treatments are reducing
risk, and hence that risk management systems are effective.
A range of tools that can be used to assist with the identification and assessment of risks within
an organisation is included in Section 5 of this Handbook, as many of the tools can be applied to
both risk management and quality improvement.
Other examples of references and tools that can assist in managing specific risks include:
Stop the Clot – National Institute of Clinical Studies (NICS)
Move your Dot – Institute for Health Improvement (IHI)
Better Practice Falls Prevention – the Australian Commission on Safety and Quality in Health
Care.
The WHO surgical safety checklist and implementation manual – World Health Organisation
The Australia and New Zealand edition of the surgical safety checklist – Royal Australian
College of Surgeons (RACS)
Tools to support consistent communication of risk issues should be implemented, such as a risk
assessment reporting tool to ensure corporate and clinical risks are captured.
No single tool will identify all risks within an organisation and a range of approaches should be
implemented. The focus should be to create a culture where all issues are raised in a safe
manner to support analysis of issues, as well as improved clinical care and service delivery
outcomes.

Page 32 of 81
Copyright © The Australian Council on Healthcare Standards (ACHS) Risk Management and Quality Improvement Handbook. EQuIPNational. July 2013
Review and monitoring mechanisms are integral to the process of risk management. Risk
issues require ongoing review and monitoring, as does the effectiveness of treatment plans and
the management systems in place. The methods and/or timeframes used to monitor and review
the effectiveness of actions taken should be established as part of applying the risk
management process.
Outcomes of the action plan should be progressively monitored and reviewed for effectiveness
by analysing the risk considering the additional controls in place. Such reviews could occur as
part of existing management processes, such as management meetings, incident and risk
assessment reports, audit results both internal and external, and performance indicator reviews,
or as separate planned activities. Guidance regarding when risks may be removed from the
current risk register and returned to management by routine procedures should be included.
The documentation should also identify whether changes in practice and/or policy resulted
following analysis, management, monitoring risk and follow-up action
Summary In summary, effective risk management systems can best be achieved in an atmosphere of trust.
Successful risk management provides assurance that the organisation’s objectives will be
achieved within an acceptable degree of residual risk.13 It also creates an environment in which
quality improvement occurs as the natural consequence of the identification, assessment and
elimination or minimisation of risk. Risk management can therefore also be considered as an
aspect of the organisation’s ongoing continuous quality improvement program.

Page 33 of 81
Copyright © The Australian Council on Healthcare Standards (ACHS) Risk Management and Quality Improvement Handbook. EQuIPNational. July 2013
Section 4 Quality Improvement
Quality Cycle Organisations should select a systematic methodology to progress through the stages of quality
improvement. Many such methods have been developed, but perhaps the most well known is that of
Shewhart14, who developed the PDSA cycle, and Deming’s15 PDCA cycle. PDSA is shown in Figure
4.1. The cycle is continuous and can be entered at any point.
Figure 4.1 Plan, do, study, act
Step 1: Plan
Plan what you are going to do, after you have gathered some evidence of the nature and size of the
problem:
State the objective of the test.
Make predictions about what will happen and why.
Develop a plan to test the change. (Who? What? When? Where? What data should be collected?)
Step 2: Do
Do it, preferably on a small scale first:
Carry out the test.
Document problems and unexpected observations.
Begin analysis of the data.
Page 34 of 81
Copyright © The Australian Council on Healthcare Standards (ACHS) Risk Management and Quality Improvement Handbook. EQuIPNational. July 2013
Step 3: Study
Study the results. Did the plan work?
Complete the analysis of the data.
Compare the data to your predictions.
Summarise and reflect on what was learned.
Step 4: Act
Act on the results. If the plan was successful, standardise this new way of working. If it wasn't, try
something else:
Determine what modifications should be made.
Prepare a plan for the next test.
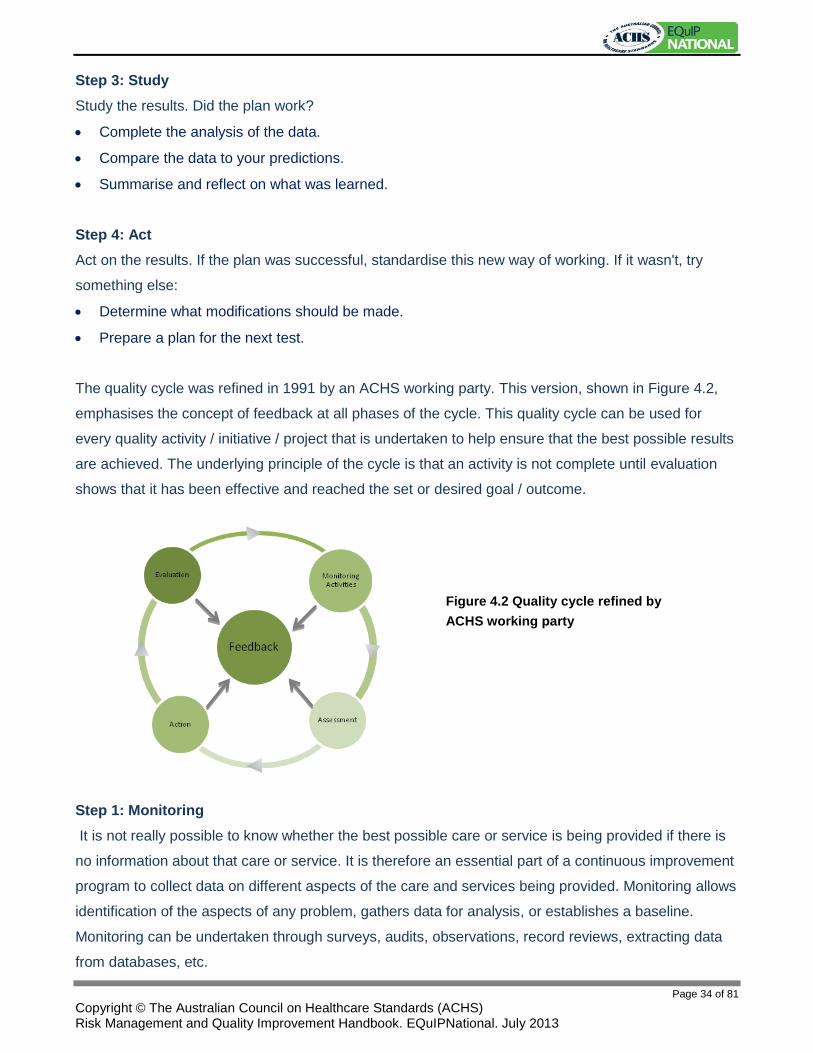
The quality cycle was refined in 1991 by an ACHS working party. This version, shown in Figure 4.2,
emphasises the concept of feedback at all phases of the cycle. This quality cycle can be used for
every quality activity / initiative / project that is undertaken to help ensure that the best possible results
are achieved. The underlying principle of the cycle is that an activity is not complete until evaluation
shows that it has been effective and reached the set or desired goal / outcome.
Step 1: Monitoring
It is not really possible to know whether the best possible care or service is being provided if there is
no information about that care or service. It is therefore an essential part of a continuous improvement
program to collect data on different aspects of the care and services being provided. Monitoring allows
identification of the aspects of any problem, gathers data for analysis, or establishes a baseline.
Monitoring can be undertaken through surveys, audits, observations, record reviews, extracting data
from databases, etc.
Figure 4.2 Quality cycle refined by
ACHS working party

Page 35 of 81
Copyright © The Australian Council on Healthcare Standards (ACHS) Risk Management and Quality Improvement Handbook. EQuIPNational. July 2013
Step 2: Assessment
An assessment of the current situation should be made by analysing the data from the monitoring
phase of the cycle. The analytical quality tools shown in this section of the handbook can be utilised in
this phase. Data presentations, identifying best practice, group discussions and obtaining quotes for
external resources help determine actions to be taken in the next phase.
Step 3: Action
Suitable, practical solutions for system improvement take into consideration the needs of the
consumer / patient and of the staff working in the areas involved, as well as the needs of the service
and organisation. Actions should be prioritised and then taken according to the assessment decisions.
Step 4: Evaluation
The quality activity does not finish once an action is taken. To ensure the required result is achieved
an organisation should ask itself:
Did the action achieve the desired result / outcome?
Is the improvement sustainable over time?
Is there any more that can be done for this activity / initiative / project? Is it complete?
Are the best possible care and services being provided?
Are staff aware of any resulting changes?
Monitoring that was undertaken in the first phase can be repeated and results compared.
Feedback: It is essential that all individuals involved in the review activities are aware of the results
and the effect of the evaluation, and are informed of any subsequent changes introduced into the
organisation. Communication between staff at all phases of the cycle is a critical factor in facilitating a
continued drive for excellence in consumer / patient care delivery.
Such information fed back to the individuals responsible for the activities can be instrumental in
facilitating organisational change. The end result of such feedback systems is that interest in the
quality improvement program may be stimulated at a grass roots level, and it is likely that the task of
assessing the quality care will become more professionally and intellectually rewarding for all
concerned.
The cycle should be repeated until the desired result is achieved and/or maintained.
A documented activity planner and maturity rating scale may be considered to measure and review
actions and outcomes and to evaluate the quality improvement system on a regular basis.
Page 36 of 81
Copyright © The Australian Council on Healthcare Standards (ACHS) Risk Management and Quality Improvement Handbook. EQuIPNational. July 2013
Quality Improvement Essentials Quality improvement is fundamental for all healthcare organisations. A Quality Improvement Plan is
required at each phase of the EQuIPNational cycle, and should be submitted to ACHS with pre-survey
documents, such as the organisation’s self-assessment at Phases 1 and 3, and be available for
surveyors to review during the onsite survey at Phases 2 and 4.
Quality Improvement Program
There are some basic essentials that any quality improvement program should contain but the size,
type, complexity and location of the organisation will influence the activities that are undertaken. An
organisation should identify principles required for a quality improvement program, determine its
priorities for improvement and develop a program accordingly.
For quality improvement to be successful, suggested principles are that it should be:
planned and systematic
based on reliable evidence and accurate analysis
carried out with effective teamwork and communication
applied throughout the organisation.
Quality Improvement Plan
When developing the Quality Improvement Plan, organisations need to consider that a key factor of
quality improvement is that everyone involved should perceive a need to find better ways of meeting
the needs of consumers / patients and the organisation. Successful implementation of quality
improvement will be assisted by:
an approach that is appropriate for the organisation and is consistently applied organisation wide
a total organisational commitment to continuously improving the quality of care and service
provided
an ongoing, comprehensive, multidisciplinary assessment system that engenders continuous
improvement
an education program that enables staff at all levels to develop an understanding relevant to their
level of responsibility and their active participation in the process.
The Quality Improvement Plan should outline what areas require improvement, how the need was
identified, how the organisation intends to carry out those improvements, the timeframes and
designated responsibilities, reporting arrangements including responsibilities for this, and the
evaluation processes including the expected outcomes / improvements.

Page 37 of 81
Copyright © The Australian Council on Healthcare Standards (ACHS) Risk Management and Quality Improvement Handbook. EQuIPNational. July 2013
As with the Risk Register, organisations may choose to take a tiered approach to quality improvement
planning, by developing one overarching plan for the organisation or one for each department or
service. If there is a tiered approach to quality improvement planning at both organisational and
department / service level, the plans must be kept up to date and reviewed regularly.
Requirements for a Quality Improvement Plan
In conjunction with the ACSQHC, the following main considerations for a quality improvement plan
have been identified:
1. Identify the areas that require improvement:
what is the objective
how it is to be improved, i.e. goal / KPI (determine the baseline data against which an
improvement will be measured)
how will this be achieved
how will you know if it is successful (measured against baseline data)
the timeframe
who is accountable
2. Implement the strategies / changes in the organisation
3. Data collected and analysed against the baseline and evaluate the changes in the systems
4. Note if the objective has been completed or evaluated.
The organisational Quality Improvement Plan is required to be submitted to ACHS at each phase of
the accreditation cycle. Figure 4.3 provides an example of the suggested ACSQHC’s requirements for
this, and was developed in conjunction with the ACSQHC. This example does not include an area for
describing how the changes were implemented, or what education has been provided, etc. Information
such as this should be kept for the organisation’s information and for future reference when planning
other quality activities; however, it is not required in the Quality Improvement Plan that is submitted for
accreditation purposes. Further, organisations may find it beneficial to link any issues with the
EQuIPNational Standards, and particularly to the 10 NSQHS Standards.
The table in Figure 4.3 provides an explanation of each heading in the Quality Improvement Plan, as
well as some examples of the amount of information required for each quality improvement activity.

Page 38 of 81
Copyright © The Australian Council on Healthcare Standards (ACHS) Risk Management and Quality Improvement Handbook. EQuIPNational. July 2013
Figure 4.3 Example of the minimum requirements a Quality Improvement Plan
Co
mp
lete
d
or
ev
alu
ate
d
No
te if
th
e o
bje
ctiv
e h
as b
een
co
mp
lete
d o
r ev
alu
ate
d.
H
ave
the
chan
ges
/ st
rate
gies
bee
n
imp
lem
en
ted
?
If e
valu
atio
n is
re
qu
ired
, ho
w
was
th
e ch
ange
ev
alu
ate
d?
Exam
ple
s
Co
mp
are
han
d
hyg
ien
e au
dit
re
sult
s to
sh
ow
tr
end
s in
eac
h
aud
it a
rea.
Acco
un
tab
le
pers
on
(s)
Iden
tify
th
e p
osi
tio
n o
f th
e p
erso
n
resp
on
sib
le f
or
des
ign
ing,
im
ple
me
nti
ng,
m
easu
rin
g an
d
eval
uat
ing
the
imp
rove
men
t.
Infe
ctio
n
Pre
ven
tio
n a
nd
C
on
tro
l Ex
ecu
tive
/
gove
rnan
ce
per
son
.
War
d m
anag
er a
nd
h
and
hyg
ien
e co
ord
inat
or.
Tim
elin
e
Do
cum
ent
the
dat
e o
f ex
pec
ted
co
mp
leti
on
.
30
th J
un
e 2
01
3
30
th J
un
e 2
01
3
Measu
re o
f
su
cce
ss
Def
ine
the
mea
sure
aga
inst
th
e b
asel
ine
dat
a th
at id
en
tifi
es if
th
e im
pro
vem
en
t w
as a
su
cces
s.
For
exam
ple
, an
in
crea
se in
co
mp
lian
ce r
ates
, o
r an
eva
luat
ion
o
f th
e co
mp
lete
d
pro
toco
ls, e
tc.
Res
ult
s o
f ga
p
anal
ysis
an
d r
isk
asse
ssm
ent.
Ta
rget
ed
eval
uat
ion
of
po
licie
s,
pro
ced
ure
s an
d
pro
toco
ls t
o
asse
ss u
tilis
atio
n
and
co
mp
lian
ce
wit
h p
olic
ies.
85
% o
f st
aff
are
com
ply
ing
wit
h
the
han
d h
ygie
ne
po
licy.
Ho
w w
ill w
e
ach
iev
e t
his
ou
tco
me?
Des
crib
e th
e ac
tio
ns
the
org
anis
atio
n w
ill
take
to
imp
rove
th
e is
sue
/ p
roce
ss
iden
tifi
ed
; fo
r ex
amp
le
,mo
dif
icat
ion
of
spec
ific
pro
toco
ls o
r p
roce
sses
, pro
visi
on
o
f tr
ain
ing,
etc
.
Co
nd
uct
a g
ap
asse
ssm
ent
or
bas
elin
e au
dit
to
id
enti
fy e
ffec
tive
nes
s o
f IP
C p
rogr
am a
nd
w
hat
po
licie
s ar
e in
p
lace
. C
om
ple
te a
ris
k as
sess
men
t to
p
rio
riti
se t
he
revi
ew
pro
cess
.
Dev
elo
p a
pla
n t
o
resp
on
d t
o g
aps,
b
arri
ers
and
en
able
rs.
Rev
iew
au
dit
res
ult
s an
d id
enti
fy w
her
e m
isse
d m
om
ents
are
o
ccu
rrin
g.
Edu
cate
wo
rkfo
rce
on
5 M
om
ents
fo
r H
and
Hyg
ien
e.
Pri
ori
ty
(based
on
risk)
(L/M
/H)
Pri
ori
tise
th
e im
pro
vem
ent
acco
rdin
g to
th
e ri
sk r
atin
g o
f th
e is
sue;
w
het
her
it is
a
Low
, Med
ium
o
r H
igh
ris
k.
H
H
So
urc
e
Stat
e h
ow
th
e is
sue
was
id
enti
fie
d, f
or
exam
ple
via
an
au
dit
, G
AP
an
alys
is, s
urv
ey
rep
ort
, in
cid
ent,
co
mp
lain
t, e
tc.
OW
S re
com
men
dat
ion
to
incl
ud
e ri
sk
man
agem
ent
on
in
fect
ion
p
reve
nti
on
p
olic
ies.
Au
dit
rev
eale
d
low
rat
e o
f co
mp
lian
ce w
ith
h
and
hyg
ien
e p
olic
y.
Go
al / K
PI
Det
erm
ine
the
bas
elin
e d
ata
agai
nst
wh
ich
th
e im
pro
vem
ent
will
b
e m
easu
red
. Fo
r ex
amp
le, a
n
imp
rove
men
t in
co
mp
lian
ce,
up
dat
ed
pro
toco
ls, e
tc.
Up
dat
e al
l in
fect
ion
p
reve
nti
on
p
olic
ies,
p
roce
du
res
and
p
roto
cols
to
in
clu
de
risk
m
anag
emen
t ap
pro
ach
.
To in
crea
se o
ur
bas
elin
e m
easu
rem
ent
of
han
d h
ygie
ne
com
plia
nce
fro
m
65
% t
o 8
5%
.
Ob
jecti
ve
Stat
e w
hat
th
e o
rgan
isat
ion
w
ants
to
ac
hie
ve a
nd
w
hy.
To m
eet
th
e go
vern
ance
an
d
syst
ems
for
infe
ctio
n
pre
ven
tio
n,
con
tro
l an
d
surv
eilla
nce
.
To d
emo
nst
rate
th
e h
and
h
ygie
ne
pro
gram
is
regu
larl
y au
dit
ed
to
sh
ow
im
pro
vem
ent.
Page 39 of 81
Copyright © The Australian Council on Healthcare Standards (ACHS) Risk Management and Quality Improvement Handbook. EQuIPNational. July 2013
CH
Setting the Bar Higher
Literature and research on high performing health services shows that organisations that have a
shared organisational understanding of the purpose of their quality system, and take a strategic
approach to achieving it, achieve better consumer experiences and outcomes. A strategic
quality plan is focused on creating a high quality experience for every consumer, every time. As
with any strategic priority, this requires a clear definition of what is to be achieved – in this case,
clearly defining ‘high quality consumer experience’ – and setting out an organisational roadmap
for achieving it, including the goals, priorities, strategies, roles, monitoring and evaluation
systems that must come together in an integrated plan, to achieve the high quality consumer
experience at point of care.
There are three essential ingredients to support successful risk management and quality
improvement:
a shared desire to improve services and care delivery
consultation with all relevant stakeholders to secure buy-in
governance support and the provision of resources to effectively apply changes and sustain
improvements at the department / unit / ward and across the organisation.
Leadership support is crucial for an organisation to achieve effective quality improvement. The
governing body must ensure that there are adequate resources provided, that quality
improvement training has occurred, that there is sufficient time available to plan and implement
any changes to systems, and that the culture of the organisation is one where change for
improvement is embraced.
To create and implement an optimum quality improvement process, all stakeholders must be
clear about the overall organisation-wide objectives. This can be achieved with the development
and communication of a clear strategic quality framework.
The example shown in Figure 4.4 has been sourced from Balding, C (2013) Create a Great
Quality System In Six Months9, and is reproduced here with the permission of the author.

Page 40 of 81
Copyright © The Australian Council on Healthcare Standards (ACHS) Risk Management and Quality Improvement Handbook. EQuIPNational. July 2013
Figure 4.4 Framework for a strategic quality plan
Example of the structure and content of a strategic, organisation-wide Quality Plan for creating a quality experience for every consumer (Balding, 2013)
Vision, goals and objectives for the quality consumer experience we want to create for every person,
every time, e.g.:
At the Extraordinary Health Service, our vision for the quality of care and services is that each of our
consumers has a great experience with us, every time. This links to our strategic plan and means that we
work together and in partnership with our consumers to achieve the following goals for every consumer:
No harm
Responsiveness to individual needs
The right care and services with the best possible outcomes
A smooth journey, with no surprises.
Key priorities for Year One expressed as measurable objectives for each goal:
Key components of each goal expressed as objectives
How good do we want to be as an organisation for each of these objectives? (Targets for
processes and outcomes)
By when?
How will we know if we’re making progress towards our goals and objectives?
What process and outcomes measures will we need to collect and what subjective and
qualitative information will we use?
Key implementation strategies for each objective: How will we make this happen across the organisation?
What are the specific leadership and accountability roles - committees and individuals - in
achieving the objectives?
Which organisation-wide strategies will we use to achieve the objectives?
How will they be implemented?
Which governance supports will we provide for staff to do this?
Which national, jurisdictional, corporate or professional requirements can help us achieve the
objectives?
Which services need to work with which to achieve the objectives?
How do individual departments and services translate and contribute to the organisation-wide
plan locally?
How will all the improvement work from around the organisation be coordinated?
Accountability, Monitoring and Reporting:
What is the structure and process for monitoring, reporting and responding to progress?
How will the improvement work from around the organisation on this objective be collated to
identify and report progress?
Annual evaluation of the plan:
Are our strategies helping us to achieve our objectives?
Are we achieving the consumer experience we set out to create?
How are our consumers better off as a result of our quality plan and system?

Page 41 of 81
Copyright © The Australian Council on Healthcare Standards (ACHS) Risk Management and Quality Improvement Handbook. EQuIPNational. July 2013
Identifying Areas Requiring Improvement
The following information outlines some ways that areas requiring improvement may be
identified:
Sentinel events, adverse events and root cause analysis
The occurrence of sentinel and adverse events within the healthcare system has serious
implications for all those involved, including the consumer / patient, the family and/or
carer(s), staff and the healthcare organisation itself. When a sentinel or adverse event
has occurred, it is essential that healthcare organisations have in place an integrated
critical incident management approach which will develop, implement and review risk
management and quality improvement strategies through monitoring, analysis and
appropriate management protocols.
A sentinel event can be defined as:
“an unexpected occurrence involving death or serious physical or
psychological injury, or the risk thereof. Serious injury specifically includes
loss of limb or function”.16
Whereas an adverse event is defined as:
“an incident in which unintended harm resulted to a person receiving
health care”.16
The agreed national list of core sentinel events consists of:
procedures involving the wrong patient or body part
suicide of a patient in an inpatient unit
retained instruments or other material after surgery requiring re-operation or further
surgical procedure
intravascular gas embolism resulting in death or neurological damage
haemolytic blood transfusion reaction resulting from ABO incompatibility
medication error leading to the death of a patient reasonably believed to be due to
incorrect administration of drugs
maternal death or serious morbidity associated with labour or delivery
infant discharged to the wrong family.

Page 42 of 81
Copyright © The Australian Council on Healthcare Standards (ACHS) Risk Management and Quality Improvement Handbook. EQuIPNational. July 2013
The causes of sentinel events are twofold: they are human errors and/or systems errors.
The main causes of adverse events relate to operative errors, drugs, medical
procedures, and diagnosis, and each of these is amenable to prevention.17
In the monitoring and analysis of sentinel events, organisations can undertake a root
cause analysis and then develop an action plan, thereby implementing improvements to
reduce risk and monitor the effectiveness of those improvements.
Figure 4.5 outlines a basic framework for a root cause analysis. Each question area
shown in Figure 4.5 should be addressed and the findings used to determine whether
action is required.
It is useful to answer each question in terms of whether it is a ‘root cause’ or not. A ‘root
cause’ is defined as a finding related to a process or system that has the potential for
redesign to reduce risk. If a particular finding is not a ‘root cause’, then it should be
addressed later in the analysis with a ‘why?’ question. Each finding that is identified as a
‘root cause’ should be considered for an action and addressed in an action plan.18
After a root cause analysis is completed an action plan can be formulated. An action
plan is defined as:
“The product of the root cause analysis which identifies the strategies
that an organisation intends to implement to reduce the risk of similar
events occurring in the future. The plan should address responsibility for
implementation, oversight, pilot testing as appropriate, time lines, and
strategies for measuring the effectiveness of the actions”.18
The action plan identifies changes that can be implemented to reduce risk, or formulates
a rationale for not undertaking such changes.
Sentinel event management links closely with an organisation’s risk management
program.

Page 43 of 81
Copyright © The Australian Council on Healthcare Standards (ACHS) Risk Management and Quality Improvement Handbook. EQuIPNational. July 2013
Figure 4.5 Root cause analysis framework18

Page 44 of 81
Copyright © The Australian Council on Healthcare Standards (ACHS) Risk Management and Quality Improvement Handbook. EQuIPNational. July 2013
Incident monitoring
An incident is an event or circumstance which could have resulted, or did result, in
unintended or unnecessary harm to a person and/or a complaint, loss or damage.19
Incident monitoring, a system for identifying, processing, analysing and reporting
incidents, can be used to put preventive strategies in place.
An incident monitoring system includes:
confidentiality of reported data
involvement of all staff
a just culture
education of all staff
mechanisms to minimise staff fear of reprisal
user-friendly reporting forms that capture detailed contextual information
investigation of all incidents by relevant staff and managers
communicating lessons learnt
trending of incidents and learning from the information
benchmarking information and systems with other organisations
taking action to prevent recurrence and developing ways to prevent adverse events
linkage with the organisation’s risk management system
evaluation of the system.
Incident monitoring enables organisations to identify particular areas of concern and
devise interventions. Successful implementation of incident monitoring by health units
has been followed by improved individual staff morale with fewer personnel feeling
powerless to effect change.20 However, research identifies that incidents are often
under-reported.
Other methods to support and validate the incident management system are the use of
trigger tools. The Institute of Healthcare Improvement (IHI) promotes the use of triggers,
or clues, to identify adverse events (AEs). The IHI website notes that, “Traditional efforts
to detect AEs have focused on voluntary reporting and tracking of errors. However,
public health researchers have established that only 10 to 20 percent of errors are ever
reported and, of those, 90 to 95 percent cause no harm to patients. Hospitals need a
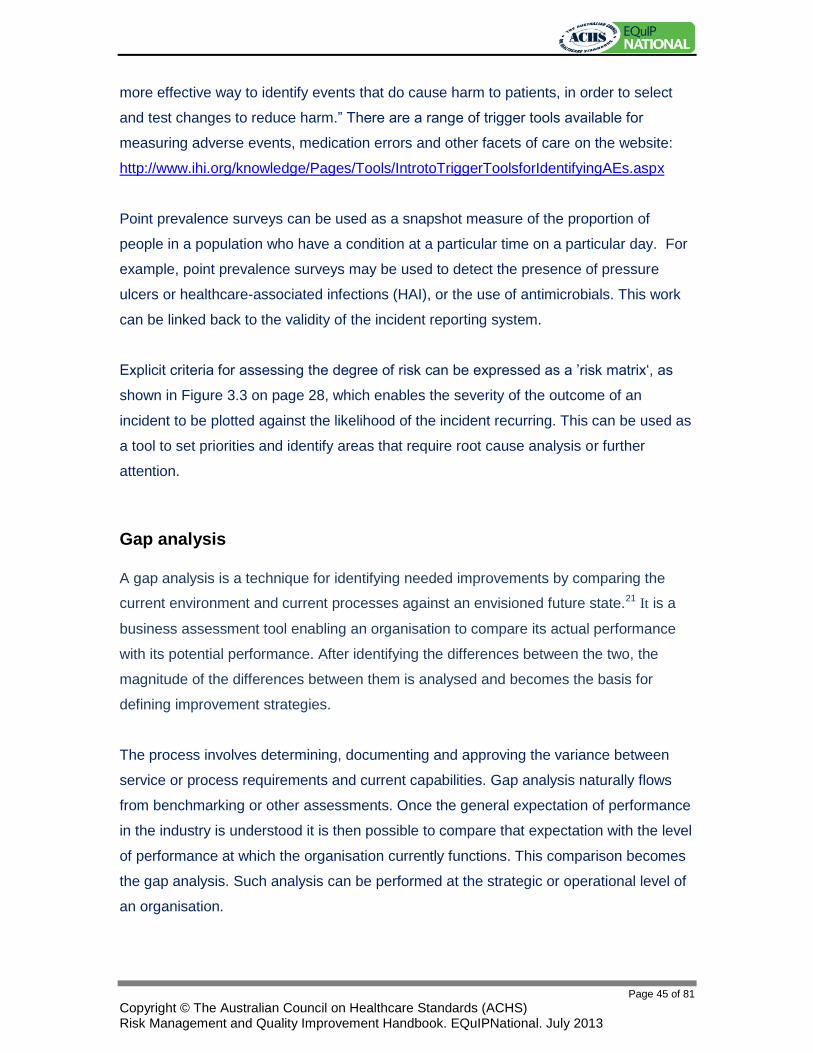
Page 45 of 81
Copyright © The Australian Council on Healthcare Standards (ACHS) Risk Management and Quality Improvement Handbook. EQuIPNational. July 2013
more effective way to identify events that do cause harm to patients, in order to select
and test changes to reduce harm.” There are a range of trigger tools available for
measuring adverse events, medication errors and other facets of care on the website:
http://www.ihi.org/knowledge/Pages/Tools/IntrotoTriggerToolsforIdentifyingAEs.aspx
Point prevalence surveys can be used as a snapshot measure of the proportion of
people in a population who have a condition at a particular time on a particular day. For
example, point prevalence surveys may be used to detect the presence of pressure
ulcers or healthcare-associated infections (HAI), or the use of antimicrobials. This work
can be linked back to the validity of the incident reporting system.
Explicit criteria for assessing the degree of risk can be expressed as a ’risk matrix‘, as
shown in Figure 3.3 on page 28, which enables the severity of the outcome of an
incident to be plotted against the likelihood of the incident recurring. This can be used as
a tool to set priorities and identify areas that require root cause analysis or further
attention.
Gap analysis
A gap analysis is a technique for identifying needed improvements by comparing the
current environment and current processes against an envisioned future state.21 It is a
business assessment tool enabling an organisation to compare its actual performance
with its potential performance. After identifying the differences between the two, the
magnitude of the differences between them is analysed and becomes the basis for
defining improvement strategies.
The process involves determining, documenting and approving the variance between
service or process requirements and current capabilities. Gap analysis naturally flows
from benchmarking or other assessments. Once the general expectation of performance
in the industry is understood it is then possible to compare that expectation with the level
of performance at which the organisation currently functions. This comparison becomes
the gap analysis. Such analysis can be performed at the strategic or operational level of
an organisation.
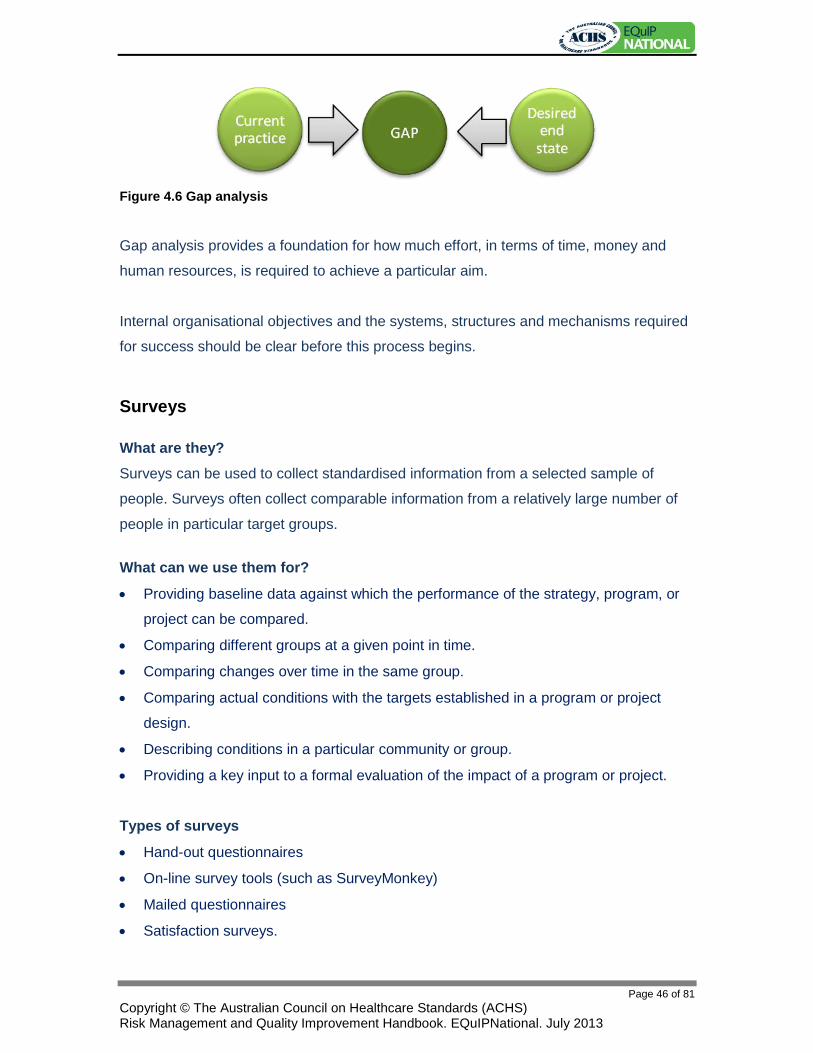
Page 46 of 81
Copyright © The Australian Council on Healthcare Standards (ACHS) Risk Management and Quality Improvement Handbook. EQuIPNational. July 2013
Figure 4.6 Gap analysis
Gap analysis provides a foundation for how much effort, in terms of time, money and
human resources, is required to achieve a particular aim.
Internal organisational objectives and the systems, structures and mechanisms required
for success should be clear before this process begins.
Surveys
What are they?
Surveys can be used to collect standardised information from a selected sample of
people. Surveys often collect comparable information from a relatively large number of
people in particular target groups.
What can we use them for?
Providing baseline data against which the performance of the strategy, program, or
project can be compared.
Comparing different groups at a given point in time.
Comparing changes over time in the same group.
Comparing actual conditions with the targets established in a program or project
design.
Describing conditions in a particular community or group.
Providing a key input to a formal evaluation of the impact of a program or project.
Types of surveys
Hand-out questionnaires
On-line survey tools (such as SurveyMonkey)
Mailed questionnaires
Satisfaction surveys.

Page 47 of 81
Copyright © The Australian Council on Healthcare Standards (ACHS) Risk Management and Quality Improvement Handbook. EQuIPNational. July 2013
Advantages
Findings from the sample of people interviewed can be applied to the wider target
group or the population as a whole.
Quantitative estimates can be made for the size and distribution of impacts.
Disadvantages
Results are often not available for a long period of time.
Potential bias in terms of who responds.
The processing and analysis of data can be a major bottleneck for larger surveys
even where computers are available.
Surveys can be time-consuming.
Many kinds of information are difficult to obtain through formal surveys.
Patient feedback systems
Consumer / patient feedback provides healthcare organisations with information and
insight on their consumer / patients' view of the services they provide.
In some States / Territories, public hospitals may be required to use a statewide survey
tool, while a private hospital group may have standardised surveys, where other
organisations either design their own survey, or contract the task to a private company.
Whatever process is used, survey tools should be relevant to the organisation and,
where possible, developed with the input of consumers, thereby increasing the likelihood
that questions are valid and written in language appropriate to consumer needs.
Consumer / patient satisfaction surveys should aim to address consumers’ experiences,
as well as their satisfaction with different dimensions of care. In addition, consumers
should be asked to rank the importance of each dimension. This will allow the
organisation to direct their quality improvement initiatives to those areas consumers
identify as being most important to their care. For example, consumers may rate both the
quality of information provided by medical staff about tests and treatment and the quality
of food as being very poor, but rank the provision of information about tests and
treatment more highly than the quality of food. Such information would allow
organisations to give priority to improving the quality of information provision to
consumers.
Page 48 of 81
Copyright © The Australian Council on Healthcare Standards (ACHS) Risk Management and Quality Improvement Handbook. EQuIPNational. July 2013
For consumer / patient satisfaction surveys to have any value, they must be
methodologically rigorous, clearly linked to action that produces meaningful changes in
service quality and part of a broader range of approaches.
Consumer / patient satisfaction surveys are not an isolated event, but rather the
beginning of a continuous improvement cycle. Organisations should use the survey
results to design and track quality improvement over time, as well as compare
themselves to other healthcare organisations.
Rapid appraisals
What are they?
Rapid appraisal methods are a quick, low-cost ways to gather the views and feedback of
consumers / patients and other stakeholders, in order to respond to decision makers’
needs for information.
What can we use them for?
Providing rapid information for management decision making, especially at the
project or program level.
Providing qualitative understanding of complex socioeconomic changes, highly
interactive social situations, or people’s values, motivations, and reactions.
Providing context and interpretation for quantitative data collected by more formal
methods.
Types of appraisals
Focus groups
Interviews
Direct observation.
Advantages
Low cost
Can be conducted quickly
Provide flexibility to explore new ideas.

Page 49 of 81
Copyright © The Australian Council on Healthcare Standards (ACHS) Risk Management and Quality Improvement Handbook. EQuIPNational. July 2013
Disadvantages
Findings usually relate to specific communities or localities, thus difficult to
generalise from findings.
Less valid, reliable, and credible than formal surveys.
Audits Audits are a key requirement of the NSQHS Standards. The Australian Commission on
Safety and Quality in Health Care (ACSQHC) provides a list of actions where clinical
audit is to be undertaken. This is available in the relevant Accreditation Workbooks,
which can be accessed from their website: http://www.safetyandquality.gov.au/
Clinical audits can be used to improve all aspects of clinical care. Auditing is a
systematic framework used by health professionals for investigating and assessing
clinical work and for introducing and monitoring improvements. The process of auditing
is a cyclical activity of reviewing clinical performance and refining practice to remedy
identified deficiencies and measuring the outcomes against agreed standards. It has the
potential to deliver substantial benefits to consumers / patients in terms of improved
quality of care and safety of service delivery.22
The following factors should be considered when including clinical audits within a quality
improvement program:
defining the systems for gathering information, such as a health record review for
infection control monitoring
resources allocated to the audit process
choice of audit topic
audit method
appropriate sampling
frequency of audit
understanding of results
education of staff
multidisciplinary involvement
privacy and confidentiality
integration of audit processes into routine management

Page 50 of 81
Copyright © The Australian Council on Healthcare Standards (ACHS) Risk Management and Quality Improvement Handbook. EQuIPNational. July 2013
improvements in care to be monitored, sustained and reinforced
communicating lessons learnt.
Queensland Health has developed audit tools for the NSQHS Standards that require
clinical audits. These are available to all organisations from the Queensland Health
website: http://www.health.qld.gov.au/psq/safetyandquality/nsqhss-audit-tools.asp or
through a link on the ACSQHC’s website: http://www.safetyandquality.gov.au/
The international standard AS/NZS ISO 19011: Guidelines for quality and/or
environmental management systems auditing may be used to provide guidance on the
principles of auditing and managing audit programs. Organisational policy to support the
internal audit program may include:
organisation audit program
audit scheduling
audit sample size
auditor training
independence of the audit process
approval of audit tools
action planning.
Accreditation survey results and recommendations
An organisation’s survey report can identify areas of risk or opportunities for
improvement. Surveyor recommendations will alert an organisation to an action that
requires performance improvement.
The EQuIPNational Accreditation Program guide (page 22, available on the ACHS
website) describes how organisations can use their survey report. Uses include to:
provide feedback to staff
identify where improvements are needed
compare the organisation’s performance over time
evaluate existing quality management procedures
assist the monitoring of risks and their management
highlight strengths and opportunities for improvement
demonstrate evidence of achievement to stakeholders.

Page 51 of 81
Copyright © The Australian Council on Healthcare Standards (ACHS) Risk Management and Quality Improvement Handbook. EQuIPNational. July 2013
Clinical indicators
The use of clinical indicators (CIs) by healthcare organisations continues to be an
important component of EQuIP programs and ACHS membership. The collection of
specific ACHS Clinical Indicators is not mandatory and organisations may choose to
develop their own indicators or use other indicators. Indicators assist healthcare
organisations to identify clinical areas that may benefit from a review of their processes
and activities, with the goal of improving the quality of care. Clinical indicator data can be
of assistance when presenting evidence for NSQHS Standard 1, action 1.2.1.
A clinical indicator is defined simply as a measure of the clinical management and/or
outcome of care. A well-designed indicator should ‘screen’, ‘flag’ or ‘draw attention’ to a
specific clinical issue. Usually rate-based, indicators identify the rate of occurrence of an
event. Indicators do not provide definitive answers; they are designed to indicate
potential problems that should be addressed, usually demonstrated by statistical outliers
or variations within data results. The indicators are used to assess, compare and
determine the potential to improve care. Indicators are, therefore, tools that assist an
organisation to assess whether a standard of consumer / patient care is being met.
Members of the ACHS Clinical Indicator Program can submit CI data to ACHS on a six
monthly basis. Organisations are sent the national aggregate data following this
submission. Using PIRT Online (the CI data submission tool), organisations can produce
Comparative Reports from the national data set and for their peer group. Each report
provides information to identify statistically significant differences between the individual
organisation, all organisations and peer groups. The reports also identify potential gains
to be made if an organisation’s rate was improved to that of the average and provides
information on peer as well as Australian and New Zealand participation.
The ACHS Clinical Indicator Program does not incur any additional charge for member
organisations of ACHS.
Further information about the specific clinical indicator sets and the Comparative Report
service are available for ACHS members from the ACHS website http://www.achs.org.au
or by contacting the ACHS performance and Outcomes Service. Email:

Page 52 of 81
Copyright © The Australian Council on Healthcare Standards (ACHS) Risk Management and Quality Improvement Handbook. EQuIPNational. July 2013
Patient journey surveys
Mapping the patient journey through the organisation is one way to gain an
understanding of current processes, and to identify where the actual process deviates
from the intended one. Patient journey survey methodologies review an organisation’s
processes for care delivery, by following the experiences of patients and their
information as they move through a health service. Patient journey survey
methodologies, including tracer methodologies, have been employed in health care
since the 1970s.23 They are used to evaluate the quality of care and identify areas that
need improvement. The methodology can focus on the diagnosis of individual diseases,
for example schizophrenia, to examine the care provided and health outcomes.24
Alternatively, a tracer may be performed on a specific medication to reveal the
prevalence and treatment of a particular condition, for example Parkinson’s disease.25
Healthcare systems can also be evaluated through the use of patient journey
methodologies. Studies have examined systems in primary care 26, 27, ambulatory care 28
and emergency medicine.29 The patient journey methodology has been effective in
identifying discrepancies between actual and predicted levels of care.26-28, 30
Using this methodology, organisations can track individual patients through their health
record, or by reviewing systems such as rehabilitation or radiology.31
In 2008 ACHS performed a short study on behalf of the Australian Commission on
Safety and Quality in Health Care (ACSQHC), with the assistance of the Centre for
Clinical Governance Research in Health at the University of New South Wales. The
process used was to begin by selecting a patient health record and use that individual
record as a roadmap to move through the organisation, to assess and evaluate the
organisation’s compliance with selected clinical pathways and the organisation’s
systems for providing care and services. Surveyors retrace the specific care processes
that an individual experienced by observing and talking to staff in areas in which the
individual received care.32 This allows surveyors to assess how staff members from
various disciplines work together and communicate across services to provide safe, high
quality care.33

Page 53 of 81
Copyright © The Australian Council on Healthcare Standards (ACHS) Risk Management and Quality Improvement Handbook. EQuIPNational. July 2013
Information on this study can be found in the article “An empirical test of accreditation
patient journey surveys: randomised trial”, published in the International Journal for
Quality in Healthcare.34
There is not yet a systematic approach to using patient journey methodologies in health
service assessment in Australia.35 Although patient journey approaches have been used
in accreditation overseas for some time, there has been little empirical investigation of
their effectiveness.
A supplement to the Medical Journal of Australia published in 2008 focused on clinical
process redesign. It included two studies in which patient journey methodology was
applied to improve systems in healthcare facilities in NSW and SA.36
The Joint Commission has published a book titled ‘Tracer methodology tips and
strategies for continuous systems improvement’33 that you can purchase from the Joint
Commission website (http://www.jointcommission.org/); it explains how to apply the
method to your organisation as a quality improvement tool.
Benchmarking
Benchmarking is “the continuous measurement of a process, product, or service
compared to those of the toughest competitor, to those considered industry leaders, or
to similar activities in the organisation in order to find and implement ways to improve it.
This is one of the foundations of both total quality management and continuous quality
improvement. Internal benchmarking occurs when similar processes within the same
organisation are compared.” 37
The first step in the benchmarking process is to identify what needs to be benchmarked;
formation of a key stakeholder group will assist with this decision. A flow chart on how to
benchmark is provided in Figure 4.7.
Page 54 of 81
Copyright © The Australian Council on Healthcare Standards (ACHS) Risk Management and Quality Improvement Handbook. EQuIPNational. July 2013
There are different types of benchmarking that an organisation can use. These include:
Internal
In most large organisations there are similar functions in different units / departments /
sub-services. One of the simplest benchmarking exercises is to compare these internal
operations. One of the objectives of internal benchmarking is to identify the internal
performance standards of an organisation.
The advantages of internal benchmarking are that there is often a significant amount of
information-sharing accompanying internal benchmarking and many organisations are
able to obtain immediate gains by identifying their best internal practices and transferring
those to other parts of the organisation. This internal knowledge can become the
baseline for later investigation and measurement involving external benchmarking
partners.
The disadvantage of internal benchmarking is that it fosters an internal organisational
view. It is too easy to ignore that other organisations have the edge by solely
concentrating on outperforming internal rivals.
External
Benchmarking can be done externally against other organisations. The objective is to
compare aspects of the organisation with another of approximately the same size and
geographical type, such as rural / metropolitan or public / private, providing the same or
similar services and ideally the best in the category so improvements may be made. It is
desirable to find organisations that are recognised as leaders or which are known to be
achieving standards of excellence.
The advantage of external benchmarking is that you can see how performance relates
with similar organisations. The main disadvantage is finding another organisation that is
willing to allow access to information.
Competitive
Competitive benchmarking concentrates on key performance indicators, including
published data.

Page 55 of 81
Copyright © The Australian Council on Healthcare Standards (ACHS) Risk Management and Quality Improvement Handbook. EQuIPNational. July 2013
Process
Process benchmarking compares processes to maximise opportunities for learning and
improving.
Choosing which type of benchmarking to use depends on what needs to be
benchmarked.
To start benchmarking, the following steps might be helpful:
Staff education in benchmarking. This education would include an overview of
benchmarking and its benefits.
Form a multidisciplinary benchmarking team. In a large or complex organisation
there may need to be more than one team. In a small organisation the team may be
a doctor and a nurse.
Identify a process to benchmark. It may be best to start with a process where there
are staff who are keen and able to benchmark or any area that would benefit from
improvement.
Understand how the organisation’s process works. This is often done through flow
charts or clinical pathways and identifying internal sources of variance.
Identify possible benchmarking partners. This can be done through:
commercial benchmarking groups
professional associations, peak organisations and networks
conferences
literature and web searches
personal contacts.
Decide what measurements to adopt. These measurements may include:
clinical indicators
key performance indicators
process and outcome measures.
Compare information with benchmarking partners. Comparison of numerical data,
flow charts or clinical pathways and site visits can all be useful. This should be
performed within a culture of openness and cooperation. The Health Round Table is
an example of a benchmarking consortium. For more information on the consortium,
please go to www.healthroundtable.org

Page 56 of 81
Copyright © The Australian Council on Healthcare Standards (ACHS) Risk Management and Quality Improvement Handbook. EQuIPNational. July 2013
Utilise the information for continuous quality improvement with a customer focus.
Benchmarking provides ‘...significant opportunity to further demonstrate its
commitment to public accountability and to continuous improvement of patient
care’.15
Figure 4.7 Steps in benchmarking
Depending on organisational characteristics, it may well be advantageous to change the
order of these steps.
Always try to ensure data integrity.

Page 57 of 81
Copyright © The Australian Council on Healthcare Standards (ACHS) Risk Management and Quality Improvement Handbook. EQuIPNational. July 2013
Summary The processes outlined in this section may lead to the identification of a number of areas
requiring improvement. Organisations will need to consider all of the information
gathered and prioritise the improvements according to either the level of risk the issue
may cause and/or the organisation’s needs.
The issues selected for an improvement process should then be detailed on the
organisations Quality Improvement Plan, as described in Section 4, page 36.

Page 58 of 81
Copyright © The Australian Council on Healthcare Standards (ACHS) Risk Management and Quality Improvement Handbook. EQuIPNational. July 2013
Section 5
Quality Improvement Tools There are many quality improvement tools that can be used for various stages of
performance improvement. Some tools can address a number of steps, while others will
only perform one part of the process. The selection of tool should be a consideration
when planning the quality improvement process, dependent on the project, the people
involved (such as how many and who), and the operator’s understanding of how the tool
works.
The following diagram lists some tools and their uses. Flow charting, cause and effect
diagrams, brainstorming and Pareto charts are some of the tools that are commonly
used within the quality improvement cycle that can help identify problems, analyse
processes and identify improvement options. Histograms, run charts and control charts
display data and provide information for decision making. Some of these tools are
suitable for teams, and others are more useful for individual use.
Using the Right Tool for the Task
Tool Identification of Processes
Analyzing Processes and Data
Planning Solutions
Measuring Improvement Results
Affinity Diagram x x
Bar Chart / Graph x x x
Brainstorming x x x
Cause and Effect (Fishbone) x x
Control Charts x x x
Failure Mode Effects Analysis (FMEA) x x x
Flow Chart x x x
Histograms x x
Pareto Chart x x x
Patient Journey x x x
Run Chart / Line Graph x x x
Figure 5.1 Quality tool matrix

Page 59 of 81
Copyright © The Australian Council on Healthcare Standards (ACHS) Risk Management and Quality Improvement Handbook. EQuIPNational. July 2013
Identifying the current steps in a process
Before any improvements can be made to a process, it is important to be clear about
how it currently works, as it is only with this understanding that areas requiring
improvement can be identified. There are many ways an organisation can identify steps
and map a current process, as indicated in Figure 5.1.
The mapping of a process should include the activities, actions, and decisions which
occur between its starting and stopping points, and will require observation of the flow of
work, which will need to occur on more than one occasion. This is to ensure that what is
being mapped is not how people think the process is working, how they would like it to
work, or how a policy or procedure says it should work. Only a display of the process as
it is actually working can reveal the improvements that may need to be made.
Analysing the process
Knowing the current process is the first step to identifying ways to improve it. Many tools
can be used to analyse processes and data, convert the data into information and then
present it for use for improvement within the organisation. Some of these may be the
same as tools used to identify the process, as well as to design solutions, and should be
selected depending on the needs of the organisation, the understanding or preferences
of the improvement team and the type of processes being analysed.
Analysing the process includes looking at each activity within it and determining its
importance to the process outcome. Analysis may indicate that some steps or decision
points are redundant or unnecessary, or that there may be a weak link in the process
that requires the addition of one or more steps. Even if the data indicate that the process
is meeting the objective, the team should consider whether it is feasible to improve the
process further.
Planning solutions to improve the process
Following analysis, there should be a clear picture of where the process may need
improvement. It could be where the actual workflow deviates from a documented
procedure that is based on best-practice, or the procedure could simply be inappropriate

Page 60 of 81
Copyright © The Australian Council on Healthcare Standards (ACHS) Risk Management and Quality Improvement Handbook. EQuIPNational. July 2013
to achieve the desired outcome. Either way, the optimum process will need to be
identified and mapped in order to ensure that this is the process that is finally used.
Planning the solution is usually best performed with the input from those who perform
the process. Gaining insight from a number of participants offers the opportunity for
solutions that may not otherwise be thought of.
Measuring improvements
Measurement is a critical part of evaluation of change management processes.
Measurement generally focuses on whether changes are efficient (for example, more
patients are treated within a specified time period in the emergency department) or more
importantly whether changes are effective (more patients are treated in the emergency
department with reduced need for admission or lower rates of re-presentation within a
specified time period). While being efficient is commendable, the effectiveness of
changes is a more important measure, as being effective reduces long-term waste,
duplication and inefficiency in systems.
Efficiency and effectiveness indicators can only be determined when goals and
objectives for process improvement are clearly articulated when changes are being
considered for implementation, and are measurable. Thus, the desired outcomes for
change need to be translated into measures. Failure to determine outcome measures as
part of the change management planning makes evaluation very difficult post-
implementation. By clarifying the measures up front, everyone is clear on expectations or
the results to be achieved.
Put all expectations for improvement in writing, determine the outcomes in qualitative
and quantitative form and communicate these to all of the stakeholders involved in the
improvement process. Once the indicators are established, it is then important to be able
to ensure that the data are readily available or easily obtained to support measurement,
evaluation and action. Using the emergency department example, patients are allocated
to a triage category which has a specified time limit in which the patient should be seen.
The patient administration system records the time of arrival to the time of assessment,
thus enabling reports to be produced and data to be trended over time.

Page 61 of 81
Copyright © The Australian Council on Healthcare Standards (ACHS) Risk Management and Quality Improvement Handbook. EQuIPNational. July 2013
Measuring performance repetitively can help an organisation determine whether the
improved processes implemented have been successful, or if further action is required to
reach the desired target measure.
Information about the specific tools listed in Figure 5.1 is shown below. These tools are
presented in alphabetical order, and not in order of importance.
Affinity diagrams
This tool is often used to group ideas generated by brainstorming. It allows users to
organise and present large amounts of data (ideas, issues, solutions, problems) into
logical categories based on users’ perceived relationships of the data. The final diagram
will show the relationship between the issue in question and the categories.
Operating Room Performance Issues
Features of the Affinity process that are important to its success:
It works well with a team of 4-6 people. There should be a good mix of experiences
and perspectives, and the diagramming session should be approached with a
creative, open mind.
Start with a clear statement of the problem or goal to be explored, or have the team
compose a statement about what they are trying to accomplish, or what the end
result will be. This statement should be broad and neutral, yet clearly understood and
agreed upon by all members of the team.
Provide a time limit for the session, usually 45-60 minutes is sufficient.
Emergency
vs Elective
Beds unavailable
Changes to lists
Organisation of lists
Delays in consent process
Surgeon availability
Delays in sterilisation
Electives cancelled due to emergencies
Equipment
Capacity
Staff Issues
Patient Issues
Available vs used Operating rooms
Patients fully prepared
Scheduled vs actual times
Sterilisation failure
Lists running overtime
Equipment failure
Equipment loss
Staff overtime
Availability of equipment
Arrival to theatre
Staff shortage
Training of staff
Staff skill mix
Failure of patient to attend
Late investigations
Patient preparation
Staff fully prepared
Figure 5.2 An affinity diagram
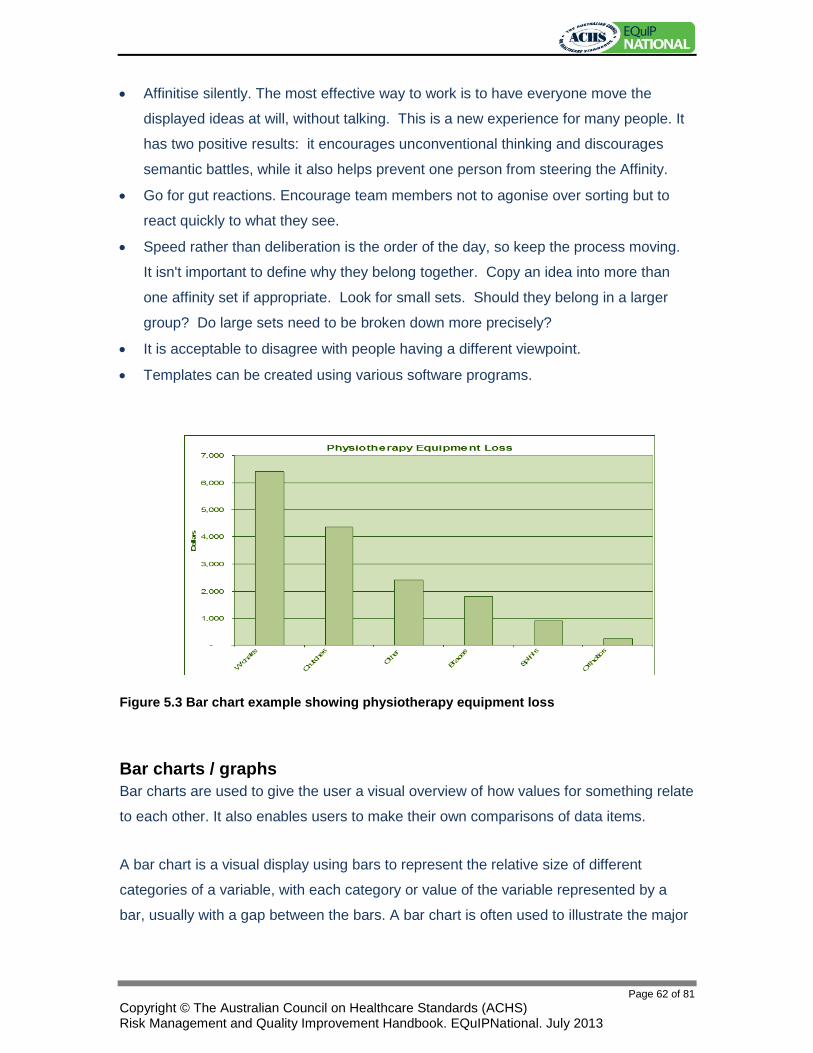
Page 62 of 81
Copyright © The Australian Council on Healthcare Standards (ACHS) Risk Management and Quality Improvement Handbook. EQuIPNational. July 2013
Affinitise silently. The most effective way to work is to have everyone move the
displayed ideas at will, without talking. This is a new experience for many people. It
has two positive results: it encourages unconventional thinking and discourages
semantic battles, while it also helps prevent one person from steering the Affinity.
Go for gut reactions. Encourage team members not to agonise over sorting but to
react quickly to what they see.
Speed rather than deliberation is the order of the day, so keep the process moving.
It isn't important to define why they belong together. Copy an idea into more than
one affinity set if appropriate. Look for small sets. Should they belong in a larger
group? Do large sets need to be broken down more precisely?
It is acceptable to disagree with people having a different viewpoint.
Templates can be created using various software programs.
Figure 5.3 Bar chart example showing physiotherapy equipment loss
Bar charts / graphs
Bar charts are used to give the user a visual overview of how values for something relate
to each other. It also enables users to make their own comparisons of data items.
A bar chart is a visual display using bars to represent the relative size of different
categories of a variable, with each category or value of the variable represented by a
bar, usually with a gap between the bars. A bar chart is often used to illustrate the major

Page 63 of 81
Copyright © The Australian Council on Healthcare Standards (ACHS) Risk Management and Quality Improvement Handbook. EQuIPNational. July 2013
features of the distribution of data because it is an easier and quicker way to see and
grasp the information.
Brainstorming
Brainstorming is a very useful tool for getting information and ideas from people. It can
help an organisation to come up with what the problems are and/or find possible
solutions. The goal is to come up with as many ideas as possible without stifling
creativity. Once a list of ideas is available the ideas are analysed and best solutions
explored.
There are many techniques for brainstorming. No matter which is chosen there are some
fundamental rules to follow:
start with a well-defined problem, issue or topic
have an informal atmosphere
allow enough time but set a time limit
assign a facilitator and recorder
let people know the rules
have participants from a number of backgrounds
encourage freewheeling / wild ideas
encourage all to participate
keep the pace fast and the situation exciting
ensure a collaborative environment
piggyback ideas onto the ideas of others
suspend judgment as all ideas are accepted
negative comments are not accepted
no answer is wrong
clarify if unsure
post all ideas as suggested, write everything down
remember to have breaks.

Page 64 of 81
Copyright © The Australian Council on Healthcare Standards (ACHS) Risk Management and Quality Improvement Handbook. EQuIPNational. July 2013
Cause and Effect (Fishbone)
Cause and effect analysis offers a structured approach for a team to identify, explore
and display graphically all of the possible causes related to a problem in order to
discover the root cause. The problem is the head of the fishbone. The cause and effect
diagram groups the causes under suitable headings (the major bones). The causes
should be brainstormed to achieve the most comprehensive list and useful groupings.
Delays in theatre:
Figure 5.4 Example cause and effect diagram
Control charts
A control chart is a visual representation of process consistency intended to highlight
special cause (assignable unique variation) from common cause (normal and expected
variation), and whether or not the process is performing predictably. Control charts may
be used in Identification, Analysis and Measurement phases and work best for numerical
data.
Control charts are graphic representations of a collection of data points from a particular
process over a period of time. The repetitive nature of healthcare processes and
procedures lend themselves well to this type of analysis.
There are several different control chart types that can be used, depending on the type
of data to be analysed, although all control charts contain a centreline representing the
process average, or expected performance, as well as upper and lower control limits that
set the bounds for an acceptable area of deviation from the centreline.
Staff
Equipment
Processes / Procedures
Staff shortages
Unplanned delays
/ late starts
Wrong skillmix of staff
Poor booking of technicians
Lists too full
Lack of equipment
Sterilisation failures / delays
Theatre staff waiting for surgeons
Overrun of lists
Impact of emergencies
Environment

Page 65 of 81
Copyright © The Australian Council on Healthcare Standards (ACHS) Risk Management and Quality Improvement Handbook. EQuIPNational. July 2013
Figure 5.5 Control chart
After plotting a sufficient amount of data points, these types of charts can identify if a
process is ‘in control’ or ‘out of control’, depending on whether the data are plotted within
the set acceptable area, and from there, investigations into the reasons for variation can
identify areas that may require improvement.
Failure Mode Effects Analysis (FMEA)
Failure Mode Effects Analysis (FMEA) is a systematic, proactive method for evaluating a
process to identify where and how it might fail, and to assess the impact of those
failures, in order to identify the parts of a process that are most in need of change or
improvement.11 It requires input from the entire team involved in that process, to ensure
that all steps are examined. It is important to ensure that all steps within the process are
numbered. A flow chart may assist this process.
The basic steps for performing an FMEA are:
1. Select the process to evaluate
2. Recruit a multidisciplinary team, including those involved at any point in the selected
process
3. Have the team meet and identify (for example by a flowchart) all of the steps in the
selected process
4. Using the list of questions below, list anything that could go wrong with the selected
process
5. Have the team assign a numeric value for the likelihood of occurrence (Figure 5.6a),
detection (Figure 5.6b) and severity (Figure 5.6c)

Page 66 of 81
Copyright © The Australian Council on Healthcare Standards (ACHS) Risk Management and Quality Improvement Handbook. EQuIPNational. July 2013
6. Evaluate the results to identify the Risk Profile Number (RPN). This is done by
multiplying the three scores obtained (the 1 to 10 score for each of likelihood of
occurrence, detection, and severity).
The steps in the process that score the highest are the main areas where failure may
occur, and identify the most important parts of the process that require improvement.
The diagrams below show examples of an FMEA of two medication dispensing
scenarios. FMEA is not suitable for evaluating the entire program; rather, it is suitable for
evaluating components of that program.38
Questions to ask when completing the FMEA are:
Failure Mode: What could go wrong?
Failure Causes: Why would the failure happen?
Failure Effects: What would be the consequences of the failure?
Likelihood of occurrence: 1-10, 10 = very likely to occur
Likelihood of Detection: 1-10, 10 = very unlikely to detect
Severity: 1-10, 10 = most severe
Risk Priority Number (RPN): Likelihood of occurrence x Likelihood of Detection x Severity.
Figure 5.6 Sample FMEA: Comparison of Five Medication Dispensing Scenarios
Scenario Steps in the Process
Failure Mode
Failure Causes
Failure Effects Likelihood of Occurrence
(1-10)
Likelihood of Detection (1-10)
Severit
y (1-10)
Risk Profile Number (RPN)
Action to Reduce Occurrence of Failure
Orders are written for new medications
The first dose may be given prior to pharmacist review of the orders
Medication ordered may be available in the dispensing machine and can be accessed if next delivery is too long to wait
Patient may receive an incorrect medication, incorrect dose, or a dose via incorrect route
4 5 1 20 Assign clinical pharmacists to patient care units so that all medication orders can be reviewed as they occur
Orders are written to discontinue a medication or change the existing order
Discontinued medications are still available after orders
Medications in dispensing machines are not removed Multi-dose vials may be available. It may be 3 hours until the next removal of medications
Patient may receive an incorrect medication, incorrect dose, or a dose via incorrect route
7 5 5 175 Remove multi-dose vials from dispensing machines Remove discontinued medications more frequently

Page 67 of 81
Copyright © The Australian Council on Healthcare Standards (ACHS) Risk Management and Quality Improvement Handbook. EQuIPNational. July 2013
Figure 5.6a Occurrence rating scale
Rating Description Definition
10 Certain probability of occurrence
Failure occurs at least once a day; or, failure occurs almost every time.
9
Failure is almost inevitable Failure occurs predictably; or, failure occurs every 3 or 4 days.
8 7
Very high probability of occurrence
Failure occurs frequently; or, failure occurs about once per week.
6 5
Moderately high probability of occurrence
Failure occurs about once per month.
4 3
Moderate probability of occurrence
Failure occurs occasionally; or, failure once every 3 months.
2 Low probability of occurrence
Failure occurs rarely; or, failure occurs about once per year.
1 Remote probability of occurrence
Failure almost never occurs; no one remembers last failure.
Figure 5.6b Detection rating scale
Rating Description Definition
10 No change of detection There is no known mechanism for detecting the failure.
9 8
Very Remote / Unreliable The failure can be detected only with thorough inspection and this is not feasible or cannot be readily done.
7 6
Remote The error can be detected with manual inspection but no process is in place so that detection left to chance.
5 Moderate chance of detection
There is a process for double-checks or inspection but it is not automated and/or is applied only to a sample and/or relies on vigilance.
4 3
High There is 100% inspection or review of the process but it is not automated.
2 Very High There is 100% inspection of the process and it is automated.
1 Almost certain There are automatic ’shut-offs‘ or constraints that prevent failure.
Figure 5.6c Severity rating scale
Rating Description Definition
10 Extremely dangerous Failure could cause death of a customer (patient, visitor, employee, staff member, business partner) and/or total system breakdown, without any prior warning.
9 8
Very dangerous Failure could cause major or permanent injury and/or serious system disruption and interruption in service, with prior warning.
7 Dangerous Failure causes minor to moderate injury with a high degree of customer dissatisfaction and/or major system problems requiring major repairs or significant re-work.
6 5
Moderate danger Failure causes minor injury with some customer dissatisfaction and/or major system problems.
4 3
Low to Moderate danger Failure causes very minor or no injury but annoys customers and/or results in minor system problems that can be overcome with minor modifications to system or process.
2 Slight danger Failure causes no injury and customer is unaware of problem, however the potential for minor injury exists; little or no effect on system.
1 No danger Failure causes no injury and has no impact on system

Page 68 of 81
Copyright © The Australian Council on Healthcare Standards (ACHS) Risk Management and Quality Improvement Handbook. EQuIPNational. July 2013
Flow charts
Flow charts are a visual representation of the process and help team members identify
points where problems might occur, or intervention points for solutions. Standard
symbols, as shown in Figure 5.7, are often used in flow charts but are not necessary.
These will be particularly useful for undertaking risk assessments of systems as required
for NSQHS Standards 3-10.
Figure 5.7 Standard flow chart symbols
There are different types of flow charts that an organisation can use. The following
information identifies two types of flow charts that organisations most often use.39
Top-down flow charts identify the major steps in a process and force people to
narrow their thinking to those steps that are essential to the process. An organisation
can use the top-down flowchart to identify issues and potential sources of problems.
Top-down flow charts are also useful for planning in that teams can spend time
looking at a project as a whole rather than the detail.
Detailed flow charts offer more complexity than the top-down flow chart. A detailed
flow chart breaks down the process into the sub-processes which makes them and
the process as a whole, easier to examine and understand. It is useful to flow chart a
process as a team, allowing multidisciplinary input and ensuring that different
perspectives are considered and added to the chart. Once a chart is complete it can
then be used to identify:
where problems may be occurring
if there are any inherent issues that need examining
areas for improvement
Connector
Activity / Process
Documentation
Pre-defined Process
Data Input
Decision Terminator

Page 69 of 81
Copyright © The Australian Council on Healthcare Standards (ACHS) Risk Management and Quality Improvement Handbook. EQuIPNational. July 2013
what the ideal process would be.
The new process can then be put into practice.40
It does not matter how well the flow chart is drawn up. A simple hand-drawn chart will
accomplish the task. The important aspect is that the process that requires
understanding or improvement is charted. See Figure 5.8 for an example of a detailed
flow chart.
Figure 5.8 Example of detailed flow chart: Computer recovery system
YES
Equipment or files repaired
with minimum delay of 48
hours
Equipment or files repaired
within one day
YES
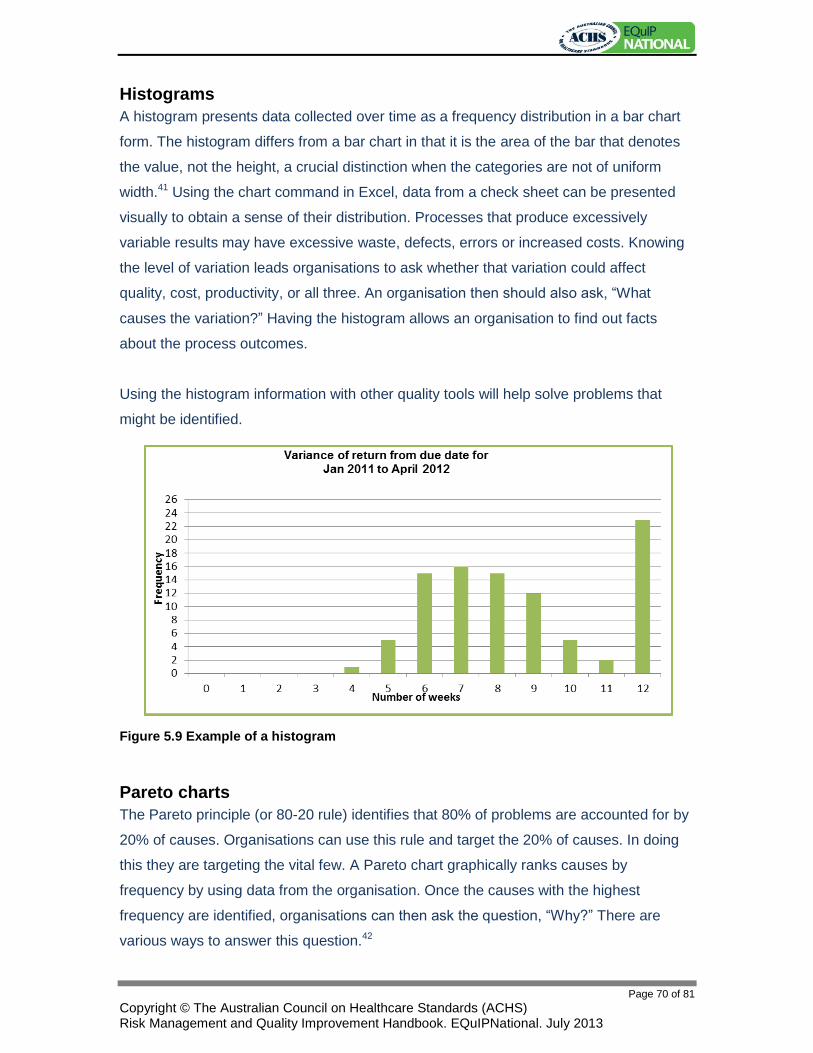
Page 70 of 81
Copyright © The Australian Council on Healthcare Standards (ACHS) Risk Management and Quality Improvement Handbook. EQuIPNational. July 2013
Histograms
A histogram presents data collected over time as a frequency distribution in a bar chart
form. The histogram differs from a bar chart in that it is the area of the bar that denotes
the value, not the height, a crucial distinction when the categories are not of uniform
width.41 Using the chart command in Excel, data from a check sheet can be presented
visually to obtain a sense of their distribution. Processes that produce excessively
variable results may have excessive waste, defects, errors or increased costs. Knowing
the level of variation leads organisations to ask whether that variation could affect
quality, cost, productivity, or all three. An organisation then should also ask, “What
causes the variation?” Having the histogram allows an organisation to find out facts
about the process outcomes.
Using the histogram information with other quality tools will help solve problems that
might be identified.
Figure 5.9 Example of a histogram
Pareto charts
The Pareto principle (or 80-20 rule) identifies that 80% of problems are accounted for by
20% of causes. Organisations can use this rule and target the 20% of causes. In doing
this they are targeting the vital few. A Pareto chart graphically ranks causes by
frequency by using data from the organisation. Once the causes with the highest
frequency are identified, organisations can then ask the question, “Why?” There are
various ways to answer this question.42

Page 71 of 81
Copyright © The Australian Council on Healthcare Standards (ACHS) Risk Management and Quality Improvement Handbook. EQuIPNational. July 2013
How to Construct a Pareto chart
A Pareto chart can be constructed by segmenting the range of the data into groups (also
called segments, bins or categories). For example, to map the reasons for cancellation
of procedures, group the data into the following categories:
lack of beds
pathology not complete
consumer / patient request
anaesthetic issues
financial issues
other.
The left-side vertical axis of the Pareto chart is labeled ‘frequency’ (the number of counts
for each category), the right-side vertical axis of the Pareto chart is the ‘cumulative
percentage’, and the horizontal axis of the Pareto chart is labeled with the group names
of the response variables.
Figure 5.10 Example Pareto chart illustrating another way to show the same information as
in the bar chart, Figure 5.3
The number of data points that reside within each group is then determined and the
Pareto chart is constructed, but unlike the bar chart, the Pareto chart is ordered in
descending frequency magnitude. The groups are defined by the user.
Physiotherapy Equipment Loss 2013
1,800
900 250
6,420
2,400
4,350
40%
67%
82%
93% 98% 100%
-
1,000
2,000
3,000
4,000
5,000
6,000
7,000
W'chairs Crutches Other Braces Splints Orthotics Source
0%
10%
20%
30%
40%
50%
60%
70%
80%
90%
100%
Cumulative % Frequency

Page 72 of 81
Copyright © The Australian Council on Healthcare Standards (ACHS) Risk Management and Quality Improvement Handbook. EQuIPNational. July 2013
What questions the Pareto chart answers.
What are the most significant issues facing our team or organisation?
What 20% of sources are causing 80% of the problems?
Where should we focus our efforts to achieve the greatest improvements?
Run charts / line graphs
A run chart or line graph tracks changes in an important variable over time. Run charts
are easy to interpret and useful in predicting trends. Organisations can use run charts to
compare a performance measure before and after implementation of a solution. The
horizontal axis of a run chart is always time. The charts require the axes to be named to
identify what was measured and when.
A run chart represents data or sets of data that have been collected over a period of
time. The data are plotted on a graph corresponding to standard intervals of time, and a
line is drawn connecting the data points. If updated regularly, line graphs help managers
follow a trend over a period of time and take actions to manage the trend. The line in the
graph allows managers or team members to see trends in the data (an increase,
decrease, or no change) over a period of time. This can be useful to help visualise
changes in the process over time, or to compare the performance before and after the
implementation of a solution.
Figure 5.11 Example of a run chart showing results of an improvement program
Page 73 of 81
Copyright © The Australian Council on Healthcare Standards (ACHS) Risk Management and Quality Improvement Handbook. EQuIPNational. July 2013
Section 6
Evaluation
Although the evaluation section appears at the end of this Handbook, it should be a part
of the risk management and quality improvement process from the start.
Evaluation is an integral part of risk management and quality improvement, as described
in Shewhart’s PDSA cycle, and Deming’s15 PDCA cycle on page 33, and will provide the
organisation with a more positive experience if it is built into the improvement process to
create on-going activity.
Evaluation is the systematic collection and analysis of information about a specific
program or intervention in order to allow its critical appraisal. Evaluation is used to:
improve strategies, programs, and interventions
make more informed decisions in future planning
clarify the options available
account for the expenditure of funds.
There are a number of actions throughout the 15 EQuIPNational Standards that require
evaluation. Most explicit evaluation items and actions are within the five EQuIP-content
Standards, however NSQHS Standards 1, 2, 3 and 6 contain explicit requirements for
evaluation. Further, the NSQHS Standards require organisations to undertake sample or
comprehensive audits or reviews, which are a form of evaluation. Information about the
NSQHS Standards that require audit or review are available on the ACSQHS website,
and are listed in the Hospital Accreditation Workbook for NSQHS Standards 1 to 10.
Evaluation is collecting information about an activity, a service or some aspect of a
service, in order to make necessary decisions on the effectiveness of that activity or
service. Evaluation measures can be related to the structures, processes or outcomes of
service delivery. A critical step in evaluation is to select the best measures for assessing
whether the desired effect has been achieved.

Page 74 of 81
Copyright © The Australian Council on Healthcare Standards (ACHS) Risk Management and Quality Improvement Handbook. EQuIPNational. July 2013
The purpose of evaluation is to ensure that the systems the organisation has
implemented work effectively. This applies not only to the evaluation of clinical systems
but also to the evaluation of policy, programs and corporate systems.
“Evaluation is judging the value of something by gathering valid information about it in a
systematic way and by making a comparison. The purpose of evaluation is to help the
user of the evaluation to decide what to do, or to contribute to scientific knowledge.” 43
There are many different methods of evaluation that can be used in health services. The
evaluation that is required by healthcare organisations to achieve a Satisfactorily Met
rating for the applicable actions does not have to involve conventional research
processes.
For example, Øvretveit43 provides a detailed description of the various methods of
evaluation and the steps required for each method. These methods are specifically for
use by clinicians, healthcare professionals and managers in health services and include:
Program feasibility assessment or option appraisal which helps to decide whether an
action or program should be carried out.
Outcome evaluation or summative evaluation, which is often used to discover the
effects of an action or program.
Process evaluation or formative evaluation, which is used to evaluate how the
program or reform was implemented and how that impacted on the outcome.
Action evaluation where data about an intervention and its effects are collected and
compared to decide future action.
To ensure systems and processes within an organisation are working, they should be
regularly evaluated. This evaluation should be:
organisation-wide
at a level appropriate to the organisation. Organisations may not have access to the
resources to undertake a complex study but there should be in place an appropriate
quality program that ensures completion of the quality cycle
in relation to processes that are high-risk, high-cost, high-volume and/or problem
areas related to care and services
in accordance with the evaluation requirements of a specific action

Page 75 of 81
Copyright © The Australian Council on Healthcare Standards (ACHS) Risk Management and Quality Improvement Handbook. EQuIPNational. July 2013
reliable in that if the evaluation was repeated the results would remain the same
valid in that the evaluation measures what it intends to measure
utilised as part of a continuous quality improvement system from both a strategic and
operational perspective.
While all healthcare organisations are strongly encouraged to operate with an outcome
focus to attain the Satisfactorily Met rating, it is not always possible to have verified
outcomes. There should be adequate evidence of evaluation of structures and
processes that comply with the bullet points above.
Structure, process and outcome Donabedian44 identified the need in health care to look at structure, process and
outcome. If evaluation of the outcome demonstrates satisfactory levels of quality, it can
be presumed that the structure and process are intact.45
Structure, process and outcome can be defined as follows:
A structure includes the human, physical and financial resources of the organisation,
such as buildings, staff, equipment and policies. Examples of structure-related
quality improvement activities include improvements to security measures or
increase in staff-to-patient ratio where needed.
A process is a set of activities and the discrete steps such as procedures. Examples
include improvement to the admission procedure, development of a flow chart for
maintenance requests or development of clinical pathways.
An outcome occurs as a result of a service or intervention. It looks at the end result
of care and service, such as length of stay, consumer / patient satisfaction, mortality
and morbidity rates. Examples of some outcome-related quality improvements
include meeting best-practice care outcomes, decreasing complaint rates or
increasing satisfaction with the care provided.

Page 76 of 81
Copyright © The Australian Council on Healthcare Standards (ACHS) Risk Management and Quality Improvement Handbook. EQuIPNational. July 2013
In identifying which activities to implement, an organisation should look at striking a
balance between structure, process and outcome. Three questions organisations should
ask themselves when looking at structure, process and outcome are:
How did this improve organisational performance?
How did this improve the quality of care or service?
Do staff know about it? 45
Structure Evaluations of structure are undertaken to understand how the various components of
the organisation support the activities of the organisation. Structure relates to the
supportive framework of the organisation in which care is delivered and includes the
staff, facilities, equipment and resources. Examples of structure evaluation include:
availability of resources
percentage increase in new staff
regularity of equipment replacement
number and type of contracts with external parties
assessment of future staff requirements.
Process Process-based evaluations help clarify how a system works. Processes are the activities
that make up service delivery, for example the activities carried out by staff in the
delivery of care to consumers / patients. Other examples of ‘processes’ include the
steps involved in the recruitment, selection and appointment of staff, and the
implementation of policies and procedures. Process-based evaluation generally leads to
output or results such as:
number and type of procedures performed
result of implementing new policies, such as improved compliance with WHS
legislation
degree of compliance with best-practice guidelines
number of staff self-reporting a change in practice after attending professional
development
identification of staff concerns with data collection procedure
number and type of meeting actions addressed within agreed timeframes.
Page 77 of 81
Copyright © The Australian Council on Healthcare Standards (ACHS) Risk Management and Quality Improvement Handbook. EQuIPNational. July 2013
Outcome Outcome evaluation looks at what happened because of what was done. An outcomes-
based evaluation encourages an organisation to ask if it is really doing the right activities
to bring about the outcomes it believes to be needed by consumers / patients.
There are many measurable outcomes which can be either short-term, such as changes
in knowledge, skills or attitudes; intermediate, such as changes in behavior; or long-term,
such as changes in condition or status. Examples of outcome evaluation include:
effectiveness of service delivery
improved staff safety
consumer / patient satisfaction
staff / healthcare provider satisfaction
cost-effectiveness of service delivery, for example benefits derived compared to cost
of implementing
change in knowledge, skills or attitudes of staff / healthcare provider
change in behaviour of staff / healthcare provider.
There are six main designs used for health evaluations. They are46:
Descriptive: The report describes features of the program, policy or implementation
process.
Audit: A comparison of what is done against specified standards or parameters.
Outcome: The ‘before’ stage is compared to the ‘after’ stage.
Comparative: A comparison of the before-and-after states of people who received two or
more different interventions.
Randomised controlled trial: A comparison of a specified before-and-after state of people
who were randomly allocated to an intervention or to a placebo or a comparison
intervention.
Intentional change to organisation: Looks at an intervention to an organisation or to
health providers and at the before-and-after effects of the intervention on these targets
or on consumers / patients.

Page 78 of 81
Copyright © The Australian Council on Healthcare Standards (ACHS) Risk Management and Quality Improvement Handbook. EQuIPNational. July 2013
Conclusion Health care has never been more complex than it is today and it is critical that staff have
access to the solutions they need to efficiently deliver high quality care and services.
From new standards and core measures to constantly changing compliance regulations,
organisations face a variety of high pressure challenges.
This Handbook aims to provide information on some of the requirements under the
National Safety and Quality Health Service (NSQHS) Standards accreditation program
and some basic principles of risk management and quality improvement.
Further information can be found on the Australian Commission on Safety and Quality in
Health Care’s website: http://www.safetyandquality.gov.au/ . Various other sites can
provide information on tools and processes to identify and manage both risks and areas
for improvement.
Feedback
ACHS welcomes feedback on this tool. Should you have any ideas for improvement or
suggestions for inclusion, please contact:
Executive Director – Development Unit
The Australian Council on Healthcare Standards (ACHS)
5 Macarthur Street
ULTIMO NSW 2007
+61 2 9281 9955
Page 79 of 81
Copyright © The Australian Council on Healthcare Standards (ACHS) Risk Management and Quality Improvement Handbook. EQuIPNational. July 2013
References 1. Runciman B, Merry A and Walton M. Safety and ethics in healthcare: a guide to getting it
right. Aldershot UK; Ashgate Publishing Limited; 2007.
2. Shaw CD and ISQua toolkit working group. Toolkit for accreditation programs: Some issues in the design and redesign of external health care assessment and improvement systems. Melbourne VIC; ISQua; 2004.
3. AS/NZS ISO 31000—2009 Risk management — principles and guidelines.
4. Organisation for Economic Co-operation and Development (OECD). OECD Principles of corporate governance. Paris FR; OECD; 2004.
5. Braithwaite J. Changing organisational culture. Sydney; UNSW Centre for Clinical Governance Research; 2002.
6. Drucker P. Managing in turbulent times. New York; Karper and Roe; 1980.
7. Lewin K. Frontiers in group dynamics: Concept, method and reality in Social Science. Human Relations 1947; 1(1): 5-41.
8. Treasury Board of Canada Secretariat. Changing management culture: Models and strategies to make it happen. Ottawa CA; Treasury Board of Canada; 2003.
9. Roberts DG. Risk management in healthcare. London UK; Witherby Publishers; 2002.
10. Institute for Healthcare Improvement. Getting Started Kit: Governance Leadership “Boards on Board ”How-to Guide 5 million lives campaign. Cambridge MA.; Institute for Healthcare Improvement; 2008.
11. National Health Service (NHS). Integrated governance handbook: A handbook for executives and non-executives in healthcare organisations. London UK; Department of Health; 2006.
12. Standards Australia and Standards New Zealand. Risk Management Guidelines. Companion to AS/NZS 4360:2004. Sydney; Standards Australia; 2004.
13. Dahms T. Part 1: Risk management and corporate governance: are they the same? Risk Magazine 2008.(23 January): Accessed from http://www.riskmanagementmagazine.com.au/articles/EC/0C052EEC.asp?Type=125&Category=1241.
14. Shewhart W. Statistical method from the viewpoint of quality control. New York NY; Dover Publications; 1986.
15. Demming W. Out of the crisis Cambridge MA; Institute of Technology. Centre for Advanced Engineering Study; 1986.
16. Australian Commission on Safety and Quality in Health Care (ACSQHC). Former Council terms and definitions for safety and quality concepts. Sydney NSW: ACSQHC. Accessed from http://www.safetyandquality.gov.au/internet/safety/publishing.nsf/Content/former-pubs-archive-definitions.
17. Alberti K. Editorial: Medical errors: a common problem. Br Med J 2001; 322(3 Mar): 501-502.
18. Joint Commission on Accreditation of Healthcare Organizations. Information on Root Cause Analysis. Accessed from http://www.jointcommission.org/NR/rdonlyres/F84F9DC6-A5DA-490F-A91F-A9FCE26347C4/0/SE_chapter_july07.pdf
19. Runciman WB. Shared meanings: preferred terms and definitions for safety and quality concepts. Med J Aust 2006; 184(10 Suppl): S41-S43.
20. Runciman W, Edmonds M and Pradhan M. Setting priorities for patient safety. Qual Saf Health Care 2002; 11(3): 224-229.
9
Page 80 of 81
Copyright © The Australian Council on Healthcare Standards (ACHS) Risk Management and Quality Improvement Handbook. EQuIPNational. July 2013
21. Duncan WL. Total Quality: Key terms and concepts. New York, NY; Luftig & Warren International; 1995.
22. BRI Inquiry Secretariat. BRI Inquiry paper on medical and clinical audit in the NHS. Bristol UK; NHS; 199.
23. Greenfield D, Travaglia J, Braithwaite J and Pawsey M. Unannounced Surveys and Tracer Methodology: Literature Review. Sydney; Centre for Clinical Governance Research; 2007.
24. Janssen B, Burgmann C, Habel U et al. External quality assurance of inpatient treatment in schizophrenia: results of a multicenter study. Nervenarzt 2000; 71(5): 364-372.
25. Lai B, Schulzer M, Marionc S et al. The prevalence of Parkinson's disease in British Columbia, Canada, estimated by using drug tracer methodology Parkinsonism & Related Disorders 2003; 9(4): 233-238.
26. Amonoo-Lartson R and de Vries J. Patient care evaluation in a primary health care programme: the use of tracer conditions as a simple and appropriate technology in health care delivery. Social Science & Medicine 1981; 15(5): 735-741.
27. Osterweis M and Bryant E. Assessing technical performance at diverse ambulatory care sites. Journal of Community Health 1978; 4(2): 104-119.
28. Novick L, Dickinson K, Asnes R et al. Assessment of ambulatory care: application of the tracer methodology. Medical Care 1976; 14(1): 1-12.
29. Egges J and Turnock B. Evaluation of an EMS regional referral system using a tracer methodology. Annals of Emergency Medicine 1980; 9(10): 518-523.
30. Fleishman R, Ross N and Feierstein A. Quality of care in residential homes: a comparison between Israel and Florida. Quality Assurance in Health Care 1992; 4(3): 225-244.
31. Joint Commission on Accreditation of Healthcare. Joint Commission renames tracer activities. Joint Commission Perspectives 2005; 25(3): 9-10.
32. Joint Commission on Accreditation of Healthcare Organisations. Facts about tracer methodology. Accreditation Process. Oakbrook Terrace: JCAHO. Updated: March 2008. Accessed from http://www.jointcommission.org/AccreditationPrograms/Hospitals/AccreditationProcess/Tracer_Methodology.htm.
33. Joint Commission on Accreditation of Healthcare Organisations. Tracer Methodology: Tips and strategies for continuous systems improvement. 2nd edn. Oakbrook Terrace, USA; Joint Commission Resources; 2008.
34. Greenfield D, Hinchcliff R, Westbrook M et al. An empirical test of accreditation patient journey surveys: randomized trial. Int J Qual Health Care 2012; 24(3): 1-6.
35. Baggoley C. Request for Tender for piloting innovative accreditation methodologies: patient journeys. Sydney; Australian Commission for the Safety and Quality of Health Care; 2008.
36. Ben-Tovim DI, Dougherty ML, O’Connell TJ and McGrath KM. Patient journeys: the process of clinical redesign. Med J Aust 2008; 188(6): S14–S17.
37. Joint Commission on Accreditation of Healthcare Organisations (JCAHO). Sentinel event glossary of terms. Oakbrook Terrace USA: JCAHO. Accessed from http://www.jointcommission.org/SentinelEvents/se_glossary.htm .
38. Scholtes PR, Joiner BJ and Streibel BJ. The Team Handbook. 2nd edn. Madison WI; Oriel Publishing, USA; 1996.
39. McConnell J. The Seven Tools of TQC. 4th edn. Sydney NSW; Delaware; 2001.
40. Institute for Healthcare Improvement (IHI). Failure Modes and Effects Analysis (FMEA). Cambridge MA; IHI; 2004.

Page 81 of 81
Copyright © The Australian Council on Healthcare Standards (ACHS) Risk Management and Quality Improvement Handbook. EQuIPNational. July 2013
41. Lancaster H. An Introduction to Medical Statistics. New York, NY; John Wiley & Sons; 1974.
42. Joint Commission on Accreditation of Healthcare Organizations (JCAHO). Using Performance Improvement Tools. Oakbrook Terrace, IL; JCAHO; 1999.
43. Øvretveit J. Action evaluation of health programmes and changes: a handbook for a user-focused approach. Oxford UK; Radcliffe Medical Press; 2002.
44. Donabedian A. The definition of quality and approaches to its assessment. Ann Arbor MI; Health Administration Press; 1980.
45. Meiesenheimer C. Quality Assurance: A complete guide to effective programs. Aspen Publishers; Frederick MD; 1985.
46. Ovretveit J. Action evaluation of health programmes and changes: a handbook for a user focused approach. Oxford UK; Radcliff Medical Press; 2002.